Embed Size (px)
Citation preview
© Lean & Mean Consulting. All rights reserved. 2015 © Lean & Mean Consulting. All rights reserved. 2016
02 / 16
Lean Value Stream Mapping & Analysis
Creating End Vision and Roadmaps for Driving OpEx
World-Class Standards of Operational Excellence
2
Objectives
Upon completion of this workshop, you will be able to:
Understand why creating a VSM is crucial for succeeding in Lean
Create a value stream map for both the current and future states
Develop a data collection plan for the value stream map
Conduct end-to-end assessment of value-added versus non-value-added activities
Prioritize projects based on strategic objectives
Develop action plan to achieve the future state
3
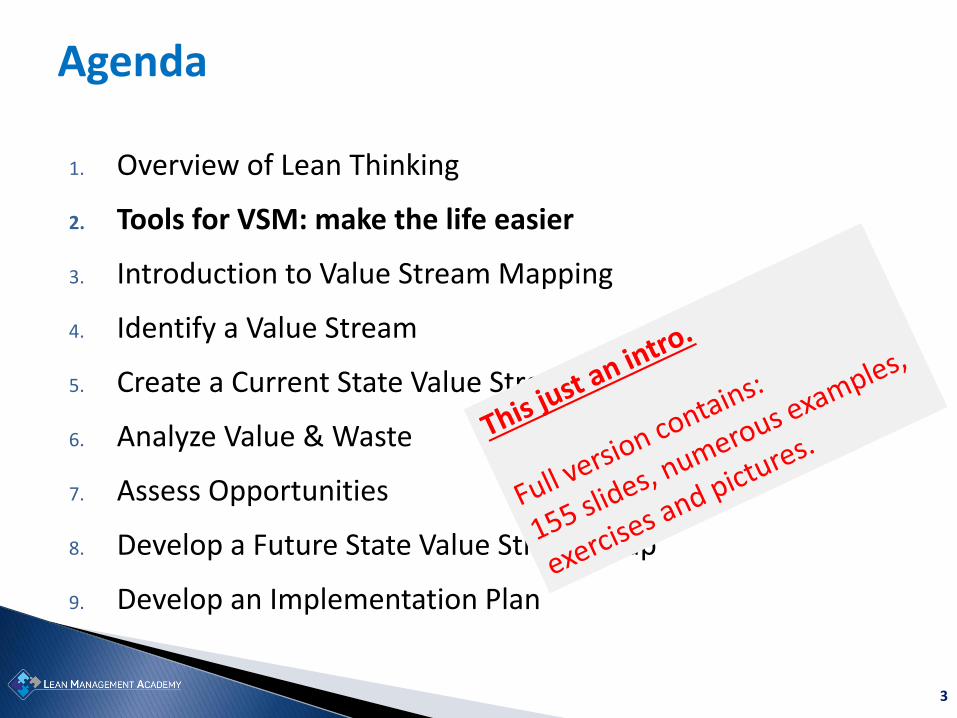
Agenda
1. Overview of Lean Thinking
2. Tools for VSM: make the life easier
3. Introduction to Value Stream Mapping
4. Identify a Value Stream
5. Create a Current State Value Stream Map
6. Analyze Value & Waste
7. Assess Opportunities
8. Develop a Future State Value Stream Map
9. Develop an Implementation Plan
4
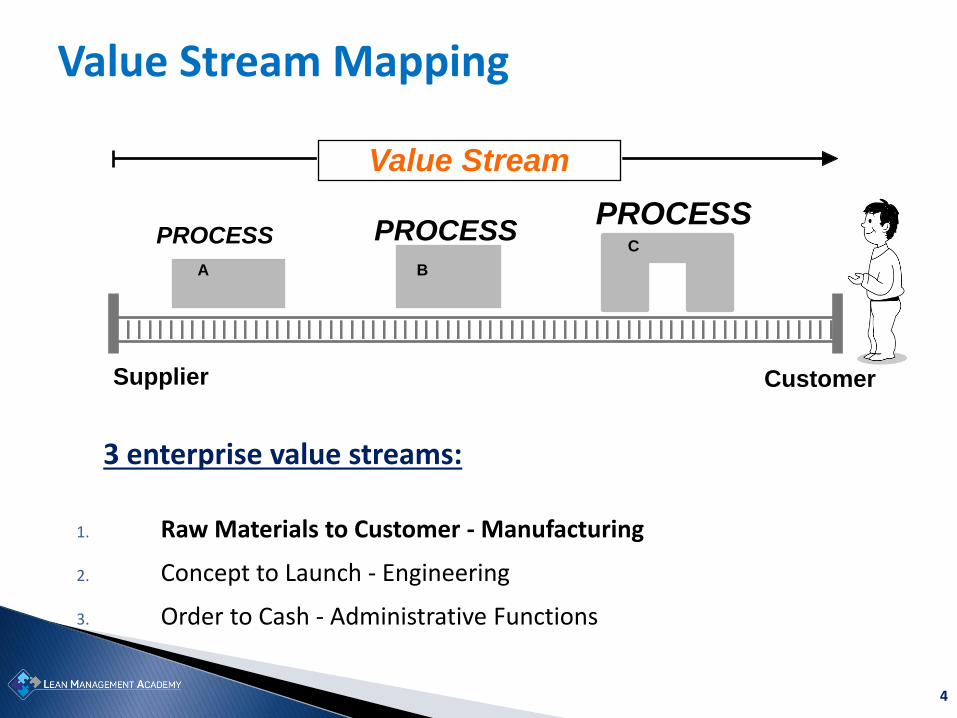
3 enterprise value streams:
1. Raw Materials to Customer - Manufacturing
2. Concept to Launch - Engineering
3. Order to Cash - Administrative Functions
Value Stream Mapping
Supplier
PROCESS
Value Stream
Customer
PROCESS PROCESS
A B
C
5
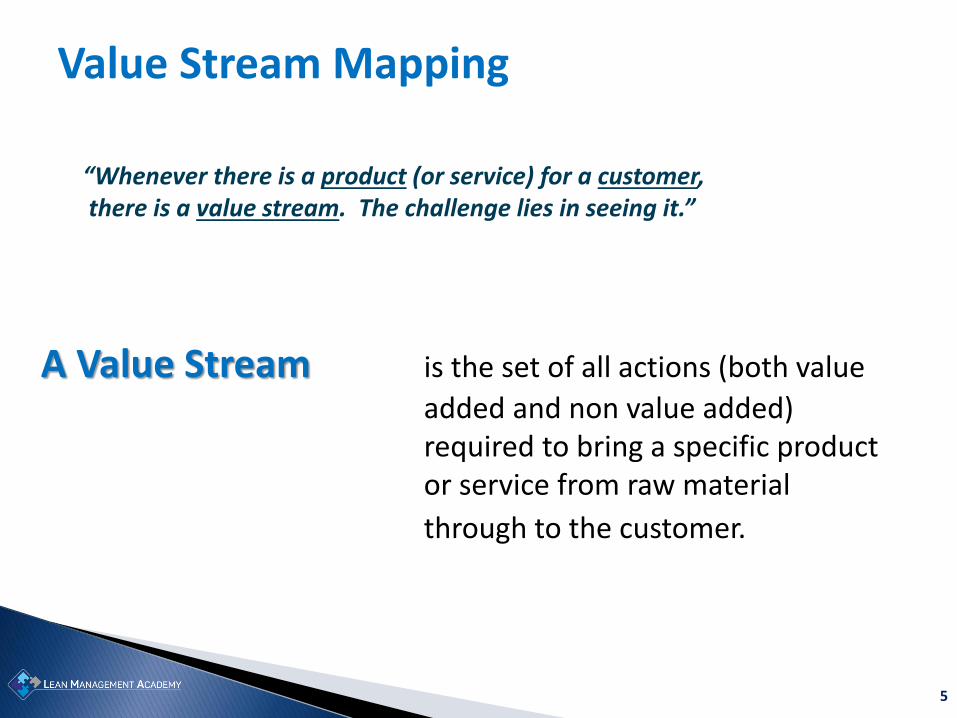
A Value Stream is the set of all actions (both value
added and non value added) required to bring a specific product or service from raw material
through to the customer.
“Whenever there is a product (or service) for a customer, there is a value stream. The challenge lies in seeing it.”
Value Stream Mapping
6
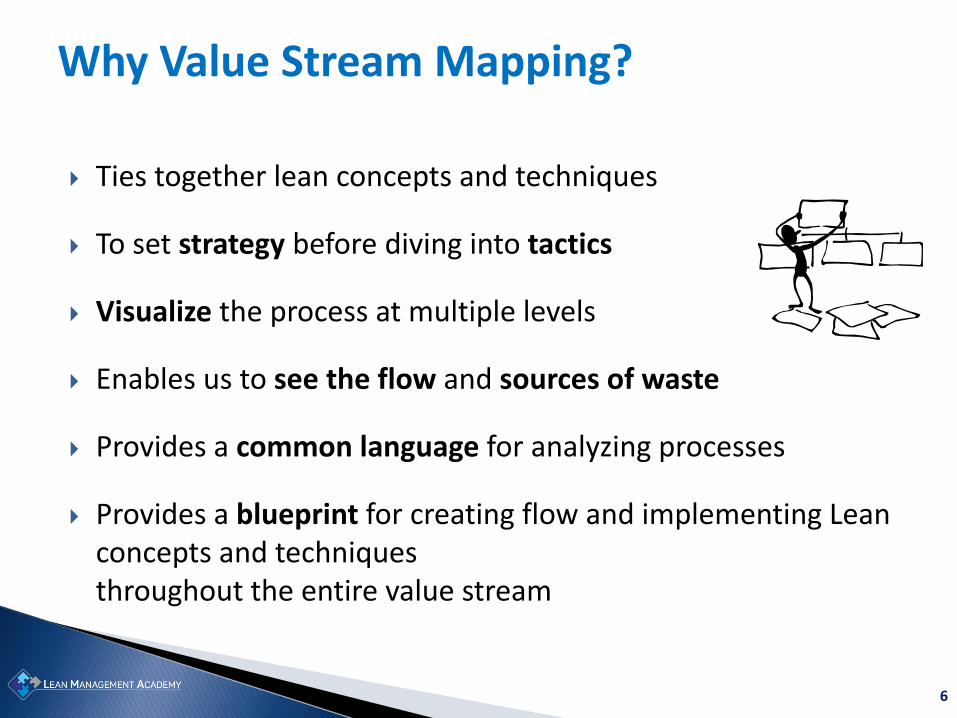
Why Value Stream Mapping?
Ties together lean concepts and techniques
To set strategy before diving into tactics
Visualize the process at multiple levels
Enables us to see the flow and sources of waste
Provides a common language for analyzing processes
Provides a blueprint for creating flow and implementing Lean concepts and techniques throughout the entire value stream
7
Using the mapping process solely as a work design exercise
Using the map to make tactical improvements
Creating value stream maps during a kaizen event
Creating maps but taking no action
Mapping with an inappropriate team – or no team at all
Creating maps with no metrics…
Common Failings with Value Stream Mapping
8
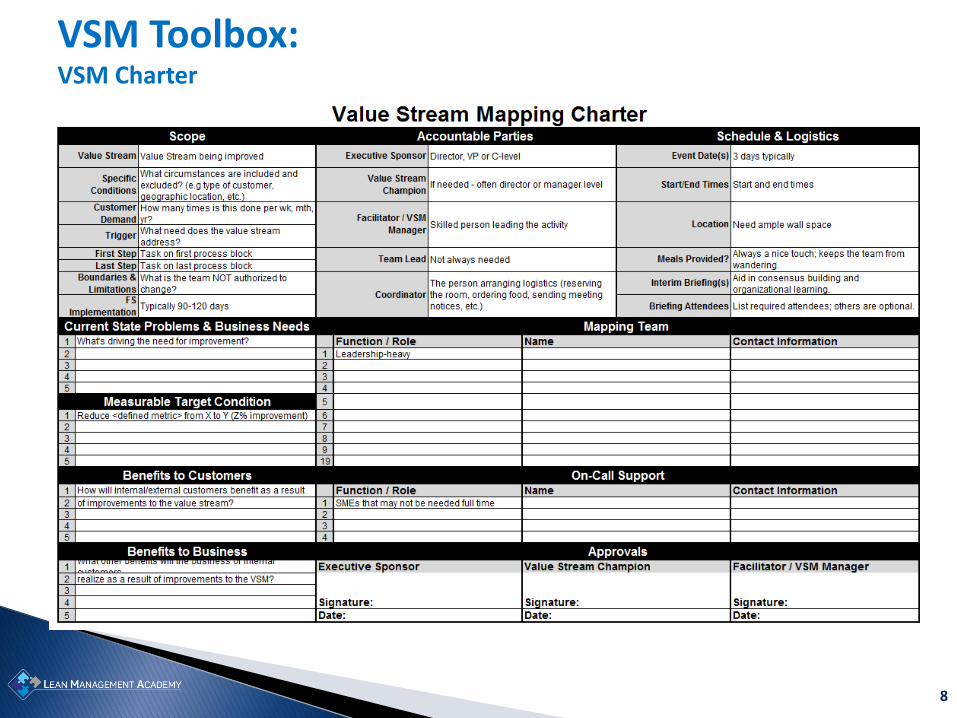
VSM Toolbox: VSM Charter
9
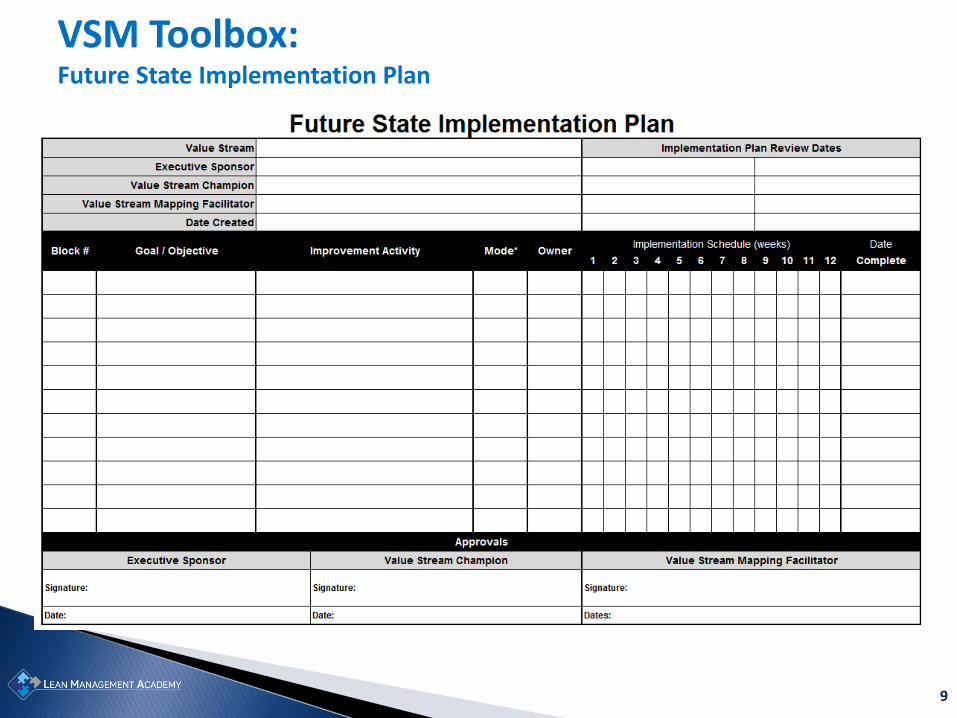
VSM Toolbox: Future State Implementation Plan
10
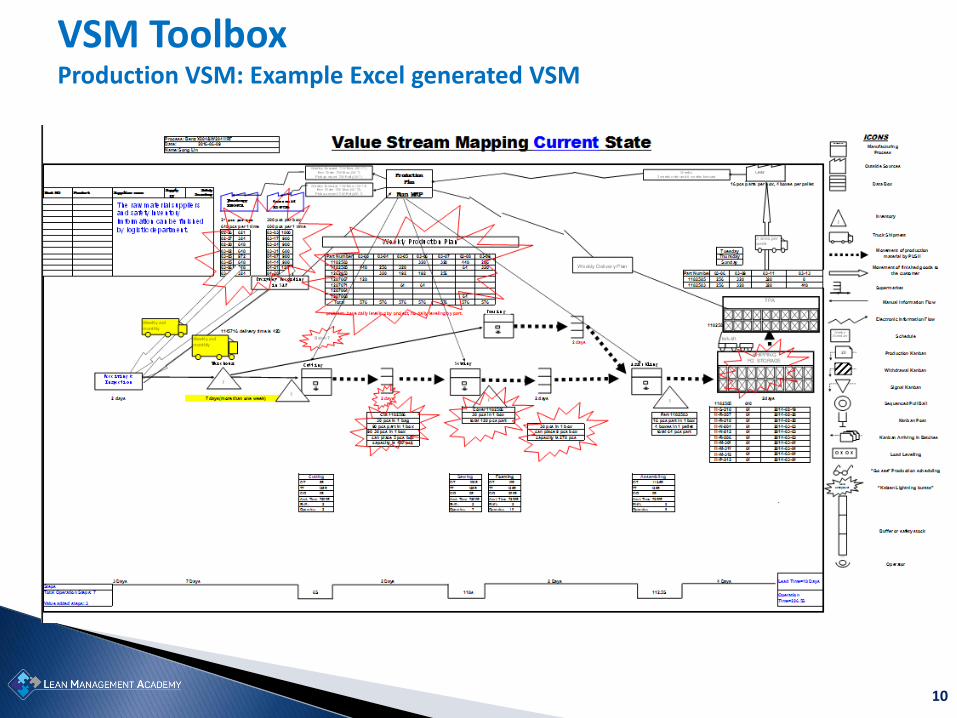
VSM Toolbox Production VSM: Example Excel generated VSM
11
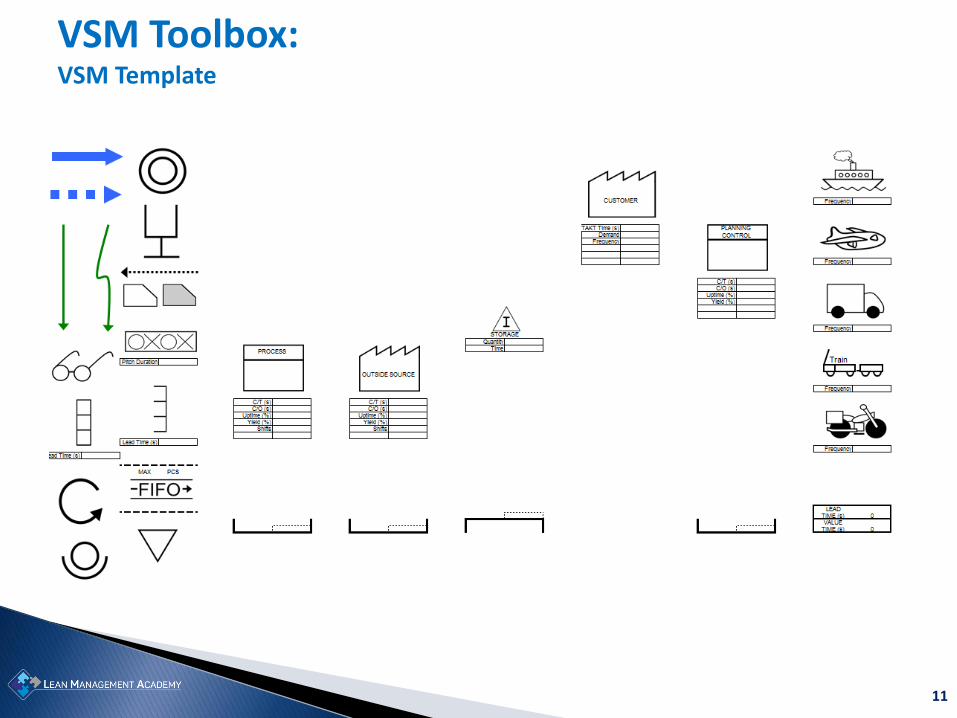
VSM Toolbox: VSM Template
12
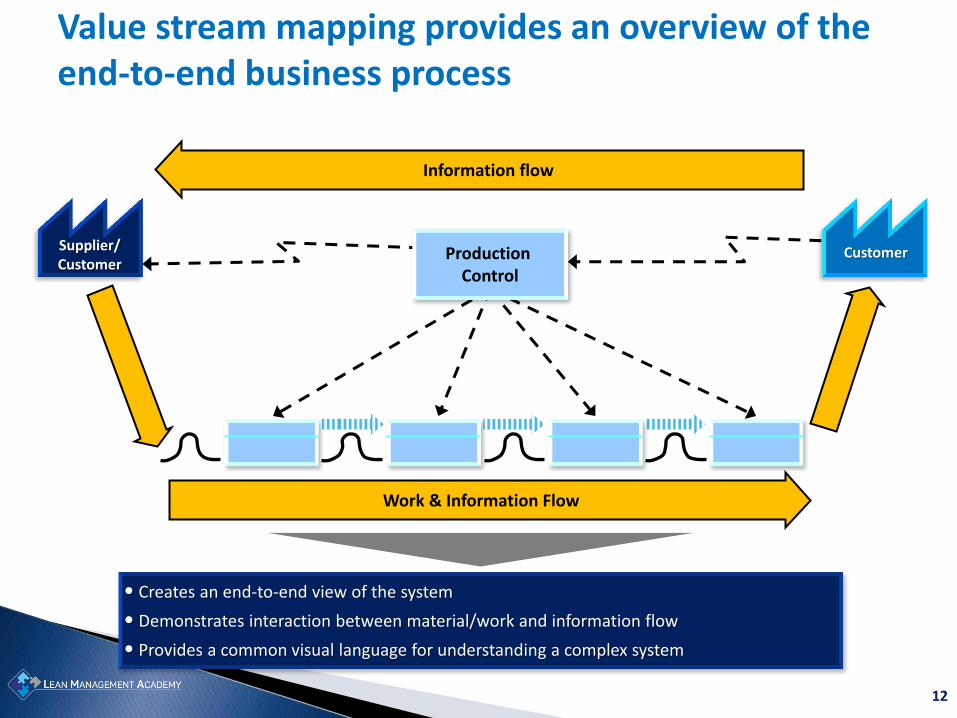
• Creates an end-to-end view of the system
• Demonstrates interaction between material/work and information flow
• Provides a common visual language for understanding a complex system
Supplier/ Customer
Production Control
Customer
Work & Information Flow
Information flow
Value stream mapping provides an overview of the end-to-end business process
13
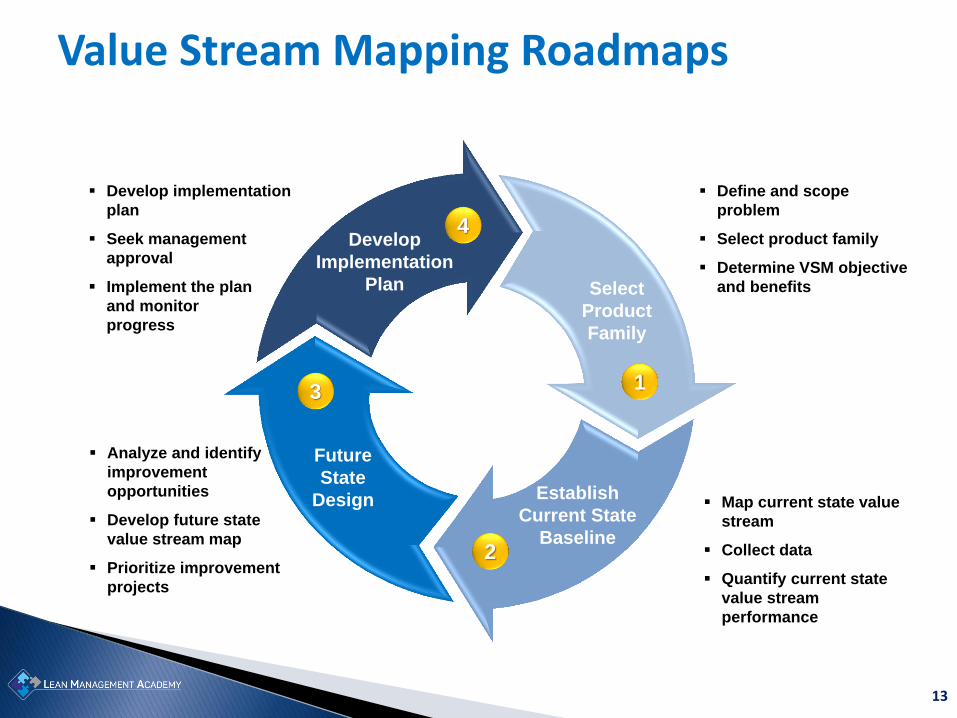
Value Stream Mapping Roadmaps
Develop
Implementation
Plan
Future
State
Design Establish
Current State
Baseline
Select
Product
Family
Define and scope
problem
Select product family
Determine VSM objective
and benefits
Map current state value
stream
Collect data
Quantify current state
value stream
performance
Analyze and identify
improvement
opportunities
Develop future state
value stream map
Prioritize improvement
projects
Develop implementation
plan
Seek management
approval
Implement the plan
and monitor
progress
1
2
3
4
14
• Phase 1 – Document and analyze the current state
Go to the Gemba!
• Phase 2 – Design the future state (3-6 month out)
• Phase 3 – Create the implementation plan!
VSM: Three Key Activities & Deliverables
15
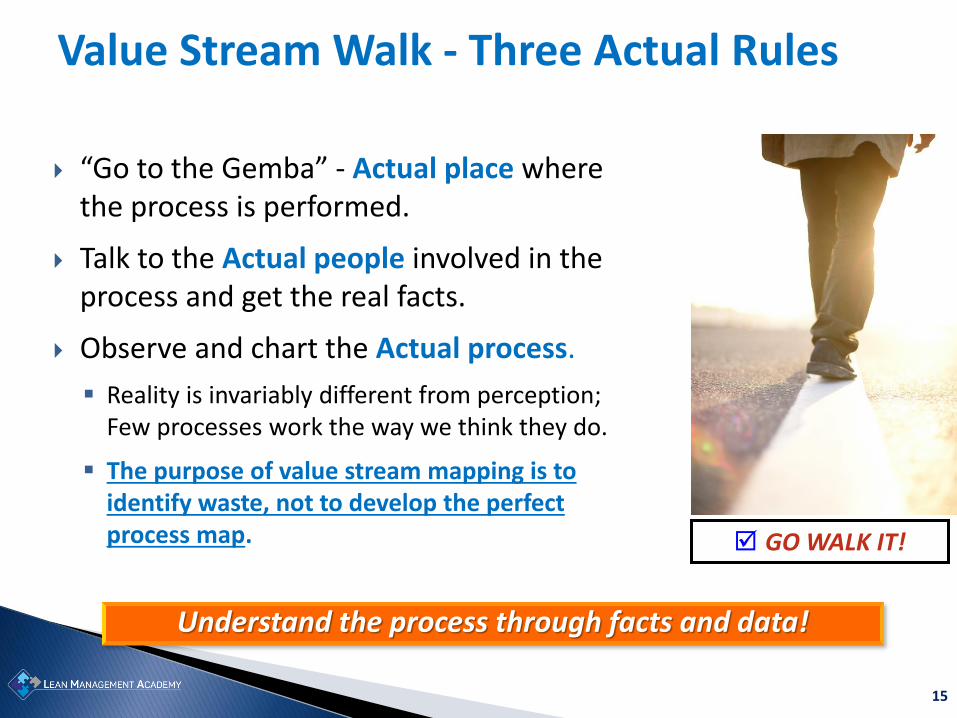
Value Stream Walk - Three Actual Rules
“Go to the Gemba” - Actual place where the process is performed.
Talk to the Actual people involved in the process and get the real facts.
Observe and chart the Actual process.
Reality is invariably different from perception; Few processes work the way we think they do.
The purpose of value stream mapping is to identify waste, not to develop the perfect process map.
Understand the process through facts and data!
GO WALK IT!
16
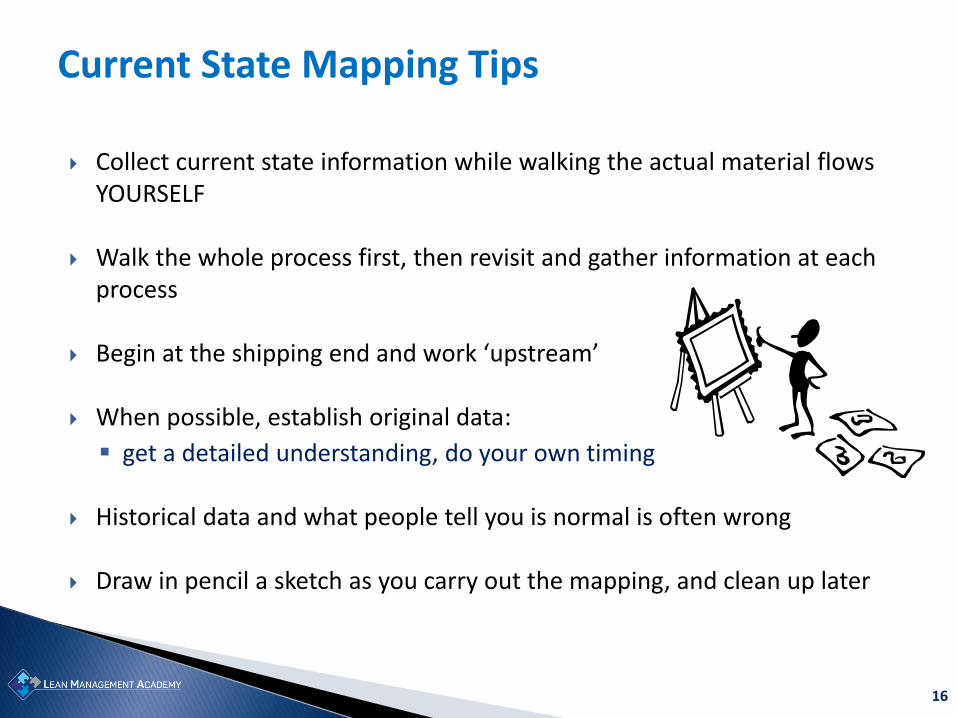
Collect current state information while walking the actual material flows YOURSELF
Walk the whole process first, then revisit and gather information at each process
Begin at the shipping end and work ‘upstream’
When possible, establish original data:
get a detailed understanding, do your own timing
Historical data and what people tell you is normal is often wrong
Draw in pencil a sketch as you carry out the mapping, and clean up later
Current State Mapping Tips
17
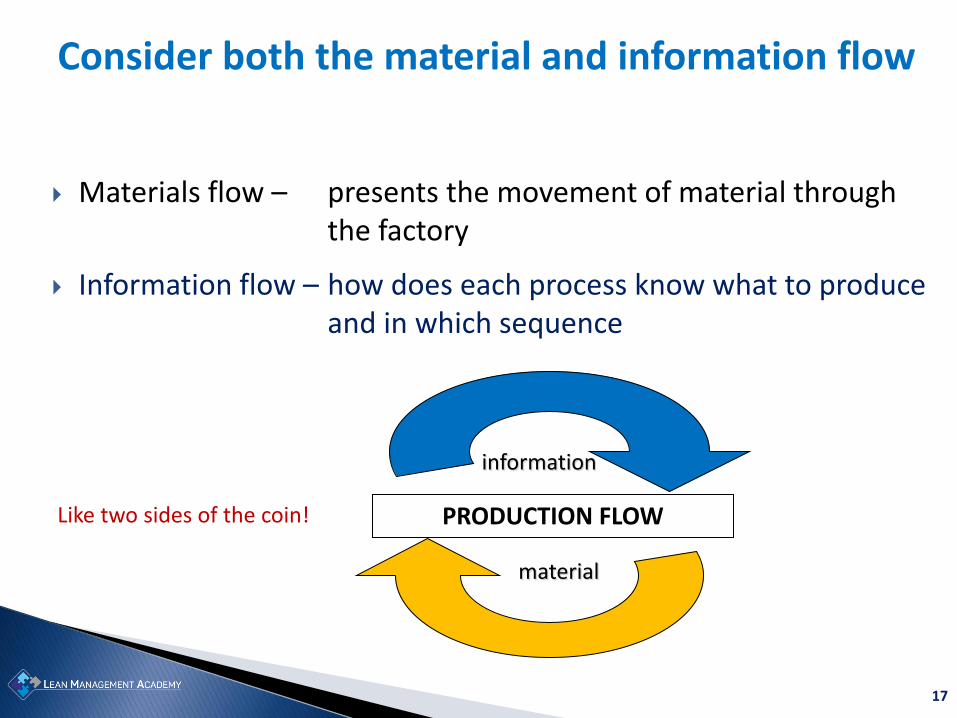
Consider both the material and information flow
Materials flow – presents the movement of material through the factory
Information flow – how does each process know what to produce and in which sequence
PRODUCTION FLOW
material
information
Like two sides of the coin!
18
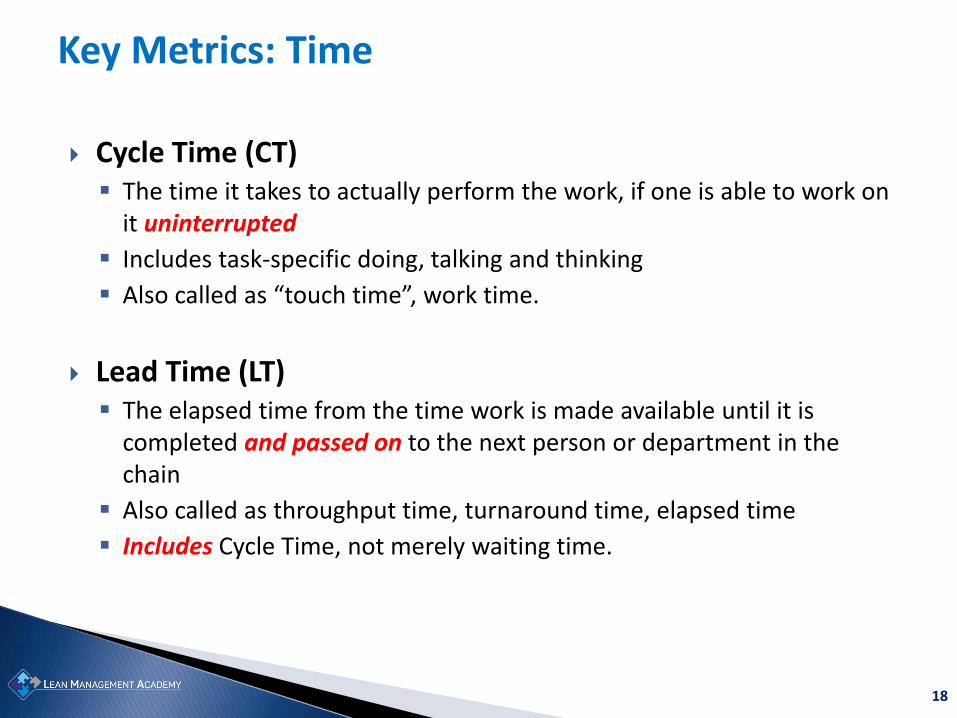
Key Metrics: Time
Cycle Time (CT) The time it takes to actually perform the work, if one is able to work on
it uninterrupted
Includes task-specific doing, talking and thinking
Also called as “touch time”, work time.
Lead Time (LT) The elapsed time from the time work is made available until it is
completed and passed on to the next person or department in the chain
Also called as throughput time, turnaround time, elapsed time
Includes Cycle Time, not merely waiting time.
19
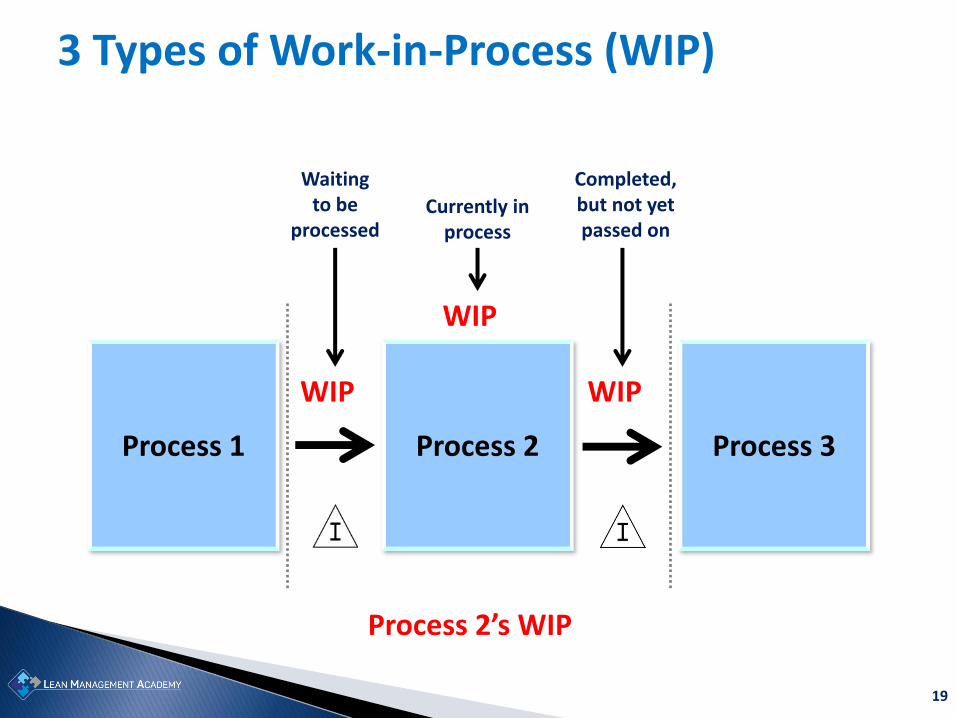
3 Types of Work-in-Process (WIP)
Process 1 Process 3 Process 2
WIP WIP
WIP
Waiting to be
processed Currently in
process
Completed, but not yet passed on
Process 2’s WIP
20
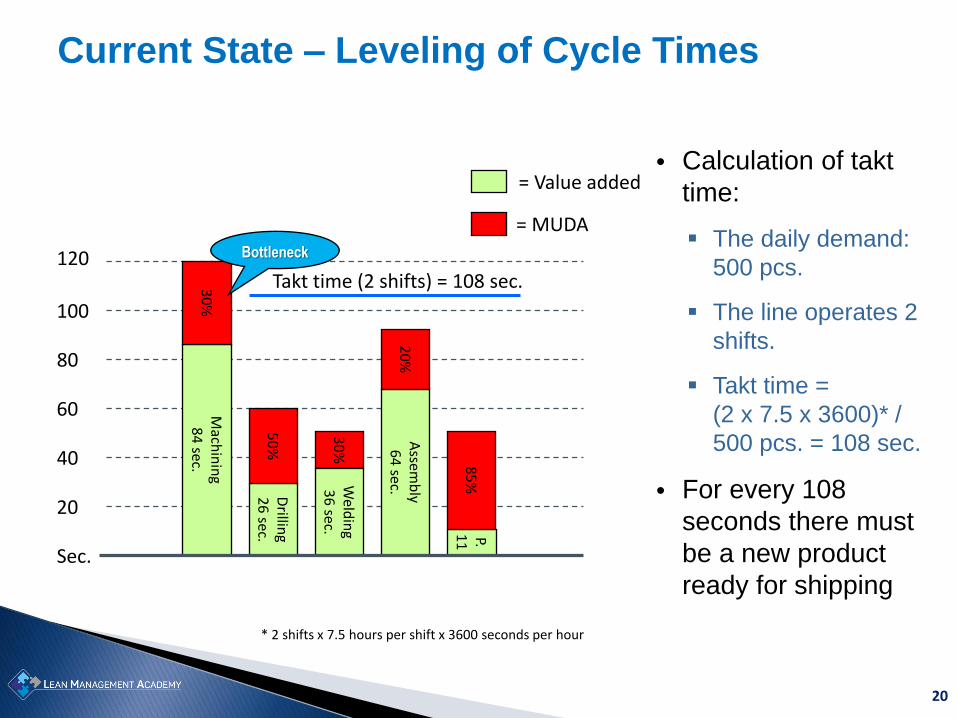
• From this figure it is visible why the flow is bad in the current production. The bad flow also causes inventory between all processes.
• The takt time is 532 sec. based on 2 shifts. It is also clear that 2 shifts is not enough on the machining process.
20
40
60
80
100
120
Mach
inin
g 8
4 sec.
Drillin
g 2
6 sec.
Assem
bly
64
sec.
P. 1
1
30
%
50
%
20
%
85
%
30
%
Weld
ing
36
sec.
Bottleneck
Sec.
Takt time (2 shifts) = 108 sec.
= MUDA
• Calculation of takt
time:
The daily demand:
500 pcs.
The line operates 2
shifts.
Takt time =
(2 x 7.5 x 3600)* /
500 pcs. = 108 sec.
• For every 108
seconds there must
be a new product
ready for shipping
Current State – Leveling of Cycle Times
* 2 shifts x 7.5 hours per shift x 3600 seconds per hour
= Value added
21
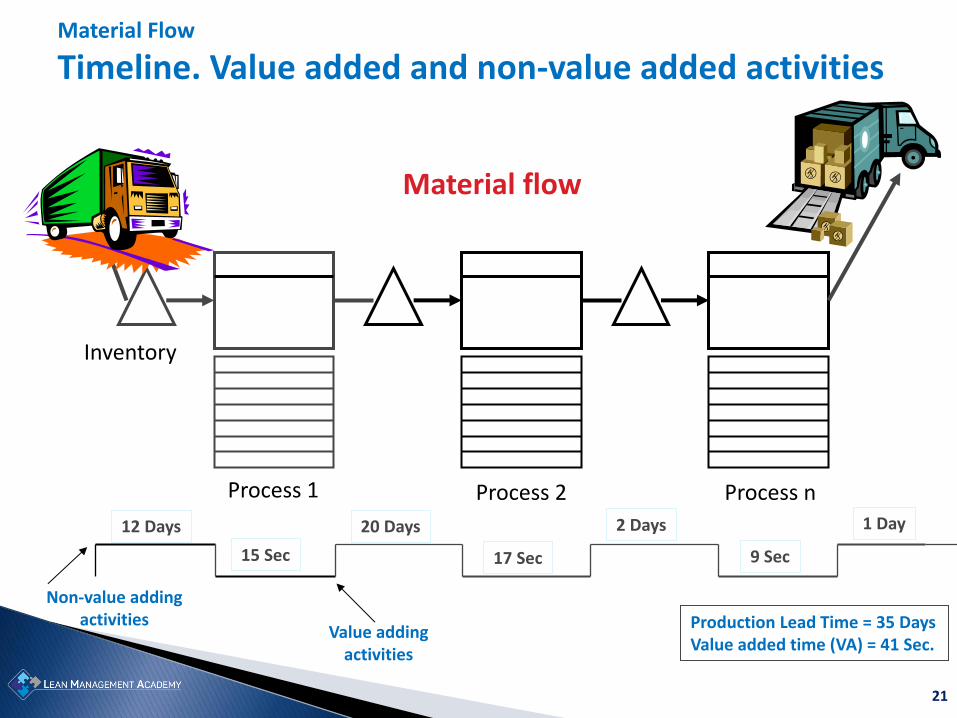
Inventory
Process 1
Production Lead Time = 35 Days Value added time (VA) = 41 Sec.
12 Days
15 Sec
20 Days
17 Sec
2 Days
9 Sec
1 Day
Value adding activities
Material flow
Material Flow
Timeline. Value added and non-value added activities
Non-value adding activities
Process 2 Process n
22
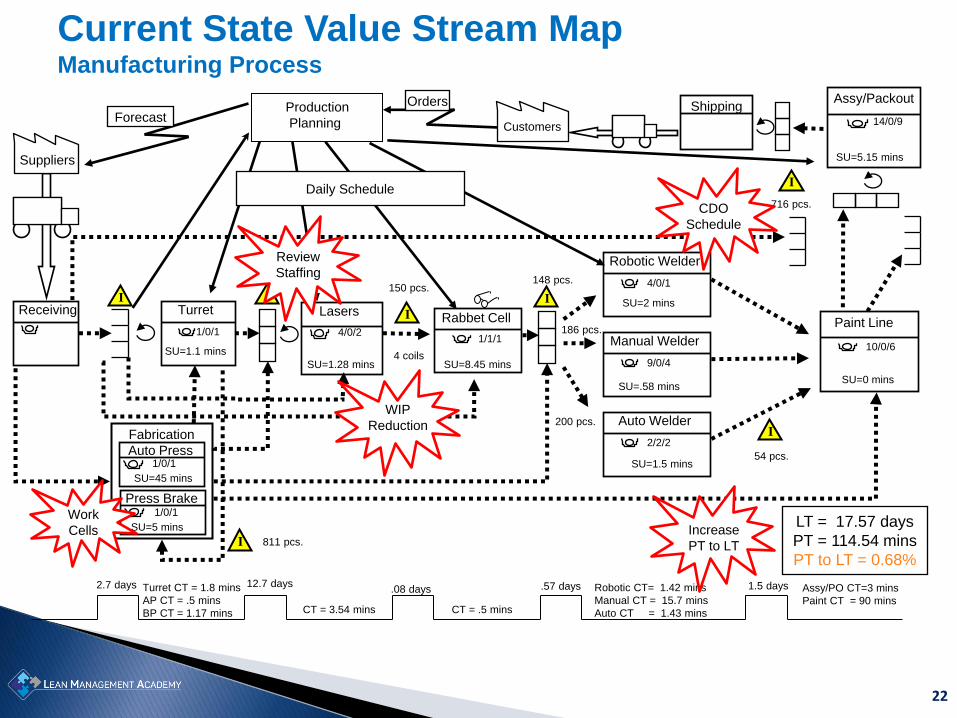
Suppliers
Receiving Turret
1/0/1
Lasers
4/0/2
Rabbet Cell
Production
Planning
SU=1.28 mins
I
I
I
Robotic CT= 1.42 mins
Manual CT = 15.7 mins
Auto CT = 1.43 mins CT = 3.54 mins
Turret CT = 1.8 mins
AP CT = .5 mins
BP CT = 1.17 mins CT = .5 mins
Assy/PO CT=3 mins
Paint CT = 90 mins
2.7 days
Daily Schedule
Robotic Welder
Manual Welder
Auto Welder
Customers
4/0/1
9/0/4
2/2/2
1/1/1
SU=8.45 mins
SU=2 mins
SU=.58 mins
SU=1.5 mins
I
Paint Line
Assy/Packout
14/0/9
10/0/6
SU=0 mins
SU=5.15 mins
I
Shipping Orders
Forecast
Press Brake
Auto Press
Fabrication
1/0/1
1/0/1
SU=5 mins
SU=45 mins
150 pcs.
I
54 pcs.
716 pcs.
148 pcs.
4 coils
I 811 pcs.
0 pcs.
12.7 days .08 days 1.5 days
SU=1.1 mins
LT = 17.57 days
PT = 114.54 mins
PT to LT = 0.68%
186 pcs.
200 pcs.
.57 days
Work
Cells
CDO
Schedule
WIP
Reduction
Review
Staffing
Increase
PT to LT
Current State Value Stream Map Manufacturing Process
23
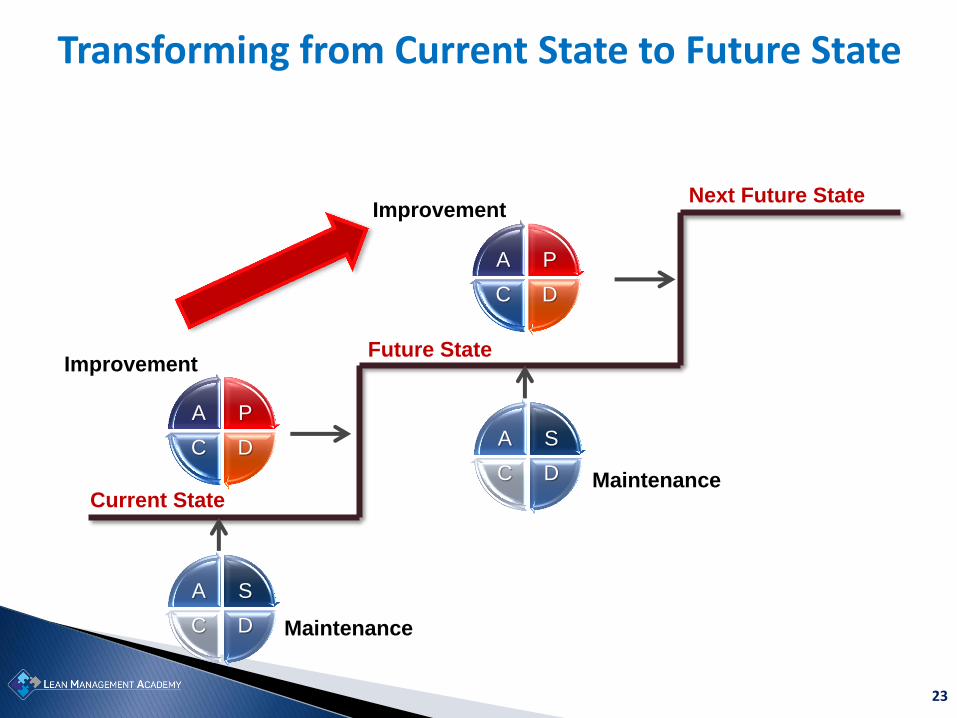
Transforming from Current State to Future State
Improvement
Maintenance
S
D C
A
P
D C
A
Maintenance
S
D C
A
P
D C
A
Improvement
Current State
Future State
Next Future State
24
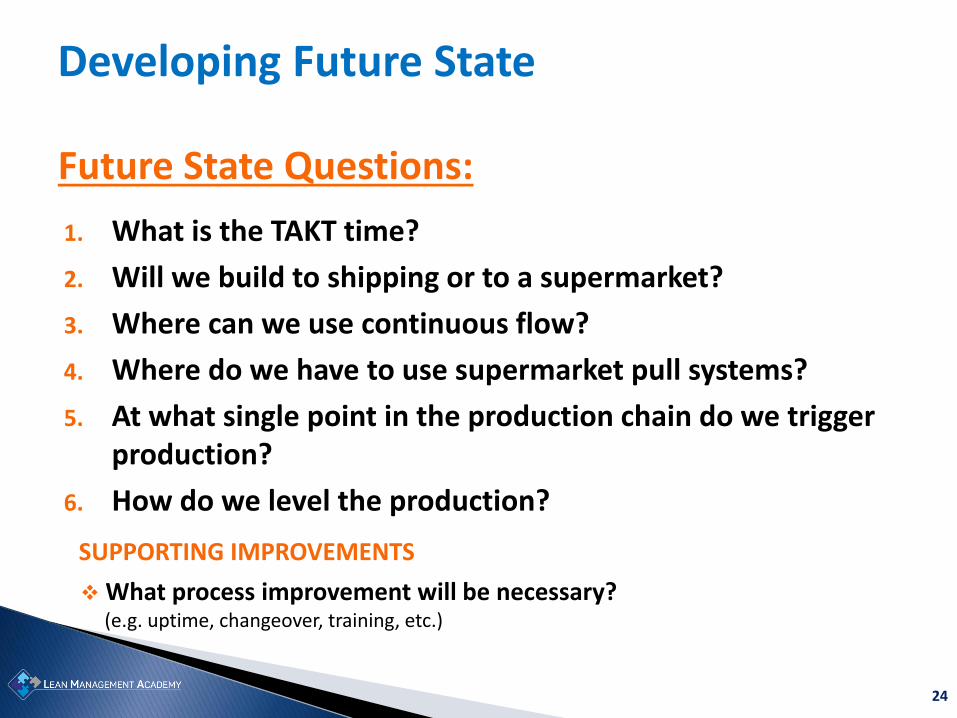
Developing Future State
Future State Questions:
1. What is the TAKT time?
2. Will we build to shipping or to a supermarket?
3. Where can we use continuous flow?
4. Where do we have to use supermarket pull systems?
5. At what single point in the production chain do we trigger production?
6. How do we level the production?
SUPPORTING IMPROVEMENTS
What process improvement will be necessary? (e.g. uptime, changeover, training, etc.)
25
1. The team starts and ends the day together; begin and end breaks together
2. No interruptions or distractions – 100% focus; phones on silent; no email; no texting
3. Rank has no privilege
4. Seek the wisdom of ten instead of the knowledge of one
5. Use creativity before capital (in designing improvements)
To be continued…
VSM Improvement Activities: Rules of Engagement (1)
26
Define tasks (1)
To get an overview of the tasks, Kaizen events are added to the “Future State” before the tasks are defined.
Kaizen events are drawn as “stars” or “bursts”.
Kaizen events aim to improve workplace organization (5S), increase uptime (OEE), reduce changeover times (SMED), implement Kanban, arrange the cell, cross-training, work sharing, etc.
When mapping the value stream, Kaizen is used to define the overall tasks to achieve the future value stream.
27
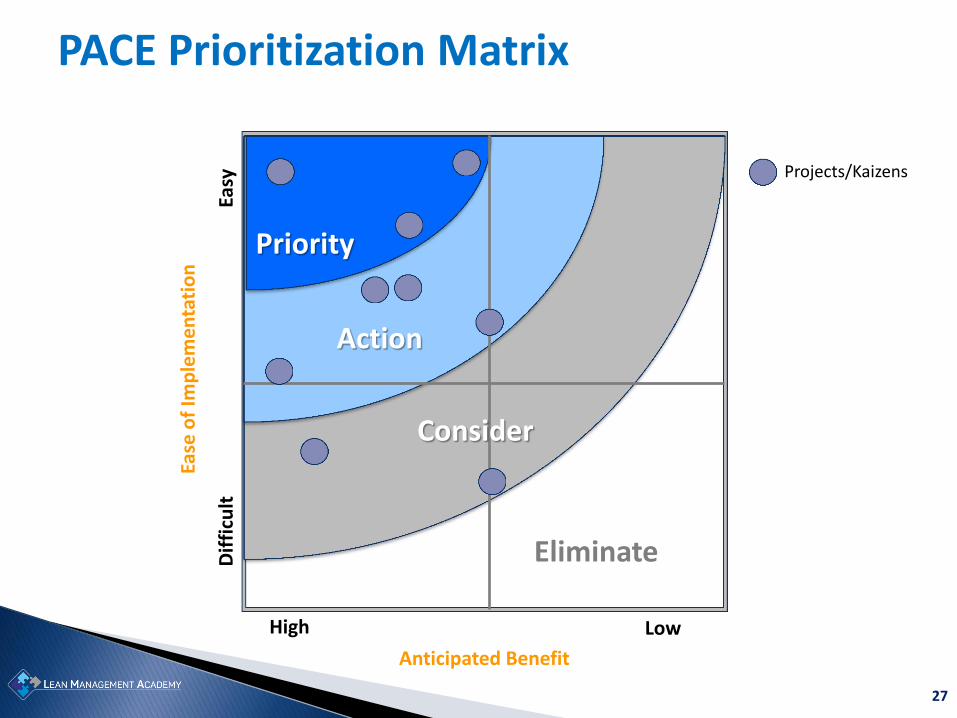
PACE Prioritization Matrix
Ease
of
Imp
lem
enta
tio
n
Dif
ficu
lt
Low
Anticipated Benefit
High
Priority
Action
Eliminate
Easy
Consider
Projects/Kaizens
28
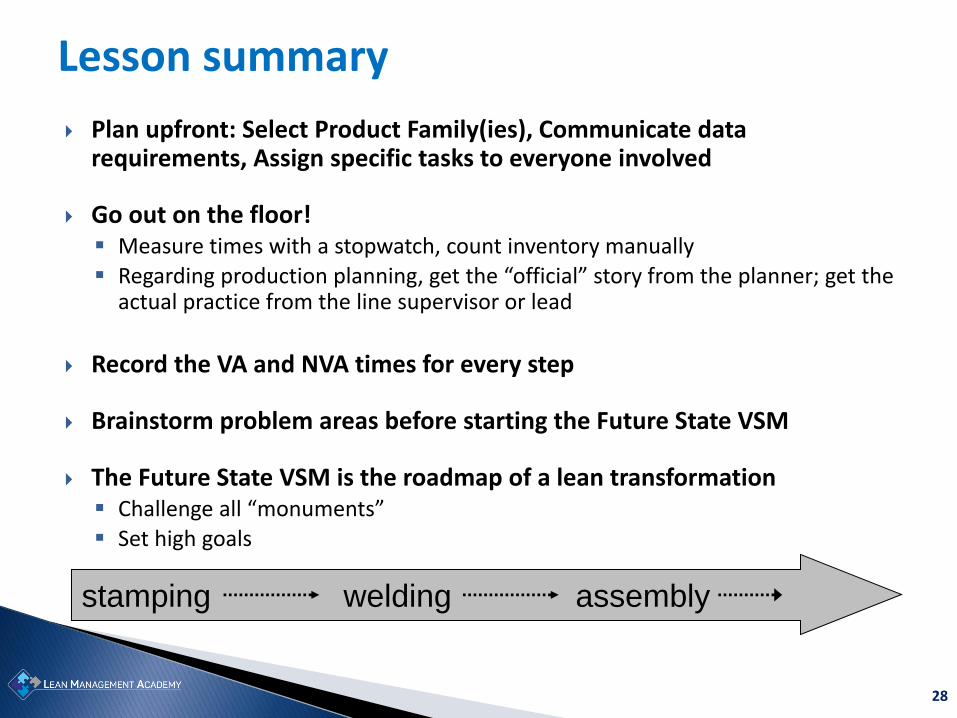
Lesson summary
Plan upfront: Select Product Family(ies), Communicate data requirements, Assign specific tasks to everyone involved
Go out on the floor! Measure times with a stopwatch, count inventory manually Regarding production planning, get the “official” story from the planner; get the
actual practice from the line supervisor or lead
Record the VA and NVA times for every step
Brainstorm problem areas before starting the Future State VSM
The Future State VSM is the roadmap of a lean transformation Challenge all “monuments” Set high goals
stamping welding assembly
29
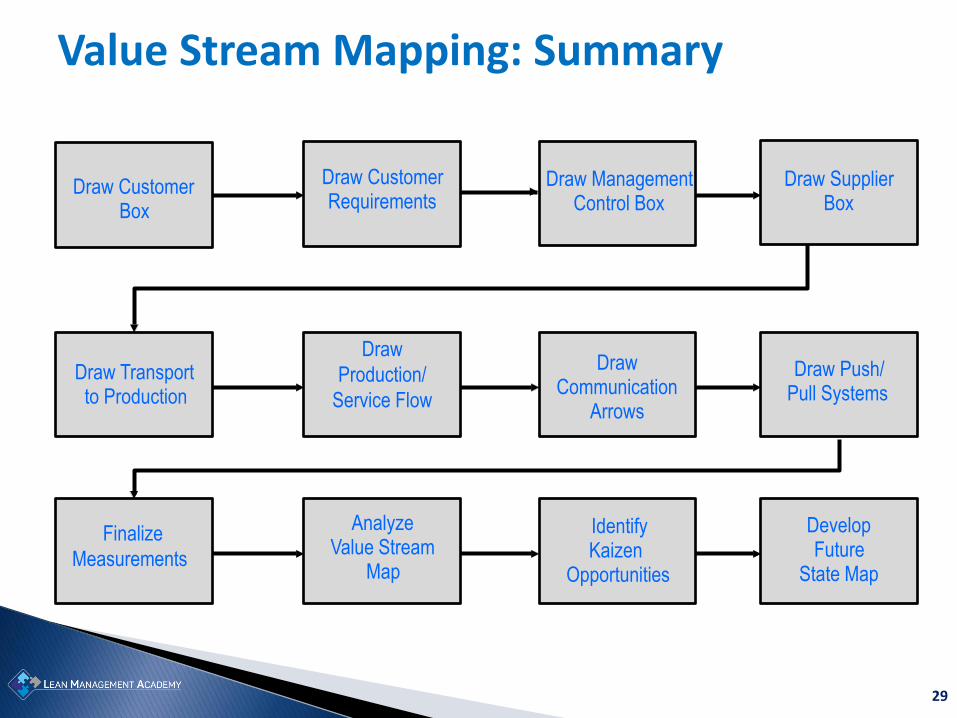
Value Stream Mapping: Summary
Draw Customer Box
Draw Customer Requirements
Draw Management Control Box
Draw Supplier Box
Draw Transport to Production
Draw
Production/
Service Flow
Draw Communication
Arrows
Draw Push/ Pull Systems
Finalize
Measurements
Analyze Value Stream
Map
Identify Kaizen
Opportunities
Develop Future
State Map
30
Value Stream Management
The map is just a picture of ideas!
The fundamental change is in how we choose to manage the value stream as an integrated system of decisions and tasks.
31
Value Stream Management
Use your strategic plan as a guide
Find the gaps in necessary performance
Improve value streams to meet the performance
Create new metrics to support new ways of thinking and acting
Understand true product family costs
Manage operations by the value stream data
Always have a future state!
32
Critical sucess factors
Management must understand, embrace, and lead the organization into lean thinking.
Value stream managers must be empowered and enabled to manage implementations.
Improvements must be planned in detail with the cross functional Kaizen teams.
Successes must be translated to the bottom line and/or market share.
33
Planning and implementing
Don’t Wait!
You need a plan!
• Tie it to your business objectives
• Make a VS Plan: What to do by when
• Establish an appropriate review frequency
• Conduct VS Reviews walking the flow
34 © Lean & Mean Consulting. All rights reserved. 2016


![[Lean sigma] SMED&VSM](https://img.pdfslide.net/doc/110x75/55b36dcbbb61ebb11d8b4634/lean-sigma-smedvsm.jpg)


![Lean Manufacturing-VSM[1] PSG](https://img.pdfslide.net/doc/110x75/546c2efdb4af9fda238b465c/lean-manufacturing-vsm1-psg.jpg)