Embed Size (px)
Citation preview
Q2 2015 HIGHLIGHTS
August 14, 2015
Forward-looking statements are included in this presentation. These forward-looking statements are typically identified by the use of terms such as “outlook”, “guidance”, “target”,
“forecast”, “assumption” and other similar expressions or future or conditional terms such as "anticipate", "believe", "could", "estimate", "expect", "intend", "may", "plan", "predict",
"project", "will", "would", and “should”. Such statements may involve but are not limited to comments with respect to strategies, expectations, planned operations or future actions.
Forward-looking statements, by their nature, are based on assumptions and are subject to important risks and uncertainties. Any forecasts, predictions or forward-looking statements
cannot be relied upon due to, among other things, changing external events and general uncertainties of the business and its corporate structure. Results indicated in forward-looking
statements may differ materially from actual results for a number of reasons, including without limitation, dependency on significant Accumulation Partners and clients, failure to
safeguard databases, cyber security and consumer privacy, changes to the Aeroplan Program, reliance on Redemption Partners, conflicts of interest, greater than expected air
redemptions for rewards, regulatory matters, retail market/economic conditions, industry competition, Air Canada liquidity issues, Air Canada or travel industry disruptions, airline industry
changes and increased airline costs, supply and capacity costs, unfunded future redemption costs, changes to coalition loyalty programs, seasonal nature of the business, other factors
and prior performance, foreign operations, legal proceedings, reliance on key personnel, labour relations, pension liability, technological disruptions, inability to use third-party software
and outsourcing, failure to protect intellectual property rights, interest rate and currency fluctuations (including currency risk or our foreign operations which are denominated in a currency
other than the Canadian dollar, mainly pound sterling, and subject to fluctuations as a result of foreign exchange rate variations), leverage and restrictive covenants in current and future
indebtedness, uncertainty of dividend payments, managing growth, credit ratings, audit by tax authorities, as well as the other factors identified throughout Aimia’s MD&A and its other
public disclosure records on file with the Canadian securities regulatory authorities.
In particular, slide 18 of this presentation contain certain forward-looking statements with respect to certain financial metrics in 2015. Aimia made a number of general economic and
market assumptions in making these statements, including assumptions regarding currencies, the performance of the economies in which the Corporation operates and market
competition and tax laws applicable to the Corporation’s operations. The Corporation cautions that the assumptions used to make these statements with respect to 2015, although
reasonable at the time they were made, may prove to be incorrect or inaccurate. In addition, these statements do not reflect the potential impact of any non-recurring or other special
items or of any new material commercial agreements, dispositions, mergers, acquisitions, other business combinations or transactions that may be announced or that may occur after
August 14, 2015. The financial impact of these transactions and non-recurring and other special items can be complex and depends on the facts particular to each of them. We therefore
cannot describe the expected impact in a meaningful way or in the same way we present known risks affecting our business. Accordingly, our actual results could differ materially from
the statements made on slide 18 of this presentation.
The forward-looking statements contained herein represent the Corporation’s expectations as of August 14, 2015 and are subject to change. However, Aimia disclaims any intention or
obligation to update or revise any forward-looking statements whether as a result of new information, future events or otherwise, except as required under applicable securities
regulations.
This presentation contains both IFRS and non-GAAP financial measures. Non-GAAP financial measures are defined and reconciled to the most comparable IFRS measures, if
applicable, in our MD&A. See caution regarding Non-GAAP financial measures on slide 4.
FORWARD-LOOKING AND CAUTIONARY STATEMENTS
3
Aimia uses the following non-GAAP financial measures which it believes provides investors and analysts with additional information to better understand results as well as assess its potential. GAAP means
generally accepted accounting principles in Canada and represents International Financial Reporting Standards (“IFRS”). For a reconciliation of non-GAAP financial measures to the most comparable GAAP
measure, please refer to the section entitled “Performance Indicators (including certain non-GAAP financial measures)” in our Management Discussion & Analysis for the three and six months ended June 30, 2015.
Adjusted EBITDA
Adjusted EBITDA is not a measurement based on GAAP, is not considered an alternative to operating income or net earnings in measuring performance, and is not comparable to similar measures used by other
issuers. We do not believe that Adjusted EBITDA has an appropriate directly comparable GAAP measure. As an alternative, we do however provide a reconciliation to operating income in our MD&A. Adjusted
EBITDA is used by management to evaluate performance, and to measure compliance with debt covenants. Management believes Adjusted EBITDA assists investors in comparing the Corporation’s performance
on a consistent basis without regard to depreciation and amortization and goodwill impairment, which are non-cash in nature and can vary significantly depending on accounting methods and non-operating factors
such as historical cost. Adjusted EBITDA is operating income adjusted to exclude depreciation, amortization and impairment charges, as well as adjusted for certain factors particular to the business, such as
changes in deferred revenue and Future Redemption Costs. Adjusted EBITDA also includes distributions and dividends received or receivable from equity-accounted investments. Adjusted EBITDA should not be
used as an exclusive measure of cash flow because it does not account for the impact of working capital growth, capital expenditures, debt repayments and other sources and uses of cash, which are disclosed in
the statements of cash flows.
Adjusted Net Earnings
Adjusted Net Earnings is not a measurement based on GAAP, is not considered an alternative to net earnings in measuring profitability, and is not comparable to similar measures used by other issuers. Adjusted
Net Earnings provides a measurement of profitability calculated on a basis consistent with Adjusted EBITDA. Net earnings attributable to equity holders of the Corporation are adjusted to exclude Amortization of
Accumulation Partners’ contracts, customer relationships and technology, share of net earnings (loss) of equity accounted investments and impairment charges. Adjusted Net Earnings includes the Change in
deferred revenue and Change in Future Redemption Costs, net of the income tax effect and non-controlling interest effect (where applicable) on these items at an entity level basis. Adjusted Net Earnings also
includes distributions and dividends received or receivable from equity-accounted investments.
Adjusted Net Earnings per Common Share
Adjusted Net Earnings per Common Share is not a measurement based on GAAP, is not considered an alternative to Net Earnings per Common Share in measuring profitability per Common Share and is not
comparable to similar measures used by other issuers. Adjusted Net Earnings per Common Share provides a measurement of profitability per Common Share on a basis consistent with Adjusted Net Earnings.
Calculated as Adjusted Net Earnings less dividends declared on preferred shares divided by the number of weighted average number of basic and diluted common shares. Free Cash Flow Free Cash Flow is not a measurement based on GAAP and is unlikely to be comparable to similar measures used by other issuers. Management believes Free cash flow (“Free Cash Flow”) provides a consistent and comparable measurement of cash generated from operations and is used as an indicator of financial strength and performance. Free Cash Flow is defined as cash flows from operating activities, as reported in accordance with GAAP, less: (a) total capital expenditures as reported in accordance with GAAP; and (b) dividends paid.
Free Cash Flow before Dividends paid and Free Cash Flow before Dividends paid per Common Share
Free Cash Flow before Dividends Paid are non-GAAP measures and are not comparable to similar measures used by other issuers. They are used in order to provide a consistent and comparable measurement
of cash generated from operations and used as indicators of financial strength and performance. Free Cash Flow before Dividends Paid is defined as cash flows from operating activities as reported in accordance
with GAAP, less capital expenditures as reported in accordance with GAAP. Free Cash Flow before Dividends Paid per Common Share is a measurement of cash flow generated from operations on a per share
basis. It is calculated as follows: Free Cash Flow before dividends paid minus dividends paid on preferred shares and non-controlling interests over the weighted average number of common shares outstanding.
Constant Currency
Because exchange rates are an important factor in understanding period to period comparisons, management believes that the presentation of various financial metrics on a constant currency basis or after giving
effect to foreign exchange translation, in addition to the reported metrics, helps improve the ability to understand operating results and evaluate performance in comparison to prior periods. Constant currency
information compares results between periods as if exchange rates had remained constant over the periods. Constant currency is derived by calculating current-year results using prior-year foreign currency
exchange rates. Results calculated on a constant currency basis should be considered in addition to, not as a substitute for, results reported in accordance with GAAP and may not be comparable to similarly titled
measures used by other companies.
NON-GAAP FINANCIAL MEASURES
4
RUPERT DUCHESNE GROUP CHIEF EXECUTIVE

DAVID JOHNSTON GROUP CHIEF OPERATING OFFICER
SIMPLIFYING, FOCUSING & GROWING THE BUSINESS
7
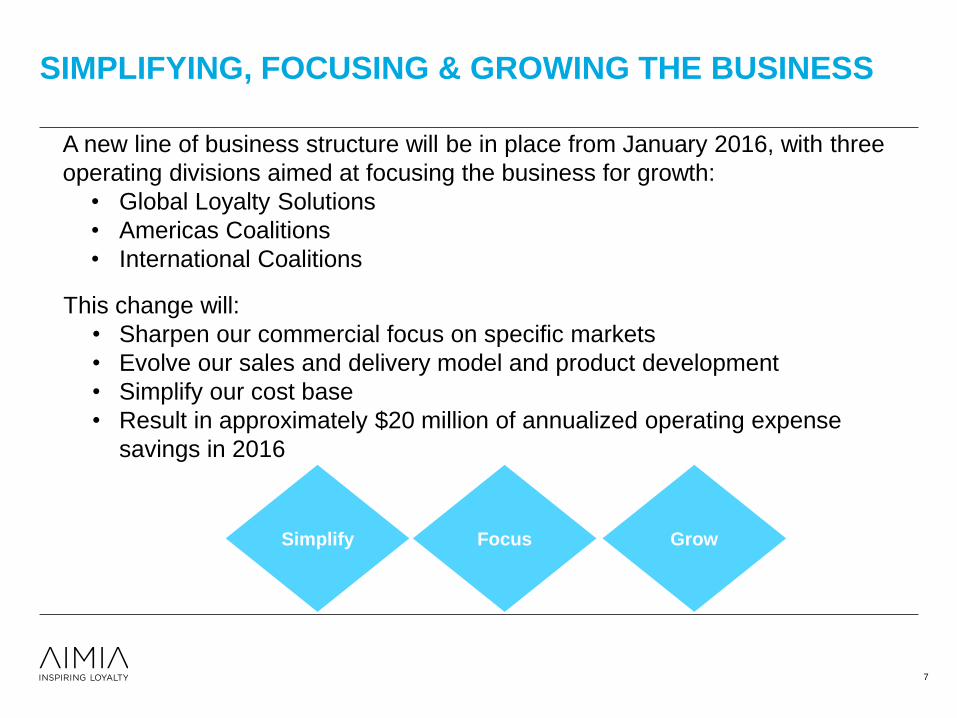
A new line of business structure will be in place from January 2016, with three
operating divisions aimed at focusing the business for growth:
• Global Loyalty Solutions
• Americas Coalitions
• International Coalitions
This change will:
• Sharpen our commercial focus on specific markets
• Evolve our sales and delivery model and product development
• Simplify our cost base
• Result in approximately $20 million of annualized operating expense
savings in 2016
Simplify Focus Grow
AEROPLAN FINANCIAL CARD TRENDS
8
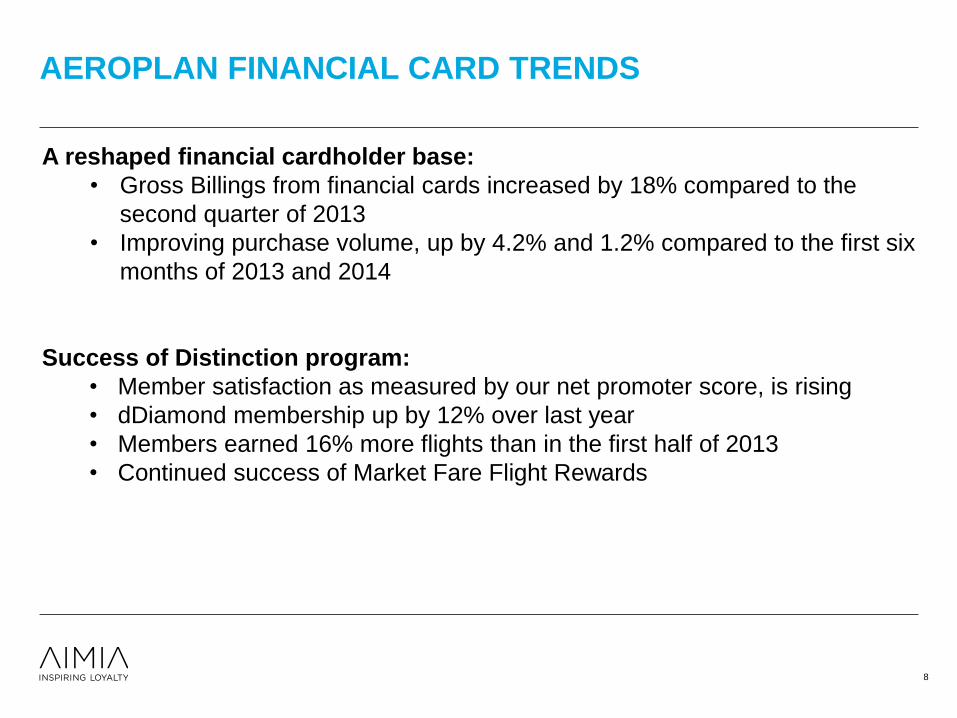
A reshaped financial cardholder base:
• Gross Billings from financial cards increased by 18% compared to the
second quarter of 2013
• Improving purchase volume, up by 4.2% and 1.2% compared to the first six
months of 2013 and 2014
Success of Distinction program:
• Member satisfaction as measured by our net promoter score, is rising
• dDiamond membership up by 12% over last year
• Members earned 16% more flights than in the first half of 2013
• Continued success of Market Fare Flight Rewards
DAVID ADAMS EXECUTIVE VICE-PRESIDENT
AND CFO
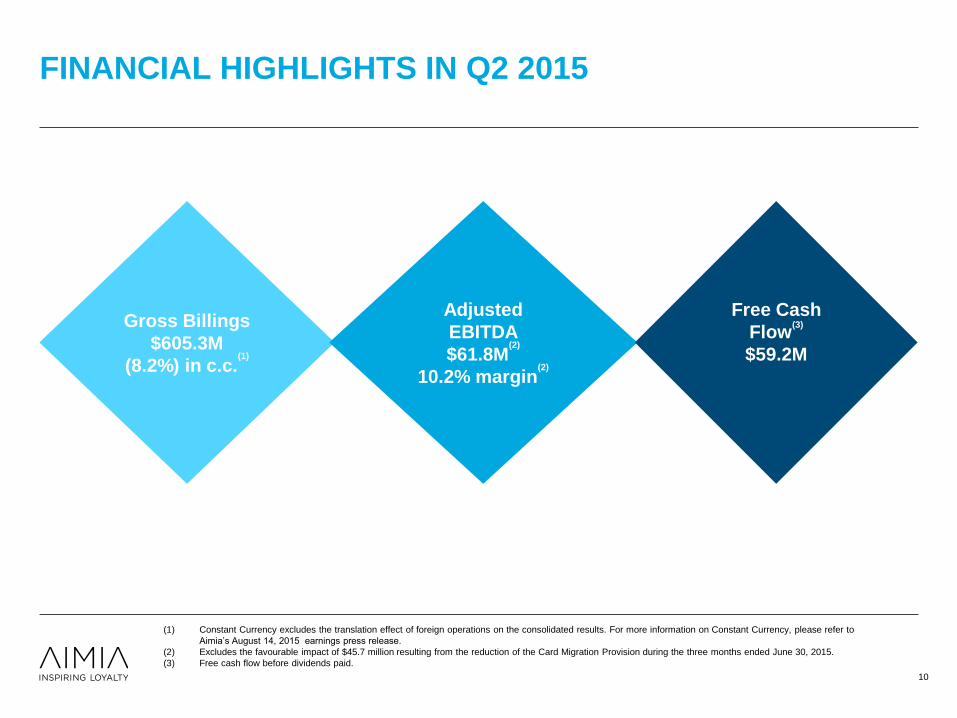
FINANCIAL HIGHLIGHTS IN Q2 2015
(1) Constant Currency excludes the translation effect of foreign operations on the consolidated results. For more information on Constant Currency, please refer to
Aimia’s August 14, 2015 earnings press release.
(2) Excludes the favourable impact of $45.7 million resulting from the reduction of the Card Migration Provision during the three months ended June 30, 2015.
(3) Free cash flow before dividends paid.
Gross Billings
$605.3M
(8.2%) in c.c.(1)
Adjusted
EBITDA
$61.8M(2)
10.2% margin(2)
Free Cash
Flow(3)
$59.2M
10
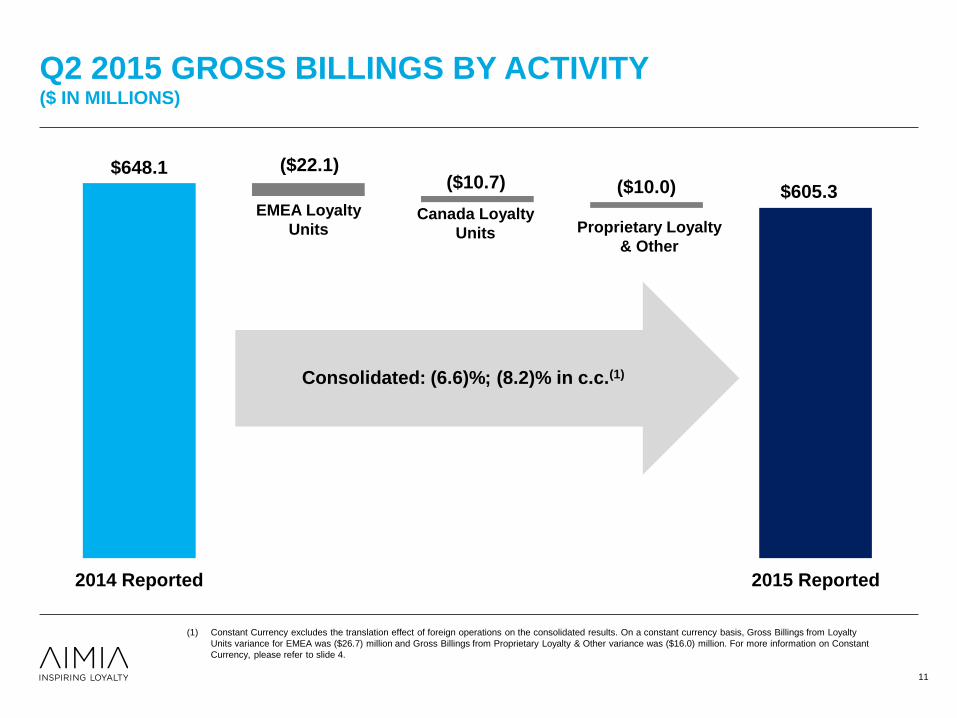
Q2 2015 GROSS BILLINGS BY ACTIVITY ($ IN MILLIONS)
Canada Loyalty
Units
EMEA Loyalty
Units Proprietary Loyalty
& Other
11
$605.3
($22.1) ($10.7) ($10.0)
$648.1
2014 Reported 2015 Reported
Consolidated: (6.6)%; (8.2)% in c.c.(1)
(1) Constant Currency excludes the translation effect of foreign operations on the consolidated results. On a constant currency basis, Gross Billings from Loyalty
Units variance for EMEA was ($26.7) million and Gross Billings from Proprietary Loyalty & Other variance was ($16.0) million. For more information on Constant
Currency, please refer to slide 4.
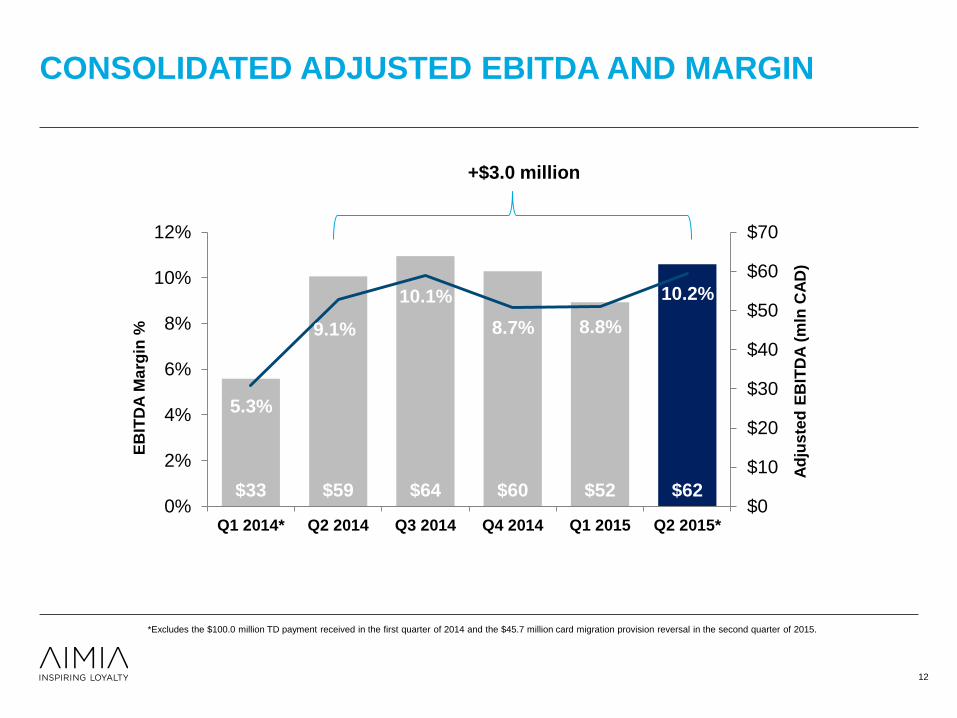
CONSOLIDATED ADJUSTED EBITDA AND MARGIN
12
$33 $59 $64 $60 $52 $62
5.3%
9.1%
10.1%
8.7% 8.8%
10.2%
0%
2%
4%
6%
8%
10%
12%
Q1 2014* Q2 2014 Q3 2014 Q4 2014 Q1 2015 Q2 2015*$0
$10
$20
$30
$40
$50
$60
$70
EB
ITD
A M
arg
in %
Ad
juste
d E
BIT
DA
(m
ln C
AD
)
*Excludes the $100.0 million TD payment received in the first quarter of 2014 and the $45.7 million card migration provision reversal in the second quarter of 2015.
+$3.0 million
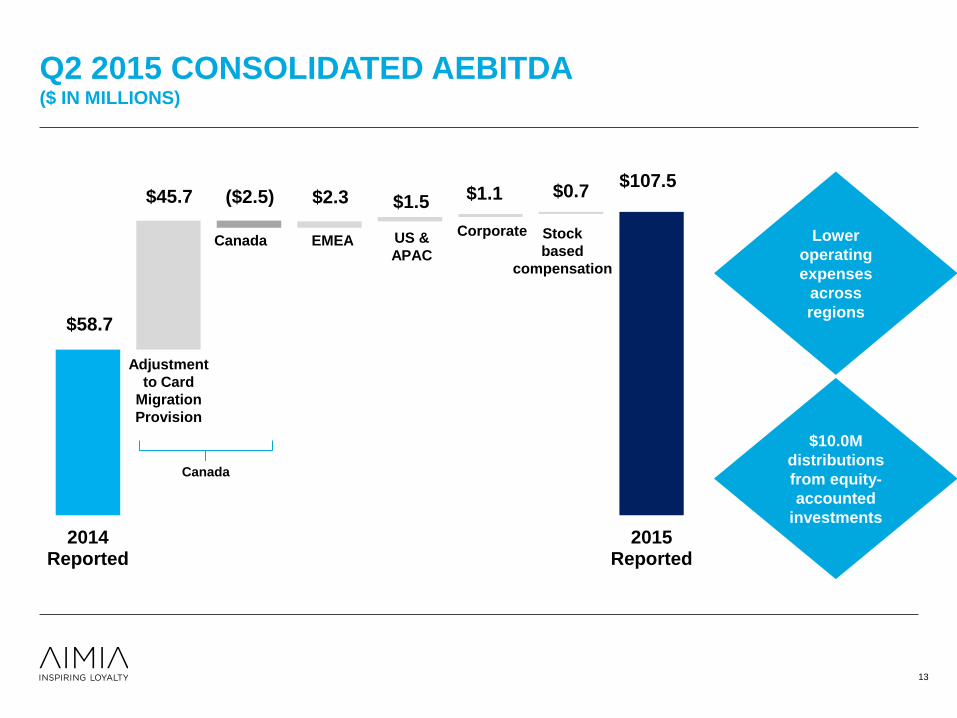
Q2 2015 CONSOLIDATED AEBITDA ($ IN MILLIONS)
13
$107.5 ($2.5) $45.7 $2.3 $1.5 $1.1 $0.7
$58.7
2014Reported
2015Reported
Adjustment
to Card
Migration
Provision
Canada EMEA US &
APAC
Corporate Stock
based
compensation
Canada
Lower
operating
expenses
across
regions
$10.0M
distributions
from equity-
accounted
investments
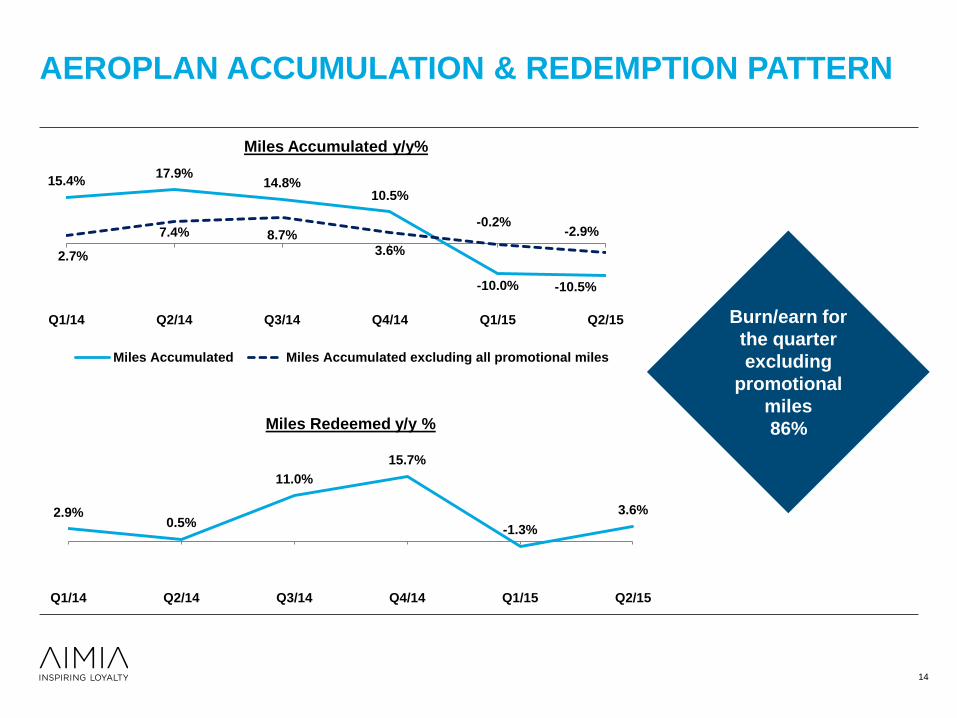
AEROPLAN ACCUMULATION & REDEMPTION PATTERN
14
15.4% 17.9%
14.8% 10.5%
-10.0% -10.5%
2.7%
7.4% 8.7%
3.6%
-0.2% -2.9%
Q1/14 Q2/14 Q3/14 Q4/14 Q1/15 Q2/15
Miles Accumulated y/y%
Miles Accumulated Miles Accumulated excluding all promotional miles
2.9% 0.5%
11.0%
15.7%
-1.3%
3.6%
Q1/14 Q2/14 Q3/14 Q4/14 Q1/15 Q2/15
Miles Redeemed y/y %
Burn/earn for
the quarter
excluding
promotional
miles
86%
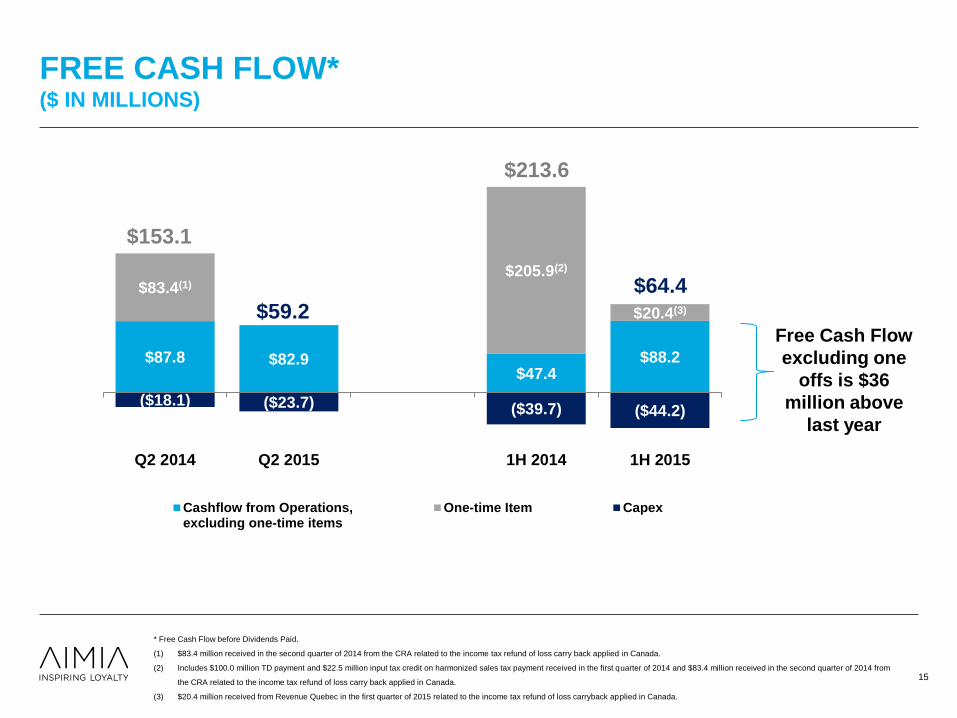
FREE CASH FLOW* ($ IN MILLIONS)
* Free Cash Flow before Dividends Paid.
(1) $83.4 million received in the second quarter of 2014 from the CRA related to the income tax refund of loss carry back applied in Canada.
(2) Includes $100.0 million TD payment and $22.5 million input tax credit on harmonized sales tax payment received in the first quarter of 2014 and $83.4 million received in the second quarter of 2014 from
the CRA related to the income tax refund of loss carry back applied in Canada.
(3) $20.4 million received from Revenue Quebec in the first quarter of 2015 related to the income tax refund of loss carryback applied in Canada.
$87.8 $82.9 $47.4
$88.2
$83.4(1) $205.9(2)
$20.4(3)
($18.1) ($23.7) ($39.7) ($44.2)
Q2 2014 Q2 2015 1H 2014 1H 2015
Cashflow from Operations,excluding one-time items
One-time Item Capex
$153.1
$59.2
15
$64.4
$213.6
Free Cash Flow
excluding one
offs is $36
million above
last year
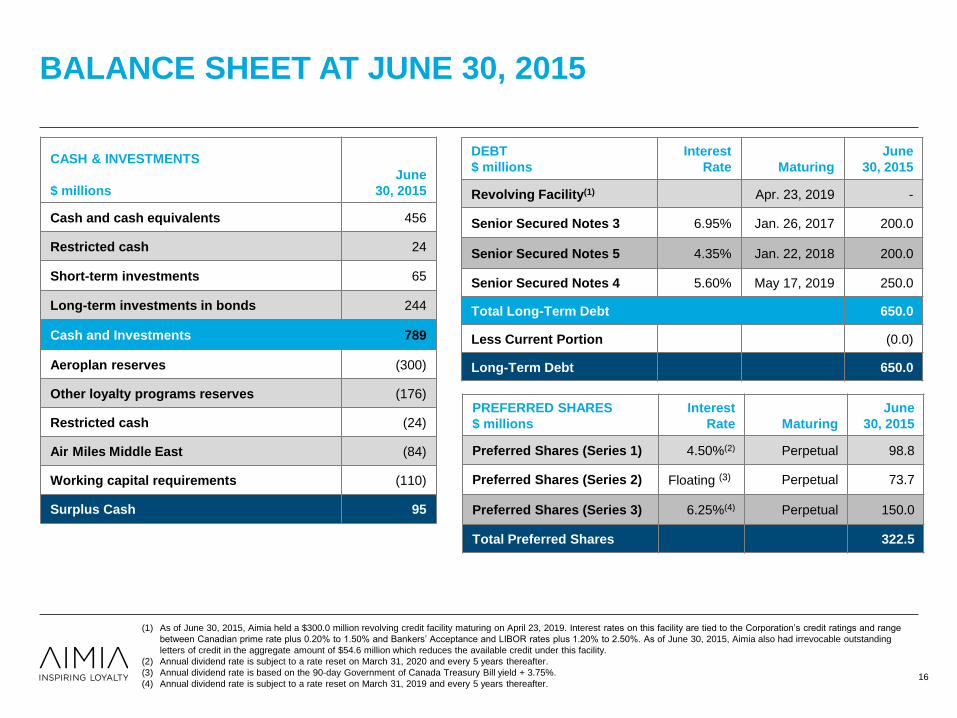
BALANCE SHEET AT JUNE 30, 2015
CASH & INVESTMENTS
$ millions
June
30, 2015
Cash and cash equivalents 456
Restricted cash 24
Short-term investments 65
Long-term investments in bonds 244
Cash and Investments 789
Aeroplan reserves (300)
Other loyalty programs reserves (176)
Restricted cash (24)
Air Miles Middle East (84)
Working capital requirements (110)
Surplus Cash 95
DEBT
$ millions
Interest
Rate
Maturing
June
30, 2015
Revolving Facility(1) Apr. 23, 2019 -
Senior Secured Notes 3 6.95% Jan. 26, 2017 200.0
Senior Secured Notes 5 4.35% Jan. 22, 2018 200.0
Senior Secured Notes 4 5.60% May 17, 2019 250.0
Total Long-Term Debt 650.0
Less Current Portion (0.0)
Long-Term Debt 650.0
(1) As of June 30, 2015, Aimia held a $300.0 million revolving credit facility maturing on April 23, 2019. Interest rates on this facility are tied to the Corporation’s credit ratings and range
between Canadian prime rate plus 0.20% to 1.50% and Bankers’ Acceptance and LIBOR rates plus 1.20% to 2.50%. As of June 30, 2015, Aimia also had irrevocable outstanding
letters of credit in the aggregate amount of $54.6 million which reduces the available credit under this facility.
(2) Annual dividend rate is subject to a rate reset on March 31, 2020 and every 5 years thereafter.
(3) Annual dividend rate is based on the 90-day Government of Canada Treasury Bill yield + 3.75%.
(4) Annual dividend rate is subject to a rate reset on March 31, 2019 and every 5 years thereafter.
PREFERRED SHARES
$ millions
Interest
Rate
Maturing
June
30, 2015
Preferred Shares (Series 1) 4.50%(2) Perpetual 98.8
Preferred Shares (Series 2) Floating (3) Perpetual 73.7
Preferred Shares (Series 3) 6.25%(4) Perpetual 150.0
Total Preferred Shares 322.5
16
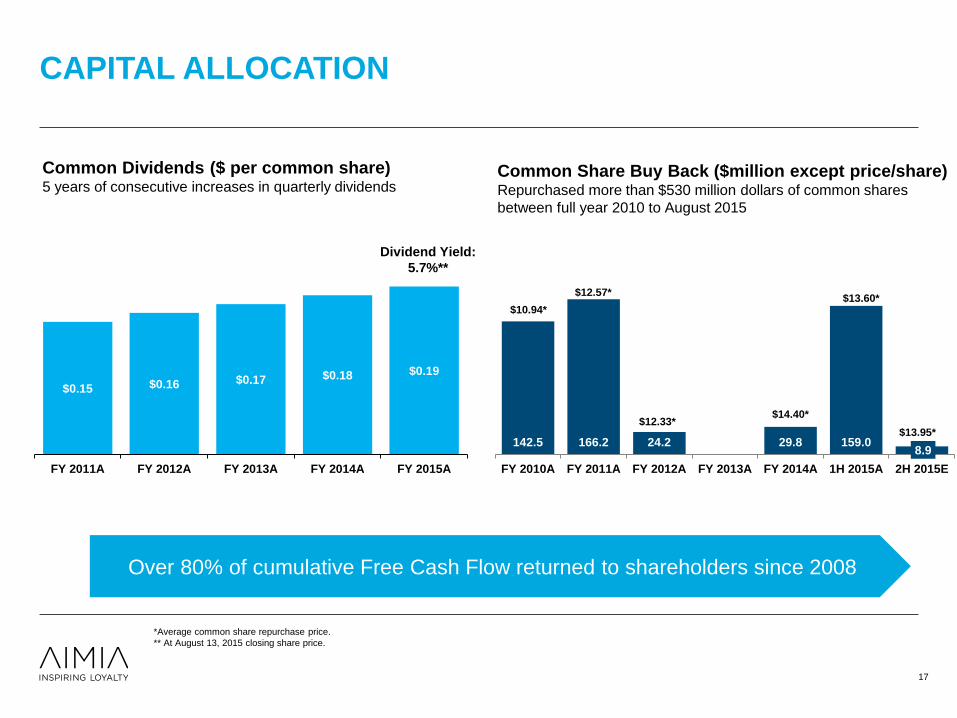
CAPITAL ALLOCATION
*Average common share repurchase price.
** At August 13, 2015 closing share price.
Over 80% of cumulative Free Cash Flow returned to shareholders since 2008
17
Common Dividends ($ per common share) 5 years of consecutive increases in quarterly dividends
$0.15 $0.16 $0.17 $0.18 $0.19
FY 2011A FY 2012A FY 2013A FY 2014A FY 2015A
Common Share Buy Back ($million except price/share) Repurchased more than $530 million dollars of common shares
between full year 2010 to August 2015
Dividend Yield:
5.7%**
142.5 166.2 24.2 0 29.8 159.0 8.9
FY 2010A FY 2011A FY 2012A FY 2013A FY 2014A 1H 2015A 2H 2015E
$10.94*
$12.57*
$12.33* $14.40*
$13.60*
$13.95*
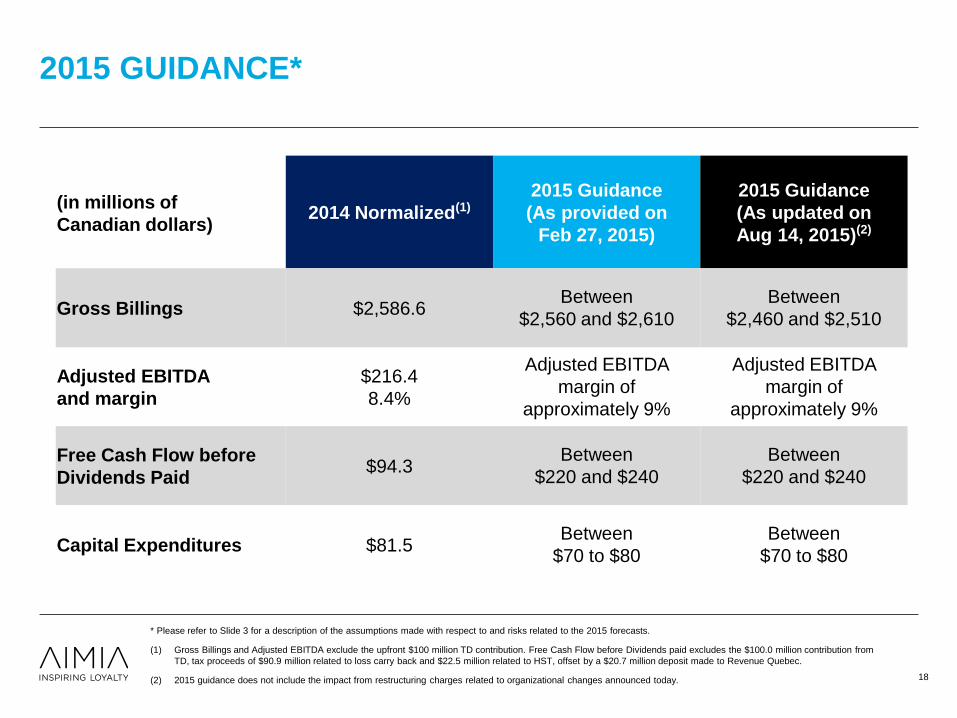
2015 GUIDANCE*
* Please refer to Slide 3 for a description of the assumptions made with respect to and risks related to the 2015 forecasts.
(1) Gross Billings and Adjusted EBITDA exclude the upfront $100 million TD contribution. Free Cash Flow before Dividends paid excludes the $100.0 million contribution from
TD, tax proceeds of $90.9 million related to loss carry back and $22.5 million related to HST, offset by a $20.7 million deposit made to Revenue Quebec.
(2) 2015 guidance does not include the impact from restructuring charges related to organizational changes announced today.
18
(in millions of
Canadian dollars) 2014 Normalized(1)
2015 Guidance
(As provided on
Feb 27, 2015)
2015 Guidance
(As updated on
Aug 14, 2015)(2)
Gross Billings $2,586.6 Between
$2,560 and $2,610
Between
$2,460 and $2,510
Adjusted EBITDA
and margin
$216.4
8.4%
Adjusted EBITDA
margin of
approximately 9%
Adjusted EBITDA
margin of
approximately 9%
Free Cash Flow before
Dividends Paid $94.3
Between
$220 and $240
Between
$220 and $240
Capital Expenditures $81.5 Between
$70 to $80
Between
$70 to $80

THANK YOU

APPENDIX
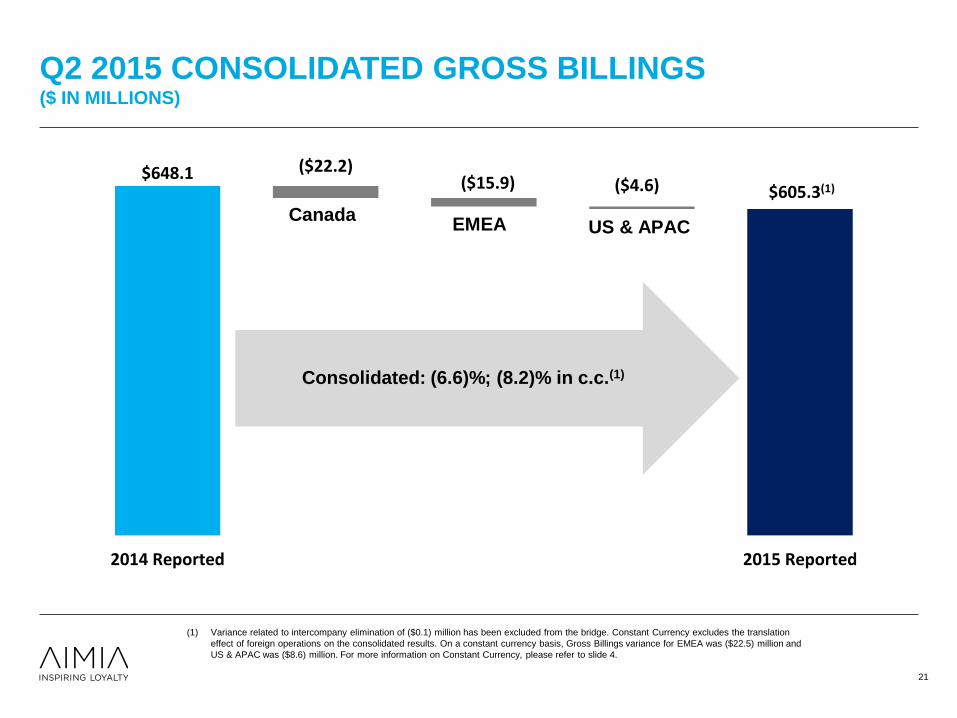
Q2 2015 CONSOLIDATED GROSS BILLINGS ($ IN MILLIONS)
US &
APAC
EMEA
Canada
Breakage
Impact PLM Stock
Based
Compensation
Corporate
Consolidated +60.1% growth
Consolidated: +17.0% growth; 12.1% in c.c.(1)
Canada: +22.4%; EMEA: +12.7%; -1.2% in c.c.(1)
US & APAC: +5.2%; 0.0% in c.c.(1)
21
$605.3(1)
($22.2) ($15.9) ($4.6)
$648.1
2014 Reported 2015 Reported
Canada EMEA US & APAC
Consolidated: (6.6)%; (8.2)% in c.c.(1)
(1) Variance related to intercompany elimination of ($0.1) million has been excluded from the bridge. Constant Currency excludes the translation
effect of foreign operations on the consolidated results. On a constant currency basis, Gross Billings variance for EMEA was ($22.5) million and
US & APAC was ($8.6) million. For more information on Constant Currency, please refer to slide 4.
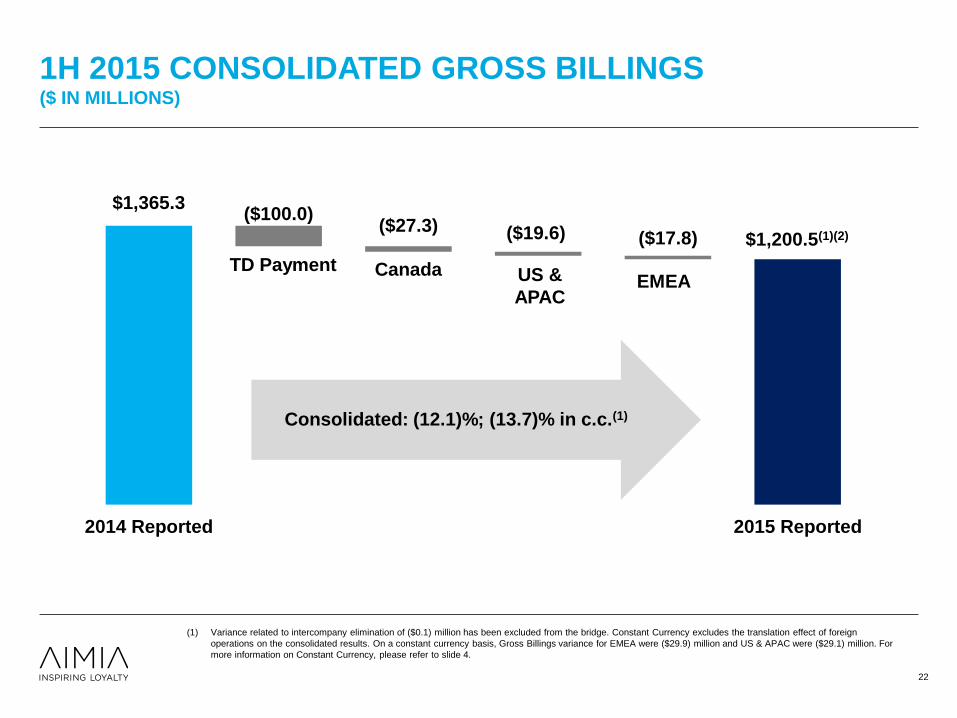
1H 2015 CONSOLIDATED GROSS BILLINGS ($ IN MILLIONS)
US &
APAC
EMEA
Canada
Breakage
Impact PLM Stock
Based
Compensation
Corporate
Consolidated +60.1% growth
Consolidated: +17.0% growth; 12.1% in c.c.(1)
Canada: +22.4%; EMEA: +12.7%; -1.2% in c.c.(1)
US & APAC: +5.2%; 0.0% in c.c.(1)
22
(1) Variance related to intercompany elimination of ($0.1) million has been excluded from the bridge. Constant Currency excludes the translation effect of foreign
operations on the consolidated results. On a constant currency basis, Gross Billings variance for EMEA were ($29.9) million and US & APAC were ($29.1) million. For
more information on Constant Currency, please refer to slide 4.
$1,200.5(1)(2)
($100.0) ($27.3) ($19.6) ($17.8)
$1,365.3
2014 Reported 2015 Reported
Consolidated: (12.1)%; (13.7)% in c.c.(1)
TD Payment Canada US &
APAC EMEA
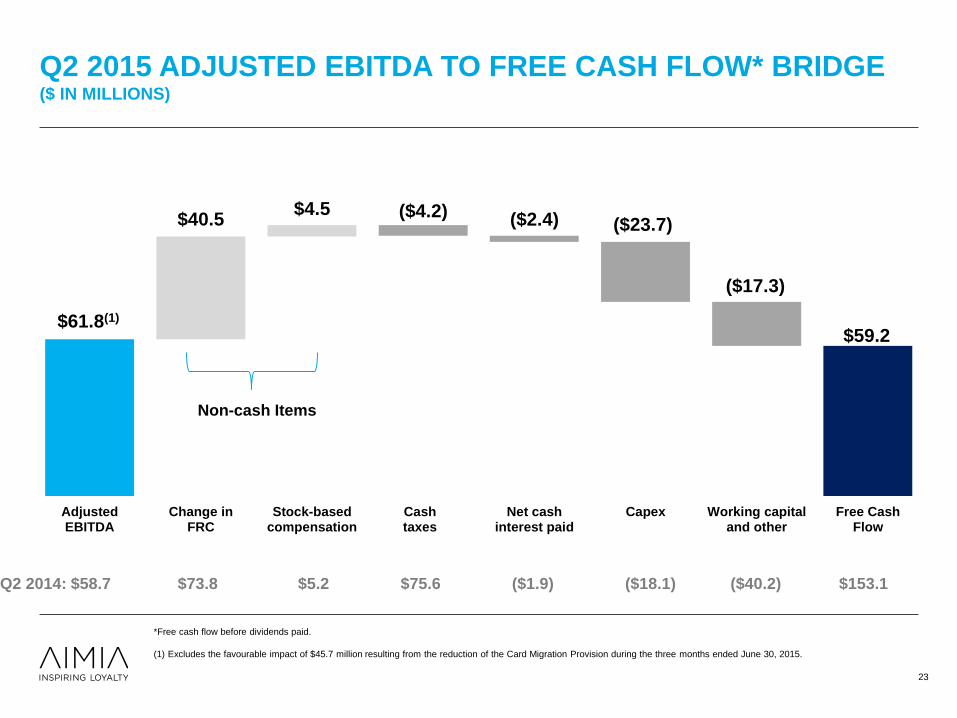
Q2 2015 ADJUSTED EBITDA TO FREE CASH FLOW* BRIDGE ($ IN MILLIONS)
23
*Free cash flow before dividends paid.
(1) Excludes the favourable impact of $45.7 million resulting from the reduction of the Card Migration Provision during the three months ended June 30, 2015.
Non-cash Items
Q2 2014: $58.7 $73.8 $5.2 $75.6 ($1.9) ($18.1) ($40.2) $153.1
$59.2
($4.2) ($2.4) ($23.7)
($17.3)
$40.5 $4.5
$61.8(1)
AdjustedEBITDA
Change inFRC
Stock-basedcompensation
Cashtaxes
Net cashinterest paid
Capex Working capitaland other
Free CashFlow
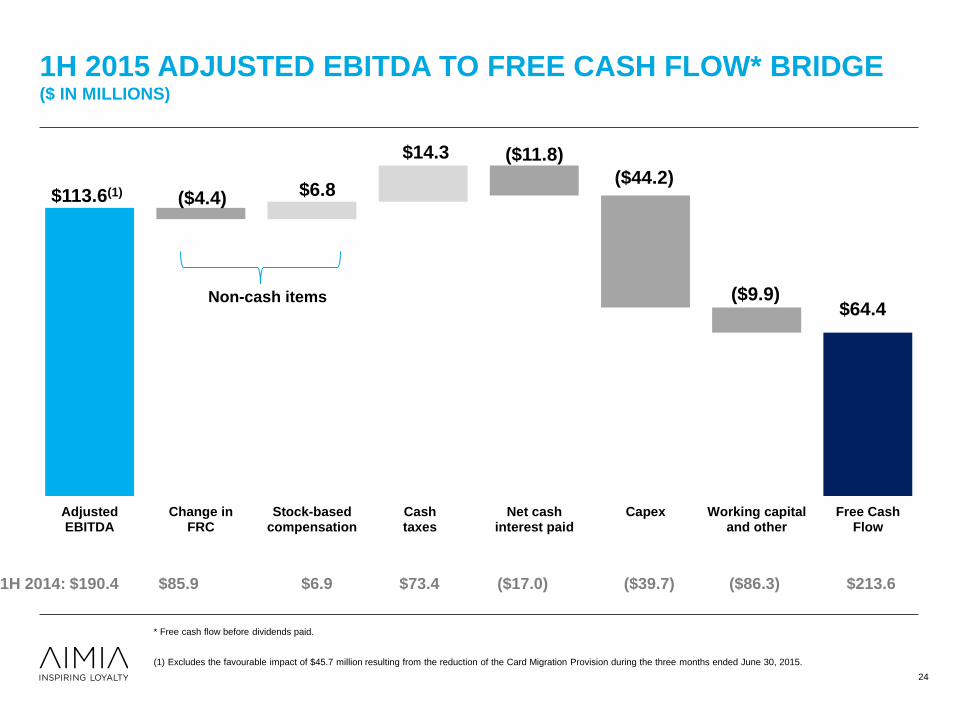
1H 2015 ADJUSTED EBITDA TO FREE CASH FLOW* BRIDGE ($ IN MILLIONS)
24
1H 2014: $190.4 $85.9 $6.9 $73.4 ($17.0) ($39.7) ($86.3) $213.6
Non-cash items $64.4
($4.4)
($11.8)
($44.2)
($9.9)
$6.8
$14.3
$113.6(1)
AdjustedEBITDA
Change inFRC
Stock-basedcompensation
Cashtaxes
Net cashinterest paid
Capex Working capitaland other
Free CashFlow
* Free cash flow before dividends paid.
(1) Excludes the favourable impact of $45.7 million resulting from the reduction of the Card Migration Provision during the three months ended June 30, 2015.
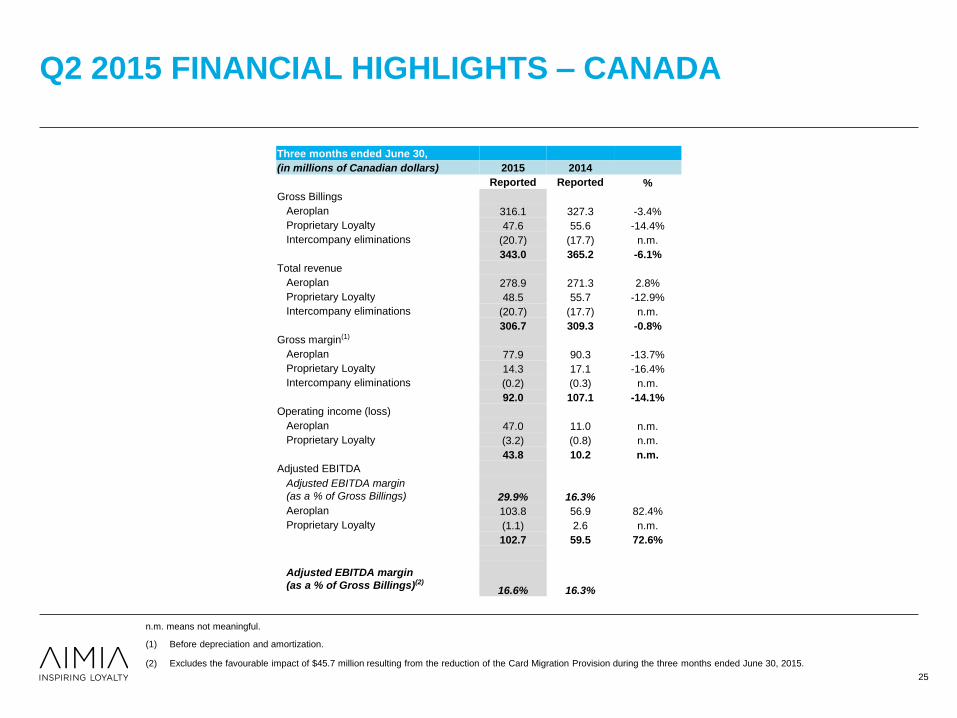
Q2 2015 FINANCIAL HIGHLIGHTS – CANADA
(1) Before depreciation and amortization.
(2) Excludes the favourable impact of $45.7 million resulting from the reduction of the Card Migration Provision during the three months ended June 30, 2015.
n.m. means not meaningful.
25
Three months ended June 30,
(in millions of Canadian dollars) 2015 2014
Reported Reported %
Gross Billings
Aeroplan 316.1 327.3 -3.4%
Proprietary Loyalty 47.6 55.6 -14.4%
Intercompany eliminations (20.7) (17.7) n.m.
343.0 365.2 -6.1%
Total revenue
Aeroplan 278.9 271.3 2.8%
Proprietary Loyalty 48.5 55.7 -12.9%
Intercompany eliminations (20.7) (17.7) n.m.
306.7 309.3 -0.8%
Gross margin(1)
Aeroplan 77.9 90.3 -13.7%
Proprietary Loyalty 14.3 17.1 -16.4%
Intercompany eliminations (0.2) (0.3) n.m.
92.0 107.1 -14.1%
Operating income (loss)
Aeroplan 47.0 11.0 n.m.
Proprietary Loyalty (3.2) (0.8) n.m.
43.8 10.2 n.m.
Adjusted EBITDA
Adjusted EBITDA margin
(as a % of Gross Billings) 29.9% 16.3%
Aeroplan 103.8 56.9 82.4%
Proprietary Loyalty (1.1) 2.6 n.m.
102.7 59.5 72.6%
Adjusted EBITDA margin
(as a % of Gross Billings)(2) 16.6% 16.3%
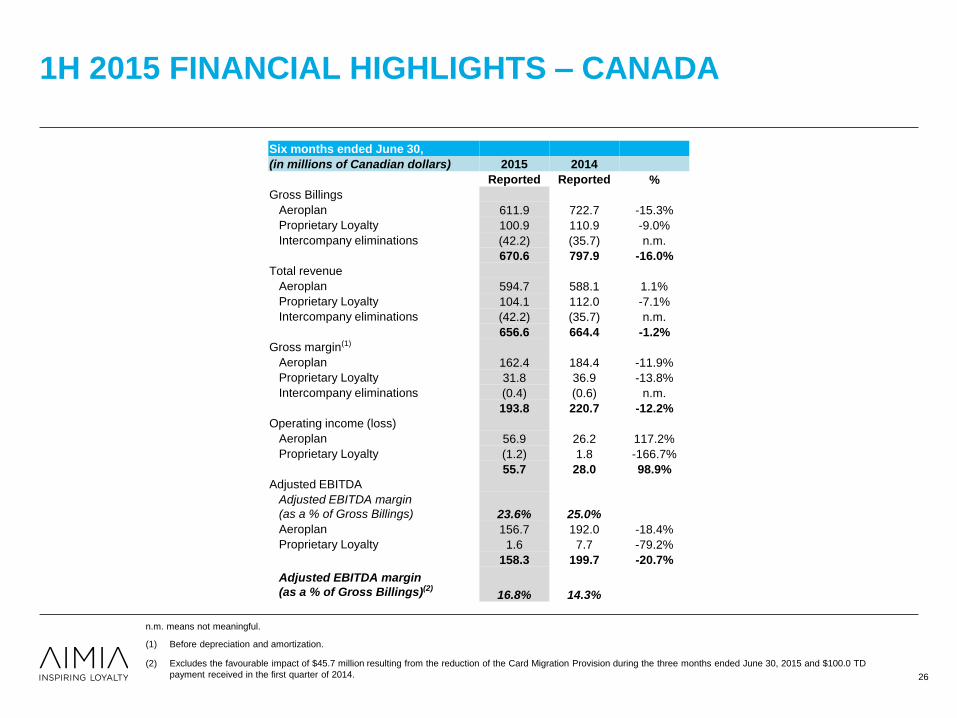
1H 2015 FINANCIAL HIGHLIGHTS – CANADA
(1) Before depreciation and amortization.
(2) Excludes the favourable impact of $45.7 million resulting from the reduction of the Card Migration Provision during the three months ended June 30, 2015 and $100.0 TD
payment received in the first quarter of 2014.
n.m. means not meaningful.
26
Six months ended June 30,
(in millions of Canadian dollars) 2015 2014
Reported Reported %
Gross Billings
Aeroplan 611.9 722.7 -15.3%
Proprietary Loyalty 100.9 110.9 -9.0%
Intercompany eliminations (42.2) (35.7) n.m.
670.6 797.9 -16.0%
Total revenue
Aeroplan 594.7 588.1 1.1%
Proprietary Loyalty 104.1 112.0 -7.1%
Intercompany eliminations (42.2) (35.7) n.m.
656.6 664.4 -1.2%
Gross margin(1)
Aeroplan 162.4 184.4 -11.9%
Proprietary Loyalty 31.8 36.9 -13.8%
Intercompany eliminations (0.4) (0.6) n.m.
193.8 220.7 -12.2%
Operating income (loss)
Aeroplan 56.9 26.2 117.2%
Proprietary Loyalty (1.2) 1.8 -166.7%
55.7 28.0 98.9%
Adjusted EBITDA
Adjusted EBITDA margin
(as a % of Gross Billings) 23.6% 25.0%
Aeroplan 156.7 192.0 -18.4%
Proprietary Loyalty 1.6 7.7 -79.2%
158.3 199.7 -20.7%
Adjusted EBITDA margin
(as a % of Gross Billings)(2) 16.8% 14.3%
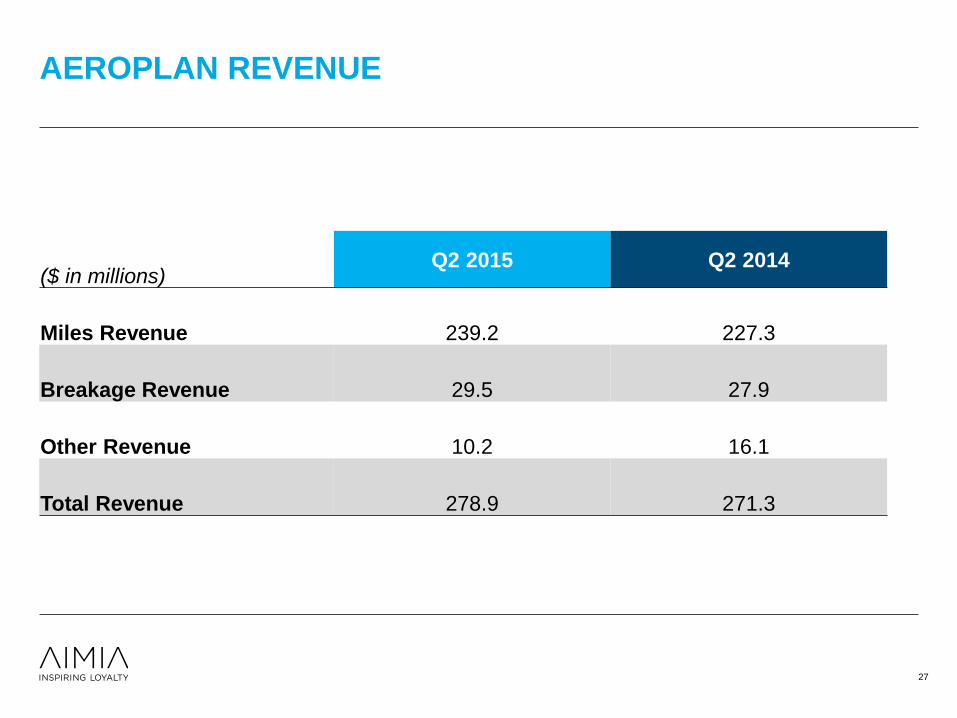
AEROPLAN REVENUE
($ in millions) Q2 2015 Q2 2014
Miles Revenue 239.2 227.3
Breakage Revenue 29.5 27.9
Other Revenue 10.2 16.1
Total Revenue 278.9 271.3
27

14.2%
19.5%
19.2% 11.9%
12.4%
22.8%
GROSS BILLINGS FROM SALE OF LOYALTY UNITS BY
MAJOR PARTNER
15.3%
20.2%
19.9%
11.5%
13.6%
19.5%
AMEX
CIBC
TD
Air
Canada
Other CIBC
Sainsbury’s
Air Canada
Other
Q2 2014
$491.1M
Q2 2015
$458.3M
Sainsbury’s
AMEX TD
28
14.3%
19.4%
18.2% 12.1%
12.9%
23.1%
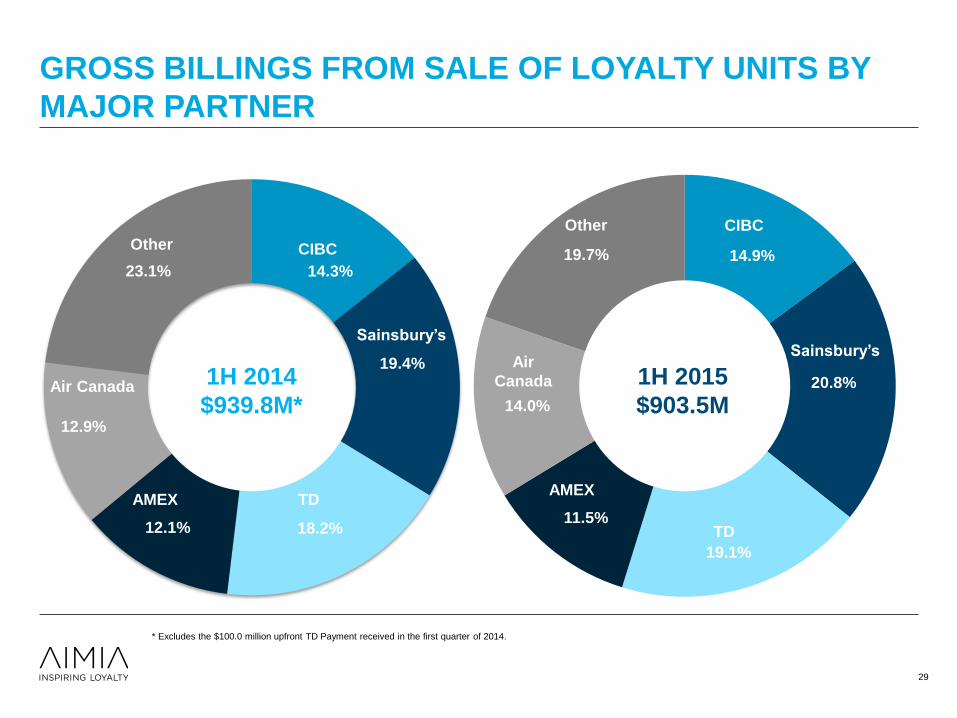
GROSS BILLINGS FROM SALE OF LOYALTY UNITS BY
MAJOR PARTNER
14.9%
20.8%
19.1%
11.5%
14.0%
19.7%
AMEX
CIBC
TD
Air
Canada
Other
CIBC
Sainsbury’s
Air Canada
Other
1H 2014
$939.8M*
1H 2015
$903.5M
Sainsbury’s
AMEX TD
29
* Excludes the $100.0 million upfront TD Payment received in the first quarter of 2014.
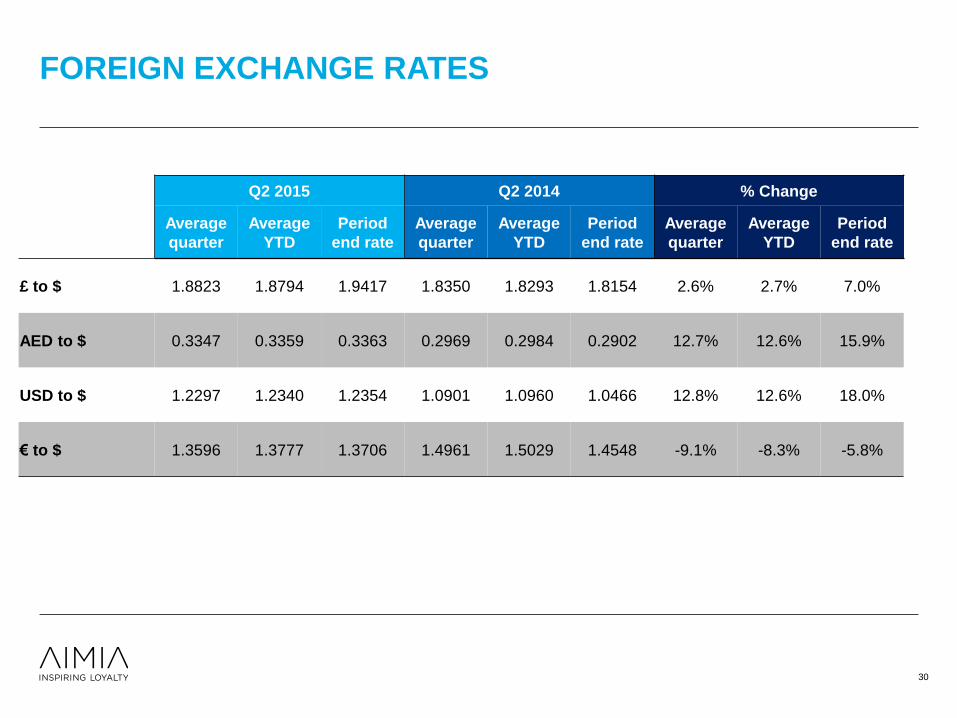
FOREIGN EXCHANGE RATES
30
Q2 2015 Q2 2014 % Change
Average
quarter
Average
YTD
Period
end rate
Average
quarter
Average
YTD
Period
end rate
Average
quarter
Average
YTD
Period
end rate
£ to $ 1.8823 1.8794 1.9417 1.8350 1.8293 1.8154 2.6% 2.7% 7.0%
AED to $ 0.3347 0.3359 0.3363 0.2969 0.2984 0.2902 12.7% 12.6% 15.9%
USD to $ 1.2297 1.2340 1.2354 1.0901 1.0960 1.0466 12.8% 12.6% 18.0%
€ to $ 1.3596 1.3777 1.3706 1.4961 1.5029 1.4548 -9.1% -8.3% -5.8%