Embed Size (px)
Citation preview
Business and entrepreneurship data sources for LEP benchmarking
Prof Stephen Roper

ERC – the background
• Established Jan 2013 with a mission to deepen our understanding of ‘what drives SME productivity and growth’.
• Project value is £5.9m (FEC) over five years from consortium of 7 private and public funders (ESRC, BIS, Innovate UK, 4 major Banks via BBA (2013-15) and the British Business Bank (2015-18).
• Research is strongly policy/practice focussed. Impact and engagement agenda is paramount
• ERC is a UK Hub for SME Research with a strong team of world class researchers drawn from 6 University business schools (Warwick, Aston, Imperial, Birmingham, Queen’s Belfast and Strathclyde)
• ERC operates as a ‘virtual centre’ with researchers concentrated in Aston and Warwick and a ‘flying faculty’ model .
2
Introduction
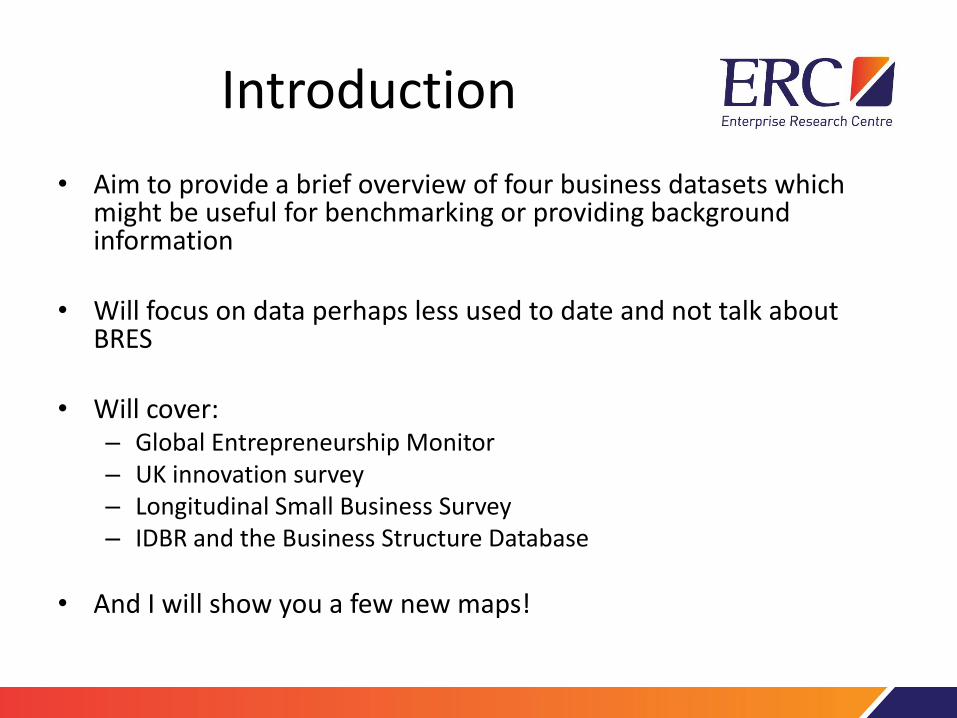
• Aim to provide a brief overview of four business datasets which might be useful for benchmarking or providing background information
• Will focus on data perhaps less used to date and not talk about BRES
• Will cover:– Global Entrepreneurship Monitor– UK innovation survey – Longitudinal Small Business Survey – IDBR and the Business Structure Database
• And I will show you a few new maps!
Global Entrepreneurship Monitor (GEM)
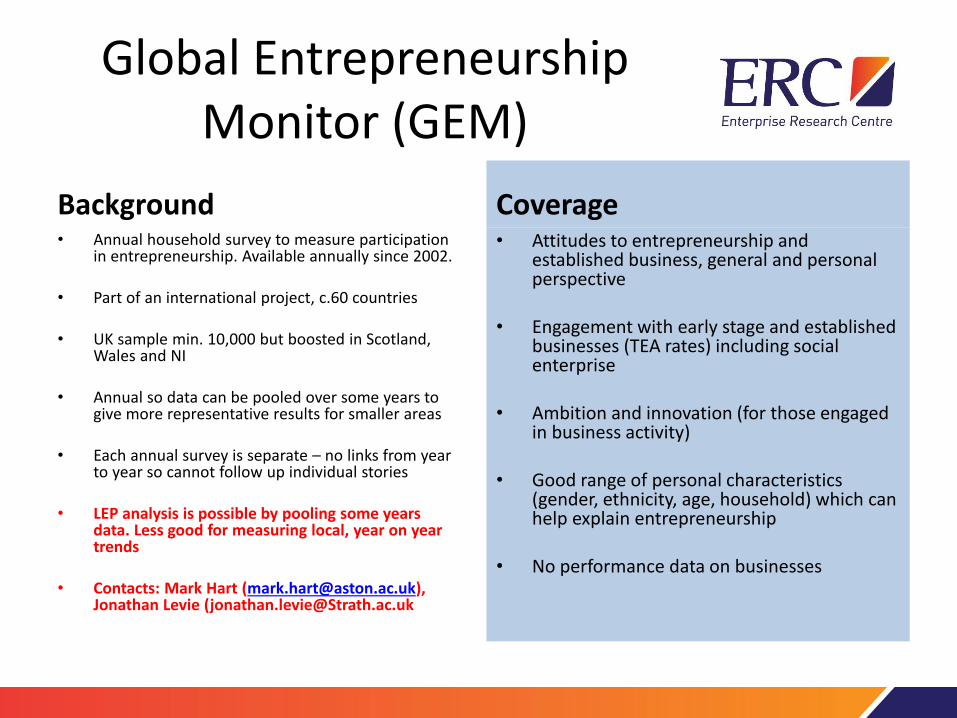
Background • Annual household survey to measure participation
in entrepreneurship. Available annually since 2002.
• Part of an international project, c.60 countries
• UK sample min. 10,000 but boosted in Scotland, Wales and NI
• Annual so data can be pooled over some years to give more representative results for smaller areas
• Each annual survey is separate – no links from year to year so cannot follow up individual stories
• LEP analysis is possible by pooling some years data. Less good for measuring local, year on year trends
• Contacts: Mark Hart ([email protected]), Jonathan Levie ([email protected]
Coverage • Attitudes to entrepreneurship and
established business, general and personal perspective
• Engagement with early stage and established businesses (TEA rates) including social enterprise
• Ambition and innovation (for those engaged in business activity)
• Good range of personal characteristics (gender, ethnicity, age, household) which can help explain entrepreneurship
• No performance data on businesses
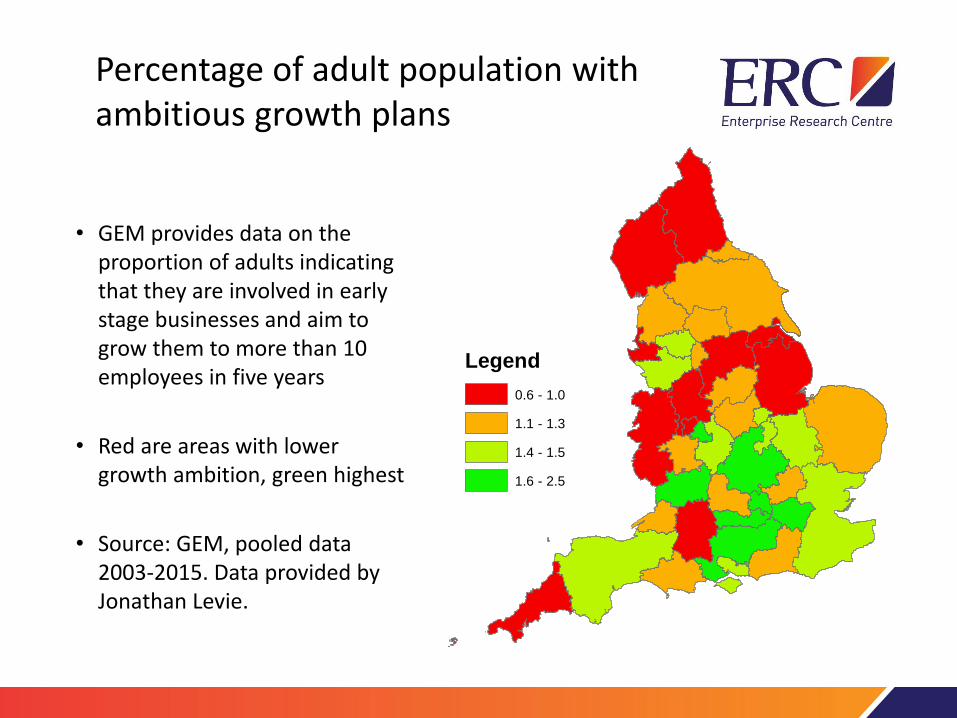
Percentage of adult population with ambitious growth plans
Legend
0.6 - 1.0
1.1 - 1.3
1.4 - 1.5
1.6 - 2.5
• GEM provides data on the proportion of adults indicating that they are involved in early stage businesses and aim to grow them to more than 10 employees in five years
• Red are areas with lower growth ambition, green highest
• Source: GEM, pooled data 2003-2015. Data provided by Jonathan Levie.
UK Innovation Survey (UKIS)
Background • Company based survey of innovation, R&D with
some performance data
• Conducted every 2 years with a 3 year reference period – e.g. innovation over the last three years. Part of EU survey. Available since 2002
• Sample structured by region, industry and sizeband and weighted, 10 plus employees
• Around 14,000 observations in each wave.
• Some overlap between surveys (c. 1000) provides longitudinal data
• LEP level analysis is possible but requires new weighting structure and for smaller LEPs coverage may be limited
• Contact: Hooker Hulya ([email protected])
Coverage • R&D and other investments in
innovation e.g. design, IT, training
• Intellectual property protection, e.g. patents trademarks
• Innovation – products, services, organisation, new to the firm and new to the market.
• Cooperation and barriers
• Performance – turnover, employment and exports
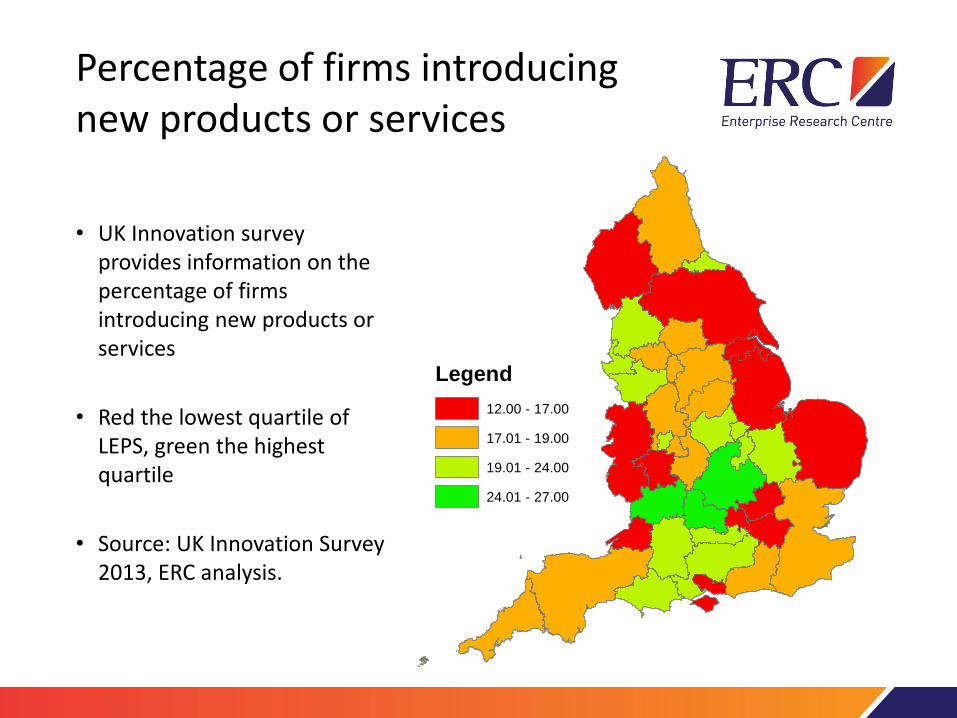
Percentage of firms introducing new products or services
Legend
12.00 - 17.00
17.01 - 19.00
19.01 - 24.00
24.01 - 27.00
• UK Innovation survey provides information on the percentage of firms introducing new products or services
• Red the lowest quartile of LEPS, green the highest quartile
• Source: UK Innovation Survey 2013, ERC analysis.
Longitudinal Small Business Survey (LSBS)
Background • New survey (2015) of small businesses (and self-
employed) across the UK
• Central focus of survey is growth and performance but has become more general survey hence coverage
• Telephone survey structured by region, industry and sizeband
• In tradition of BIS Small Business Surveys but much larger (c14000 respondents) and aim to build longitudinal data (2016). A unique feature in this space.
• LEP analysis is feasible but need to be careful as sample sizes are relatively small for some LEPs.
• Contact: Ian Drummond ([email protected])
Coverage • Background to the
entrepreneur or leadership team
• Characteristics of the business and its markets
• Finance (detailed), innovation, barriers, pensions, ambition, exporting behaviour
• Performance data: employment and turnover growth (no GVA)
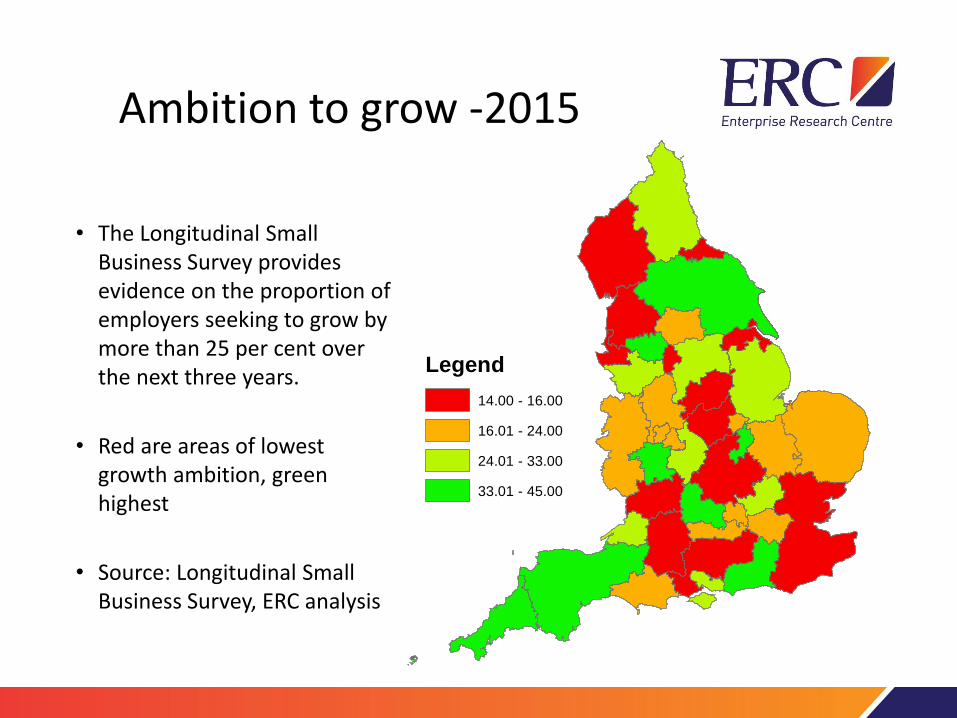
Ambition to grow -2015
Legend
14.00 - 16.00
16.01 - 24.00
24.01 - 33.00
33.01 - 45.00
• The Longitudinal Small Business Survey provides evidence on the proportion of employers seeking to grow by more than 25 per cent over the next three years.
• Red are areas of lowest growth ambition, green highest
• Source: Longitudinal Small Business Survey, ERC analysis
IBDR and the Business Structure Database (BSD)
Background • IDBR (Inter-departmental Business Register)
includes all firms with PAYE or VAT registered
• Updated from surveys and using data provided by HMRC
• Covers all UK firms including single employee businesses but data coverage is very limited
• BSD links firms to provide longitudinal data to monitor firm growth and survival. Available since 1998
• LEP analysis by sector sizeband is possible as covers all firms. Anonymous survey, however, with no personal details for firms or leadership. Some disclosure rules for small samples.
• Contact (BSD): Karen Bonner ([email protected])
Coverage • Firm sector and location,
ownership flag (UK or external)
• Employment and turnover (no GVA data) and lags may be evident in the data recorded
• BSD used to calculate growth from year to year
• Survival flags and can identify births
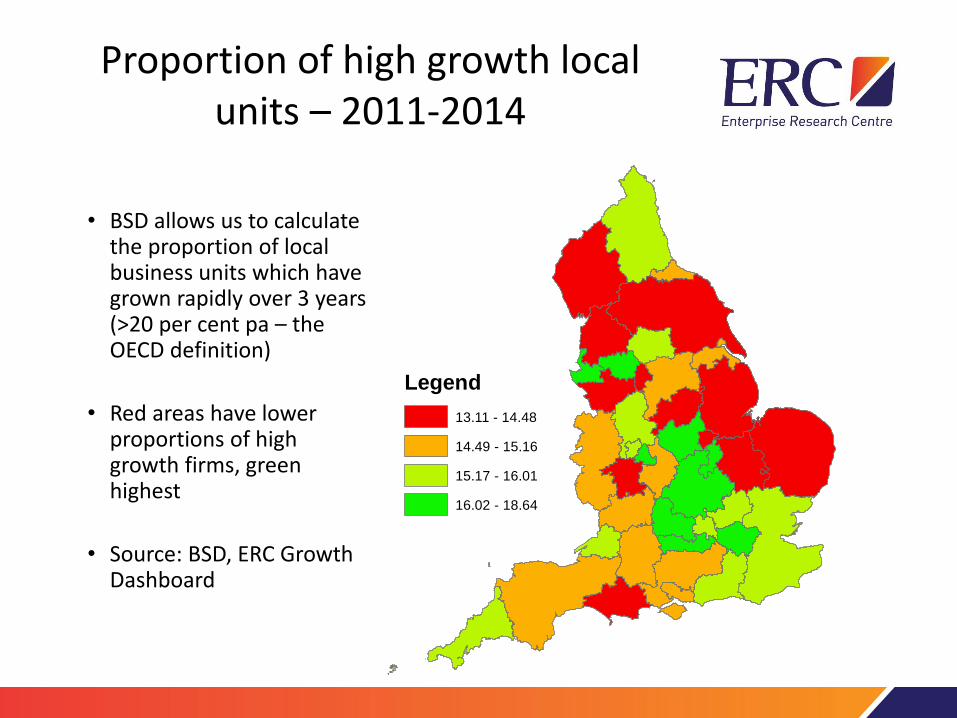
Proportion of high growth local units – 2011-2014
Legend
13.11 - 14.48
14.49 - 15.16
15.17 - 16.01
16.02 - 18.64
• BSD allows us to calculate the proportion of local business units which have grown rapidly over 3 years (>20 per cent pa – the OECD definition)
• Red areas have lower proportions of high growth firms, green highest
• Source: BSD, ERC Growth Dashboard

Contact us:
• If you would like any more information about the ERC and any of its activities please contact us: Stephen Roper ([email protected]), Mark Hart ([email protected]) or Vicki Belt ([email protected]).
More details about the activities of the ERC and our latest events can be found at:
www.enterpriseresearch.ac.uk