Embed Size (px)
Citation preview
THESPROUTSOCIAL INDEX
ENGAGEMENT &
CUSTOMER CARE
DECEMBER 2013
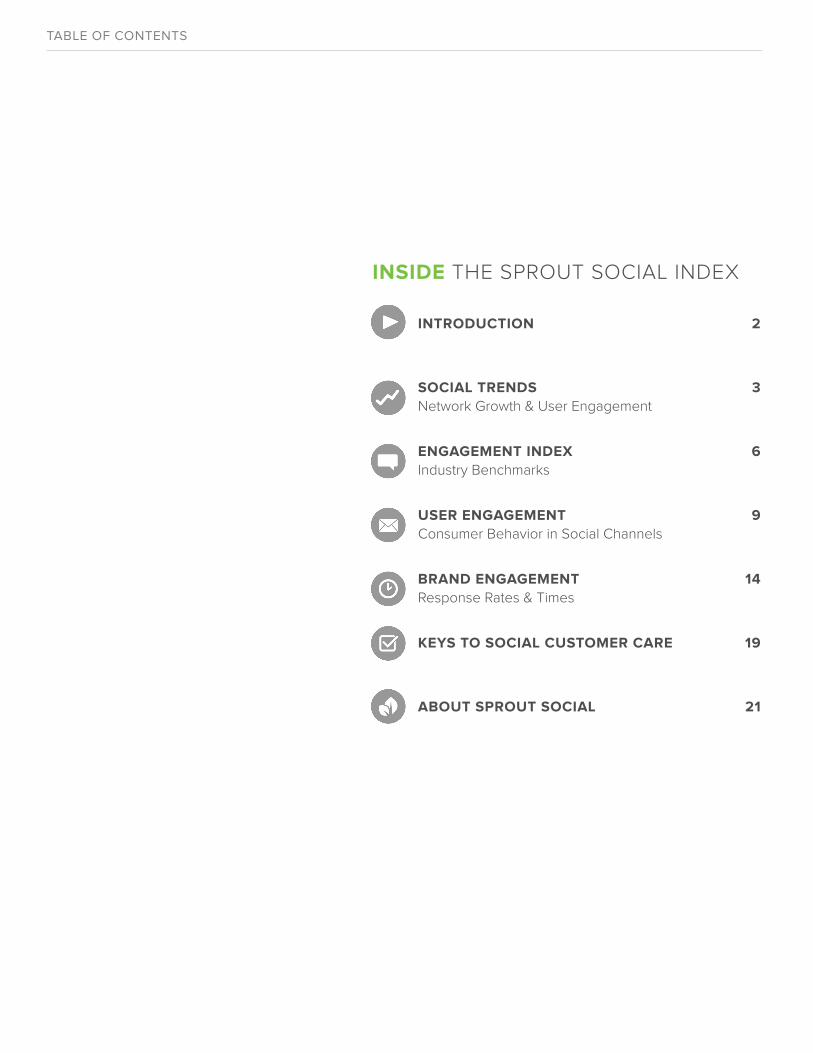
TABLE OF CONTENTS
INSIDE THE SPROUT SOCIAL INDEX
INTRODUCTION 2
SOCIAL TRENDS 3
Network Growth & User Engagement
ENGAGEMENT INDEX 6
Industry Benchmarks
USER ENGAGEMENT 9
Consumer Behavior in Social Channels
BRAND ENGAGEMENT 14
Response Rates & Times
KEYS TO SOCIAL CUSTOMER CARE 19
ABOUT SPROUT SOCIAL 21
SOCIAL TRENDS
Highlights the dramatic surge in inbound
messages to brands.
INDUSTRY ANALYSIS
Social data across 15 di�erent industries.
ENGAGEMENT STATISTICS
Variations in user & brand interactions across
Facebook & Twitter.
THE SPROUT SOCIAL INDEX
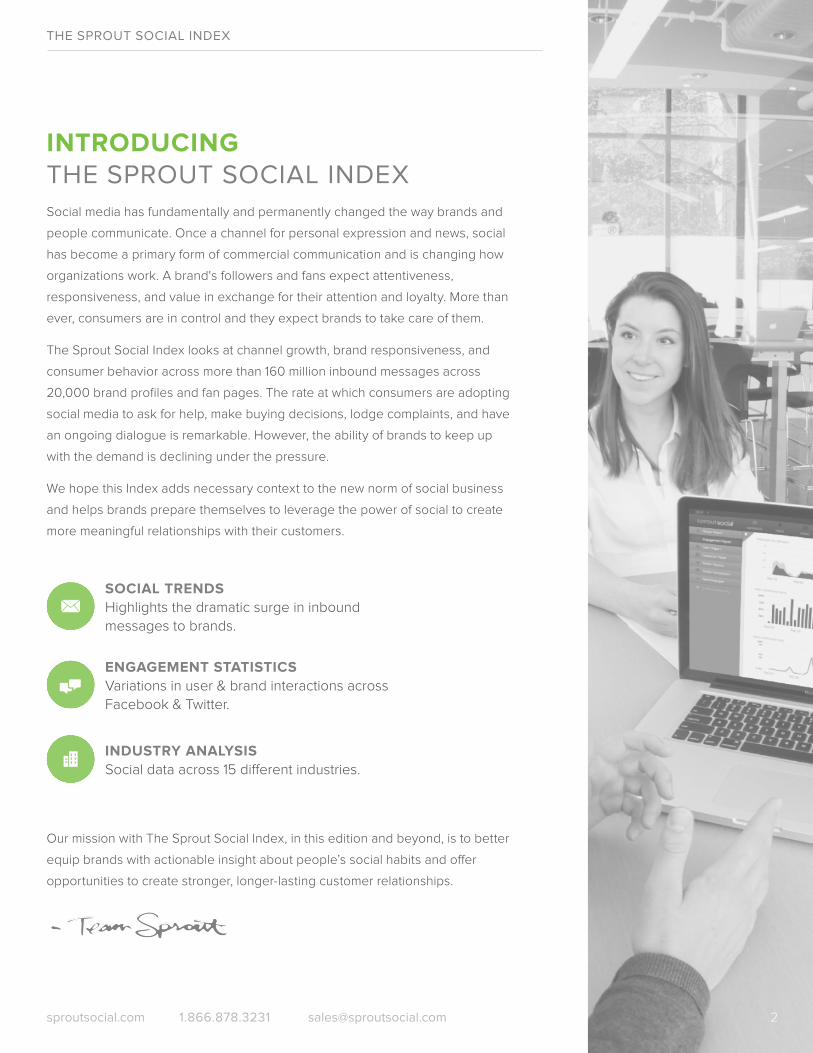
INTRODUCINGTHE SPROUT SOCIAL INDEXSocial media has fundamentally and permanently changed the way brands and
people communicate. Once a channel for personal expression and news, social
has become a primary form of commercial communication and is changing how
organizations work. A brand's followers and fans expect attentiveness,
responsiveness, and value in exchange for their attention and loyalty. More than
ever, consumers are in control and they expect brands to take care of them.
The Sprout Social Index looks at channel growth, brand responsiveness, and
consumer behavior across more than 160 million inbound messages across
20,000 brand profiles and fan pages. The rate at which consumers are adopting
social media to ask for help, make buying decisions, lodge complaints, and have
an ongoing dialogue is remarkable. However, the ability of brands to keep up
with the demand is declining under the pressure.
We hope this Index adds necessary context to the new norm of social business
and helps brands prepare themselves to leverage the power of social to create
more meaningful relationships with their customers.
Our mission with The Sprout Social Index, in this edition and beyond, is to better
equip brands with actionable insight about people’s social habits and o�er
opportunities to create stronger, longer-lasting customer relationships.
2sproutsocial.com 1.866.878.3231 [email protected]
SOCIAL TRENDSNETWORK GROWTH & USER ENGAGEMENT
Increasingly, people turn to social for much more than
catching up with friends and posting status updates.
They interact with brands for customer service, sales
inquiries, compliments, complaints, and other purposeful
reasons. Prior to social, these communications were
handled primarily through telephone and email or, in
many instances, didn’t happen at all. The pace of growth
in social engagement continues to o�er significant
possibilities for the brands willing to embrace this
opportunity and satisfy customer needs on such a
pervasive channel.
3
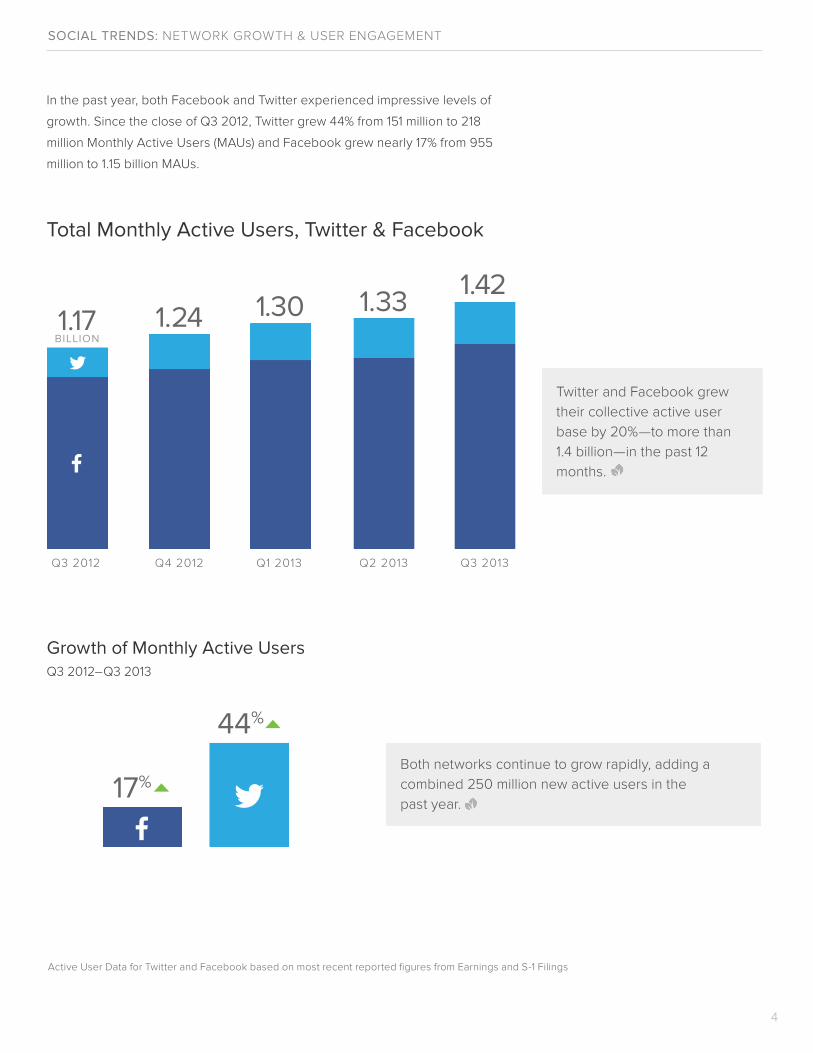
In the past year, both Facebook and Twitter experienced impressive levels of
growth. Since the close of Q3 2012, Twitter grew 44% from 151 million to 218
million Monthly Active Users (MAUs) and Facebook grew nearly 17% from 955
million to 1.15 billion MAUs.
SOCIAL TRENDS: NETWORK GROWTH & USER ENGAGEMENT
Total Monthly Active Users, Twitter & Facebook
Growth of Monthly Active Users
Active User Data for Twitter and Facebook based on most recent reported figures from Earnings and S-1 Filings
17%
44%
4
Q3 2012 Q4 2012 Q1 2013 Q2 2013 Q3 2013
1.17BILLION
1.24 1.30 1.33 1.42
Q3 2012–Q3 2013
Both networks continue to grow rapidly, adding a
combined 250 million new active users in the
past year.
Twitter and Facebook grew
their collective active user
base by 20%—to more than
1.4 billion—in the past 12
months.
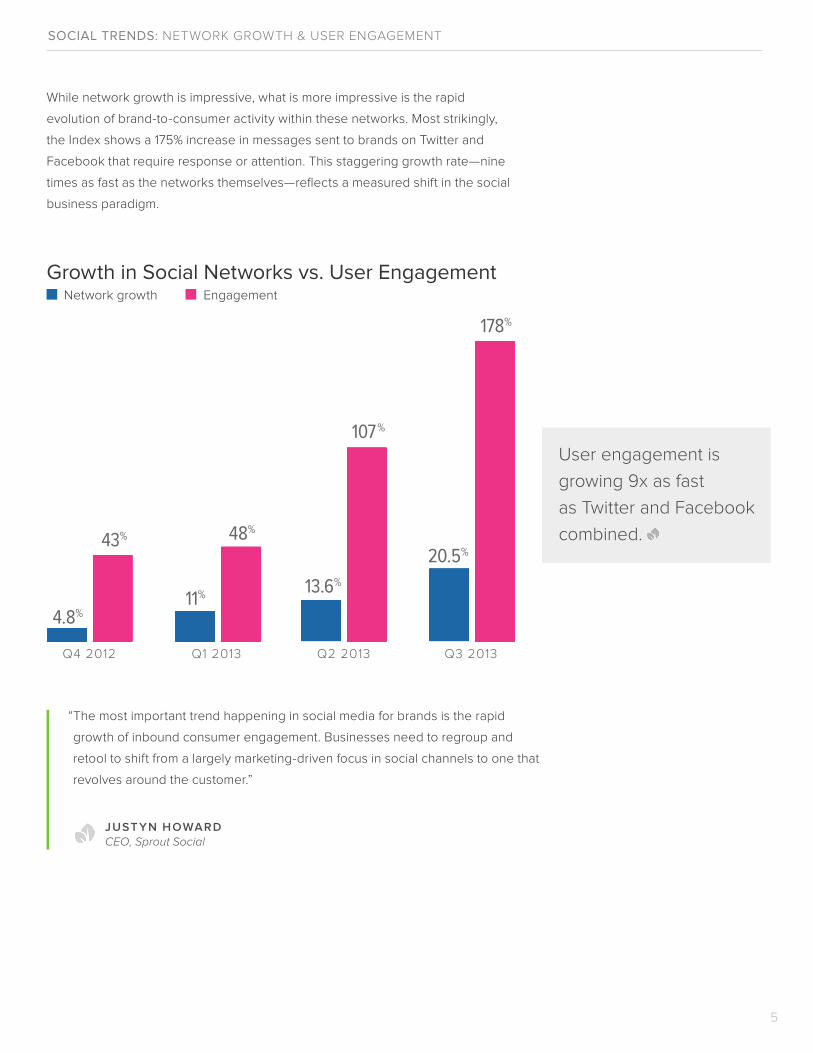
Growth in Social Networks vs. User EngagementNetwork growth Engagement
While network growth is impressive, what is more impressive is the rapid
evolution of brand-to-consumer activity within these networks. Most strikingly,
the Index shows a 175% increase in messages sent to brands on Twitter and
Facebook that require response or attention. This staggering growth rate—nine
times as fast as the networks themselves—reflects a measured shift in the social
business paradigm.
SOCIAL TRENDS: NETWORK GROWTH & USER ENGAGEMENT
5
Q1 2013Q4 2012 Q2 2013 Q3 2013
11%
4.8%
48%
13.6%
20.5%
107%
178%
43%
“The most important trend happening in social media for brands is the rapid
growth of inbound consumer engagement. Businesses need to regroup and
retool to shift from a largely marketing-driven focus in social channels to one that
revolves around the customer.”
JUST YN HOWARDCEO, Sprout Social
User engagement is
growing 9x as fast
as Twitter and Facebook
combined.
ENGAGEMENT INDEXINDUSTRY BENCHMARKS
To shed light on the shifting relationships and growing
interactions between brands and social networkers and to
provide an ongoing benchmark, in this report we’ve
created two key indices for social customer care.
First, our Consumer Engagement Index outlines the
industries that are currently receiving the most inbound
messages requiring attention. Second, the Brand
Engagement Index summarizes industries which are the
most timely and responsive to those messages.
6
ENGAGEMENT INDEX: INDUSTRY BENCHMARKS
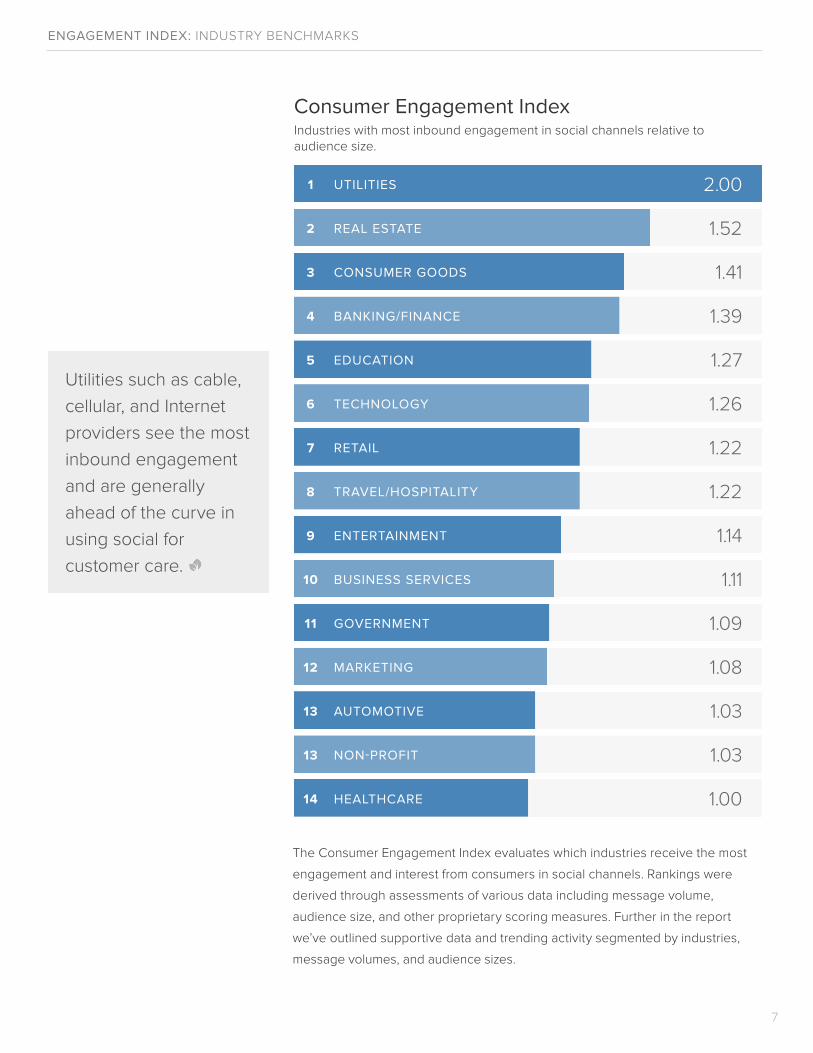
The Consumer Engagement Index evaluates which industries receive the most
engagement and interest from consumers in social channels. Rankings were
derived through assessments of various data including message volume,
audience size, and other proprietary scoring measures. Further in the report
we’ve outlined supportive data and trending activity segmented by industries,
message volumes, and audience sizes.
UTILITIES
REAL ESTATE
CONSUMER GOODS
BANKING/FINANCE
EDUCATION
TECHNOLOGY
RETAIL
TRAVEL/HOSPITALITY
ENTERTAINMENT
BUSINESS SERVICES
GOVERNMENT
MARKETING
AUTOMOTIVE
NON-PROFIT
HEALTHCARE
1
2
3
4
5
6
7
8
9
10
11
12
13
13
14
2.00
1.52
1.41
1.39
1.27
1.26
1.22
1.22
1.14
1.11
1.09
1.08
1.03
1.03
1.00
7
Consumer Engagement IndexIndustries with most inbound engagement in social channels relative toaudience size.
Utilities such as cable,
cellular, and Internet
providers see the most
inbound engagement
and are generally
ahead of the curve in
using social for
customer care.
ENGAGEMENT INDEX: INDUSTRY BENCHMARKS
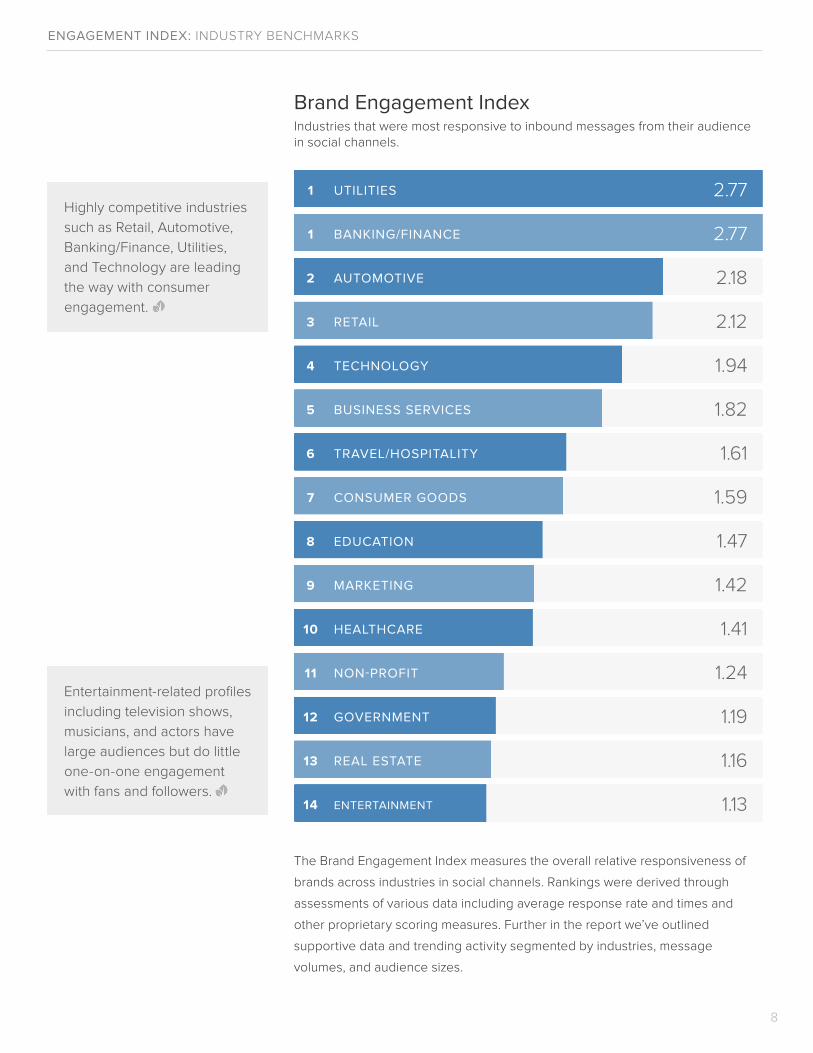
Brand Engagement IndexIndustries that were most responsive to inbound messages from their audiencein social channels.
UTILITIES
BANKING/FINANCE
AUTOMOTIVE
RETAIL
TECHNOLOGY
BUSINESS SERVICES
TRAVEL/HOSPITALITY
CONSUMER GOODS
EDUCATION
MARKETING
HEALTHCARE
NON-PROFIT
GOVERNMENT
REAL ESTATE
ENTERTAINMENT
2.77
2.77
2.18
2.12
1.94
1.82
1.61
1.59
1.47
1.42
1.41
1.24
1.19
1.16
1.13
1
1
2
3
4
5
6
7
8
9
10
11
12
13
14
8
The Brand Engagement Index measures the overall relative responsiveness of
brands across industries in social channels. Rankings were derived through
assessments of various data including average response rate and times and
other proprietary scoring measures. Further in the report we’ve outlined
supportive data and trending activity segmented by industries, message
volumes, and audience sizes.
Highly competitive industries
such as Retail, Automotive,
Banking/Finance, Utilities,
and Technology are leading
the way with consumer
engagement.
Entertainment-related profiles
including television shows,
musicians, and actors have
large audiences but do little
one-on-one engagement
with fans and followers.
USER ENGAGEMENTCONSUMER BEHAVIOR IN SOCIAL CHANNELS
Like no other medium before it, social provides open
communication and fair value exchange between brands
and individuals. The one-on-one relationship that social
media facilitates—whether publicly, privately, only once, or
every day—provides an inherent ability for brands to
engage directly with their customers. Brands big or small
realize that every conversation has the potential to impact
brand reputation, customer loyalty, and sales.
9
ENTERTAINMENT
UTILITIES
TRAVEL/HOSPITALITY
NON-PROFIT
RETAIL
TECHNOLOGY
GOVERNMENT
HEALTHCARE
BUSINESS SERVICES
MARKETING
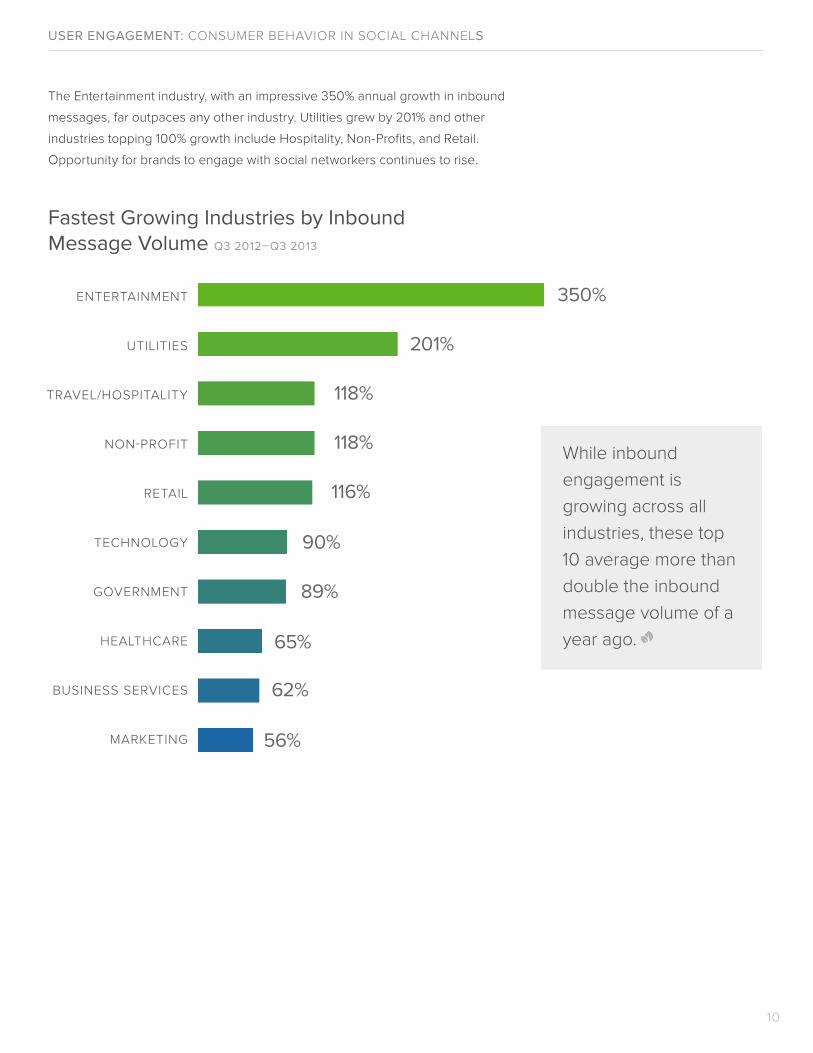
The Entertainment industry, with an impressive 350% annual growth in inbound
messages, far outpaces any other industry. Utilities grew by 201% and other
industries topping 100% growth include Hospitality, Non-Profits, and Retail.
Opportunity for brands to engage with social networkers continues to rise.
Fastest Growing Industries by InboundMessage Volume Q3 2012–Q3 2013
USER ENGAGEMENT: CONSUMER BEHAVIOR IN SOCIAL CHANNELS
10
350%
201%
118%
118%
116%
90%
89%
65%
62%
56%
While inbound
engagement is
growing across all
industries, these top
10 average more than
double the inbound
message volume of a
year ago.
USER ENGAGEMENT: CONSUMER BEHAVIOR IN SOCIAL CHANNELS
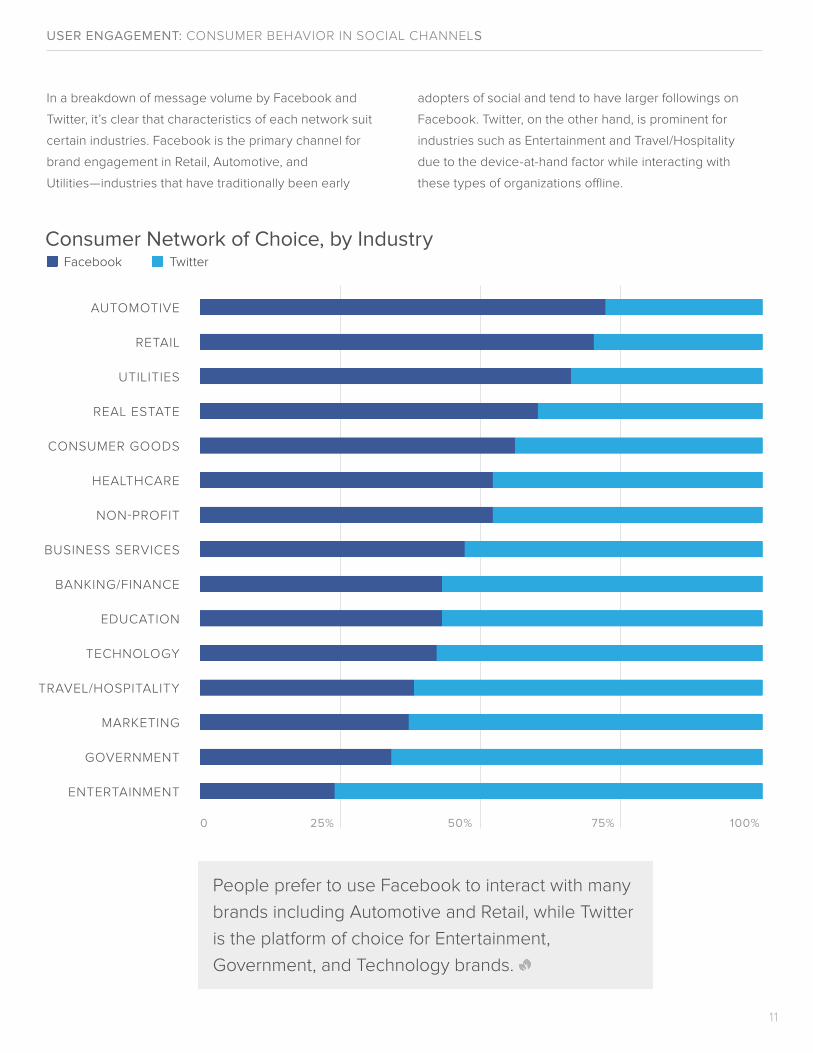
In a breakdown of message volume by Facebook and
Twitter, it’s clear that characteristics of each network suit
certain industries. Facebook is the primary channel for
brand engagement in Retail, Automotive, and
Utilities—industries that have traditionally been early
11
Consumer Network of Choice, by Industry
AUTOMOTIVE
RETAIL
UTILITIES
REAL ESTATE
CONSUMER GOODS
HEALTHCARE
NON-PROFIT
BUSINESS SERVICES
BANKING/FINANCE
EDUCATION
TECHNOLOGY
TRAVEL/HOSPITALITY
MARKETING
GOVERNMENT
ENTERTAINMENT
25%0 50% 75% 100%
Facebook Twitter
People prefer to use Facebook to interact with many
brands including Automotive and Retail, while Twitter
is the platform of choice for Entertainment,
Government, and Technology brands.
adopters of social and tend to have larger followings on
Facebook. Twitter, on the other hand, is prominent for
industries such as Entertainment and Travel/Hospitality
due to the device-at-hand factor while interacting with
these types of organizations o�ine.
USER ENGAGEMENT: CONSUMER BEHAVIOR IN SOCIAL CHANNELS
Aside from strong growth for Entertainment and Utilities as mentioned,
industries traditionally ingrained in one network versus the other are starting to
level out. For instance, Twitter has always been popular with Technology
companies, but Facebook is catching up in that industry. Similarly, Utility and
Automotive companies who saw early success on Facebook are increasingly
engaging with their audience on Twitter as social customer care becomes a
primary objective.
12
Fastest Growing Industries by NetworkQ3 2012–Q3 2013
ENTERTAINMENT
UTILITIES
BUSINESS SERVICES
EDUCATION
TRAVEL/HOSPITALITY
498%
273%
128%
125%
97%
ENTERTAINMENT
UTILITIES
NON-PROFIT
TRAVEL/HOSPITALITY
RETAIL
196%
170%
154%
134%
129%
• Entertainment draws big
crowds and audience
outreach is growing
significantly, especially
on Twitter.
• Utilities, like cable and
telecom companies,
increasingly rely on Twitter
for customer care and are
shifting resources that
direction.
131
122
112
106
102
101
100
97
97
95
94
91
90
76
67
USER ENGAGEMENT: CONSUMER BEHAVIOR IN SOCIAL CHANNELS
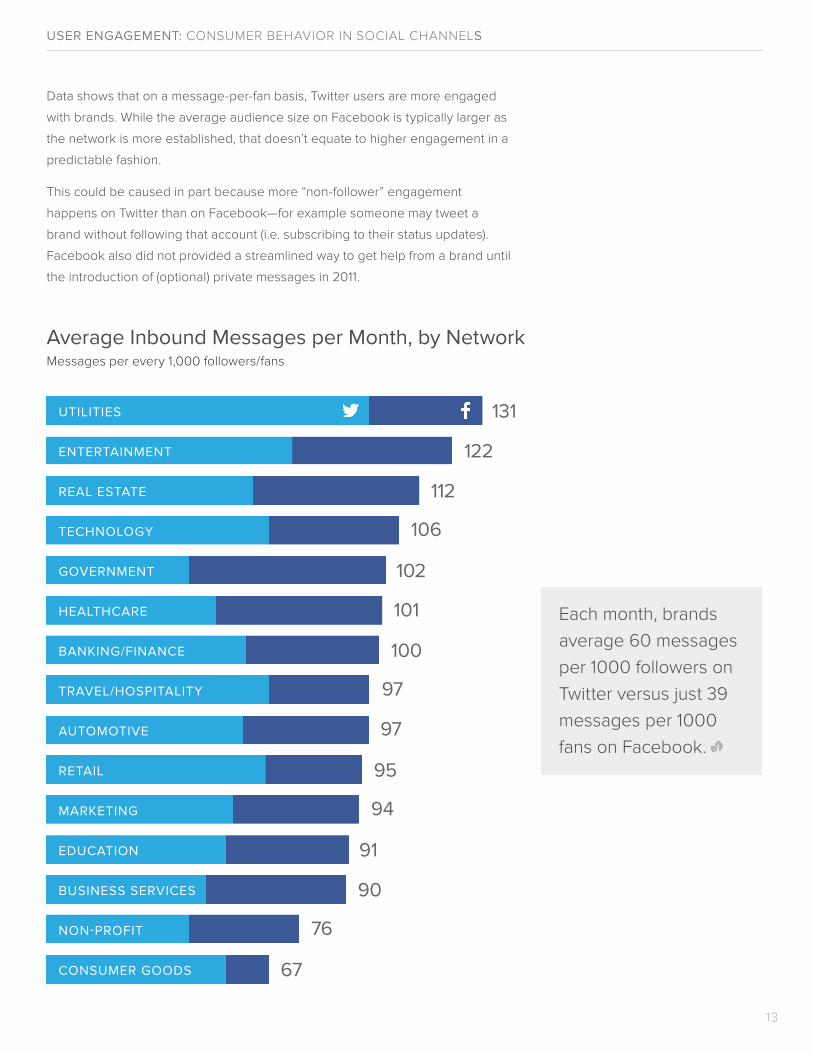
Data shows that on a message-per-fan basis, Twitter users are more engaged
with brands. While the average audience size on Facebook is typically larger as
the network is more established, that doesn’t equate to higher engagement in a
predictable fashion.
This could be caused in part because more “non-follower” engagement
happens on Twitter than on Facebook—for example someone may tweet a
brand without following that account (i.e. subscribing to their status updates).
Facebook also did not provided a streamlined way to get help from a brand until
the introduction of (optional) private messages in 2011.
UTILITIES
ENTERTAINMENT
REAL ESTATE
TECHNOLOGY
GOVERNMENT
HEALTHCARE
BANKING/FINANCE
TRAVEL/HOSPITALITY
AUTOMOTIVE
RETAIL
MARKETING
EDUCATION
BUSINESS SERVICES
NON-PROFIT
CONSUMER GOODS
Average Inbound Messages per Month, by NetworkMessages per every 1,000 followers/fans
13
Each month, brands
average 60 messages
per 1000 followers on
Twitter versus just 39
messages per 1000
fans on Facebook.
BRAND ENGAGEMENTRESPONSE RATES & TIMES
As the demand for brand responsiveness rises, industries
that delight customers with attentive behavior reap
rewards, while failure to meet expectations is wasted
opportunity. Thankfully, industries are building and
bracing for greater social involvement. Econsultancy
reported that in 2013, 62% of companies would increase
investment in social media and 38% would increase
investment in social media management systems.
Businesses need to consider increased investments in
social as a customer care channel as well as retool parts
of their organization to accommodate the shift from
traditional communication channels in order to meet
customer expectations.
14
Average Response Time, Across All Industries
BRAND ENGAGEMENT: RESPONSE RATES & TIMES
Q3 2012 Q4 2012 Q1 2013 Q2 2013 Q3 2013
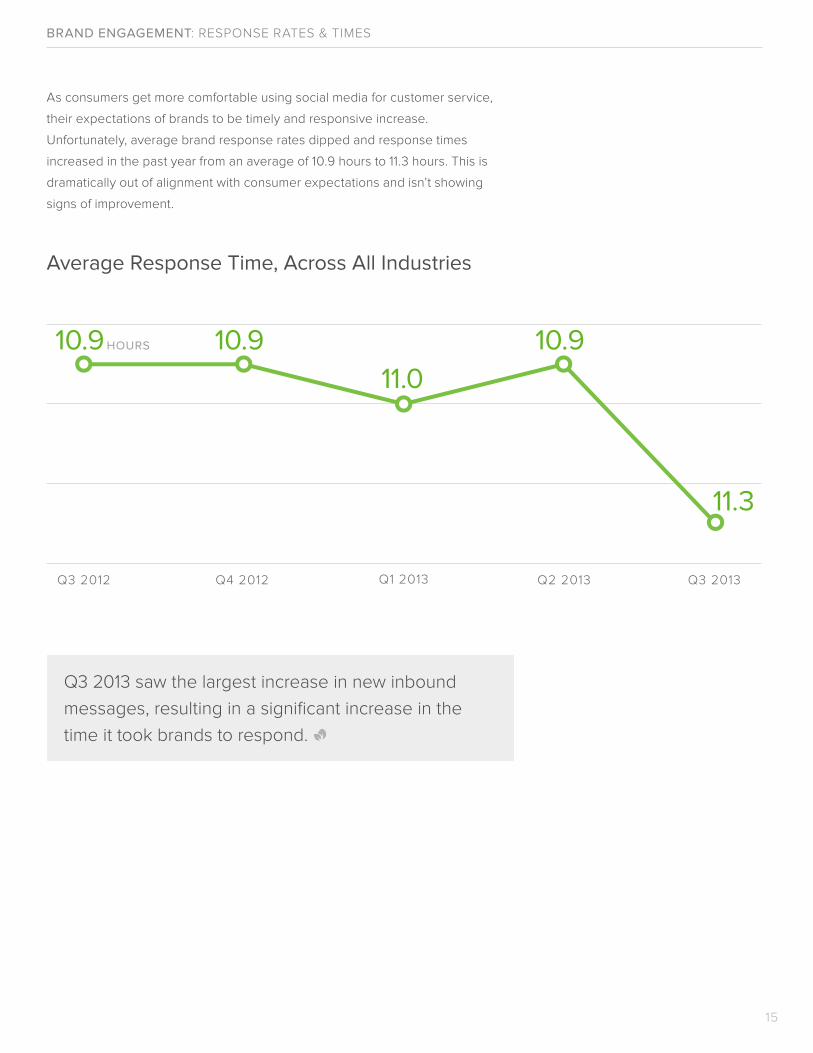
As consumers get more comfortable using social media for customer service,
their expectations of brands to be timely and responsive increase.
Unfortunately, average brand response rates dipped and response times
increased in the past year from an average of 10.9 hours to 11.3 hours. This is
dramatically out of alignment with consumer expectations and isn’t showing
signs of improvement.
15
10.9 HOURS 10.9 10.9
11.3
11.0
Q3 2013 saw the largest increase in new inbound
messages, resulting in a significant increase in the
time it took brands to respond.
10
10.9
10.9
11.6
11.7
12.3
11.8
12.4
14.5
BRAND ENGAGEMENT: RESPONSE RATES & TIMES
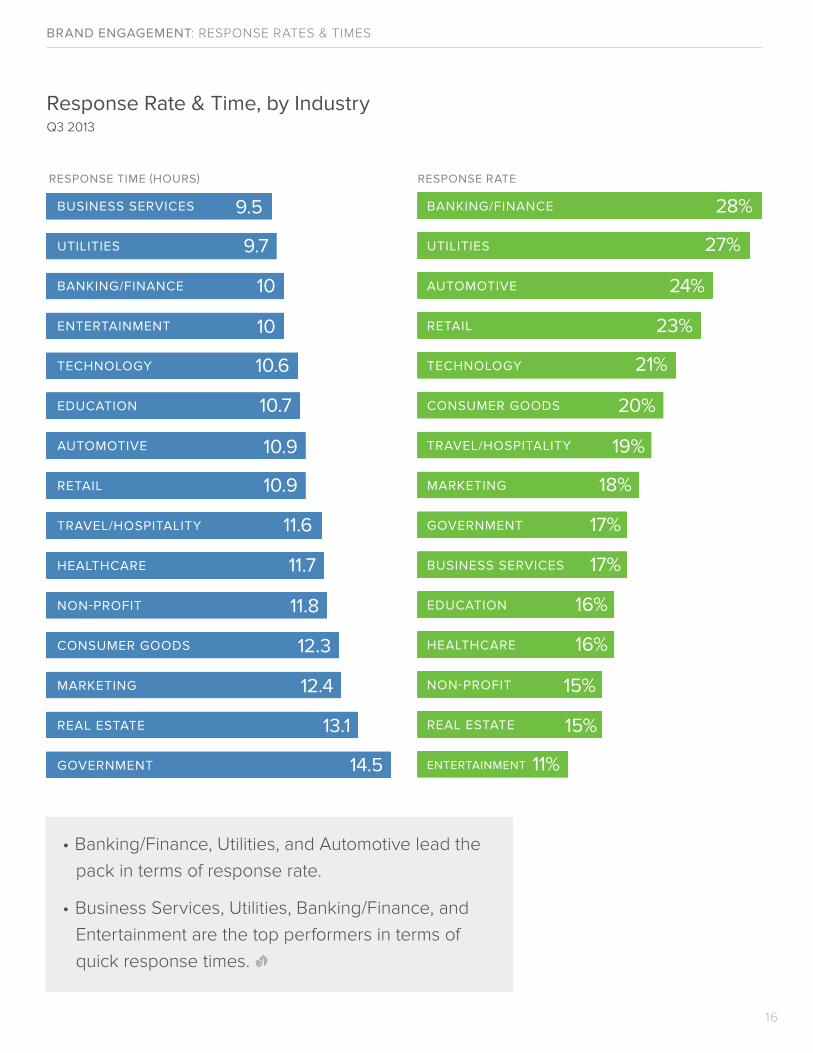
Response Rate & Time, by IndustryQ3 2013
RESPONSE RATE
16
28%
27%
24%
23%
21%
20%
19%
18%
17%
17%
16%
16%
15%
15%
11%
• Banking/Finance, Utilities, and Automotive lead the
pack in terms of response rate.
• Business Services, Utilities, Banking/Finance, and
Entertainment are the top performers in terms of
quick response times.
RESPONSE TIME (HOURS)
9.7
10.6
9.5
10.7
13.1
10
BANKING/FINANCE
UTILITIES
AUTOMOTIVE
RETAIL
TECHNOLOGY
CONSUMER GOODS
TRAVEL/HOSPITALITY
MARKETING
GOVERNMENT
BUSINESS SERVICES
EDUCATION
HEALTHCARE
NON-PROFIT
REAL ESTATE
ENTERTAINMENT
EDUCATION
RETAIL
AUTOMOTIVE
ENTERTAINMENT
TECHNOLOGY
TRAVEL/HOSPITALITY
HEALTHCARE
CONSUMER GOODS
MARKETING
BUSINESS SERVICES
GOVERNMENT
BANKING/FINANCE
REAL ESTATE
NON-PROFIT
UTILITIES
BRAND ENGAGEMENT: RESPONSE RATES & TIMES
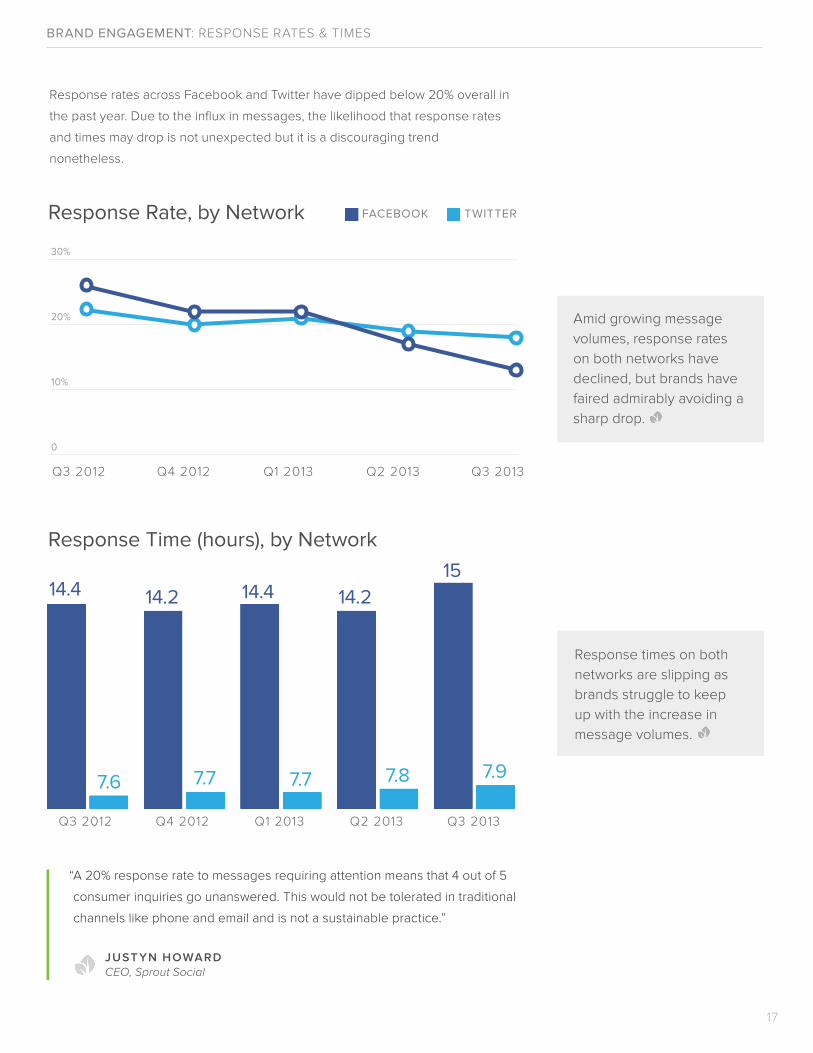
Response rates across Facebook and Twitter have dipped below 20% overall in
the past year. Due to the influx in messages, the likelihood that response rates
and times may drop is not unexpected but it is a discouraging trend
nonetheless.
Response Rate, by Network TWITTERFACEBOOK
Q3 2012 Q4 2012 Q1 2013 Q2 2013 Q3 2013
Q3 2012 Q4 2012 Q1 2013 Q2 2013 Q3 2013
30%
20%
10%
0
Response Time (hours), by Network
17
14.4 14.2 14.4 14.215
7.6 7.7 7.7 7.8 7.9
Amid growing message
volumes, response rates
on both networks have
declined, but brands have
faired admirably avoiding a
sharp drop.
Response times on both
networks are slipping as
brands struggle to keep
up with the increase in
message volumes.
“A 20% response rate to messages requiring attention means that 4 out of 5
consumer inquiries go unanswered. This would not be tolerated in traditional
channels like phone and email and is not a sustainable practice.”
JUST YN HOWARDCEO, Sprout Social
BRAND ENGAGEMENT: RESPONSE RATES & TIMES
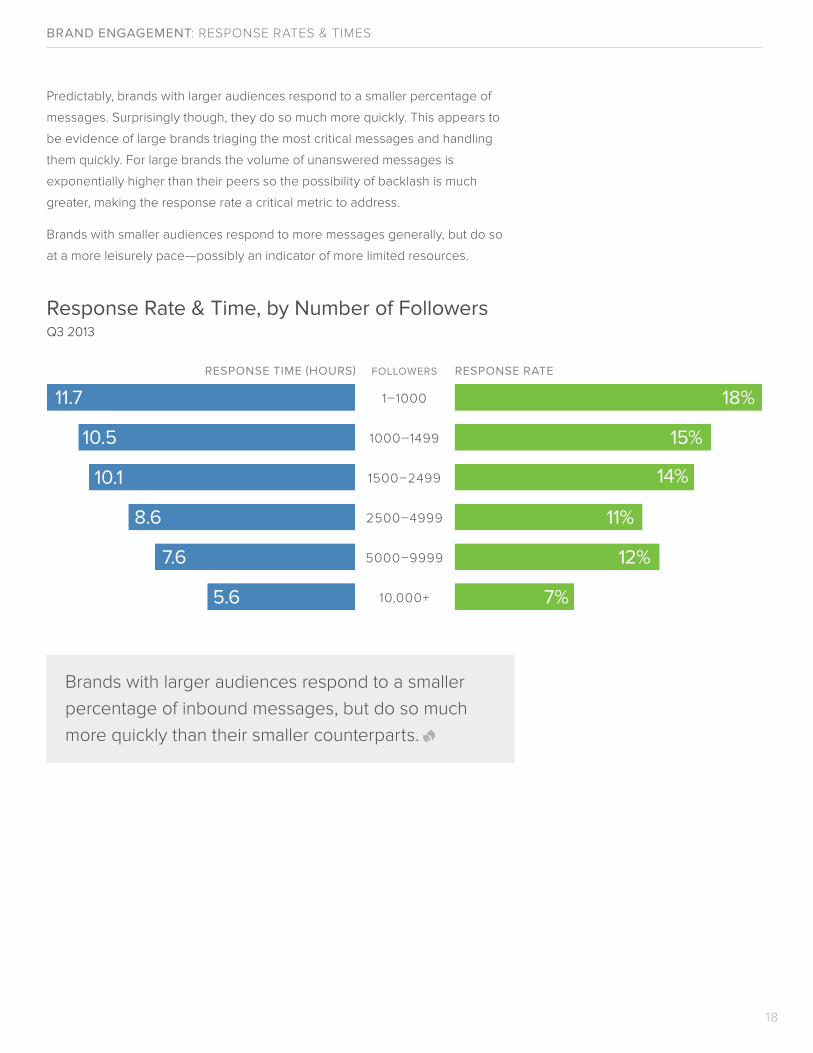
Predictably, brands with larger audiences respond to a smaller percentage of
messages. Surprisingly though, they do so much more quickly. This appears to
be evidence of large brands triaging the most critical messages and handling
them quickly. For large brands the volume of unanswered messages is
exponentially higher than their peers so the possibility of backlash is much
greater, making the response rate a critical metric to address.
Brands with smaller audiences respond to more messages generally, but do so
at a more leisurely pace—possibly an indicator of more limited resources.
18
1–1000
1000–1499
1500–2499
2500–4999
5000–9999
10,000+
RESPONSE TIME (HOURS) FOLLOWERS RESPONSE RATE
18%
15%
14%
11%
12%
7%
11.7
10.5
10.1
8.6
7.6
5.6
Brands with larger audiences respond to a smaller
percentage of inbound messages, but do so much
more quickly than their smaller counterparts.
Response Rate & Time, by Number of FollowersQ3 2013
KEYS TO SOCIALCUSTOMER CARE
What does all this data mean and how can brands use it
to directly and decisively improve social performance?
For brands that want to create authentic, lasting social
relationships it demands a shift in perception and
continued dedication to ongoing customer care. It
requires an unbridled embrace of the fact that social
media must not be just a siloed channel but a fully
integrated communication layer.
In consideration of this concept and the Index findings,
we o�er these strategic recommendations to better your
brand’s social engagement and customer care.
19
KEYS TO SOCIAL CUSTOMER CARE
20
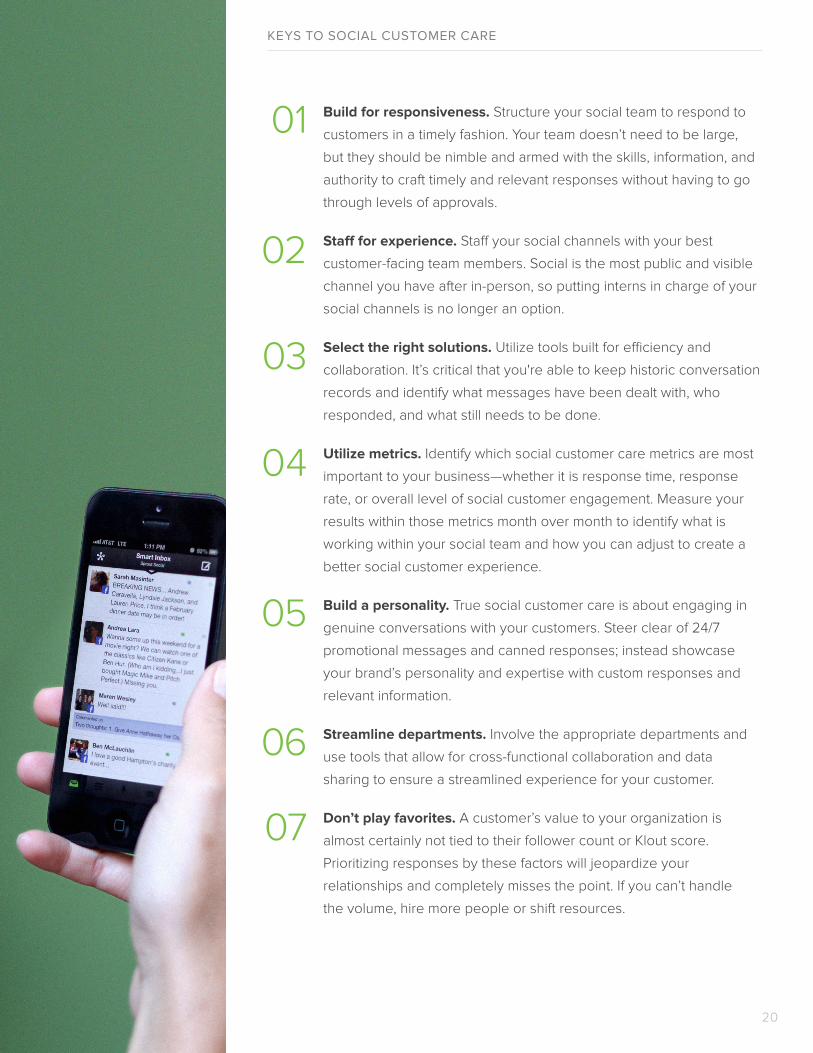
Build for responsiveness. Structure your social team to respond to
customers in a timely fashion. Your team doesn’t need to be large,
but they should be nimble and armed with the skills, information, and
authority to craft timely and relevant responses without having to go
through levels of approvals.
Sta� for experience. Sta� your social channels with your best
customer-facing team members. Social is the most public and visible
channel you have after in-person, so putting interns in charge of your
social channels is no longer an option.
Select the right solutions. Utilize tools built for e�ciency and
collaboration. It’s critical that you're able to keep historic conversation
records and identify what messages have been dealt with, who
responded, and what still needs to be done.
Utilize metrics. Identify which social customer care metrics are most
important to your business—whether it is response time, response
rate, or overall level of social customer engagement. Measure your
results within those metrics month over month to identify what is
working within your social team and how you can adjust to create a
better social customer experience.
Build a personality. True social customer care is about engaging in
genuine conversations with your customers. Steer clear of 24/7
promotional messages and canned responses; instead showcase
your brand’s personality and expertise with custom responses and
relevant information.
Streamline departments. Involve the appropriate departments and
use tools that allow for cross-functional collaboration and data
sharing to ensure a streamlined experience for your customer.
Don’t play favorites. A customer’s value to your organization is
almost certainly not tied to their follower count or Klout score.
Prioritizing responses by these factors will jeopardize your
relationships and completely misses the point. If you can’t handle
the volume, hire more people or shift resources.
01
02
03
04
05
06
07
The Sprout Social Index is a report compiled and released by Sprout Social.
All referenced data is based on nearly 20,000 public social profiles (8,731 Twitter,
10,671 Facebook) of continually active accounts between Q3 2012 and Q3 2013.
More than 160 million messages sent during that time were analyzed for the
purposes of this report.
Industry classifications were based on LinkedIn industry categories. In some cases
closely-related industries were merged into a single overarching industry.
All messages analyzed which were considered casual mentions or not in need of a
response were excluded from engagement, response rate, and response time
calculations with the intention of eliminating “noise”. Analysis of which messages
required attention was done using Sprout’s proprietary technologies. Response
time and response rate calculations were done using Sprout’s Engagement
Reporting technology found in the Sprout Social product and at mustbepresent.com
For questions about the index data, please contact: [email protected]
Sprout Social provides social media engagement, publishing, and analytic tools for
leading brands including AMD, McDonald’s, UPS, and Spotify. A powerful platform for
social business, Sprout enables brands to more e�ectively manage social channels
and provide an exceptional customer experience. Headquartered in Chicago, Sprout
is a Twitter Certified Product, Facebook Preferred Marketing Developer, and Google+
Pages Certified API Partner.
For more information or to start a FREE 30-day trial, visit sproutsocial.com
ABOUT THE DATA
ABOUT SPROUT SOCIAL
21
Sprout Social
PROFILES
@SproutSocial
Sprout Social, Inc.
Mentions
Posts
Direct Messages
New Followers
Sprout
MESSAGE T YPES
BRAND KEY WORDS
Add Brand Keyword
Wall Posts
Comments
ArchiveArchive
Smart Inbox
Sprout seamlessly integrates Response Rate metrics in the Smart Inbox.
sent 17 minutes ago
@SproutSocial I’m really enjoying the new Average Response Time metric!
sent 8 minutes ago
With @SproutSocial I can engage with all of my customers in one place.
sent 20 minutes ago
Excited that Sprout lets me see all of my social feeds in one place.
2 Commented on status “Sprout Social introduces the Smart Inbox”
With Response Rate, I can measure how well my team responds to messages.
Commented on status “Sprout Social introduces Response Rate”
Good bye columns! With Sprout Social you can view all your social feeds in one inbox.
Commented on status “Sprout Social introduces Response Rate”
TASKS DISCOVERYFEEDS PUBLISHING REPORTSMESSAGES