Embed Size (px)
Citation preview

Fast Forward to Growth Seizing opportunities in high-growth markets

1
Foreword 3
Executive summary 5
A wake-up call 9
Locating demand: The search for growth 13
New players, new rules: 26 The new shape of competition
Rethinking capabilities: The roadmap to success 33Sizing the future: Assessing where and when to act 35
Shaping the future: Seeding tomorrow’s growth 43
Seizing the future: Operating at speed and scale 54
Conclusion: Windows to the future 65
Methodology: Income and consumption forecasting 67
References 69
Contents

2
3
ForewordThe search for growth opportunities in emerging economies is no longer a matter of choice; it has become a necessity. With short-term growth difficult to find in developed markets, emerging markets must be considered as more than an optional, longer-term bet.
But making bets on the future, whether short-term or long-term, is an especially difficult challenge amid the persistent uncertainty, complexity and volatility in the global marketplace. In my conversations with clients around the world, I am struck by how today’s business executives often find themselves struggling to prioritize their investments across the diverse set of growth markets in emerging economies. The questions I hear in boardrooms vary widely: Why aren’t we making profits in China yet? Is it too late to enter Brazil? How can we move faster to establish a foothold in Africa? The questions highlight a key factor in strategic growth planning: the importance of getting your timing right.
Planning an effective global growth strategy across time horizons demands significant investments of time, effort and resources to assess market potential accurately and to build the requisite capabilities for success. Putting off such investments, waiting to see how markets evolve, is tempting in today’s economic environment, and it may be the right decision.
But this presents executives with a critical paradox: ongoing global economic change may lead businesses to shy away from action in the very markets that hold the key to faster growth. The longer firms hesitate, the greater the risk of missing out on opportunities, and the more challenging the competitive environment they will face when they eventually take action.
I see two underlying factors at play.
First, regardless of when and how growth returns to developed markets, the future map of global demand will look very different from that of
previous decades. Fundamental shifts in income and demography are reshaping the landscape of global consumption. Predicting where and when the related market opportunities will arise is difficult enough; understanding how to grasp them is even harder.
Second, I see a new constellation of competition being formed out of the market turbulence of recent years. This is due partly to the new economic and political relationships that are being forged, particularly between emerging economies. But I also see transformation in how businesses operate. The downturn has spurred improvements in the efficiency of global operations. New technologies and reconfigured operating models are allowing companies to create value more effectively and to build more direct and intimate connections with their customers. And these new business models, practices and capabilities draw from a more diverse pool of global players, characterized by important differences in strategic priorities, governance and culture.
It is in the context of this dramatically altered landscape of opportunity and competition that this report, the work of the Accenture Institute for High Performance, calls for an urgent reassessment of the strategies and capabilities that will be central to achieving high performance in tomorrow’s global marketplace. Business leaders cannot allow change and uncertainty to paralyze their decision making. We hope you find the report insightful and stimulating and its recommendations both useful and actionable.
Mark Spelman
Global Head of StrategyAccenture
Mark Spelman

4
1 We analyzed household income data across 64 countries (see Methodology on page 67 for details) which together accounted for more than 90 percent of global GDP in 2010. The income of the emerging-market households in our analysis will jump by more than US$8.5 trillion between 2010 and 2020.
5
In the current global economic environment, executives fear that prospects for growth in many markets are patchy and vulnerable. With this fear comes a renewed search for pockets of growth in the global economy. We surveyed nearly 600 business leaders worldwide and found that 80 percent are focused primarily on high-growth markets in emerging economies to chart a more compelling path for the future. And with good reason. Household incomes in emerging economies will jump by more than US$8.5 trillion between 2010 and 2020—nearly 60 percent of the global increase over this period, in real terms.1 As these incomes grow, so will consumption and demand.
But many executives are not confident that their organizations are up to the task. Forty percent do not believe that their companies possess the strategic and operational capabilities to fully grasp the opportunities in emerging economies. The same proportion worry that they do not fully understand the competitive dynamics they will face. These doubts are not misplaced—and may be exacerbated by the emergence of a rapidly intensifying competitive landscape, populated by new players with new capabilities. High-growth emerging markets are a fast-moving target. Companies must build powerful new capabilities to address this new reality.
Tracking the income surgeThe pace of income growth in emerging economies can be bewildering. Many companies have been impatiently awaiting the promise of profitability in emerging economies. But as our detailed analysis of household incomes shows, the real growth in consumption
is yet to come. For example, many companies are pinning their hopes on China, the world’s most populous nation and one of its largest and fastest-growing economies. Currently, 27 other economies—including Poland, Colombia and Turkey—have a greater number of households with an annual income above US$30,000. But over the next decade, China will rapidly accelerate up the ranks, leaving only three economies with a greater number of households earning US$30,000 and above: the United States, Japan and Germany. This pace of change is not restricted to China: Mexican households in this income band are expected to boost their income by an additional US$340 billion by 2020, an increase higher than that expected in Germany. And in a richer income segment, households with an annual income of more than US$50,000, Turkey will see a total increase of US$380 billion, the highest of any emerging economy. As these examples demonstrate, the varying degree and speed of change across these markets make the size and timing of opportunities difficult to grasp.
Mapping the competitive terrainCompanies seeking their fortunes in high-growth markets face a challenging competitive landscape. As competitors jostle for position, firms targeting these markets will confront domestic players with strong local knowledge and intimate customer relationships; established multinationals with global scale that have improved their efficiency in response to the downturn; and a further potent breed, growing multinationals from emerging economies. The competitive landscape is characterized by a combination of scale advantages, strong brands,
low-cost capabilities and deep local knowledge, as well as an increased role of relationships and government support. In this environment, with its wide range of players and broad variety of capabilities, many companies will face a challenge in pressing home their own competitive advantage.
The opportunity paradoxOur research uncovers a paradox: on one hand, there is strong affirmation that firms see continued growth coming from emerging economies. On the other hand, they feel that the windows of opportunity to secure their company’s share of these markets may be shrinking. The point is underlined by our survey finding that 73 percent of respondents believe they need to accelerate their efforts, or may already be too late, to build satisfactory market share in these high-growth markets.
Our research supports this imperative to accelerate action in seeking opportunities in high-growth markets. In an uncertain economic environment, there is a strong temptation for companies to watch and wait, or even to retrench or withdraw from some markets until the global economic environment becomes clearer. In fact, many organizations have significant reserves of cash that could be used for expansion. But they continue to hesitate. A strategy of “wait and see” may be effective, as long as it is based on a realistic assessment of the options, opportunities and risks involved. More likely, however, hesitation in today’s global competitive environment may be the most dangerous choice of all. High-growth markets offer many opportunities, but the explosion in demand is matched by ever-intensifying competition.
Executive summary
6
Faced with the risk of squandering these opportunities, what can companies do to accelerate their efforts and avoid missing the boat? What are the specific capabilities they need to build in order to compete effectively and claim their share of future growth?
Opening windows of opportunityIn our research we found that successful companies in high-growth markets think differently about the capabilities critical for growth and prioritize their investments in different ways. Specifically, these “successful globalizers”—companies with a track record of successful performance in emerging economies, that are confident and committed about their future prospects in these markets—excel in three areas. They are better able to size the future—they possess the ability to accurately size, time and prioritize demand opportunities around the world. They are better able to shape the future—they possess the insights and capabilities to cultivate and protect future demand opportunities around the world. And they are better able to seize the future—they display the operational agility and flexibility to adapt and reorient the company to grasp opportunities across growth markets. Companies can take specific actions today to improve their capabilities in each of these areas:
1. Sizing the future: Where and when to investOur research suggests that successful companies in high-growth markets adopt new approaches to assessing potential market opportunity. They take a more dynamic view that incorporates foresight and flexibility into strategic planning.
They are more adept at examining global opportunities through multiple lenses. This allows them to aggregate seemingly disparate markets and uncover business cases that would otherwise have remained untapped. Witness companies that have successfully targeted diaspora communities scattered across the world, or specific high-potential customer segments, such as those in water-scarce areas, rural communities or
newly-empowered female populations. In this way, successful globalizers develop a more complete and realistic understanding of the markets in which they intend to operate.
Second, in a rapidly-changing environment, these companies understand better than their competitors the importance of planning over time horizons, allowing them to sequence and prioritize their investments. Our research, conducted in partnership with Oxford Economics, illustrates the importance of identifying where different markets will sit in terms of their consumption of specific products and services. How close are they to reaching a point where demand rapidly takes off? How close are they to market maturity? What are the opportunities of different markets over different time horizons?
This deep understanding of their target markets allows successful globalizers to become masters of strategic positioning: to be not only where opportunities are today, but where they will be tomorrow. Through their superior ability to discern the size, location and timing of opportunities, these companies make more informed decisions and trade-offs around where and when to invest, and remain several moves ahead of the competition.
To become masters of strategic positioning, companies can:
• Conduct cross-country forecasts of product and service consumption across time horizons, beyond national and regional borders, and use these to evaluate trade-offs and guide decisions about when, where and how to enter high-growth markets. Some markets may offer immediate opportunities, while others may be poised for more significant growth in the longer term.
• Experiment with different customer segmentation variables to uncover new geographic and demographic groups. Discovering segments that cut across country borders may unearth business cases beyond those that focus exclusively on country-level segmentation. Procter & Gamble has designed razors, shampoos and cleansing products specifically designed for consumers in water-scarce areas.
• Use information and communications technology (ICT) such as mobile phones and social media to collect reliable and relevant data, improve demand forecasting, and overcome data scarcity. Coca-Cola has 22 million consumers following it through social media, and the ensuing dialogue has given Coca-Cola valuable ideas for new beverages and other products.
• Leverage existing proprietary data for further growth opportunities: the Mexican retailer Grupo Elektra built one of the country’s largest networks of banking branches based on data from a credit service it launched for retail customers.
• Choose local partners—whether through joint ventures, alliances or other arrangements—to gain a deep understanding of local market dynamics, needs and preferences.
• Enhance competitor analysis techniques to anticipate emerging competitors across multiple time horizons, from different geographies and adjacent industries.
2. Shaping the future: Cultivating new marketsWhile some companies may feel they are too late to secure their position in high-growth markets, our research shows that successful globalizers do not simply accept that windows of opportunity are shrinking. Instead, they open new windows of opportunity by discovering new demand and seeding future opportunities.
In an environment where attaining market share is challenging, successful companies have identified the opportunity to grow the size of the overall opportunity, not just their share. They understand how to extend the frontiers of opportunity, often through targeted partnerships and collaboration with local stakeholders.
Our research demonstrates the impact, in real consumption opportunities, that can be achieved when businesses invest in generating future demand. For example, our analysis examines how demand can be measurably increased through improvements in infrastructure, education and health care.
7
To achieve a better understanding of how they can push open new windows of opportunity, companies can:
• Identify and map key stakeholders, local and global, and build trusted relationships.
• Assess the strength of relationships with government agencies, industry regulators and local communities. These relationships can help obtain a license to operate, ease the policy environment, and improve access to scarce resources. Executives may be surprised at the extent of common interests held by these stakeholders.
• Innovate to fulfill unmet needs, and involve local consumers in innovation and design. Vodafone and Safaricom’s M-PESA money transfer platform was designed to address a particular need in Kenyan society, to send money to family at home. The service has grown quickly, achieving 14 million registered users within four years, and has simultaneously brought an entirely new business model to markets across the world.
• Evaluate local and global leadership’s understanding of social and economic factors that influence demand, and promote the social and economic development of local communities. Companies successful in emerging markets engage national and local governments to help create the conditions needed for their businesses to prosper. GSK, a leading pharmaceutical and healthcare products company, reduced the price of its patented medicines in the world’s poorest countries, providing social benefits and opening up new markets.
3. Seizing the future: The operational agility to grasp new opportunities Successful companies infuse their organizations with the strategic, operational and cultural agility to grasp new opportunities. Identifying opportunities is one thing, but rapidly mobilizing the organization to attain them is another. In order to achieve this, they prioritize and invest in distinctive capabilities that boost operational agility and flexibility. These capabilities are not just instrumental in helping
companies to grasp the opportunities of today, but will play a fundamental role in shaping the markets of tomorrow.
For example, our analysis shows how the power of disruptive innovation can transform industry dynamics, improving the accessibility of consumer products and creating markets. In the automotive sector, for example, process redesign and low-cost materials have dramatically broadened the accessibility of passenger cars to new customers. New pockets of demand have opened up for those companies with the agility and efficiency to design low-price business models. Successful globalizers are pushing the boundaries of what is possible: they understand that business performance and the bottom line will only become more important in geographic growth plans. They understand that operating at speed and scale will play an ever greater role in determining the winners and losers of the next phase of global competition.
To achieve operational agility and seize new opportunities, companies can:
• Explore partnership and acquisition options to boost reach, capability and speed; and continually reassess and evolve ownership and governance structures as circumstances change. The flexibility of Starbucks in managing a range of business models and partnerships has been instrumental to its success in China, which the company now regards as its “second home market.”
• Develop systems to rapidly redeploy people, capital and ideas around the global organization. In expanding its global footprint, Tata Communications designed a wholly new international operating model to incorporate local leadership expertise into its global operations.
• Encourage experimentation—incubate, fund and protect new ideas. The success of Indian pharmaceutical companies demonstrates the importance of innovation, and the benefits of scaling new ideas across the global organization.
• Assess the leadership team and how its skills and experience align with growth plans. Nestlé is relaunching its
International Development Program, giving future leaders experience in foreign markets within the company’s business units across the globe.
No business decisions are simple in today’s environment of prolonged global economic uncertainty. But a game of “wait and see” purely due to a lack of understanding or preparedness poses the risk of missing the boat. This report uncovers the key dynamics at play and details specific actions that companies can take to build the capabilities for success in the high-growth markets of the future.
The researchAccenture’s Institute for High Performance has conducted thorough research to investigate the keys for success in today’s competitive high-growth markets. The main elements of research include:
• Household income analysis, in collaboration with Oxford Economics. We created five standard bands of annual household income and, for each of 64 countries, estimated the number of households falling into each band in 2010, 2015 and in 2020. All forecasts are measured in real terms, and at market exchange rates.
• Industry consumption curves, in collaboration with Oxford Economics. This research forecasts the evolution of consumption for a select group of industries across the world. It also includes scenario-based sensitivity analysis to assess the impact of changes in the business and policy environment.
• A survey of 588 business leaders, across 85 countries and 22 industries, conducted by the Economist Intelligence Unit. Business leaders were asked about their perceptions of the competitive landscape, their company’s plans for growth and the capabilities important for success in these markets.
• Conversations with clients and experts across industries and extensive secondary research, including company case studies and analysis of greenfield and M&A investment data.

8
9
A wake-up call
A world of opportunityFaced with protracted economic uncertainty, many companies are renewing their interest in emerging economies as a springboard for their next phase of growth. Our survey of 588 business leaders reveals that 80 percent are looking primarily at emerging economies for their next stage of growth. And they acknowledge that this is where future opportunities lie, with 81 percent planning to increase their investment in emerging economies over the coming three years.
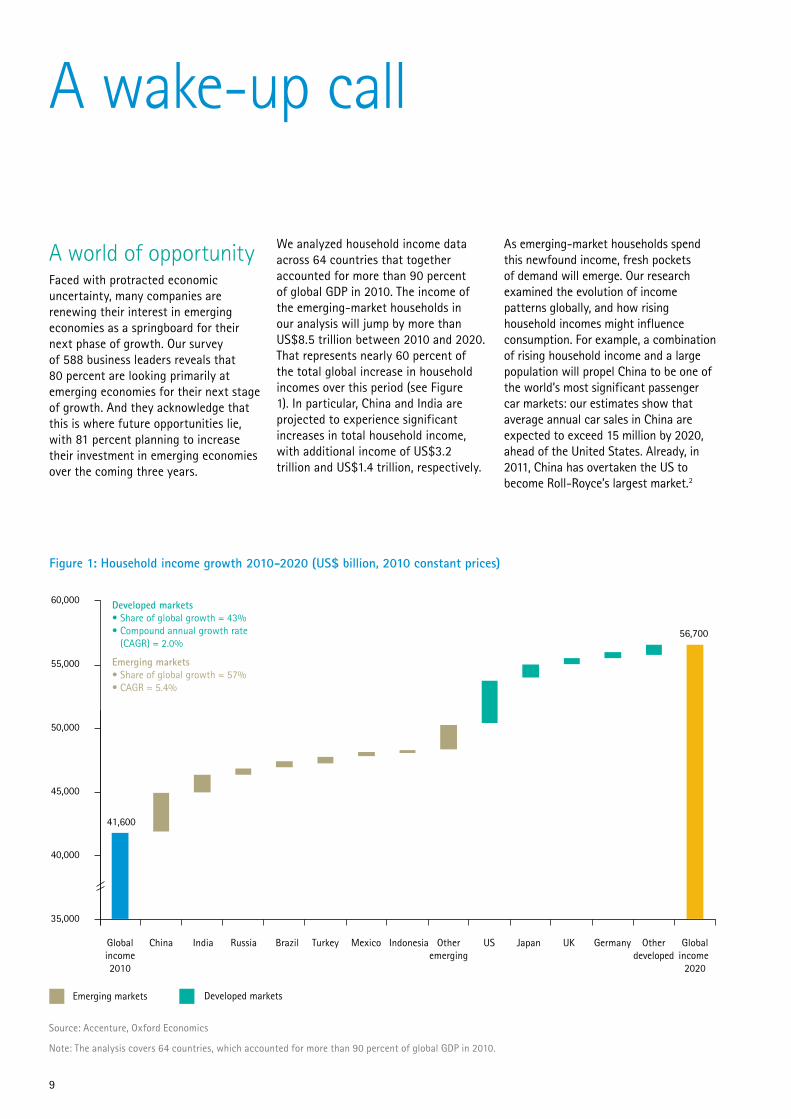
We analyzed household income data across 64 countries that together accounted for more than 90 percent of global GDP in 2010. The income of the emerging-market households in our analysis will jump by more than US$8.5 trillion between 2010 and 2020. That represents nearly 60 percent of the total global increase in household incomes over this period (see Figure 1). In particular, China and India are projected to experience significant increases in total household income, with additional income of US$3.2 trillion and US$1.4 trillion, respectively.
As emerging-market households spend this newfound income, fresh pockets of demand will emerge. Our research examined the evolution of income patterns globally, and how rising household incomes might influence consumption. For example, a combination of rising household income and a large population will propel China to be one of the world’s most significant passenger car markets: our estimates show that average annual car sales in China are expected to exceed 15 million by 2020, ahead of the United States. Already, in 2011, China has overtaken the US to become Roll-Royce’s largest market.2
Figure 1: Household income growth 2010-2020 (US$ billion, 2010 constant prices)
35,000
40,000
45,000
50,000
55,000
60,000
Globalincome2010
China India Russia Brazil Turkey Mexico Indonesia Otheremerging
US Japan UK Germany Otherdeveloped
Globalincome
2020
Developed markets• Share of global growth = 43%• Compound annual growth rate (CAGR) = 2.0%
Emerging markets• Share of global growth = 57%• CAGR = 5.4%
41,600
56,700
Emerging markets Developed markets
Source: Accenture, Oxford Economics
Note: The analysis covers 64 countries, which accounted for more than 90 percent of global GDP in 2010.
“Emerging markets,” however, is a nebulous term that obscures the diversity and complexity across those markets. South Korea, India and Vietnam are often cited as high-potential “emerging markets” to watch. Yet average household income in these markets diverges significantly; approximately US$35,400, US$5,800 and US$3,300, respectively, in 2010. The value of comparing a “typical” consumer across these countries is questionable, even when factoring in cultural differences.
Headline numbers can also mislead. China, for example, is the world’s most populous country and home to one of the world’s largest and fastest-growing economies. Yet in 2010 it had fewer households with annual incomes above US$30,000 than many other smaller “emerging” economies, including Colombia, South Africa and Argentina. While attention is focused on the BRIC economies, we project that by 2020 Turkey will be home to an additional 4.7 million households in this income bracket, on a par with expected growth levels in Brazil. Mexico will also undergo rapid growth in its consumer-market potential: there will be an additional 3.3 million households in this segment over the decade to 2020. With so much variation and rapid change, the size and timing of opportunities can be challenging to grasp.
The temptation to hesitateBusinesses are understandably hesitant to prioritize their investments in these diverse, unfamiliar, but potentially lucrative markets. Each brings unique opportunities, challenges and operating environments. The temptation to hesitate is aggravated by continued global economic uncertainty, sluggishness in developed markets and increasingly tempered near-term growth prospects in emerging markets.
The instinctive response of many companies will be to watch and wait, or even to retrench or withdraw from some geographic locations. Yet our research demonstrates that in today’s global competitive environment, hesitation
may be the most dangerous choice of all. The economic downturn has had a profound impact, dramatically reshaping the global competitive landscape. High-growth markets present many opportunities, but these opportunities are being rapidly snapped up by a new breed of players from emerging economies, as well as multinationals that have entrenched themselves in these markets during previous phases of globalization. The longer they wait, the more challenging competitive environment they will face when eventually taking action.
The risk of missing the boatCompanies turning their attention to high-growth markets must act quickly and definitively to carve out their position. Firms entering and expanding in high-growth markets can expect to face a range of competitors with powerful strengths: from low-cost players to global giants, from locally networked incumbents to masters of global scale and efficiency. In this environment, hesitation risks squandering opportunities. The longer the hesitation, the greater the odds that more nimble and prepared players will position themselves for these lucrative growth opportunities.
The mobile telecoms market in Latin America, for example, is often predicted to be one of the world’s fastest-growing telecoms markets over the next five years (See “América Móvil and Telefónica: Seizing opportunities ahead of the pack,” page 12). The market for value-added services such as mobile data is not yet established in much of Latin America. Penetration rates remain very low in many countries, and rapid increases in demand may be far off. These facts have not stopped Mexico’s América Móvil and Spain’s Telefónica from expanding rapidly across these smaller markets, acquiring local providers and gaining access to the infrastructure essential for growth when demand does take off. Companies looking to enter these nascent markets will face not only domestic players, but also two Fortune Global 500 multinationals with established products, infrastructure, relationships and brands.
The growth prospects are clear. But it is also clear that many companies will feel locked out of the opportunity to become serious players in the market, even before it has taken off.
This pattern is repeating itself in different industries and locations around the world. In some cases, the risk of being locked out of markets threatens deep and long-term consequences. The CEO of a large Chinese railway equipment manufacturer explained that the financial crisis weakened the ability of European and North American banks to finance large railway contracts demanded in Asia’s emerging economies. Chinese enterprises and banks partnered to fill the void. The CEO is confident that his company’s products rival the quality of multinational competitors and will anchor rapid sales expansion in Asia: exports for the first half of 2009 increased by 60 percent over the same period in the previous year.3 The prospect of being locked out of such long-term contracts around the world should be a sobering thought for many companies.
The intensity of competition is not all that has changed. The diversity of competitors, and of their competitive advantages, brings new challenges. In this report, we bring to light the fundamental shifts in the global business landscape that the downturn has wrought. We make clear the new challenges companies face in determining the optimal location and timing of opportunities, and the risk of delaying action in the face of aggressive competition.
The opportunity paradoxOur global business survey uncovered a paradox: on one hand, companies see continued growth coming from emerging economies. On the other, they feel that their windows of opportunity may be shrinking. Our survey findings underscored the point: 73 percent of respondents believe they need to accelerate their efforts to build satisfactory market share in these high-growth markets—or that it may already be too late.
10
Wanted: Action and confidenceEven while companies feel they are missing out on opportunities, uncertainty may lead them to hesitate about investing in high-growth markets. In fact, many companies have healthy cash reserves that could be used for expansion. Cash holdings for American nonfinancial companies in June 2011 exceeded US$1.9 trillion, the highest in half a century.4
The volatile economic environment drives uncertainty and hesitation, but our research uncovers deeper concerns. We found that many business leaders are not confident about their own company’s ability to succeed in high-growth markets.
• 40 percent do not believe that their company possesses the strategic and operational capabilities to fully grasp the opportunities in emerging economies.
• The same proportion acknowledge that they do not fully understand the competitive dynamics they will face.
• Nearly one-third do not even believe that their company has a clear strategy for high-growth markets.
With almost three-quarters of business leaders believing that they need to accelerate their efforts in high-growth markets, it is critical to understand the dynamics that constrain their progress.
Many companies may not appreciate the degree of change in the business landscape since the downturn.
On the demand side, companies have not adjusted their methods to locate and measure demand and fully evaluate potential opportunities: their tools are often inappropriate, or even outdated and irrelevant.
On the supply side, companies underestimate the diversity of players and capabilities they will encounter in the competitive landscape. Next, we explore these demand and supply dynamics.
73% of companies feel they need to accelerate efforts or may already be too late to build satisfactory market share in high-growth markets.
11
12
Latin America is projected to be the fastest-growing telecoms market over the next five years. Demand is growing at unprecedented rates: penetration reached a high of 89 percent this year.5 As penetration rates rise, so do opportunities for lucrative “value-added” services. Almost one-third of all new phones in Latin America by 2014 are expected to be smartphones. The number of mobile data plan subscribers is expected to more than double this year, a sizable opportunity in a continent of nearly 600 million people.6
The market is dominated by two global telecoms giants, each looking for growth to offset a decline in its traditional revenue base: América Móvil, which is looking for growth in mobile, broadband and pay TV to offset declining revenue in fixed-line services since the market was liberalized and opened up to competition, and Telefónica, which is looking to broaden its footprint beyond Europe, an intensely saturated and competitive market.7
These two companies are the dominant players in most key Latin American markets. In Mexico, Telcel—América Móvil’s mobile arm—holds 72 percent of the market, but Telefónica is closing fast. In the last quarter of 2010, the two companies accounted for 90 percent of the one million new connections: Telcel took 30 percent, but Telefónica took 61 percent. And in Brazil, América Móvil’s Claro brand is a key player in the market, along with Vivo, acquired by Telefónica in 2007.8
The strategies América Móvil and Telefónica use to build their presence are revealing. América Móvil has for many years been buying up smaller operators around Latin America, taking control of fixed-line infrastructure and
increasing its customer base. In recent years, Telefónica has built on long-standing relationships in the region, strengthening its presence through sizable acquisitions of established players such as Vivo.
As other telecoms players look to high-growth markets in Latin America, they are faced not only with smaller domestic incumbents but also with two Fortune Global 500 multinationals with global reach and scale, combined with local presence and understanding across the region. Breaking through this incumbency poses new and challenging questions to potential entrants.
América Móvil and Telefónica are already jostling for position in new services, including mobile data, broadband and pay TV. Telefónica recently rebranded its operations across Latin America, bringing together fixed line, mobile, broadband and TV under the Movistar brand.
When Latin America’s markets begin their inevitable acceleration—broadband penetration rates are still hovering at around 15 percent in most of these countries—América Móvil and Telefónica will be at the forefront of new opportunities.9 They are identifying and snapping up opportunities almost before they appear.
América Móvil and Telefónica: Seizing opportunities ahead of the pack
13
Locating demand: The search for growth
Between 2011 and 2016, approximately 60 percent of global economic growth is forecast to come from emerging economies,10 despite an expected near-term slowdown in key high-growth markets such as China and India. The triad economies of the United States, Europe and Japan continue to experience persistently high unemployment and public debt levels. Many developed economies have seen their economic growth forecasts downgraded in recent months and companies struggle to locate the next sources of growth in these markets. In many emerging economies, in contrast, unemployment is falling and governments hold significant reserves. Many companies in these markets may not even have felt the impact of the downturn.
Levels of consumption and demand for goods and services in emerging economies will increase as incomes grow. But with enormous differences in the size and growth rates of demand, along with a variety of customer preferences, it is difficult to accurately assess and forecast growth opportunities.
A fast-moving targetWe have conducted an extensive analysis, in collaboration with Oxford Economics, of household incomes and their evolution over the coming decade. According to our analysis, China lags behind 27 other economies, including Poland, Turkey and Colombia, in the number of households with an annual income greater than US$30,000. This comes as no surprise to companies eagerly and impatiently awaiting
profitability in China. But over the next decade, China will rapidly move up the ranks, leaving only three economies with a greater number of households earning US$30,000 and above: the United States, Japan and Germany. In 2010, the number of Chinese households in this income bracket was almost twice that in Thailand—but by 2020, there will be more than thirteen times as many. Our analysis highlights the dynamics shaping global demand opportunities through 2020 (see “In focus: Household buying power,” page 18). Specifically, we illustrate how US$15 trillion of additional household income will be dispersed around the world across distinct income segments. The stories that emerge reveal where “high growth” may be found.
Attachment to outdated labelsIncome levels and the speed of change are difficult to keep up with and translate into investment decisions. Commentators are quick to embrace labels such as BRIC (Brazil, Russia, India and China), MINT (Mexico, Indonesia, Nigeria and Turkey) and CIVETS (Colombia, Indonesia, Vietnam, Egypt, Turkey and South Africa). But the dramatic speed at which the demand landscape is changing brings into question the value of these terms. Over the next three years, in real terms, India’s economy will grow at a rate twice as fast as that of Russia. China will grow twice as fast as Brazil. And there are significant structural differences: while India’s growth has been fueled primarily by domestic demand (private consumption accounts
for 56 percent of India’s economy, compared with 34 percent in China),11 China’s economy is largely built on investment and export growth, and Russia is heavily dependent on its natural resources: oil, fuel and gas accounted for 69 percent of exports in 2010.12 These fundamental differences illustrate the dangers of relying upon such country groupings for detailed analysis and comparisons. Looking outside the BRICs, Vietnam, Peru and Angola are all forecast to grow more quickly than Russia. It becomes clear that even the accuracy of the terms “emerging markets” and “high-growth markets” is debatable.
Economic groupings and macroeconomic terminology help describe important global trends. But when a company plans its own global strategy, it needs a far more granular analysis—one that looks beneath headline figures and provides a more accurate picture of the true size and pace of growth in demand around the world.
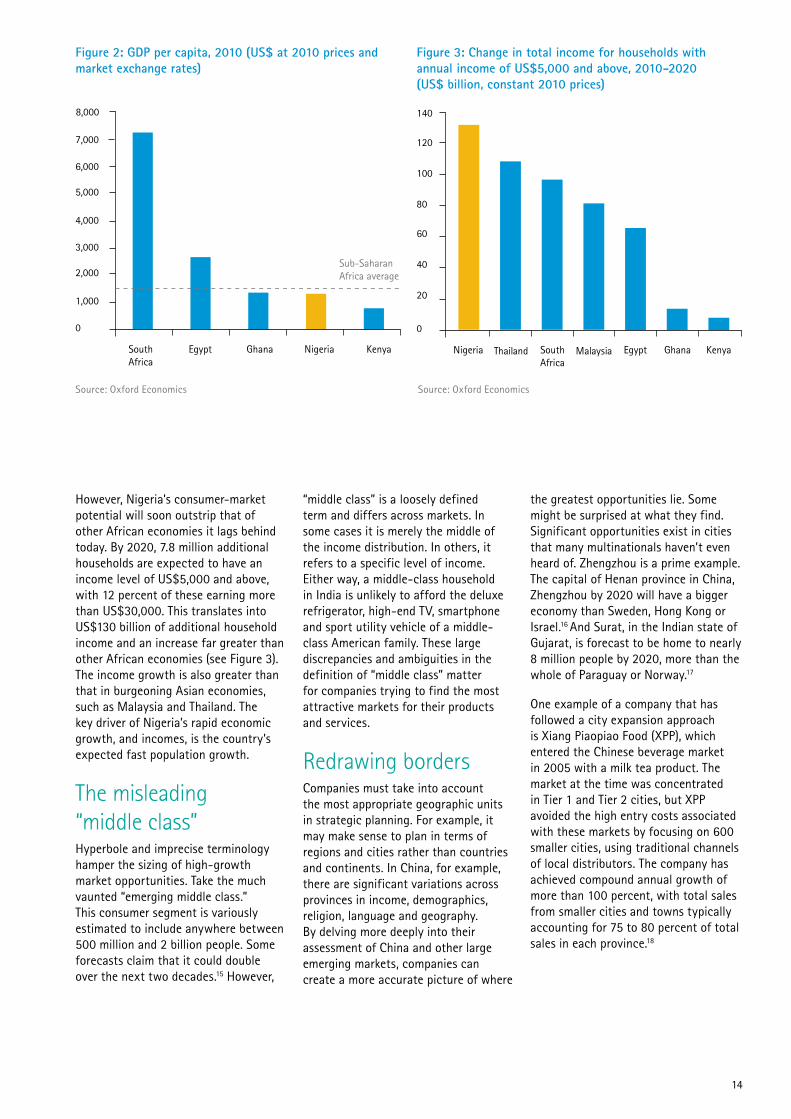
The dangers of generalizationLabeling groups of countries can also lead companies to overlook important differences among unfamiliar markets. For decades, the African continent has borne the brunt of such generalizations. In 2010, Nigeria had a per capita GDP of US$1,300, lower than the sub-Saharan Africa average (see Figure 2).13 Nigeria’s total household income was approximately US$200 billion—lower than South Africa’s, despite a population three times as large.14
14
However, Nigeria’s consumer-market potential will soon outstrip that of other African economies it lags behind today. By 2020, 7.8 million additional households are expected to have an income level of US$5,000 and above, with 12 percent of these earning more than US$30,000. This translates into US$130 billion of additional household income and an increase far greater than other African economies (see Figure 3). The income growth is also greater than that in burgeoning Asian economies, such as Malaysia and Thailand. The key driver of Nigeria’s rapid economic growth, and incomes, is the country’s expected fast population growth.
The misleading “middle class”Hyperbole and imprecise terminology hamper the sizing of high-growth market opportunities. Take the much vaunted “emerging middle class.” This consumer segment is variously estimated to include anywhere between 500 million and 2 billion people. Some forecasts claim that it could double over the next two decades.15 However,
“middle class” is a loosely defined term and differs across markets. In some cases it is merely the middle of the income distribution. In others, it refers to a specific level of income. Either way, a middle-class household in India is unlikely to afford the deluxe refrigerator, high-end TV, smartphone and sport utility vehicle of a middle-class American family. These large discrepancies and ambiguities in the definition of “middle class” matter for companies trying to find the most attractive markets for their products and services.
Redrawing bordersCompanies must take into account the most appropriate geographic units in strategic planning. For example, it may make sense to plan in terms of regions and cities rather than countries and continents. In China, for example, there are significant variations across provinces in income, demographics, religion, language and geography. By delving more deeply into their assessment of China and other large emerging markets, companies can create a more accurate picture of where
the greatest opportunities lie. Some might be surprised at what they find. Significant opportunities exist in cities that many multinationals haven’t even heard of. Zhengzhou is a prime example. The capital of Henan province in China, Zhengzhou by 2020 will have a bigger economy than Sweden, Hong Kong or Israel.16 And Surat, in the Indian state of Gujarat, is forecast to be home to nearly 8 million people by 2020, more than the whole of Paraguay or Norway.17
One example of a company that has followed a city expansion approach is Xiang Piaopiao Food (XPP), which entered the Chinese beverage market in 2005 with a milk tea product. The market at the time was concentrated in Tier 1 and Tier 2 cities, but XPP avoided the high entry costs associated with these markets by focusing on 600 smaller cities, using traditional channels of local distributors. The company has achieved compound annual growth of more than 100 percent, with total sales from smaller cities and towns typically accounting for 75 to 80 percent of total sales in each province.18
Figure 2: GDP per capita, 2010 (US$ at 2010 prices and market exchange rates)
0
1,000
2,000
3,000
4,000
5,000
7,000
6,000
SouthAfrica
Egypt Ghana Nigeria Kenya
Sub-SaharanAfrica average
8,000
Source: Oxford Economics
Figure 3: Change in total income for households with annual income of US$5,000 and above, 2010-2020 (US$ billion, constant 2010 prices)
Source: Oxford Economics
0
100
80
60
40
20
SouthAfrica
Egypt GhanaNigeria Kenya
120
140
Thailand Malaysia
15
Understand the “unknown-knowns” A large number of external factors can cause consumer spending to diverge from expectations. One such factor is change in the distribution of income, something that is receiving increased attention from opinion formers and policymakers around the world. China, for example, has made reducing income inequality a priority in its 12th Five-Year Plan.
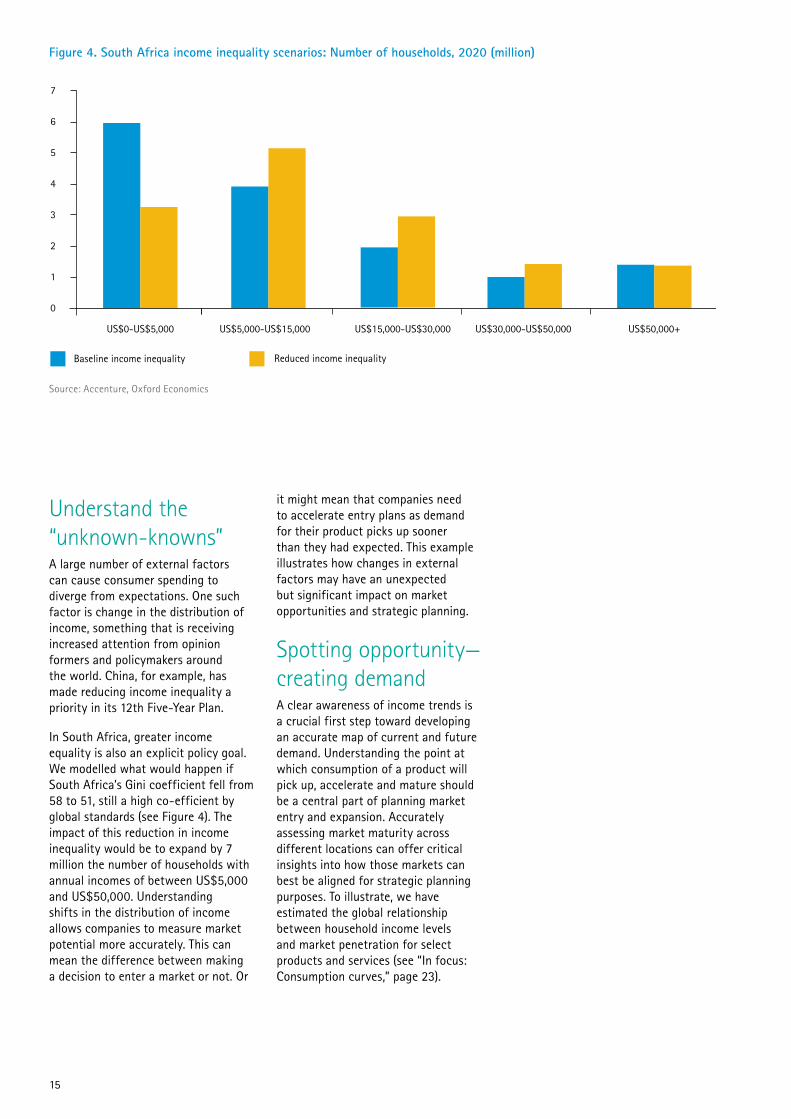
In South Africa, greater income equality is also an explicit policy goal. We modelled what would happen if South Africa’s Gini coefficient fell from 58 to 51, still a high co-efficient by global standards (see Figure 4). The impact of this reduction in income inequality would be to expand by 7 million the number of households with annual incomes of between US$5,000 and US$50,000. Understanding shifts in the distribution of income allows companies to measure market potential more accurately. This can mean the difference between making a decision to enter a market or not. Or
it might mean that companies need to accelerate entry plans as demand for their product picks up sooner than they had expected. This example illustrates how changes in external factors may have an unexpected but significant impact on market opportunities and strategic planning.
Spotting opportunity—creating demandA clear awareness of income trends is a crucial first step toward developing an accurate map of current and future demand. Understanding the point at which consumption of a product will pick up, accelerate and mature should be a central part of planning market entry and expansion. Accurately assessing market maturity across different locations can offer critical insights into how those markets can best be aligned for strategic planning purposes. To illustrate, we have estimated the global relationship between household income levels and market penetration for select products and services (see “In focus: Consumption curves,” page 23).
Figure 4. South Africa income inequality scenarios: Number of households, 2020 (million)
1
2
3
4
5
6
7
US$0-US$5,000 US$50,000+
Baseline income inequality Reduced income inequality
0
US$5,000-US$15,000 US$15,000-US$30,000 US$30,000-US$50,000
Source: Accenture, Oxford Economics

16

17
18
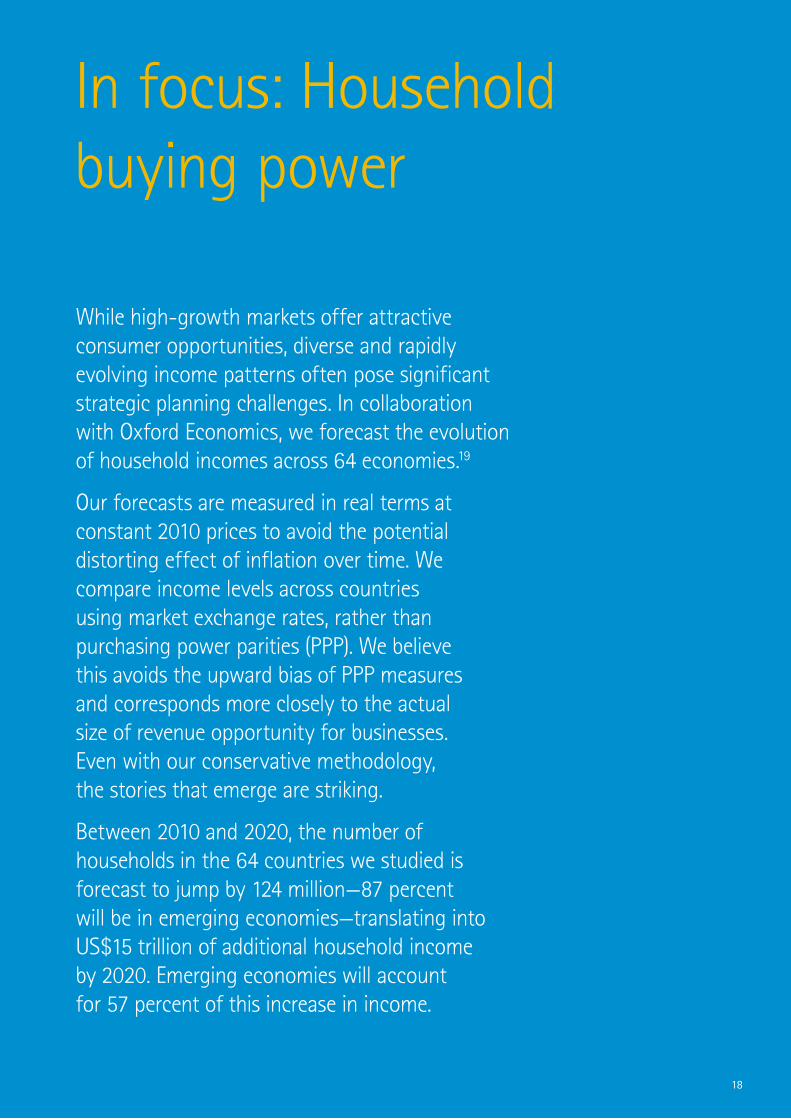
In focus: Household buying power
While high-growth markets offer attractive consumer opportunities, diverse and rapidly evolving income patterns often pose significant strategic planning challenges. In collaboration with Oxford Economics, we forecast the evolution of household incomes across 64 economies.19
Our forecasts are measured in real terms at constant 2010 prices to avoid the potential distorting effect of inflation over time. We compare income levels across countries using market exchange rates, rather than purchasing power parities (PPP). We believe this avoids the upward bias of PPP measures and corresponds more closely to the actual size of revenue opportunity for businesses. Even with our conservative methodology, the stories that emerge are striking.
Between 2010 and 2020, the number of households in the 64 countries we studied is forecast to jump by 124 million—87 percent will be in emerging economies—translating into US$15 trillion of additional household income by 2020. Emerging economies will account for 57 percent of this increase in income.
19
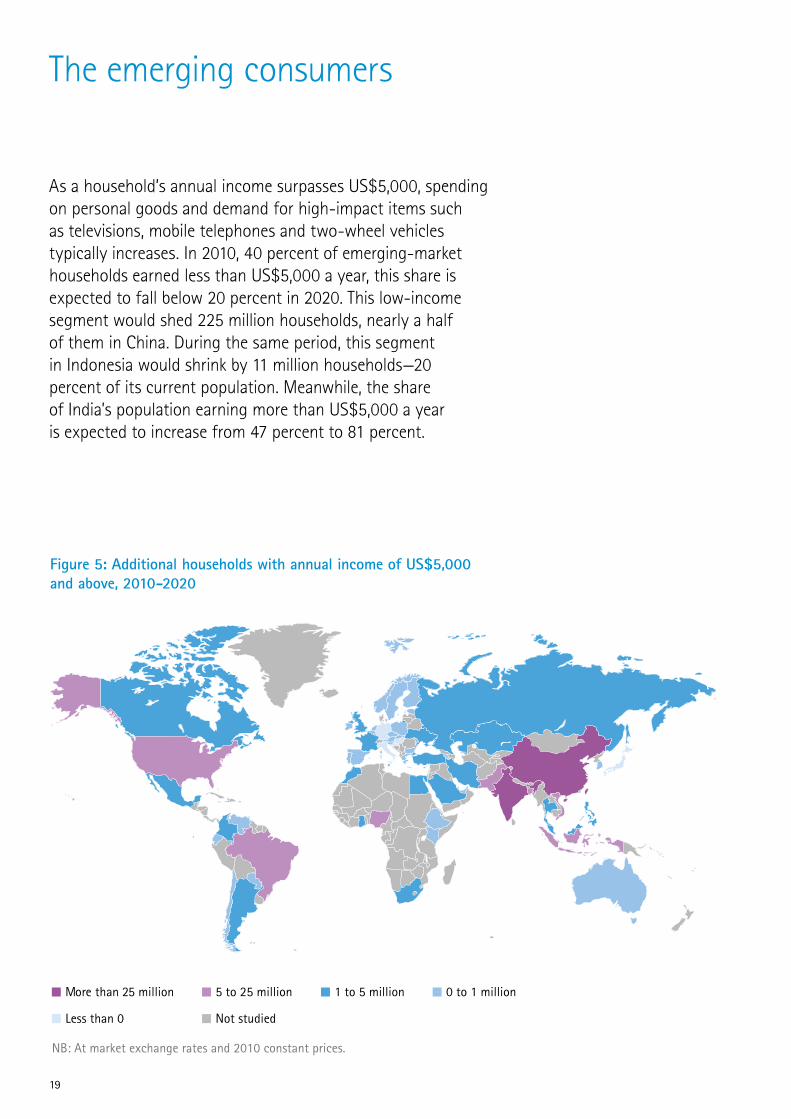
The emerging consumers
Figure 5: Additional households with annual income of US$5,000 and above, 2010-2020
More than 25 million
NB: At market exchange rates and 2010 constant prices.
5 to 25 million 1 to 5 million 0 to 1 million
Less than 0 Not studied
As a household’s annual income surpasses US$5,000, spending on personal goods and demand for high-impact items such as televisions, mobile telephones and two-wheel vehicles typically increases. In 2010, 40 percent of emerging-market households earned less than US$5,000 a year, this share is expected to fall below 20 percent in 2020. This low-income segment would shed 225 million households, nearly a half of them in China. During the same period, this segment in Indonesia would shrink by 11 million households—20 percent of its current population. Meanwhile, the share of India’s population earning more than US$5,000 a year is expected to increase from 47 percent to 81 percent.
20
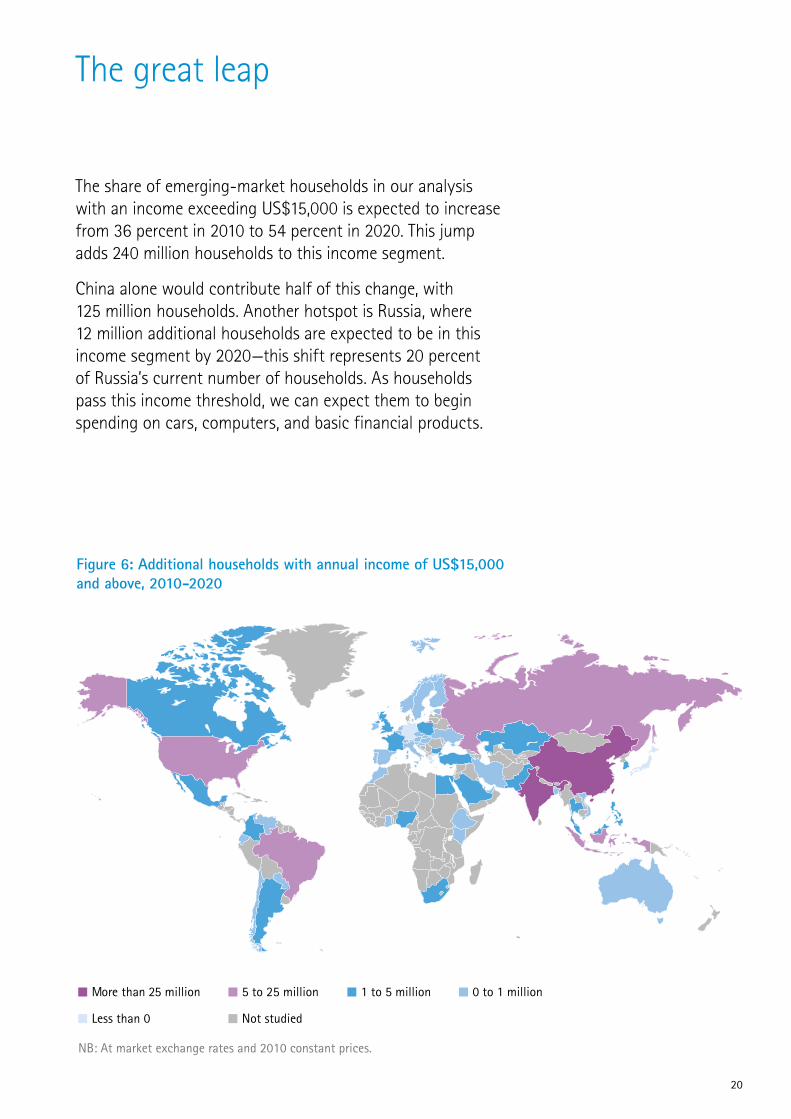
The great leap
Figure 6: Additional households with annual income of US$15,000 and above, 2010-2020
More than 25 million
NB: At market exchange rates and 2010 constant prices.
5 to 25 million 1 to 5 million 0 to 1 million
Less than 0 Not studied
The share of emerging-market households in our analysis with an income exceeding US$15,000 is expected to increase from 36 percent in 2010 to 54 percent in 2020. This jump adds 240 million households to this income segment.
China alone would contribute half of this change, with 125 million households. Another hotspot is Russia, where 12 million additional households are expected to be in this income segment by 2020—this shift represents 20 percent of Russia’s current number of households. As households pass this income threshold, we can expect them to begin spending on cars, computers, and basic financial products.
21
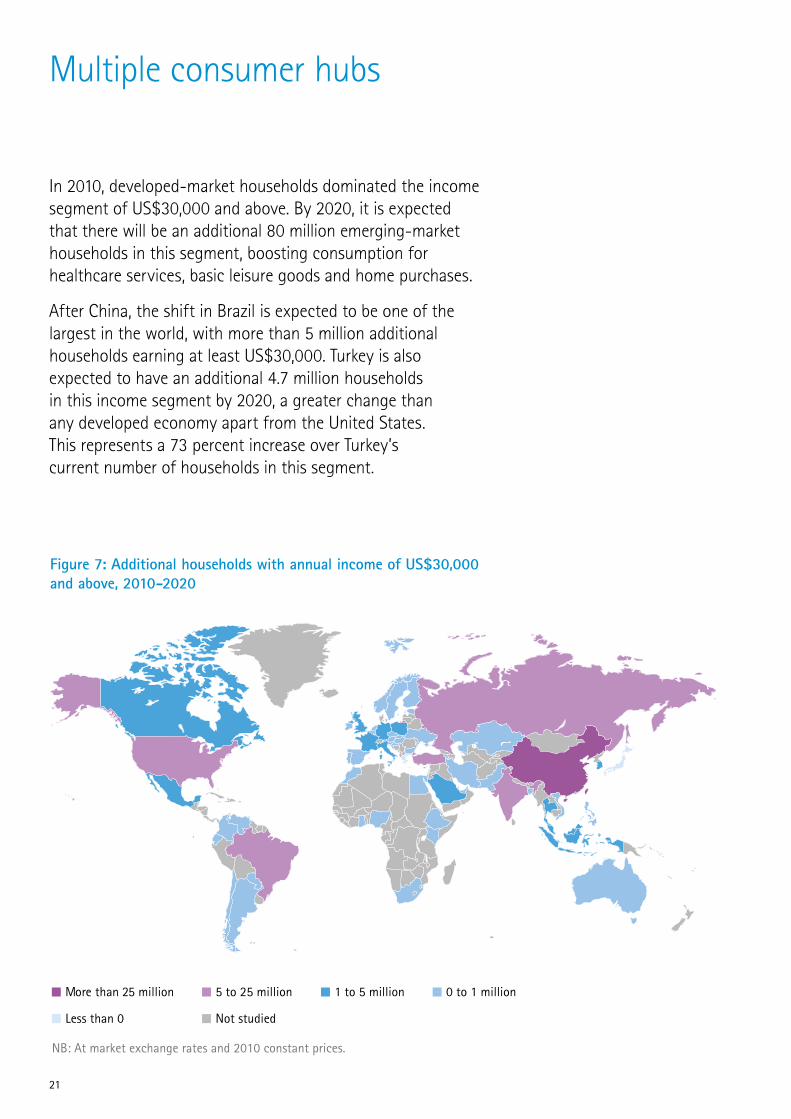
Multiple consumer hubs
Figure 7: Additional households with annual income of US$30,000 and above, 2010-2020
More than 25 million
NB: At market exchange rates and 2010 constant prices.
5 to 25 million 1 to 5 million 0 to 1 million
Less than 0 Not studied
In 2010, developed-market households dominated the income segment of US$30,000 and above. By 2020, it is expected that there will be an additional 80 million emerging-market households in this segment, boosting consumption for healthcare services, basic leisure goods and home purchases.
After China, the shift in Brazil is expected to be one of the largest in the world, with more than 5 million additional households earning at least US$30,000. Turkey is also expected to have an additional 4.7 million households in this income segment by 2020, a greater change than any developed economy apart from the United States. This represents a 73 percent increase over Turkey’s current number of households in this segment.
22
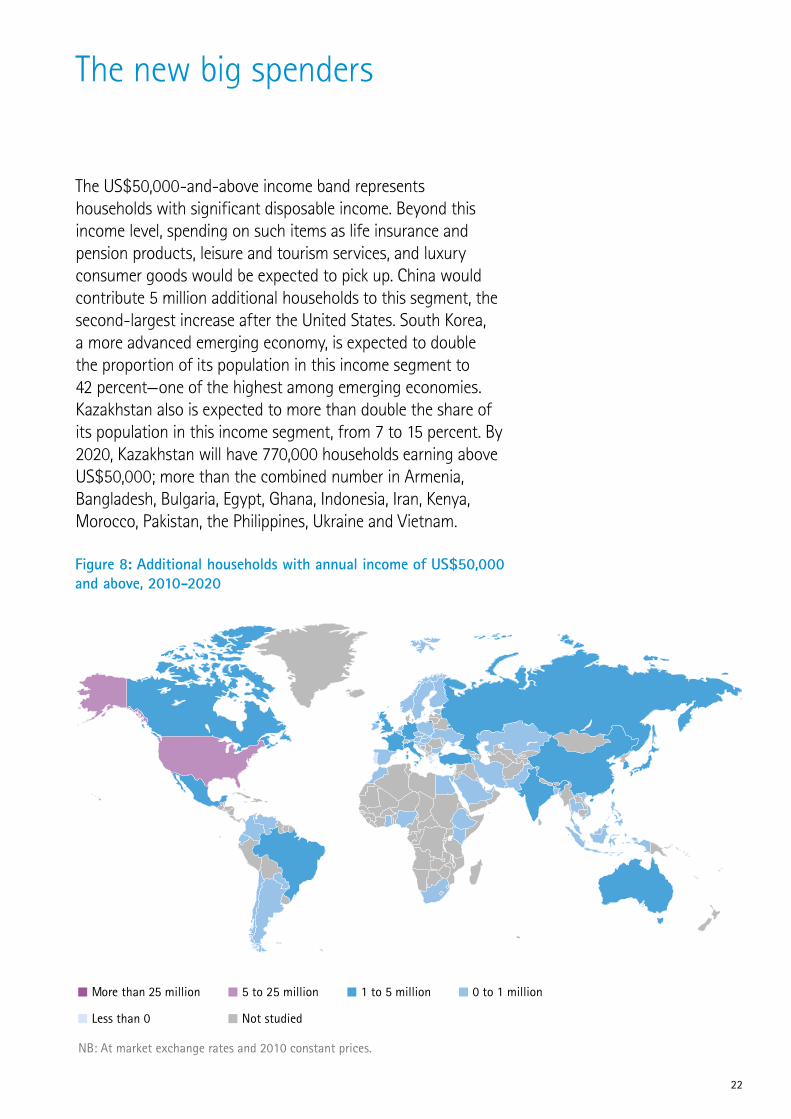
The new big spenders
Figure 8: Additional households with annual income of US$50,000 and above, 2010-2020
More than 25 million
NB: At market exchange rates and 2010 constant prices.
5 to 25 million 1 to 5 million 0 to 1 million
Less than 0 Not studied
The US$50,000-and-above income band represents households with significant disposable income. Beyond this income level, spending on such items as life insurance and pension products, leisure and tourism services, and luxury consumer goods would be expected to pick up. China would contribute 5 million additional households to this segment, the second-largest increase after the United States. South Korea, a more advanced emerging economy, is expected to double the proportion of its population in this income segment to 42 percent—one of the highest among emerging economies. Kazakhstan also is expected to more than double the share of its population in this income segment, from 7 to 15 percent. By 2020, Kazakhstan will have 770,000 households earning above US$50,000; more than the combined number in Armenia, Bangladesh, Bulgaria, Egypt, Ghana, Indonesia, Iran, Kenya, Morocco, Pakistan, the Philippines, Ukraine and Vietnam.
23
In focus: Consumption curves
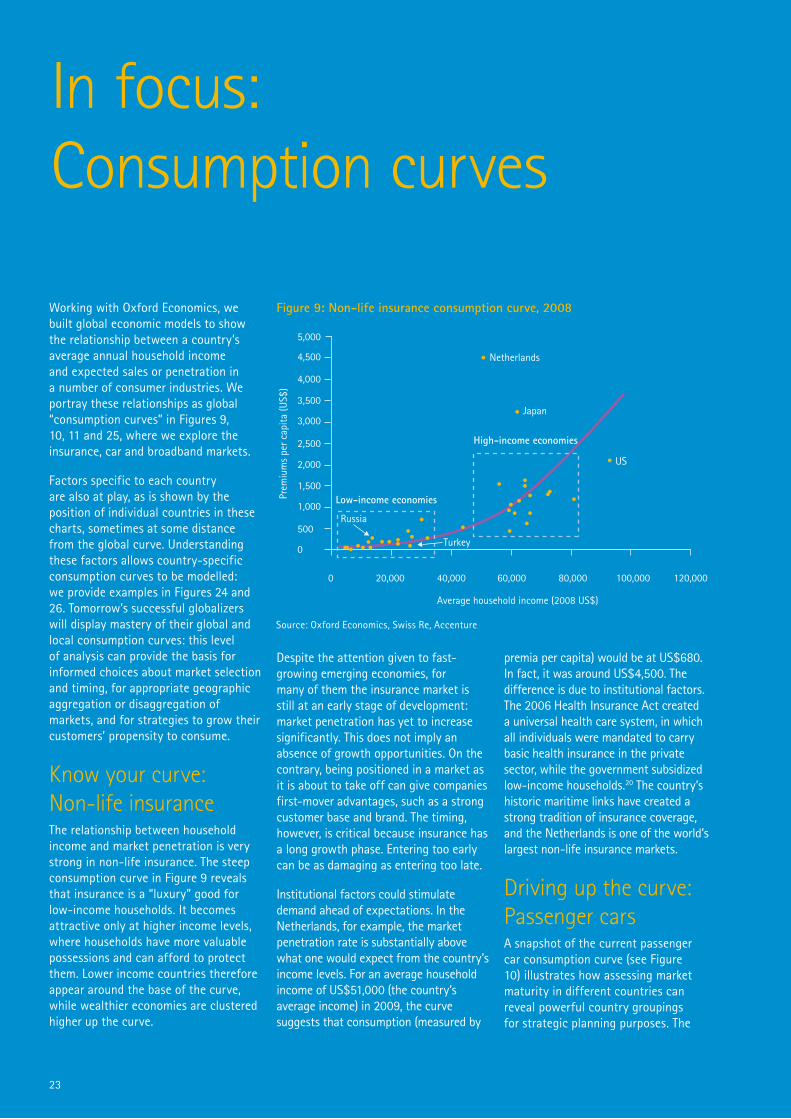
Working with Oxford Economics, we built global economic models to show the relationship between a country’s average annual household income and expected sales or penetration in a number of consumer industries. We portray these relationships as global “consumption curves” in Figures 9, 10, 11 and 25, where we explore the insurance, car and broadband markets.
Factors specific to each country are also at play, as is shown by the position of individual countries in these charts, sometimes at some distance from the global curve. Understanding these factors allows country-specific consumption curves to be modelled: we provide examples in Figures 24 and 26. Tomorrow’s successful globalizers will display mastery of their global and local consumption curves: this level of analysis can provide the basis for informed choices about market selection and timing, for appropriate geographic aggregation or disaggregation of markets, and for strategies to grow their customers’ propensity to consume.
Know your curve: Non-life insuranceThe relationship between household income and market penetration is very strong in non-life insurance. The steep consumption curve in Figure 9 reveals that insurance is a “luxury” good for low-income households. It becomes attractive only at higher income levels, where households have more valuable possessions and can afford to protect them. Lower income countries therefore appear around the base of the curve, while wealthier economies are clustered higher up the curve.
Despite the attention given to fast-growing emerging economies, for many of them the insurance market is still at an early stage of development: market penetration has yet to increase significantly. This does not imply an absence of growth opportunities. On the contrary, being positioned in a market as it is about to take off can give companies first-mover advantages, such as a strong customer base and brand. The timing, however, is critical because insurance has a long growth phase. Entering too early can be as damaging as entering too late.
Institutional factors could stimulate demand ahead of expectations. In the Netherlands, for example, the market penetration rate is substantially above what one would expect from the country’s income levels. For an average household income of US$51,000 (the country’s average income) in 2009, the curve suggests that consumption (measured by
premia per capita) would be at US$680. In fact, it was around US$4,500. The difference is due to institutional factors. The 2006 Health Insurance Act created a universal health care system, in which all individuals were mandated to carry basic health insurance in the private sector, while the government subsidized low-income households.20 The country’s historic maritime links have created a strong tradition of insurance coverage, and the Netherlands is one of the world’s largest non-life insurance markets.
Driving up the curve: Passenger carsA snapshot of the current passenger car consumption curve (see Figure 10) illustrates how assessing market maturity in different countries can reveal powerful country groupings for strategic planning purposes. The
Prem
ium
s pe
r cap
ita (U
S$)
5,000
4,500
4,000
3,500
3,000
2,500
2,000
1,500
1,000
500
0
0 20,000 40,000 60,000 80,000 100,000 120,000
High-income economies
Low-income economies
Average household income (2008 US$)
Japan
Netherlands
US
Russia
Turkey
Figure 9: Non-life insurance consumption curve, 2008
Source: Oxford Economics, Swiss Re, Accenture
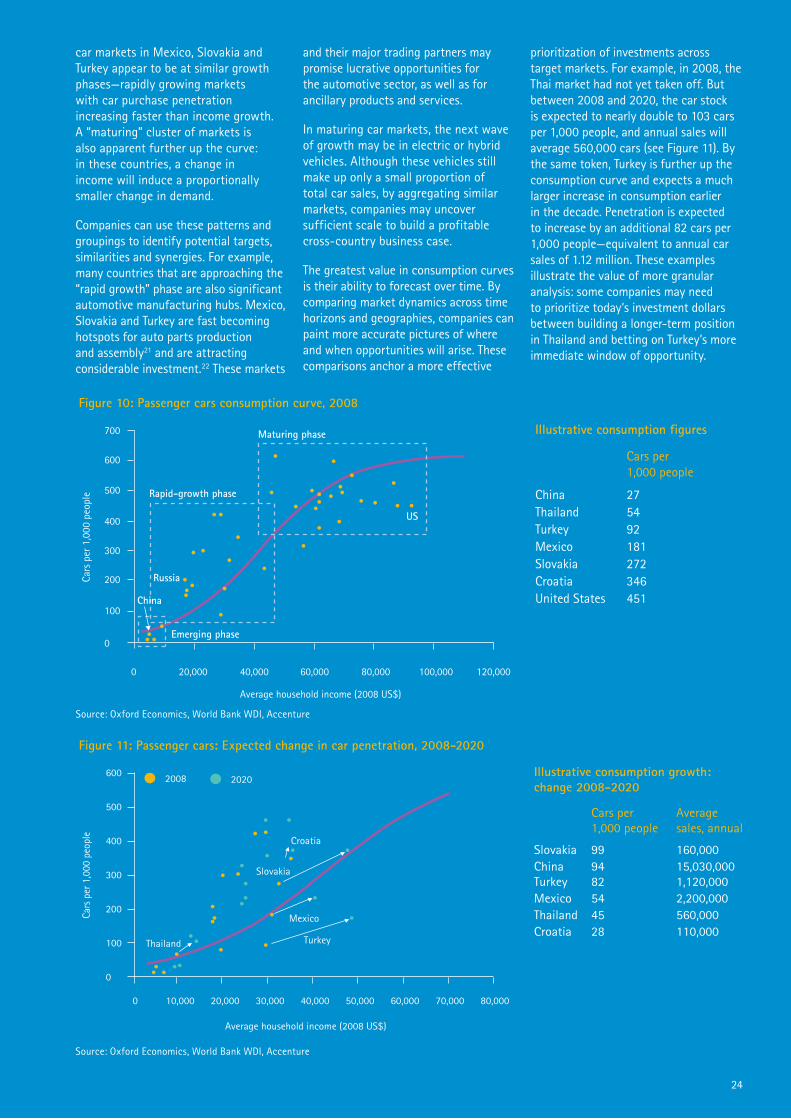
Figure 10: Passenger cars consumption curve, 2008
Source: Oxford Economics, World Bank WDI, Accenture
Cars
per
1,0
00 p
eopl
e
700
600
500
400
300
200
100
0
0 20,000 40,000 60,000 80,000 100,000 120,000
Emerging phase
Average household income (2008 US$)
Rapid-growth phase
Maturing phase Illustrative consumption figures
Cars per 1,000 people
China 27Thailand 54Turkey 92Mexico 181Slovakia 272Croatia 346United States 451
US
China
Russia
Figure 11: Passenger cars: Expected change in car penetration, 2008-2020
Source: Oxford Economics, World Bank WDI, Accenture
Cars
per
1,0
00 p
eopl
e
600
500
400
300
200
100
0
0 10,000 20,000 30,000 60,000 70,000 80,000
Average household income (2008 US$)
Illustrative consumption growth: change 2008-2020
Cars per Average 1,000 people sales, annual
Slovakia 99 160,000China 94 15,030,000 Turkey 82 1,120,000Mexico 54 2,200,000Thailand 45 560,000Croatia 28 110,000
40,000
Thailand
50,000
Slovakia
Croatia
Turkey
Mexico
2008 2020
24
car markets in Mexico, Slovakia and Turkey appear to be at similar growth phases—rapidly growing markets with car purchase penetration increasing faster than income growth. A “maturing” cluster of markets is also apparent further up the curve: in these countries, a change in income will induce a proportionally smaller change in demand.
Companies can use these patterns and groupings to identify potential targets, similarities and synergies. For example, many countries that are approaching the “rapid growth” phase are also significant automotive manufacturing hubs. Mexico, Slovakia and Turkey are fast becoming hotspots for auto parts production and assembly21 and are attracting considerable investment.22 These markets
and their major trading partners may promise lucrative opportunities for the automotive sector, as well as for ancillary products and services.
In maturing car markets, the next wave of growth may be in electric or hybrid vehicles. Although these vehicles still make up only a small proportion of total car sales, by aggregating similar markets, companies may uncover sufficient scale to build a profitable cross-country business case.
The greatest value in consumption curves is their ability to forecast over time. By comparing market dynamics across time horizons and geographies, companies can paint more accurate pictures of where and when opportunities will arise. These comparisons anchor a more effective
prioritization of investments across target markets. For example, in 2008, the Thai market had not yet taken off. But between 2008 and 2020, the car stock is expected to nearly double to 103 cars per 1,000 people, and annual sales will average 560,000 cars (see Figure 11). By the same token, Turkey is further up the consumption curve and expects a much larger increase in consumption earlier in the decade. Penetration is expected to increase by an additional 82 cars per 1,000 people—equivalent to annual car sales of 1.12 million. These examples illustrate the value of more granular analysis: some companies may need to prioritize today’s investment dollars between building a longer-term position in Thailand and betting on Turkey’s more immediate window of opportunity.

25

26
New players, new rules: The new shape of competition
This chapter looks at the important dynamics reshaping the global competitive landscape: the key players and new competitive pressures that make it more difficult for companies to access growth opportunities. We introduce the players in this new phase of global competition and then look at how they are changing the rules of the game.
New playersInternationalization has never been a simple journey. The ability to become relevant and respond to local needs in new markets has always been a fundamental challenge. A major obstacle is the strength of incumbents, with their deep local-level relationships, acute knowledge of local needs and preferences, and enviable customer loyalty. Business school case studies and media coverage are littered with praise for companies that have managed to effectively tailor their offerings to local markets. By the same token, companies unable to recognize and adapt to local circumstances are criticized.
But companies looking to enter high-growth markets today face a more complex incumbency challenge than ever before. High-growth markets have spurred growing levels of investment and corporate activity over recent years.
Many economies have actively courted foreign investment, and governments compete against one another to attract firms from around the world. The impact on local competitive dynamics has been dramatic.
Multiple layers of incumbencyFirst, companies must compete against strong local knowledge and the relationships that domestic players enjoy. Second, many can expect to face Western multinationals that have expended significant effort to become locally entrenched. These multinational players possess the scale and efficiency of global enterprises, some possess strong brands, and most have become leaner and more competitive in response to economic troubles in their home countries. Finally, companies entering new markets will also face multinationals from emerging economies that can leverage scale advantages with low-cost capabilities and, in some cases, government support and funding. Most companies are rightly daunted by the prospect of having to take share from these incumbents. It is no wonder that some firms feel they are already too late to enter these markets (For an example of how to respond to these pressures, see “Cencosud: Retail relations,” page 30).
27
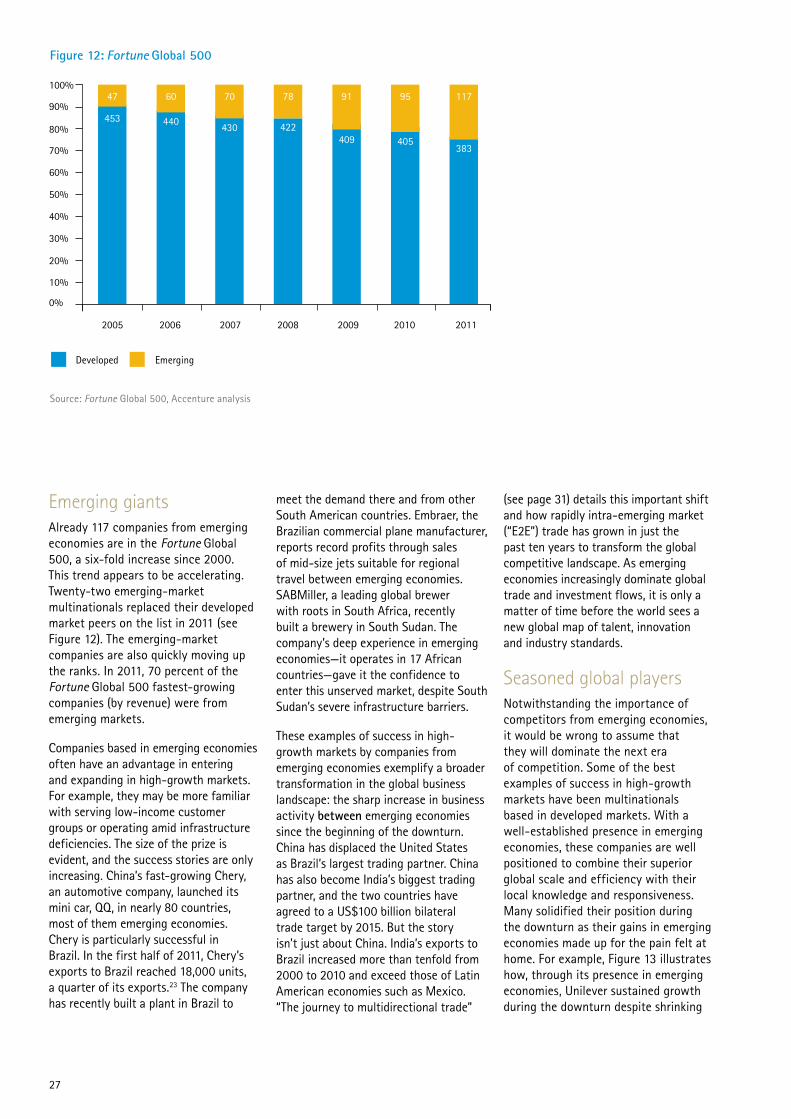
Emerging giantsAlready 117 companies from emerging economies are in the Fortune Global 500, a six-fold increase since 2000. This trend appears to be accelerating. Twenty-two emerging-market multinationals replaced their developed market peers on the list in 2011 (see Figure 12). The emerging-market companies are also quickly moving up the ranks. In 2011, 70 percent of the Fortune Global 500 fastest-growing companies (by revenue) were from emerging markets.
Companies based in emerging economies often have an advantage in entering and expanding in high-growth markets. For example, they may be more familiar with serving low-income customer groups or operating amid infrastructure deficiencies. The size of the prize is evident, and the success stories are only increasing. China’s fast-growing Chery, an automotive company, launched its mini car, QQ, in nearly 80 countries, most of them emerging economies. Chery is particularly successful in Brazil. In the first half of 2011, Chery’s exports to Brazil reached 18,000 units, a quarter of its exports.23 The company has recently built a plant in Brazil to
meet the demand there and from other South American countries. Embraer, the Brazilian commercial plane manufacturer, reports record profits through sales of mid-size jets suitable for regional travel between emerging economies. SABMiller, a leading global brewer with roots in South Africa, recently built a brewery in South Sudan. The company’s deep experience in emerging economies—it operates in 17 African countries—gave it the confidence to enter this unserved market, despite South Sudan’s severe infrastructure barriers.
These examples of success in high-growth markets by companies from emerging economies exemplify a broader transformation in the global business landscape: the sharp increase in business activity between emerging economies since the beginning of the downturn. China has displaced the United States as Brazil’s largest trading partner. China has also become India’s biggest trading partner, and the two countries have agreed to a US$100 billion bilateral trade target by 2015. But the story isn’t just about China. India’s exports to Brazil increased more than tenfold from 2000 to 2010 and exceed those of Latin American economies such as Mexico. “The journey to multidirectional trade”
(see page 31) details this important shift and how rapidly intra-emerging market (“E2E”) trade has grown in just the past ten years to transform the global competitive landscape. As emerging economies increasingly dominate global trade and investment flows, it is only a matter of time before the world sees a new global map of talent, innovation and industry standards.
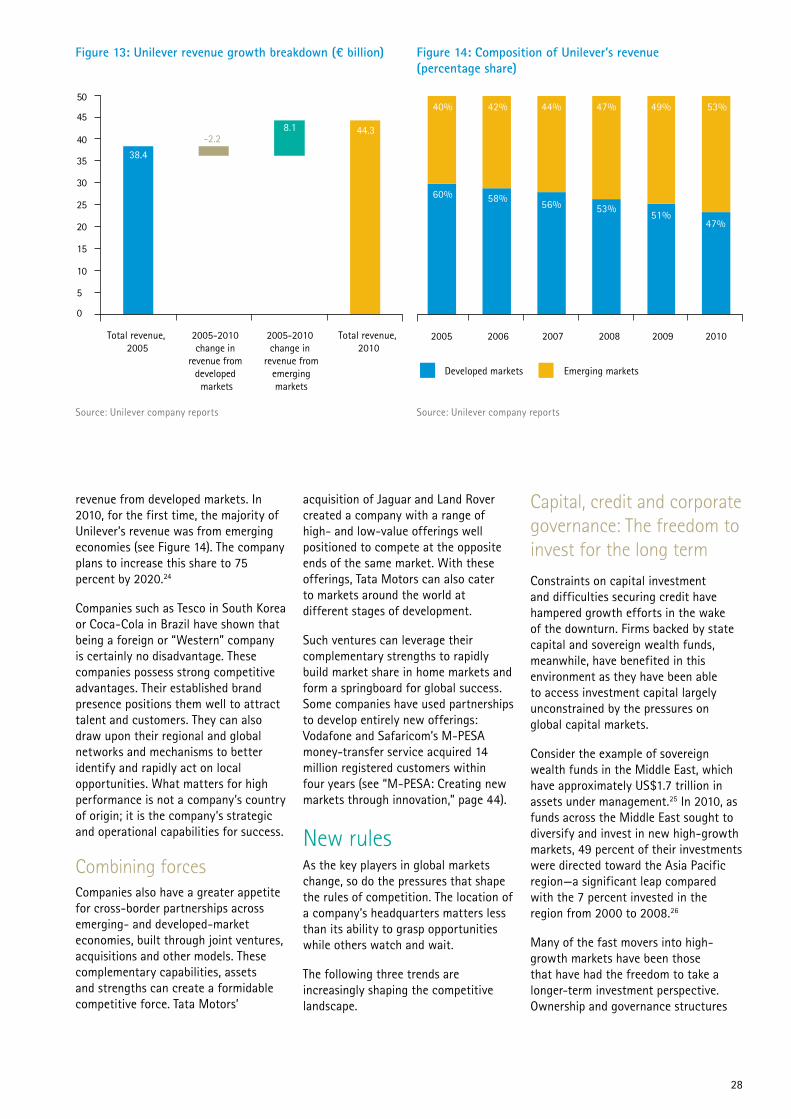
Seasoned global playersNotwithstanding the importance of competitors from emerging economies, it would be wrong to assume that they will dominate the next era of competition. Some of the best examples of success in high-growth markets have been multinationals based in developed markets. With a well-established presence in emerging economies, these companies are well positioned to combine their superior global scale and efficiency with their local knowledge and responsiveness. Many solidified their position during the downturn as their gains in emerging economies made up for the pain felt at home. For example, Figure 13 illustrates how, through its presence in emerging economies, Unilever sustained growth during the downturn despite shrinking
0%
10%
20%
30%
40%
50%
60%
70%
80%
90%
100%
2005 2006 2007 2008 2009 2010 2011
Developed Emerging
95
405
91
409
78
422
70
430
60
440
47
453
117
383
Source: Fortune Global 500, Accenture analysis
Figure 12: Fortune Global 500
28
38.4
-2.28.1 44.3
0
5
10
15
20
25
30
35
40
45
50
Total revenue, 2005
2005-2010 change in
revenue from developed
markets
2005-2010 change in
revenue from emerging
markets
Total revenue, 2010
60%
40%
58%
42%
56%
44%
53%
47%
51%
49%
47%
53%
2005 2006 2007 2008 2009 2010
Developed markets Emerging markets
Source: Unilever company reports
Figure 13: Unilever revenue growth breakdown (€ billion)
Source: Unilever company reports
Figure 14: Composition of Unilever’s revenue (percentage share)
revenue from developed markets. In 2010, for the first time, the majority of Unilever’s revenue was from emerging economies (see Figure 14). The company plans to increase this share to 75 percent by 2020.24
Companies such as Tesco in South Korea or Coca-Cola in Brazil have shown that being a foreign or “Western” company is certainly no disadvantage. These companies possess strong competitive advantages. Their established brand presence positions them well to attract talent and customers. They can also draw upon their regional and global networks and mechanisms to better identify and rapidly act on local opportunities. What matters for high performance is not a company’s country of origin; it is the company’s strategic and operational capabilities for success.
Combining forcesCompanies also have a greater appetite for cross-border partnerships across emerging- and developed-market economies, built through joint ventures, acquisitions and other models. These complementary capabilities, assets and strengths can create a formidable competitive force. Tata Motors’
acquisition of Jaguar and Land Rover created a company with a range of high- and low-value offerings well positioned to compete at the opposite ends of the same market. With these offerings, Tata Motors can also cater to markets around the world at different stages of development.
Such ventures can leverage their complementary strengths to rapidly build market share in home markets and form a springboard for global success. Some companies have used partnerships to develop entirely new offerings: Vodafone and Safaricom’s M-PESA money-transfer service acquired 14 million registered customers within four years (see “M-PESA: Creating new markets through innovation,” page 44).
New rulesAs the key players in global markets change, so do the pressures that shape the rules of competition. The location of a company’s headquarters matters less than its ability to grasp opportunities while others watch and wait.
The following three trends are increasingly shaping the competitive landscape.
Capital, credit and corporate governance: The freedom to invest for the long term
Constraints on capital investment and difficulties securing credit have hampered growth efforts in the wake of the downturn. Firms backed by state capital and sovereign wealth funds, meanwhile, have benefited in this environment as they have been able to access investment capital largely unconstrained by the pressures on global capital markets.
Consider the example of sovereign wealth funds in the Middle East, which have approximately US$1.7 trillion in assets under management.25 In 2010, as funds across the Middle East sought to diversify and invest in new high-growth markets, 49 percent of their investments were directed toward the Asia Pacific region—a significant leap compared with the 7 percent invested in the region from 2000 to 2008.26
Many of the fast movers into high-growth markets have been those that have had the freedom to take a longer-term investment perspective. Ownership and governance structures
29
play a role here, as certain models are less beholden to short-term shareholder demands. This freedom provides a distinct advantage in tasks such as product development or market planning. Of China’s 54 businesses in the Fortune Global 500, 41 are state-owned. While the total number of state-owned enterprises in China fell from 159,000 in 2003 to 114,500 in 2010, the total assets of those under central government control rose from RMB 3 trillion (US$473 billion) to RMB 20 trillion (US$3,150 billion).27 And though many of Brazil’s large companies are publicly listed, most of them are family-owned. The majority of India’s giant conglomerates still hold family names, and family members serve on boards.
Access and preferential treatment: The importance of relationshipsMore and more, relationships are shaping access to new market opportunities: business-to-business, business-to-government, government-to-government, as well as cross-sector relationships with civil society and non-governmental organizations (NGOs).
The resources and extractives sector is a case in point. Mining rights and access to natural resources are carefully controlled by host governments and are often granted to state-backed companies on the basis of high-level governmental agreements. In exchange for rights to extract more than 11 million tons of copper and 620,000 tons of cobalt in the Democratic Republic of Congo, China has agreed to build hundreds of clinics, hospitals and schools, two hydro-electric dams, 3,300km of road and 3,000km of railway there.28 As long-term investment deals brokered by governments seeking foreign expertise erect barriers to later entrants, the path to new opportunities for many companies may be blocked.
In other industries, access to opportunities may depend on cultivating relationships with the right partners. In the banking sector, acquisitions and joint ventures are a common route to entry. Banking has traditionally been an industry where market share is
difficult to steal. Africa, for example, was emerging as a compelling growth opportunity for global banks just as the financial crisis struck. Since then, companies less affected by the downturn have taken advantage of Africa’s more open playing field and snapped up the most lucrative partnerships and acquisitions. For example, the Industrial and Commercial Bank of China recently acquired 20 percent of South Africa’s Standard Bank and formed a commercial partnership for corporate banking services.29 And Bank of China partnered with Togo-based Ecobank, which operates widely across Africa, to facilitate trade and investments between Africa and Asia. Snapping up the most promising partners is a key advantage to moving fast in this sector.
Global efficiency and local responsiveness: Dual imperatives, not a trade-offThe most astute competitors in today’s fast-evolving opportunities combine global efficiency and scale with local relevance and responsiveness. For example, while Coca-Cola benefits from its global scale and brand, its local market understanding allows the company to offer 15 varieties of Fanta in Mexico.30 Such success requires a carefully designed international operating model: deep local market insights, such as preferences around packaging and the local palate, combined with flexible sales and distribution strategies that can respond to the local retail infrastructure.
Many companies grounded in efficiency advantages have built more targeted offerings to appeal to specific consumer groups. Players such as China’s Haier, Taiwan’s HTC and South Korea’s Samsung and LG have moved beyond their initial low-cost offerings to design products and services for a variety of income levels, cultural tastes and preferences. Haier has driven international expansion by tailoring its products to local markets: in China’s rural Sichuan province, Haier sells washing machines specifically designed and labeled to wash “clothes, sweet potatoes and peanuts.” In Africa, its
high-capacity machines are equipped to wash traditional gowns. And when LG expanded into the Indian market with a television set featuring on-screen display in the regional languages of Hindi, Tamil and Bengali, the “Sampoorna” sold more than 100,000 sets in the first year of its launch.31
With opportunity and competition difficult to evaluate and predict, companies often hesitate to invest. It is not surprising that the majority of businesses believe they need to accelerate their efforts to build market share—or that it may be already too late. As companies wait, they fear that the windows of opportunity are shrinking. They know the opportunities lie in high-growth markets. They know they need to accelerate their efforts. But what exactly should they be doing? What are the capabilities they need to build in order to succeed in high-growth markets? The following chapters seek to answer these questions.

30
Cencosud in Latin America established, through a focus on strong relationships, a regional foothold that is daunting to potential competitors. For supermarkets, chances of success are strongly influenced by access to the infrastructure and ecosystems that support their business. Appropriate real estate, and effective supplier and distribution networks, can make or break a venture. The right local-level relationships are critical because control over real estate and supply chains can sit in a small number of hands in high-growth markets. In an industry where market share really counts, relationships can provide the access needed to unlock opportunity and to establish a leading presence.
Cencosud has long been one of the key players in its home market of Chile, and the company is building on its domestic position to expand across Latin America. In stepping up its regional expansion, the company
looked to acquire well-entrenched players in high-growth markets, such as the Wong Group in Peru, thereby gaining access to established infrastructure and relationships. These acquisitions—13 in just 10 years—have enabled the company to expand rapidly across the region, driving year-on-year growth of more than 25 percent. Cencosud is now the leading or No. 2 supermarket retailer in three of the four countries in which it operates.32
Cencosud’s competitive position is raising the stakes for other retailers attempting to gain a foothold in these high-growth markets. New entrants, whether regional or global retailers, will be pitted against Cencosud’s mastery of local knowledge and relationships.
Cencosud: Retail relations
31
A new map of global trade and investment is emerging. The dominance of developed economies is being challenged, and the last ten years alone have seen a sharp transformation in the dynamics of global trade. The implications are far reaching, not least in giving a clue as to where the future hubs of opportunity and competition will lie.
The journey to multidirectional trade over the past decade has three distinct phases (see Figure 15).
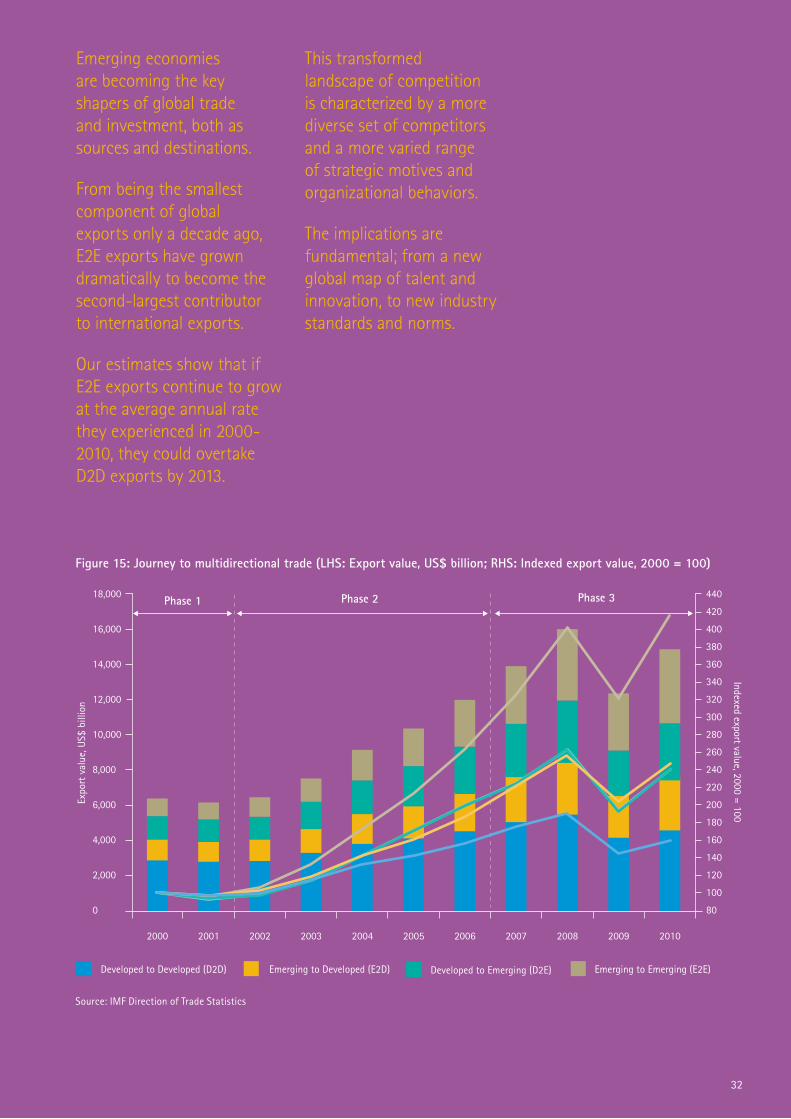
Phase 1Before 2002, the majority of global trade took place between developed economies. For example, just ten years ago, 47 percent of world exports excluded emerging economies completely. Exports between emerging economies accounted for just 15 percent of total exports in 2000. Emerging economies were largely perceived as sources of raw materials. The triad economies of the United States, Japan and the European Union determined the norms and rules of business. However, China’s accession to the World Trade Organization in 2001 marked a turning point, opening up China’s vast potential as an exporter, particularly of manufactured goods, to the rest of the world.
Phase 2From 2002 to 2006, E2E exports averaged 25 percent annual growth. By 2003, they overtook exports from developed to emerging economies, and by 2006 E2E exports overtook those from emerging to developed economies. Exports between developed economies remained the dominant component of global trade. But their relative share declined during this period, from 53 percent in 2002 to 38 percent by 2006.
Phase 3The third phase, heralded by the global downturn, is still under way. It is characterized by the resilience of exports between emerging economies. E2E exports have grown from the smallest component of global trade to the second-largest contributor to international exports, just behind D2D (developed market to developed market) exports. Our estimates suggest that if E2E exports continue to grow at the average annual rate they experienced from 2000 to 2010, they could overtake D2D exports by 2013.
The journey to multidirectional trade
32
Figure 15: Journey to multidirectional trade (LHS: Export value, US$ billion; RHS: Indexed export value, 2000 = 100)
Source: IMF Direction of Trade Statistics
80
100
120
140
160
180
200
220
240
260
280
300
320
340
360
380
400
420
440
0
2,000
4,000
6,000
8,000
10,000
12,000
14,000
16,000
18,000
2000 2001 2002 2003 2004 2005 2006 2007 2008 2009 2010
Indexed export value, 2000 = 100
Expo
rt v
alue
, US$
bill
ion
Phase 1 Phase 2 Phase 3
Developed to Developed (D2D) Emerging to Developed (E2D) Developed to Emerging (D2E) Emerging to Emerging (E2E)
Emerging economies are becoming the key shapers of global trade and investment, both as sources and destinations.
From being the smallest component of global exports only a decade ago, E2E exports have grown dramatically to become the second-largest contributor to international exports.
Our estimates show that if E2E exports continue to grow at the average annual rate they experienced in 2000-2010, they could overtake D2D exports by 2013.
This transformed landscape of competition is characterized by a more diverse set of competitors and a more varied range of strategic motives and organizational behaviors.
The implications are fundamental; from a new global map of talent and innovation, to new industry standards and norms.
33
Rethinking capabilities: The roadmap to success
Business leaders realize that they need to step up their search for growth—and that old approaches will not be suitable for the new competitive landscape. Some 57 percent of respondents to our survey acknowledge that they need to “reassess” or “fundamentally rethink” their approaches and capabilities to compete and win in high-growth markets.
Moreover, our research unearthed key differences between successful and unsuccessful companies in high-growth markets. Successful companies think differently about the capabilities critical for growth and prioritize investments in different ways.
In our research, we were keen to understand the perceptions and the actions of two particular sample groups:
Successful globalizers We looked at companies that have had a track record of successful performance during recent years and are also confident and committed about their future growth in high-growth markets. Specifically, they are defined by the following characteristics, based on their responses to our survey:
• They are primarily looking at emerging economies for their next stage of growth.
• They are planning to increase investment in their target high-growth markets over the next three years.
• They believe they have an accurate understanding of the size of opportunities in emerging economies.
• They believe they fully understand the competitive dynamics that they face in these markets.
• They believe they possess the strategic and operational capabilities to fully grasp those opportunities.
• In the past three years, their company revenue and profits in high-growth markets have developed in line with, or faster than, their expectations.
In 2010, 61 percent of these successful globalizers experienced global revenue growth of 5 percent or more.
Disappointed globalizersWe also looked at companies that are committed to growing in high-growth markets but that have been disappointed by their performance to date. They are defined by the following characteristics:
• They are primarily looking at emerging economies for their next stage of growth.
• In the past three years, their company revenue and profits in high-growth markets have developed slower than they expected.
Keys to high performanceOur research uncovers three capability areas that successful globalizers excel at relative to their peers, particularly in comparison with disappointed globalizers:
1. Sizing the future: The ability to accurately size, time and prioritize demand opportunities around the world.
2. Shaping the future: The insights and capabilities to cultivate and protect future demand in high-growth markets.
3. Seizing the future: The operational agility and flexibility to adapt and reorient the company to grasp opportunities across high-growth markets.
The following chapters look at each of these capability areas in depth.
57% of respondents to our survey acknowledge that they need to “reassess” or “fundamentally rethink” their approaches and capabilities to compete and win in high-growth markets.

34
Accenture conducted an extensive research program to investigate the keys to success in today’s hyper-competitive high-growth markets.
The main elements of research include:
• Household income analysis, in collaboration with Oxford Economics. We created five standard bands of annual household income and, for each of 64 countries, estimated the number of households falling into each band in 2010, 2015 and in 2020. All forecasts are measured in real terms, and at market exchange rates.
• Industry consumption curves, in collaboration with Oxford Economics. This unique research maps the evolution of a select group of industries across the world. It also includes scenario-based sensitivity analysis that assesses the impact of changes in the business and policy environment.
• A survey of 588 business leaders, across 85 countries and 22 industries, conducted by the Economist Intelligence Unit. Business leaders were asked about their perceptions of the competitive landscape, their company’s plans for growth and the capabilities important for success in these markets.
• Conversations with clients and experts across industries and extensive secondary research, including company case studies and analysis of greenfield and M&A investment data.

Our research suggests that successful globalizers in high-growth markets adopt new approaches to assessing potential market opportunity. The distinction becomes clearer when we compare them with firms that have been disappointed by their performance in high-growth markets.
Traditionally, companies looking to enter new markets might construct country-by-country business cases, or segment opportunities by common language, for example. Successful globalizers take a more dynamic view that incorporates flexibility and foresight into strategic planning.
First, they are more adept at examining global opportunities through multiple lenses, to find where and when demand will arise. Witness companies that have successfully targeted diaspora communities scattered across the world, or specific high-potential customer segments, such as those in water-scarce areas, rural communities or newly-empowered female populations. In this way, successful globalizers develop a more complete and realistic understanding of the markets in which they intend to operate.
Second, in a rapidly-changing business environment, these companies understand better than their competitors the importance of planning over time horizons, allowing them to sequence and prioritize their investments. Our research, conducted in partnership with Oxford Economics, illustrates the importance of identifying where different markets will sit in terms of their consumption of specific products and services. How close are they to reaching a point where demand rapidly takes off? How close are they to market maturity? What are the opportunities of different markets over different time horizons?
This deep understanding of their target markets allows successful globalizers to become masters of strategic positioning: to be not only where opportunities are today, but where they will be tomorrow. Through their superior ability to discern the size, location and timing of opportunities, these companies make more informed decisions and trade-offs around where and when to invest, and remain several moves ahead of the competition.
Getting the “where” and the “when” rightSizing and timing opportunities across high-growth markets is complex. The evolution of household income over the next decade—an indicator of potential consumer buying power—underscores its importance. For example, from 2010 to 2020, Turkey’s share of households with an annual income above US$50,000 is estimated to nearly double, from 18 percent to 34 percent. This translates into an additional 3.6 million households in that income segment, representing total household income of US$380 billion.
But the accurate assessment of addressable opportunities is only a first step. Planning over time horizons is becoming a critical capability, as consumption levels evolve at a variety of speeds around the world. In this complex and volatile environment, understanding these dynamics, and using this understanding to evaluate trade-offs and guide decisions about when, where and how to enter high-growth markets, will be critical to success. Some markets may offer immediate opportunities, while others may be poised for more significant growth in the longer term.
One way to build this understanding is through in-depth analysis of consumption curves for companies’ products and services. By analyzing consumption curves, companies can identify the optimal entry point for a particular target market. For example, in our analysis “In focus: Consumption curves” (see page 23), we see that the non-life insurance market has a long growth phase. Entering too early can be as damaging as entering too late. This type of analysis also offers clues to appropriate routes of entry. For example, in a country where demand is still in its infancy, companies have more time to build partnerships with local players and gradually cultivate their customer base. In a more mature market, entry through acquisition might be more attractive.
Cross-country consumption forecasts can also identify countries at similar stages of market development. Such insights open opportunities to share lessons across markets and to build scale and synergy into market entry plans. For example, our analysis shows that Mexico, Slovakia and Turkey are on the cusp of rapid demand growth for passenger cars.
Successful globalizers recognize that superior market assessment capabilities, such as analysis of household incomes and product consumption curves, give them an edge. For example, 75 percent of successful globalizers said that looking at the size of potential consumer purchasing power is critical for growth. Among disappointed companies, only 42 percent had similar feelings.
We now look at some of the specific ways in which successful globalizers differentiate themselves and build an in-depth understanding of their target high-growth markets.
35
Sizing the future: Assessing where and when to act
36
As it pursues an ambitious goal of adding 800 million new consumers between 2010 and 2015, Procter & Gamble (P&G) is actively targeting the underserved—those it calls the “$2-a-day” consumers. In a significant shift in strategy, P&G is moving beyond its traditional focus on high-end beauty and personal care to build new markets at the “bottom of the pyramid,” seeking to reach consumer segments across high-growth markets through a deep understanding of their needs and preferences.
Realizing that future opportunities lie predominantly in emerging economies, P&G has invested significant time, money and management attention to aggressive expansion in these markets. CEO Robert McDonald speaks of “shifting the center of gravity” of the company’s innovation away from top-end products and toward innovation that reaches underserved consumers.
To achieve this goal, P&G has established the Beijing Innovation Center. While the company has 25 innovation centers across the world, the US$70 million investment in the Beijing center provides a base for P&G researchers to collect insights from across the world. These insights will drive cross-country groupings of consumers and products designed to serve their specific needs and living conditions. The unit is focused on discovering cross-country insights: product researchers frequently travel across multiple countries and regions to test potential products in the field.
This approach has already provided critical market insights. Last year, P&G targeted the notoriously challenging male grooming market in India. Through field research, product developers discovered that previous international brands of men’s razors had failed because of poor access to running water in India’s rural communities. In response, the company launched an affordable razor that uses less water. Within three months of launch, Gillette Guard became the best-selling razor in India and today represents more than half of the razors sold in the country. Building on its rural customer insights, P&G is developing new cleansing and hair-care products specifically designed to be effective in water-scarce conditions across China, India, Africa and Latin America.
Following the success of the Beijing Innovation Center, P&G plans to invest US$250 million in a new innovation center in Singapore as a “connect and develop” hub. The hub will meld insights from customers and local stakeholders to co-create appropriate products that help P&G ensure that it has the right products in the right place at the right time.
Procter & Gamble: Designing for the $2-a-day consumer
75% of successful globalizers said that looking at the size of potential customer purchasing power is critical for growth, compared with 42% of disappointed globalizers.
37
Segment to seek new customer groupings
Successful companies stand out through their focus on segmentation techniques that create customer groupings that are relevant both within and across high-potential markets. According to our survey, 82 percent of successful globalizers believe that this is critical for growth, compared with 64 percent of disappointed globalizers (see Figure 16). Successful globalizers are also more likely to devote adequate time, money and attention to building this capability, with 78 percent saying they do so, compared with only 45 percent of disappointed globalizers.
Approaching segmentation in distinctive waysSuccessful companies use advanced techniques to analyze demand. Seventy-five percent highlight the critical role of understanding the size of potential customer purchasing power, compared with only 42 percent of disappointed companies (see Figure 17). Successful companies are also more likely to identify synergies through an understanding of similar business environments before making country groupings—41 percent of successful globalizers achieve this understanding, nearly double the amount of disappointed companies (22 percent). On the contrary, successful globalizers do not make strategic growth plans based on easy and conventional criteria, such as targeting locations with a common language. Disappointed globalizers are twice as likely to do so.
Identifying cross-country segmentsToday’s tech-savvy young adults in Mumbai have more in common with their peers in New York than with youngsters in rural India. Affluent consumers in Shanghai are more likely to buy the same luxury products as high-income consumers in Paris. Alongside their geographic strategies, companies should identify segments that cut across national borders. Emerging-market strategies have traditionally focused on tailoring products to specific local needs. While understanding local tastes and preferences is essential, companies should also find cross-country opportunities to enable greater operational scale. Restricting segmentation to a country-by-country approach may hide lucrative opportunities that could be uncovered by a cross-country business case.
The world’s diaspora populations, for example, provide a vast pool of well-networked consumers with similar tastes and preferences that companies can tap to develop cross-border segments. There are more Chinese people living outside China than there are French people living in France.33 Dabur, the Indian consumer goods company, has adopted an international growth strategy that leverages the expansive Indian diaspora. Dabur created a cross-country customer segment that spans South Asia and the Middle East, based upon similarities in hair-care preferences: it launched Dabur Amla, a hair oil, in Bangladesh, Pakistan and the United Arab Emirates. Dabur plans to use its success among the Indian diaspora as a springboard for broader growth in new segments of global consumer markets.34
France Telecom’s Orange brand is another example. As the firm analyzed strategic segments across its African and Middle Eastern markets, it found that, regardless of nationality, consumers share a need for very low-cost, easy-to-use telephone services. In response, Orange launched innovative services such as Bonus Zone, which offers special prices when network traffic is low. For the illiterate, Orange launched Voice SMS, a service for short voice messages offered at the same price as an SMS. Orange discovered a specific consumer segment for this service that spans Botswana, Cameroon, Côte d’Ivoire, Egypt and Madagascar.35
Procter & Gamble (see “Procter & Gamble: Designing for the $2-a-day consumer,” page 36) has identified new market segments through similarities in living conditions. The company has focused on products that address consumer challenges in water-scarce areas: razors that require less rinsing, for example, or detergents that are effective with minimal water. As water scarcity becomes an ever-greater global challenge, this segment may offer further opportunities to scale the business around the world.
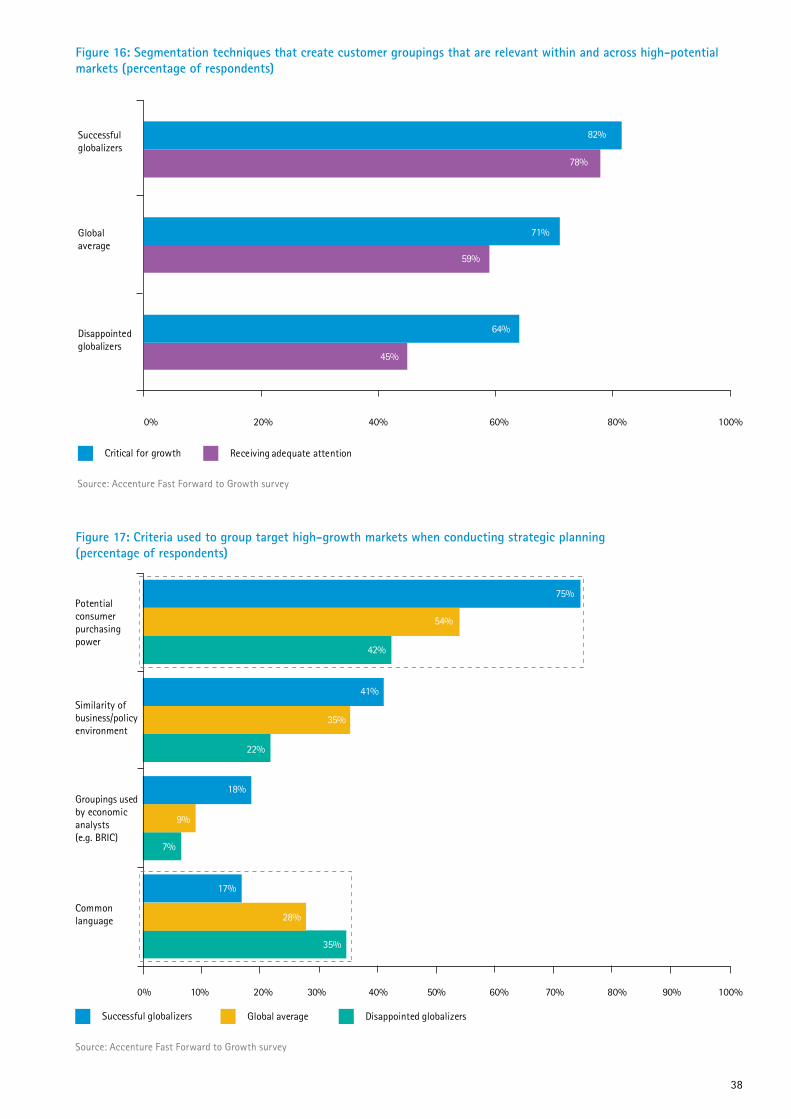
Source: Accenture Fast Forward to Growth survey
Source: Accenture Fast Forward to Growth survey
38
Figure 16: Segmentation techniques that create customer groupings that are relevant within and across high-potential markets (percentage of respondents)
45%
59%
78%
64%
71%
82%
0% 20% 40% 60% 80% 100%
Disappointedglobalizers
Global average
Successful globalizers
12%
Critical for growth Receiving adequate attention
Figure 17: Criteria used to group target high-growth markets when conducting strategic planning (percentage of respondents)
7%
9%
18%
22%
35%
41%
35%
28%
17%
42%
54%
75%
10% 30% 50% 70% 90%0% 20% 40% 60% 80% 100%
Successful globalizers Global average
Common language
Groupings used by economic analysts (e.g. BRIC)
Similarity of business/policy environment
Potential consumerpurchasing power
Disappointed globalizers
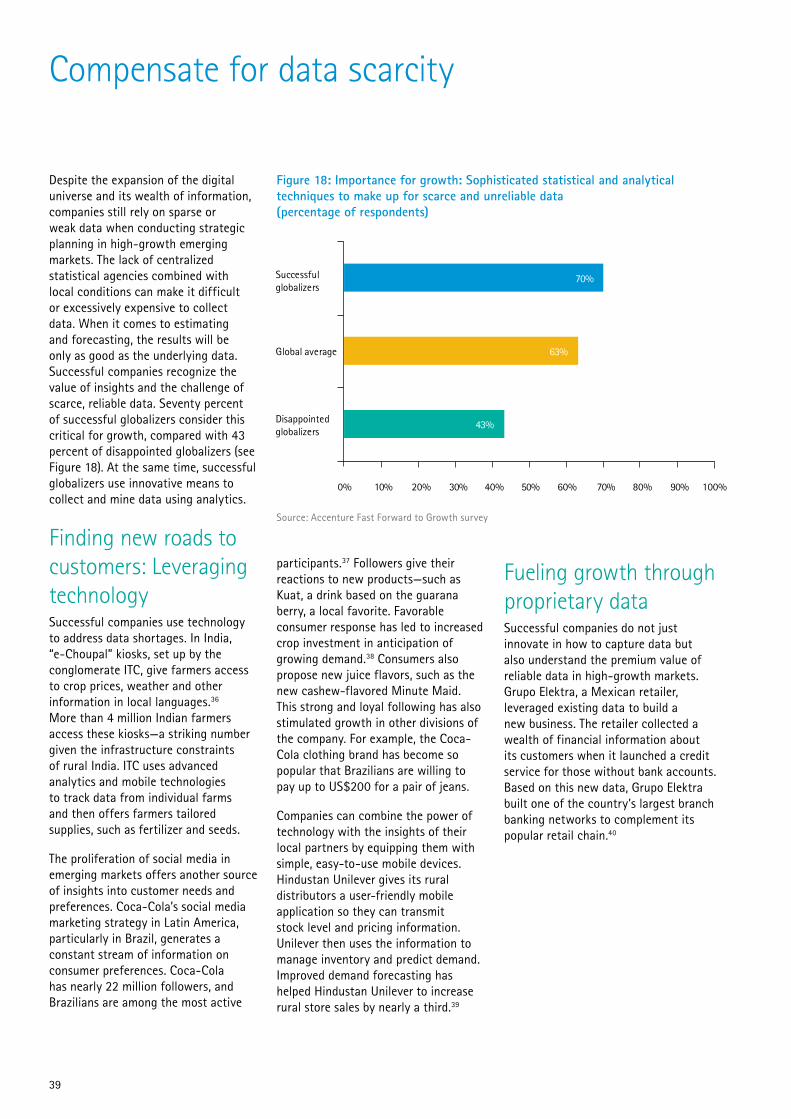
39
Compensate for data scarcity
Despite the expansion of the digital universe and its wealth of information, companies still rely on sparse or weak data when conducting strategic planning in high-growth emerging markets. The lack of centralized statistical agencies combined with local conditions can make it difficult or excessively expensive to collect data. When it comes to estimating and forecasting, the results will be only as good as the underlying data. Successful companies recognize the value of insights and the challenge of scarce, reliable data. Seventy percent of successful globalizers consider this critical for growth, compared with 43 percent of disappointed globalizers (see Figure 18). At the same time, successful globalizers use innovative means to collect and mine data using analytics.
Finding new roads to customers: Leveraging technologySuccessful companies use technology to address data shortages. In India, “e-Choupal” kiosks, set up by the conglomerate ITC, give farmers access to crop prices, weather and other information in local languages.36 More than 4 million Indian farmers access these kiosks—a striking number given the infrastructure constraints of rural India. ITC uses advanced analytics and mobile technologies to track data from individual farms and then offers farmers tailored supplies, such as fertilizer and seeds.
The proliferation of social media in emerging markets offers another source of insights into customer needs and preferences. Coca-Cola’s social media marketing strategy in Latin America, particularly in Brazil, generates a constant stream of information on consumer preferences. Coca-Cola has nearly 22 million followers, and Brazilians are among the most active
Figure 18: Importance for growth: Sophisticated statistical and analytical techniques to make up for scarce and unreliable data (percentage of respondents)
43%
63%
70%
10% 30% 50% 70% 90%0% 20% 40% 60% 80% 100%
Disappointed globalizers
Global average
Successful globalizers
participants.37 Followers give their reactions to new products—such as Kuat, a drink based on the guarana berry, a local favorite. Favorable consumer response has led to increased crop investment in anticipation of growing demand.38 Consumers also propose new juice flavors, such as the new cashew-flavored Minute Maid. This strong and loyal following has also stimulated growth in other divisions of the company. For example, the Coca-Cola clothing brand has become so popular that Brazilians are willing to pay up to US$200 for a pair of jeans.
Companies can combine the power of technology with the insights of their local partners by equipping them with simple, easy-to-use mobile devices. Hindustan Unilever gives its rural distributors a user-friendly mobile application so they can transmit stock level and pricing information. Unilever then uses the information to manage inventory and predict demand. Improved demand forecasting has helped Hindustan Unilever to increase rural store sales by nearly a third.39
Fueling growth through proprietary dataSuccessful companies do not just innovate in how to capture data but also understand the premium value of reliable data in high-growth markets. Grupo Elektra, a Mexican retailer, leveraged existing data to build a new business. The retailer collected a wealth of financial information about its customers when it launched a credit service for those without bank accounts. Based on this new data, Grupo Elektra built one of the country’s largest branch banking networks to complement its popular retail chain.40
Source: Accenture Fast Forward to Growth survey

40
41
Anticipate emerging competitors
Accurately measuring fast-evolving windows of opportunity requires an assessment of current demand, future demand and the component within each of these that is accessible. An accurate analysis of the accessible demand cannot be carried out without understanding the dynamics of both demand and competition.
Successful companies emphasize competitor analysis techniques to anticipate and evaluate emerging competitive threats, both from adjacent industries and from new geographic locations. Eighty-one percent of business executives from successful companies agreed that this capability is critical to their company’s success in high-growth markets (see Figure 19).
Locating the future hotspots of competitionAt the macro level, mapping the volume and shape of trade and investment flows can help to locate future hotspots of competition. Companies can also look for opportunities and challenges that emerge from government strategies, such as “going out” initiatives (where governments encourage local companies to invest abroad), nurturing of national champions or strategic plans to build advantage in specific sectors. For example, Malaysia’s Economic Transformation Programme, launched in October 2010, is the country’s roadmap toward its aim of becoming a high-income country. The roadmap includes a target of 6 percent annual growth and a focus on 12 strategic sectors, including tourism, financial services, palm oil and electronics.41 New economic cooperation plans
between emerging economies, such as trade and investment agreements, are also reshaping the business landscape. For example, Mexico and some South American countries—Uruguay, Paraguay and Peru—want to establish mutually beneficial trade pacts with India, particularly around information technology.42 Keeping track of future competition can boost strategic planning efforts and reveal new options for partnerships or acquisitions.
Looking beyond your industry’s traditional boundariesSuccessful companies keep an eye on emerging competitors from adjacent industries, or industries further afield. As technology and business model innovation continue to blur the boundaries between industries, a keen knowledge of competitive threats from multiple sources is crucial. The decline of DVD rental stores, bookshops and music retailers is a cautionary tale of companies that failed to identify and adapt to this shift. Companies that are alert to such trends have a sharper lens to spot new competitors and business options. Nestlé, for example, used its broad, loyal customer base to enter the pharmaceuticals sector. In 2010 it created a health science business to develop products that tackle obesity and chronic ailments such as heart disease.43 Similarly, Google is no longer just a search engine. For example, the company operates in the smartphone market, through its stake in the Android software and its plans to acquire Motorola Mobility,44 and also in the renewable energy market, through its investments in wind energy projects.45
Likewise, some competitors are structured around their presence in multiple industries. The growth model of Indian conglomerates, such as the Tata Group or the Aditya Birla Group, is based on expansion into new industries—their success in one market can be a buffer for cycles in other industries, or provide a steppingstone to entering new markets.
Preparing for your next victoryCompanies cannot expect their competitive advantage to last as long as they may have been accustomed to. In fact, research shows that the average lifespan of a Standard & Poor’s 500 company is shortening.46 To remain relevant, companies must move beyond anticipating the influx of new competitors. They must continually plan their next venture and build capabilities for its success. Enterprises must have a foot in the opportunities of today and tomorrow. Apple is an example of a company using product innovation to stay ahead of competitors. While redesigning new versions of its iPhone, Apple was developing its iPad tablet. It beat competitors to the market and forced them to scramble to offer alternatives.
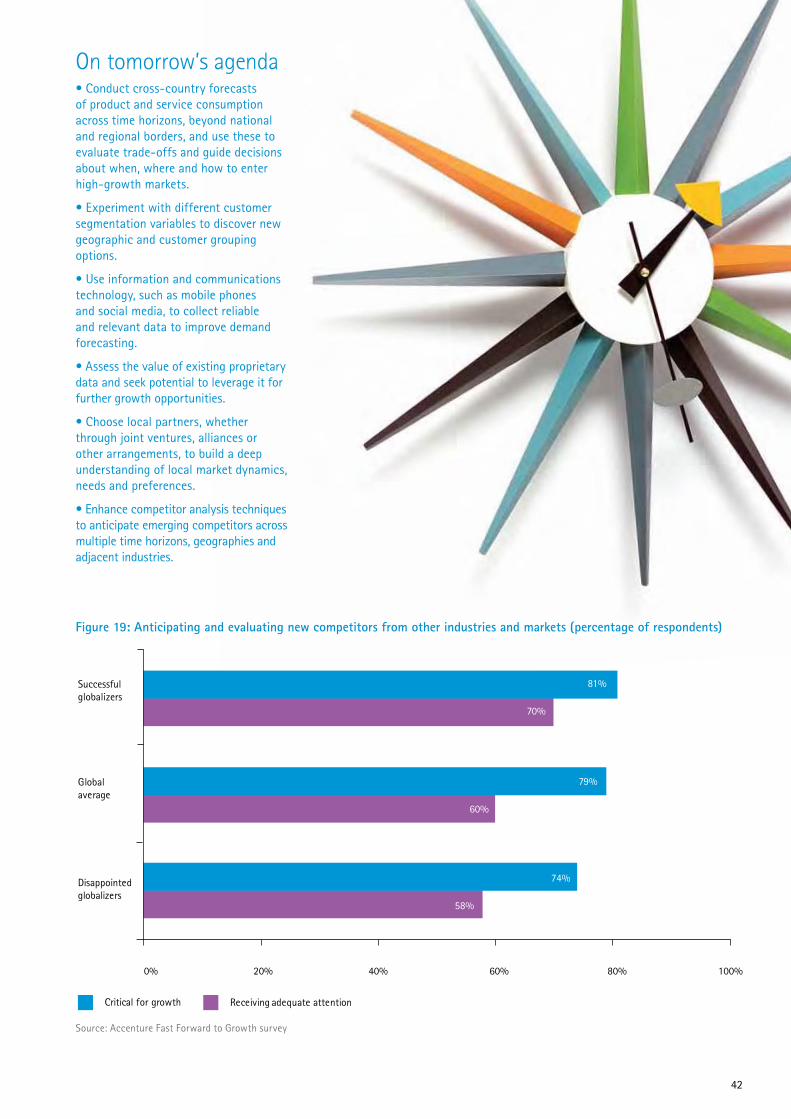
42
Figure 19: Anticipating and evaluating new competitors from other industries and markets (percentage of respondents)
58%
60%
70%
74%
79%
81%
0% 20% 40% 60% 80% 100%
Disappointedglobalizers
Global average
Successful globalizers
12%
Critical for growth Receiving adequate attention
Source: Accenture Fast Forward to Growth survey
On tomorrow’s agenda• Conduct cross-country forecasts of product and service consumption across time horizons, beyond national and regional borders, and use these to evaluate trade-offs and guide decisions about when, where and how to enter high-growth markets.
• Experiment with different customer segmentation variables to discover new geographic and customer grouping options.
• Use information and communications technology, such as mobile phones and social media, to collect reliable and relevant data to improve demand forecasting.
• Assess the value of existing proprietary data and seek potential to leverage it for further growth opportunities.
• Choose local partners, whether through joint ventures, alliances or other arrangements, to build a deep understanding of local market dynamics, needs and preferences.
• Enhance competitor analysis techniques to anticipate emerging competitors across multiple time horizons, geographies and adjacent industries.
43
Shaping the future: Seeding tomorrow’s growth
While some companies may feel they are too late to secure their position in high-growth markets, our research shows that successful globalizers do not simply accept that windows of opportunity are shrinking. Instead, they open new windows of opportunity by shaping and seeding future demand.
Most businesses today accept the need to engage with local stakeholders in order to gain a licence to operate and increase their penetration and market share. Many companies have gone further, appreciating the need to collaborate with governments and other actors, and to invest in the communities in which they operate, in order to drive economic development and higher incomes.
But our research finds that successful globalizers go further still: they are not content to simply push for increased sales that will come about as incomes rise. They aspire to “shift their consumption curve,” rather than just move along it. They are not just looking to scramble for market share; rather, they want to increase the overall size of the market, as well as their share of it. And critically, they understand the strategies and capabilities required to extend the frontiers of opportunity in this way.
Our analysis, in collaboration with Oxford Economics, demonstrates the impact, in real consumption opportunities, that can be achieved when businesses invest in generating future demand. For example, our analysis examines how demand can be measurably increased through improvements in infrastructure, education and health care.
The analysis presented in “Shape your consumption curve: Building digital pathways” (see page 49) details how businesses can increase and bring forward demand by engaging in policy development and infrastructure building. The scenarios outlined in “Shifting consumption curves: The value of disruptive innovation” (see page 51) illustrate the potential rewards for companies with a deep commitment to consumer-focused innovation. Companies should not underestimate the potential to influence consumer trends and shape their next opportunity.
Successful globalizers place significantly greater emphasis on specific capabilities that seed future growth. They invest in relationships with local stakeholders and design flexible business models that can adapt to local circumstances. They share and scale successful innovations that can uncover and generate new demand. Finally, they create strategies and processes that encourage sustainable growth.
44
The sudden explosion of M-PESA in Kenya shows how companies can actively shape future opportunities through innovation that targets the fulfillment of unmet needs. Vodafone’s M-PESA platform, which now generates 16 percent of local partner Safaricom’s revenue, was launched in March 2007 to provide a system of electronic peer-to-peer payment for consumers in Kenya. In a country where 40 percent of the people had no access to financial services, but a similar share owned a mobile phone, M-PESA offered a new platform to meet the needs of those without bank accounts.47
The platform addresses a particular need in Kenyan society, to send money to family at home: 17 percent of Kenyan households depend on remittances from relatives working away from home as their primary source of income.48 M-PESA aims to reduce the high cost of sending money across the country and to remove the risks of doing so. The solution is a simple-to-use mobile phone application, supported by a network of branded retail outlets across Kenya that tap into the strong consumer trust in the Safaricom brand.
By serving the unmet needs of Kenyan consumers, M-PESA has grown quickly, achieving 14 million registered customers within four years. This corresponds to 81 percent of Safaricom’s customer base, two-thirds of Kenyan adults, and 35 percent of the entire population.49 M-PESA has achieved US$320 million per month in person-to-person transfers, equal to approximately 10 percent of Kenyan GDP.50
The success of M-PESA illustrates how companies can create and grasp opportunities to build an entirely new market so quickly that competitors barely have a chance to catch up. Vodafone and Safaricom laid the foundations for success by taking an innovative approach to the nascent market for financial services, designing a product from the bottom up to meet specific local needs, quickly establishing market incumbency and rapidly rolling out M-PESA across the country. In the Kenyan market, the incumbency advantages enjoyed by M-PESA have created a challenging environment for would-be competitors: only one in five of alternative branchless banking services have passed the one million user mark, compared with M-PESA’s 14 million.51
M-PESA’s success is not limited to its initial products. The partnership has extended its initial product offering to launch M-KESHO accounts, which offer micro-savings, micro-credit and micro-insurance to M-PESA customers. And success is not limited to Kenya: Vodafone is combining its Kenyan experience with its global reach to enter into new ventures in Tanzania, South Africa and Afghanistan, and the company has identified India as the next big opportunity for growth.
M-PESA: Creating new markets through innovation
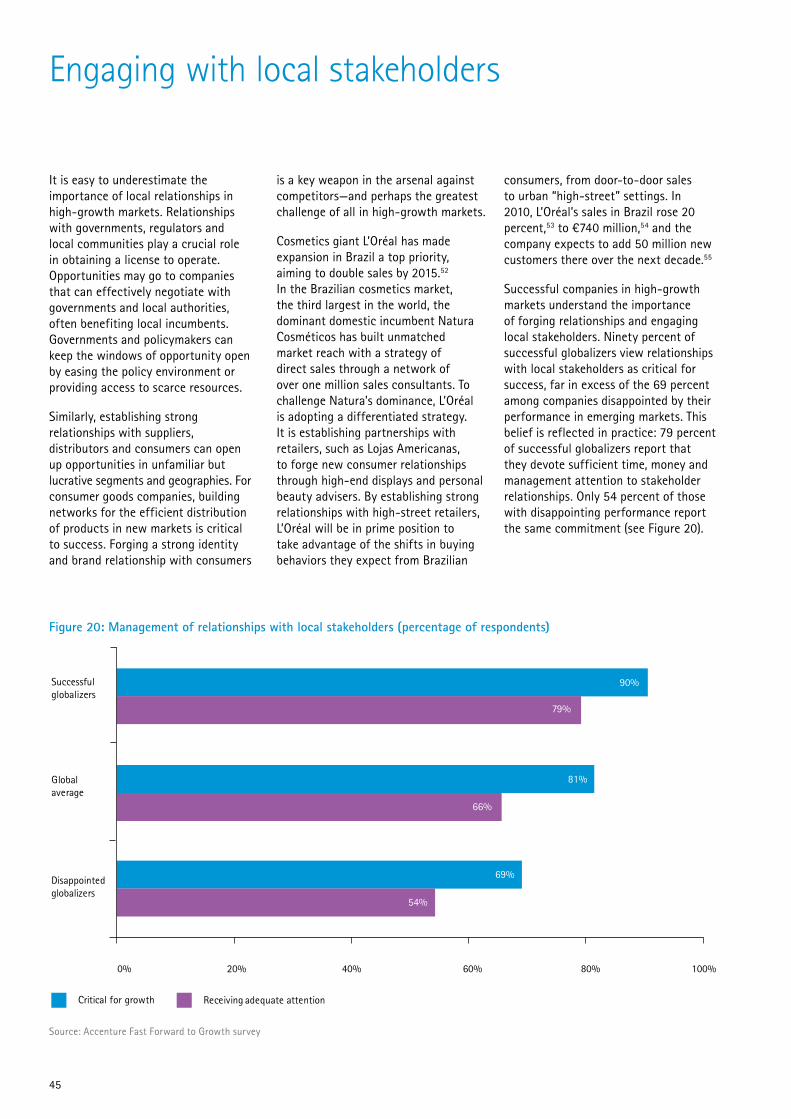
45
Engaging with local stakeholders
It is easy to underestimate the importance of local relationships in high-growth markets. Relationships with governments, regulators and local communities play a crucial role in obtaining a license to operate. Opportunities may go to companies that can effectively negotiate with governments and local authorities, often benefiting local incumbents. Governments and policymakers can keep the windows of opportunity open by easing the policy environment or providing access to scarce resources.
Similarly, establishing strong relationships with suppliers, distributors and consumers can open up opportunities in unfamiliar but lucrative segments and geographies. For consumer goods companies, building networks for the efficient distribution of products in new markets is critical to success. Forging a strong identity and brand relationship with consumers
is a key weapon in the arsenal against competitors—and perhaps the greatest challenge of all in high-growth markets.
Cosmetics giant L’Oréal has made expansion in Brazil a top priority, aiming to double sales by 2015.52 In the Brazilian cosmetics market, the third largest in the world, the dominant domestic incumbent Natura Cosméticos has built unmatched market reach with a strategy of direct sales through a network of over one million sales consultants. To challenge Natura’s dominance, L’Oréal is adopting a differentiated strategy. It is establishing partnerships with retailers, such as Lojas Americanas, to forge new consumer relationships through high-end displays and personal beauty advisers. By establishing strong relationships with high-street retailers, L’Oréal will be in prime position to take advantage of the shifts in buying behaviors they expect from Brazilian
consumers, from door-to-door sales to urban “high-street” settings. In 2010, L’Oréal’s sales in Brazil rose 20 percent,53 to €740 million,54 and the company expects to add 50 million new customers there over the next decade.55
Successful companies in high-growth markets understand the importance of forging relationships and engaging local stakeholders. Ninety percent of successful globalizers view relationships with local stakeholders as critical for success, far in excess of the 69 percent among companies disappointed by their performance in emerging markets. This belief is reflected in practice: 79 percent of successful globalizers report that they devote sufficient time, money and management attention to stakeholder relationships. Only 54 percent of those with disappointing performance report the same commitment (see Figure 20).
Figure 20: Management of relationships with local stakeholders (percentage of respondents)
54%
66%
79%
69%
81%
90%
0% 20% 40% 60% 80% 100%
Disappointedglobalizers
Global average
Successful globalizers
Critical for growth Receiving adequate attention
Source: Accenture Fast Forward to Growth survey
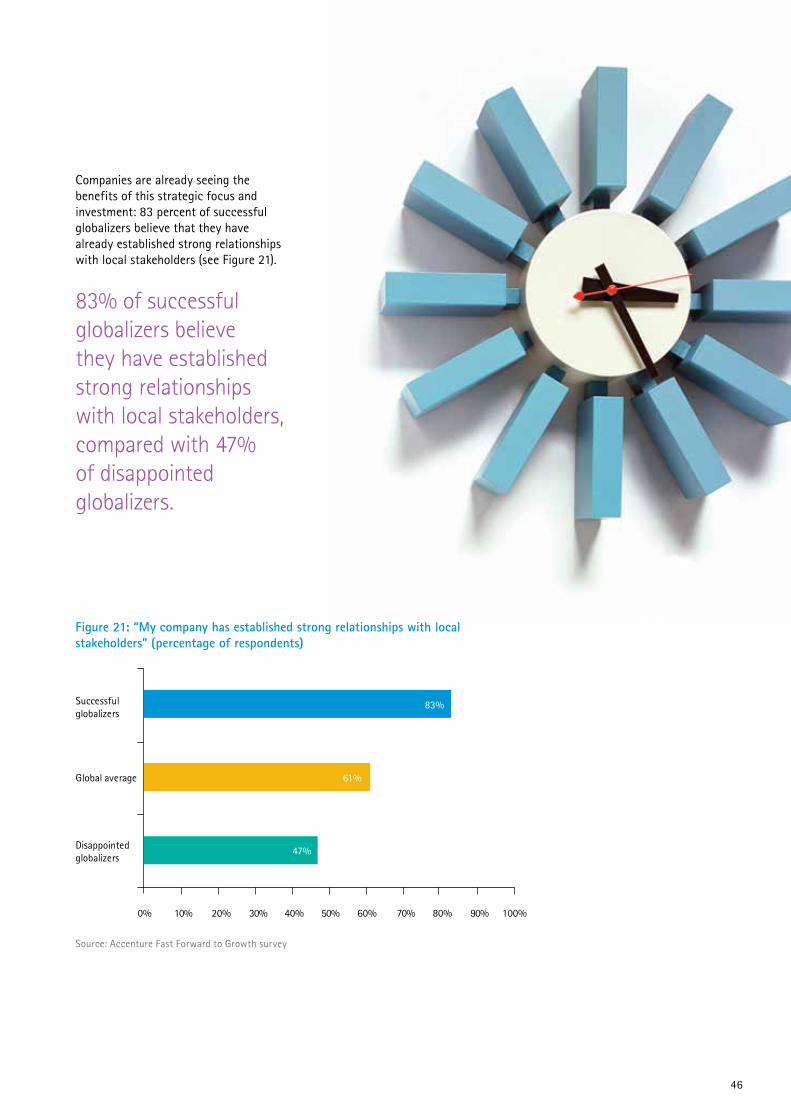
46
Figure 21: “My company has established strong relationships with local stakeholders” (percentage of respondents)
47%
61%
83%
10% 30% 50% 70% 90%0% 20% 40% 60% 80% 100%
Disappointed globalizers
Global average
Successful globalizers
83% of successful globalizers believe they have established strong relationships with local stakeholders, compared with 47% of disappointed globalizers.
Companies are already seeing the benefits of this strategic focus and investment: 83 percent of successful globalizers believe that they have already established strong relationships with local stakeholders (see Figure 21).
Source: Accenture Fast Forward to Growth survey
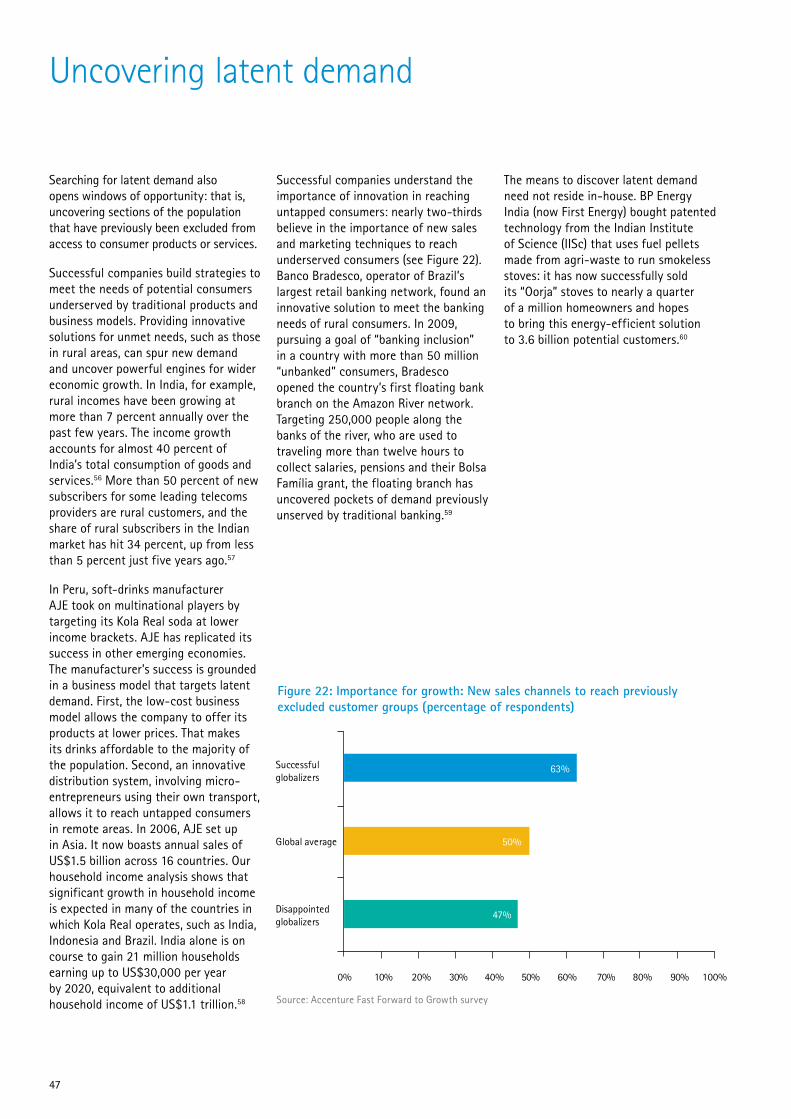
47
Uncovering latent demand
Searching for latent demand also opens windows of opportunity: that is, uncovering sections of the population that have previously been excluded from access to consumer products or services.
Successful companies build strategies to meet the needs of potential consumers underserved by traditional products and business models. Providing innovative solutions for unmet needs, such as those in rural areas, can spur new demand and uncover powerful engines for wider economic growth. In India, for example, rural incomes have been growing at more than 7 percent annually over the past few years. The income growth accounts for almost 40 percent of India’s total consumption of goods and services.56 More than 50 percent of new subscribers for some leading telecoms providers are rural customers, and the share of rural subscribers in the Indian market has hit 34 percent, up from less than 5 percent just five years ago.57
In Peru, soft-drinks manufacturer AJE took on multinational players by targeting its Kola Real soda at lower income brackets. AJE has replicated its success in other emerging economies. The manufacturer’s success is grounded in a business model that targets latent demand. First, the low-cost business model allows the company to offer its products at lower prices. That makes its drinks affordable to the majority of the population. Second, an innovative distribution system, involving micro-entrepreneurs using their own transport, allows it to reach untapped consumers in remote areas. In 2006, AJE set up in Asia. It now boasts annual sales of US$1.5 billion across 16 countries. Our household income analysis shows that significant growth in household income is expected in many of the countries in which Kola Real operates, such as India, Indonesia and Brazil. India alone is on course to gain 21 million households earning up to US$30,000 per year by 2020, equivalent to additional household income of US$1.1 trillion.58
Figure 22: Importance for growth: New sales channels to reach previously excluded customer groups (percentage of respondents)
47%
50%
63%
10% 30% 50% 70% 90%0% 20% 40% 60% 80% 100%
Disappointed globalizers
Global average
Successful globalizers
Successful companies understand the importance of innovation in reaching untapped consumers: nearly two-thirds believe in the importance of new sales and marketing techniques to reach underserved consumers (see Figure 22). Banco Bradesco, operator of Brazil’s largest retail banking network, found an innovative solution to meet the banking needs of rural consumers. In 2009, pursuing a goal of “banking inclusion” in a country with more than 50 million “unbanked” consumers, Bradesco opened the country’s first floating bank branch on the Amazon River network. Targeting 250,000 people along the banks of the river, who are used to traveling more than twelve hours to collect salaries, pensions and their Bolsa Família grant, the floating branch has uncovered pockets of demand previously unserved by traditional banking.59
The means to discover latent demand need not reside in-house. BP Energy India (now First Energy) bought patented technology from the Indian Institute of Science (IISc) that uses fuel pellets made from agri-waste to run smokeless stoves: it has now successfully sold its “Oorja” stoves to nearly a quarter of a million homeowners and hopes to bring this energy-efficient solution to 3.6 billion potential customers.60
Source: Accenture Fast Forward to Growth survey
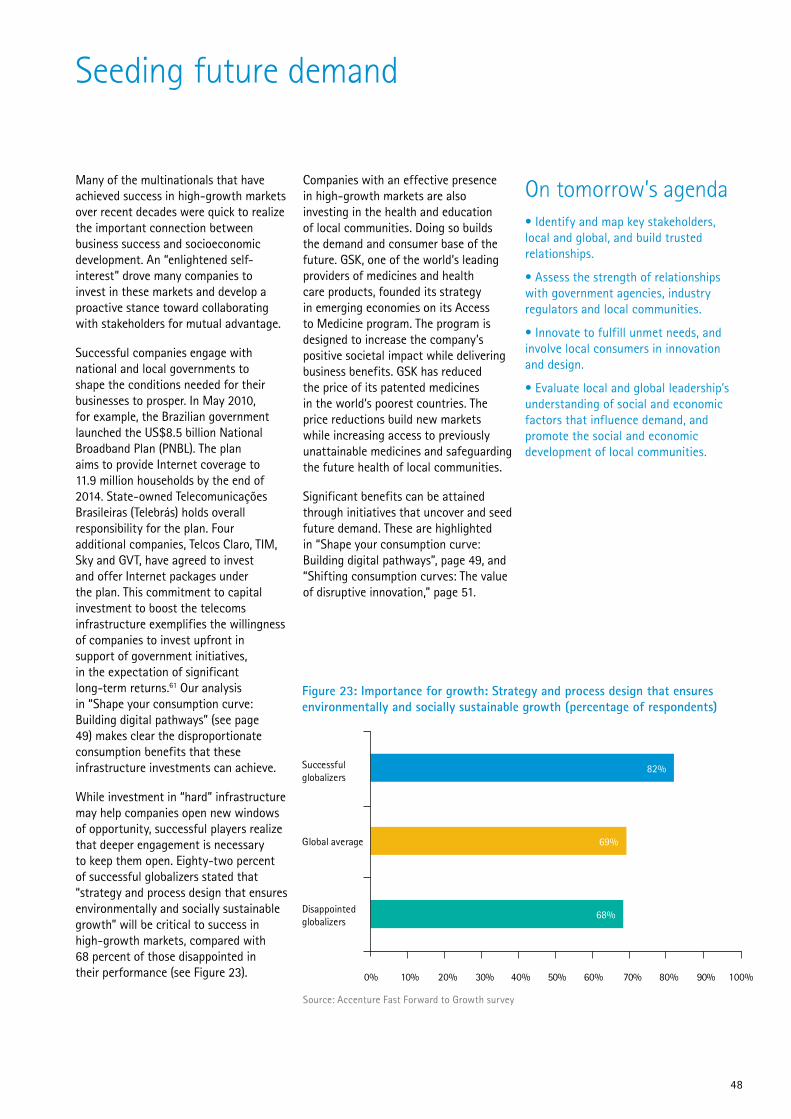
48
Seeding future demand
Many of the multinationals that have achieved success in high-growth markets over recent decades were quick to realize the important connection between business success and socioeconomic development. An “enlightened self-interest” drove many companies to invest in these markets and develop a proactive stance toward collaborating with stakeholders for mutual advantage.
Successful companies engage with national and local governments to shape the conditions needed for their businesses to prosper. In May 2010, for example, the Brazilian government launched the US$8.5 billion National Broadband Plan (PNBL). The plan aims to provide Internet coverage to 11.9 million households by the end of 2014. State-owned Telecomunicações Brasileiras (Telebrás) holds overall responsibility for the plan. Four additional companies, Telcos Claro, TIM, Sky and GVT, have agreed to invest and offer Internet packages under the plan. This commitment to capital investment to boost the telecoms infrastructure exemplifies the willingness of companies to invest upfront in support of government initiatives, in the expectation of significant long-term returns.61 Our analysis in “Shape your consumption curve: Building digital pathways” (see page 49) makes clear the disproportionate consumption benefits that these infrastructure investments can achieve.
While investment in “hard” infrastructure may help companies open new windows of opportunity, successful players realize that deeper engagement is necessary to keep them open. Eighty-two percent of successful globalizers stated that “strategy and process design that ensures environmentally and socially sustainable growth” will be critical to success in high-growth markets, compared with 68 percent of those disappointed in their performance (see Figure 23).
Figure 23: Importance for growth: Strategy and process design that ensures environmentally and socially sustainable growth (percentage of respondents)
68%
69%
82%
10% 30% 50% 70% 90%0% 20% 40% 60% 80% 100%
Disappointed globalizers
Global average
Successful globalizers
Companies with an effective presence in high-growth markets are also investing in the health and education of local communities. Doing so builds the demand and consumer base of the future. GSK, one of the world’s leading providers of medicines and health care products, founded its strategy in emerging economies on its Access to Medicine program. The program is designed to increase the company’s positive societal impact while delivering business benefits. GSK has reduced the price of its patented medicines in the world’s poorest countries. The price reductions build new markets while increasing access to previously unattainable medicines and safeguarding the future health of local communities.
Significant benefits can be attained through initiatives that uncover and seed future demand. These are highlighted in “Shape your consumption curve: Building digital pathways”, page 49, and “Shifting consumption curves: The value of disruptive innovation,” page 51.
On tomorrow’s agenda• Identify and map key stakeholders, local and global, and build trusted relationships.
• Assess the strength of relationships with government agencies, industry regulators and local communities.
• Innovate to fulfill unmet needs, and involve local consumers in innovation and design.
• Evaluate local and global leadership’s understanding of social and economic factors that influence demand, and promote the social and economic development of local communities.
Source: Accenture Fast Forward to Growth survey
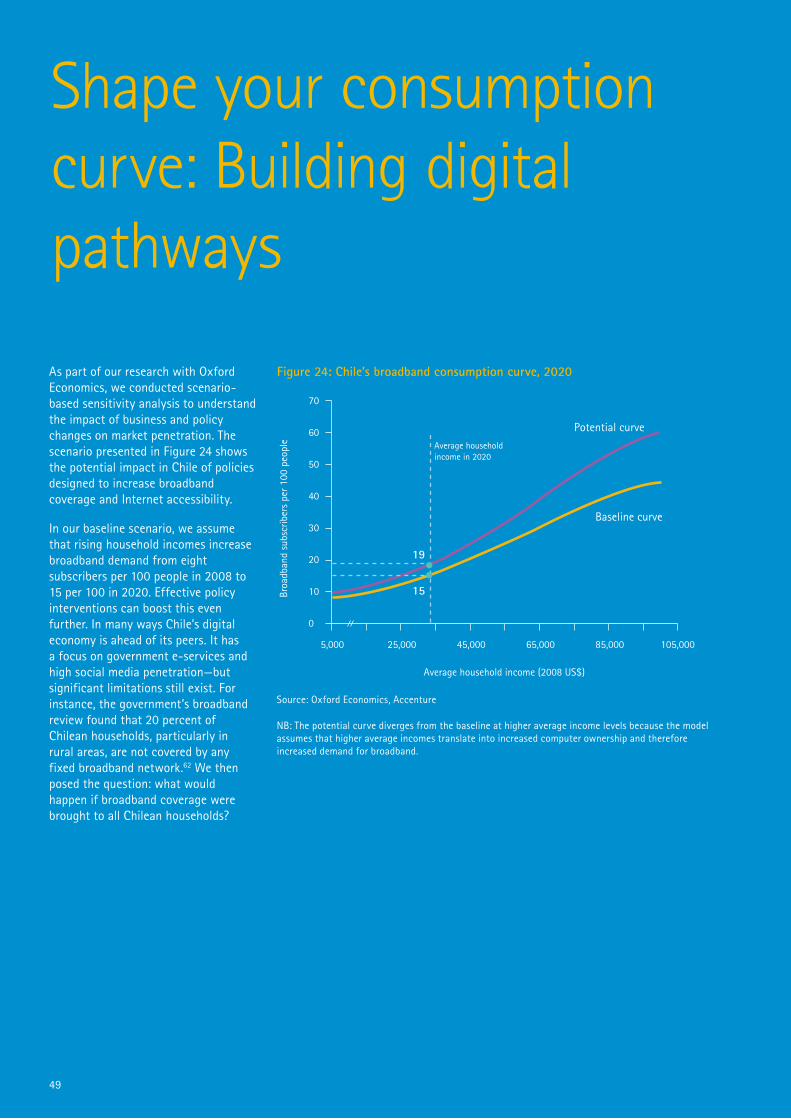
49
Shape your consumption curve: Building digital pathways
As part of our research with Oxford Economics, we conducted scenario-based sensitivity analysis to understand the impact of business and policy changes on market penetration. The scenario presented in Figure 24 shows the potential impact in Chile of policies designed to increase broadband coverage and Internet accessibility.
In our baseline scenario, we assume that rising household incomes increase broadband demand from eight subscribers per 100 people in 2008 to 15 per 100 in 2020. Effective policy interventions can boost this even further. In many ways Chile’s digital economy is ahead of its peers. It has a focus on government e-services and high social media penetration—but significant limitations still exist. For instance, the government’s broadband review found that 20 percent of Chilean households, particularly in rural areas, are not covered by any fixed broadband network.62 We then posed the question: what would happen if broadband coverage were brought to all Chilean households?
Broa
dban
d su
bscr
iber
s pe
r 100
peo
ple
70
60
50
40
30
20
0
5,000 25,000 45,000 85,000 105,00065,000
Baseline curve
10
Potential curve
Average household income (2008 US$)
19
15
Average household income in 2020
Figure 24: Chile’s broadband consumption curve, 2020
Source: Oxford Economics, Accenture
NB: The potential curve diverges from the baseline at higher average income levels because the model assumes that higher average incomes translate into increased computer ownership and therefore increased demand for broadband.
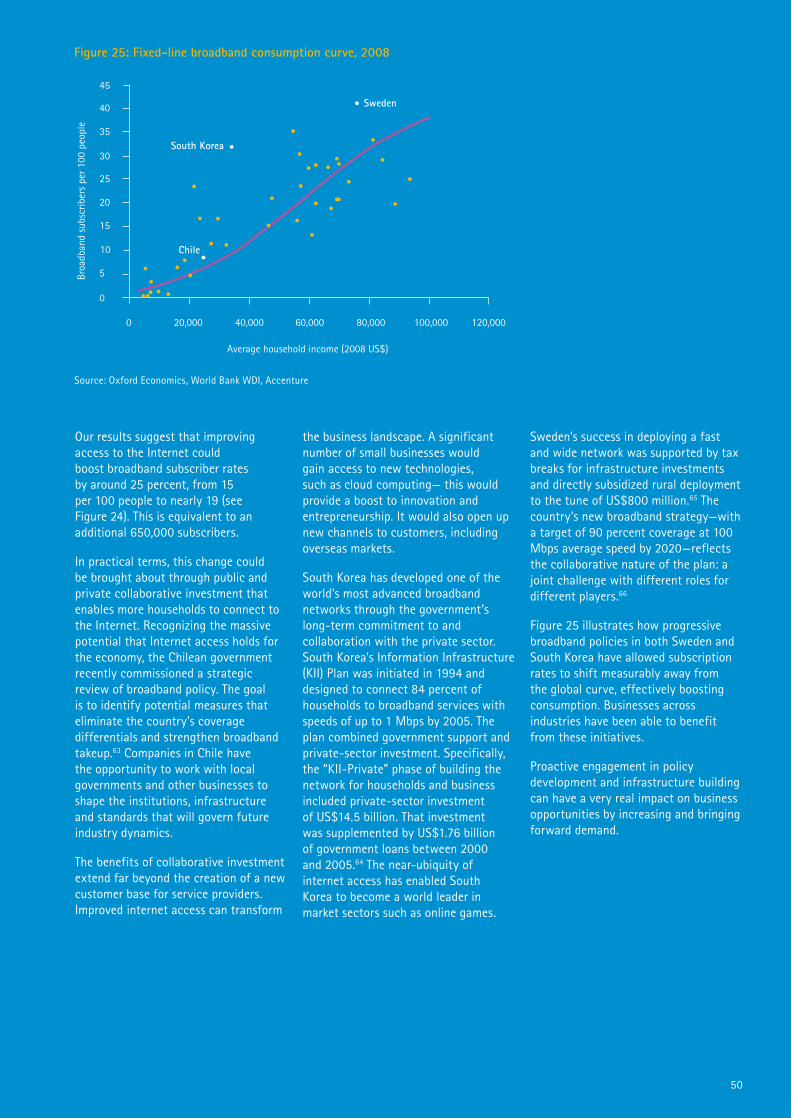
50
Our results suggest that improving access to the Internet could boost broadband subscriber rates by around 25 percent, from 15 per 100 people to nearly 19 (see Figure 24). This is equivalent to an additional 650,000 subscribers.
In practical terms, this change could be brought about through public and private collaborative investment that enables more households to connect to the Internet. Recognizing the massive potential that Internet access holds for the economy, the Chilean government recently commissioned a strategic review of broadband policy. The goal is to identify potential measures that eliminate the country’s coverage differentials and strengthen broadband takeup.63 Companies in Chile have the opportunity to work with local governments and other businesses to shape the institutions, infrastructure and standards that will govern future industry dynamics.
The benefits of collaborative investment extend far beyond the creation of a new customer base for service providers. Improved internet access can transform
the business landscape. A significant number of small businesses would gain access to new technologies, such as cloud computing— this would provide a boost to innovation and entrepreneurship. It would also open up new channels to customers, including overseas markets.
South Korea has developed one of the world’s most advanced broadband networks through the government’s long-term commitment to and collaboration with the private sector. South Korea’s Information Infrastructure (KII) Plan was initiated in 1994 and designed to connect 84 percent of households to broadband services with speeds of up to 1 Mbps by 2005. The plan combined government support and private-sector investment. Specifically, the “KII-Private” phase of building the network for households and business included private-sector investment of US$14.5 billion. That investment was supplemented by US$1.76 billion of government loans between 2000 and 2005.64 The near-ubiquity of internet access has enabled South Korea to become a world leader in market sectors such as online games.
Sweden’s success in deploying a fast and wide network was supported by tax breaks for infrastructure investments and directly subsidized rural deployment to the tune of US$800 million.65 The country’s new broadband strategy—with a target of 90 percent coverage at 100 Mbps average speed by 2020—reflects the collaborative nature of the plan: a joint challenge with different roles for different players.66
Figure 25 illustrates how progressive broadband policies in both Sweden and South Korea have allowed subscription rates to shift measurably away from the global curve, effectively boosting consumption. Businesses across industries have been able to benefit from these initiatives.
Proactive engagement in policy development and infrastructure building can have a very real impact on business opportunities by increasing and bringing forward demand.
Figure 25: Fixed-line broadband consumption curve, 2008
Broa
dban
d su
bscr
iber
s pe
r 100
peo
ple
45
40
35
30
25
20
15
0
0 20,000 40,000 60,000 80,000 100,000 120,000
Average household income (2008 US$)
Sweden
10
5
South Korea
Chile
Source: Oxford Economics, World Bank WDI, Accenture
51
Shifting consumption curves: The value of disruptive innovation
Renault, the French automotive company, used its acquisition of Romanian car manufacturer Dacia to produce the Logan, a five-seater sedan. The Logan was introduced in Romania in 2004. Prices started at US$6,500, approximately 40 percent lower than rival sedans.67 The car was a success in Romania and other emerging economies and now accounts for one in five of Renault’s global sales.68 Tata Motors launched its no-frills small car, the Tata Nano, in 2008. It retails for US$2,500,69 70 percent lower than the average car price in India in 2008.70
These cars are not stripped-down versions of the models sold in developed economies. In fact, the innovations extend beyond the actual product, including a full-scale process redesign from materials sourcing to marketing. For example, the locally sourced, low-cost steel that Renault uses for the Logan is more difficult to shape than the steel used for high-end cars. To work with this steel, the car’s design had to be simple enough to be manufactured by humans instead of robots. Working with human labor allowed Renault to take advantage of Romania’s low labor costs.71
As part of our sectoral consumption analysis, in collaboration with Oxford Economics, we examined the potential impact of disruptive innovation on the automotive sector. We selected India’s passenger car sector as an example. It is a market about to take off and promises significant rewards.
In the baseline case, as household incomes in India rise, the ratio of passenger cars to people is expected to rise to 28 per 1,000 by 2020, compared with 10 cars per 1,000 people in 2008. This growth would translate into 3 million cars sold per annum in the period to 2020. We then posed the question: what would happen if price innovation reduced average retail prices across the Indian car market? (see Figure 26).
In our alternative scenario, innovation drives down prices significantly and current industry dynamics are transformed. Households lower in the income spectrum would be able to afford new cars. Consumption patterns would change as households re-prioritize their demand between goods and services. To illustrate, take a scenario in which car prices in India drop by 50 percent. Typically, the
impact of any price change can be broken down into two elements: the “substitution effect” and the “income effect.” The substitution effect occurs when a price drop makes cars more affordable and consumers can trade up from their current transport mode. This means that the consumption curve would shift to the left, so that there is higher demand at every income level (move from A to B in Figure 26). But the dramatic price drop also increases the purchasing power that households can dedicate to buying a car—it has a similar effect to that of an increase in income. This is the income effect and is demonstrated in Figure 26 as a move along the consumption curve (move from B to C). Of course, this isn’t a stage-by-stage process. The breakdown presented depicts the potential shifts as the market moves to a new equilibrium. The combined impact of these two effects could be a 25 percent increase in car sales over and above the baseline—equivalent to an additional 750,000 cars per annum (this is toward the upper end of the range of car sales’ responsiveness to price: see Methodology, page 67, for further details on the modeling assumptions used to generate this estimate).
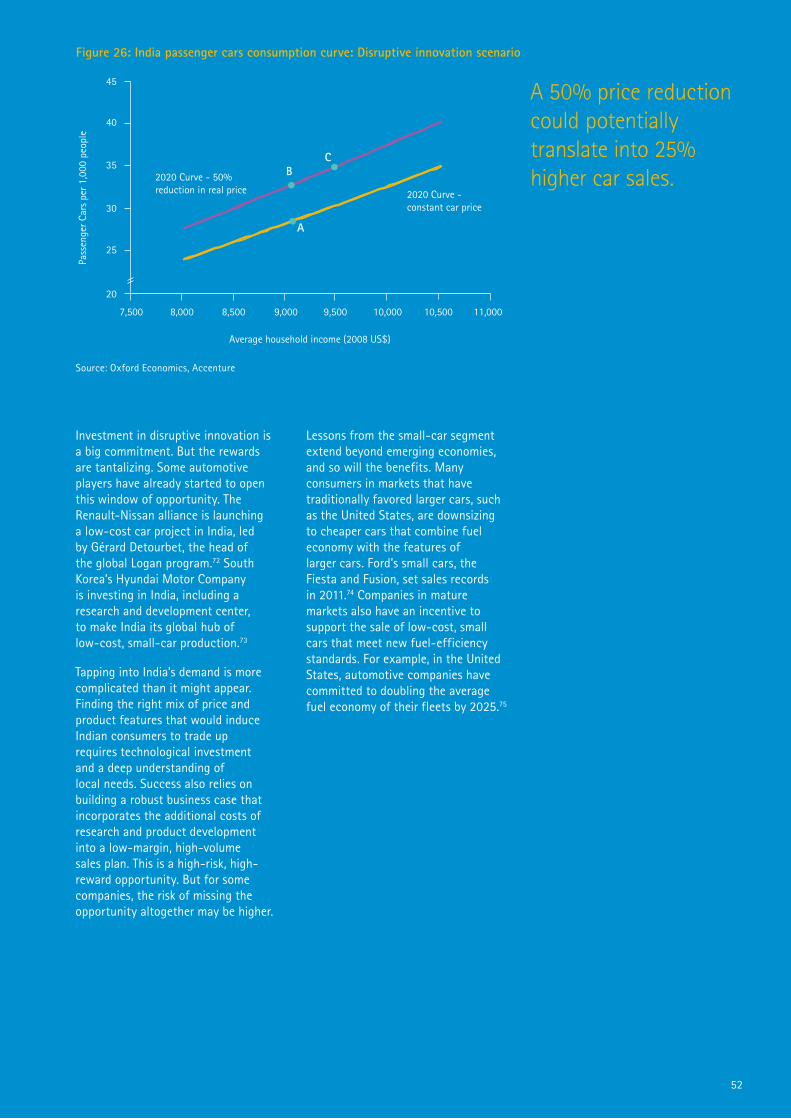
52
Pass
enge
r Car
s pe
r 1,0
00 p
eopl
e45
40
30
25
20
7,500 8,000 8,500 9,000 10,000 10,5009,500
2020 Curve - constant car price
352020 Curve - 50% reduction in real price
A
BC
Average household income (2008 US$)
11,000
Figure 26: India passenger cars consumption curve: Disruptive innovation scenario
Source: Oxford Economics, Accenture
Investment in disruptive innovation is a big commitment. But the rewards are tantalizing. Some automotive players have already started to open this window of opportunity. The Renault-Nissan alliance is launching a low-cost car project in India, led by Gérard Detourbet, the head of the global Logan program.72 South Korea’s Hyundai Motor Company is investing in India, including a research and development center, to make India its global hub of low-cost, small-car production.73
Tapping into India’s demand is more complicated than it might appear. Finding the right mix of price and product features that would induce Indian consumers to trade up requires technological investment and a deep understanding of local needs. Success also relies on building a robust business case that incorporates the additional costs of research and product development into a low-margin, high-volume sales plan. This is a high-risk, high-reward opportunity. But for some companies, the risk of missing the opportunity altogether may be higher.
Lessons from the small-car segment extend beyond emerging economies, and so will the benefits. Many consumers in markets that have traditionally favored larger cars, such as the United States, are downsizing to cheaper cars that combine fuel economy with the features of larger cars. Ford’s small cars, the Fiesta and Fusion, set sales records in 2011.74 Companies in mature markets also have an incentive to support the sale of low-cost, small cars that meet new fuel-efficiency standards. For example, in the United States, automotive companies have committed to doubling the average fuel economy of their fleets by 2025.75
A 50% price reduction could potentially translate into 25% higher car sales.

53
54
Seizing the future: Operating at speed and scale
Successful companies infuse their organizations with the strategic, operational and cultural agility to grasp new opportunities. In order to achieve this, they prioritize and invest in distinctive capabilities that boost operational agility and flexibility. These capabilities are not just instrumental in helping companies to grasp the opportunities of today, but will play a fundamental role in shaping the markets of tomorrow.
For many companies, a focus on efficiency and profitability may have been secondary to the desire to grow quickly and establish a foothold in high-growth markets. But the competitive pressures of tomorrow’s markets will demand renewed attention on efficiency. Agility and flexibility will be essential to enable companies to serve new consumers faster and more effectively than their rivals.
Our research demonstrates that successful globalizers prioritize specific capabilities that boost operational agility and flexibility. This in turn allows them to adapt and reorient to the opportunities of today and tomorrow. The results of this commitment are clear: 83 percent of successful globalizers believe that their company is able to keep pace with change in high-growth markets, a figure significantly ahead of the global average of 62 percent.
Innovation plays an important role in this. Our analysis shows how the power of disruptive innovation can transform industry dynamics, improving the accessibility of consumer products and creating new markets. In the automotive sector, for example, process redesign and low-cost materials have dramatically broadened the accessibility of passenger cars to new consumers. New pockets of demand have opened up for those companies with the agility and efficiency to design low-price business models.
Successful globalizers are pushing the boundaries of what is possible: they understand that business performance and the bottom line will only become more important in geographic growth plans. They understand that operating at speed and scale will play an ever greater role in determining the winners and losers of the next phase of global competition.
83% of successful globalizers believe they can keep up with the pace of change in high-growth markets, compared with 47% of disappointed globalizers.

55
56
With nearly 500 stores across mainland China, Starbucks has undergone strong growth in China over the past five years. Starbucks now regards China as its “second home market” and plans to triple the number of stores there by 2015.76 But the company’s success has not been simple: it had to be flexible enough to incorporate a range of ownership models, from joint ventures to wholly-owned operations, and develop them over time. Starbucks understands the importance of agility in order to take advantage of new opportunities.
Joint ventures with local operators such as Hong Kong-based Maxim’s powered the coffee giant’s initial venture into China. With Starbucks’ need to gain local market experience and build the necessary networks, these partnerships provided access to new consumers and allowed Starbucks to “dip a toe in the water” of the potentially lucrative Chinese market.
The company’s confidence in China has grown with its success, and Starbucks is deepening its roots in the market. It has partnered with Ai Ni Group, one of China’s most established coffee operators and agricultural companies, to open a coffee farm and processing facilities in the southwestern province of Yunnan. Expansion plans target ten new Chinese cities each year to reach a total of 1,500 stores in 90 cities by 2015.77
Restructured operations and the move from a partnership model to a wholly-owned venture reflects the importance of China in the company’s growth plans. In June 2011, Starbucks took full ownership of the stores it ran in partnership with Maxim’s. This agreement gave Starbucks 250 wholly-owned stores in the provinces of Guangdong, Hainan, Sichuan, Shaanxi and Hubei and afforded the company greater control of its brand, outlets and product offering.78
At the same time, Starbucks added direct responsibility for China to the portfolio of Asia Pacific President John Culver, bringing executive responsibility for the market into the top management team. Culver’s remit includes growing and developing Starbucks operations in Indonesia, Japan, Malaysia, New Zealand, the Philippines and South Korea. Starbucks continues to explore new high-growth markets through joint ventures and licensing models. The flexibility of its approach, driven largely by the maturity of the company’s presence in each market, is central to achieving the agility that Starbucks has displayed. The operational changes that Starbucks has been able to make are a testament to its culture and ability to navigate complexity and change.
Starbucks may have only scratched the surface of the coffee opportunity in China: single-store sales in Chinese outlets are on average 40 percent less than in the United States, and the average consumer purchases just five cups of coffee per year, compared with 400 in North America. As tastes change—driven in part by the company’s own efforts—China is poised to become the world’s second-biggest coffee market. Starbucks is well positioned to take advantage of this new wave of growth.79
Starbucks: Flexibility, the recipe for success
57
Designing agile and flexible operations
The rapid evolution of markets demands speed in identifying and responding to opportunities. Entering a new market, designing a new product or making an acquisition requires organizational agility and flexibility to move ideas, people and capital around the organization as required.
Our survey highlights some significant differences between successful globalizers and other companies. Although companies across the board consider the rapid mobilization of people to be critical for success in high-growth markets, behavior differs substantially when it comes to committing sufficient time, money and attention (see Figure 27).
The ability to mobilize people is particularly important for large domestic players expanding onto the international stage. In seeking to extend its footprint beyond India’s borders, Tata Communications designed a wholly new operating model to incorporate local leadership expertise into its global operations. By establishing corporate offices in Singapore, Sri Lanka, the United States and the UK, the company has extended the reach of its corporate center. By instituting a rotation model, employees can be redeployed according to business need, while simultaneously building their cross-cultural skills.80
Successful globalizers also place greater emphasis than other companies on the ease of redeploying capital around the world. They are more confident that they pay sufficient attention to this capability (see Figure 28). Successful globalizers are also far more likely to feel that they have sufficient access to investment capital (see Figure 29).
Attitudes toward the movement of ideas around the organization are particularly illuminating. Innovation will become increasingly important. Players in higher-end markets will face heightened pressures to innovate as firms from emerging economies continue their move up the value chain. Players at the lower end will face continued pressure as competitors find innovative ways to develop the same offerings at a lower cost: think Tata’s Nano car, Asus’ notebook computers or the new generation of lower-cost pharmaceuticals (see “Indian pharmaceuticals: Turning agility to advantage,” page 60).
Successful globalizers place great importance on generating new ideas and innovations. Seventy percent use incentives to encourage local innovation and experimentation among employees in potential high-demand locations, and 76 percent underline the importance of structures and incentives that generate and capture demand. Once new ideas and innovations are created, successful globalizers also focus on sharing and scaling successful ideas across the organization (see Figure 30).
Investment in innovation can lead to significant demand and consumption gains, as illustrated in “Shifting consumption curves: The value of disruptive innovation,” page 51.
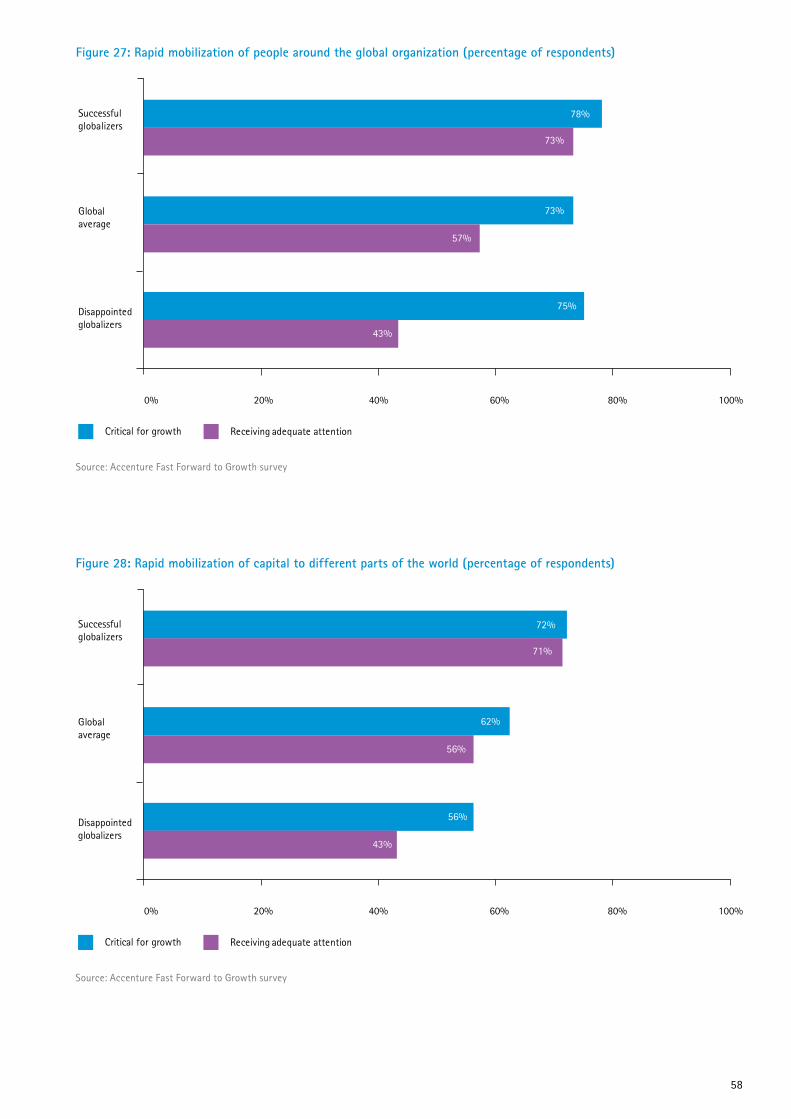
58
Figure 27: Rapid mobilization of people around the global organization (percentage of respondents)
43%
57%
73%
75%
73%
78%
0% 20% 40% 60% 80% 100%
Disappointedglobalizers
Global average
Successful globalizers
Critical for growth Receiving adequate attention
Source: Accenture Fast Forward to Growth survey
Figure 28: Rapid mobilization of capital to different parts of the world (percentage of respondents)
43%
56%
71%
56%
62%
72%
0% 20% 40% 60% 80% 100%
Disappointedglobalizers
Global average
Successful globalizers
Critical for growth Receiving adequate attention
Source: Accenture Fast Forward to Growth survey
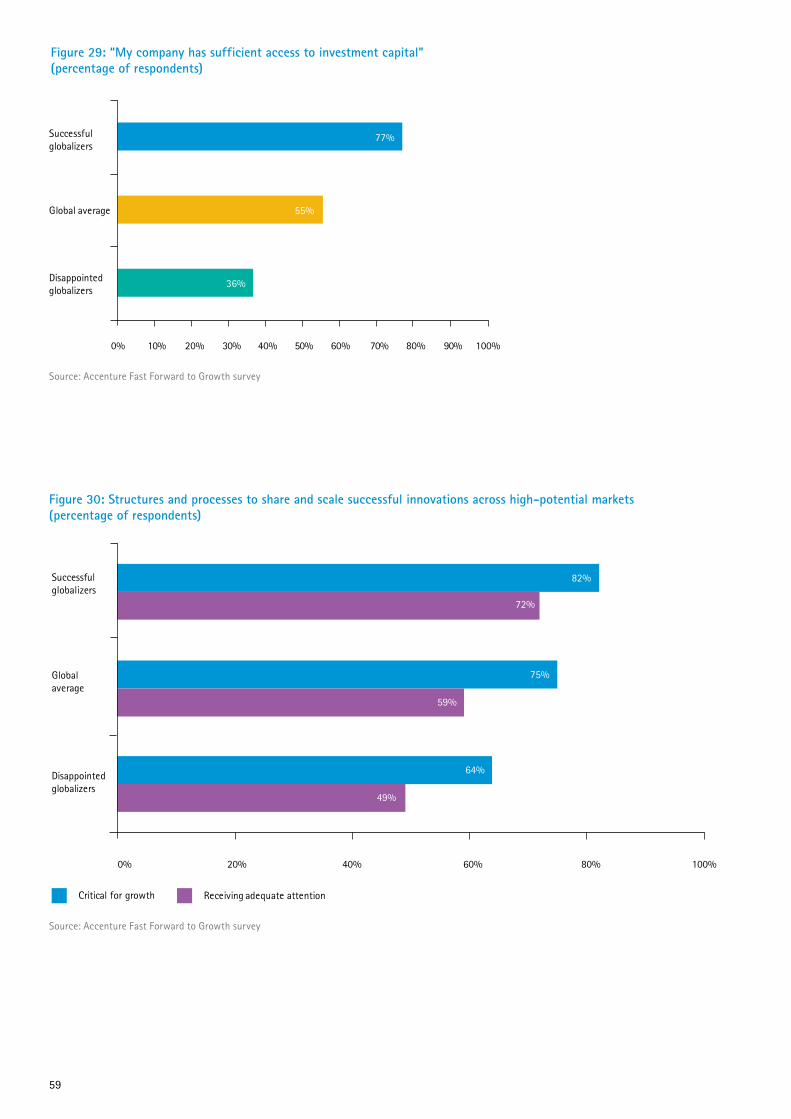
59
49%
59%
72%
64%
75%
82%
0% 20% 40% 60% 80% 100%
Disappointedglobalizers
Global average
Successful globalizers
Critical for growth Receiving adequate attention
Figure 30: Structures and processes to share and scale successful innovations across high-potential markets (percentage of respondents)
Figure 29: “My company has sufficient access to investment capital” (percentage of respondents)
36%
55%
77%
10% 30% 50% 70% 90%0% 20% 40% 60% 80% 100%
Disappointed globalizers
Global average
Successful globalizers
Source: Accenture Fast Forward to Growth survey
Source: Accenture Fast Forward to Growth survey
60
The rising global presence of Indian pharmaceutical companies in recent years demonstrates the importance of organizational agility and flexibility, as companies build on their domestic success by sharing and scaling innovation across new markets.
Growth in India’s pharmaceutical sector has been strong in recent years, driven by rising domestic consumption and strong export demand. The pharmaceuticals industry has traditionally been dominated by companies in developed markets. But deregulation and new production processes have allowed new players to gain leadership in the generics market.
India’s leading pharmaceutical players have taken advantage of the opportunities presented by deregulation and patent expiration through innovative approaches to process design. Traditionally, pharmaceutical industry R&D has been a slow process, but in India the adoption of reverse pharmacology has provided production efficiency gains and helped manufacturers to test generic drugs more quickly and increase the speed to market.
The ability to bring relevant products quickly to market at low price points has been instrumental for domestic players in shaping the Indian market on their terms. Organizational agility, combined with a focus on lean, low-cost manufacturing operations, has enabled domestic players to secure the largest share of the Indian market: while 15 of the world’s top 20 pharmaceutical companies have an active presence in India,81 domestic players supply 90 percent of bulk drugs in the country.82 Domestic companies are also rapidly expanding sales in advanced formulations and specialty medicines.
In response, foreign multinationals are aggressively pursuing joint ventures with Indian players. These ventures are designed to gain access to the Indian market. Bayer HealthCare, for example,
recently launched a joint venture with Cadila, one of India’s largest privately held pharmaceutical companies. But these ventures are also designed to establish a new base for expansion into other emerging markets. In 2009, GSK, the world’s third-largest pharmaceutical company, signed an agreement with India’s Dr. Reddy’s to develop and market selected products across emerging markets.
Building on the strength of their domestic position and the advantages of joint ventures with multinational players, Indian companies are expected to grow exports nearly 20 percent this fiscal year, to US$12 billion. They will supply nearly 50 percent of the world’s bulk drug requirement. The United States remains the largest export destination, followed by the UK, Germany, South Africa and Russia. In coming years, however, Indian firms anticipate significant growth in exports to emerging economies. A recent study forecasts that by 2020, seven emerging markets—Brazil, China, India, Indonesia, Mexico, Russia and Turkey—will account for one-fifth of international pharmaceutical sales.83
As new markets develop in emerging economies, Indian players and their joint-venture partners may hold an advantage. They can apply their domestic experience to new geographies and innovate at home before scaling across global markets. Success in these markets will play a critical role in determining the future growth prospects of even the largest companies. Pfizer estimates that 75 percent of pharmaceutical sales growth over the next five years will come from emerging markets.84 In seizing these opportunities, operational agility and flexibility will be critical.
Indian pharmaceuticals: Turning agility to advantage
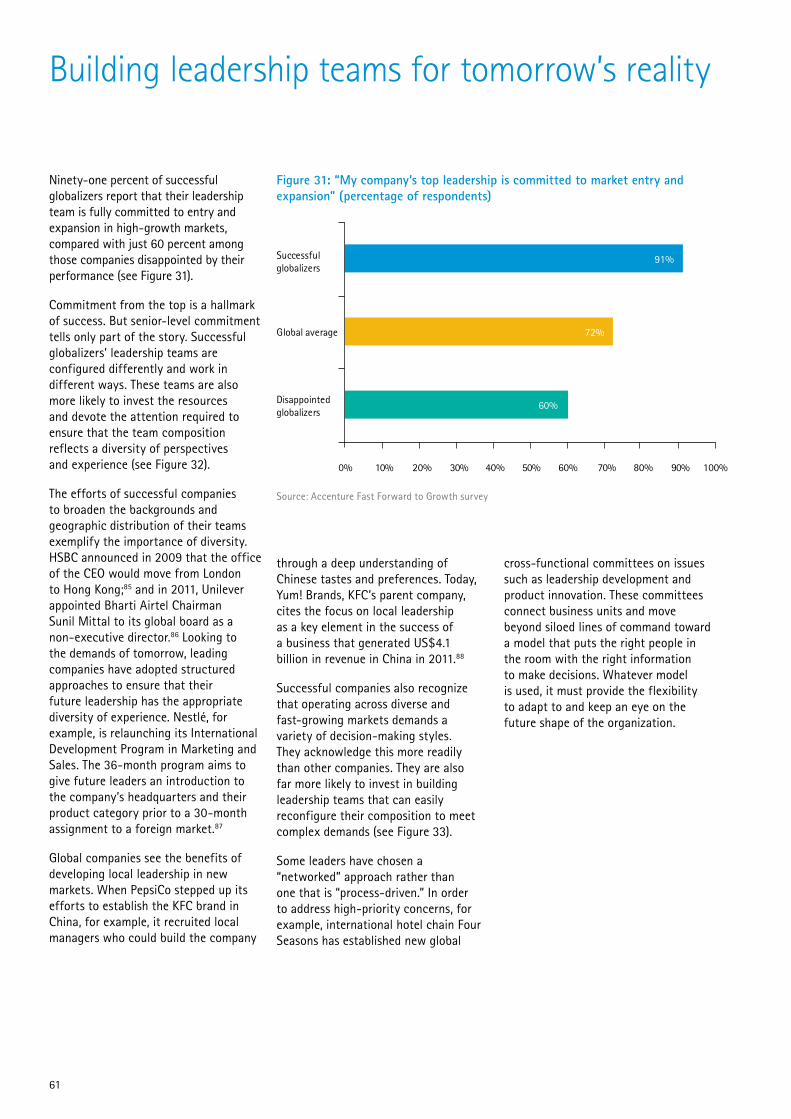
61
Building leadership teams for tomorrow’s reality
Ninety-one percent of successful globalizers report that their leadership team is fully committed to entry and expansion in high-growth markets, compared with just 60 percent among those companies disappointed by their performance (see Figure 31).
Commitment from the top is a hallmark of success. But senior-level commitment tells only part of the story. Successful globalizers’ leadership teams are configured differently and work in different ways. These teams are also more likely to invest the resources and devote the attention required to ensure that the team composition reflects a diversity of perspectives and experience (see Figure 32).
The efforts of successful companies to broaden the backgrounds and geographic distribution of their teams exemplify the importance of diversity. HSBC announced in 2009 that the office of the CEO would move from London to Hong Kong;85 and in 2011, Unilever appointed Bharti Airtel Chairman Sunil Mittal to its global board as a non-executive director.86 Looking to the demands of tomorrow, leading companies have adopted structured approaches to ensure that their future leadership has the appropriate diversity of experience. Nestlé, for example, is relaunching its International Development Program in Marketing and Sales. The 36-month program aims to give future leaders an introduction to the company’s headquarters and their product category prior to a 30-month assignment to a foreign market.87
Global companies see the benefits of developing local leadership in new markets. When PepsiCo stepped up its efforts to establish the KFC brand in China, for example, it recruited local managers who could build the company
Figure 31: “My company’s top leadership is committed to market entry and expansion” (percentage of respondents)
60%
72%
91%
10% 30% 50% 70% 90%0% 20% 40% 60% 80% 100%
Disappointed globalizers
Global average
Successful globalizers
through a deep understanding of Chinese tastes and preferences. Today, Yum! Brands, KFC’s parent company, cites the focus on local leadership as a key element in the success of a business that generated US$4.1 billion in revenue in China in 2011.88
Successful companies also recognize that operating across diverse and fast-growing markets demands a variety of decision-making styles. They acknowledge this more readily than other companies. They are also far more likely to invest in building leadership teams that can easily reconfigure their composition to meet complex demands (see Figure 33).
Some leaders have chosen a “networked” approach rather than one that is “process-driven.” In order to address high-priority concerns, for example, international hotel chain Four Seasons has established new global
cross-functional committees on issues such as leadership development and product innovation. These committees connect business units and move beyond siloed lines of command toward a model that puts the right people in the room with the right information to make decisions. Whatever model is used, it must provide the flexibility to adapt to and keep an eye on the future shape of the organization.
Source: Accenture Fast Forward to Growth survey
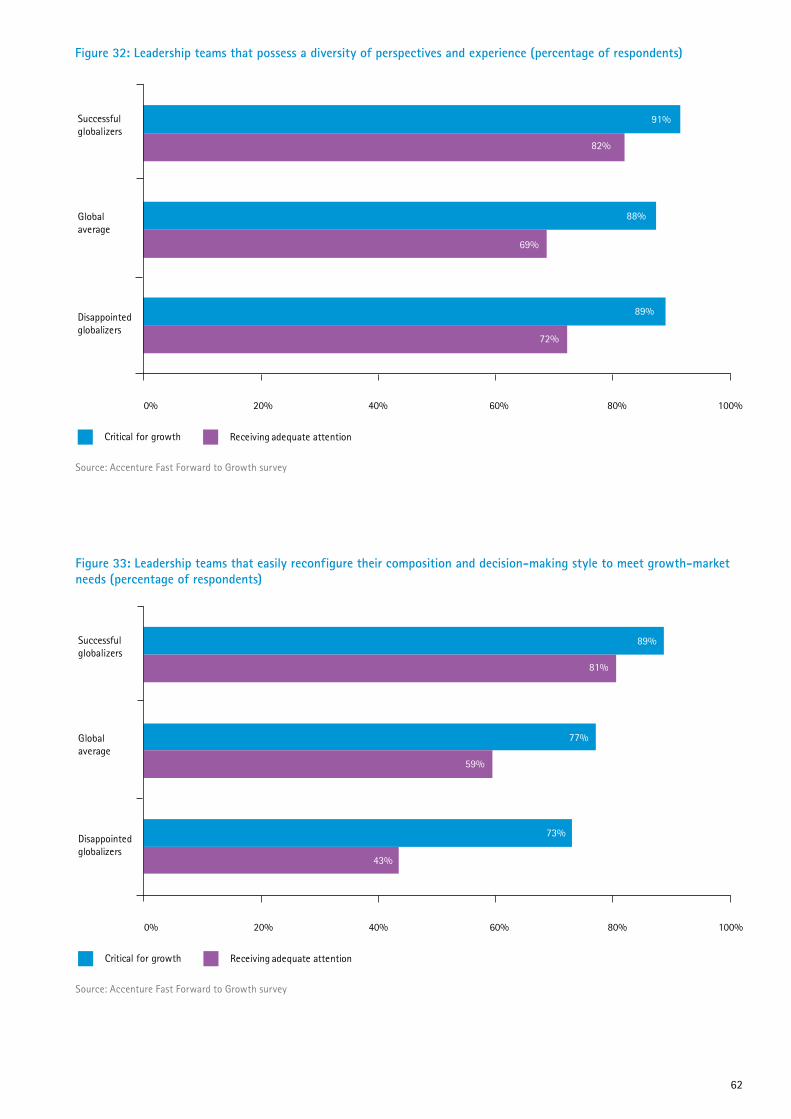
62
Figure 33: Leadership teams that easily reconfigure their composition and decision-making style to meet growth-market needs (percentage of respondents)
43%
59%
81%
73%
77%
89%
0% 20% 40% 60% 80% 100%
Disappointedglobalizers
Global average
Successful globalizers
Critical for growth Receiving adequate attention
Figure 32: Leadership teams that possess a diversity of perspectives and experience (percentage of respondents)
72%
69%
82%
89%
88%
91%
0% 20% 40% 60% 80% 100%
Disappointedglobalizers
Global average
Successful globalizers
Critical for growth Receiving adequate attention
Source: Accenture Fast Forward to Growth survey
Source: Accenture Fast Forward to Growth survey
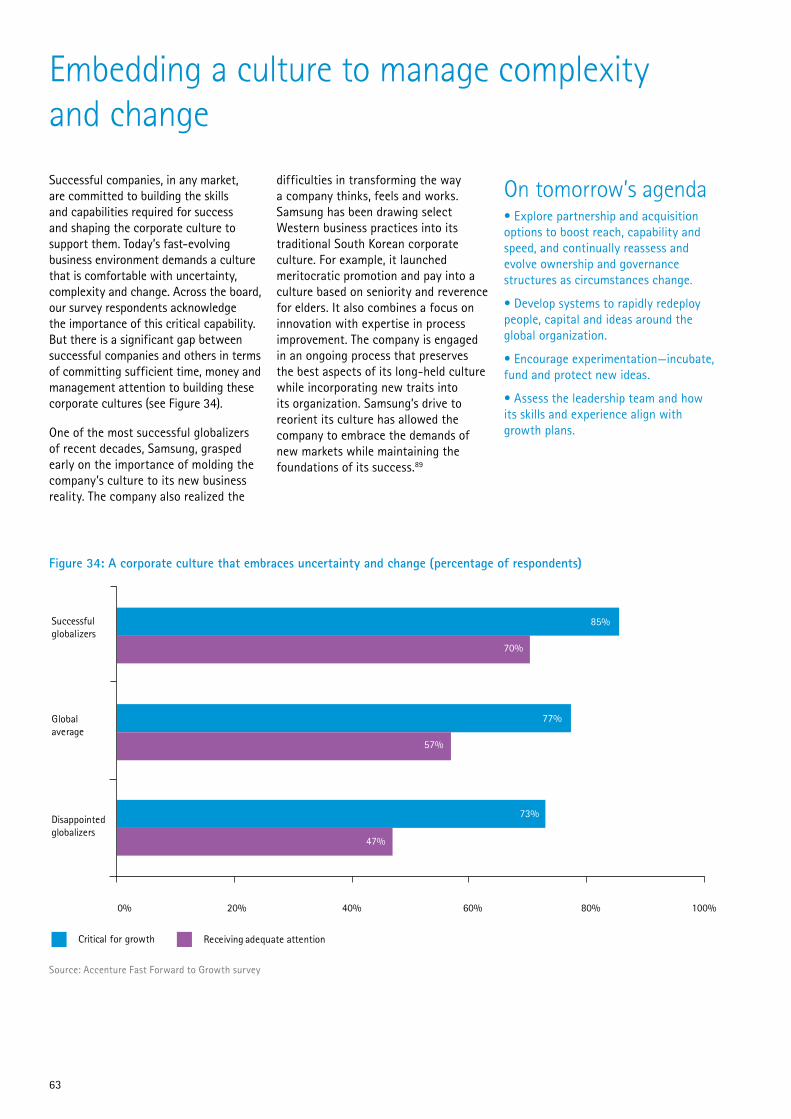
63
Embedding a culture to manage complexity and change
Successful companies, in any market, are committed to building the skills and capabilities required for success and shaping the corporate culture to support them. Today’s fast-evolving business environment demands a culture that is comfortable with uncertainty, complexity and change. Across the board, our survey respondents acknowledge the importance of this critical capability. But there is a significant gap between successful companies and others in terms of committing sufficient time, money and management attention to building these corporate cultures (see Figure 34).
One of the most successful globalizers of recent decades, Samsung, grasped early on the importance of molding the company’s culture to its new business reality. The company also realized the
difficulties in transforming the way a company thinks, feels and works. Samsung has been drawing select Western business practices into its traditional South Korean corporate culture. For example, it launched meritocratic promotion and pay into a culture based on seniority and reverence for elders. It also combines a focus on innovation with expertise in process improvement. The company is engaged in an ongoing process that preserves the best aspects of its long-held culture while incorporating new traits into its organization. Samsung’s drive to reorient its culture has allowed the company to embrace the demands of new markets while maintaining the foundations of its success.89
On tomorrow’s agenda• Explore partnership and acquisition options to boost reach, capability and speed, and continually reassess and evolve ownership and governance structures as circumstances change.
• Develop systems to rapidly redeploy people, capital and ideas around the global organization.
• Encourage experimentation—incubate, fund and protect new ideas.
• Assess the leadership team and how its skills and experience align with growth plans.
Figure 34: A corporate culture that embraces uncertainty and change (percentage of respondents)
47%
57%
70%
73%
77%
85%
0% 20% 40% 60% 80% 100%
Disappointedglobalizers
Global average
Successful globalizers
Critical for growth Receiving adequate attention
Source: Accenture Fast Forward to Growth survey

64
65
Conclusion: Windows to the Future
Who will be the high performers in the next phase of global competition? It will be those organizations that are able to make the most of the transformations in today’s business environment to position themselves for growth tomorrow. It will be those that have revised their approach to global growth in recognition of the fundamental changes in the global landscape of opportunity and competition. Success will not come to those that rely on outmoded templates and attitudes. Rather, it will come to those that engage in new strategic and operational approaches that bring a superior ability to track and act upon the diversity of global opportunities, wherever they are found. These opportunities will, in many cases, lie in emerging economies.
Beginning today, business executives can focus on understand the unfolding changes in the map of global trade and investment flows, especially between emerging economies. They can build their understanding of where new competitors and partners will come from and where emerging players are placing their big bets for growth.
Beginning today, companies can view global growth opportunity through multiple lenses. They can look across time horizons in order to better sequence their investments and more effectively evaluate trade-offs between competing opportunities. They can also look across national borders, for example, by aggregating across disparate markets to find new opportunities and by exploring new pockets of demand.
Beginning today, firms can make efforts to push the boundaries of opportunity beyond the status quo. They can build the relationships and make the investments to generate new demand, to build new customer groups and to shape the possibilities of consumption. For example, innovating new business models can shift price points and bring new customer groups within reach. And entirely new markets can be seeded through improvements in infrastructure, healthcare and education.
Tomorrow’s high performers are already building agility and flexibility into their international operating models. They are leveraging advances in technology and analytics; they are reconfiguring processes and organizational structures; and they are investing in building skills and leaders that have a superior capacity to identify and rapidly act upon emerging opportunities. Their culture embraces market change and uncertainty, rather than allowing change to paralyze decision-making.
The future looks bright for companies that are acting today to position themselves for the next era of global opportunity and competition. Business leaders who invest in building the capabilities to succeed in this new environment will not talk of shrinking windows of opportunity—they will throw open the windows to the future.

66
67
Household income analysisAccenture, in collaboration with Oxford Economics, constructed household income band estimates and forecasts for 64 countries.90 These countries accounted for more than 90 percent of global GDP in 2010. The research involved the following stages:
• Data collection: The data for total net disposable household income (i.e., total household income once all taxes have been paid) were collected from national statistics agencies and broken down by key sources (wage earnings, government transfers, other income sources). This was done for each of the 64 countries.
• Data adjustments: For some emerging markets, total household incomes were rescaled using the household savings rate to match the consumption total in the national accounts. In some cases, no breakdown was available for the source of income, so a proxy country, with a similar economic structure, was used.
• Total household income forecasts: The Oxford Economics baseline macroeconomic forecasts from June 2011 were used as a basis for calculating estimates and forecasts of total household income in 2010, 2015 and 2020.
• Income distribution estimates across income bands: We used a log-normal distribution, which is defined by two parameters: the mean (median household income, in this case), and the standard deviation (which captures the degree of dispersion around the mean).
The projected distribution for 2020 was obtained by inputting the 2020 forecasts of average income into the function, keeping the standard deviation constant.
• Inflation adjustment: All forecasts are adjusted to constant 2010 US$.
Baseline global consumption curvesAccenture, in collaboration with Oxford Economics, estimated the consumption curves for a select number of products and services.
The main steps for all sectors covered were:
• Defining the shape of the consumption curve: Different ideas were explored for the general functional form of each sector’s consumption curve. The logistic functional form was chosen as the most appropriate fit, based on the academic literature and the nature of the selected industries.
• Estimating the consumption curve: The first step was to estimate a cross-country relationship between market penetration and household income. The base year for analysis was sector-specific, and we used household income data for the base year. The estimated curve implicitly assumes that the relationship between household income and market penetration takes the same shape across all countries. The second step was to incorporate relevant country-specific structural factors. For example, for passenger car market penetration, the percentage of roads
paved in each country was included. For broadband penetration, the average broadband speed was included.
• Identifying market phases: The takeoff, rapid growth and maturity points were identified for each consumption curve. The takeoff point was located as the point where market penetration begins to significantly increase at the bottom of the consumption curve. The rapid-growth point was calculated by using the point where the slope of the consumption curve is steepest. The market maturity point is where market penetration does not rise significantly despite an increase in income.
ScenariosScenarios were developed to test how consumption curves might change and how they might be shifted by targeted business and/or policy action. Output from two scenarios, passenger car market and broadband penetration, was presented in the main body of the report.
Passenger car marketThe approach was to estimate a baseline consumption curve for 2020 for a particular case-study country (India) and then vary the parameters of interest to test different scenarios. The baseline curve for 2020 already includes the increase in market penetration due to the expected rise in household income. The household income data were based on our own research in this area.
Methodology: Income and consumption forecasting

68
In the alternative scenario presented in the report, we test the impact of a 50 percent price reduction. Consumption analysis explores the relationship of a given good versus others in the consumer basket. Typically, the impact of a price change on demand can be decomposed into the substitution and income effects.
The substitution effect arises because of the relative price change, since a price drop makes cars more affordable relative to other goods and consumers are encouraged to trade up from their current transport mode. According to the academic literature, the price elasticity of the car stock to price changes is around 0.11 (for example, Johansson & Schipper, 1997).91 However, it is likely that a large price drop would trigger a more significant response in demand. This is particularly true in emerging economies, where the passenger car stock per capita is still very low. To account for this impact, we increased the price elasticity in our scenario to 0.3. Studies that look at price elasticity in the context of large price drops are rare, so our assumed elasticity of 0.3 lies just above the upper estimate suggested by most academic studies.
The income effect means that household purchasing power has increased as a result of the price drop. For example, a 50 percent price fall in a good that represents 20 percent of the average household’s consumer spending implies a rise in real income of 10 percent. So although the household’s average nominal income hasn’t actually changed, the price drop simulates the same effect as an income increase. We might usually assume that the share of vehicle purchases stays in line with the household’s share in the consumer price index (CPI) bundle. But our scenario assumes a disruptive innovation whose impact is to bring about a significant shift in household spending patterns, increasing the share of household spending on cars at the expense of other items in the consumer bundle. To account for this change, we assume that vehicle purchases rise to 10 percent of household income.
Broadband penetrationUsing Chile as a case study, our baseline consumption curve for 2020 incorporates the impact of rising household incomes and improvements in the average speed of fixed-line broadband from around 2 Mbps to around 15 Mbps. This is based on recent market trends that suggest a brisk pace in broadband speed improvements around the world.
Although improvements in speed increase penetration rates, access (as indicated by maximum coverage) is also important. In Chile broadband penetration is limited by access restrictions—20 percent of households are not covered by any fixed broadband network. The Chilean government has announced its intention to work with business to widen broadband access to all households. To capture this, in our alternative scenario, the maximum penetration rate in the broadband consumption curve is increased from 45 subscribers per 100 people to 65 subscribers.
69
References
1 We analyzed household income data across 64 countries (see Methodology on page 67 for details) which together accounted for more than 90 percent of global GDP in 2010. The income of the emerging-market households in our analysis will jump by more than US$8.5 trillion between 2010 and 2020.
2 “Rolls-Royce Posts Record Sales”, The Wall Street Journal, January 9, 2012.
3 “Dancing on the stage of a multi-polar world: The path to globalization for Chinese enterprises,” Accenture, 2011.
4 “Companies shun investment, hoard cash,” The Wall Street Journal, September 17, 2011.
5 “State of mobile in Latin America,” mobiThinking, September 2010.
6 “State of mobile in Latin America,” mobiThinking, September 2010.
7 América Móvil and Telefónica corporate investor presentations, 2011.
8 Wireless Intelligence, “Snapshot: América Móvil merger targets Telefónica in Latin America,” January 2010.
9 International Telecommunication Union, 2011.
10 Economist Intelligence Unit.
11 Economist Intelligence Unit, 2011 estimate.
12 Economist Intelligence Unit, 2010 estimate.
13 Oxford Economics.
14 NB: Nigeria’s population in 2010 was roughly 158 million, more than three times South Africa’s population of 50 million (Source: United Nations).
15 The Economist, “Burgeoning bourgeoisie,” February 12, 2009.
16 Economist Intelligence Unit, “CHAMPS: China’s fastest-growing cities,” 2010.
17 Citymayors website.
18 “Reaching China’s Next 600 Cities,” China Business Review, November-December 2010.
19 NB: The sample covers the majority of developed economies and a significant proportion of emerging economies.
20 The Dutch Association of Insurers.
21 European Automobile Manufacturers’ Association.
22 ”Toyota to invest EUR265m for new vehicles in UK, Turkey,” The Wall Street Journal, November 24, 2011.
23 “Cornerstone laying ceremony held for Chery Brazil Industry Park,” Chery Press release, July 22, 2011.
24 “Unilever targets emerging markets for 75 percent of sales,” Reuters, August 17, 2011.
25 Sovereign Wealth Fund Institute.
26 Korea Institute for International Economic Policy (KIEP), October 2011, via Yonhapnews.
27 “China: Political Influence of state owned enterprises,” UK Foreign and Commonwealth Office, September 2011.
28 “Congo details China venture,” Financial Times, May 10, 2008.
29 “ICBC to buy Standard Bank stake,” Reuters, October 25, 2007.
30 Coca-Cola investor presentation.
31 “Masters of rural markets: The hallmarks of high performance,” Accenture, 2010.
32 Cencosud investor presentation.
33 “Weaving the world together,” The Economist, November 19, 2011.
34 Egan, H. and A. Ovanessoff, “Gearing up for growth,” Accenture, 2011.
35 “Africa and the Middle East, lands of innovation for Orange,” Orange, November 2010.
36 Narsalay, R. and A. Gupta, “Closing the commitment gap,” Outlook, 2011, No 3.
37 “Facebook growth: User statistics and usage trends,” Vabsite, October 2, 2011.
38 Coca-Cola corporate website.
39 “Hindustan Unilever’s Bharat darshan,” Forbes India, September 22, 2010.
40 Egan, H. and A. Ovanessoff, “Gearing up for growth,” Accenture, 2011.
41 Malaysia Economic Transformation Programme website.
42 The Hindu Business Line, “South American nations keen on trade pacts with India,” August 6, 2011.
43 “Nestlé to take on pharmaceutical sector,” Financial Times, September 27, 2010.
44 “Google buys Motorola Mobility,” The Guardian, August 15, 2011.
45 “Google makes another big wind energy investment,” Forbes, June 22, 2011.
46 Nunes, P. and T. Breene, “Jumping the S-Curve,” Boston: Harvard Business Review Press, 2011.
47 Financial Sector Deepening Kenya; “Safaricom M-PESA”, International Finance Corporation, March 2009.
48 “Mobile payments go viral: M-PESA in Kenya,” Gates Foundation, 2010.
49 “Safaricom limited announces audited results for the year ended 31st March 2011,” Safaricom news release; UN population database.
50 “Mobile payments go viral: M-PESA in Kenya,” Gates Foundation, 2010.
51 “The case for more product innovation in mobile money and branchless banking,” CGAP, October 14, 2011; CGAP Branchless Banking Database, 2011.
52 “L’Oréal Latin America head aims to double Brazil sales by 2015,” Bloomberg, March 17, 2011.
53 L’Oréal, “Brazil: A real thirst for beauty,” Shareholders’ corner, 2011.
54 L’Oréal annual report, 2010.
55 “To L’Oréal, Brazil’s women need new style of shopping,” The Wall Street Journal, January 21, 2011.
56 “Masters of rural markets: The hallmarks of high performance,” Accenture, 2010.
57 “Rural market,” India Brand Equity Foundation, August 2009; Telecom Regulatory Authority of India.
58 ”Case study: AJE—taking on bigger rivals,” Financial Times, November 7, 2011.
59 “Floating loans on the river bank,” The Wall Street Journal, March 16, 2010.
60 “Masters of rural markets: The hallmarks of high performance,” Accenture, 2010.
61 “Brazil: The national broadband plan,” IT Decisions, July 26, 2011.
62 Borrell, L., et al., “Strategic review of broadband regulatory policy in Chile,” January 11, 2010.
63 Borrell, L., et al., “Strategic review of broadband regulatory policy in Chile,” January 11, 2010.
64 The Information Technology and Innovation Foundation (ITIF).
65 Atkinson, R., et al., “Explaining international broadband leadership,” ITIF, 2008.
66 Government Offices of Sweden, “Broadband strategy for Sweden,” 2009.
67 Govindarajan, V. and A.T. Dubiel, “Reverse innovation in action: Romanian cars from a French company on the German Autobahn,” Harvard Business Review blog post, May 21, 2010.
68 Renault Group corporate website.
69 Tata Motors.
70 Polk.
71 Govindarajan, V., and A.T. Dubiel, “Reverse innovation in action: Romanian cars from a French company on the German Autobahn,” Harvard Business Review blog post, May 21, 2010.
72 “Renault-Nissan firms small car programme for India,” Forbes India, November 28, 2011.

70
73 Hyundai Motor corporate website.
74 “US car buyers downsizing as gas prices bite,” The Independent, April 5, 2011.
75 “Barack Obama unveils ‘historic’ agreement on fuel economy standards,” The Guardian, July 29, 2011.
76 Starbucks investor call, Q4 2011.
77 “Starbucks plans coffee joint venture with China’s Ai Ni Group,” The Wall Street Journal, July 14, 2011; “China takes Starbucks to next level,” Forbes, May 13, 2011.
78 ”Starbucks tightens focus on China,” The Wall Street Journal, June 3, 2011.
79 “China’s coffee consumption: From leaves to beans,” Global Coffee Review, August 2011.
80 “Tata Communications: Building a global-local operating model,” Accenture, 2009.
81 “The emergence of India’s pharmaceutical industry and implications for the US generic drug market,” US International Trade Commission, May 2007.
82 Bulk Drug Manufacturers Association (India).
83 “Pharma 2020: The vision—which path will you take?” PricewaterhouseCoopers, 2007.
84 “Pfizer eyes bigger push into emerging markets,” Reuters, January 19, 2010.
85 “HSBC CEO moves to Hong Kong,” Reuters, September 25, 2009.
86 Unilever corporate website.
87 Nestlé corporate website.
88 “KFC’s radical approach to China,” Harvard Business Review, November 2011.
89 Khanna, T., J. Song and K. Lee, “The globe: The paradox of Samsung’s rise,” Harvard Business Review, July 2011.
90 Argentina, Armenia, Australia, Austria, Bangladesh, Belgium, Brazil, Bulgaria, Canada, Chile, China, Colombia, Croatia, Cyprus, Czech Republic, Ecuador, Egypt, Estonia, Ethiopia, Finland, France, Germany, Ghana, Greece, Hong Kong, Hungary, India, Indonesia, Iran, Ireland, Italy, Japan, Kazakhstan, Kenya, South Korea, Luxembourg, Malaysia, Malta, Mexico, Morocco, the Netherlands, Nigeria, Norway, Pakistan, Paraguay, the Philippines, Poland, Portugal, Russia, Saudi Arabia, Singapore, Slovakia, Slovenia, South Africa, Spain, Sweden, Thailand, Turkey, United Kingdom, Ukraine, United Arab Emirates, United States, Venezuela, Vietnam.
91 Johansson, O., and L. Schipper, “Measuring the long-run fuel demand of cars,” Journal of Transport Economics and Policy, September 1997.

AcknowledgmentsCore research teamRob Hayward, Armen Ovanessoff, Athena Peppes, Kuangyi Wei
Senior executive steering committeePaul Nunes, Mark Purdy, Matthew Robinson, Mark Spelman
External economic advisorVanessa Rossi
We would like to thank the many Accenture client account executives who provided input.
We would also like to thank the following individuals for their contributions to the studyClaire Allen, Allan Alter, Joshua Bellin, Sarah Bird, Shawn Collinson, Tim Cooper, Steve Culp, Ladan Davarzani, Philip Davis, Henry Egan, Alex Foster, Stephane Girod, Anish Gupta, Nancy Hamill, Jeanne Harris, Francis Hintermann, Sarah Hunter, Sanjay Jain, Mamta Kapur, Marcia Kramer, Hans von Lewinski, Gong Li, David Light, Scott Livermore, Luisa Lombardo, David Mann, Susan Mann, Matthew McGuinness, Joanne McMorrow, Raghav Narsalay, Andrew Newby, Alex Pachetti, Yali Peng, Anton Pichler, Bérenger Playford, Lawrence Ryz, Carron Sass, Stefano Scuratti, Abhik Sen, Tina Senior, Andrew Sleigh, Marcelo Gil Souza, Roxanne Taylor, Meng Yen Ti, Jens Tholstrup, Robert Thomas, David Thomlinson, Oscar Vasco, Alex Walker.
About the Accenture Institute for High Performance The Accenture Institute for High Performance creates strategic insights into key management issues and macroeconomic and political trends through original research and analysis. Its management researchers combine world-class reputations with Accenture’s extensive consulting, technology and outsourcing experience to conduct innovative research and analysis into how organizations become and remain high-performance businesses.
About AccentureAccenture is a global management consulting, technology services and outsourcing company, with more than 244,000 people serving clients in more than 120 countries. Combining unparalleled experience, comprehensive capabilities across all industries and business functions, and extensive research on the world’s most successful companies, Accenture collaborates with clients to help them become high-performance businesses and governments. The company generated net revenues of US$25.5 billion for the fiscal year ended Aug. 31, 2011. Its home page is www.accenture.com.
Copyright © 2012 Accenture All rights reserved.
Accenture, its logo, and High Performance Delivered are trademarks of Accenture.
11-2358 / 11-4446