Embed Size (px)
Citation preview

inancial LiteracyFOR DIGITAL MARKETING FIRMSJody Grunden, CPA | Summit CPA Group
Bureau of Digi ta l • Webinar • 2016
F

2
Introduction
**This presentation will be available for download**
Jody Grunden, CPAVirtual CFO
Summit CPA Group

3
“Prediction is difficult, especially when dealing with the future”
Why You’re Here
--- Danish Proverb
4
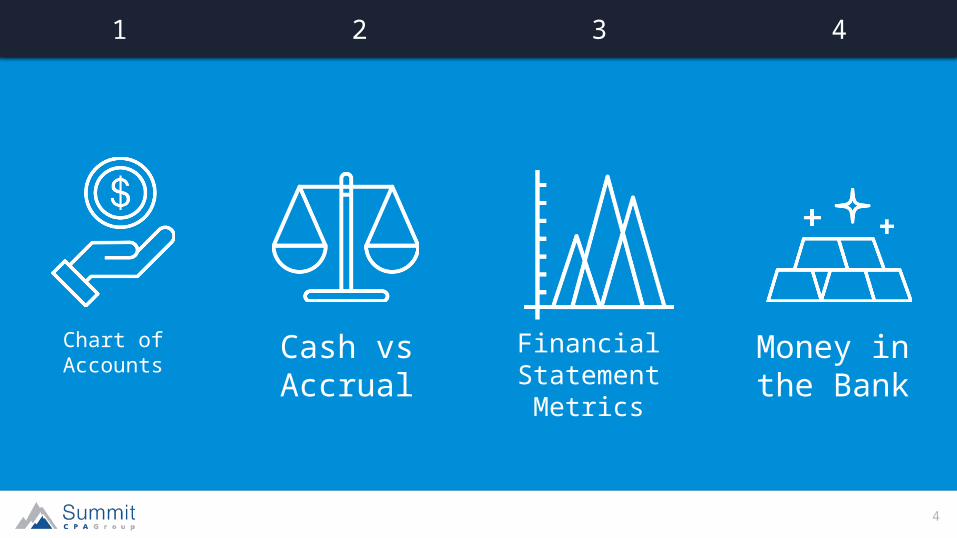
Chart of Accounts
4321
Cash vs Accrual
Financial Statement Metrics
Money in the Bank
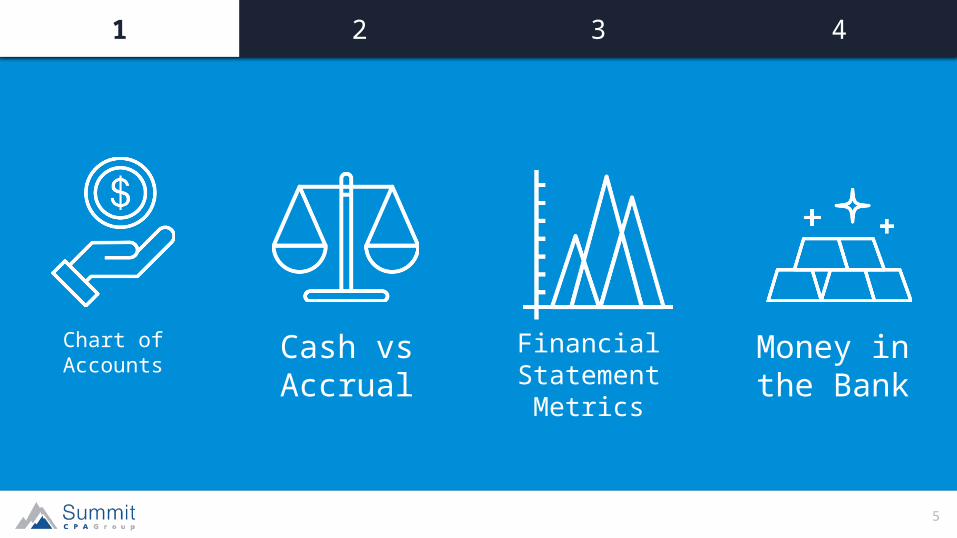
5
Chart of Accounts
432
Cash vs Accrual
Financial Statement Metrics
Money in the Bank
1
6
31
Chart of Accounts
2 4
7
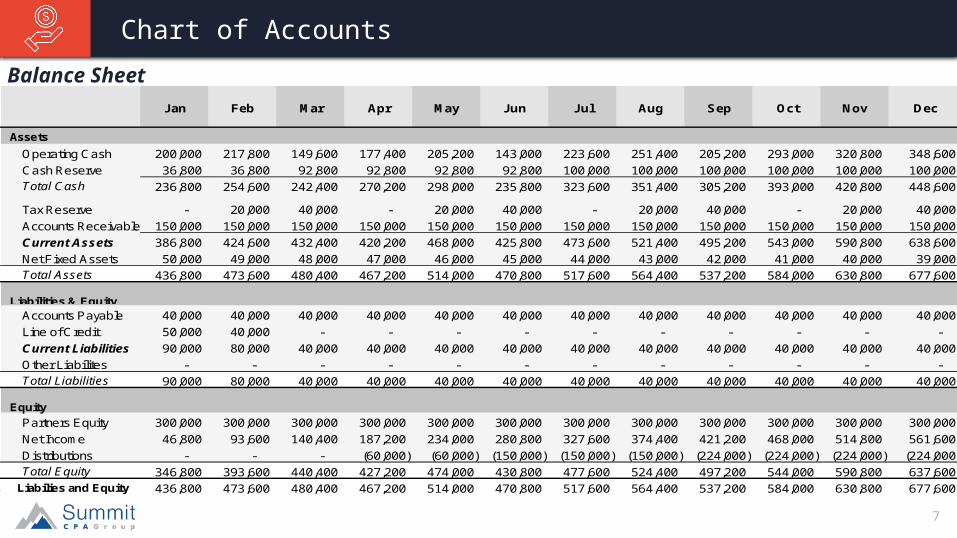
Chart of Accounts
Jan Feb Mar Apr May Jun Jul Aug Sep Oct Nov Dec
AssetsOperating Cash 200,000 217,800 149,600 177,400 205,200 143,000 223,600 251,400 205,200 293,000 320,800 348,600 Cash Reserve 36,800 36,800 92,800 92,800 92,800 92,800 100,000 100,000 100,000 100,000 100,000 100,000 Total Cash 236,800 254,600 242,400 270,200 298,000 235,800 323,600 351,400 305,200 393,000 420,800 448,600
Tax Reserve - 20,000 40,000 - 20,000 40,000 - 20,000 40,000 - 20,000 40,000 Accounts Receivable 150,000 150,000 150,000 150,000 150,000 150,000 150,000 150,000 150,000 150,000 150,000 150,000 Current Assets 386,800 424,600 432,400 420,200 468,000 425,800 473,600 521,400 495,200 543,000 590,800 638,600 Net Fixed Assets 50,000 49,000 48,000 47,000 46,000 45,000 44,000 43,000 42,000 41,000 40,000 39,000
Total AssetsTotal Assets 436,800 473,600 480,400 467,200 514,000 470,800 517,600 564,400 537,200 584,000 630,800 677,600
Liabilities & EquityAccounts Payable 40,000 40,000 40,000 40,000 40,000 40,000 40,000 40,000 40,000 40,000 40,000 40,000 Line of Credit 50,000 40,000 - - - - - - - - - - Current Liabilities 90,000 80,000 40,000 40,000 40,000 40,000 40,000 40,000 40,000 40,000 40,000 40,000 Other Liabilites - - - - - - - - - - - - Total Liabilities 90,000 80,000 40,000 40,000 40,000 40,000 40,000 40,000 40,000 40,000 40,000 40,000
EquityPartners Equity 300,000 300,000 300,000 300,000 300,000 300,000 300,000 300,000 300,000 300,000 300,000 300,000 Net Income 46,800 93,600 140,400 187,200 234,000 280,800 327,600 374,400 421,200 468,000 514,800 561,600 Distributions - - - (60,000) (60,000) (150,000) (150,000) (150,000) (224,000) (224,000) (224,000) (224,000) Total Equity 346,800 393,600 440,400 427,200 474,000 430,800 477,600 524,400 497,200 544,000 590,800 637,600
Liabilies and Equity 436,800 473,600 480,400 467,200 514,000 470,800 517,600 564,400 537,200 584,000 630,800 677,600
Balance Sheet

8
Chart of Accounts
Jan Feb Mar Apr May Jun Jul Aug Sep Oct Nov Dec
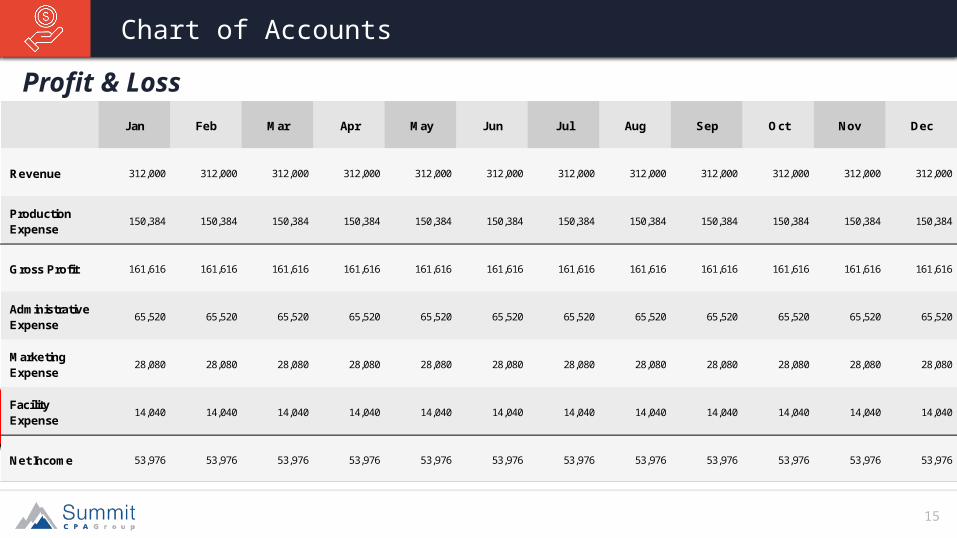
Revenue 312,000 312,000 312,000 312,000 312,000 312,000 312,000 312,000 312,000 312,000 312,000 312,000
Production Expense
150,384 150,384 150,384 150,384 150,384 150,384 150,384 150,384 150,384 150,384 150,384 150,384
Gross Profit 161,616 161,616 161,616 161,616 161,616 161,616 161,616 161,616 161,616 161,616 161,616 161,616
Administrative Expense
65,520 65,520 65,520 65,520 65,520 65,520 65,520 65,520 65,520 65,520 65,520 65,520
Marketing Expense
28,080 28,080 28,080 28,080 28,080 28,080 28,080 28,080 28,080 28,080 28,080 28,080
Facility Expense
14,040 14,040 14,040 14,040 14,040 14,040 14,040 14,040 14,040 14,040 14,040 14,040
Net Income 53,976 53,976 53,976 53,976 53,976 53,976 53,976 53,976 53,976 53,976 53,976 53,976
Profit & Loss
9
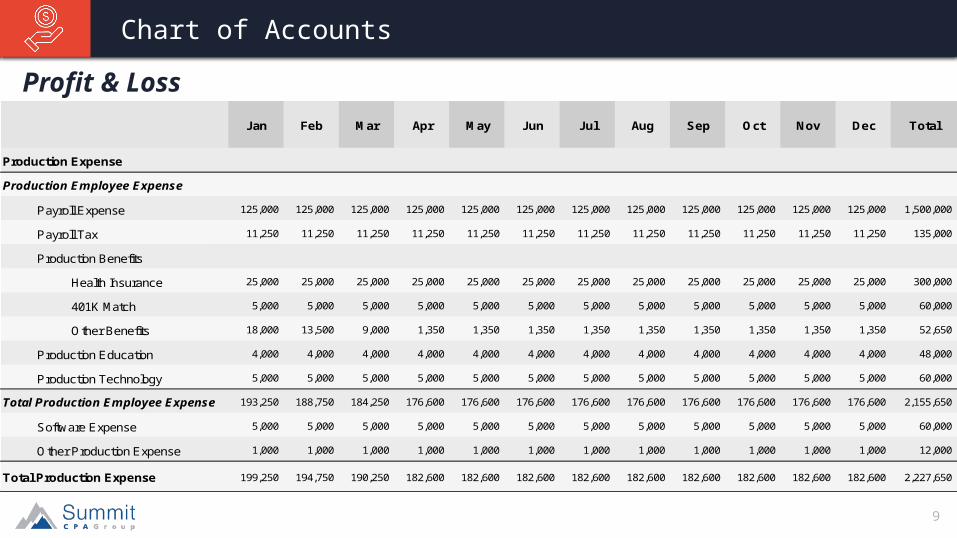
Chart of Accounts
Jan Feb Mar Apr May Jun Jul Aug Sep Oct Nov Dec Total
Payroll Expense 125,000 125,000 125,000 125,000 125,000 125,000 125,000 125,000 125,000 125,000 125,000 125,000 1,500,000
Payroll Tax 11,250 11,250 11,250 11,250 11,250 11,250 11,250 11,250 11,250 11,250 11,250 11,250 135,000
Production Benefits
Health Insurance 25,000 25,000 25,000 25,000 25,000 25,000 25,000 25,000 25,000 25,000 25,000 25,000 300,000
401K Match 5,000 5,000 5,000 5,000 5,000 5,000 5,000 5,000 5,000 5,000 5,000 5,000 60,000
Other Benefits 18,000 13,500 9,000 1,350 1,350 1,350 1,350 1,350 1,350 1,350 1,350 1,350 52,650
Production Education 4,000 4,000 4,000 4,000 4,000 4,000 4,000 4,000 4,000 4,000 4,000 4,000 48,000
Production Technology 5,000 5,000 5,000 5,000 5,000 5,000 5,000 5,000 5,000 5,000 5,000 5,000 60,000
193,250 188,750 184,250 176,600 176,600 176,600 176,600 176,600 176,600 176,600 176,600 176,600 2,155,650
Software Expense 5,000 5,000 5,000 5,000 5,000 5,000 5,000 5,000 5,000 5,000 5,000 5,000 60,000
Other Production Expense 1,000 1,000 1,000 1,000 1,000 1,000 1,000 1,000 1,000 1,000 1,000 1,000 12,000
199,250 194,750 190,250 182,600 182,600 182,600 182,600 182,600 182,600 182,600 182,600 182,600 2,227,650 Total Production Expense
Production Expense
Production Employee Expense
Total Production Employee Expense
Profit & Loss
10
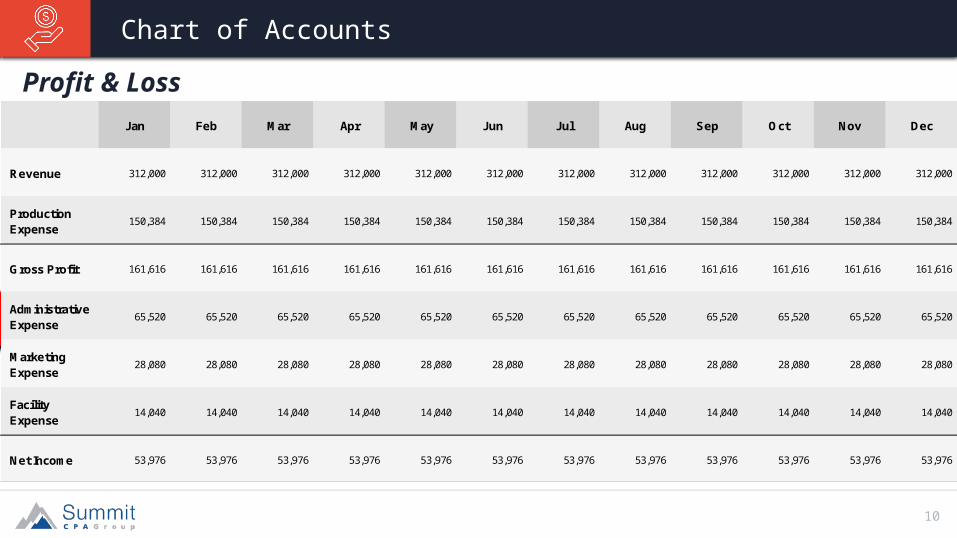
Jan Feb Mar Apr May Jun Jul Aug Sep Oct Nov Dec
Revenue 312,000 312,000 312,000 312,000 312,000 312,000 312,000 312,000 312,000 312,000 312,000 312,000
Production Expense
150,384 150,384 150,384 150,384 150,384 150,384 150,384 150,384 150,384 150,384 150,384 150,384
Gross Profit 161,616 161,616 161,616 161,616 161,616 161,616 161,616 161,616 161,616 161,616 161,616 161,616
Administrative Expense
65,520 65,520 65,520 65,520 65,520 65,520 65,520 65,520 65,520 65,520 65,520 65,520
Marketing Expense
28,080 28,080 28,080 28,080 28,080 28,080 28,080 28,080 28,080 28,080 28,080 28,080
Facility Expense
14,040 14,040 14,040 14,040 14,040 14,040 14,040 14,040 14,040 14,040 14,040 14,040
Net Income 53,976 53,976 53,976 53,976 53,976 53,976 53,976 53,976 53,976 53,976 53,976 53,976
Chart of Accounts
Profit & Loss
11
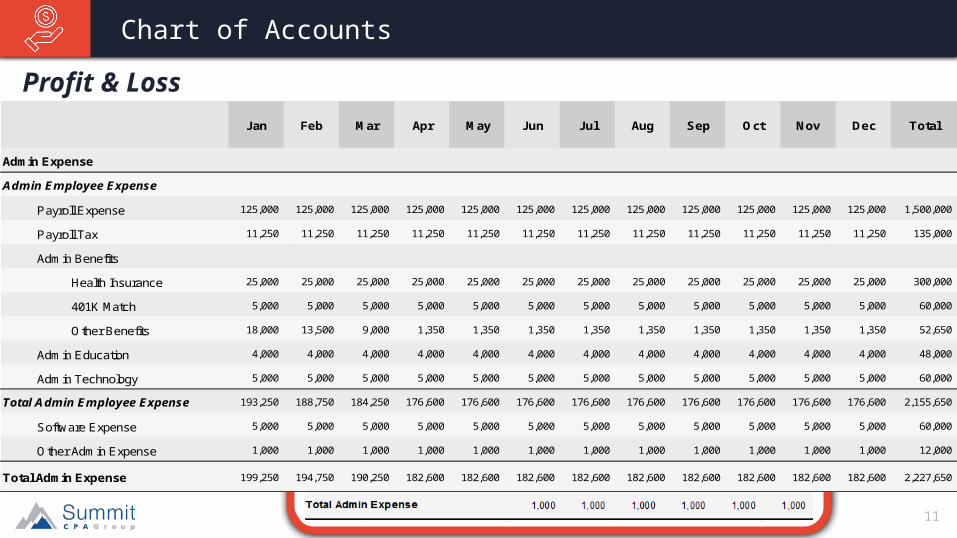
Chart of Accounts
Jan Feb Mar Apr May Jun Jul Aug Sep Oct Nov Dec Total
Payroll Expense 125,000 125,000 125,000 125,000 125,000 125,000 125,000 125,000 125,000 125,000 125,000 125,000 1,500,000
Payroll Tax 11,250 11,250 11,250 11,250 11,250 11,250 11,250 11,250 11,250 11,250 11,250 11,250 135,000
Admin Benefits
Health Insurance 25,000 25,000 25,000 25,000 25,000 25,000 25,000 25,000 25,000 25,000 25,000 25,000 300,000
401K Match 5,000 5,000 5,000 5,000 5,000 5,000 5,000 5,000 5,000 5,000 5,000 5,000 60,000
Other Benefits 18,000 13,500 9,000 1,350 1,350 1,350 1,350 1,350 1,350 1,350 1,350 1,350 52,650
Admin Education 4,000 4,000 4,000 4,000 4,000 4,000 4,000 4,000 4,000 4,000 4,000 4,000 48,000
Admin Technology 5,000 5,000 5,000 5,000 5,000 5,000 5,000 5,000 5,000 5,000 5,000 5,000 60,000
193,250 188,750 184,250 176,600 176,600 176,600 176,600 176,600 176,600 176,600 176,600 176,600 2,155,650
Software Expense 5,000 5,000 5,000 5,000 5,000 5,000 5,000 5,000 5,000 5,000 5,000 5,000 60,000
Other Admin Expense 1,000 1,000 1,000 1,000 1,000 1,000 1,000 1,000 1,000 1,000 1,000 1,000 12,000
199,250 194,750 190,250 182,600 182,600 182,600 182,600 182,600 182,600 182,600 182,600 182,600 2,227,650 Total Admin Expense
Admin Expense
Admin Employee Expense
Total Admin Employee Expense
Profit & Loss

13
Jan Feb Mar Apr May Jun Jul Aug Sep Oct Nov Dec
Revenue 312,000 312,000 312,000 312,000 312,000 312,000 312,000 312,000 312,000 312,000 312,000 312,000
Production Expense
150,384 150,384 150,384 150,384 150,384 150,384 150,384 150,384 150,384 150,384 150,384 150,384
Gross Profit 161,616 161,616 161,616 161,616 161,616 161,616 161,616 161,616 161,616 161,616 161,616 161,616
Administrative Expense
65,520 65,520 65,520 65,520 65,520 65,520 65,520 65,520 65,520 65,520 65,520 65,520
Marketing Expense
28,080 28,080 28,080 28,080 28,080 28,080 28,080 28,080 28,080 28,080 28,080 28,080
Facility Expense
14,040 14,040 14,040 14,040 14,040 14,040 14,040 14,040 14,040 14,040 14,040 14,040
Net Income 53,976 53,976 53,976 53,976 53,976 53,976 53,976 53,976 53,976 53,976 53,976 53,976
Chart of Accounts
Profit & Loss
14
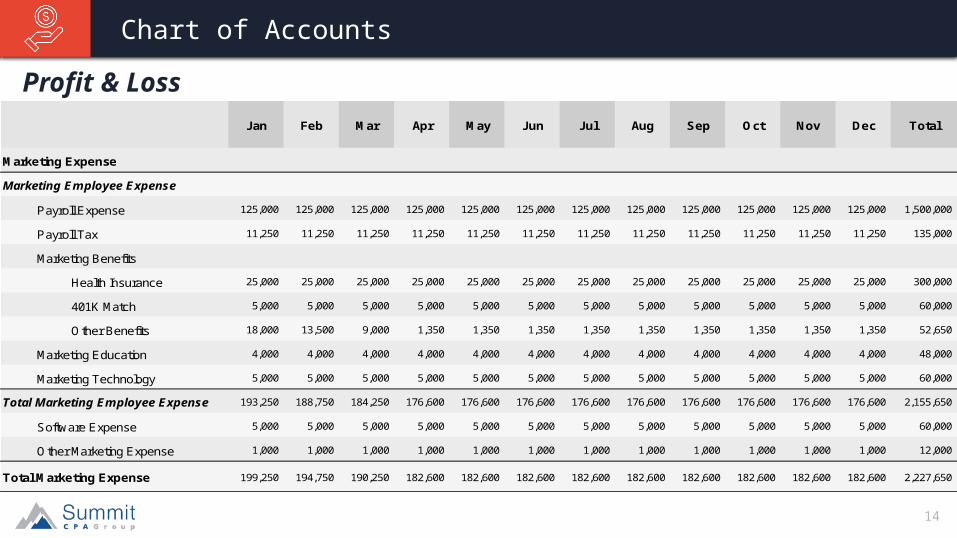
Chart of Accounts
Jan Feb Mar Apr May Jun Jul Aug Sep Oct Nov Dec Total
Payroll Expense 125,000 125,000 125,000 125,000 125,000 125,000 125,000 125,000 125,000 125,000 125,000 125,000 1,500,000
Payroll Tax 11,250 11,250 11,250 11,250 11,250 11,250 11,250 11,250 11,250 11,250 11,250 11,250 135,000
Marketing Benefits
Health Insurance 25,000 25,000 25,000 25,000 25,000 25,000 25,000 25,000 25,000 25,000 25,000 25,000 300,000
401K Match 5,000 5,000 5,000 5,000 5,000 5,000 5,000 5,000 5,000 5,000 5,000 5,000 60,000
Other Benefits 18,000 13,500 9,000 1,350 1,350 1,350 1,350 1,350 1,350 1,350 1,350 1,350 52,650
Marketing Education 4,000 4,000 4,000 4,000 4,000 4,000 4,000 4,000 4,000 4,000 4,000 4,000 48,000
Marketing Technology 5,000 5,000 5,000 5,000 5,000 5,000 5,000 5,000 5,000 5,000 5,000 5,000 60,000
193,250 188,750 184,250 176,600 176,600 176,600 176,600 176,600 176,600 176,600 176,600 176,600 2,155,650
Software Expense 5,000 5,000 5,000 5,000 5,000 5,000 5,000 5,000 5,000 5,000 5,000 5,000 60,000
Other Marketing Expense 1,000 1,000 1,000 1,000 1,000 1,000 1,000 1,000 1,000 1,000 1,000 1,000 12,000
199,250 194,750 190,250 182,600 182,600 182,600 182,600 182,600 182,600 182,600 182,600 182,600 2,227,650 Total Marketing Expense
Marketing Expense
Marketing Employee Expense
Total Marketing Employee Expense
Profit & Loss
15
Jan Feb Mar Apr May Jun Jul Aug Sep Oct Nov Dec
Revenue 312,000 312,000 312,000 312,000 312,000 312,000 312,000 312,000 312,000 312,000 312,000 312,000
Production Expense
150,384 150,384 150,384 150,384 150,384 150,384 150,384 150,384 150,384 150,384 150,384 150,384
Gross Profit 161,616 161,616 161,616 161,616 161,616 161,616 161,616 161,616 161,616 161,616 161,616 161,616
Administrative Expense
65,520 65,520 65,520 65,520 65,520 65,520 65,520 65,520 65,520 65,520 65,520 65,520
Marketing Expense
28,080 28,080 28,080 28,080 28,080 28,080 28,080 28,080 28,080 28,080 28,080 28,080
Facility Expense
14,040 14,040 14,040 14,040 14,040 14,040 14,040 14,040 14,040 14,040 14,040 14,040
Net Income 53,976 53,976 53,976 53,976 53,976 53,976 53,976 53,976 53,976 53,976 53,976 53,976
Chart of Accounts
Profit & Loss
16
Chart of Accounts
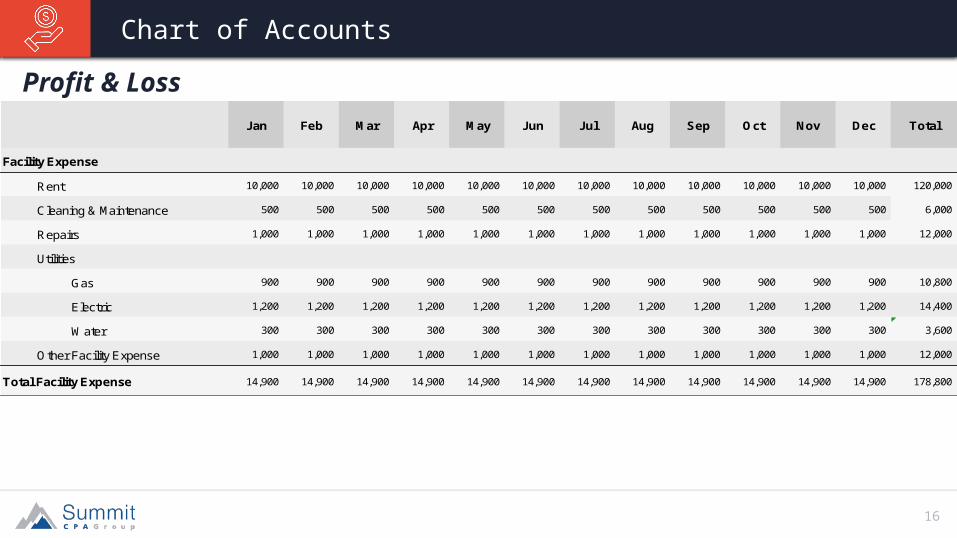
Jan Feb Mar Apr May Jun Jul Aug Sep Oct Nov Dec Total
Rent 10,000 10,000 10,000 10,000 10,000 10,000 10,000 10,000 10,000 10,000 10,000 10,000 120,000
Cleaning & Maintenance 500 500 500 500 500 500 500 500 500 500 500 500 6,000
Repairs 1,000 1,000 1,000 1,000 1,000 1,000 1,000 1,000 1,000 1,000 1,000 1,000 12,000
Utilities
Gas 900 900 900 900 900 900 900 900 900 900 900 900 10,800
Electric 1,200 1,200 1,200 1,200 1,200 1,200 1,200 1,200 1,200 1,200 1,200 1,200 14,400
Water 300 300 300 300 300 300 300 300 300 300 300 300 3,600
Other Facility Expense 1,000 1,000 1,000 1,000 1,000 1,000 1,000 1,000 1,000 1,000 1,000 1,000 12,000
14,900 14,900 14,900 14,900 14,900 14,900 14,900 14,900 14,900 14,900 14,900 14,900 178,800 Total Facility Expense
Facility Expense
Profit & Loss
17
Jan Feb Mar Apr May Jun Jul Aug Sep Oct Nov Dec
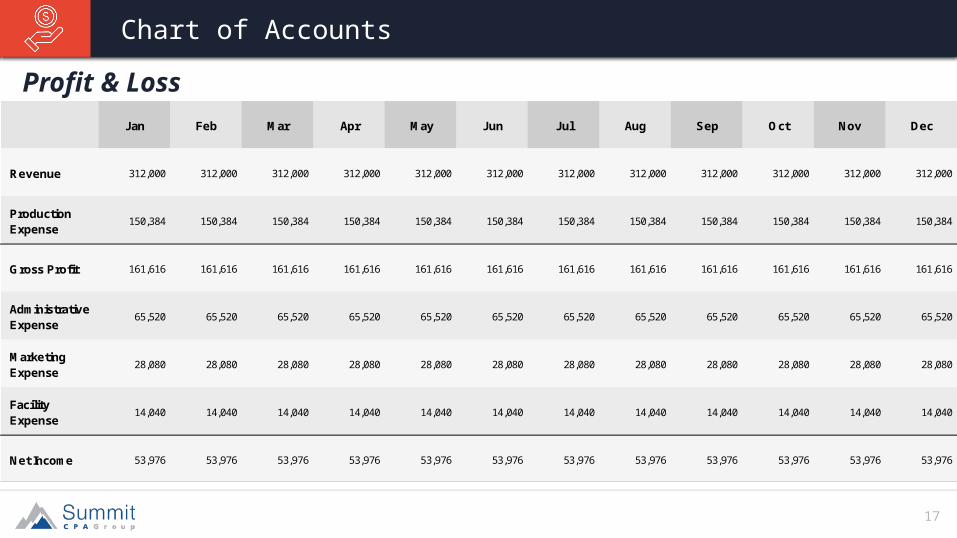
Revenue 312,000 312,000 312,000 312,000 312,000 312,000 312,000 312,000 312,000 312,000 312,000 312,000
Production Expense
150,384 150,384 150,384 150,384 150,384 150,384 150,384 150,384 150,384 150,384 150,384 150,384
Gross Profit 161,616 161,616 161,616 161,616 161,616 161,616 161,616 161,616 161,616 161,616 161,616 161,616
Administrative Expense
65,520 65,520 65,520 65,520 65,520 65,520 65,520 65,520 65,520 65,520 65,520 65,520
Marketing Expense
28,080 28,080 28,080 28,080 28,080 28,080 28,080 28,080 28,080 28,080 28,080 28,080
Facility Expense
14,040 14,040 14,040 14,040 14,040 14,040 14,040 14,040 14,040 14,040 14,040 14,040
Net Income 53,976 53,976 53,976 53,976 53,976 53,976 53,976 53,976 53,976 53,976 53,976 53,976
Chart of Accounts
Profit & Loss
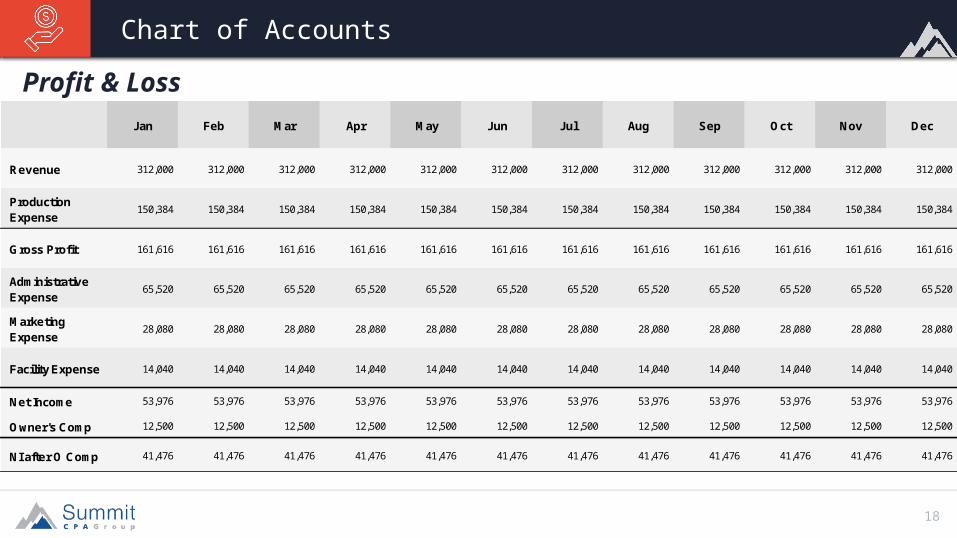
Where is OWNERS Compensation?
18
Jan Feb Mar Apr May Jun Jul Aug Sep Oct Nov Dec
Revenue 312,000 312,000 312,000 312,000 312,000 312,000 312,000 312,000 312,000 312,000 312,000 312,000
Production Expense
150,384 150,384 150,384 150,384 150,384 150,384 150,384 150,384 150,384 150,384 150,384 150,384
Gross Profit 161,616 161,616 161,616 161,616 161,616 161,616 161,616 161,616 161,616 161,616 161,616 161,616
Administrative Expense
65,520 65,520 65,520 65,520 65,520 65,520 65,520 65,520 65,520 65,520 65,520 65,520
Marketing Expense
28,080 28,080 28,080 28,080 28,080 28,080 28,080 28,080 28,080 28,080 28,080 28,080
Facility Expense 14,040 14,040 14,040 14,040 14,040 14,040 14,040 14,040 14,040 14,040 14,040 14,040
Net Income 53,976 53,976 53,976 53,976 53,976 53,976 53,976 53,976 53,976 53,976 53,976 53,976
Owner's Comp 12,500 12,500 12,500 12,500 12,500 12,500 12,500 12,500 12,500 12,500 12,500 12,500
NI after O Comp 41,476 41,476 41,476 41,476 41,476 41,476 41,476 41,476 41,476 41,476 41,476 41,476
Chart of Accounts
Profit & Loss
20
Chart of Accounts
4
Cash vs Accrual
Financial Statement Metrics
Money in the Bank
1 2 3
21
3
Cash vs Accrual
2 421
22
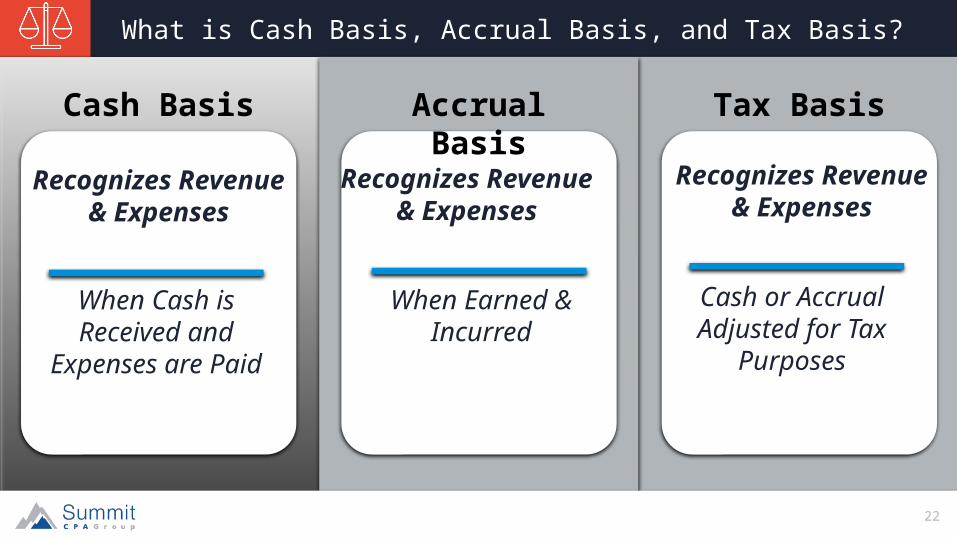
What is Cash Basis, Accrual Basis, and Tax Basis?
Cash Basis
Recognizes Revenue & Expenses
Accrual Basis Tax Basis
When Cash is Received and
Expenses are Paid
Recognizes Revenue & Expenses
Recognizes Revenue & Expenses
When Earned & Incurred
Cash or Accrual Adjusted for Tax
Purposes
23
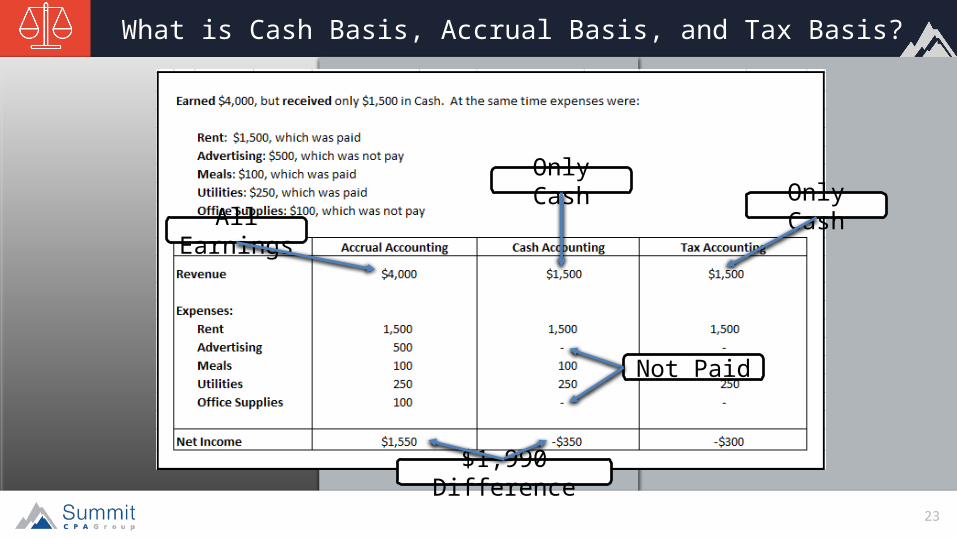
What is Cash Basis, Accrual Basis, and Tax Basis?
Only CashOnly Cash
All Earnings
Not Paid
$1,990 Difference
24
Chart of Accounts
4
Cash vs Accrual
Financial Statement Metrics
Money in the Bank
1 32
25
1
Financial Statement Metrics
2 43
26
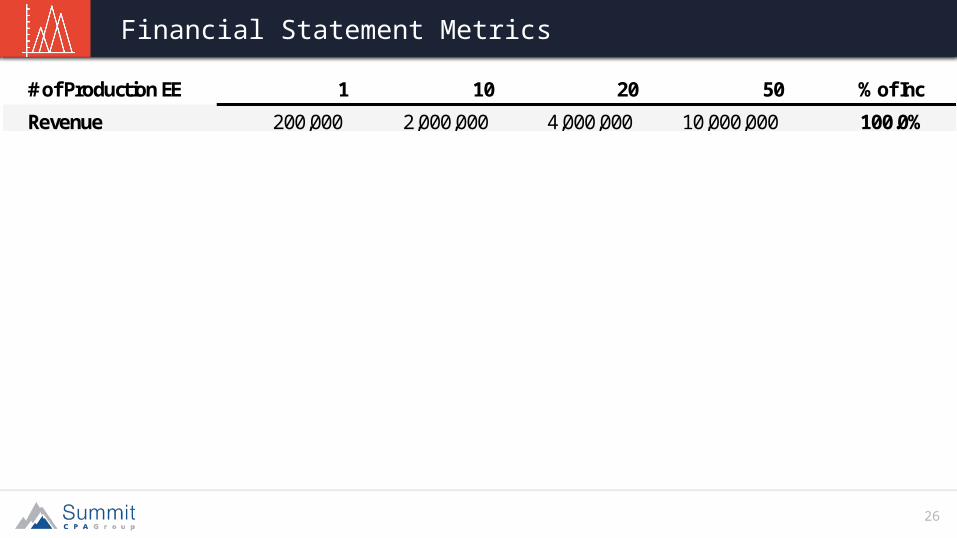
# of Production EE 1 10 20 50 % of IncRevenue 200,000 2,000,000 4,000,000 10,000,000 100.0%
Financial Statement Metrics
27
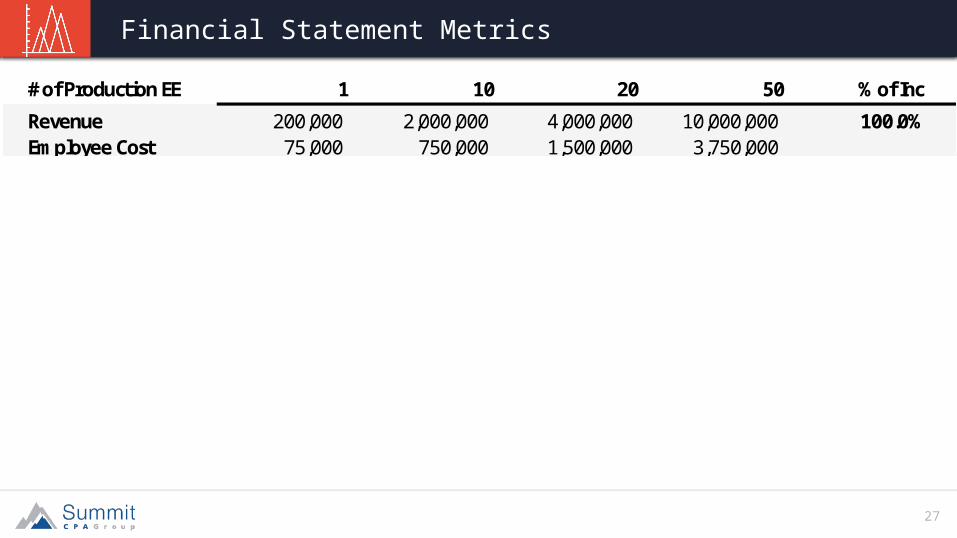
# of Production EE 1 10 20 50 % of IncRevenue 200,000 2,000,000 4,000,000 10,000,000 100.0%Employee Cost 75,000 750,000 1,500,000 3,750,000
Financial Statement Metrics
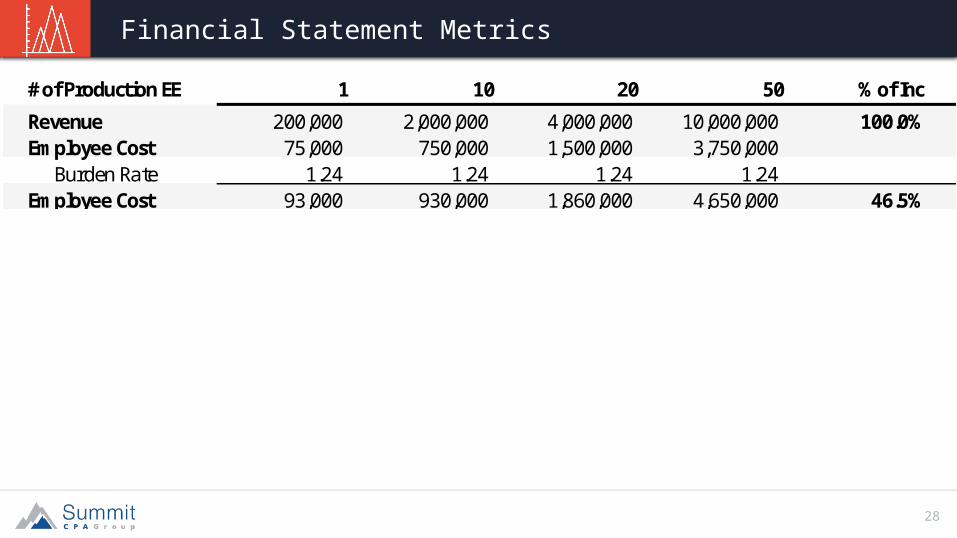
28
# of Production EE 1 10 20 50 % of IncRevenue 200,000 2,000,000 4,000,000 10,000,000 100.0%Employee Cost 75,000 750,000 1,500,000 3,750,000
Burden Rate 1.24 1.24 1.24 1.24 Employee Cost 93,000 930,000 1,860,000 4,650,000 46.5%
Financial Statement Metrics
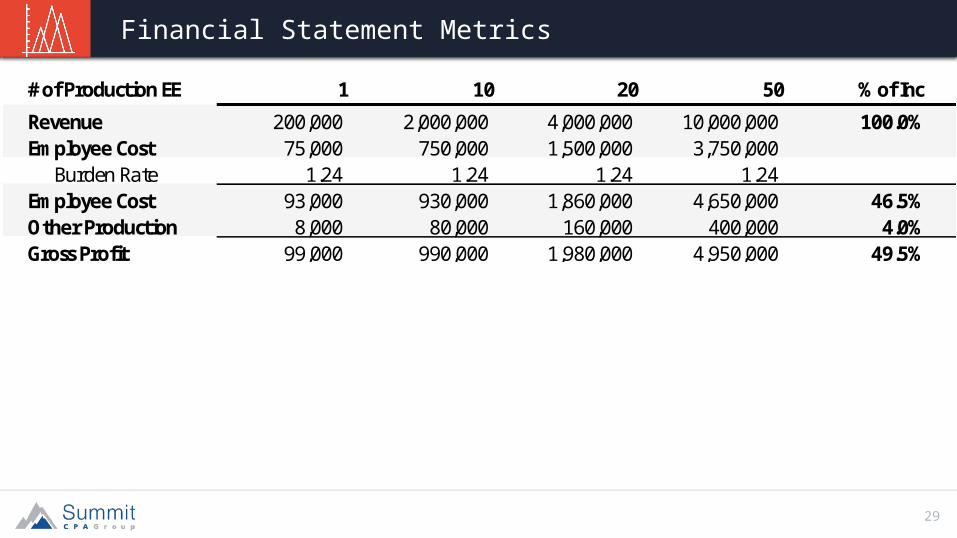
29
# of Production EE 1 10 20 50 % of IncRevenue 200,000 2,000,000 4,000,000 10,000,000 100.0%Employee Cost 75,000 750,000 1,500,000 3,750,000
Burden Rate 1.24 1.24 1.24 1.24 Employee Cost 93,000 930,000 1,860,000 4,650,000 46.5%Other Production 8,000 80,000 160,000 400,000 4.0%Gross Profit 99,000 990,000 1,980,000 4,950,000 49.5%
Financial Statement Metrics
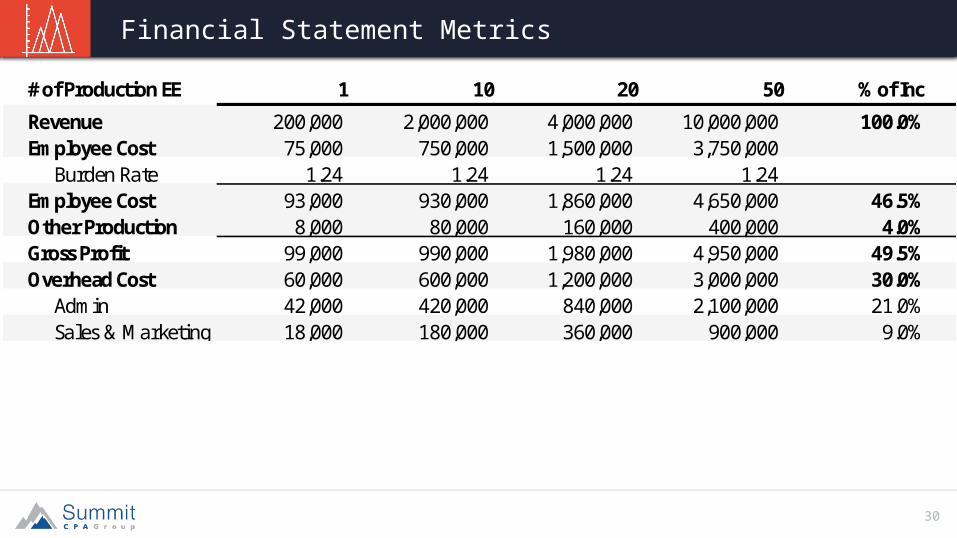
30
# of Production EE 1 10 20 50 % of IncRevenue 200,000 2,000,000 4,000,000 10,000,000 100.0%Employee Cost 75,000 750,000 1,500,000 3,750,000
Burden Rate 1.24 1.24 1.24 1.24 Employee Cost 93,000 930,000 1,860,000 4,650,000 46.5%Other Production 8,000 80,000 160,000 400,000 4.0%Gross Profit 99,000 990,000 1,980,000 4,950,000 49.5%Overhead Cost 60,000 600,000 1,200,000 3,000,000 30.0%
Admin 42,000 420,000 840,000 2,100,000 21.0%Sales & Marketing 18,000 180,000 360,000 900,000 9.0%
Financial Statement Metrics
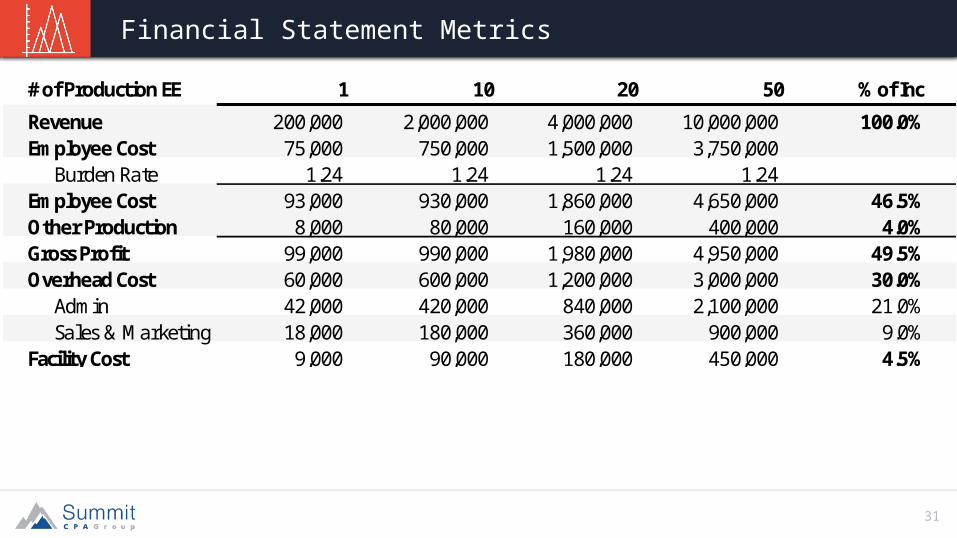
31
# of Production EE 1 10 20 50 % of IncRevenue 200,000 2,000,000 4,000,000 10,000,000 100.0%Employee Cost 75,000 750,000 1,500,000 3,750,000
Burden Rate 1.24 1.24 1.24 1.24 Employee Cost 93,000 930,000 1,860,000 4,650,000 46.5%Other Production 8,000 80,000 160,000 400,000 4.0%Gross Profit 99,000 990,000 1,980,000 4,950,000 49.5%Overhead Cost 60,000 600,000 1,200,000 3,000,000 30.0%
Admin 42,000 420,000 840,000 2,100,000 21.0%Sales & Marketing 18,000 180,000 360,000 900,000 9.0%
Facility Cost 9,000 90,000 180,000 450,000 4.5%
Financial Statement Metrics
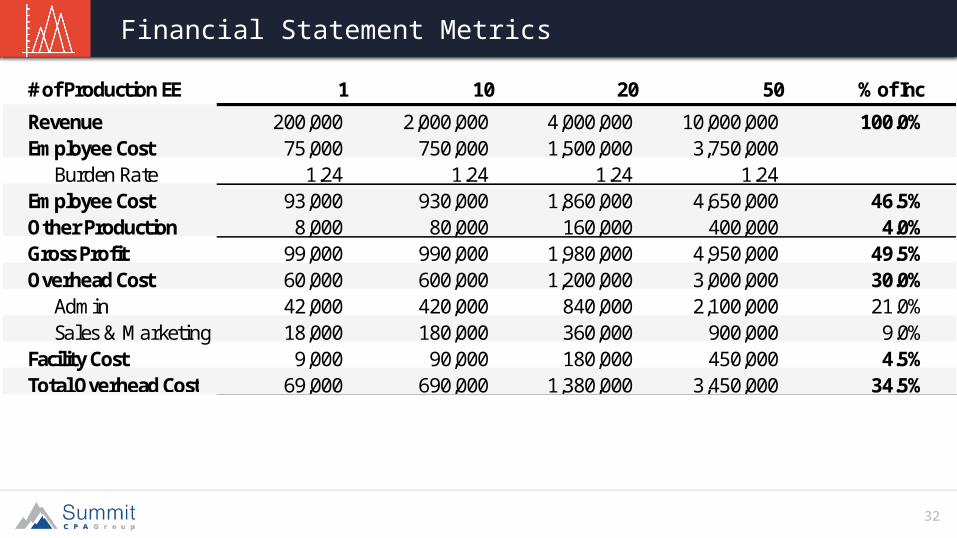
32
# of Production EE 1 10 20 50 % of IncRevenue 200,000 2,000,000 4,000,000 10,000,000 100.0%Employee Cost 75,000 750,000 1,500,000 3,750,000
Burden Rate 1.24 1.24 1.24 1.24 Employee Cost 93,000 930,000 1,860,000 4,650,000 46.5%Other Production 8,000 80,000 160,000 400,000 4.0%Gross Profit 99,000 990,000 1,980,000 4,950,000 49.5%Overhead Cost 60,000 600,000 1,200,000 3,000,000 30.0%
Admin 42,000 420,000 840,000 2,100,000 21.0%Sales & Marketing 18,000 180,000 360,000 900,000 9.0%
Facility Cost 9,000 90,000 180,000 450,000 4.5%Total Overhead Cost 69,000 690,000 1,380,000 3,450,000 34.5%
Financial Statement Metrics
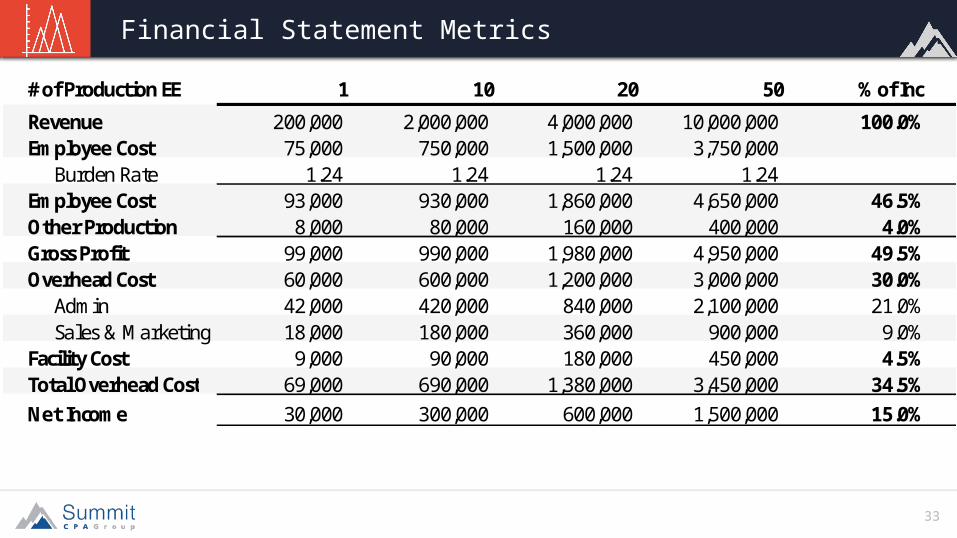
33
# of Production EE 1 10 20 50 % of IncRevenue 200,000 2,000,000 4,000,000 10,000,000 100.0%Employee Cost 75,000 750,000 1,500,000 3,750,000
Burden Rate 1.24 1.24 1.24 1.24 Employee Cost 93,000 930,000 1,860,000 4,650,000 46.5%Other Production 8,000 80,000 160,000 400,000 4.0%Gross Profit 99,000 990,000 1,980,000 4,950,000 49.5%Overhead Cost 60,000 600,000 1,200,000 3,000,000 30.0%
Admin 42,000 420,000 840,000 2,100,000 21.0%Sales & Marketing 18,000 180,000 360,000 900,000 9.0%
Facility Cost 9,000 90,000 180,000 450,000 4.5%Total Overhead Cost 69,000 690,000 1,380,000 3,450,000 34.5%Net Income 30,000 300,000 600,000 1,500,000 15.0%
Financial Statement Metrics
34
Chart of Accounts
4
Cash vs Accrual
Financial Statement Metrics
Money in the Bank
1 42 3
35
1
Money in the Bank
2 3 4
37
Money in the Bank
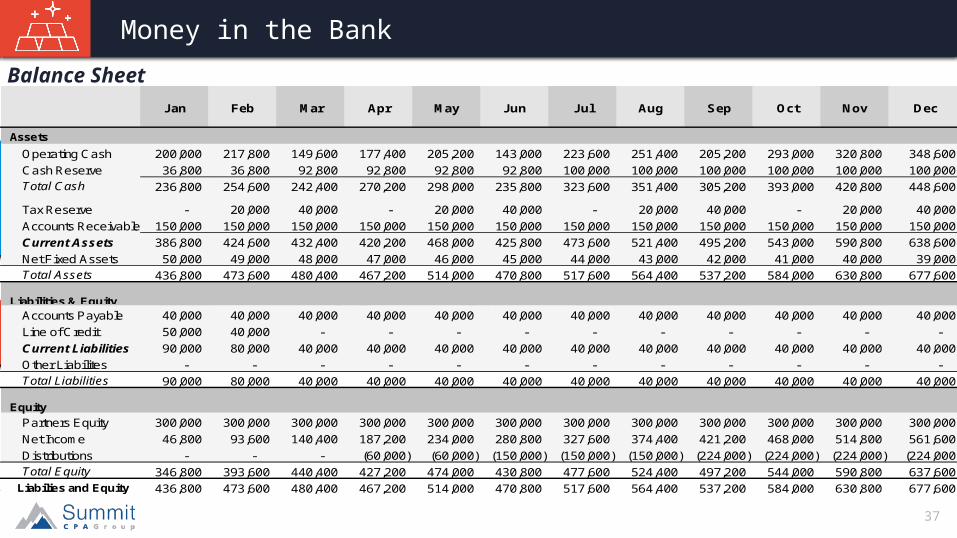
Jan Feb Mar Apr May Jun Jul Aug Sep Oct Nov Dec
AssetsOperating Cash 200,000 217,800 149,600 177,400 205,200 143,000 223,600 251,400 205,200 293,000 320,800 348,600 Cash Reserve 36,800 36,800 92,800 92,800 92,800 92,800 100,000 100,000 100,000 100,000 100,000 100,000 Total Cash 236,800 254,600 242,400 270,200 298,000 235,800 323,600 351,400 305,200 393,000 420,800 448,600
Tax Reserve - 20,000 40,000 - 20,000 40,000 - 20,000 40,000 - 20,000 40,000 Accounts Receivable 150,000 150,000 150,000 150,000 150,000 150,000 150,000 150,000 150,000 150,000 150,000 150,000 Current Assets 386,800 424,600 432,400 420,200 468,000 425,800 473,600 521,400 495,200 543,000 590,800 638,600 Net Fixed Assets 50,000 49,000 48,000 47,000 46,000 45,000 44,000 43,000 42,000 41,000 40,000 39,000
Total AssetsTotal Assets 436,800 473,600 480,400 467,200 514,000 470,800 517,600 564,400 537,200 584,000 630,800 677,600
Liabilities & EquityAccounts Payable 40,000 40,000 40,000 40,000 40,000 40,000 40,000 40,000 40,000 40,000 40,000 40,000 Line of Credit 50,000 40,000 - - - - - - - - - - Current Liabilities 90,000 80,000 40,000 40,000 40,000 40,000 40,000 40,000 40,000 40,000 40,000 40,000 Other Liabilites - - - - - - - - - - - - Total Liabilities 90,000 80,000 40,000 40,000 40,000 40,000 40,000 40,000 40,000 40,000 40,000 40,000
EquityPartners Equity 300,000 300,000 300,000 300,000 300,000 300,000 300,000 300,000 300,000 300,000 300,000 300,000 Net Income 46,800 93,600 140,400 187,200 234,000 280,800 327,600 374,400 421,200 468,000 514,800 561,600 Distributions - - - (60,000) (60,000) (150,000) (150,000) (150,000) (224,000) (224,000) (224,000) (224,000) Total Equity 346,800 393,600 440,400 427,200 474,000 430,800 477,600 524,400 497,200 544,000 590,800 637,600
Liabilies and Equity 436,800 473,600 480,400 467,200 514,000 470,800 517,600 564,400 537,200 584,000 630,800 677,600
Balance Sheet

38
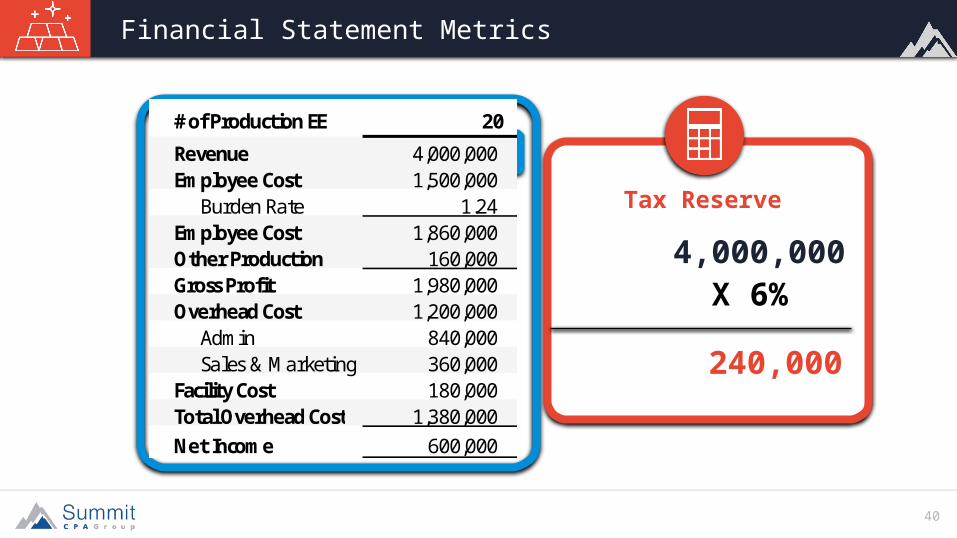
# of Production EE 20
Revenue 4,000,000 Employee Cost 1,500,000
Burden Rate 1.24 Employee Cost 1,860,000 Other Production 160,000 Gross Profit 1,980,000 Overhead Cost 1,200,000
Admin 840,000 Sales & Marketing 360,000
Facility Cost 180,000 Total Overhead Cost 1,380,000 Net Income 600,000
Financial Statement Metrics
4,000,000X 10%
400,000
Cash on Hand

39
Money in the Bank
Jan Feb Mar Apr May Jun Jul Aug Sep Oct Nov Dec
AssetsOperating Cash 200,000 217,800 149,600 177,400 205,200 143,000 223,600 251,400 205,200 293,000 320,800 348,600 Cash Reserve 36,800 36,800 92,800 92,800 92,800 92,800 100,000 100,000 100,000 100,000 100,000 100,000 Total Cash 236,800 254,600 242,400 270,200 298,000 235,800 323,600 351,400 305,200 393,000 420,800 448,600
Tax Reserve - 20,000 40,000 - 20,000 40,000 - 20,000 40,000 - 20,000 40,000 Accounts Receivable 150,000 150,000 150,000 150,000 150,000 150,000 150,000 150,000 150,000 150,000 150,000 150,000 Current Assets 386,800 424,600 432,400 420,200 468,000 425,800 473,600 521,400 495,200 543,000 590,800 638,600 Net Fixed Assets 50,000 49,000 48,000 47,000 46,000 45,000 44,000 43,000 42,000 41,000 40,000 39,000
Total AssetsTotal Assets 436,800 473,600 480,400 467,200 514,000 470,800 517,600 564,400 537,200 584,000 630,800 677,600
Liabilities & EquityAccounts Payable 40,000 40,000 40,000 40,000 40,000 40,000 40,000 40,000 40,000 40,000 40,000 40,000 Line of Credit 50,000 40,000 - - - - - - - - - - Current Liabilities 90,000 80,000 40,000 40,000 40,000 40,000 40,000 40,000 40,000 40,000 40,000 40,000 Other Liabilites - - - - - - - - - - - - Total Liabilities 90,000 80,000 40,000 40,000 40,000 40,000 40,000 40,000 40,000 40,000 40,000 40,000
EquityPartners Equity 300,000 300,000 300,000 300,000 300,000 300,000 300,000 300,000 300,000 300,000 300,000 300,000 Net Income 46,800 93,600 140,400 187,200 234,000 280,800 327,600 374,400 421,200 468,000 514,800 561,600 Distributions - - - (60,000) (60,000) (150,000) (150,000) (150,000) (224,000) (224,000) (224,000) (224,000) Total Equity 346,800 393,600 440,400 427,200 474,000 430,800 477,600 524,400 497,200 544,000 590,800 637,600
Liabilies and Equity 436,800 473,600 480,400 467,200 514,000 470,800 517,600 564,400 537,200 584,000 630,800 677,600
Balance Sheet
4,000,000x 10%
400,000
Cash on Hand
40
# of Production EE 20
Revenue 4,000,000 Employee Cost 1,500,000
Burden Rate 1.24 Employee Cost 1,860,000 Other Production 160,000 Gross Profit 1,980,000 Overhead Cost 1,200,000
Admin 840,000 Sales & Marketing 360,000
Facility Cost 180,000 Total Overhead Cost 1,380,000 Net Income 600,000
Financial Statement Metrics
4,000,000X 6%
240,000
Tax Reserve

41
Money in the Bank
Jan Feb Mar Apr May Jun Jul Aug Sep Oct Nov Dec
AssetsOperating Cash 200,000 217,800 149,600 177,400 205,200 143,000 223,600 251,400 205,200 293,000 320,800 348,600 Cash Reserve 36,800 36,800 92,800 92,800 92,800 92,800 100,000 100,000 100,000 100,000 100,000 100,000 Total Cash 236,800 254,600 242,400 270,200 298,000 235,800 323,600 351,400 305,200 393,000 420,800 448,600
Tax Reserve - 20,000 40,000 - 20,000 40,000 - 20,000 40,000 - 20,000 40,000 Accounts Receivable 150,000 150,000 150,000 150,000 150,000 150,000 150,000 150,000 150,000 150,000 150,000 150,000 Current Assets 386,800 424,600 432,400 420,200 468,000 425,800 473,600 521,400 495,200 543,000 590,800 638,600 Net Fixed Assets 50,000 49,000 48,000 47,000 46,000 45,000 44,000 43,000 42,000 41,000 40,000 39,000
Total AssetsTotal Assets 436,800 473,600 480,400 467,200 514,000 470,800 517,600 564,400 537,200 584,000 630,800 677,600
Liabilities & EquityAccounts Payable 40,000 40,000 40,000 40,000 40,000 40,000 40,000 40,000 40,000 40,000 40,000 40,000 Line of Credit 50,000 40,000 - - - - - - - - - - Current Liabilities 90,000 80,000 40,000 40,000 40,000 40,000 40,000 40,000 40,000 40,000 40,000 40,000 Other Liabilites - - - - - - - - - - - - Total Liabilities 90,000 80,000 40,000 40,000 40,000 40,000 40,000 40,000 40,000 40,000 40,000 40,000
EquityPartners Equity 300,000 300,000 300,000 300,000 300,000 300,000 300,000 300,000 300,000 300,000 300,000 300,000 Net Income 46,800 93,600 140,400 187,200 234,000 280,800 327,600 374,400 421,200 468,000 514,800 561,600 Distributions - - - (60,000) (60,000) (150,000) (150,000) (150,000) (224,000) (224,000) (224,000) (224,000) Total Equity 346,800 393,600 440,400 427,200 474,000 430,800 477,600 524,400 497,200 544,000 590,800 637,600
Liabilies and Equity 436,800 473,600 480,400 467,200 514,000 470,800 517,600 564,400 537,200 584,000 630,800 677,600
Balance Sheet
40,000+ 224,000
264,000
Tax Reserve

42
Money in the Bank
Jan Feb Mar Apr May Jun Jul Aug Sep Oct Nov Dec
AssetsOperating Cash 200,000 217,800 149,600 177,400 205,200 143,000 223,600 251,400 205,200 293,000 320,800 348,600 Cash Reserve 36,800 36,800 92,800 92,800 92,800 92,800 100,000 100,000 100,000 100,000 100,000 100,000 Total Cash 236,800 254,600 242,400 270,200 298,000 235,800 323,600 351,400 305,200 393,000 420,800 448,600
Tax Reserve - 20,000 40,000 - 20,000 40,000 - 20,000 40,000 - 20,000 40,000 Accounts Receivable 150,000 150,000 150,000 150,000 150,000 150,000 150,000 150,000 150,000 150,000 150,000 150,000 Current Assets 386,800 424,600 432,400 420,200 468,000 425,800 473,600 521,400 495,200 543,000 590,800 638,600 Net Fixed Assets 50,000 49,000 48,000 47,000 46,000 45,000 44,000 43,000 42,000 41,000 40,000 39,000
Total AssetsTotal Assets 436,800 473,600 480,400 467,200 514,000 470,800 517,600 564,400 537,200 584,000 630,800 677,600
Liabilities & EquityAccounts Payable 40,000 40,000 40,000 40,000 40,000 40,000 40,000 40,000 40,000 40,000 40,000 40,000 Line of Credit 50,000 40,000 - - - - - - - - - - Current Liabilities 90,000 80,000 40,000 40,000 40,000 40,000 40,000 40,000 40,000 40,000 40,000 40,000 Other Liabilites - - - - - - - - - - - - Total Liabilities 90,000 80,000 40,000 40,000 40,000 40,000 40,000 40,000 40,000 40,000 40,000 40,000
EquityPartners Equity 300,000 300,000 300,000 300,000 300,000 300,000 300,000 300,000 300,000 300,000 300,000 300,000 Net Income 46,800 93,600 140,400 187,200 234,000 280,800 327,600 374,400 421,200 468,000 514,800 561,600 Distributions - - - (60,000) (60,000) (150,000) (150,000) (150,000) (224,000) (224,000) (224,000) (224,000) Total Equity 346,800 393,600 440,400 427,200 474,000 430,800 477,600 524,400 497,200 544,000 590,800 637,600
Liabilies and Equity 436,800 473,600 480,400 467,200 514,000 470,800 517,600 564,400 537,200 584,000 630,800 677,600
Balance Sheet
43
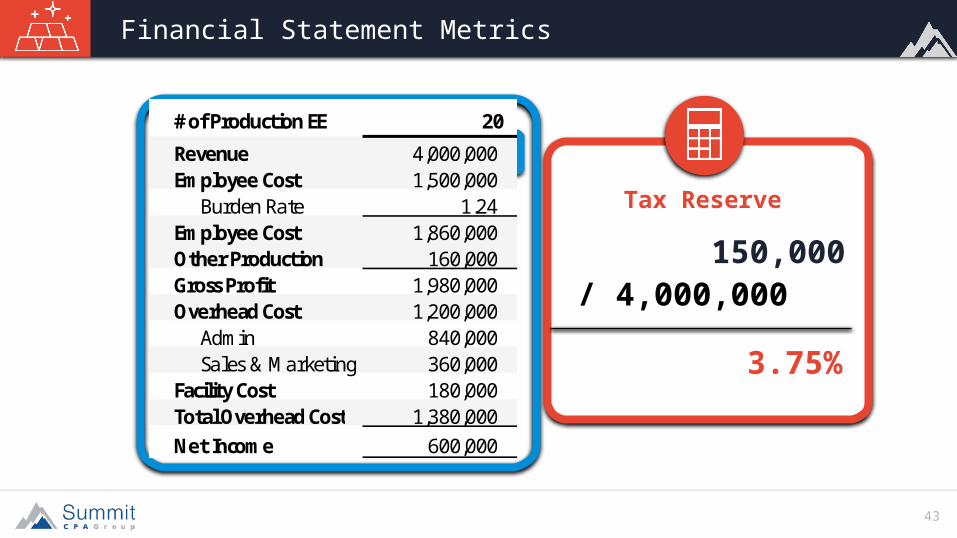
# of Production EE 20
Revenue 4,000,000 Employee Cost 1,500,000
Burden Rate 1.24 Employee Cost 1,860,000 Other Production 160,000 Gross Profit 1,980,000 Overhead Cost 1,200,000
Admin 840,000 Sales & Marketing 360,000
Facility Cost 180,000 Total Overhead Cost 1,380,000 Net Income 600,000
Financial Statement Metrics
150,000/ 4,000,000
3.75%
Tax Reserve
44
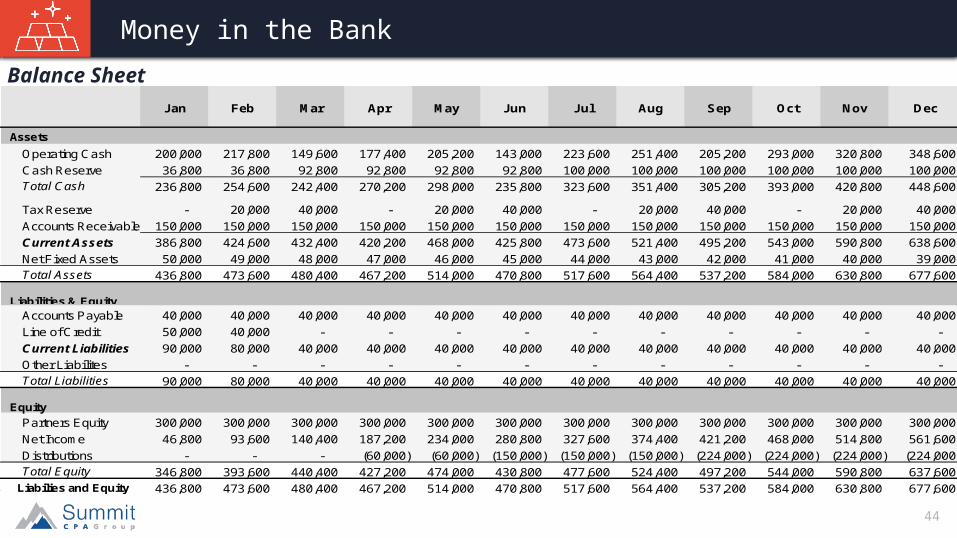
Money in the Bank
Jan Feb Mar Apr May Jun Jul Aug Sep Oct Nov Dec
AssetsOperating Cash 200,000 217,800 149,600 177,400 205,200 143,000 223,600 251,400 205,200 293,000 320,800 348,600 Cash Reserve 36,800 36,800 92,800 92,800 92,800 92,800 100,000 100,000 100,000 100,000 100,000 100,000 Total Cash 236,800 254,600 242,400 270,200 298,000 235,800 323,600 351,400 305,200 393,000 420,800 448,600
Tax Reserve - 20,000 40,000 - 20,000 40,000 - 20,000 40,000 - 20,000 40,000 Accounts Receivable 150,000 150,000 150,000 150,000 150,000 150,000 150,000 150,000 150,000 150,000 150,000 150,000 Current Assets 386,800 424,600 432,400 420,200 468,000 425,800 473,600 521,400 495,200 543,000 590,800 638,600 Net Fixed Assets 50,000 49,000 48,000 47,000 46,000 45,000 44,000 43,000 42,000 41,000 40,000 39,000
Total AssetsTotal Assets 436,800 473,600 480,400 467,200 514,000 470,800 517,600 564,400 537,200 584,000 630,800 677,600
Liabilities & EquityAccounts Payable 40,000 40,000 40,000 40,000 40,000 40,000 40,000 40,000 40,000 40,000 40,000 40,000 Line of Credit 50,000 40,000 - - - - - - - - - - Current Liabilities 90,000 80,000 40,000 40,000 40,000 40,000 40,000 40,000 40,000 40,000 40,000 40,000 Other Liabilites - - - - - - - - - - - - Total Liabilities 90,000 80,000 40,000 40,000 40,000 40,000 40,000 40,000 40,000 40,000 40,000 40,000
EquityPartners Equity 300,000 300,000 300,000 300,000 300,000 300,000 300,000 300,000 300,000 300,000 300,000 300,000 Net Income 46,800 93,600 140,400 187,200 234,000 280,800 327,600 374,400 421,200 468,000 514,800 561,600 Distributions - - - (60,000) (60,000) (150,000) (150,000) (150,000) (224,000) (224,000) (224,000) (224,000) Total Equity 346,800 393,600 440,400 427,200 474,000 430,800 477,600 524,400 497,200 544,000 590,800 637,600
Liabilies and Equity 436,800 473,600 480,400 467,200 514,000 470,800 517,600 564,400 537,200 584,000 630,800 677,600
Balance Sheet
150,000/ 4,000,000
3.75%
A/R
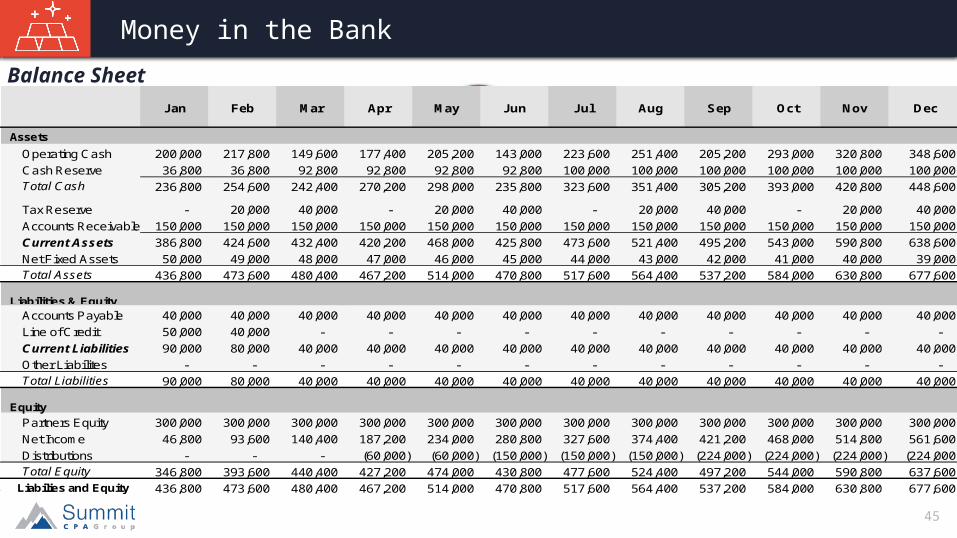
45
Money in the Bank
Jan Feb Mar Apr May Jun Jul Aug Sep Oct Nov Dec
AssetsOperating Cash 200,000 217,800 149,600 177,400 205,200 143,000 223,600 251,400 205,200 293,000 320,800 348,600 Cash Reserve 36,800 36,800 92,800 92,800 92,800 92,800 100,000 100,000 100,000 100,000 100,000 100,000 Total Cash 236,800 254,600 242,400 270,200 298,000 235,800 323,600 351,400 305,200 393,000 420,800 448,600
Tax Reserve - 20,000 40,000 - 20,000 40,000 - 20,000 40,000 - 20,000 40,000 Accounts Receivable 150,000 150,000 150,000 150,000 150,000 150,000 150,000 150,000 150,000 150,000 150,000 150,000 Current Assets 386,800 424,600 432,400 420,200 468,000 425,800 473,600 521,400 495,200 543,000 590,800 638,600 Net Fixed Assets 50,000 49,000 48,000 47,000 46,000 45,000 44,000 43,000 42,000 41,000 40,000 39,000
Total AssetsTotal Assets 436,800 473,600 480,400 467,200 514,000 470,800 517,600 564,400 537,200 584,000 630,800 677,600
Liabilities & EquityAccounts Payable 40,000 40,000 40,000 40,000 40,000 40,000 40,000 40,000 40,000 40,000 40,000 40,000 Line of Credit 50,000 40,000 - - - - - - - - - - Current Liabilities 90,000 80,000 40,000 40,000 40,000 40,000 40,000 40,000 40,000 40,000 40,000 40,000 Other Liabilites - - - - - - - - - - - - Total Liabilities 90,000 80,000 40,000 40,000 40,000 40,000 40,000 40,000 40,000 40,000 40,000 40,000
EquityPartners Equity 300,000 300,000 300,000 300,000 300,000 300,000 300,000 300,000 300,000 300,000 300,000 300,000 Net Income 46,800 93,600 140,400 187,200 234,000 280,800 327,600 374,400 421,200 468,000 514,800 561,600 Distributions - - - (60,000) (60,000) (150,000) (150,000) (150,000) (224,000) (224,000) (224,000) (224,000) Total Equity 346,800 393,600 440,400 427,200 474,000 430,800 477,600 524,400 497,200 544,000 590,800 637,600
Liabilies and Equity 436,800 473,600 480,400 467,200 514,000 470,800 517,600 564,400 537,200 584,000 630,800 677,600
Balance Sheet
Quick Ratio
$638,600 / 40,000
16:1
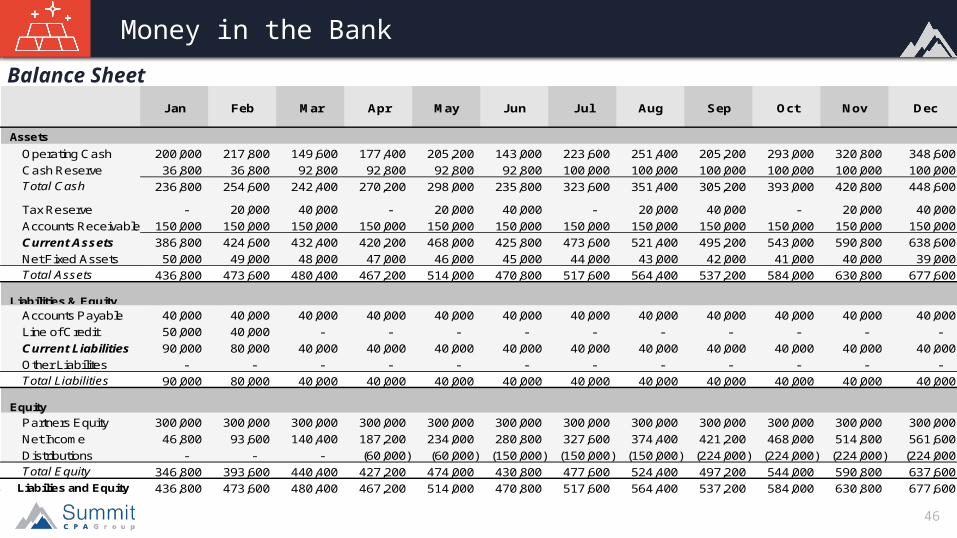
46
Money in the Bank
Jan Feb Mar Apr May Jun Jul Aug Sep Oct Nov Dec
AssetsOperating Cash 200,000 217,800 149,600 177,400 205,200 143,000 223,600 251,400 205,200 293,000 320,800 348,600 Cash Reserve 36,800 36,800 92,800 92,800 92,800 92,800 100,000 100,000 100,000 100,000 100,000 100,000 Total Cash 236,800 254,600 242,400 270,200 298,000 235,800 323,600 351,400 305,200 393,000 420,800 448,600
Tax Reserve - 20,000 40,000 - 20,000 40,000 - 20,000 40,000 - 20,000 40,000 Accounts Receivable 150,000 150,000 150,000 150,000 150,000 150,000 150,000 150,000 150,000 150,000 150,000 150,000 Current Assets 386,800 424,600 432,400 420,200 468,000 425,800 473,600 521,400 495,200 543,000 590,800 638,600 Net Fixed Assets 50,000 49,000 48,000 47,000 46,000 45,000 44,000 43,000 42,000 41,000 40,000 39,000
Total AssetsTotal Assets 436,800 473,600 480,400 467,200 514,000 470,800 517,600 564,400 537,200 584,000 630,800 677,600
Liabilities & EquityAccounts Payable 40,000 40,000 40,000 40,000 40,000 40,000 40,000 40,000 40,000 40,000 40,000 40,000 Line of Credit 50,000 40,000 - - - - - - - - - - Current Liabilities 90,000 80,000 40,000 40,000 40,000 40,000 40,000 40,000 40,000 40,000 40,000 40,000 Other Liabilites - - - - - - - - - - - - Total Liabilities 90,000 80,000 40,000 40,000 40,000 40,000 40,000 40,000 40,000 40,000 40,000 40,000
EquityPartners Equity 300,000 300,000 300,000 300,000 300,000 300,000 300,000 300,000 300,000 300,000 300,000 300,000 Net Income 46,800 93,600 140,400 187,200 234,000 280,800 327,600 374,400 421,200 468,000 514,800 561,600 Distributions - - - (60,000) (60,000) (150,000) (150,000) (150,000) (224,000) (224,000) (224,000) (224,000) Total Equity 346,800 393,600 440,400 427,200 474,000 430,800 477,600 524,400 497,200 544,000 590,800 637,600
Liabilies and Equity 436,800 473,600 480,400 467,200 514,000 470,800 517,600 564,400 537,200 584,000 630,800 677,600
Balance Sheet
638,600/ 40,000
16:1
Quick Ratio

48
Chart of Accounts
4321
Cash vs Accrual
Financial Statement Metrics
Money in the Bank

Questions? Need more info?Feel free to get in touch!
Summit CPA Group
Jody Grunden, [email protected]
www.summitcpa.net


![Digital Marketing at Asset Management Firms [INFOGRAPHIC]](https://img.pdfslide.net/doc/110x75/587a1b961a28abb4238b6631/digital-marketing-at-asset-management-firms-infographic.jpg)