Embed Size (px)
Citation preview
Sponsored by: A Service
Of:
Financial Management for Mature Organizations
Anthony Reese
October 17, 2012
Sponsored by: A Service
Of:
Advising nonprofits in:
• Strategy
• Planning
• Organizational Development
www.synthesispartnership.com
(617) 969-1881
INTEGRATED PLANNING

Sponsored by: A Service
Of:
www.mission.do

Sponsored by: A Service
Of:
Today’s Speaker
Anthony Reese CFO and Vice President of Financial
Management Practice
Olive Grove Consulting Assisting with chat questions: Jamie Maloney, Nonprofit Webinars
Hosting:
Sam Frank, Synthesis Partnership

FINANCIAL MANAGEMENT IN
MATURE ORGANIZATIONS
Presented by:
Anthony Reese
CFO/Vice-President: Financial Management Practice
Anthony Reese
• 23 years of experience as a consultant and senior manager
in non-profit organizations
• Vice-President for Financial Management Practice Area at
Olive Grove Consulting
• Specializing in building financial infrastructure, growth
modeling, scenario planning, financial consolidations and
capitalization
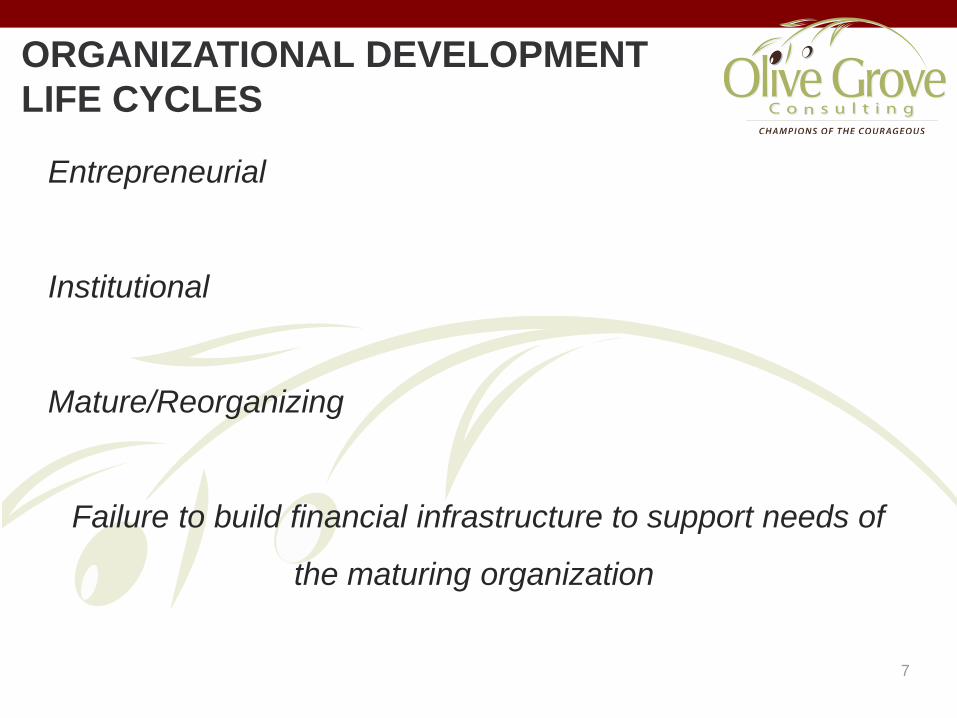
ORGANIZATIONAL DEVELOPMENT
LIFE CYCLES
Entrepreneurial
Institutional
Mature/Reorganizing
Failure to build financial infrastructure to support needs of
the maturing organization
7
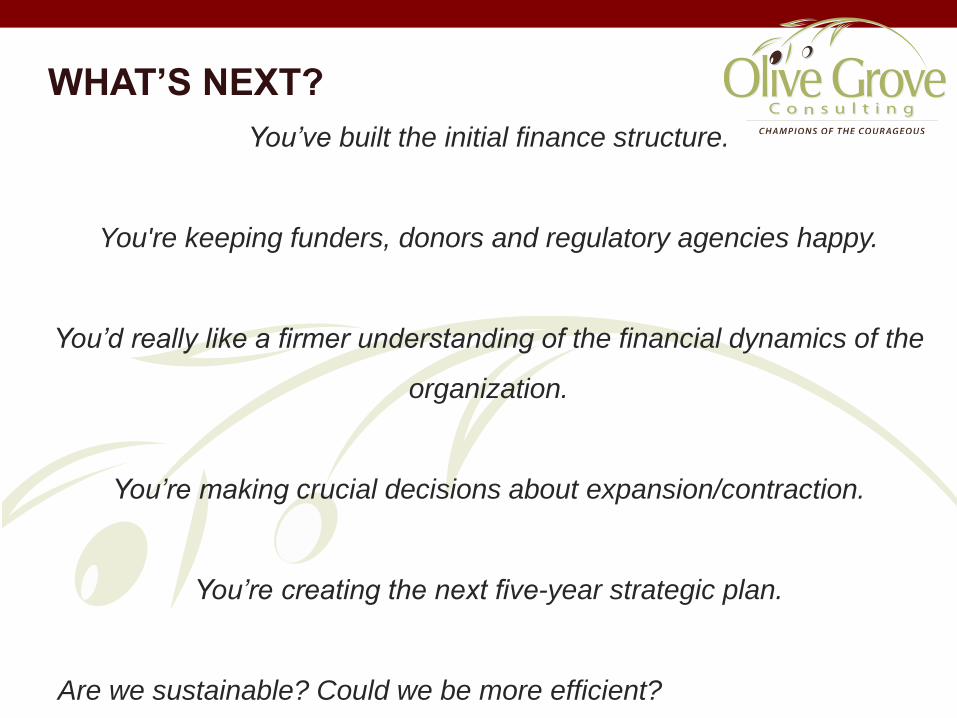
WHAT’S NEXT?
You’ve built the initial finance structure.
You're keeping funders, donors and regulatory agencies happy.
You’d really like a firmer understanding of the financial dynamics of the
organization.
You’re making crucial decisions about expansion/contraction.
You’re creating the next five-year strategic plan.
Are we sustainable? Could we be more efficient?
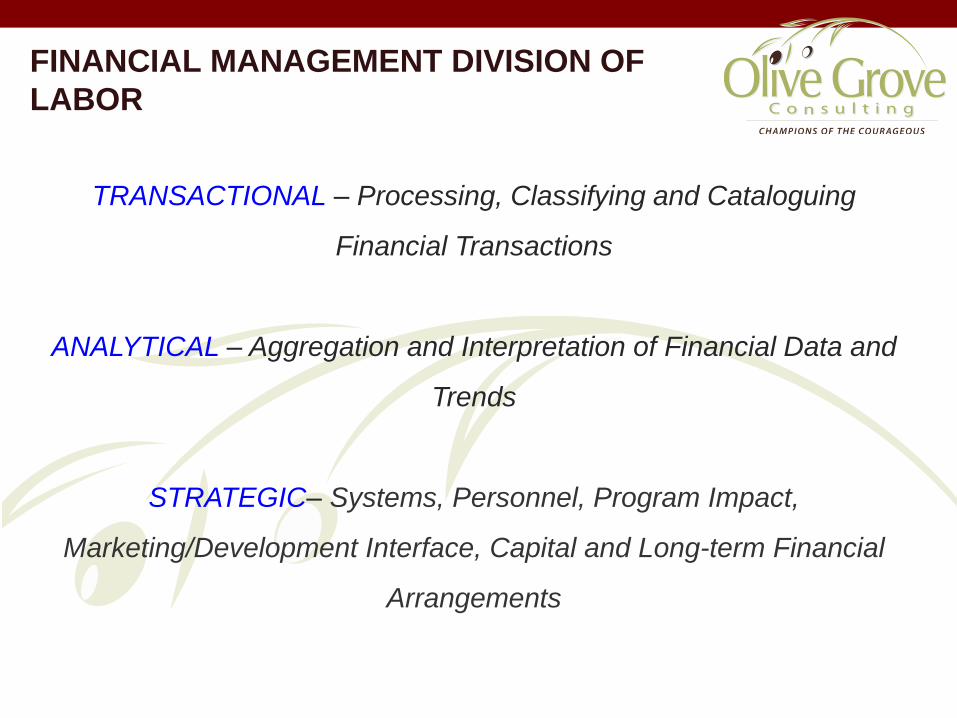
FINANCIAL MANAGEMENT DIVISION OF
LABOR
TRANSACTIONAL – Processing, Classifying and Cataloguing
Financial Transactions
ANALYTICAL – Aggregation and Interpretation of Financial Data and
Trends
STRATEGIC– Systems, Personnel, Program Impact,
Marketing/Development Interface, Capital and Long-term Financial
Arrangements
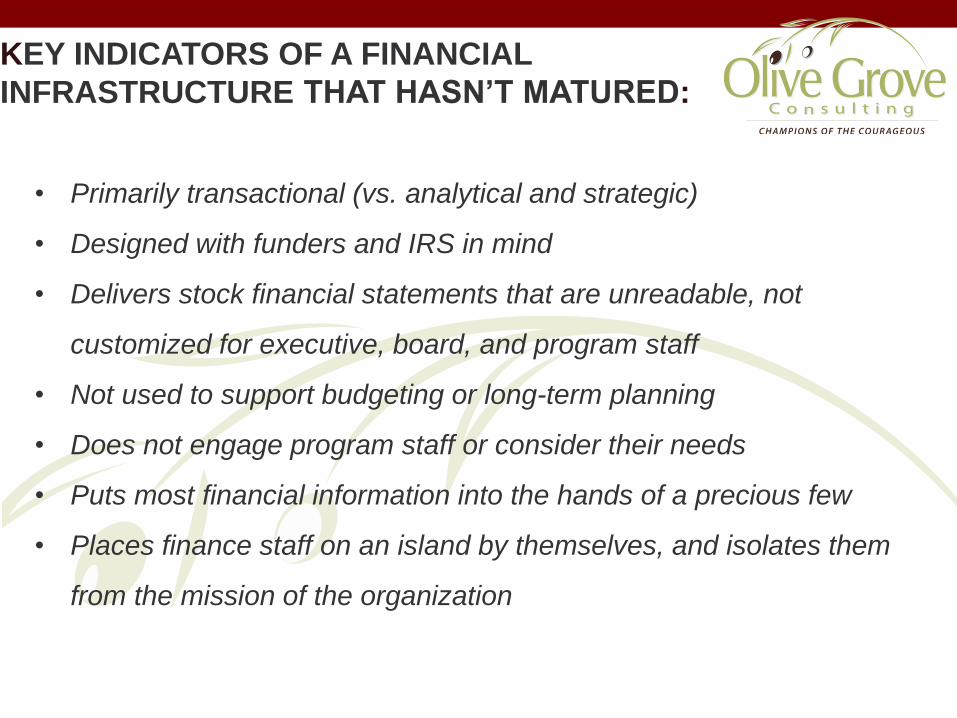
KEY INDICATORS OF A FINANCIAL
INFRASTRUCTURE THAT HASN’T MATURED:
• Primarily transactional (vs. analytical and strategic)
• Designed with funders and IRS in mind
• Delivers stock financial statements that are unreadable, not
customized for executive, board, and program staff
• Not used to support budgeting or long-term planning
• Does not engage program staff or consider their needs
• Puts most financial information into the hands of a precious few
• Places finance staff on an island by themselves, and isolates them
from the mission of the organization
CREATING A MATURE FINANCIAL
INFRASTRUCTURE
Turn finance function outside in
Engage finance in analytical and strategic projects
CREATING A MATURE FINANCIAL
INFRASTRUCTURE: Turn Finance Outside In
Create a shadow system for managerial purposes
Shift finance from purely audit to managerial
Integrate finance into strategic and programmatic decision-
making
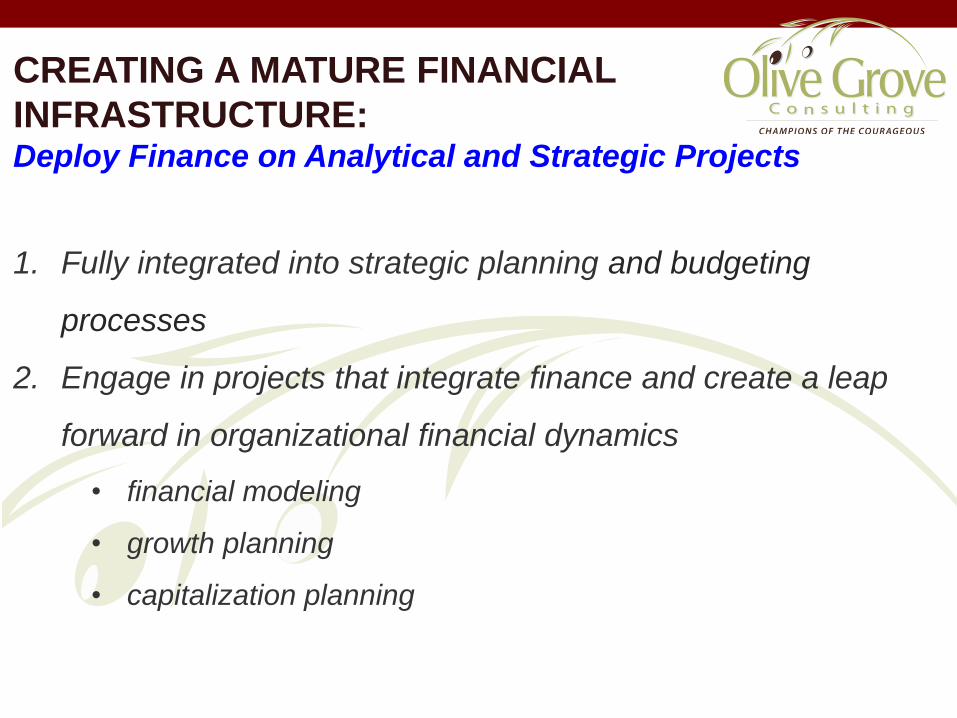
CREATING A MATURE FINANCIAL
INFRASTRUCTURE: Deploy Finance on Analytical and Strategic Projects
1. Fully integrated into strategic planning and budgeting
processes
2. Engage in projects that integrate finance and create a leap
forward in organizational financial dynamics
• financial modeling
• growth planning
• capitalization planning
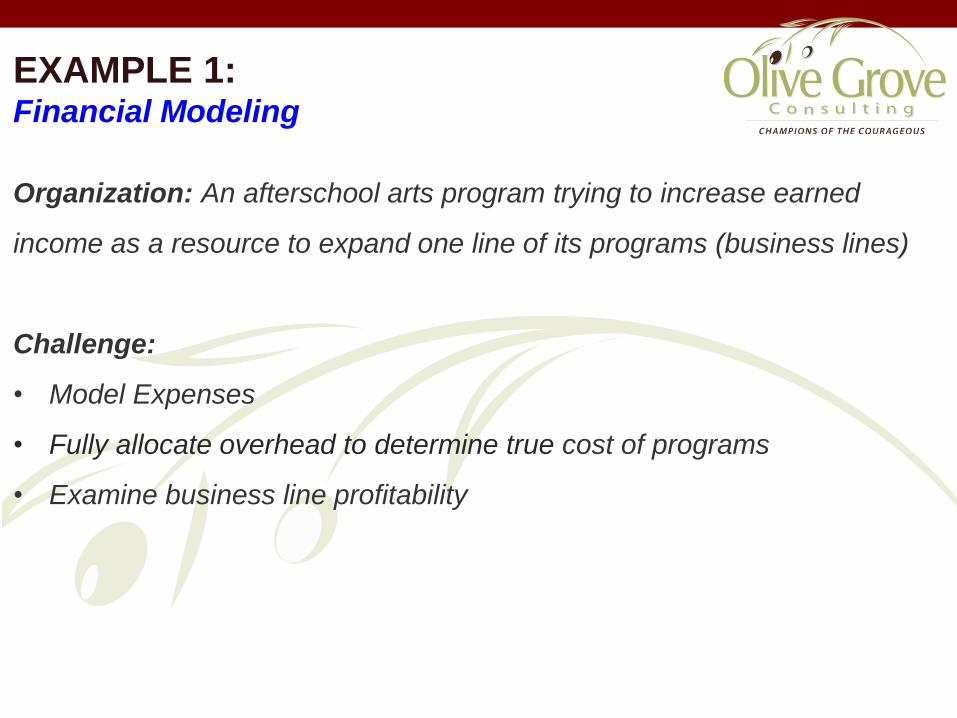
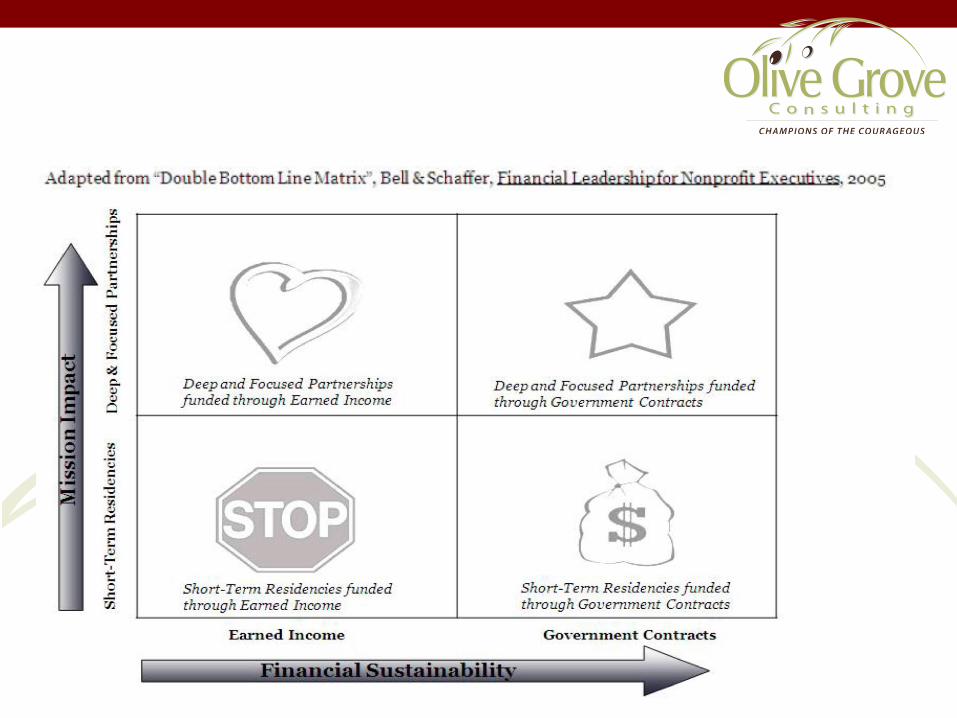
EXAMPLE 1: Financial Modeling
Organization: An afterschool arts program trying to increase earned
income as a resource to expand one line of its programs (business lines)
Challenge:
• Model Expenses
• Fully allocate overhead to determine true cost of programs
• Examine business line profitability
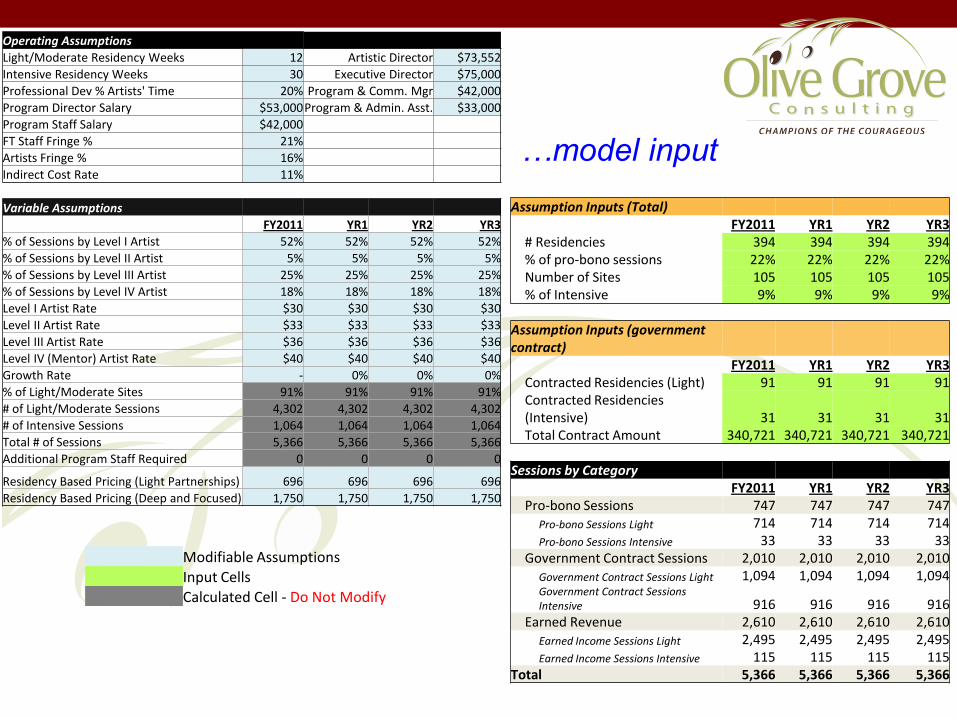
Operating Assumptions
Light/Moderate Residency Weeks 12 Artistic Director $73,552
Intensive Residency Weeks 30 Executive Director $75,000
Professional Dev % Artists' Time 20% Program & Comm. Mgr $42,000
Program Director Salary $53,000 Program & Admin. Asst. $33,000
Program Staff Salary $42,000
FT Staff Fringe % 21%
Artists Fringe % 16%
Indirect Cost Rate 11%
Variable Assumptions
FY2011 YR1 YR2 YR3
% of Sessions by Level I Artist 52% 52% 52% 52%
% of Sessions by Level II Artist 5% 5% 5% 5%
% of Sessions by Level III Artist 25% 25% 25% 25%
% of Sessions by Level IV Artist 18% 18% 18% 18%
Level I Artist Rate $30 $30 $30 $30
Level II Artist Rate $33 $33 $33 $33
Level III Artist Rate $36 $36 $36 $36
Level IV (Mentor) Artist Rate $40 $40 $40 $40
Growth Rate - 0% 0% 0%
% of Light/Moderate Sites 91% 91% 91% 91%
# of Light/Moderate Sessions 4,302 4,302 4,302 4,302
# of Intensive Sessions 1,064 1,064 1,064 1,064
Total # of Sessions 5,366 5,366 5,366 5,366
Additional Program Staff Required 0 0 0 0
Residency Based Pricing (Light Partnerships) 696 696 696 696
Residency Based Pricing (Deep and Focused) 1,750 1,750 1,750 1,750
Assumption Inputs (Total) FY2011 YR1 YR2 YR3
# Residencies 394 394 394 394 % of pro-bono sessions 22% 22% 22% 22% Number of Sites 105 105 105 105 % of Intensive 9% 9% 9% 9%
Assumption Inputs (government contract) FY2011 YR1 YR2 YR3
Contracted Residencies (Light) 91 91 91 91 Contracted Residencies (Intensive) 31 31 31 31 Total Contract Amount 340,721 340,721 340,721 340,721
Sessions by Category FY2011 YR1 YR2 YR3
Pro-bono Sessions 747 747 747 747 Pro-bono Sessions Light 714 714 714 714 Pro-bono Sessions Intensive 33 33 33 33
Government Contract Sessions 2,010 2,010 2,010 2,010 Government Contract Sessions Light 1,094 1,094 1,094 1,094 Government Contract Sessions Intensive 916 916 916 916
Earned Revenue 2,610 2,610 2,610 2,610 Earned Income Sessions Light 2,495 2,495 2,495 2,495 Earned Income Sessions Intensive 115 115 115 115
Total 5,366 5,366 5,366 5,366
Modifiable Assumptions
Input Cells
Calculated Cell - Do Not Modify
…model input
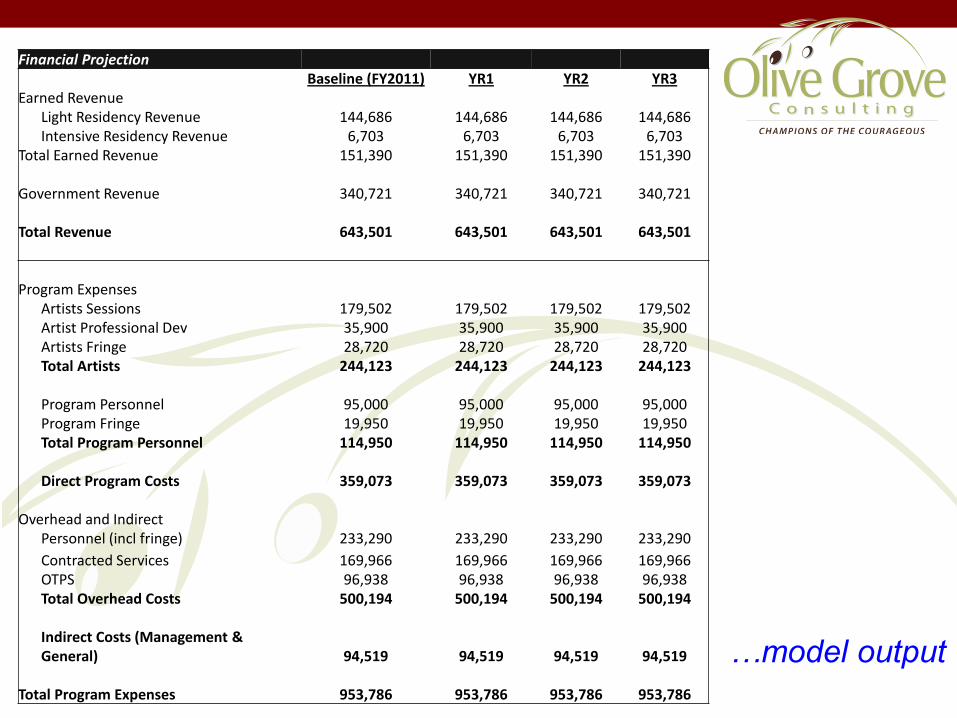
Financial Projection Baseline (FY2011) YR1 YR2 YR3 Earned Revenue
Light Residency Revenue 144,686 144,686 144,686 144,686 Intensive Residency Revenue 6,703 6,703 6,703 6,703
Total Earned Revenue 151,390 151,390 151,390 151,390
Government Revenue 340,721 340,721 340,721 340,721 Total Revenue 643,501 643,501 643,501 643,501 Program Expenses
Artists Sessions 179,502 179,502 179,502 179,502 Artist Professional Dev 35,900 35,900 35,900 35,900 Artists Fringe 28,720 28,720 28,720 28,720 Total Artists 244,123 244,123 244,123 244,123
Program Personnel 95,000 95,000 95,000 95,000 Program Fringe 19,950 19,950 19,950 19,950 Total Program Personnel 114,950 114,950 114,950 114,950 Direct Program Costs 359,073 359,073 359,073 359,073
Overhead and Indirect
Personnel (incl fringe) 233,290 233,290 233,290 233,290
Contracted Services 169,966 169,966 169,966 169,966 OTPS 96,938 96,938 96,938 96,938 Total Overhead Costs 500,194 500,194 500,194 500,194
Indirect Costs (Management & General) 94,519 94,519 94,519 94,519
Total Program Expenses 953,786 953,786 953,786 953,786
…model output
17
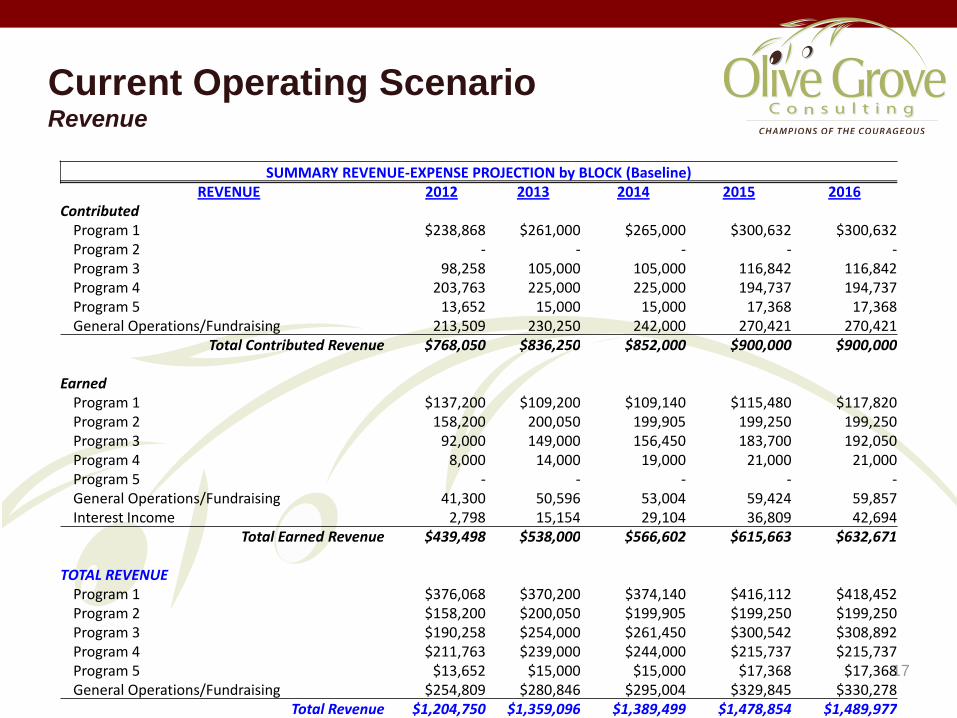
Current Operating Scenario Revenue
SUMMARY REVENUE-EXPENSE PROJECTION by BLOCK (Baseline)
REVENUE 2012 2013 2014 2015 2016 Contributed
Program 1 $238,868 $261,000 $265,000 $300,632 $300,632 Program 2 - - - - - Program 3 98,258 105,000 105,000 116,842 116,842 Program 4 203,763 225,000 225,000 194,737 194,737 Program 5 13,652 15,000 15,000 17,368 17,368 General Operations/Fundraising 213,509 230,250 242,000 270,421 270,421
Total Contributed Revenue $768,050 $836,250 $852,000 $900,000 $900,000
Earned Program 1 $137,200 $109,200 $109,140 $115,480 $117,820 Program 2 158,200 200,050 199,905 199,250 199,250 Program 3 92,000 149,000 156,450 183,700 192,050 Program 4 8,000 14,000 19,000 21,000 21,000 Program 5 - - - - - General Operations/Fundraising 41,300 50,596 53,004 59,424 59,857 Interest Income 2,798 15,154 29,104 36,809 42,694
Total Earned Revenue $439,498 $538,000 $566,602 $615,663 $632,671
TOTAL REVENUE Program 1 $376,068 $370,200 $374,140 $416,112 $418,452 Program 2 $158,200 $200,050 $199,905 $199,250 $199,250 Program 3 $190,258 $254,000 $261,450 $300,542 $308,892 Program 4 $211,763 $239,000 $244,000 $215,737 $215,737 Program 5 $13,652 $15,000 $15,000 $17,368 $17,368 General Operations/Fundraising $254,809 $280,846 $295,004 $329,845 $330,278
Total Revenue $1,204,750 $1,359,096 $1,389,499 $1,478,854 $1,489,977
18
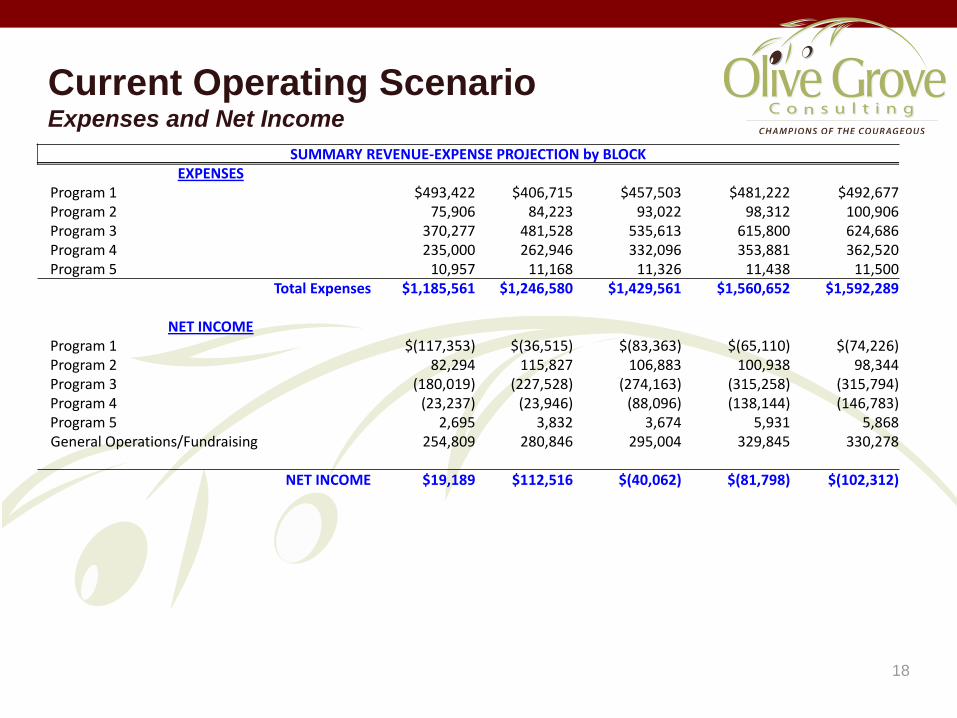
Current Operating Scenario Expenses and Net Income
SUMMARY REVENUE-EXPENSE PROJECTION by BLOCK EXPENSES
Program 1 $493,422 $406,715 $457,503 $481,222 $492,677 Program 2 75,906 84,223 93,022 98,312 100,906 Program 3 370,277 481,528 535,613 615,800 624,686 Program 4 235,000 262,946 332,096 353,881 362,520 Program 5 10,957 11,168 11,326 11,438 11,500
Total Expenses $1,185,561 $1,246,580 $1,429,561 $1,560,652 $1,592,289
NET INCOME Program 1 $(117,353) $(36,515) $(83,363) $(65,110) $(74,226) Program 2 82,294 115,827 106,883 100,938 98,344 Program 3 (180,019) (227,528) (274,163) (315,258) (315,794) Program 4 (23,237) (23,946) (88,096) (138,144) (146,783) Program 5 2,695 3,832 3,674 5,931 5,868 General Operations/Fundraising 254,809 280,846 295,004 329,845 330,278
NET INCOME $19,189 $112,516 $(40,062) $(81,798) $(102,312)
19
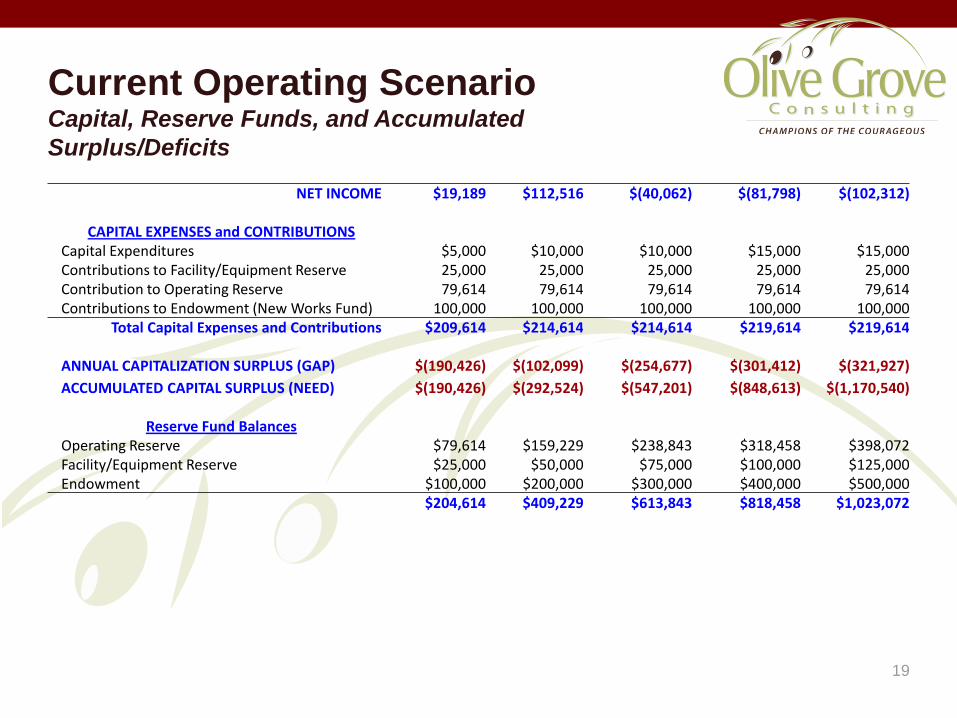
Current Operating Scenario Capital, Reserve Funds, and Accumulated
Surplus/Deficits
NET INCOME $19,189 $112,516 $(40,062) $(81,798) $(102,312)
CAPITAL EXPENSES and CONTRIBUTIONS Capital Expenditures $5,000 $10,000 $10,000 $15,000 $15,000 Contributions to Facility/Equipment Reserve 25,000 25,000 25,000 25,000 25,000 Contribution to Operating Reserve 79,614 79,614 79,614 79,614 79,614 Contributions to Endowment (New Works Fund) 100,000 100,000 100,000 100,000 100,000
Total Capital Expenses and Contributions $209,614 $214,614 $214,614 $219,614 $219,614
ANNUAL CAPITALIZATION SURPLUS (GAP) $(190,426) $(102,099) $(254,677) $(301,412) $(321,927)
ACCUMULATED CAPITAL SURPLUS (NEED) $(190,426) $(292,524) $(547,201) $(848,613) $(1,170,540)
Reserve Fund Balances Operating Reserve $79,614 $159,229 $238,843 $318,458 $398,072 Facility/Equipment Reserve $25,000 $50,000 $75,000 $100,000 $125,000 Endowment $100,000 $200,000 $300,000 $400,000 $500,000
$204,614 $409,229 $613,843 $818,458 $1,023,072
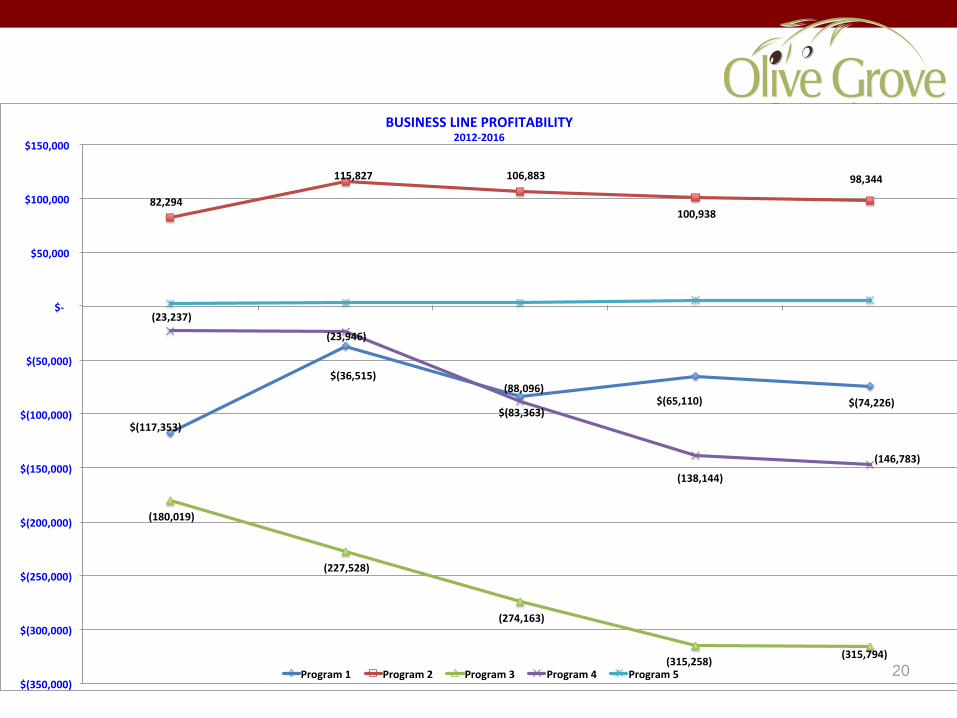
$(117,353)
$(36,515)
$(83,363)$(65,110) $(74,226)
82,294
115,827 106,883
100,938
98,344
(180,019)
(227,528)
(274,163)
(315,258)(315,794)
(23,237)
(23,946)
(88,096)
(138,144)
(146,783)
$(350,000)
$(300,000)
$(250,000)
$(200,000)
$(150,000)
$(100,000)
$(50,000)
$-
$50,000
$100,000
$150,000
BUSINESSLINEPROFITABILITY2012-2016
Program1 Program2 Program3 Program4 Program5
20
EXAMPLE 2: Growth planning and scenario analysis
Organization: A highly successful international program for young adults
exploring the implications of programmatic growth and organizational expansion
Challenge:
• Model current program
• Model various growth scenarios
• Project revenue required under various scenarios
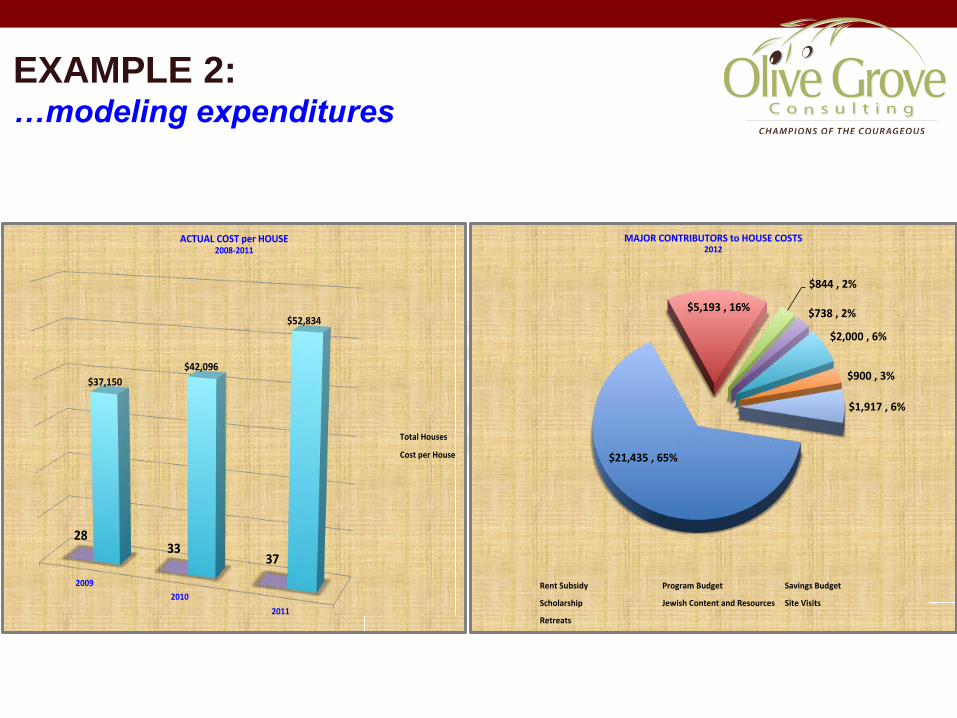
EXAMPLE 2: …modeling expenditures
2009
2010
2011
2833
37
$37,150
$42,096
$52,834
ACTUALCOSTperHOUSE2008-2011
TotalHouses
CostperHouse $21,435,65%
$5,193,16%
$844,2%
$738,2%
$2,000,6%
$900,3%
$1,917,6%
MAJORCONTRIBUTORStoHOUSECOSTS2012
RentSubsidy ProgramBudget SavingsBudget
Scholarship JewishContentandResources SiteVisits
Retreats
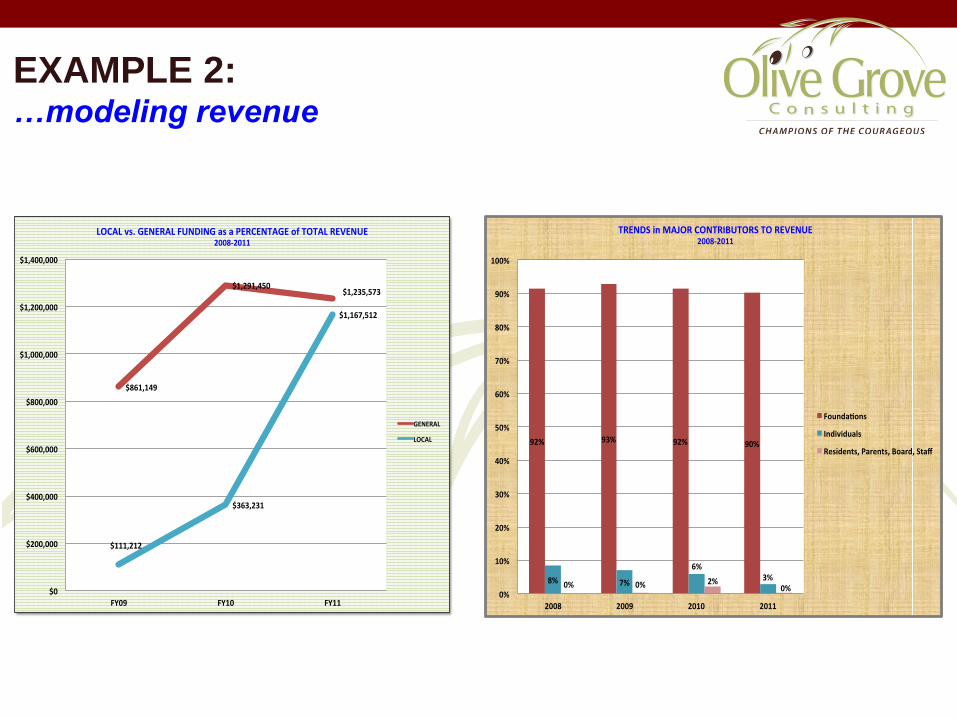
EXAMPLE 2: …modeling revenue
$861,149
$1,291,450$1,235,573
$111,212
$363,231
$1,167,512
$0
$200,000
$400,000
$600,000
$800,000
$1,000,000
$1,200,000
$1,400,000
FY09 FY10 FY11
LOCALvs.GENERALFUNDINGasaPERCENTAGEofTOTALREVENUE2008-2011
GENERAL
LOCAL
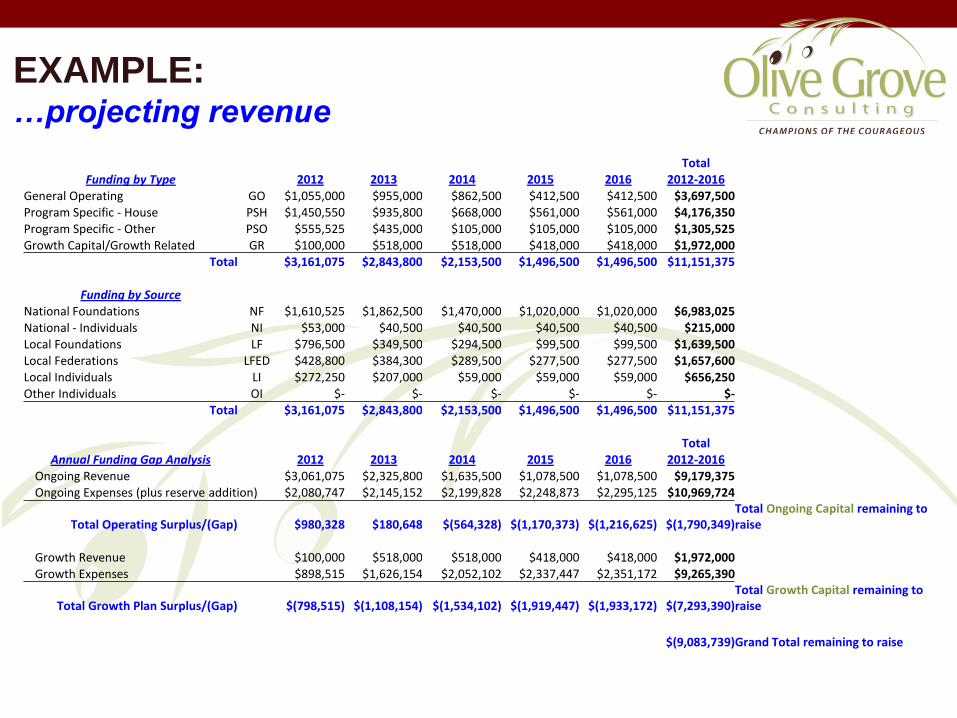
EXAMPLE: …projecting revenue
Total Funding by Type 2012 2013 2014 2015 2016 2012-2016
General Operating GO $1,055,000 $955,000 $862,500 $412,500 $412,500 $3,697,500 Program Specific - House PSH $1,450,550 $935,800 $668,000 $561,000 $561,000 $4,176,350 Program Specific - Other PSO $555,525 $435,000 $105,000 $105,000 $105,000 $1,305,525 Growth Capital/Growth Related GR $100,000 $518,000 $518,000 $418,000 $418,000 $1,972,000
Total $3,161,075 $2,843,800 $2,153,500 $1,496,500 $1,496,500 $11,151,375 TRUE
Funding by Source National Foundations NF $1,610,525 $1,862,500 $1,470,000 $1,020,000 $1,020,000 $6,983,025 $- National - Individuals NI $53,000 $40,500 $40,500 $40,500 $40,500 $215,000 Local Foundations LF $796,500 $349,500 $294,500 $99,500 $99,500 $1,639,500 Local Federations LFED $428,800 $384,300 $289,500 $277,500 $277,500 $1,657,600 Local Individuals LI $272,250 $207,000 $59,000 $59,000 $59,000 $656,250 Other Individuals OI $- $- $- $- $- $-
Total $3,161,075 $2,843,800 $2,153,500 $1,496,500 $1,496,500 $11,151,375
Total Annual Funding Gap Analysis 2012 2013 2014 2015 2016 2012-2016
Ongoing Revenue $3,061,075 $2,325,800 $1,635,500 $1,078,500 $1,078,500 $9,179,375 Ongoing Expenses (plus reserve addition) $2,080,747 $2,145,152 $2,199,828 $2,248,873 $2,295,125 $10,969,724
Total Operating Surplus/(Gap) $980,328 $180,648 $(564,328) $(1,170,373) $(1,216,625) $(1,790,349) Total Ongoing Capital remaining to raise
Growth Revenue $100,000 $518,000 $518,000 $418,000 $418,000 $1,972,000 Growth Expenses $898,515 $1,626,154 $2,052,102 $2,337,447 $2,351,172 $9,265,390
Total Growth Plan Surplus/(Gap) $(798,515) $(1,108,154) $(1,534,102) $(1,919,447) $(1,933,172) $(7,293,390) Total Growth Capital remaining to raise
$(9,083,739) Grand Total remaining to raise
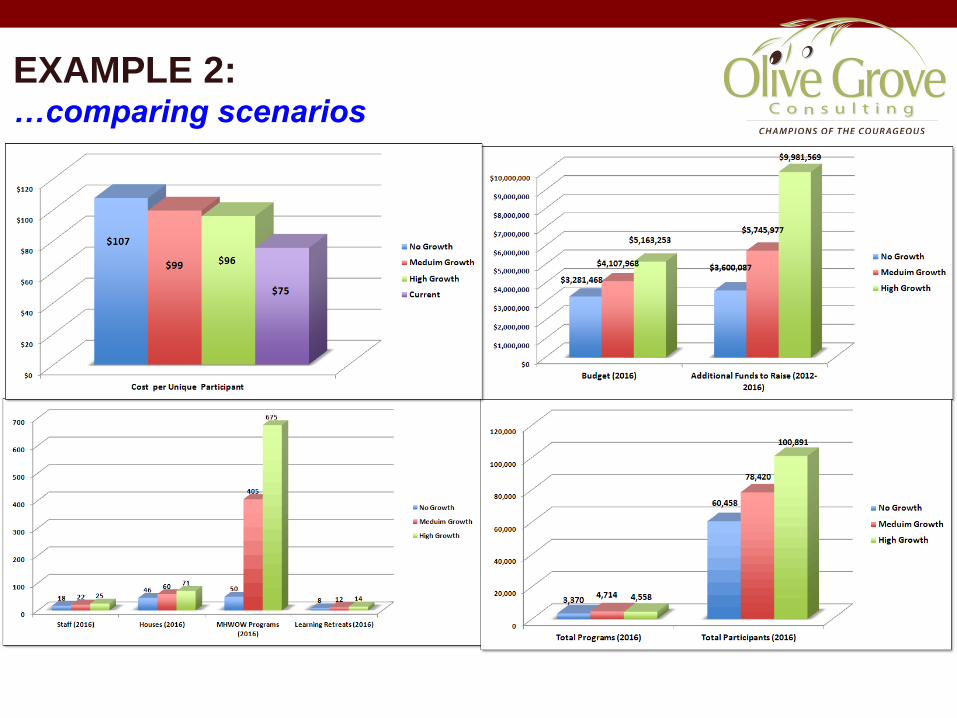
EXAMPLE 2: …comparing scenarios
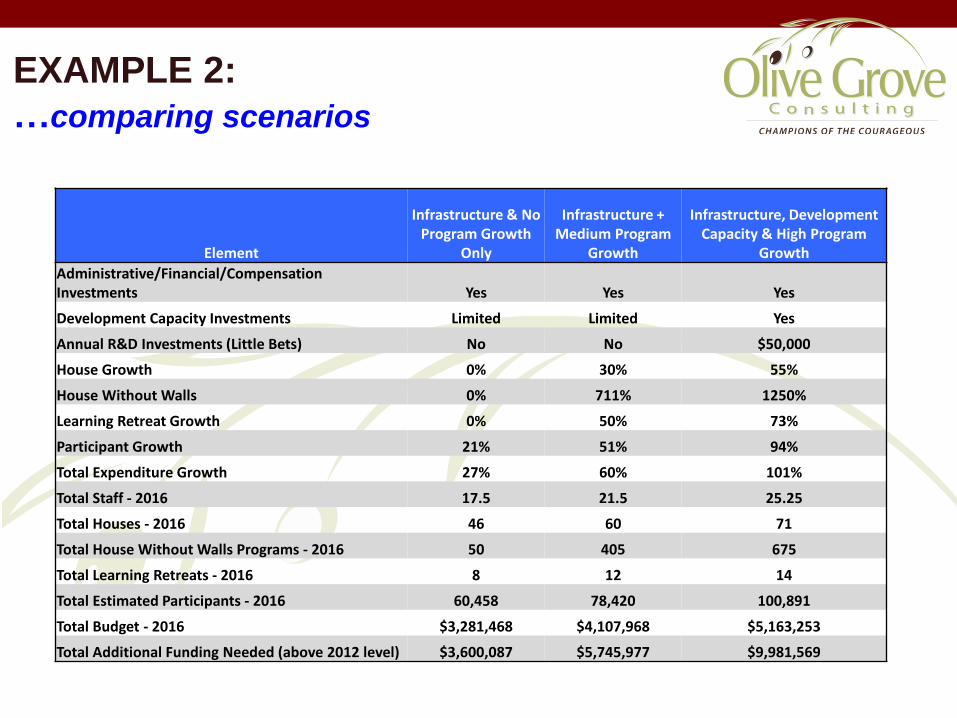
EXAMPLE 2:
…comparing scenarios
Element
Infrastructure & No Program Growth
Only
Infrastructure + Medium Program
Growth
Infrastructure, Development Capacity & High Program
Growth
Administrative/Financial/Compensation Investments Yes Yes Yes
Development Capacity Investments Limited Limited Yes
Annual R&D Investments (Little Bets) No No $50,000
House Growth 0% 30% 55%
House Without Walls 0% 711% 1250%
Learning Retreat Growth 0% 50% 73%
Participant Growth 21% 51% 94%
Total Expenditure Growth 27% 60% 101%
Total Staff - 2016 17.5 21.5 25.25
Total Houses - 2016 46 60 71
Total House Without Walls Programs - 2016 50 405 675
Total Learning Retreats - 2016 8 12 14
Total Estimated Participants - 2016 60,458 78,420 100,891
Total Budget - 2016 $3,281,468 $4,107,968 $5,163,253
Total Additional Funding Needed (above 2012 level) $3,600,087 $5,745,977 $9,981,569
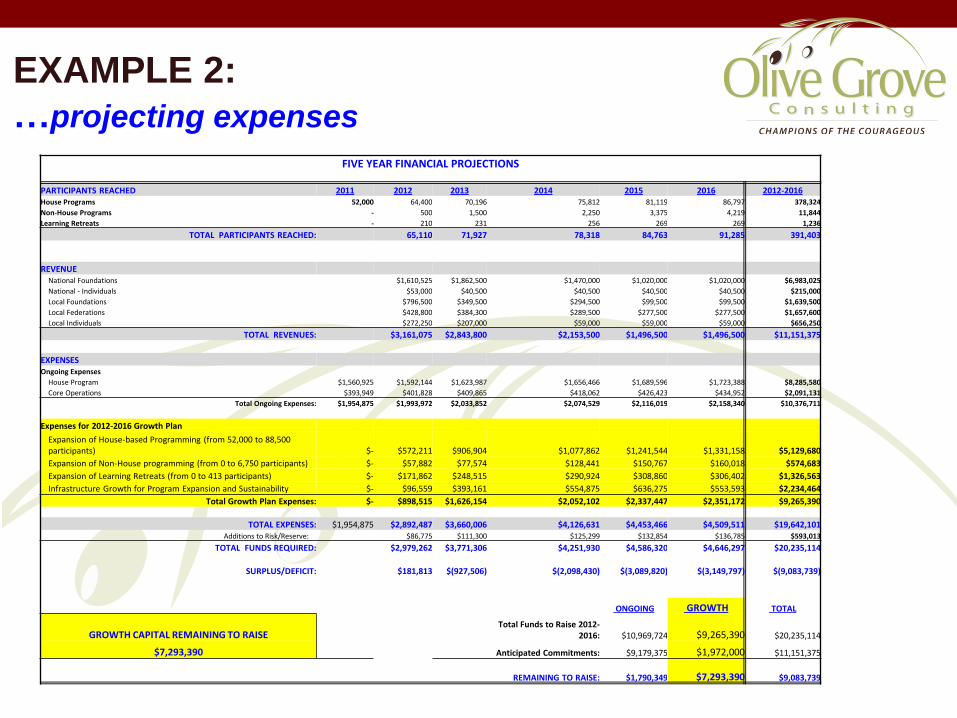
EXAMPLE 2:
…projecting expenses
FIVE YEAR FINANCIAL PROJECTIONS
PARTICIPANTS REACHED 2011 2012 2013 2014 2015 2016 2012-2016 House Programs 52,000 64,400 70,196 75,812 81,119 86,797 378,324
Non-House Programs - 500 1,500 2,250 3,375 4,219 11,844
Learning Retreats - 210 231 256 269 269 1,236
TOTAL PARTICIPANTS REACHED: 65,110 71,927 78,318 84,763 91,285 391,403
REVENUE National Foundations $1,610,525 $1,862,500 $1,470,000 $1,020,000 $1,020,000 $6,983,025
National - Individuals $53,000 $40,500 $40,500 $40,500 $40,500 $215,000
Local Foundations $796,500 $349,500 $294,500 $99,500 $99,500 $1,639,500
Local Federations $428,800 $384,300 $289,500 $277,500 $277,500 $1,657,600
Local Individuals $272,250 $207,000 $59,000 $59,000 $59,000 $656,250
TOTAL REVENUES: $3,161,075 $2,843,800 $2,153,500 $1,496,500 $1,496,500 $11,151,375
EXPENSES Ongoing Expenses
House Program $1,560,925 $1,592,144 $1,623,987 $1,656,466 $1,689,596 $1,723,388 $8,285,580
Core Operations $393,949 $401,828 $409,865 $418,062 $426,423 $434,952 $2,091,131
Total Ongoing Expenses: $1,954,875 $1,993,972 $2,033,852 $2,074,529 $2,116,019 $2,158,340 $10,376,711
Expenses for 2012-2016 Growth Plan
Expansion of House-based Programming (from 52,000 to 88,500 participants) $- $572,211 $906,904 $1,077,862 $1,241,544 $1,331,158 $5,129,680
Expansion of Non-House programming (from 0 to 6,750 participants) $- $57,882 $77,574 $128,441 $150,767 $160,018 $574,683
Expansion of Learning Retreats (from 0 to 413 participants) $- $171,862 $248,515 $290,924 $308,860 $306,402 $1,326,563
Infrastructure Growth for Program Expansion and Sustainability $- $96,559 $393,161 $554,875 $636,275 $553,593 $2,234,464
Total Growth Plan Expenses: $- $898,515 $1,626,154 $2,052,102 $2,337,447 $2,351,172 $9,265,390
TOTAL EXPENSES: $1,954,875 $2,892,487 $3,660,006 $4,126,631 $4,453,466 $4,509,511 $19,642,101 Additions to Risk/Reserve: $86,775 $111,300 $125,299 $132,854 $136,785 $593,013
TOTAL FUNDS REQUIRED: $2,979,262 $3,771,306 $4,251,930 $4,586,320 $4,646,297 $20,235,114
SURPLUS/DEFICIT: $181,813 $(927,506) $(2,098,430) $(3,089,820) $(3,149,797) $(9,083,739)
ONGOING GROWTH TOTAL
GROWTH CAPITAL REMAINING TO RAISE Total Funds to Raise 2012-
2016: $10,969,724 $9,265,390 $20,235,114
$7,293,390 Anticipated Commitments: $9,179,375 $1,972,000 $11,151,375
REMAINING TO RAISE: $1,790,349 $7,293,390 $9,083,739

CREATING A MATURE FINANCIAL
INFRASTRUCTURE
Turn finance function outside in
Engage finance in analytical and strategic projects
FINANCIAL MANAGEMENT IN
MATURE ORGANIZATIONS
Presented by:
Anthony Reese
CFO/Vice-President: Financial Management Practice

Sponsored by: A Service
Of:
Find listings for our current season of webinars and register at:
NonprofitWebinars.com


![Financial report [of] organizations at the University of ... · FINANCIAL REPORT ORGANIZATIONS ATTHEUNIVERSITYOFILLINOIS FORTHEYEAR1967-68 UNIVERSITYOFILLINOISBULLETIN Volume67,Number63,January7,1970](https://img.pdfslide.net/doc/110x75/5ed198eab177d55712671694/financial-report-of-organizations-at-the-university-of-financial-report-organizations.jpg)