Embed Size (px)
Citation preview
Mining the Territory | 27 August 2015
Francois Hardy, General Manager Tanami Operation
Cautionary statement
Cautionary statement regarding forward looking statements:
This presentation contains “forward-looking statements” within the meaning of Section 27A of the Securities Act of 1933, as amended, and Section 21E of the
Securities Exchange Act of 1934, as amended, and are intended to be covered by the safe harbor provided for under such sections. Such forward-looking
statements may include, without limitation: (i) estimates of future consolidated and attributable production and sales; (ii) estimates of future costs applicable
to sales and All-in sustaining costs; (iii) estimates of future consolidated and attributable capital expenditures; (iv) our efforts to continue delivering reduced
costs and efficiency; (v) expectations regarding the development, growth and exploration potential of the Company’s projects, including the Turf Vent Shaft,
Merian, Long Canyon Phase 1, the Tanami Expansion and the Ahafo Mill Expansion; (vi) expectations regarding the repayment of debt from cash flows and
existing cash; and (vii) expectations regarding future price assumptions, financial performance and other outlook or guidance. Estimates or expectations of
future events or results are based upon certain assumptions, which may prove to be incorrect. Such assumptions, include, but are not limited to: (i) there
being no significant change to current geotechnical, metallurgical, hydrological and other physical conditions; (ii) permitting, development, operations and
expansion of the Company’s operations and projects being consistent with current expectations and mine plans, including without limitation receipt of export
approvals; (iii) political developments in any jurisdiction in which the Company operates being consistent with its current expectations; (iv) certain exchange
rate assumptions for the Australian dollar to the U.S. dollar, as well as other the exchange rates being approximately consistent with current levels; (v) certain
price assumptions for gold, copper and oil; (vi) prices for key supplies being approximately consistent with current levels; (vii) the accuracy of our current
mineral reserve and mineralized material estimates; (viii) the acceptable outcome of negotiation of the amendment to the Contract of Work and/or resolution
of export issues in Indonesia; and (ix) other assumptions noted herein. Where the Company expresses an expectation or belief as to future events or results,
such expectation or belief is expressed in good faith and believed to have a reasonable basis. However, such statements are subject to risks, uncertainties
and other factors, which could cause actual results to differ materially from future results expressed, projected or implied by the “forward-looking statements”.
Such risks include, but are not limited to, gold and other metals price volatility, currency fluctuations, increased production costs and variances in ore grade or
recovery rates from those assumed in mining plans, political and operational risks, community relations, conflict resolution and outcome of projects or
oppositions and governmental regulation and judicial outcomes. For a more detailed discussion of such risks and other factors, see the Company’s Quarterly
Report on Form 10-Q filed on July 23, 2015 with the Securities and Exchange Commission (the “SEC”), as well as the Company’s other SEC filings. The
Company does not undertake any obligation to release publicly revisions to any “forward-looking statement,” including, without limitation, outlook, to reflect
events or circumstances after the date of this presentation, or to reflect the occurrence of unanticipated events, except as may be required under applicable
securities laws. Investors should not assume that any lack of update to a previously issued “forward-looking statement” constitutes a reaffirmation of that
statement. Continued reliance on “forward-looking statements” is at investors' own risk.
Building a solid foundation for expansion
0
0.5
1
1.5
2
2.5
3
3.5
4
4.5
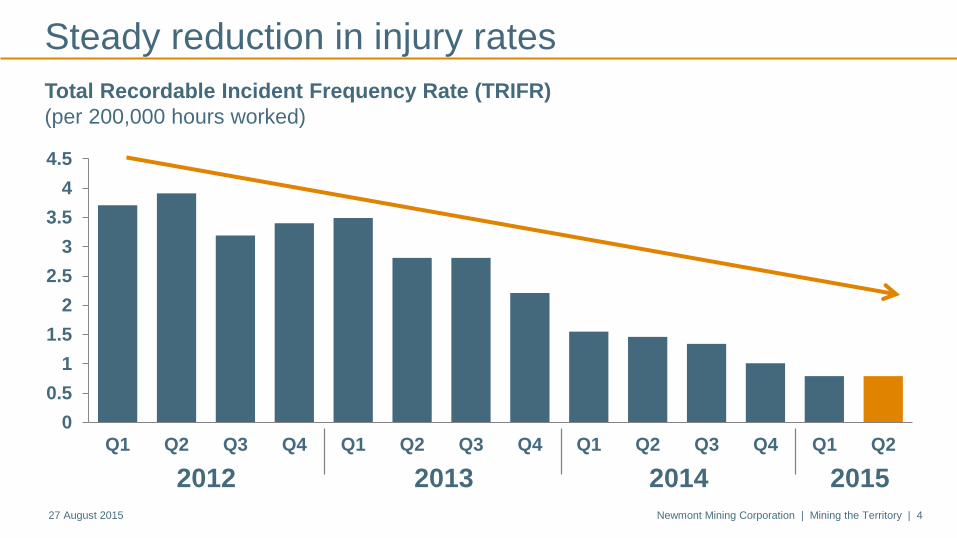
Q1 Q2 Q3 Q4 Q1 Q2 Q3 Q4 Q1 Q2 Q3 Q4 Q1 Q2
2015
Steady reduction in injury rates
Total Recordable Incident Frequency Rate (TRIFR)
(per 200,000 hours worked)
2012 2013 2014
27 August 2015 Newmont Mining Corporation | Mining the Territory | 4
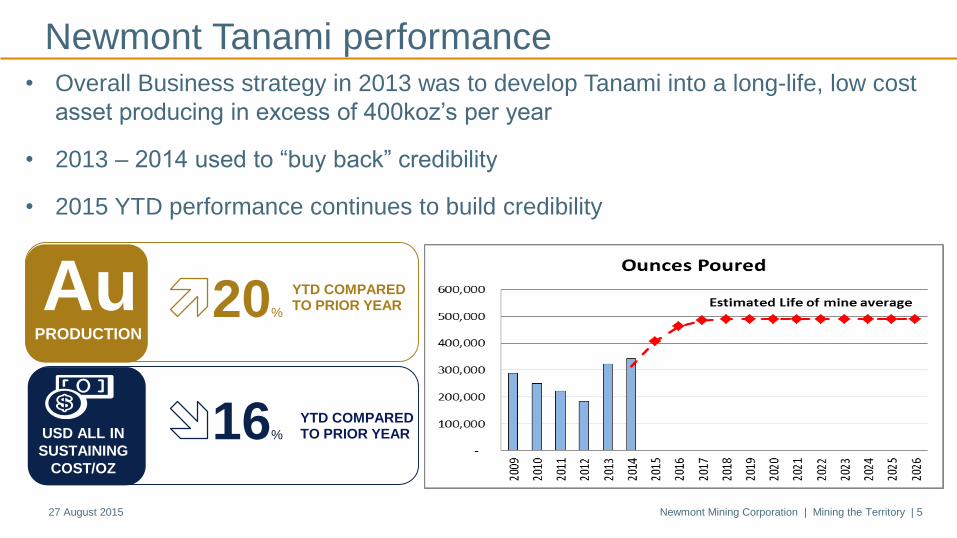
Newmont Tanami performance
27 August 2015 Newmont Mining Corporation | Mining the Territory | 5
GOLD
PRODUCTION
20%
PRODUCTION
Au YTD COMPARED TO PRIOR YEAR
USD ALL IN
SUSTAINING
COST/OZ
16%
YTD COMPARED TO PRIOR YEAR
• Overall Business strategy in 2013 was to develop Tanami into a long-life, low cost
asset producing in excess of 400koz’s per year
• 2013 – 2014 used to “buy back” credibility
• 2015 YTD performance continues to build credibility
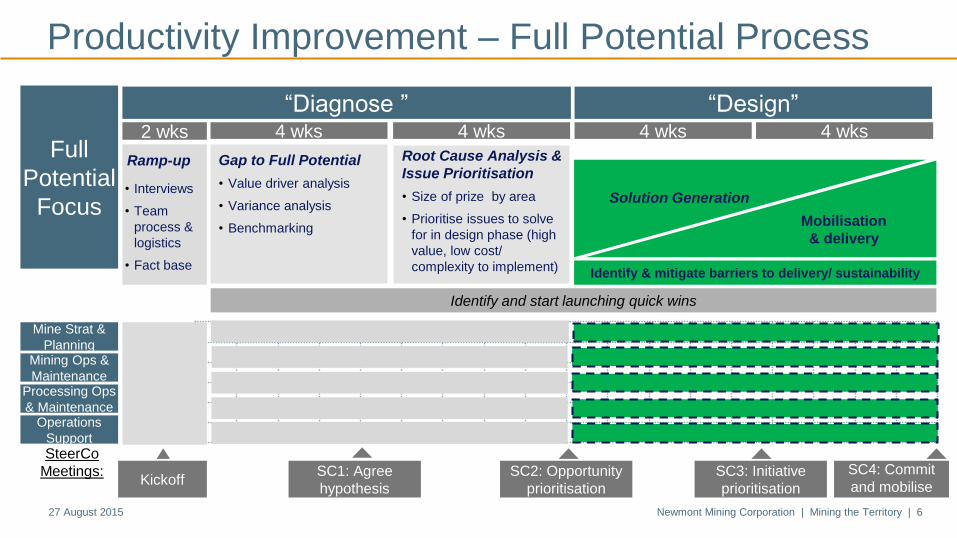
Productivity Improvement – Full Potential Process
27 August 2015 Newmont Mining Corporation | Mining the Territory | 6
SC1: Agree
hypothesis
SC2: Opportunity
prioritisation
Mine Strat &
PlanningMining Ops &
MaintenanceProcessing Ops
& Maintenance
SteerCo
Meetings: SC3: Initiative
prioritisation
SC4: Commit
and mobiliseKickoff
Identify & mitigate barriers to delivery/ sustainability
Mobilisation
& delivery
Ramp-up Gap to Full Potential
• Value driver analysis
• Variance analysis
• Benchmarking
“Diagnose ” “Design”
• Interviews
• Team
process &
logistics
• Fact base
Solution Generation
Identify and start launching quick wins
Full
Potential
Focus
Operations
Support
2 wks
Root Cause Analysis &
Issue Prioritisation
• Size of prize by area
• Prioritise issues to solve
for in design phase (high
value, low cost/
complexity to implement)
4 wks4 wks 4 wks 4 wks
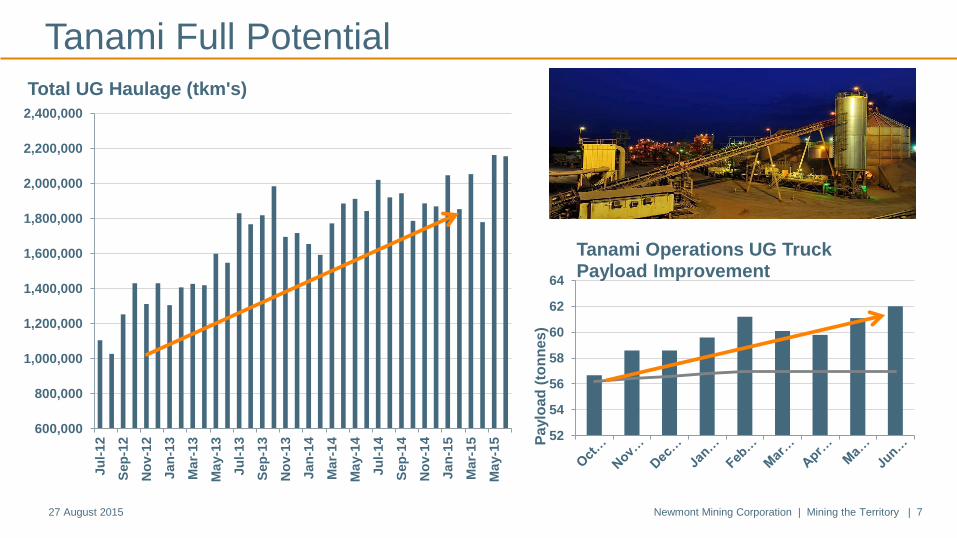
Tanami Full Potential
27 August 2015 Newmont Mining Corporation | Mining the Territory | 7
600,000
800,000
1,000,000
1,200,000
1,400,000
1,600,000
1,800,000
2,000,000
2,200,000
2,400,000Ju
l-1
2
Sep
-12
No
v-1
2
Ja
n-1
3
Ma
r-13
Ma
y-1
3
Ju
l-1
3
Sep
-13
No
v-1
3
Ja
n-1
4
Ma
r-14
Ma
y-1
4
Ju
l-1
4
Sep
-14
No
v-1
4
Ja
n-1
5
Ma
r-15
Ma
y-1
5
Total UG Haulage (tkm's)
52
54
56
58
60
62
64
Pa
ylo
ad
(to
nn
es
)
Tanami Operations UG Truck Payload Improvement
Staged approach to expansion
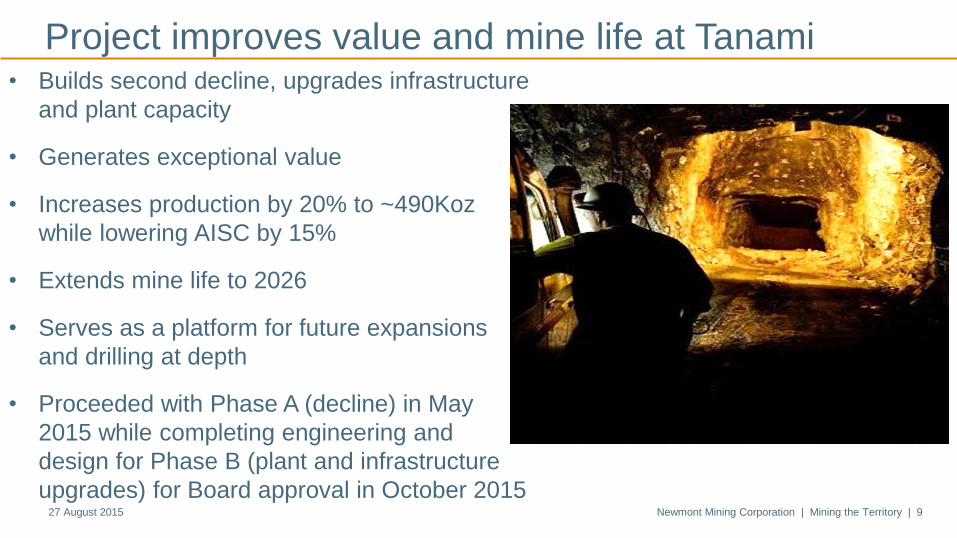
Project improves value and mine life at Tanami
27 August 2015 Newmont Mining Corporation | Mining the Territory | 9
GOLD
PRODUCTION
• Builds second decline, upgrades infrastructure
and plant capacity
• Generates exceptional value
• Increases production by 20% to ~490Koz
while lowering AISC by 15%
• Extends mine life to 2026
• Serves as a platform for future expansions
and drilling at depth
• Proceeded with Phase A (decline) in May
2015 while completing engineering and
design for Phase B (plant and infrastructure
upgrades) for Board approval in October 2015
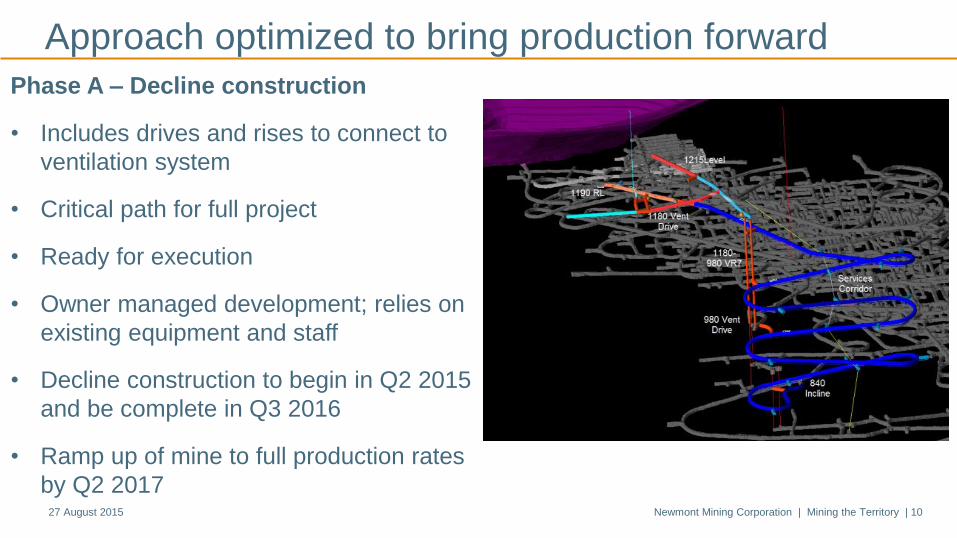
Approach optimized to bring production forward
27 August 2015 Newmont Mining Corporation | Mining the Territory | 10
GOLD
PRODUCTION
COPPER
PRODUCTION
Phase A – Decline construction
• Includes drives and rises to connect to
ventilation system
• Critical path for full project
• Ready for execution
• Owner managed development; relies on
existing equipment and staff
• Decline construction to begin in Q2 2015
and be complete in Q3 2016
• Ramp up of mine to full production rates
by Q2 2017
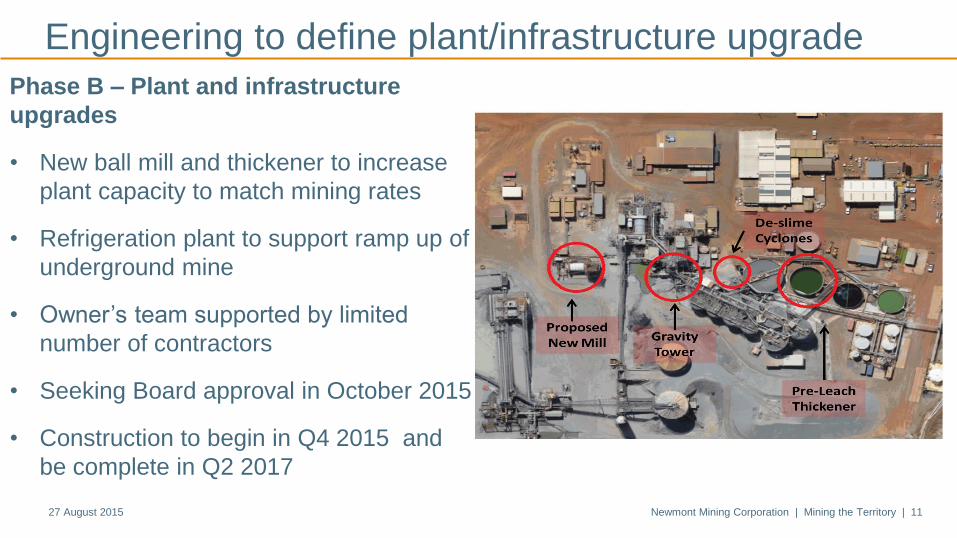
Engineering to define plant/infrastructure upgrade
27 August 2015 Newmont Mining Corporation | Mining the Territory | 11
GOLD
PRODUCTION
COPPER
PRODUCTION
Phase B – Plant and infrastructure
upgrades
• New ball mill and thickener to increase
plant capacity to match mining rates
• Refrigeration plant to support ramp up of
underground mine
• Owner’s team supported by limited
number of contractors
• Seeking Board approval in October 2015
• Construction to begin in Q4 2015 and
be complete in Q2 2017
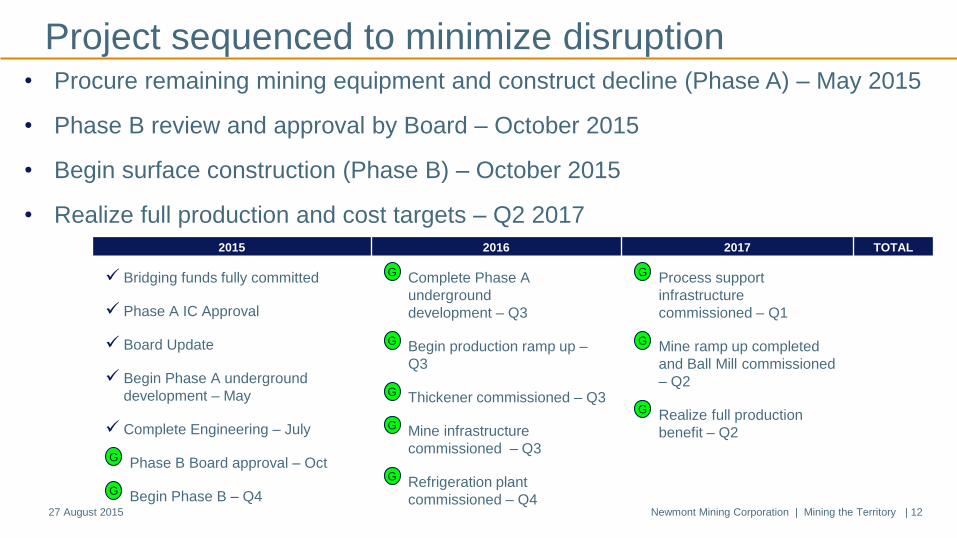
Project sequenced to minimize disruption
27 August 2015 Newmont Mining Corporation | Mining the Territory | 12
GOLD
PRODUCTION
• Procure remaining mining equipment and construct decline (Phase A) – May 2015
• Phase B review and approval by Board – October 2015
• Begin surface construction (Phase B) – October 2015
• Realize full production and cost targets – Q2 2017
2015 2016 2017 TOTAL
Bridging funds fully committed
Phase A IC Approval
Board Update
Begin Phase A underground
development – May
Complete Engineering – July
Phase B BoardG approval – Oct
Begin Phase B G – Q4
Complete PhaseG A
underground
development – Q3
BeginG production ramp up –
Q3
Thickener commissioned G – Q3
Mine infrastructure G
commissioned – Q3
Refrigeration plant G
commissioned – Q4
Process support G
infrastructure
commissioned – Q1
Mine ramp up completed G
and Ball Mill commissioned
– Q2
Realize full production G
benefit – Q2
Expansion in place – now what?
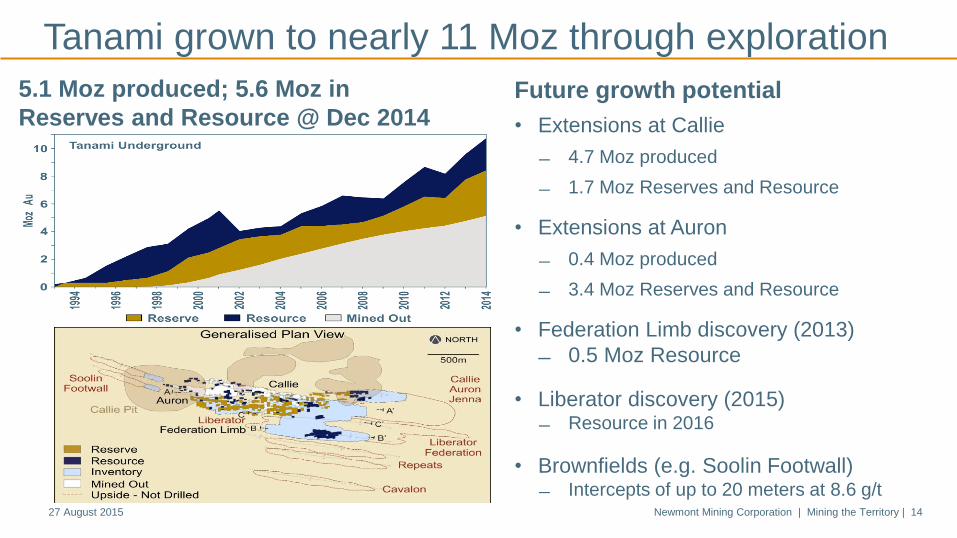
Tanami grown to nearly 11 Moz through exploration
Future growth potential
• Extensions at Callie
4.7 Moz produced
1.7 Moz Reserves and Resource
• Extensions at Auron
0.4 Moz produced
3.4 Moz Reserves and Resource
• Federation Limb discovery (2013)
0.5 Moz Resource
• Liberator discovery (2015) Resource in 2016
• Brownfields (e.g. Soolin Footwall) Intercepts of up to 20 meters at 8.6 g/t
5.1 Moz produced; 5.6 Moz in
Reserves and Resource @ Dec 2014
27 August 2015 Newmont Mining Corporation | Mining the Territory | 14
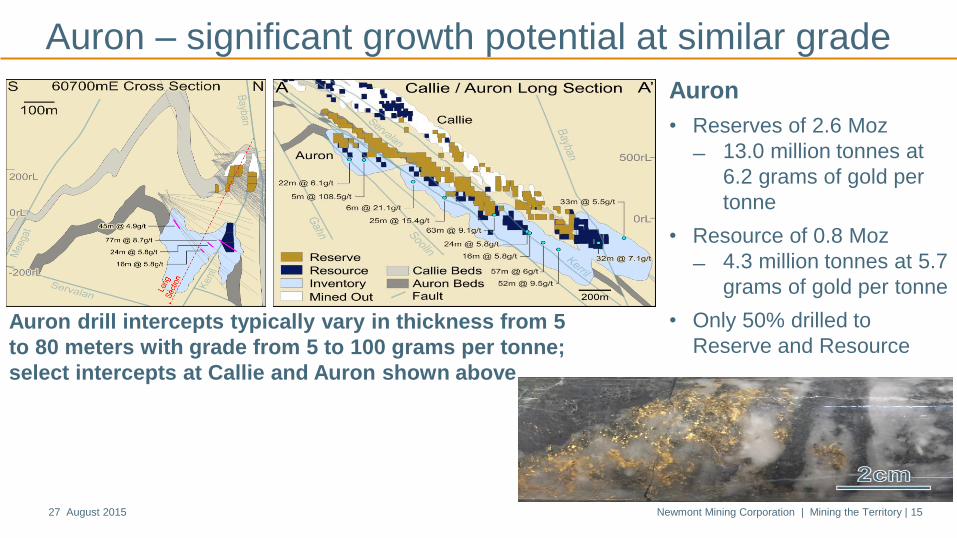
Auron – significant growth potential at similar grade
Auron
• Reserves of 2.6 Moz
13.0 million tonnes at
6.2 grams of gold per
tonne
• Resource of 0.8 Moz
4.3 million tonnes at 5.7
grams of gold per tonne
• Only 50% drilled to
Reserve and ResourceAuron drill intercepts typically vary in thickness from 5
to 80 meters with grade from 5 to 100 grams per tonne;
select intercepts at Callie and Auron shown above
27 August 2015 Newmont Mining Corporation | Mining the Territory | 15
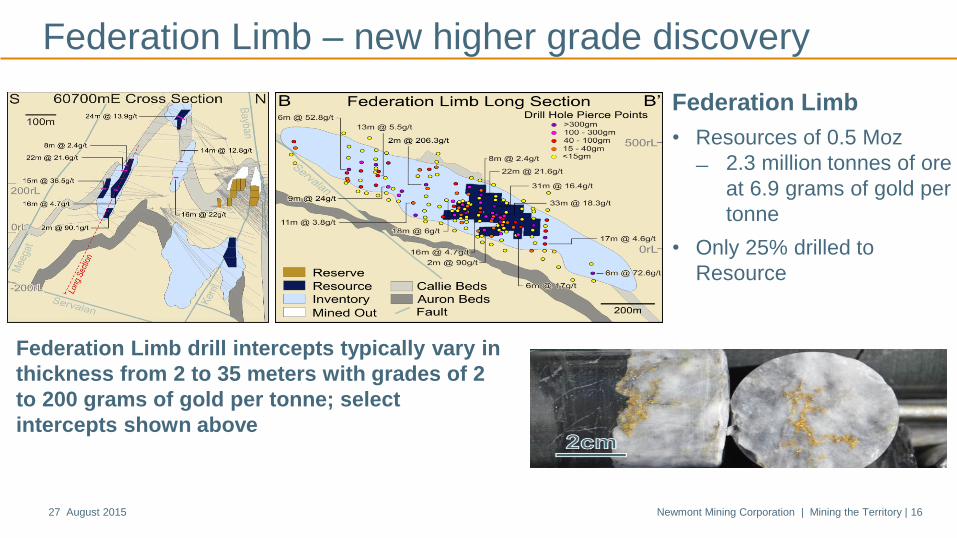
Federation Limb – new higher grade discovery
Federation Limb drill intercepts typically vary in
thickness from 2 to 35 meters with grades of 2
to 200 grams of gold per tonne; select
intercepts shown above
Federation Limb
• Resources of 0.5 Moz
2.3 million tonnes of ore
at 6.9 grams of gold per
tonne
• Only 25% drilled to
Resource
27 August 2015 Newmont Mining Corporation | Mining the Territory | 16
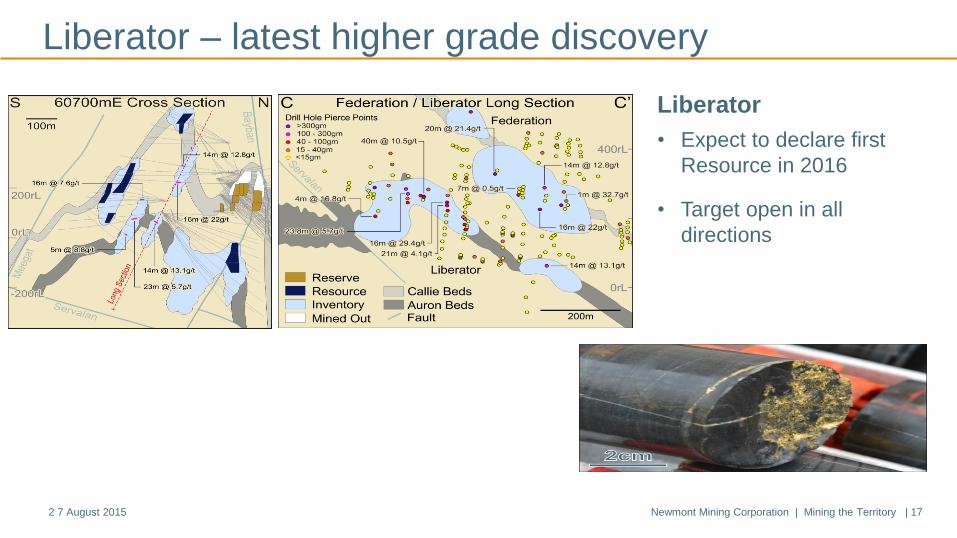
Liberator – latest higher grade discovery
Liberator
• Expect to declare first
Resource in 2016
• Target open in all
directions
2 7 August 2015 Newmont Mining Corporation | Mining the Territory | 17
Questions?
For further information contact: Newmont Asia Pacific | Telephone +61 8 9423 6100 | newmont.com