Embed Size (px)
Citation preview
From Zero to Hero: Using Simple Metrics to Boost Performance
Jon Bartos Revenue Performance Management Jonathan Sco> Interna@onal 2012

2012
2012 Trends • Social Media to going Mobile • Intense hiring will return in select areas • Reten:on issues will increase drama:cally • Social Media will increase impact by
becoming data-‐driven • Remote work changes everything • Need for Speed con:nues • Employer branding returns • Candidate experience – now cri:cal • Forward looking metrics will begin to dominate • Need for pipeline now cri:cal • JO/PL Ra:o **The people who are seeing significant increases in production/billings – are the ones who are getting their Job Order/Placement Ratio down to 2/1 or less.
To Reach your Poten:al
2012
First Step: It starts with Culture/Environment “Crea:ng a Culture of Performance”
Defini:on: A culture in which each and every individual in an organiza4on is focused on achieving performance goals. These are quan4fiable targets that are set for each individual/team and broken down by 4me – from year to quarter to month to week to day. An environment where every employee knows the importance and significance of their par4cular contribu4on to aAain the team goals and performance goals are translated into ac4vi4es and results that need to be accomplished in order to achieve the target.
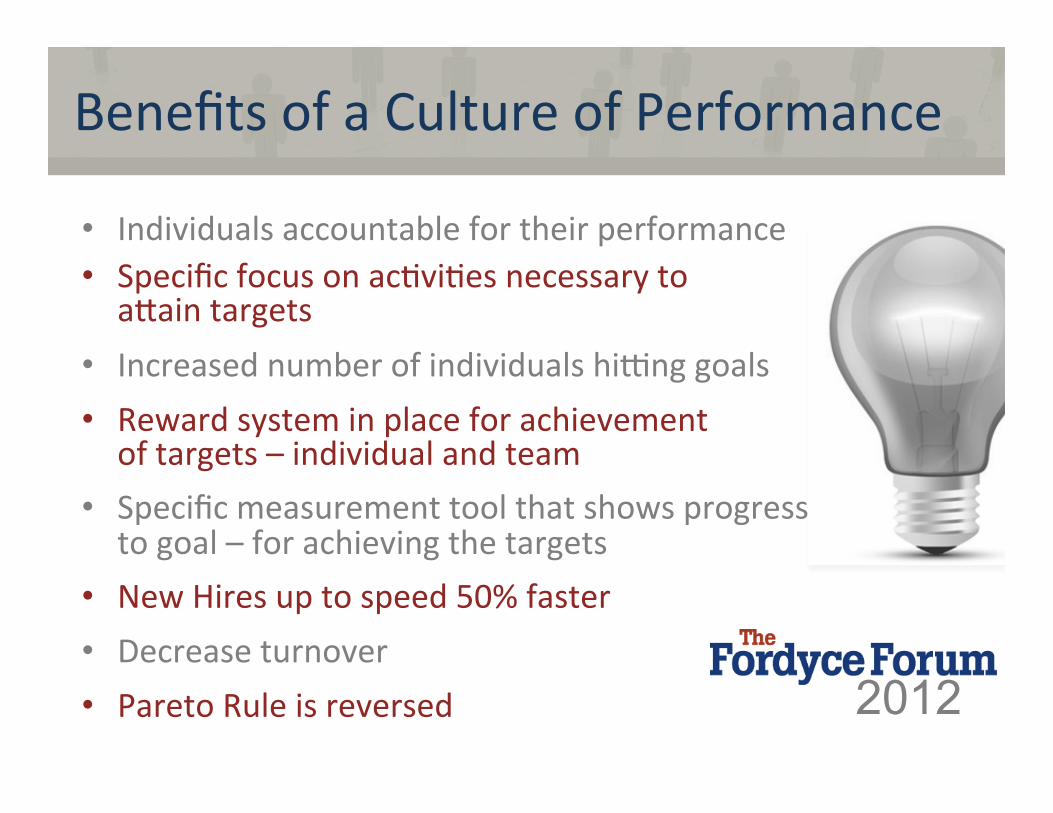
Benefits of a Culture of Performance
• Individuals accountable for their performance
• Specific focus on ac:vi:es necessary to aQain targets
• Increased number of individuals hiRng goals • Reward system in place for achievement of targets – individual and team
• Specific measurement tool that shows progress to goal – for achieving the targets
• New Hires up to speed 50% faster • Decrease turnover • Pareto Rule is reversed 2012
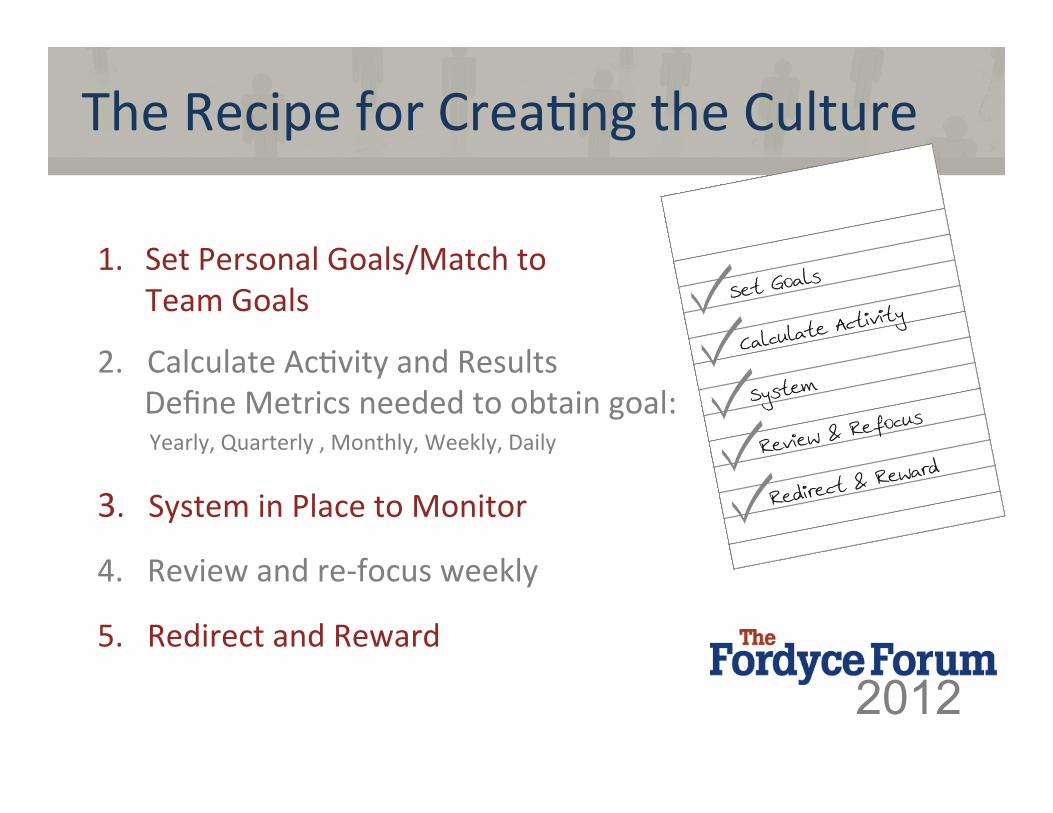
The Recipe for Crea:ng the Culture
1. Set Personal Goals/Match to Team Goals
2. Calculate Ac:vity and Results Define Metrics needed to obtain goal:
Yearly, Quarterly , Monthly, Weekly, Daily
3. System in Place to Monitor
4. Review and re-‐focus weekly
5. Redirect and Reward
2012
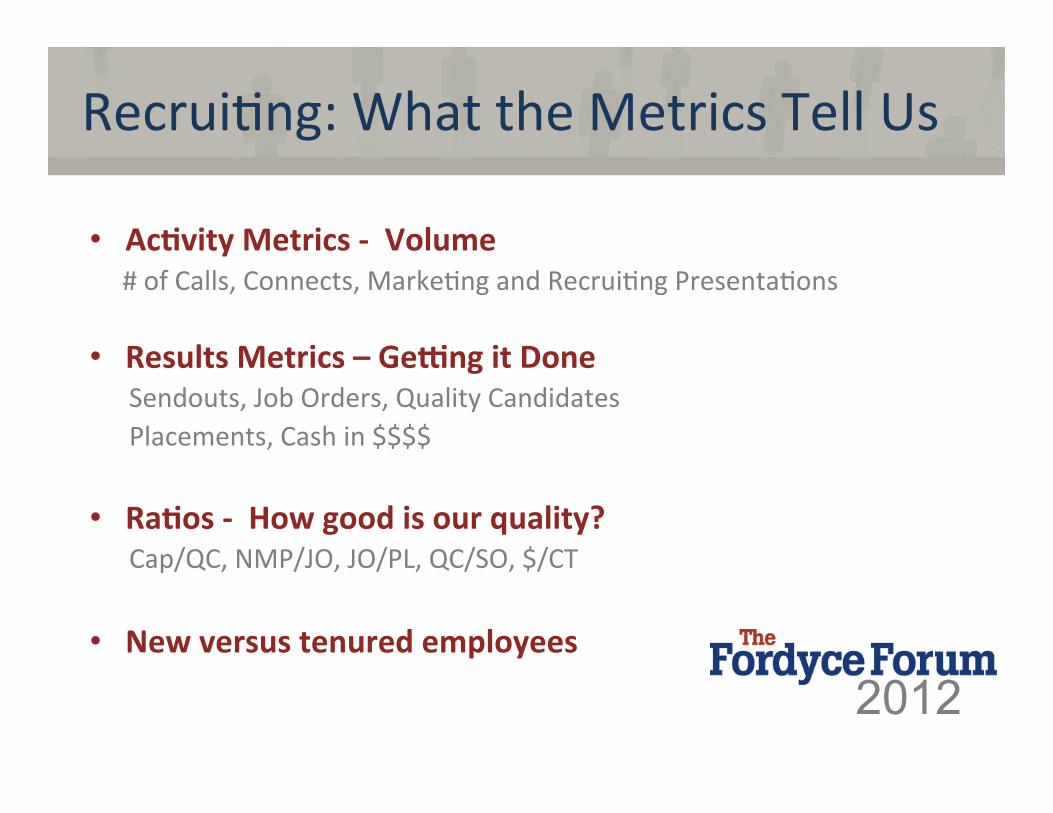
Recrui:ng: What the Metrics Tell Us
• Ac@vity Metrics -‐ Volume # of Calls, Connects, Marke:ng and Recrui:ng Presenta:ons
• Results Metrics – GeGng it Done Sendouts, Job Orders, Quality Candidates Placements, Cash in $$$$
• Ra@os -‐ How good is our quality? Cap/QC, NMP/JO, JO/PL, QC/SO, $/CT
• New versus tenured employees 2012
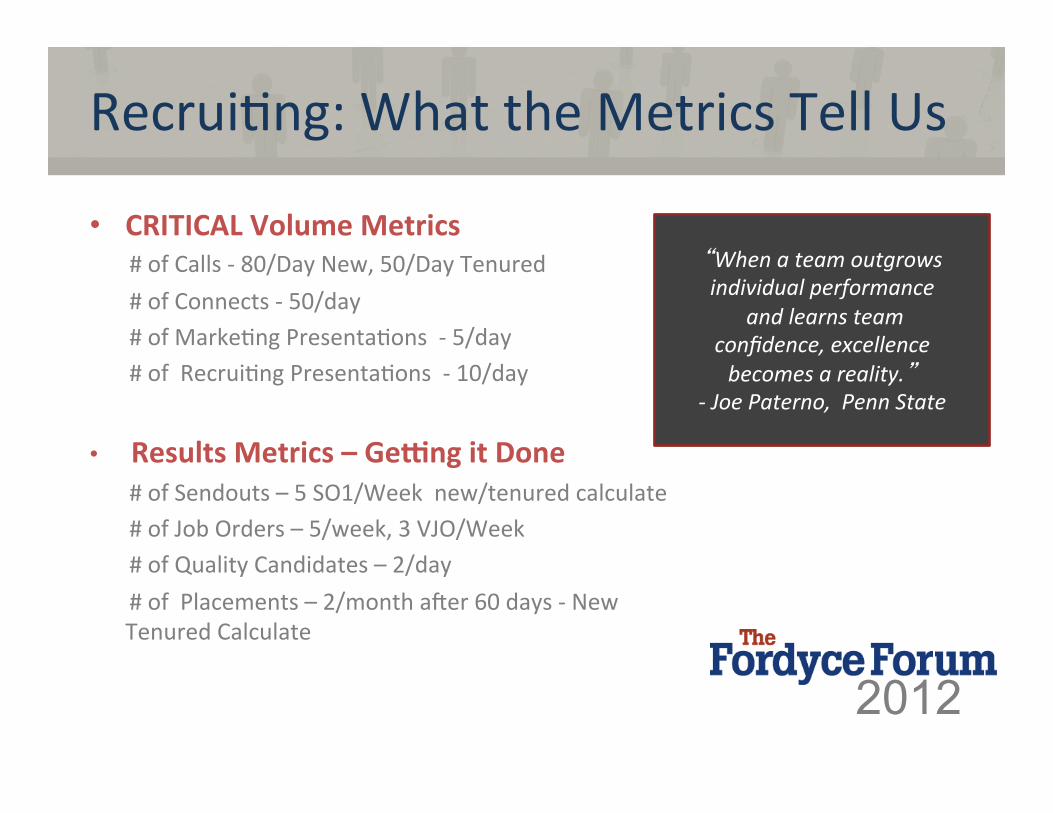
Recrui:ng: What the Metrics Tell Us
• CRITICAL Volume Metrics # of Calls -‐ 80/Day New, 50/Day Tenured # of Connects -‐ 50/day # of Marke:ng Presenta:ons -‐ 5/day # of Recrui:ng Presenta:ons -‐ 10/day
• Results Metrics – GeGng it Done # of Sendouts – 5 SO1/Week new/tenured calculate # of Job Orders – 5/week, 3 VJO/Week # of Quality Candidates – 2/day # of Placements – 2/month ader 60 days -‐ New
Tenured Calculate
“When a team outgrows individual performance
and learns team confidence, excellence becomes a reality.”
-‐ Joe Paterno, Penn State
2012
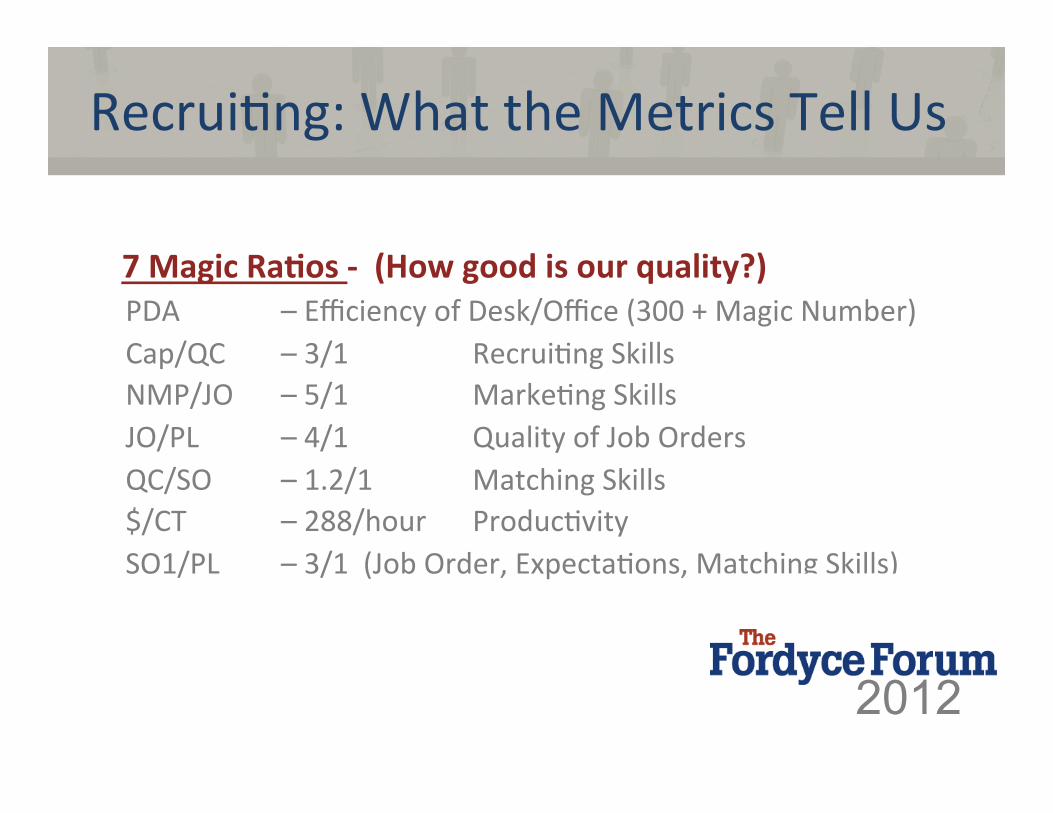
Recrui:ng: What the Metrics Tell Us
7 Magic Ra@os -‐ (How good is our quality?) PDA – Efficiency of Desk/Office (300 + Magic Number) Cap/QC – 3/1 Recrui:ng Skills NMP/JO – 5/1 Marke:ng Skills JO/PL – 4/1 Quality of Job Orders QC/SO – 1.2/1 Matching Skills $/CT – 288/hour Produc:vity SO1/PL – 3/1 (Job Order, Expecta:ons, Matching Skills)
2012
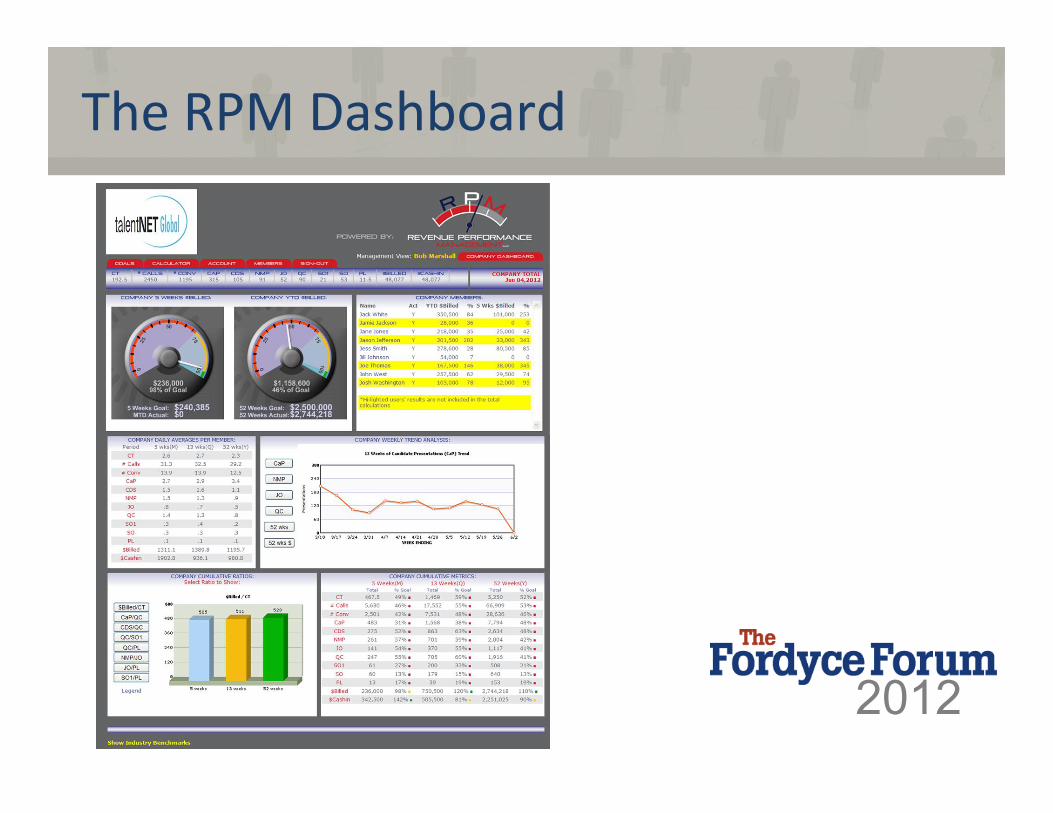
The RPM Dashboard
2012
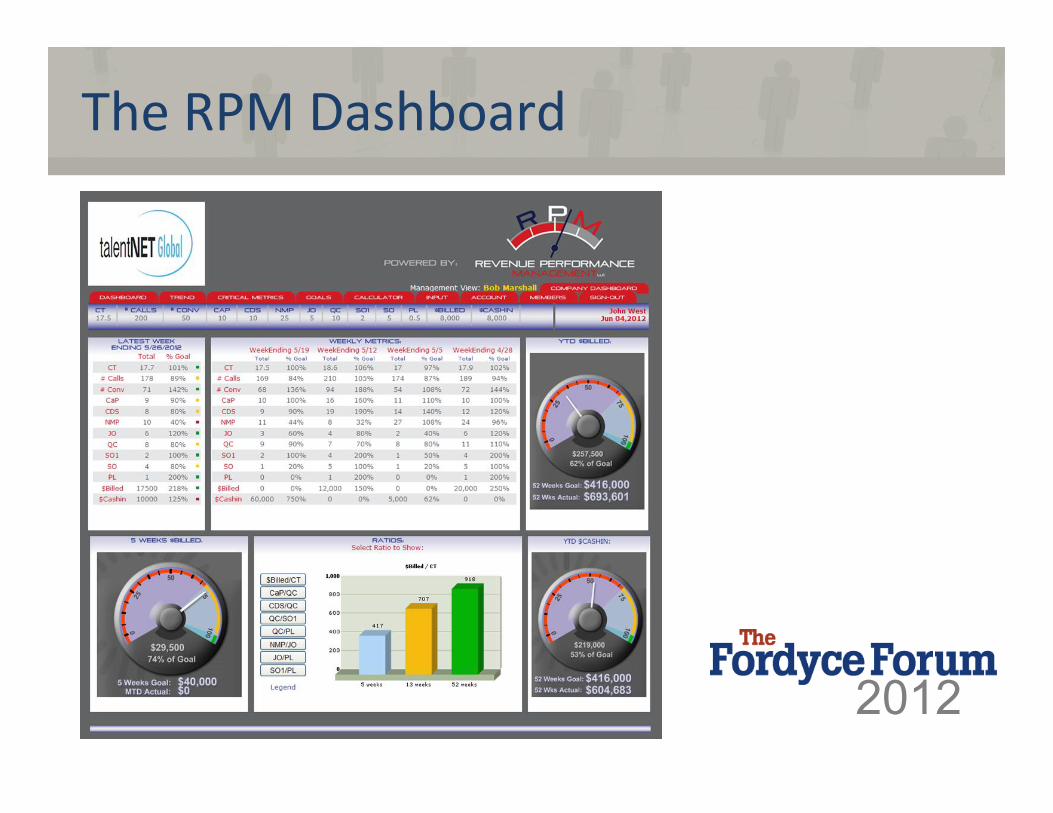
The RPM Dashboard
2012
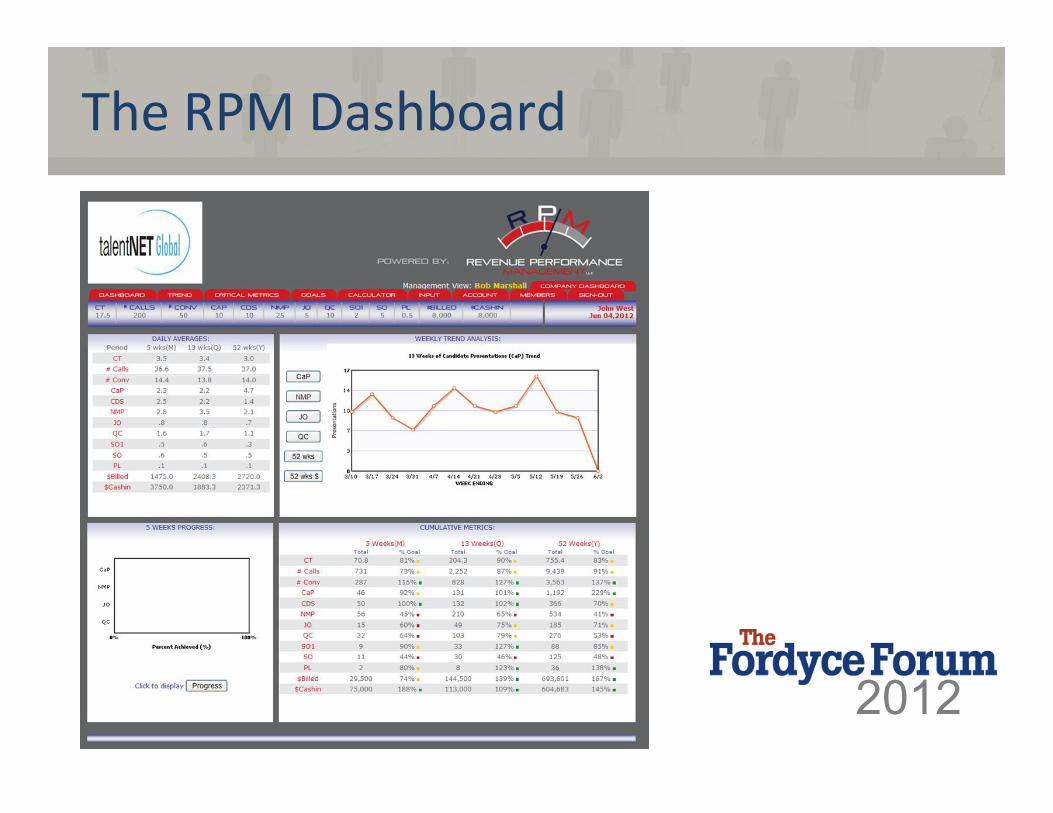
The RPM Dashboard
2012
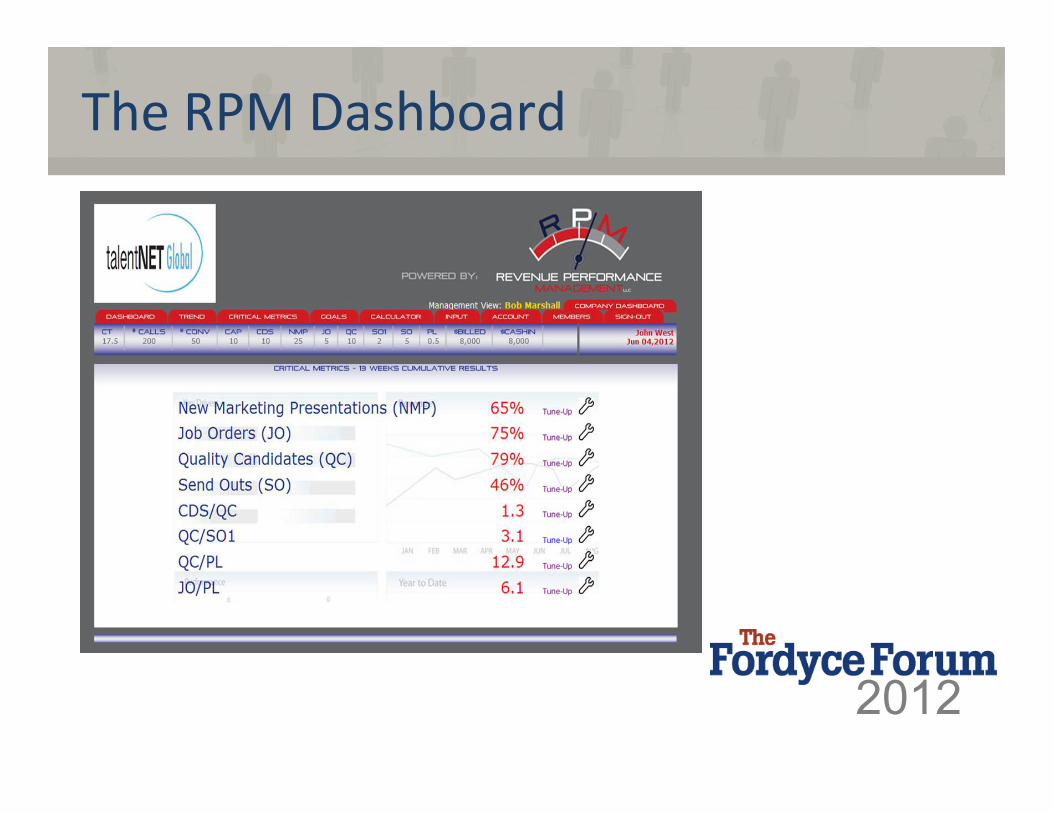
The RPM Dashboard
2012 2012
What users are saying:
2012
To Implement Tomorrow……
2012
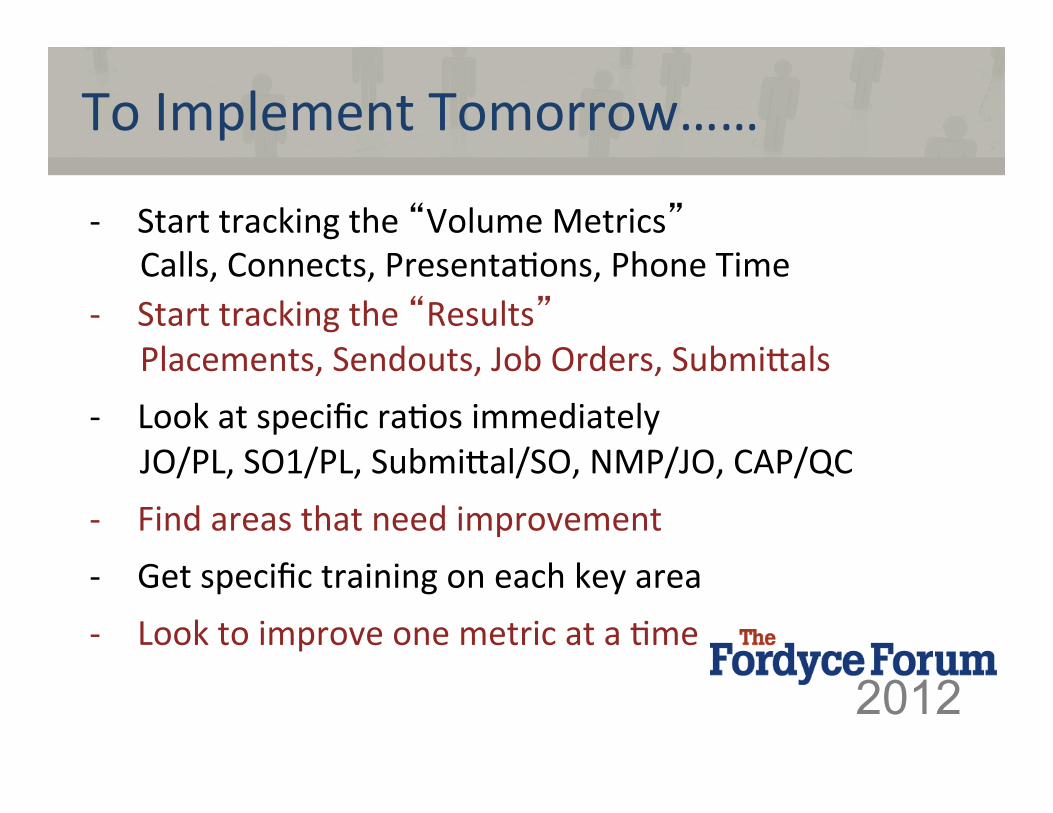
-‐ Start tracking the “Volume Metrics” Calls, Connects, Presenta:ons, Phone Time
-‐ Start tracking the “Results” Placements, Sendouts, Job Orders, SubmiQals -‐ Look at specific ra:os immediately JO/PL, SO1/PL, SubmiQal/SO, NMP/JO, CAP/QC -‐ Find areas that need improvement -‐ Get specific training on each key area -‐ Look to improve one metric at a :me
Jon Bartos
President, CEO Jonathan Sco> Interna@onal 513.701.5904 Revenue Performance Management, LLC. jon@rpm-‐usa.com
513.701.5922 info@rpm-‐usa.com
www.rpm-‐usa.com
2012