Embed Size (px)
DESCRIPTION
Citation preview
Masco IR Presentation May 2013
Safe Harbor Statement
2
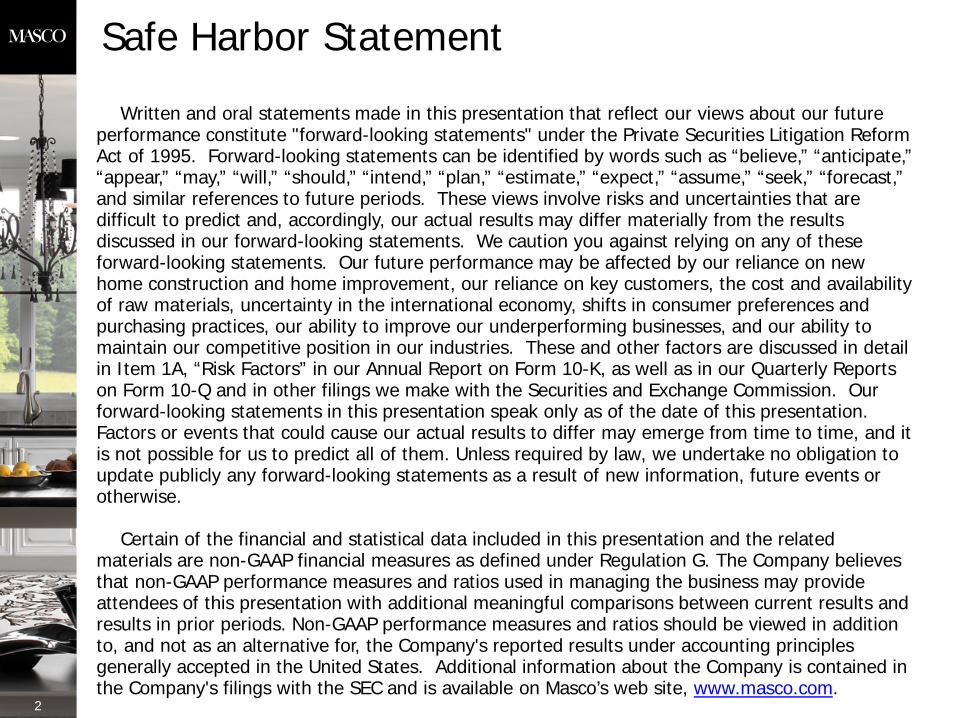
Written and oral statements made in this presentation that reflect our views about our future performance constitute "forward-looking statements" under the Private Securities Litigation Reform Act of 1995. Forward-looking statements can be identified by words such as “believe,” “anticipate,” “appear,” “may,” “will,” “should,” “intend,” “plan,” “estimate,” “expect,” “assume,” “seek,” “forecast,” and similar references to future periods. These views involve risks and uncertainties that are difficult to predict and, accordingly, our actual results may differ materially from the results discussed in our forward-looking statements. We caution you against relying on any of these forward-looking statements. Our future performance may be affected by our reliance on new home construction and home improvement, our reliance on key customers, the cost and availability of raw materials, uncertainty in the international economy, shifts in consumer preferences and purchasing practices, our ability to improve our underperforming businesses, and our ability to maintain our competitive position in our industries. These and other factors are discussed in detail in Item 1A, “Risk Factors” in our Annual Report on Form 10-K, as well as in our Quarterly Reports on Form 10-Q and in other filings we make with the Securities and Exchange Commission. Our forward-looking statements in this presentation speak only as of the date of this presentation. Factors or events that could cause our actual results to differ may emerge from time to time, and it is not possible for us to predict all of them. Unless required by law, we undertake no obligation to update publicly any forward-looking statements as a result of new information, future events or otherwise.
Certain of the financial and statistical data included in this presentation and the related
materials are non-GAAP financial measures as defined under Regulation G. The Company believes that non-GAAP performance measures and ratios used in managing the business may provide attendees of this presentation with additional meaningful comparisons between current results and results in prior periods. Non-GAAP performance measures and ratios should be viewed in addition to, and not as an alternative for, the Company's reported results under accounting principles generally accepted in the United States. Additional information about the Company is contained in the Company's filings with the SEC and is available on Masco’s web site, www.masco.com.

I N V E S T M E N T T H E S I S
Strong Fundamentals - Positioned for Growth
3
The strengths
The growth
The strategy
The company
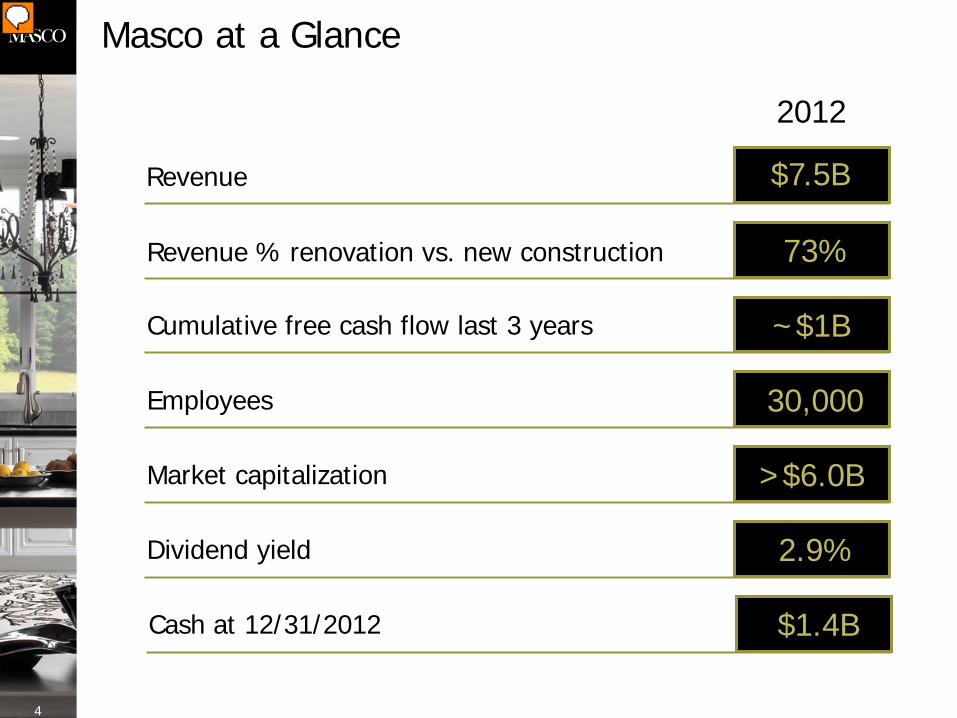
Masco at a Glance
Revenue % renovation vs. new construction 73%
Employees 30,000
Market capitalization >$6.0B
Dividend yield 2.9%
Revenue $7.5B
Cumulative free cash flow last 3 years ~$1B
4
2012
Cash at 12/31/2012 $1.4B
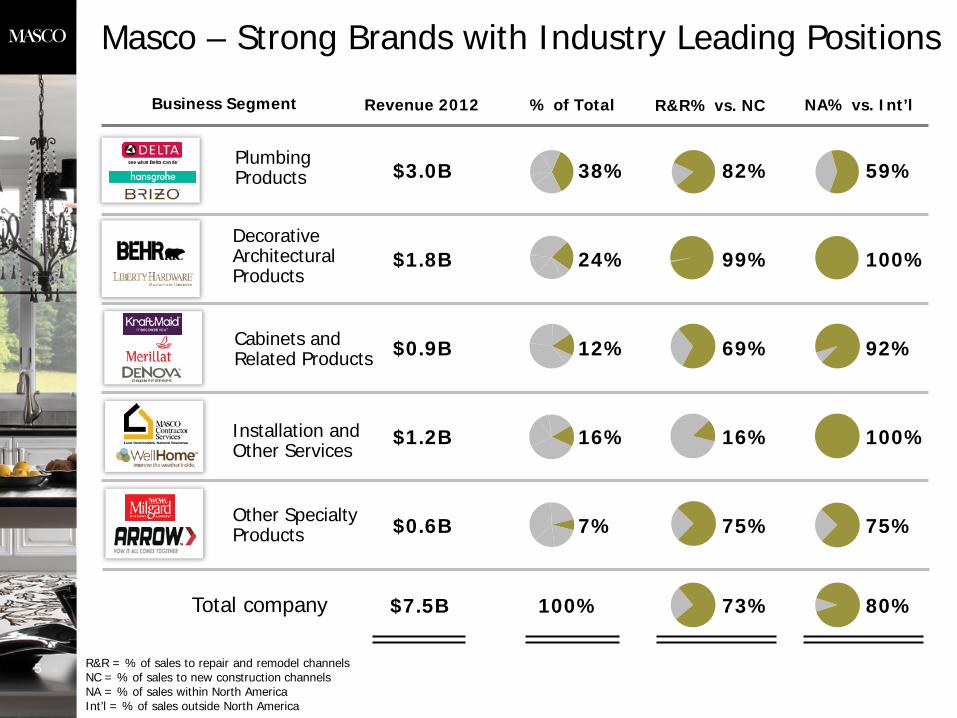
Masco – Strong Brands with Industry Leading Positions
Business Segment
Cabinets and Related Products
Plumbing Products
Installation and Other Services
Decorative Architectural Products
$0.9B
$3.0B
$1.2B
$1.8B
Revenue 2012 % of Total
38%
24%
12%
16%
$7.5B 100% Total company
5
Other Specialty Products $0.6B 7%
R&R% vs. NC NA% vs. Int’l
82% 59%
99% 100%
69% 92%
16% 100%
75% 75%
73% 80%
R&R = % of sales to repair and remodel channels NC = % of sales to new construction channels NA = % of sales within North America Int’l = % of sales outside North America
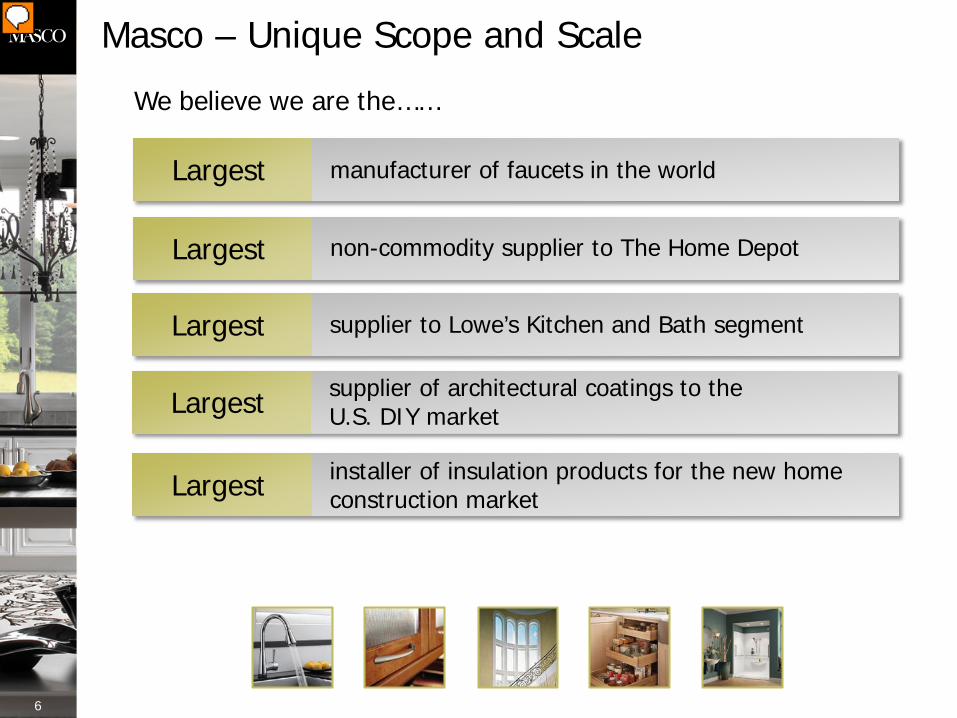
Masco – Unique Scope and Scale
6
manufacturer of faucets in the world Largest
non-commodity supplier to The Home Depot Largest
supplier to Lowe’s Kitchen and Bath segment Largest
supplier of architectural coatings to the U.S. DIY market Largest
installer of insulation products for the new home construction market Largest
We believe we are the……
I N V E S T M E N T T H E S I S
Strong Fundamentals - Positioned for Growth
7
The strengths
The growth
The strategy
The company
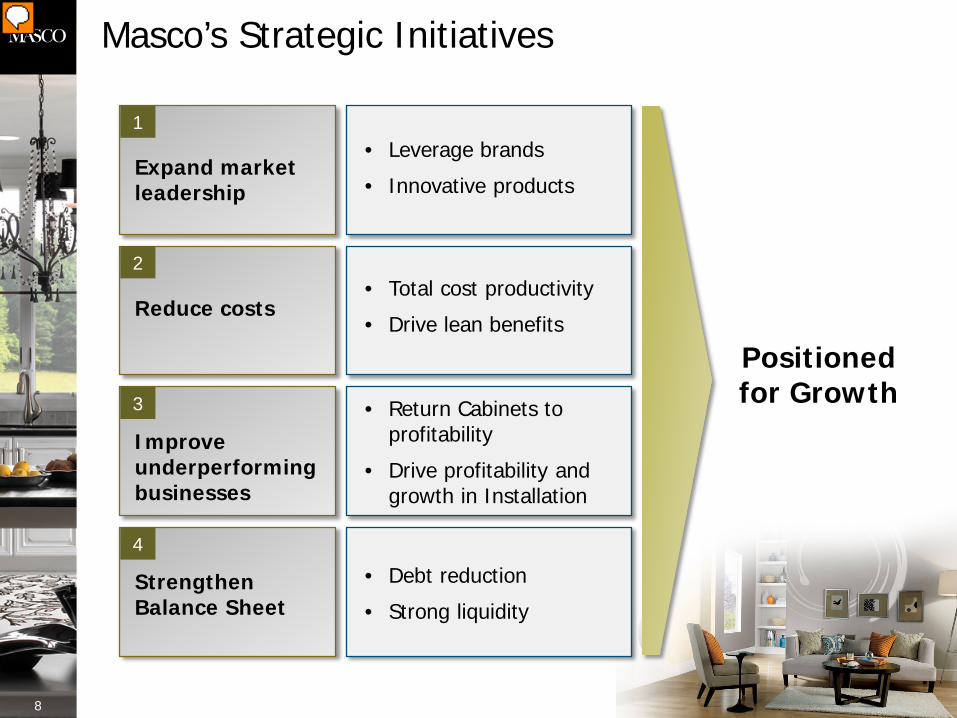
Masco’s Strategic Initiatives
8
Positioned for Growth
• Leverage brands
• Innovative products Expand market leadership
• Total cost productivity
• Drive lean benefits Reduce costs
• Return Cabinets to profitability
• Drive profitability and growth in Installation
Improve underperforming businesses
1
2
3
• Debt reduction
• Strong liquidity Strengthen Balance Sheet
4
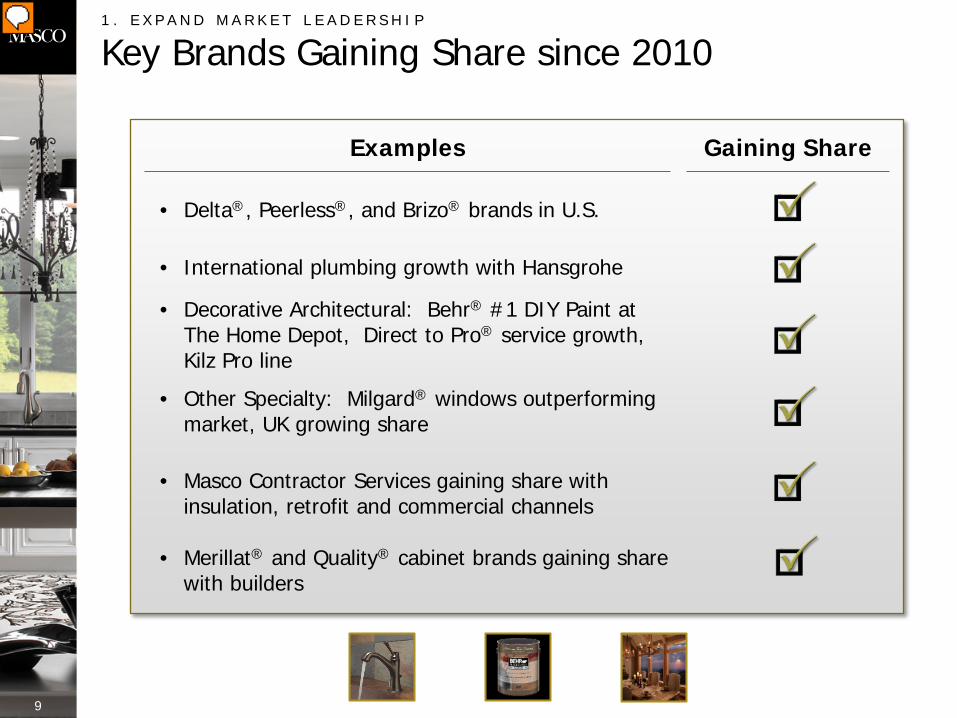
1 . E X P A N D M A R K E T L E A D E R S H I P
Key Brands Gaining Share since 2010
Examples Gaining Share
• Delta®, Peerless®, and Brizo® brands in U.S.
• International plumbing growth with Hansgrohe
• Decorative Architectural: Behr® #1 DIY Paint at The Home Depot, Direct to Pro® service growth, Kilz Pro line
• Other Specialty: Milgard® windows outperforming market, UK growing share
• Masco Contractor Services gaining share with insulation, retrofit and commercial channels
9
• Merillat® and Quality® cabinet brands gaining share with builders
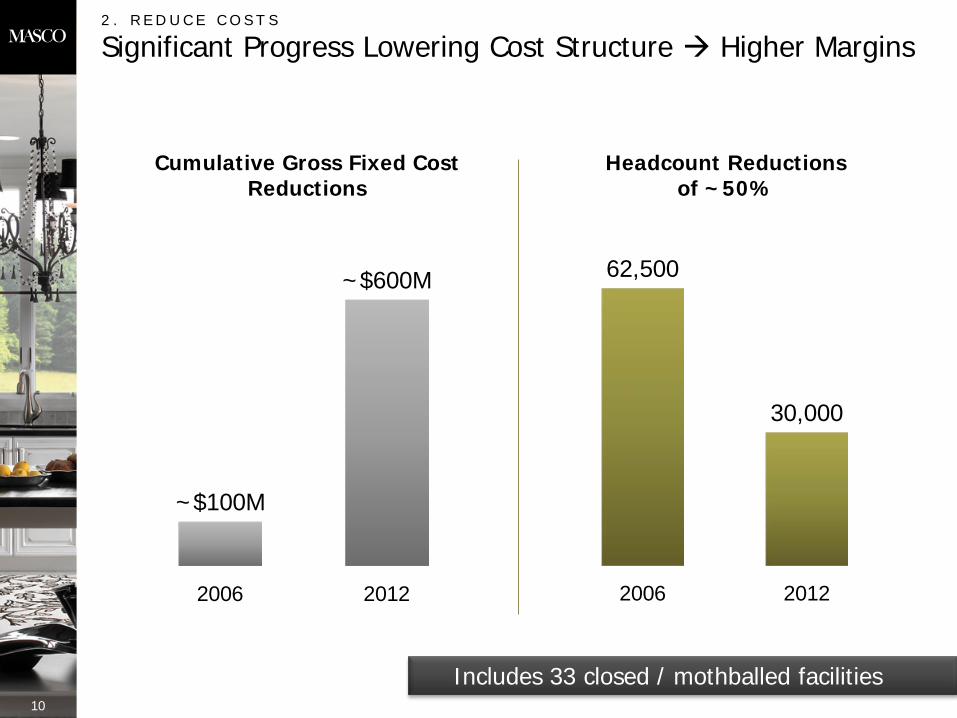
2 . R E D U C E C O S T S
Significant Progress Lowering Cost Structure Higher Margins
Cumulative Gross Fixed Cost Reductions
Headcount Reductions of ~50%
~$100M
~$600M
2006 2012
62,500
30,000
2006 2012
Includes 33 closed / mothballed facilities 10
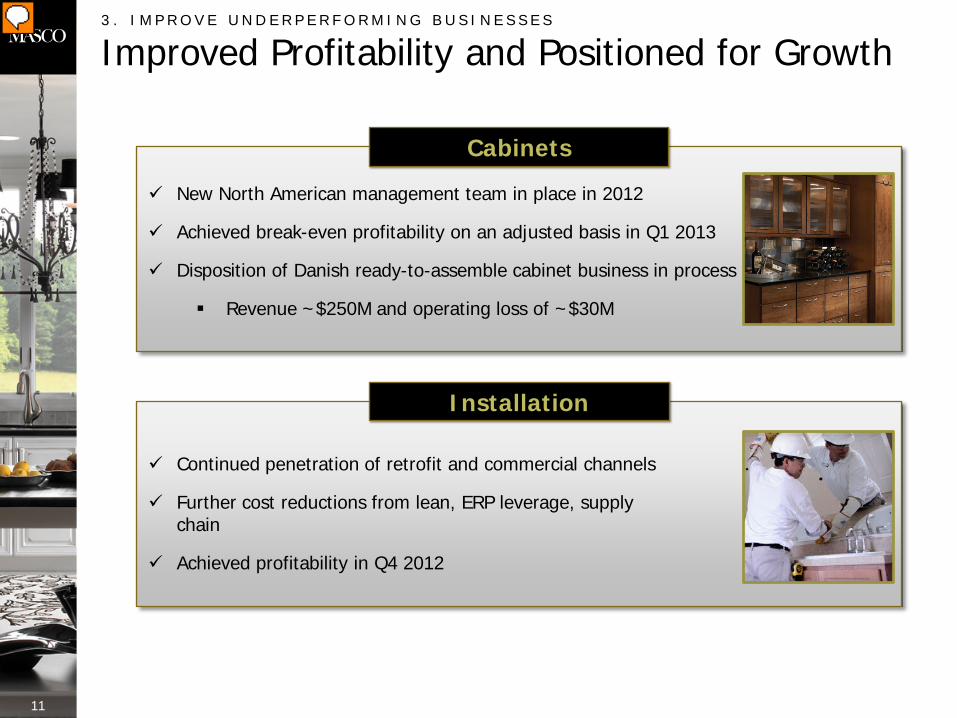
3 . I M P R O V E U N D E R P E R F O R M I N G B U S I N E S S E S
Improved Profitability and Positioned for Growth
Cabinets
New North American management team in place in 2012
Achieved break-even profitability on an adjusted basis in Q1 2013
Disposition of Danish ready-to-assemble cabinet business in process
Revenue ~$250M and operating loss of ~$30M
Installation
Continued penetration of retrofit and commercial channels
Further cost reductions from lean, ERP leverage, supply chain
Achieved profitability in Q4 2012
11
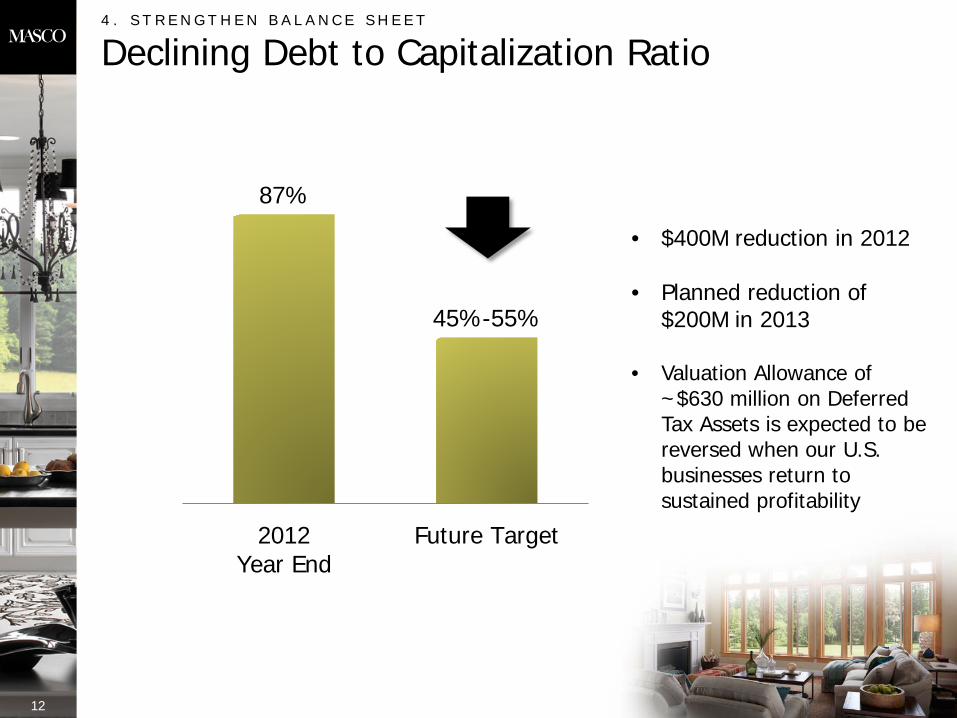
4 . S T R E N G T H E N B A L A N C E S H E E T
Declining Debt to Capitalization Ratio
12
87%
45%-55%
2012Year End
Future Target
• $400M reduction in 2012 • Planned reduction of
$200M in 2013 • Valuation Allowance of
~$630 million on Deferred Tax Assets is expected to be reversed when our U.S. businesses return to sustained profitability

I N V E S T M E N T T H E S I S
Strong Fundamentals - Positioned for Growth
13
The strengths
The growth
The strategy
The company
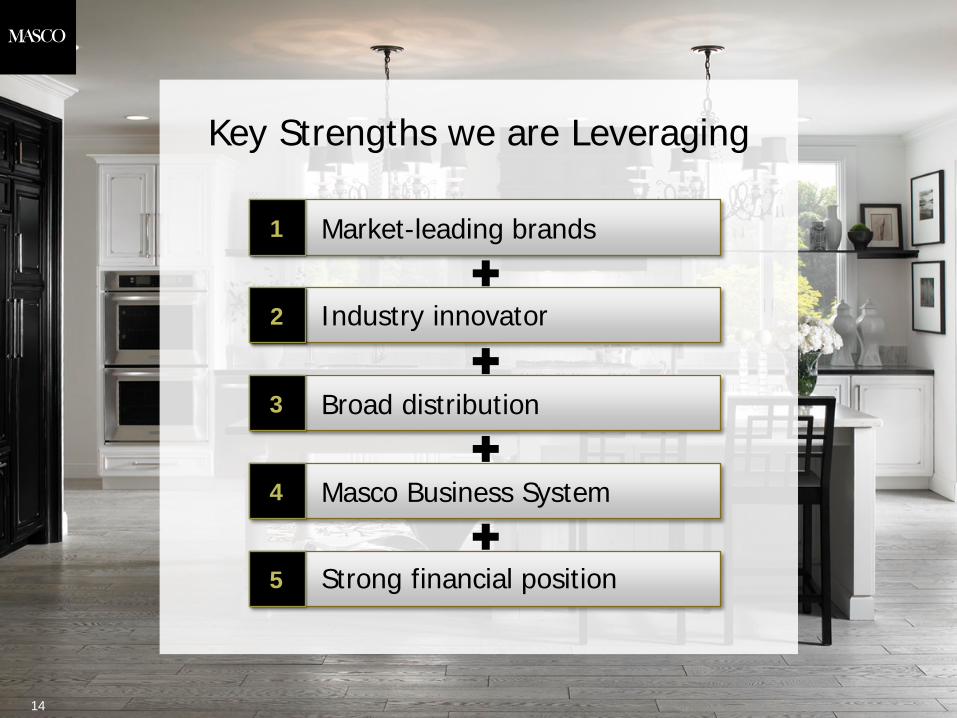
Broad distribution 3
Industry innovator 2
Market-leading brands 1
Masco Business System 4
Strong financial position 5
Key Strengths we are Leveraging
14
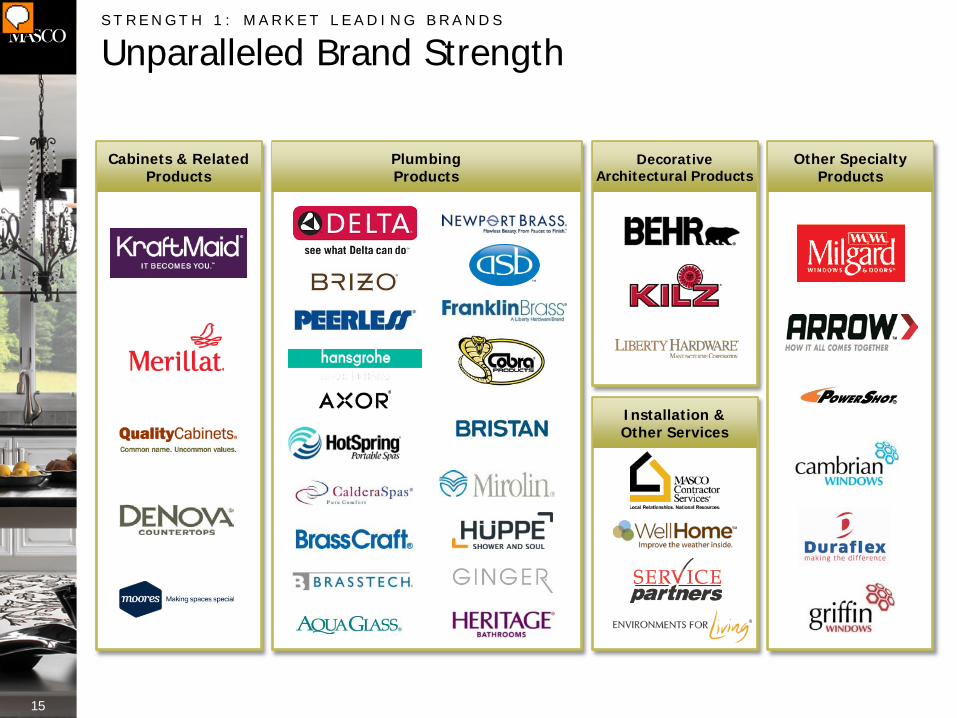
S T R E N G T H 1 : M A R K E T L E A D I N G B R A N D S
Unparalleled Brand Strength
15
Installation & Other Services
Plumbing Products
Cabinets & Related Products
Decorative Architectural Products
Other Specialty Products
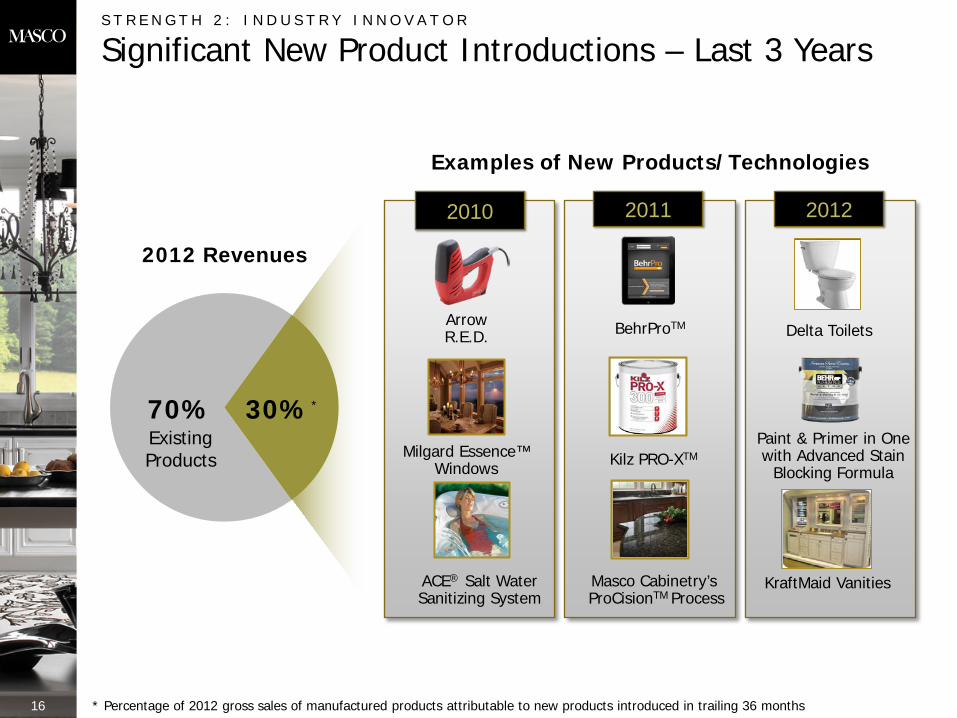
S T R E N G T H 2 : I N D U S T R Y I N N O V A T O R
Significant New Product Introductions – Last 3 Years
30%*
Examples of New Products/Technologies
Existing Products
2012 2011 2010
70% Milgard Essence™
Windows
Arrow R.E.D.
ACE® Salt Water Sanitizing System
2012 Revenues
16
BehrProTM
Masco Cabinetry’s ProCisionTM Process
* Percentage of 2012 gross sales of manufactured products attributable to new products introduced in trailing 36 months
Kilz PRO-XTM
Delta Toilets
Paint & Primer in One with Advanced Stain
Blocking Formula
KraftMaid Vanities
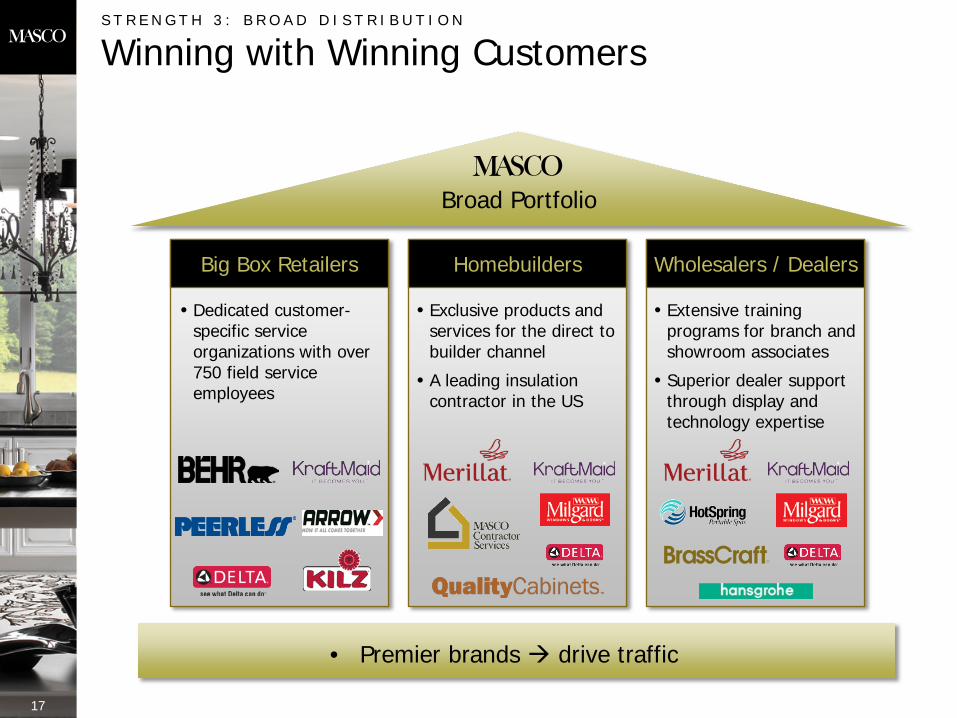
S T R E N G T H 3 : B R O A D D I S T R I B U T I O N
Winning with Winning Customers
Broad Portfolio
Big Box Retailers Homebuilders Wholesalers / Dealers
• Exclusive products and services for the direct to builder channel
• A leading insulation contractor in the US
• Dedicated customer-specific service organizations with over 750 field service employees
• Extensive training programs for branch and showroom associates
• Superior dealer support through display and technology expertise
• Premier brands drive traffic
17
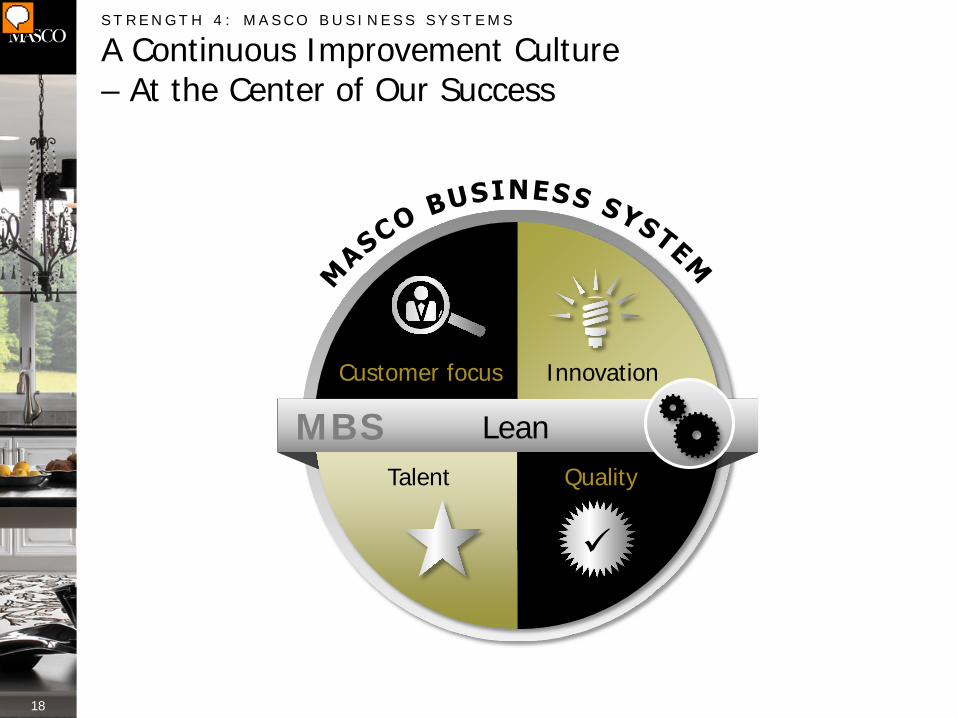
Customer focus
Lean Quality Talent
Innovation
S T R E N G T H 4 : M A S C O B U S I N E S S S Y S T E M S
A Continuous Improvement Culture – At the Center of Our Success
18
MBS
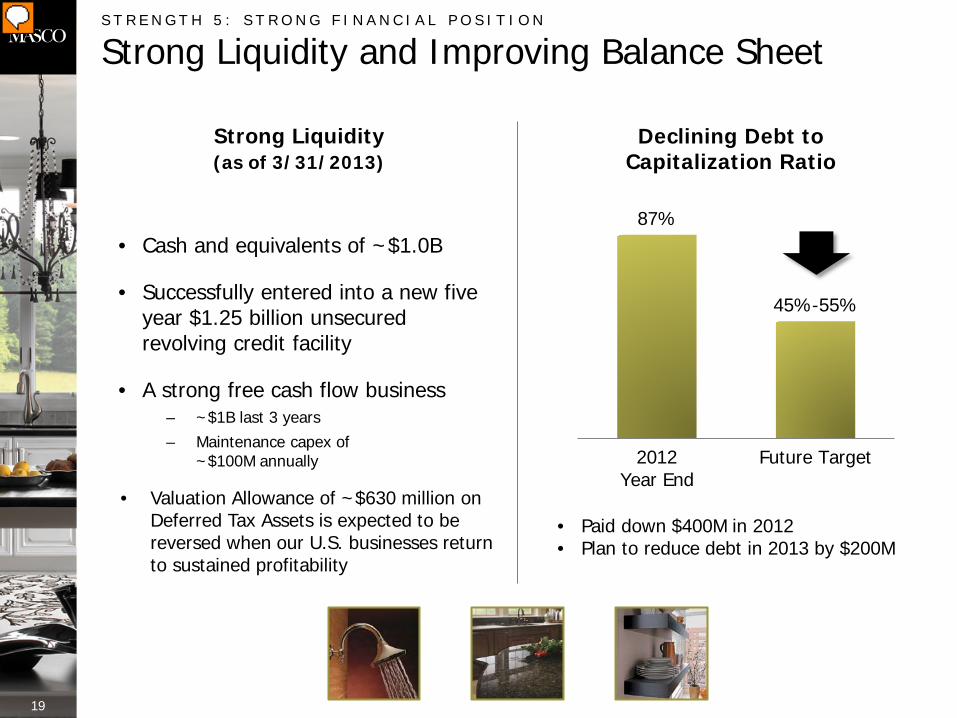
S T R E N G T H 5 : S T R O N G F I N A N C I A L P O S I T I O N
Strong Liquidity and Improving Balance Sheet
Strong Liquidity (as of 3/31/2013)
• Cash and equivalents of ~$1.0B
• Successfully entered into a new five year $1.25 billion unsecured revolving credit facility
• A strong free cash flow business – ~$1B last 3 years – Maintenance capex of
~$100M annually
19
• Paid down $400M in 2012 • Plan to reduce debt in 2013 by $200M
Declining Debt to Capitalization Ratio
87%
45%-55%
2012Year End
Future Target
• Valuation Allowance of ~$630 million on Deferred Tax Assets is expected to be reversed when our U.S. businesses return to sustained profitability
I N V E S T M E N T T H E S I S
Strong Fundamentals - Positioned for Growth
20
The strengths
The growth
The strategy
The company
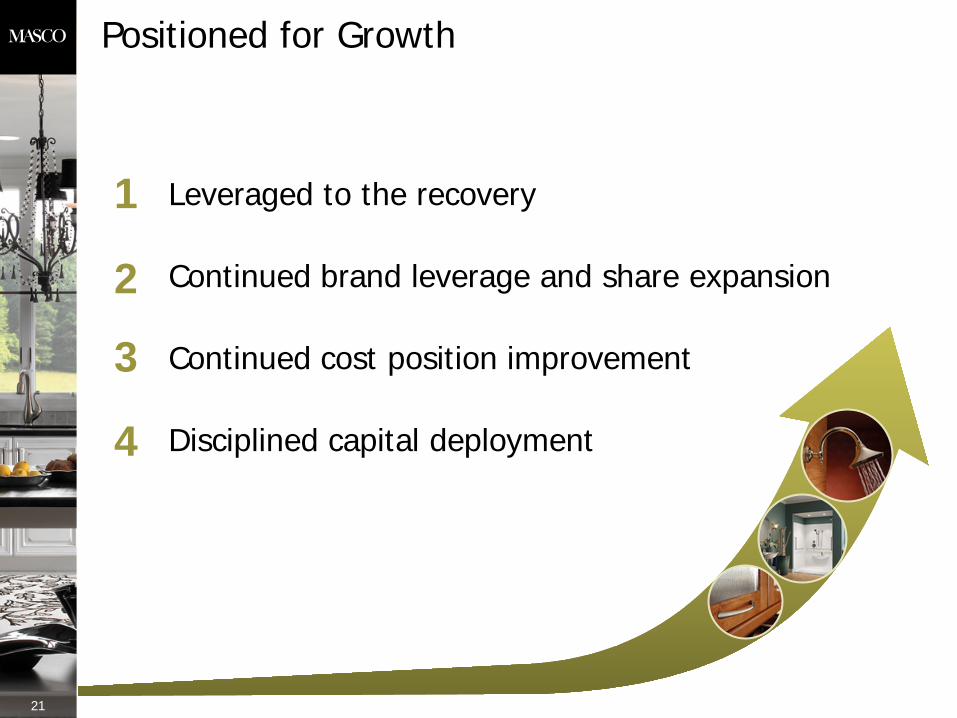
Positioned for Growth
21
Leveraged to the recovery
Continued brand leverage and share expansion
Continued cost position improvement
Disciplined capital deployment
1
2
3
4
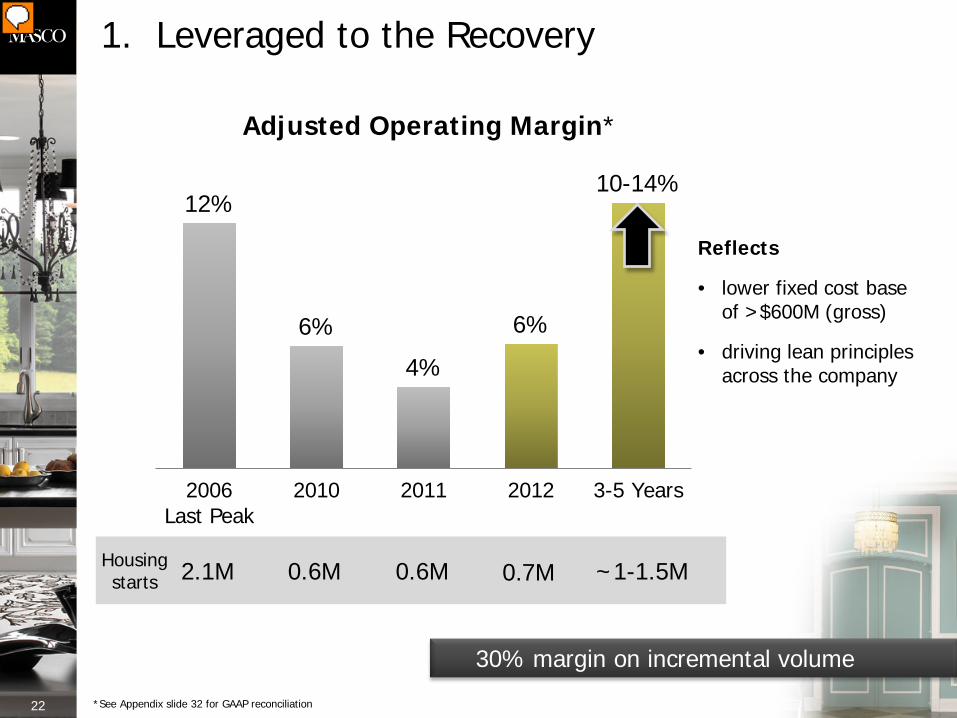
1. Leveraged to the Recovery
12%
6%
4%
6%
10-14%
2006Last Peak
2010 2011 2012 3-5 Years
Adjusted Operating Margin*
22
Reflects
• lower fixed cost base of >$600M (gross)
• driving lean principles across the company
30% margin on incremental volume
Housing starts 2.1M 0.6M 0.6M ~1-1.5M
*See Appendix slide 32 for GAAP reconciliation
0.7M
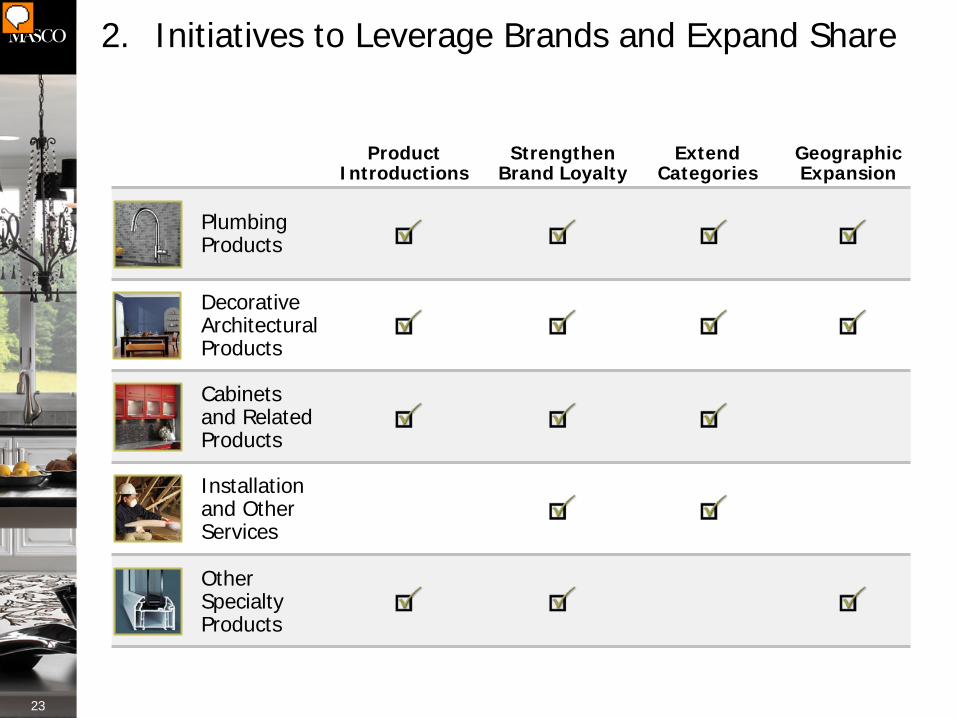
2. Initiatives to Leverage Brands and Expand Share
Geographic Expansion
Cabinets and Related Products
Plumbing Products
Installation and Other Services
Decorative Architectural Products
Other Specialty Products
Product Introductions
Extend Categories
Strengthen Brand Loyalty
23
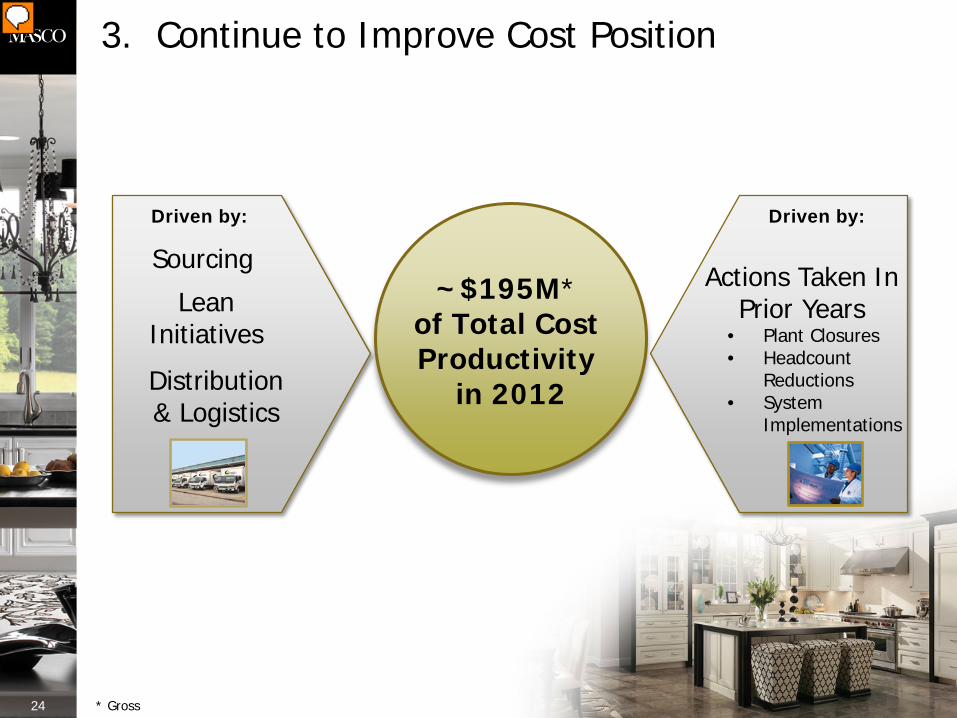
3. Continue to Improve Cost Position
~$195M* of Total Cost Productivity
in 2012
24 * Gross
Sourcing
Lean Initiatives
Driven by: Driven by:
Distribution & Logistics
Actions Taken In Prior Years
• Plant Closures • Headcount
Reductions • System
Implementations
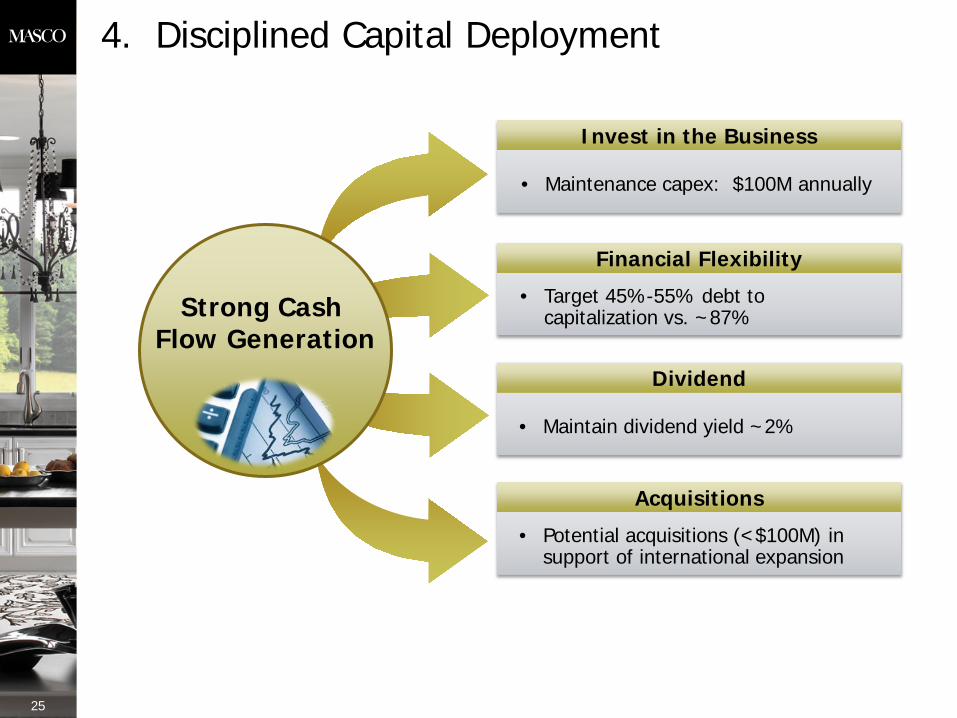
4. Disciplined Capital Deployment
Invest in the Business
• Maintenance capex: $100M annually
Strong Cash Flow Generation
Financial Flexibility
• Target 45%-55% debt to capitalization vs. ~87%
Dividend
• Maintain dividend yield ~2%
Acquisitions
• Potential acquisitions (<$100M) in support of international expansion
25
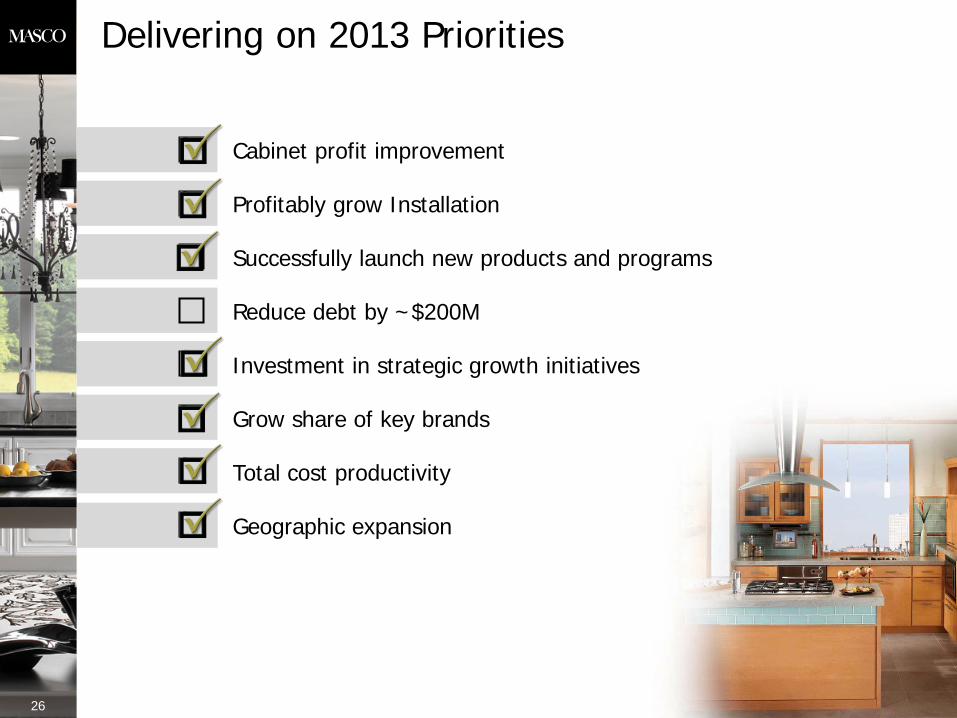
Delivering on 2013 Priorities
Investment in strategic growth initiatives
Geographic expansion
Total cost productivity
Reduce debt by ~$200M
Cabinet profit improvement
Profitably grow Installation
Grow share of key brands
26
Successfully launch new products and programs
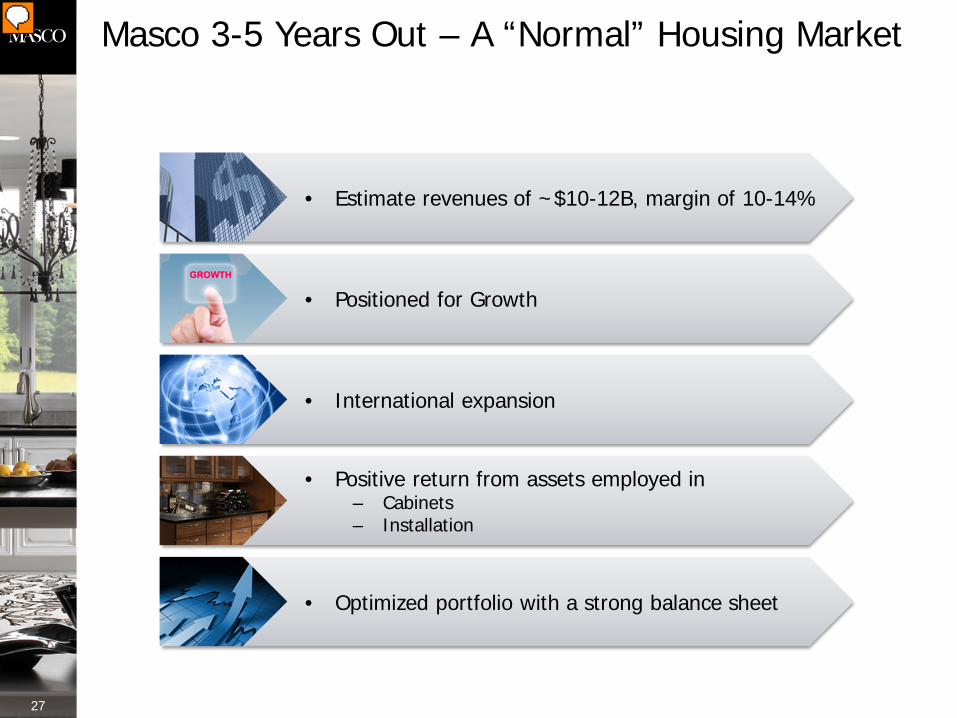
Masco 3-5 Years Out – A “Normal” Housing Market
27
• Estimate revenues of ~$10-12B, margin of 10-14%
• Positioned for Growth
• Optimized portfolio with a strong balance sheet
• International expansion
• Positive return from assets employed in – Cabinets – Installation
W H Y I N V E S T I N M A S C O
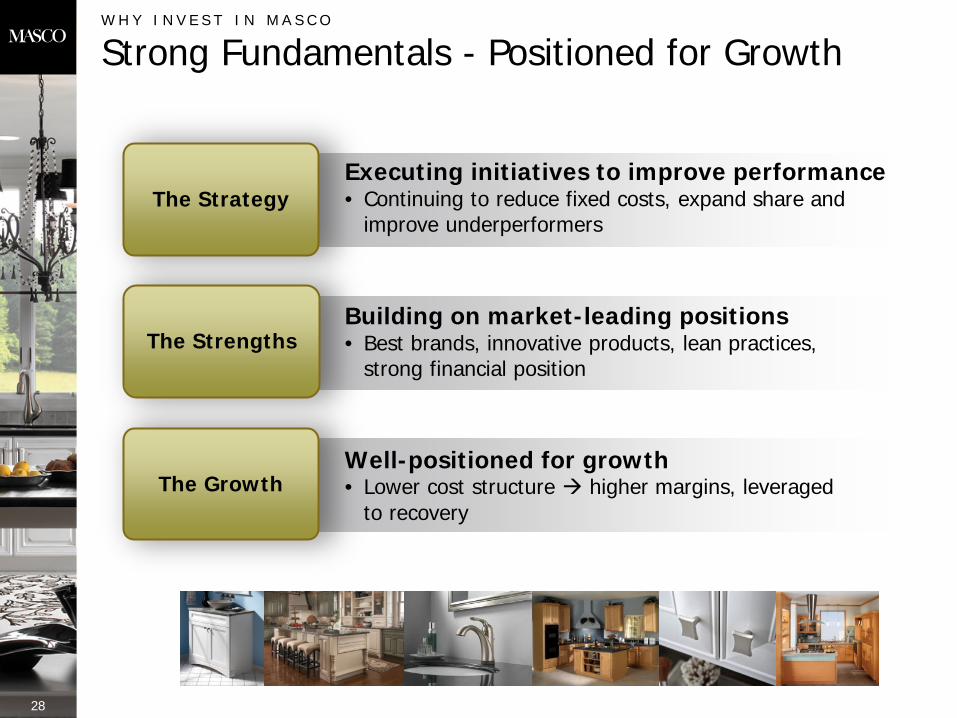
Strong Fundamentals - Positioned for Growth
28
Executing initiatives to improve performance • Continuing to reduce fixed costs, expand share and
improve underperformers The Strategy
Building on market-leading positions • Best brands, innovative products, lean practices,
strong financial position The Strengths
Well-positioned for growth • Lower cost structure higher margins, leveraged
to recovery The Growth

Appendix
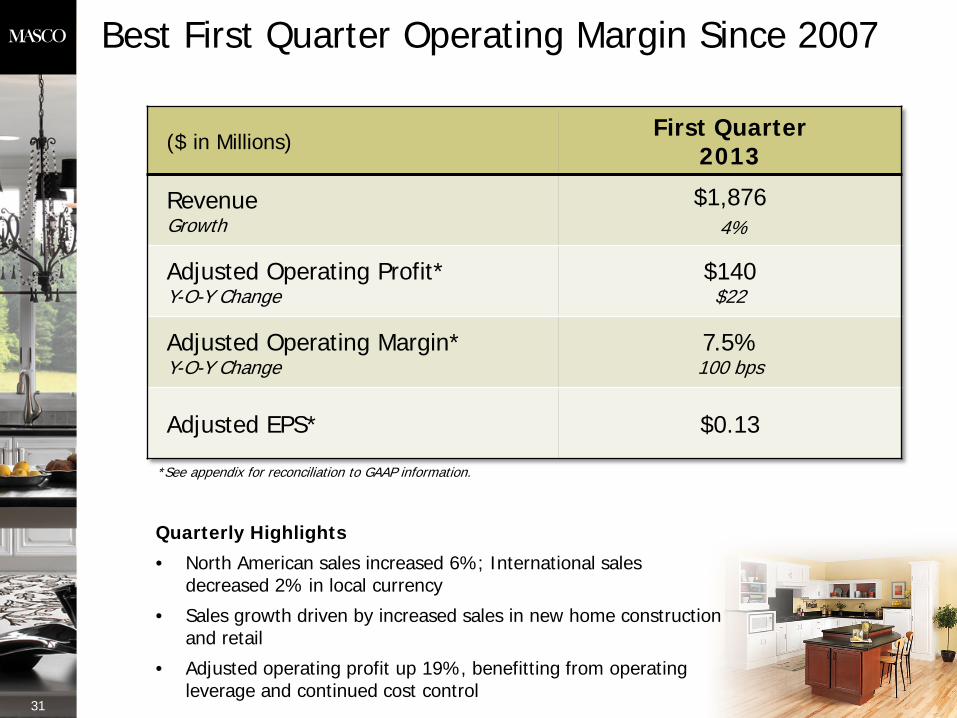
Best First Quarter Operating Margin Since 2007
31
($ in Millions) First Quarter
2013
Revenue Growth
$1,876 4%
Adjusted Operating Profit* Y-O-Y Change
$140 $22
Adjusted Operating Margin* Y-O-Y Change
7.5% 100 bps
Adjusted EPS* $0.13
Quarterly Highlights
• North American sales increased 6%; International sales decreased 2% in local currency
• Sales growth driven by increased sales in new home construction and retail
• Adjusted operating profit up 19%, benefitting from operating leverage and continued cost control
*See appendix for reconciliation to GAAP information.
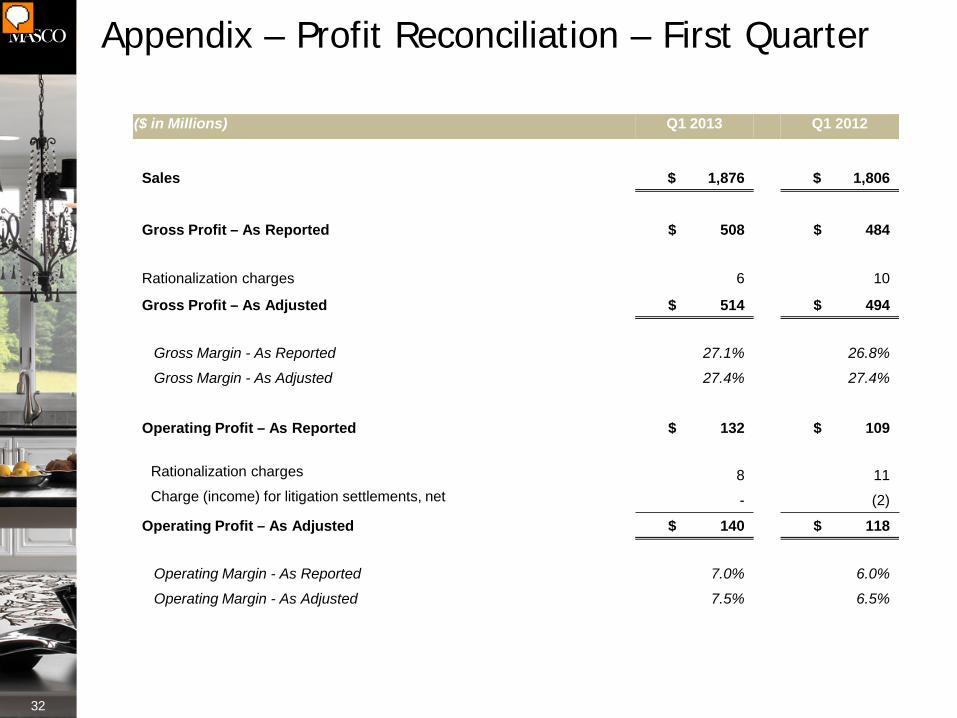
Appendix – Profit Reconciliation – First Quarter
32
($ in Millions) Q1 2013 Q1 2012
Sales $ 1,876 $ 1,806
Gross Profit – As Reported $ 508 $ 484 Rationalization charges 6 10
Gross Profit – As Adjusted $ 514 $ 494 Gross Margin - As Reported 27.1% 26.8%
Gross Margin - As Adjusted 27.4% 27.4%
Operating Profit – As Reported $ 132 $ 109
Rationalization charges 8 11 Charge (income) for litigation settlements, net - (2)
Operating Profit – As Adjusted $ 140 $ 118 Operating Margin - As Reported 7.0% 6.0%
Operating Margin - As Adjusted 7.5% 6.5%
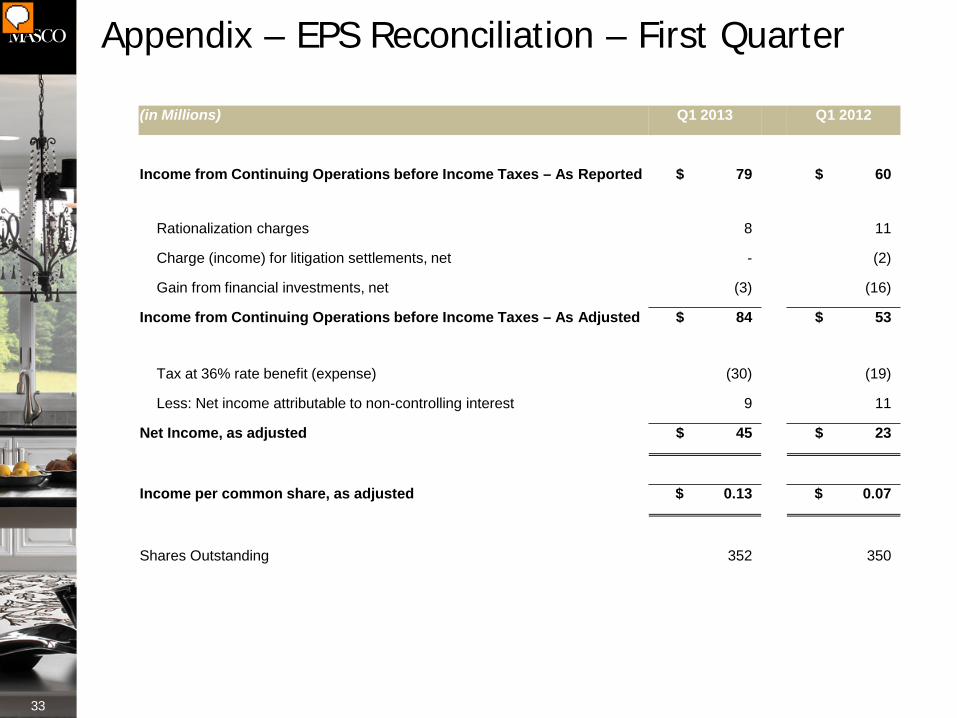
Appendix – EPS Reconciliation – First Quarter
33
(in Millions) Q1 2013 Q1 2012
Income from Continuing Operations before Income Taxes – As Reported $ 79 $ 60
Rationalization charges 8 11
Charge (income) for litigation settlements, net - (2)
Gain from financial investments, net (3) (16)
Income from Continuing Operations before Income Taxes – As Adjusted $ 84 $ 53
Tax at 36% rate benefit (expense) (30) (19)
Less: Net income attributable to non-controlling interest 9 11
Net Income, as adjusted $ 45 $ 23
Income per common share, as adjusted $ 0.13 $ 0.07
Shares Outstanding 352 350
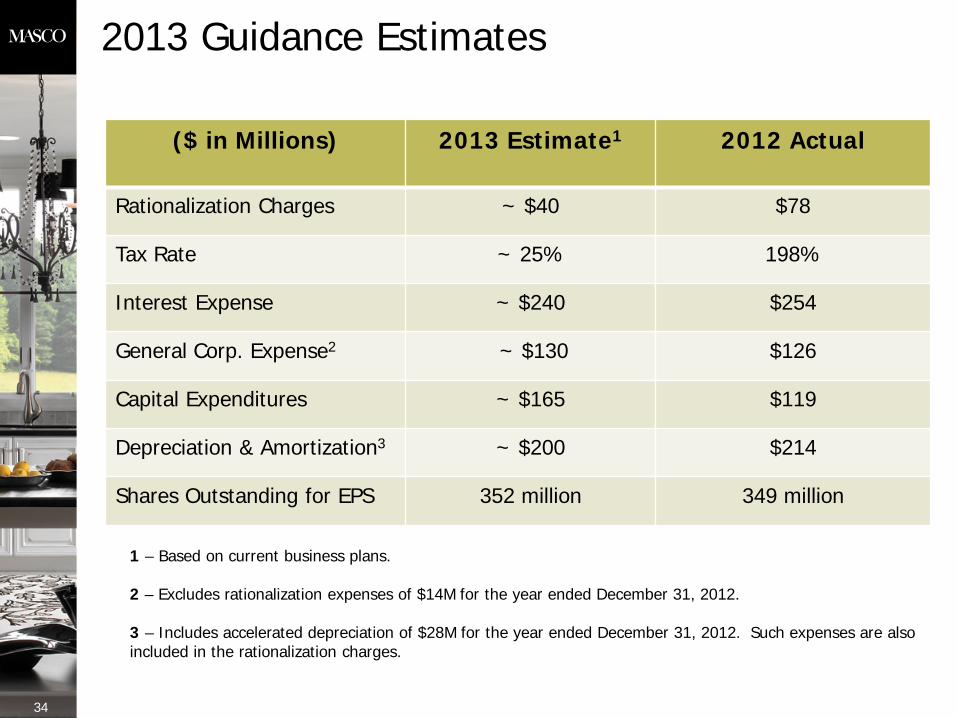
($ in Millions) 2013 Estimate1
2012 Actual
Rationalization Charges ~ $40 $78
Tax Rate ~ 25% 198%
Interest Expense ~ $240 $254
General Corp. Expense2 ~ $130 $126
Capital Expenditures ~ $165 $119
Depreciation & Amortization3 ~ $200 $214
Shares Outstanding for EPS 352 million 349 million
2013 Guidance Estimates
1 – Based on current business plans. 2 – Excludes rationalization expenses of $14M for the year ended December 31, 2012. 3 – Includes accelerated depreciation of $28M for the year ended December 31, 2012. Such expenses are also included in the rationalization charges.
34
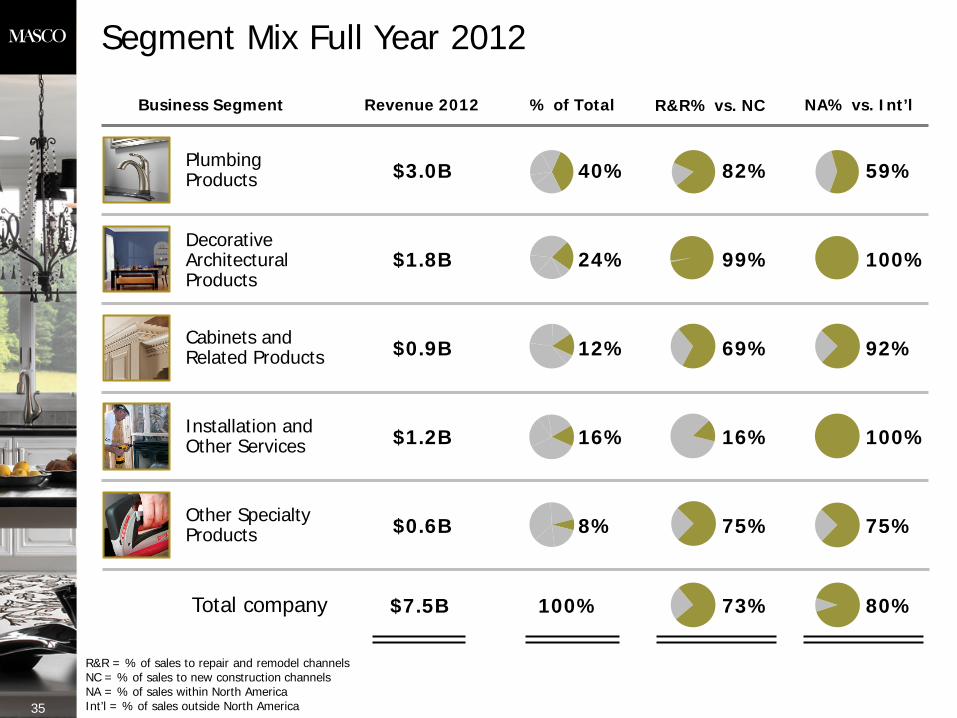
Segment Mix Full Year 2012
Business Segment
Cabinets and Related Products
Plumbing Products
Installation and Other Services
Decorative Architectural Products
$0.9B
$3.0B
$1.2B
$1.8B
Revenue 2012 % of Total
40%
24%
12%
16%
$7.5B 100% Total company
35
Other Specialty Products $0.6B 8%
R&R% vs. NC NA% vs. Int’l
82% 59%
99% 100%
69% 92%
16% 100%
75% 75%
73% 80%
R&R = % of sales to repair and remodel channels NC = % of sales to new construction channels NA = % of sales within North America Int’l = % of sales outside North America
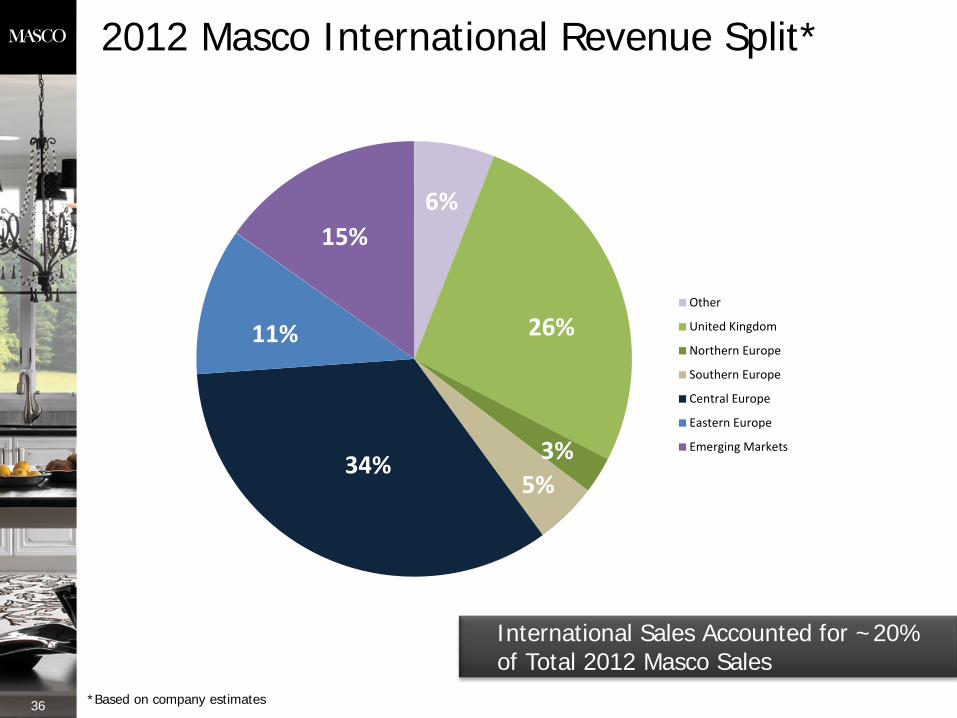
2012 Masco International Revenue Split*
36 *Based on company estimates
International Sales Accounted for ~20% of Total 2012 Masco Sales
6%
26%
3% 5%
34%
11%
15%
Other
United Kingdom
Northern Europe
Southern Europe
Central Europe
Eastern Europe
Emerging Markets