Embed Size (px)
Citation preview

'Trade House'
426 Alok Nagar , Kanadia Main Road Near Bangali Square
Indore-452001 (M.P.) India Mobile :+91-9039261444
Equity WEEKLY REPORT
28-nov-2016
GLOBAL MARKET WEEKLY
INDICES CLOSE CHANGE (%)
DOW JONES 19152.14 1.50
NASDAQ 5398.92 1.22
CAC 40 4550.27 1.02
DAX 10699.27 0.33
FTSE 100 6840.75 0.96
NIKKEI 18381.22 2.3
HANG SENG 22723.45 1.7
SHANGHAI COM. 3261.49 2.14
NIFTY WEEKLY TOP GAINERS
SCRIPT CLOSE CHANGE (%)
TECH MAHINDRA 445.30 9.42
HINDALCO 18050 9.16
TCS 2300.35 8.25
LUPIN 1508.65 6.41
WIPRO 464.75 6.31
NIFTY WEEKLY TOP LOSERS
SCRIPT CLOSE CHANGE (%)
EICHER MOTORS 20222.55 -7.20
BHEL 126.75 -5.62
M&M 1173 -5.39
SBI 260.95 -5.38
BANK BARODA 167.90 -5.11
INDIAN MARKET WEEKLY OUTLOOK
INDIAN INDICES WEEKLY
INDICES CLOSE CHANGE (%)
NIFTY 8114.30 0.50
SENSEX 30 26316.24 0.60
NIFTY 500 6960.75 0.80
NIFTY BANK 18507.30 -2.40
NIFTY IT 10114.90 8.81
NIFTY MIDCAP 3639.05 0.87
NIFTY SMALL CAP 5694.60 2.11
INDIAN SECTORIAL INDICES WEEKLY
INDICES CLOSE CHANGE (%)
NIFTY PHARMA 11085 3.10
NIFTY AUTO 8780.40 -2.30
NIFTY METAL 2757.45 5
NIFTY FMCG 20157.15 1
NIFTY ENERGY 9806.45 0.10
NIFTY INFRA 2707.05 -0.40
NIFTY FIN. SER. 7507.60 -0.99
NIFTY SER. SEC.. 10400.50 0.77
NIFTY MEDIA 2562.35 -0.25
NIFTY REALTY 163.45 4.50
COMMODITY AND CURRENCY WEEKLY
INDICES CLOSE CHANGE (%)
GOLD COMEX 1183 -2.06
GOLD INDIAN 28613 -1.11
SILVER COMEX 16.517 5.84
SILVER INDIAN 40550 0.40
WTI CRUDE NY. 45.99 0.87
CRUDE INDIAN 3196 1.71
USD-INR 68.43 0.38
EUR-INR 72.53 0.14
GBP-INR 85.24 0.61
JPY-INR 60.68 -1.81
NIFTY WEEKLY OUTLOOK
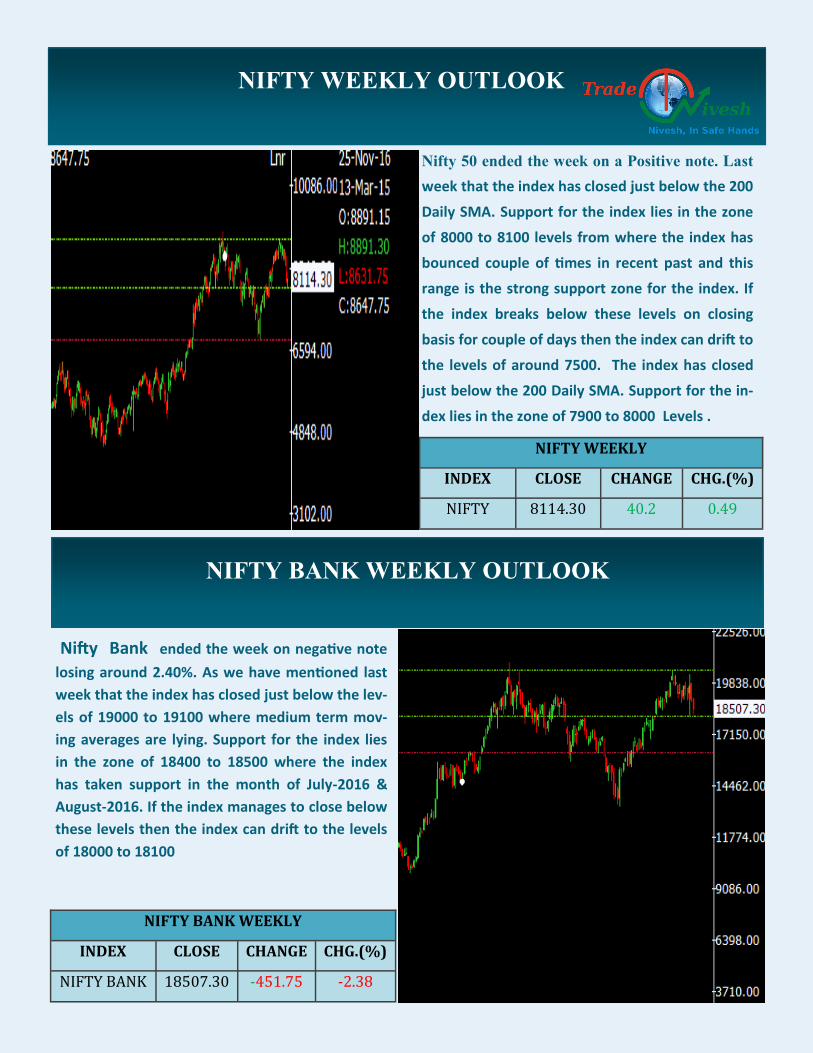
Nifty 50 ended the week on a Positive note. Last
week that the index has closed just below the 200
Daily SMA. Support for the index lies in the zone
of 8000 to 8100 levels from where the index has
bounced couple of times in recent past and this
range is the strong support zone for the index. If
the index breaks below these levels on closing
basis for couple of days then the index can drift to
the levels of around 7500. The index has closed
just below the 200 Daily SMA. Support for the in-
dex lies in the zone of 7900 to 8000 Levels .
NIFTY WEEKLY
INDEX CLOSE CHANGE CHG.(%)
NIFTY 8114.30 40.2 0.49
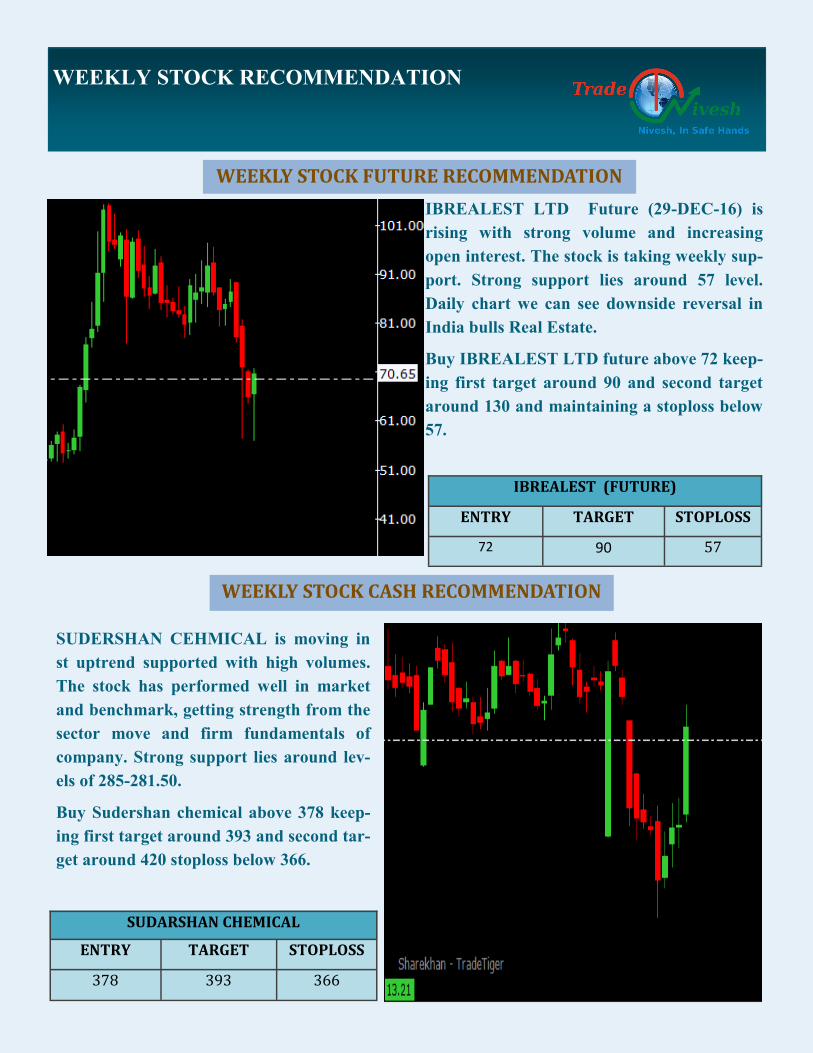
Nifty Bank ended the week on negative note
losing around 2.40%. As we have mentioned last
week that the index has closed just below the lev-
els of 19000 to 19100 where medium term mov-
ing averages are lying. Support for the index lies
in the zone of 18400 to 18500 where the index
has taken support in the month of July-2016 &
August-2016. If the index manages to close below
these levels then the index can drift to the levels
of 18000 to 18100
NIFTY BANK WEEKLY
INDEX CLOSE CHANGE CHG.(%)
NIFTY BANK 18507.30 -451.75 -2.38
NIFTY BANK WEEKLY OUTLOOK
WEEKLY STOCK CASH RECOMMENDATION
WEEKLY STOCK RECOMMENDATION
WEEKLY STOCK FUTURE RECOMMENDATION
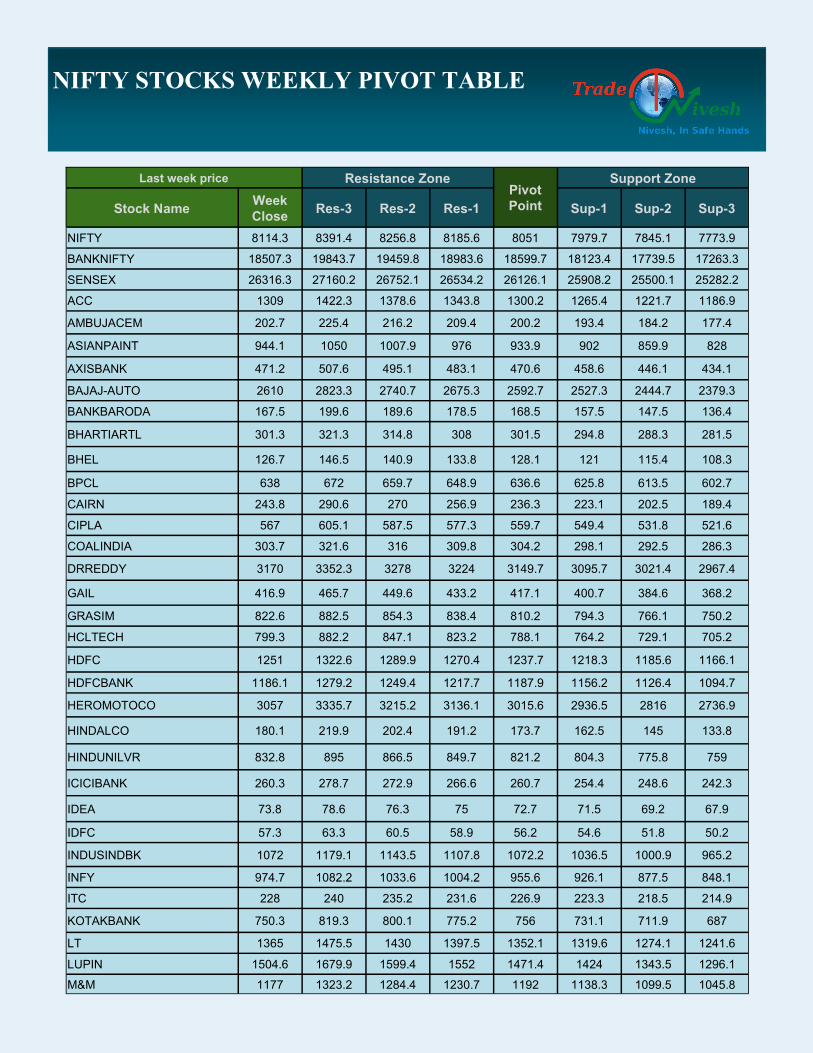
SUDERSHAN CEHMICAL is moving in
st uptrend supported with high volumes.
The stock has performed well in market
and benchmark, getting strength from the
sector move and firm fundamentals of
company. Strong support lies around lev-
els of 285-281.50.
Buy Sudershan chemical above 378 keep-
ing first target around 393 and second tar-
get around 420 stoploss below 366.
SUDARSHAN CHEMICAL
ENTRY TARGET STOPLOSS
378 393 366
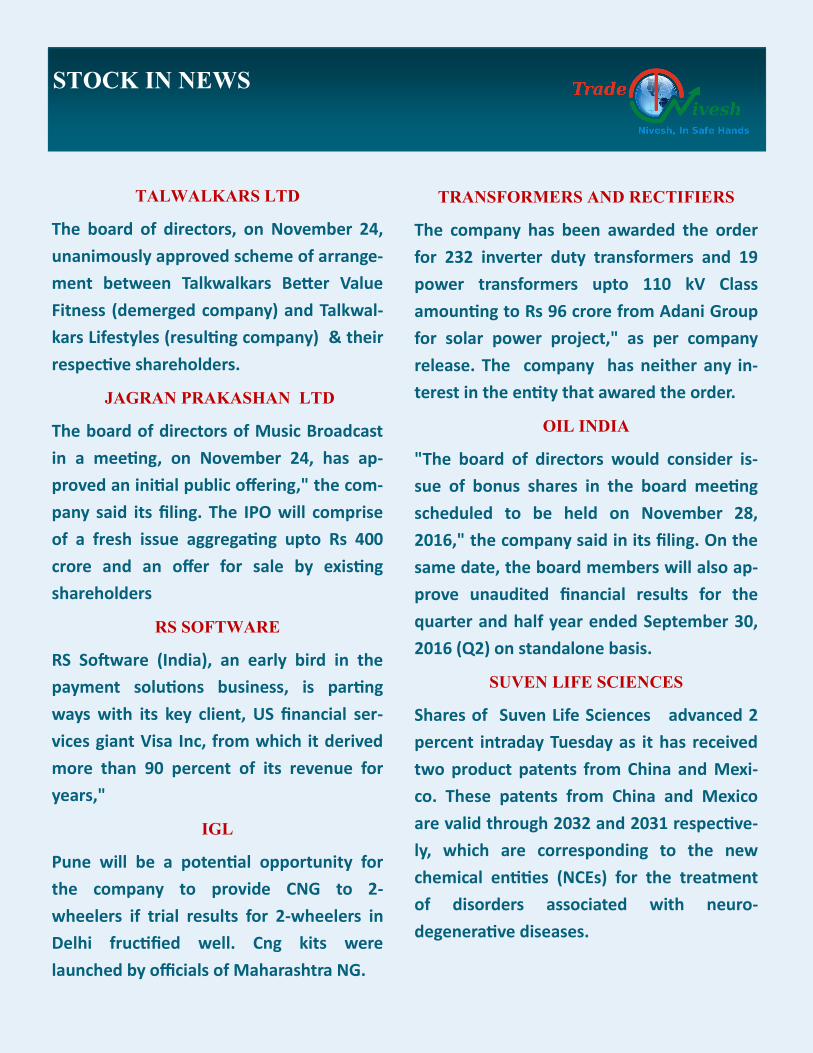
IBREALEST LTD Future (29-DEC-16) is
rising with strong volume and increasing
open interest. The stock is taking weekly sup-
port. Strong support lies around 57 level.
Daily chart we can see downside reversal in
India bulls Real Estate.
Buy IBREALEST LTD future above 72 keep-
ing first target around 90 and second target
around 130 and maintaining a stoploss below
57.
IBREALEST (FUTURE)
ENTRY TARGET STOPLOSS
72 90 57
STOCK IN NEWS
TALWALKARS LTD
The board of directors, on November 24,
unanimously approved scheme of arrange-
ment between Talkwalkars Better Value
Fitness (demerged company) and Talkwal-
kars Lifestyles (resulting company) & their
respective shareholders.
JAGRAN PRAKASHAN LTD
The board of directors of Music Broadcast
in a meeting, on November 24, has ap-
proved an initial public offering," the com-
pany said its filing. The IPO will comprise
of a fresh issue aggregating upto Rs 400
crore and an offer for sale by existing
shareholders
RS SOFTWARE
RS Software (India), an early bird in the
payment solutions business, is parting
ways with its key client, US financial ser-
vices giant Visa Inc, from which it derived
more than 90 percent of its revenue for
years,"
IGL
Pune will be a potential opportunity for
the company to provide CNG to 2-
wheelers if trial results for 2-wheelers in
Delhi fructified well. Cng kits were
launched by officials of Maharashtra NG.
TRANSFORMERS AND RECTIFIERS
The company has been awarded the order
for 232 inverter duty transformers and 19
power transformers upto 110 kV Class
amounting to Rs 96 crore from Adani Group
for solar power project," as per company
release. The company has neither any in-
terest in the entity that awared the order.
OIL INDIA
"The board of directors would consider is-
sue of bonus shares in the board meeting
scheduled to be held on November 28,
2016," the company said in its filing. On the
same date, the board members will also ap-
prove unaudited financial results for the
quarter and half year ended September 30,
2016 (Q2) on standalone basis.
SUVEN LIFE SCIENCES
Shares of Suven Life Sciences advanced 2
percent intraday Tuesday as it has received
two product patents from China and Mexi-
co. These patents from China and Mexico
are valid through 2032 and 2031 respective-
ly, which are corresponding to the new
chemical entities (NCEs) for the treatment
of disorders associated with neuro-
degenerative diseases.
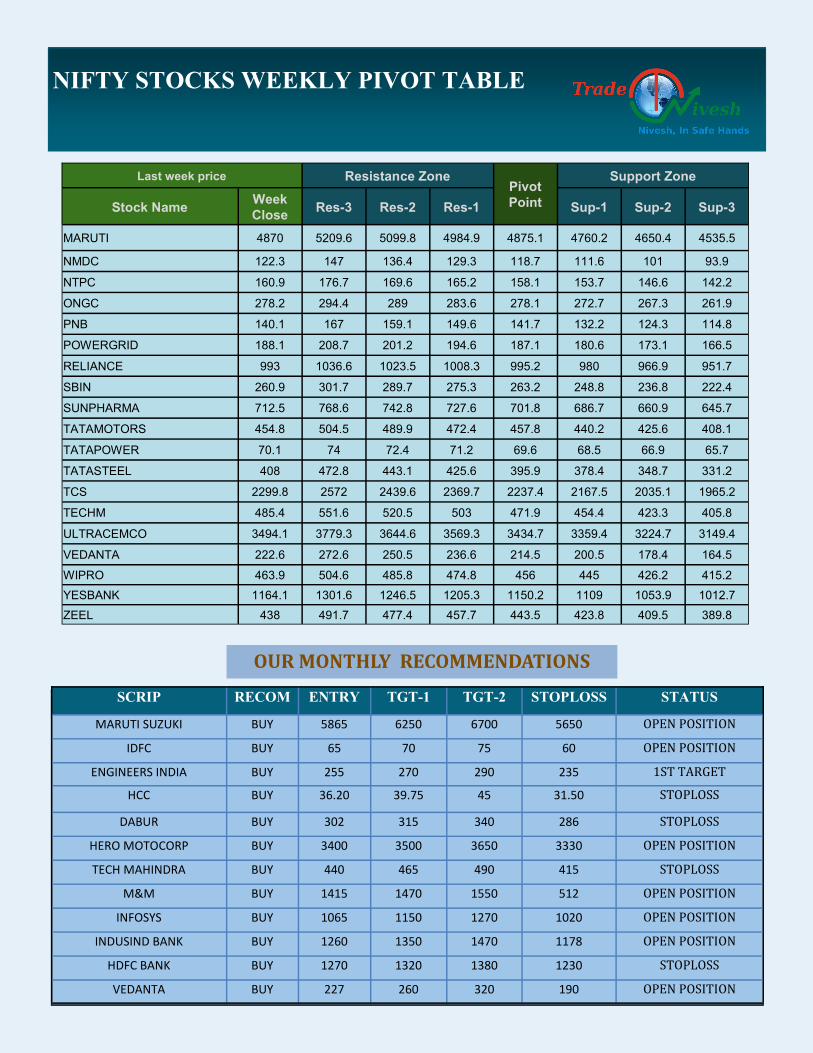
NIFTY STOCKS WEEKLY PIVOT TABLE
Last week price Resistance Zone Pivot
Point
Support Zone
Stock Name Week
Close Res-3 Res-2 Res-1 Sup-1 Sup-2 Sup-3
NIFTY 8114.3 8391.4 8256.8 8185.6 8051 7979.7 7845.1 7773.9
BANKNIFTY 18507.3 19843.7 19459.8 18983.6 18599.7 18123.4 17739.5 17263.3
SENSEX 26316.3 27160.2 26752.1 26534.2 26126.1 25908.2 25500.1 25282.2
ACC 1309 1422.3 1378.6 1343.8 1300.2 1265.4 1221.7 1186.9
AMBUJACEM 202.7 225.4 216.2 209.4 200.2 193.4 184.2 177.4
ASIANPAINT 944.1 1050 1007.9 976 933.9 902 859.9 828
AXISBANK 471.2 507.6 495.1 483.1 470.6 458.6 446.1 434.1
BAJAJ-AUTO 2610 2823.3 2740.7 2675.3 2592.7 2527.3 2444.7 2379.3
BANKBARODA 167.5 199.6 189.6 178.5 168.5 157.5 147.5 136.4
BHARTIARTL 301.3 321.3 314.8 308 301.5 294.8 288.3 281.5
BHEL 126.7 146.5 140.9 133.8 128.1 121 115.4 108.3
BPCL 638 672 659.7 648.9 636.6 625.8 613.5 602.7
CAIRN 243.8 290.6 270 256.9 236.3 223.1 202.5 189.4
CIPLA 567 605.1 587.5 577.3 559.7 549.4 531.8 521.6
COALINDIA 303.7 321.6 316 309.8 304.2 298.1 292.5 286.3
DRREDDY 3170 3352.3 3278 3224 3149.7 3095.7 3021.4 2967.4
GAIL 416.9 465.7 449.6 433.2 417.1 400.7 384.6 368.2
GRASIM 822.6 882.5 854.3 838.4 810.2 794.3 766.1 750.2
HCLTECH 799.3 882.2 847.1 823.2 788.1 764.2 729.1 705.2
HDFC 1251 1322.6 1289.9 1270.4 1237.7 1218.3 1185.6 1166.1
HDFCBANK 1186.1 1279.2 1249.4 1217.7 1187.9 1156.2 1126.4 1094.7
HEROMOTOCO 3057 3335.7 3215.2 3136.1 3015.6 2936.5 2816 2736.9
HINDALCO 180.1 219.9 202.4 191.2 173.7 162.5 145 133.8
HINDUNILVR 832.8 895 866.5 849.7 821.2 804.3 775.8 759
ICICIBANK 260.3 278.7 272.9 266.6 260.7 254.4 248.6 242.3
IDEA 73.8 78.6 76.3 75 72.7 71.5 69.2 67.9
IDFC 57.3 63.3 60.5 58.9 56.2 54.6 51.8 50.2
INDUSINDBK 1072 1179.1 1143.5 1107.8 1072.2 1036.5 1000.9 965.2
INFY 974.7 1082.2 1033.6 1004.2 955.6 926.1 877.5 848.1
ITC 228 240 235.2 231.6 226.9 223.3 218.5 214.9
KOTAKBANK 750.3 819.3 800.1 775.2 756 731.1 711.9 687
LT 1365 1475.5 1430 1397.5 1352.1 1319.6 1274.1 1241.6
LUPIN 1504.6 1679.9 1599.4 1552 1471.4 1424 1343.5 1296.1
M&M 1177 1323.2 1284.4 1230.7 1192 1138.3 1099.5 1045.8
NIFTY STOCKS WEEKLY PIVOT TABLE
SCRIP RECOM ENTRY TGT-1 TGT-2 STOPLOSS STATUS
MARUTI SUZUKI BUY 5510 5800 6300 5150 OPEN POSITION
MBL INFRA BUY 102.50 120 140 87 OPEN POSITION
BHEL BUY 136 145 157 124 OPEN POSITION
HCC BUY 34.60 39.60 45 31.50 OPEN POSITION
TATA ELXSI BUY 1450 1550 1650 1360 OPEN POSITION
SBIN BUY 252.50 270 292 235 OPEN POSITION
TATASTEEL BUY 380 407 440 357.50 OPEN POSITION
AXIS BANK BUY 541 580 620 512 OPEN POSITION
RANE MADRAS BUY 490 530 570 450 OPEN POSITION
EXIDE IND BUY 185 197 210 177 OPEN POSITION
UNION BANK BUY 137.70 146 160 129 OPEN POSITION
RELIANCE COMMUNICATION BUY 47.80 51 55 45.20 OPEN POSITION
OUR MONTHLY RECOMMENDATIONS
Last week price Resistance Zone Pivot
Point
Support Zone
Stock Name Week
Close Res-3 Res-2 Res-1 Sup-1 Sup-2 Sup-3
MARUTI 4870 5209.6 5099.8 4984.9 4875.1 4760.2 4650.4 4535.5
NMDC 122.3 147 136.4 129.3 118.7 111.6 101 93.9
NTPC 160.9 176.7 169.6 165.2 158.1 153.7 146.6 142.2
ONGC 278.2 294.4 289 283.6 278.1 272.7 267.3 261.9
PNB 140.1 167 159.1 149.6 141.7 132.2 124.3 114.8
POWERGRID 188.1 208.7 201.2 194.6 187.1 180.6 173.1 166.5
RELIANCE 993 1036.6 1023.5 1008.3 995.2 980 966.9 951.7
SBIN 260.9 301.7 289.7 275.3 263.2 248.8 236.8 222.4
SUNPHARMA 712.5 768.6 742.8 727.6 701.8 686.7 660.9 645.7
TATAMOTORS 454.8 504.5 489.9 472.4 457.8 440.2 425.6 408.1
TATAPOWER 70.1 74 72.4 71.2 69.6 68.5 66.9 65.7
TATASTEEL 408 472.8 443.1 425.6 395.9 378.4 348.7 331.2
TCS 2299.8 2572 2439.6 2369.7 2237.4 2167.5 2035.1 1965.2
TECHM 485.4 551.6 520.5 503 471.9 454.4 423.3 405.8
ULTRACEMCO 3494.1 3779.3 3644.6 3569.3 3434.7 3359.4 3224.7 3149.4
VEDANTA 222.6 272.6 250.5 236.6 214.5 200.5 178.4 164.5
WIPRO 463.9 504.6 485.8 474.8 456 445 426.2 415.2
YESBANK 1164.1 1301.6 1246.5 1205.3 1150.2 1109 1053.9 1012.7
ZEEL 438 491.7 477.4 457.7 443.5 423.8 409.5 389.8
SCRIP RECOM ENTRY TGT-1 TGT-2 STOPLOSS STATUS
MARUTI SUZUKI BUY 5865 6250 6700 5650 OPEN POSITION
IDFC BUY 65 70 75 60 OPEN POSITION
ENGINEERS INDIA BUY 255 270 290 235 1ST TARGET
HCC BUY 36.20 39.75 45 31.50 STOPLOSS
DABUR BUY 302 315 340 286 STOPLOSS
HERO MOTOCORP BUY 3400 3500 3650 3330 OPEN POSITION
TECH MAHINDRA BUY 440 465 490 415 STOPLOSS
M&M BUY 1415 1470 1550 512 OPEN POSITION
INFOSYS BUY 1065 1150 1270 1020 OPEN POSITION
INDUSIND BANK BUY 1260 1350 1470 1178 OPEN POSITION
HDFC BANK BUY 1270 1320 1380 1230 STOPLOSS
VEDANTA BUY 227 260 320 190 OPEN POSITION
This document is solely for the personal information of the recipient, and must not be singular-
ly used as the basis of any investment decision. Nothing in this document should be construed
as investment or financial advice. Each recipient of this document should make such investiga-
tions as they deem necessary to arrive at an independent evaluation of an investment in the se-
curities of the companies referred to in this document including the merits and risks involved,
and should consult their own advisors to determine the merits and risks of such an investment.
Reports based on technical and derivative analysis center on studying charts of a stock's price
movement, outstanding positions and trading volume. The information in this document has
been printed on the basis of publicly available information, internal data and other reliable
sources believed to be true, but we do not represent that it is accurate or complete and it should
not be relied on as such, as this document is for general guidance only. Trade Nivesh shall not
be in any way responsible for any loss or damage that may arise to any person from any inad-
vertent error in the information contained in this report. Trade Nivesh has not independently
verified all the information contained within this document. Accordingly, we cannot testify, nor
make any representation or warranty, express or implied, to the accuracy, contents or data con-
tained within this document. While Trade Nivesh endeavors to update on a reasonable basis the
information discussed in this material, there may be regulatory, compliance, or other reasons
that prevent us from doing so.
Investment in equity & Commodity market has its own risks. We Trade Nivesh shall not be lia-
ble or responsible for any loss or damage that may arise from the use of this information.
DISCLAIMER