Embed Size (px)
Citation preview
1601201008060504030
2015
Percentsharestraded
1208040
Target Price Range2018 2019 2020
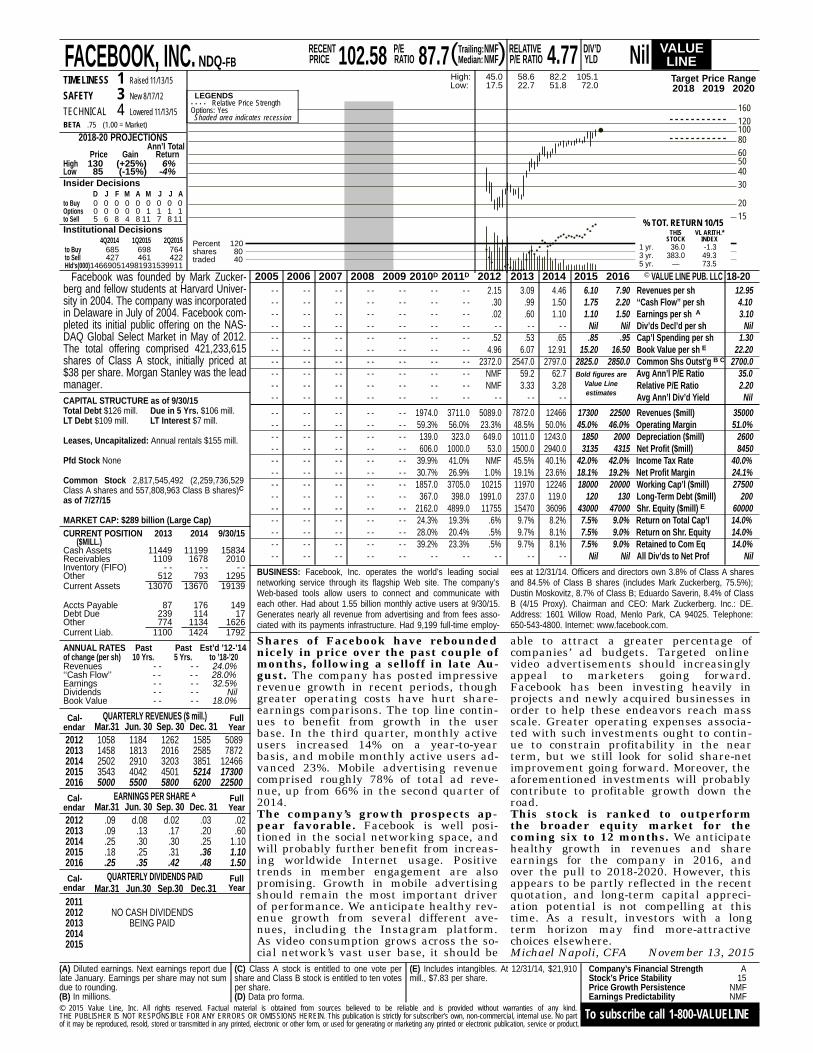
FACEBOOK, INC. NDQ-FB 102.58 87.7 NMFNMF 4.77 Nil
TIMELINESS 1 Raised 11/13/15
SAFETY 3 New 8/17/12
TECHNICAL 4 Lowered 11/13/15BETA .75 (1.00 = Market)
2018-20 PROJECTIONSAnn’l Total
Price Gain ReturnHigh 130 (+25%) 6%Low 85 (-15%) -4%Insider Decisions
D J F M A M J J Ato Buy 0 0 0 0 0 0 0 0 0Options 0 0 0 0 0 1 1 1 1to Sell 5 6 8 4 8 11 7 8 11Institutional Decisions
4Q2014 1Q2015 2Q2015to Buy 685 698 764to Sell 427 461 422Hld’s(000)146690514981931539911
High: 45.0 58.6 82.2 105.1Low: 17.5 22.7 51.8 72.0
% TOT. RETURN 10/15THIS VL ARITH.*
STOCK INDEX1 yr. 36.0 -1.33 yr. 383.0 49.35 yr. — 73.5
Facebook was founded by Mark Zucker-berg and fellow students at Harvard Univer-sity in 2004. The company was incorporatedin Delaware in July of 2004. Facebook com-pleted its initial public offering on the NAS-DAQ Global Select Market in May of 2012.The total offering comprised 421,233,615shares of Class A stock, initially priced at$38 per share. Morgan Stanley was the leadmanager.CAPITAL STRUCTURE as of 9/30/15Total Debt $126 mill. Due in 5 Yrs. $106 mill.LT Debt $109 mill. LT Interest $7 mill.
Leases, Uncapitalized: Annual rentals $155 mill.
Pfd Stock None
Common Stock 2,817,545,492 (2,259,736,529Class A shares and 557,808,963 Class B shares)Cas of 7/27/15
MARKET CAP: $289 billion (Large Cap)CURRENT POSITION 2013 2014 9/30/15
($MILL.)Cash Assets 11449 11199 15834Receivables 1109 1678 2010Inventory (FIFO) - - - - - -Other 512 793 1295Current Assets 13070 13670 19139
Accts Payable 87 176 149Debt Due 239 114 17Other 774 1134 1626Current Liab. 1100 1424 1792
ANNUAL RATES Past Past Est’d ’12-’14of change (per sh) 10 Yrs. 5 Yrs. to ’18-’20Revenues - - - - 24.0%‘‘Cash Flow’’ - - - - 28.0%Earnings - - - - 32.5%Dividends - - - - NilBook Value - - - - 18.0%
Cal- Fullendar Year
QUARTERLY REVENUES ($ mill.)Mar.31 Jun. 30 Sep. 30 Dec. 31
2012 1058 1184 1262 1585 50892013 1458 1813 2016 2585 78722014 2502 2910 3203 3851 124662015 3543 4042 4501 5214 173002016 5000 5500 5800 6200 22500Cal- Full
endar YearEARNINGS PER SHARE A
Mar.31 Jun. 30 Sep. 30 Dec. 312012 .09 d.08 d.02 .03 .022013 .09 .13 .17 .20 .602014 .25 .30 .30 .25 1.102015 .18 .25 .31 .36 1.102016 .25 .35 .42 .48 1.50Cal- Full
endar YearQUARTERLY DIVIDENDS PAID
Mar.31 Jun.30 Sep.30 Dec.3120112012 NO CASH DIVIDENDS2013 BEING PAID20142015
2005 2006 2007 2008 2009 2010D 2011D 2012- - - - - - - - - - - - - - 2.15- - - - - - - - - - - - - - .30- - - - - - - - - - - - - - .02- - - - - - - - - - - - - - - -- - - - - - - - - - - - - - .52- - - - - - - - - - - - - - 4.96- - - - - - - - - - - - - - 2372.0- - - - - - - - - - - - - - NMF- - - - - - - - - - - - - - NMF- - - - - - - - - - - - - - - -
- - - - - - - - - - 1974.0 3711.0 5089.0- - - - - - - - - - 59.3% 56.0% 23.3%- - - - - - - - - - 139.0 323.0 649.0- - - - - - - - - - 606.0 1000.0 53.0- - - - - - - - - - 39.9% 41.0% NMF- - - - - - - - - - 30.7% 26.9% 1.0%- - - - - - - - - - 1857.0 3705.0 10215- - - - - - - - - - 367.0 398.0 1991.0- - - - - - - - - - 2162.0 4899.0 11755- - - - - - - - - - 24.3% 19.3% .6%- - - - - - - - - - 28.0% 20.4% .5%- - - - - - - - - - 39.2% 23.3% .5%- - - - - - - - - - - - - - - -
2013 2014 2015 2016 © VALUE LINE PUB. LLC 18-203.09 4.46 6.10 7.90 Revenues per sh 12.95.99 1.50 1.75 2.20 ‘‘Cash Flow’’ per sh 4.10.60 1.10 1.10 1.50 Earnings per sh A 3.10- - - - Nil Nil Div’ds Decl’d per sh Nil
.53 .65 .85 .95 Cap’l Spending per sh 1.306.07 12.91 15.20 16.50 Book Value per sh E 22.20
2547.0 2797.0 2825.0 2850.0 Common Shs Outst’g B C 2700.059.2 62.7 Bold figures are
Value Lineestimates
Avg Ann’l P/E Ratio 35.03.33 3.28 Relative P/E Ratio 2.20
- - - - Avg Ann’l Div’d Yield Nil
7872.0 12466 17300 22500 Revenues ($mill) 3500048.5% 50.0% 45.0% 46.0% Operating Margin 51.0%1011.0 1243.0 1850 2000 Depreciation ($mill) 26001500.0 2940.0 3135 4315 Net Profit ($mill) 845045.5% 40.1% 42.0% 42.0% Income Tax Rate 40.0%19.1% 23.6% 18.1% 19.2% Net Profit Margin 24.1%11970 12246 18000 20000 Working Cap’l ($mill) 27500237.0 119.0 120 130 Long-Term Debt ($mill) 20015470 36096 43000 47000 Shr. Equity ($mill) E 600009.7% 8.2% 7.5% 9.0% Return on Total Cap’l 14.0%9.7% 8.1% 7.5% 9.0% Return on Shr. Equity 14.0%9.7% 8.1% 7.5% 9.0% Retained to Com Eq 14.0%
- - - - Nil Nil All Div’ds to Net Prof Nil
Company’s Financial Strength AStock’s Price Stability 15Price Growth Persistence NMFEarnings Predictability NMF
(A) Diluted earnings. Next earnings report duelate January. Earnings per share may not sumdue to rounding.(B) In millions.
(C) Class A stock is entitled to one vote pershare and Class B stock is entitled to ten votesper share.(D) Data pro forma.
(E) Includes intangibles. At 12/31/14, $21,910mill., $7.83 per share.
BUSINESS: Facebook, Inc. operates the world’s leading socialnetworking service through its flagship Web site. The company’sWeb-based tools allow users to connect and communicate witheach other. Had about 1.55 billion monthly active users at 9/30/15.Generates nearly all revenue from advertising and from fees asso-ciated with its payments infrastructure. Had 9,199 full-time employ-
ees at 12/31/14. Officers and directors own 3.8% of Class A sharesand 84.5% of Class B shares (includes Mark Zuckerberg, 75.5%);Dustin Moskovitz, 8.7% of Class B; Eduardo Saverin, 8.4% of ClassB (4/15 Proxy). Chairman and CEO: Mark Zuckerberg. Inc.: DE.Address: 1601 Willow Road, Menlo Park, CA 94025. Telephone:650-543-4800. Internet: www.facebook.com.
Shares of Facebook have reboundednicely in price over the past couple ofmonths, following a selloff in late Au-gust. The company has posted impressiverevenue growth in recent periods, thoughgreater operating costs have hurt share-earnings comparisons. The top line contin-ues to benefit from growth in the userbase. In the third quarter, monthly activeusers increased 14% on a year-to-yearbasis, and mobile monthly active users ad-vanced 23%. Mobile advertising revenuecomprised roughly 78% of total ad reve-nue, up from 66% in the second quarter of2014.The company’s growth prospects ap-pear favorable. Facebook is well posi-tioned in the social networking space, andwill probably further benefit from increas-ing worldwide Internet usage. Positivetrends in member engagement are alsopromising. Growth in mobile advertisingshould remain the most important driverof performance. We anticipate healthy rev-enue growth from several different ave-nues, including the Instagram platform.As video consumption grows across the so-cial network’s vast user base, it should be
able to attract a greater percentage ofcompanies’ ad budgets. Targeted onlinevideo advertisements should increasinglyappeal to marketers going forward.Facebook has been investing heavily inprojects and newly acquired businesses inorder to help these endeavors reach massscale. Greater operating expenses associa-ted with such investments ought to contin-ue to constrain profitability in the nearterm, but we still look for solid share-netimprovement going forward. Moreover, theaforementioned investments will probablycontribute to profitable growth down theroad.This stock is ranked to outperformthe broader equity market for thecoming six to 12 months. We anticipatehealthy growth in revenues and shareearnings for the company in 2016, andover the pull to 2018-2020. However, thisappears to be partly reflected in the recentquotation, and long-term capital appreci-ation potential is not compelling at thistime. As a result, investors with a longterm horizon may find more-attractivechoices elsewhere.Michael Napoli, CFA November 13, 2015
LEGENDS. . . . Relative Price StrengthOptions: YesShaded area indicates recession
© 2015 Value Line, Inc. All rights reserved. Factual material is obtained from sources believed to be reliable and is provided without warranties of any kind.THE PUBLISHER IS NOT RESPONSIBLE FOR ANY ERRORS OR OMISSIONS HEREIN. This publication is strictly for subscriber’s own, non-commercial, internal use. No partof it may be reproduced, resold, stored or transmitted in any printed, electronic or other form, or used for generating or marketing any printed or electronic publication, service or product.
To subscribe call 1-800-VALUELINE
RECENTPRICE
P/ERATIO
RELATIVEP/E RATIO
DIV’DYLD( )Trailing:
Median:VALUELINE


![Value Line Investment Survey VU Homepage [] Libraries –Bartley Virtual Library –Finance –Databases A-Z – V - Value Line](https://img.pdfslide.net/doc/110x75/56649e455503460f94b39262/value-line-investment-survey-vu-homepage-wwwvillanovaeduwwwvillanovaedu.jpg)