Embed Size (px)
Citation preview
Interim Report January–March 2015 January–March 2015
• Net sales of SEK 45,377 million (45,912)
• Underlying operating profit1 of SEK 7,736 million (9,075)
• Operating profit of SEK 8,386 million (11,832)
• Profit for the period of SEK 4,987 million (8,205)
• Electricity generation of 46.4 TWh (50.1)
1) Underlying operating profit is defined as operating profit excluding items affecting comparability. For a specification of items affecting comparability, see page 6.
Vattenfall discloses the information provided in this interim report pursuant to the Swedish Securities Market Act.
Rounding differences may occur in this document.
Vattenfall Interim Report January-March 2015 2
CEO’s comments “Demand for electricity remained weak during the first quarter of the year, and electricity prices have continued to fall. The protection we have in the form of forward contracts entered into at higher price levels is gradually decreasing, entailing that the current low wholesale prices are having a gradually bigger impact on Vattenfall’s earnings. All in all, Vattenfall reports an underlying operating profit of SEK 7.7 billion for the first quarter of 2015, which is SEK 1.3 billion lower than the corresponding quarter in 2014. Operating cash flow decreased by SEK 0.5 billion, to SEK 7 billion.
During the quarter we successfully issued SEK 15 billion in new hybrid bonds. The issue, which was in both euros and Swedish kronor, was met with great interest by investors. It was the first time ever that a company issued hybrid bonds in Swedish kronor. The issue led to a positive development of adjusted net debt, which decreased by SEK 7.4 billion during the quarter to SEK 150.9 billion.
During the quarter Vattenfall was awarded the concession to build and operate the Horns Rev 3 offshore wind farm in Denmark, which will have a capacity of 400 MW. This is a prime example of the major investments we are making in wind power, which totalled SEK 2 billion during the quarter and thereby accounted for Vattenfall’s single largest investment. The process of divesting our lignite operations in Germany continues.
In March the Swedish government presented the composition of the new parliamentary energy commission. Its purpose is to, within two years, draw up a foundation for a broad political accord on Sweden’s long-term energy policy. We have a positive view of the energy commission’s directive and look forward to the opportunity to contribute to the coming process.
On 1 April we began working according to our new organisational structure. The two former regions, Nordic and Continental/UK, have been replaced by six cross-border Business Areas: Heat, Wind, Customers & Solutions, Generation, Markets, and Distribution. The aim of the new organisation is to enhance Vattenfall’s business and earnings focus, and to take advantage of cross-border synergies. At the same time, we need to continue lowering our costs and will reduce the number of employees corresponding to approximately 1,000 full-time equivalents, of whom about half will be in staff functions. The new organisation creates conditions for a strong northern European company under Swedish ownership.”
Magnus Hall
President and CEO
Vattenfall Interim Report January-March 2015 3
Key data Full year
Last
Amounts in SEK million unless indicated otherwise Q1 2015 Q1 2014 2014 12 months Net sales 45 377 45 912 165 945 165 410
Operating profit before depreciation, amortisation and impairment losses (EBITDA) 13 518 16 588 41 038 37 968
Operating profit (EBIT) 8 386 11 832 -2 195 -5 641
Underlying operating profit 7 736 9 075 24 133 22 794
Profit for the period 4 987 8 205 -8 284 -11 502
Funds from operations (FFO) 9 795 10 792
32 131
31 134
Net debt 78 825 85 694
79 473
Adjusted net debt 150 737 147 296 158 291
Return on capital employed, % - 1.9 1 - 1.7 1 - 0.7
Net debt/equity, % 58.5 58.8
61.9
FFO/adjusted net debt, % 20.7 1 20.4 1 20.3
Adjusted net debt/EBITDA, times 4.0 1 3.3 1 3.9
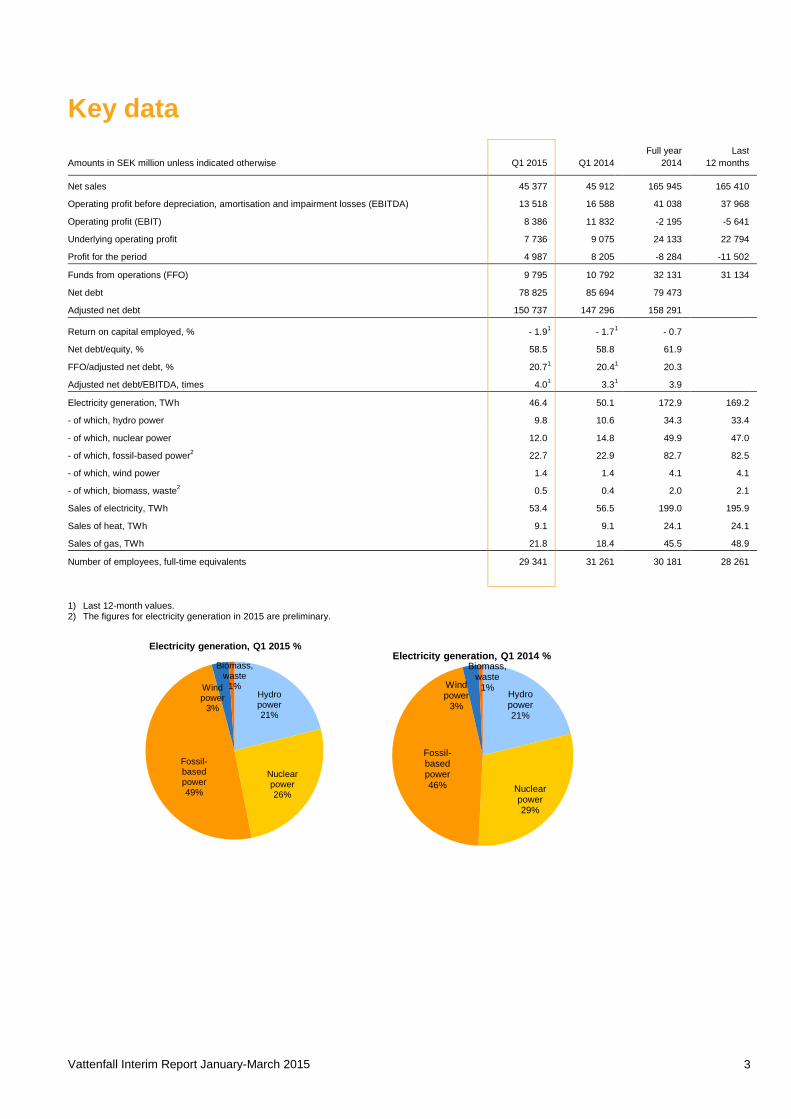
Electricity generation, TWh 46.4 50.1 172.9 169.2
- of which, hydro power 9.8 10.6 34.3 33.4
- of which, nuclear power 12.0 14.8 49.9 47.0
- of which, fossil-based power2 22.7 22.9 82.7 82.5
- of which, wind power 1.4 1.4 4.1 4.1
- of which, biomass, waste2 0.5 0.4 2.0 2.1
Sales of electricity, TWh 53.4 56.5 199.0 195.9
Sales of heat, TWh 9.1 9.1 24.1 24.1
Sales of gas, TWh 21.8 18.4 45.5 48.9
Number of employees, full-time equivalents 29 341 31 261 30 181 28 261
1) Last 12-month values. 2) The figures for electricity generation in 2015 are preliminary.
Hydro power21%
Nuclear power26%
Fossil-based power49%
Wind power
3%
Biomass,waste
1%
Electricity generation, Q1 2015 %
Hydro power21%
Nuclear power29%
Fossil-based power46%
Wind power
3%
Biomass,waste
1%
Electricity generation, Q1 2014 %
Vattenfall Interim Report January-March 2015 4
Important events Q1 2015 Vattenfall wins concession for the Horns Rev 3 wind farm In February Vattenfall won the concession to build and operate the Horns Rev 3 offshore wind farm off the Danish west coast. The wind farm will have a total capacity of 400 MW, corresponding to the electricity needs of some 450,000 households, and will be commissioned in 2017. Since previously Vattenfall owns 60% of the Horns Rev 1 offshore wind farm, with 80 wind turbines and a capacity of 160 MW.
Moorburg in commercial operation In February the first unit at the Moorburg coal-fired plant in Hamburg became operational. The power plant has two units, where unit B has now been commissioned, with a capacity of 827 MW and the ability to generate approximately 5.5 TWh of electricity per year. The plant’s unit A (827 MW) is planned to be in commercial operation in mid-2015.
New electricity contract with Boliden In March Vattenfall and the mining and metals company Boliden reached an agreement for expanded electricity supply to approximately 5.5 TWh over a five-year period. Vattenfall will also be responsible for Boliden’s power balance in Sweden from 2016, i.e., for its daily power procurement. Vattenfall has had a contract with Boliden since 2007 to supply electricity to the company’s Aitik copper mine in Gällivare and to its smelting works in Finland. The new agreement entails an extension of Vattenfall’s involvement to an additional six plants in Sweden starting in 2016.
Issue of hybrid bonds In March Vattenfall launched hybrid bonds of SEK 6 billion and EUR 1 billion (approximately SEK 15 billion combined) in order to refinance an existing hybrid bond of EUR 1 billion, issued in 2005. The excess amount will be used for general corporate purposes. The issue of corporate hybrid bonds in Swedish kronor is the first ever by a company. Like Vattenfall’s existing hybrid bond, the new bonds will be accounted for as interest-bearing debt and will be subordinate to Vattenfall’s other debt instruments. The credit rating agencies Moody’s and Standard & Poor’s classify 50% of Vattenfall’s hybrid bonds as equity in their credit analyses. In connection with the issue, Vattenfall offered to redeem its existing hybrid bond. The offer was accepted to 49.6% (EUR 496 million).
Continued investment in sustainable transports and infrastructure Vattenfall is continuing its work on developing a charging infrastructure to enable faster growth of electric vehicles. In March a demonstration project was started with plug-in hybrid buses in regular bus traffic in Stockholm. Vattenfall is responsible for the fast-charge stations and supply of wind-based electricity for the project, in which Stockholm’s mass transit company SL and Volvo Buses are the other two main partners. The plug-in hybrid buses operate entirely from stored electric power on most of their route, resulting in quieter operation, 75% lower fuel consumption and 90% lower CO2 emissions than conventional diesel buses. In January Vattenfall and Swedavia began cooperation on fast-charge stations for taxis run on electricity. Fast-charge stations for electric cars will be established at Swedavia’s airports. The first fast-charge station is now in operation at Stockholm’s Arlanda Airport.
Outsourcing of IT operations In March Vattenfall signed a five-year contract outsourcing IT network services and workplace management to Computer Sciences Corporation (CSC). The agreement took effect on 1 April 2015 and is aimed at improving operational efficiency and facilitating IT services development for nearly 30,000 Vattenfall employees in seven countries. As part of the agreement, 122 Vattenfall employees in Germany, Sweden and the Netherlands will be transferred to CSC and its partner, AT&T.
Vattenfall Interim Report January-March 2015 5
Sales, profit and cash flow Net sales Full year Last
Amounts in SEK million Q1 2015 Q1 2014 2014 12 months Net sales 45 377 45 912 165 945 165 410
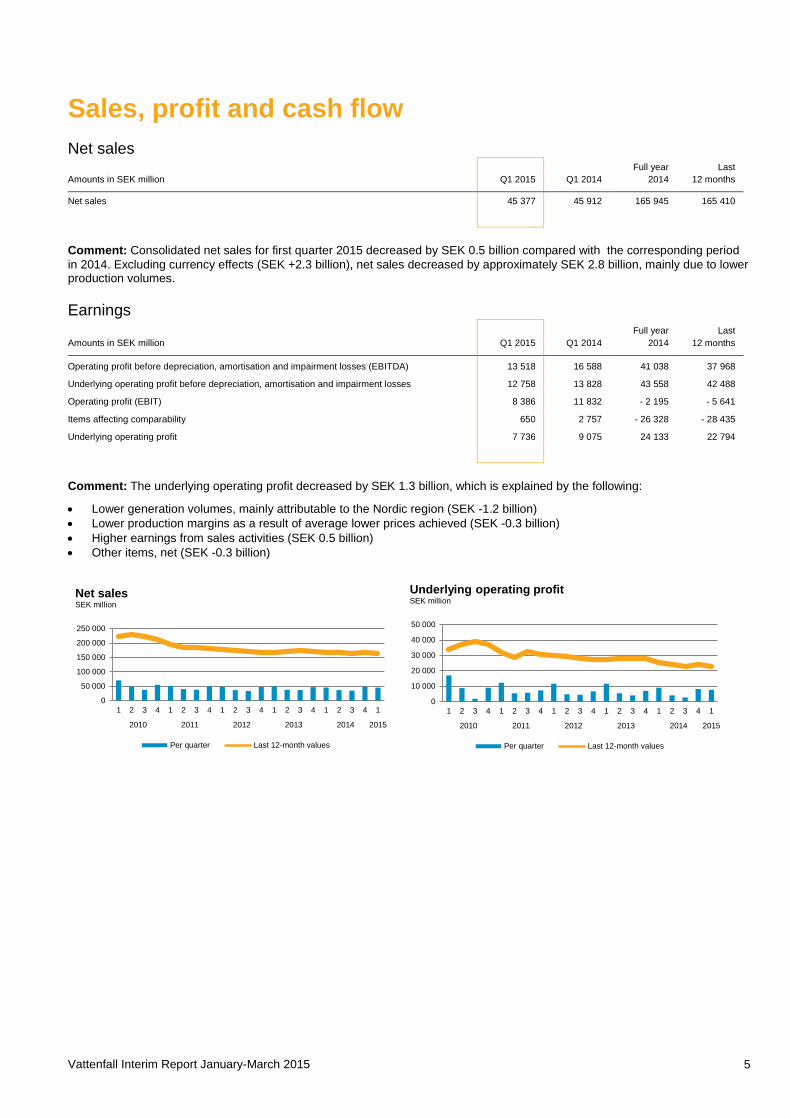
Comment: Consolidated net sales for first quarter 2015 decreased by SEK 0.5 billion compared with the corresponding period in 2014. Excluding currency effects (SEK +2.3 billion), net sales decreased by approximately SEK 2.8 billion, mainly due to lower production volumes.
Earnings Full year Last
Amounts in SEK million Q1 2015 Q1 2014 2014 12 months Operating profit before depreciation, amortisation and impairment losses (EBITDA) 13 518 16 588 41 038 37 968
Underlying operating profit before depreciation, amortisation and impairment losses 12 758 13 828 43 558 42 488
Operating profit (EBIT) 8 386 11 832 - 2 195 - 5 641
Items affecting comparability 650 2 757 - 26 328 - 28 435
Underlying operating profit 7 736 9 075 24 133 22 794
Comment: The underlying operating profit decreased by SEK 1.3 billion, which is explained by the following:
• Lower generation volumes, mainly attributable to the Nordic region (SEK -1.2 billion) • Lower production margins as a result of average lower prices achieved (SEK -0.3 billion) • Higher earnings from sales activities (SEK 0.5 billion) • Other items, net (SEK -0.3 billion)
0
50 000
100 000
150 000
200 000
250 000
1 2 3 4 1 2 3 4 1 2 3 4 1 2 3 4 1 2 3 4 1
2010 2011 2012 2013 2014 2015
Net salesSEK million
Per quarter Last 12-month values
0
10 000
20 000
30 000
40 000
50 000
1 2 3 4 1 2 3 4 1 2 3 4 1 2 3 4 1 2 3 4 1
2010 2011 2012 2013 2014 2015
Underlying operating profitSEK million
Per quarter Last 12-month values
Vattenfall Interim Report January-March 2015 6
Items affecting comparability Full year Last
Amounts in SEK million Q1 2015 Q1 2014 2014 12 months Items affecting comparability affecting operating profit (EBIT)
Capital gains 79 3 036 3 227 270
Capital losses - 14 — - 185 - 199
Impairment losses - 110 - 3 - 23 808 - 23 915
Unrealised changes in the fair value of energy derivatives 743 98 819 1 464
Unrealised changes in the fair value of inventories - 36 - 272 72 308
Restructuring costs - 12 - 102 - 765 - 675
Other items affecting comparability — — - 5 688 - 5 688
Total 650 2 757 - 26 328 - 28 435
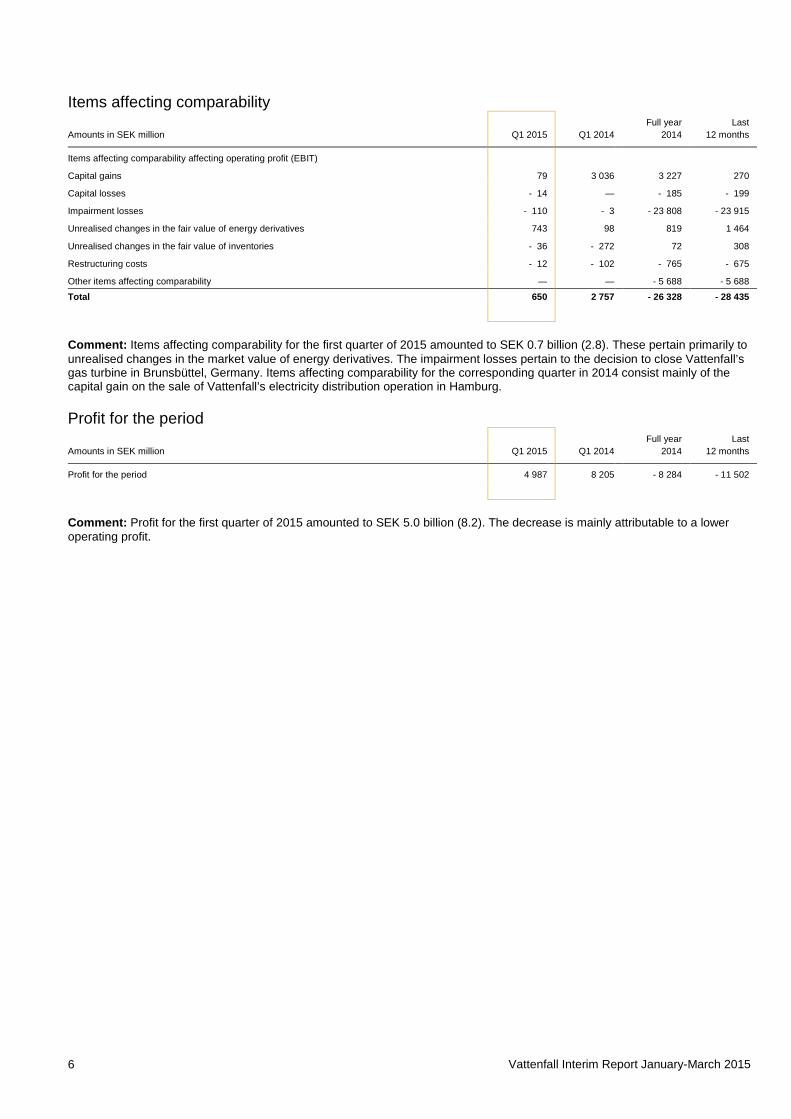
Comment: Items affecting comparability for the first quarter of 2015 amounted to SEK 0.7 billion (2.8). These pertain primarily to unrealised changes in the market value of energy derivatives. The impairment losses pertain to the decision to close Vattenfall’s gas turbine in Brunsbüttel, Germany. Items affecting comparability for the corresponding quarter in 2014 consist mainly of the capital gain on the sale of Vattenfall’s electricity distribution operation in Hamburg.
Profit for the period Full year Last
Amounts in SEK million Q1 2015 Q1 2014 2014 12 months Profit for the period 4 987 8 205 - 8 284 - 11 502
Comment: Profit for the first quarter of 2015 amounted to SEK 5.0 billion (8.2). The decrease is mainly attributable to a lower operating profit.
Vattenfall Interim Report January-March 2015 7
Financial items Full year Last Amounts in SEK million Q1 2015 Q1 2014 2014 12 months
Net financial items - 1 543 - 1 701 - 6 045 - 5 887 - of which, interest income 55 344 772 483 - of which, interest expenses - 678 - 1 181 - 3 832 - 3 329 - of which, impairment and provisions — - 2 - 37 - 35 - of which, other - 920 - 862 - 2 948 - 3 006 Interest received1 249 153 537 633 Interest paid1 - 1 658 - 1 285 - 3 074 - 3 447
1) Pertains to cash flows.
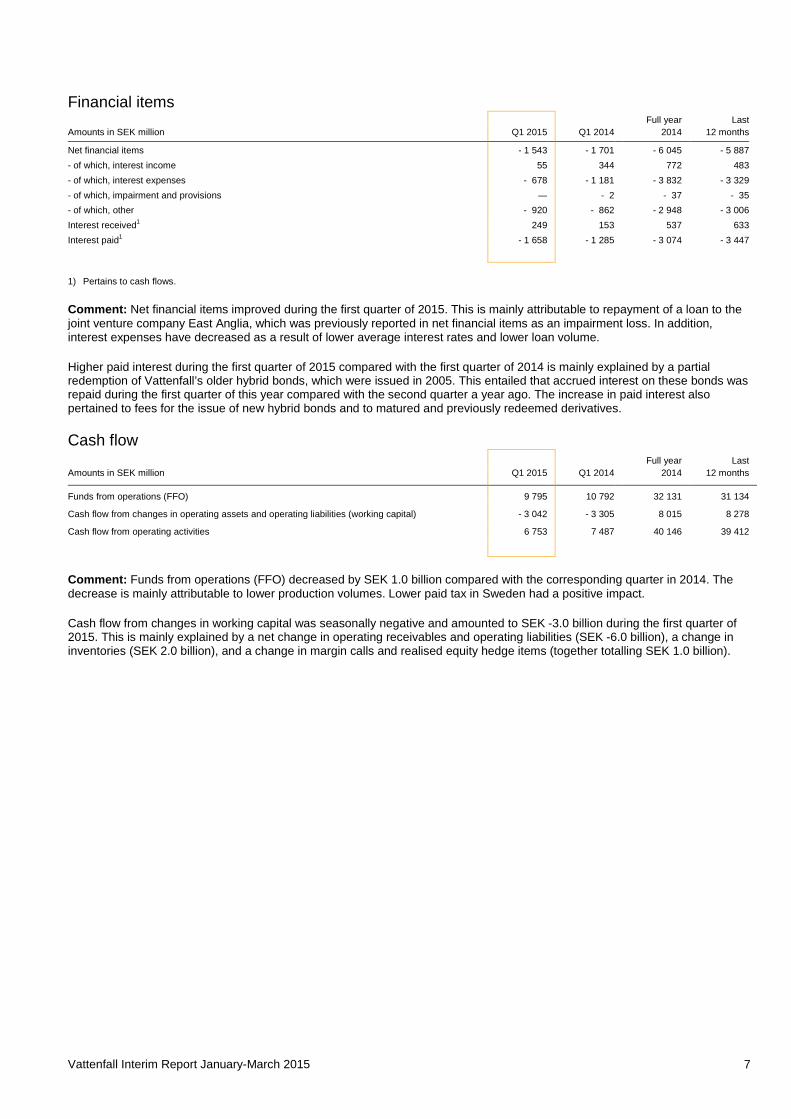
Comment: Net financial items improved during the first quarter of 2015. This is mainly attributable to repayment of a loan to the joint venture company East Anglia, which was previously reported in net financial items as an impairment loss. In addition, interest expenses have decreased as a result of lower average interest rates and lower loan volume.
Higher paid interest during the first quarter of 2015 compared with the first quarter of 2014 is mainly explained by a partial redemption of Vattenfall’s older hybrid bonds, which were issued in 2005. This entailed that accrued interest on these bonds was repaid during the first quarter of this year compared with the second quarter a year ago. The increase in paid interest also pertained to fees for the issue of new hybrid bonds and to matured and previously redeemed derivatives.
Cash flow Full year
Last
Amounts in SEK million Q1 2015 Q1 2014 2014 12 months Funds from operations (FFO) 9 795 10 792 32 131 31 134
Cash flow from changes in operating assets and operating liabilities (working capital) - 3 042 - 3 305 8 015 8 278
Cash flow from operating activities 6 753 7 487 40 146 39 412
Comment: Funds from operations (FFO) decreased by SEK 1.0 billion compared with the corresponding quarter in 2014. The decrease is mainly attributable to lower production volumes. Lower paid tax in Sweden had a positive impact.
Cash flow from changes in working capital was seasonally negative and amounted to SEK -3.0 billion during the first quarter of 2015. This is mainly explained by a net change in operating receivables and operating liabilities (SEK -6.0 billion), a change in inventories (SEK 2.0 billion), and a change in margin calls and realised equity hedge items (together totalling SEK 1.0 billion).
Vattenfall Interim Report January-March 2015 8
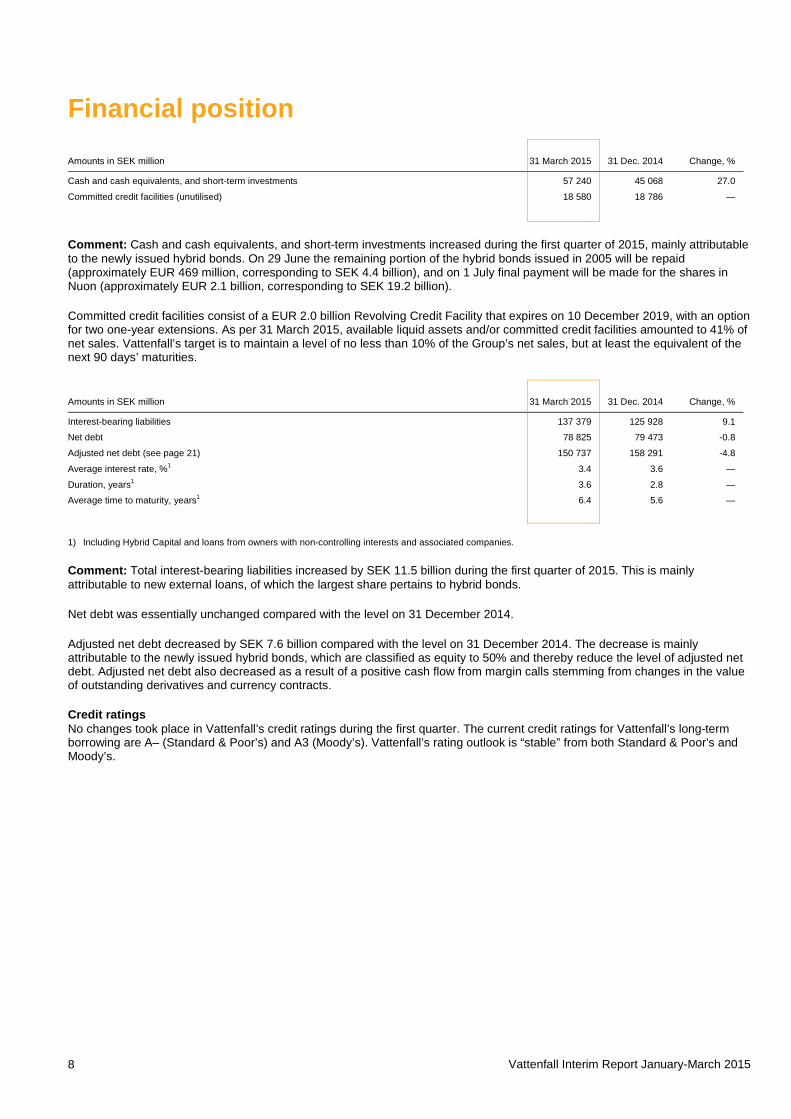
Financial position Amounts in SEK million 31 March 2015 31 Dec. 2014 Change, %
Cash and cash equivalents, and short-term investments 57 240 45 068
27.0
Committed credit facilities (unutilised) 18 580 18 786
—
Comment: Cash and cash equivalents, and short-term investments increased during the first quarter of 2015, mainly attributable to the newly issued hybrid bonds. On 29 June the remaining portion of the hybrid bonds issued in 2005 will be repaid (approximately EUR 469 million, corresponding to SEK 4.4 billion), and on 1 July final payment will be made for the shares in Nuon (approximately EUR 2.1 billion, corresponding to SEK 19.2 billion).
Committed credit facilities consist of a EUR 2.0 billion Revolving Credit Facility that expires on 10 December 2019, with an option for two one-year extensions. As per 31 March 2015, available liquid assets and/or committed credit facilities amounted to 41% of net sales. Vattenfall’s target is to maintain a level of no less than 10% of the Group’s net sales, but at least the equivalent of the next 90 days’ maturities.
Amounts in SEK million 31 March 2015 31 Dec. 2014 Change, %
Interest-bearing liabilities 137 379 125 928 9.1
Net debt 78 825 79 473 -0.8
Adjusted net debt (see page 21) 150 737 158 291 -4.8
Average interest rate, %1 3.4 3.6 —
Duration, years1 3.6 2.8 —
Average time to maturity, years1 6.4 5.6 —
1) Including Hybrid Capital and loans from owners with non-controlling interests and associated companies.
Comment: Total interest-bearing liabilities increased by SEK 11.5 billion during the first quarter of 2015. This is mainly attributable to new external loans, of which the largest share pertains to hybrid bonds.
Net debt was essentially unchanged compared with the level on 31 December 2014.
Adjusted net debt decreased by SEK 7.6 billion compared with the level on 31 December 2014. The decrease is mainly attributable to the newly issued hybrid bonds, which are classified as equity to 50% and thereby reduce the level of adjusted net debt. Adjusted net debt also decreased as a result of a positive cash flow from margin calls stemming from changes in the value of outstanding derivatives and currency contracts.
Credit ratings No changes took place in Vattenfall’s credit ratings during the first quarter. The current credit ratings for Vattenfall’s long-term borrowing are A– (Standard & Poor’s) and A3 (Moody’s). Vattenfall’s rating outlook is “stable” from both Standard & Poor’s and Moody’s.
Vattenfall Interim Report January-March 2015 9
Investments and divestments Full year
Last
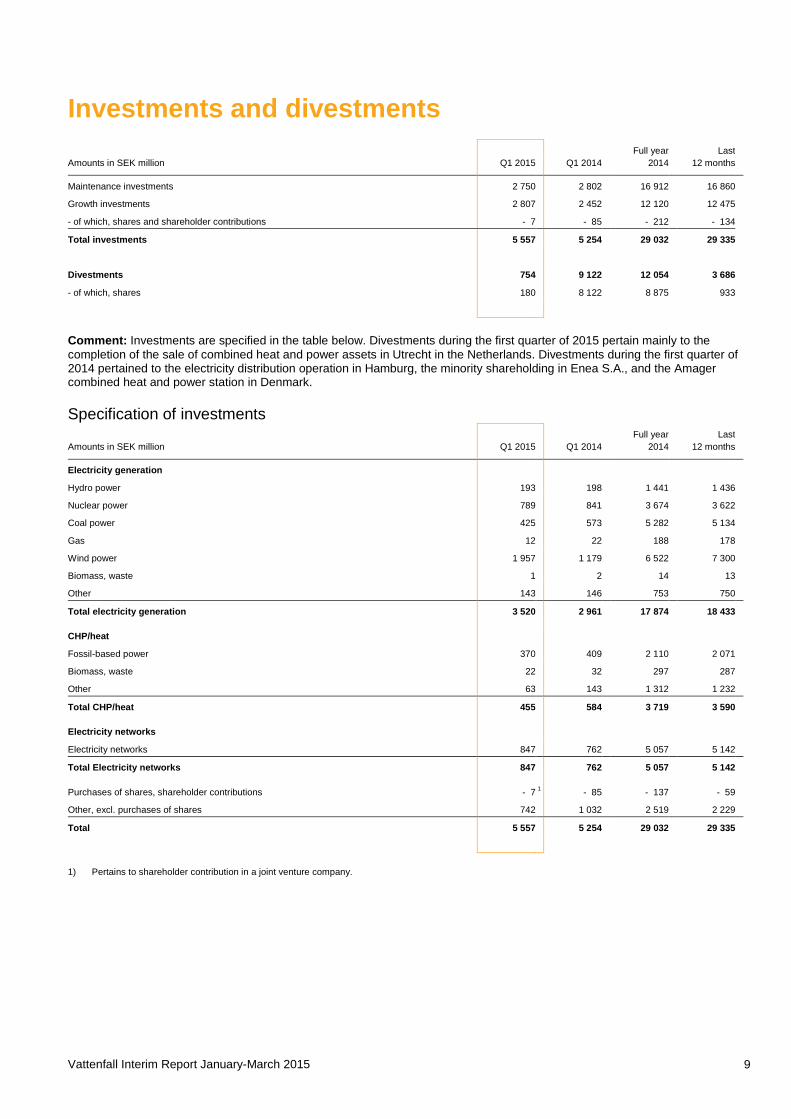
Amounts in SEK million Q1 2015 Q1 2014 2014 12 months Maintenance investments 2 750 2 802 16 912 16 860
Growth investments 2 807 2 452 12 120 12 475
- of which, shares and shareholder contributions - 7 - 85 - 212 - 134
Total investments 5 557 5 254 29 032 29 335
Divestments 754 9 122 12 054 3 686
- of which, shares 180 8 122 8 875 933
Comment: Investments are specified in the table below. Divestments during the first quarter of 2015 pertain mainly to the completion of the sale of combined heat and power assets in Utrecht in the Netherlands. Divestments during the first quarter of 2014 pertained to the electricity distribution operation in Hamburg, the minority shareholding in Enea S.A., and the Amager combined heat and power station in Denmark.
Specification of investments Full year
Last
Amounts in SEK million Q1 2015 Q1 2014 2014 12 months Electricity generation
Hydro power 193 198 1 441 1 436
Nuclear power 789 841 3 674 3 622
Coal power 425 573 5 282 5 134
Gas 12 22 188 178
Wind power 1 957 1 179 6 522 7 300
Biomass, waste 1 2 14 13
Other 143 146 753 750
Total electricity generation 3 520 2 961 17 874 18 433
CHP/heat
Fossil-based power 370 409 2 110 2 071
Biomass, waste 22 32 297 287
Other 63 143 1 312 1 232
Total CHP/heat 455 584 3 719 3 590
Electricity networks
Electricity networks 847 762 5 057 5 142
Total Electricity networks 847 762 5 057 5 142
Purchases of shares, shareholder contributions - 7 1 - 85 - 137 - 59
Other, excl. purchases of shares 742 1 032 2 519 2 229
Total 5 557 5 254 29 032 29 335
1) Pertains to shareholder contribution in a joint venture company.
Vattenfall Interim Report January-March 2015 10
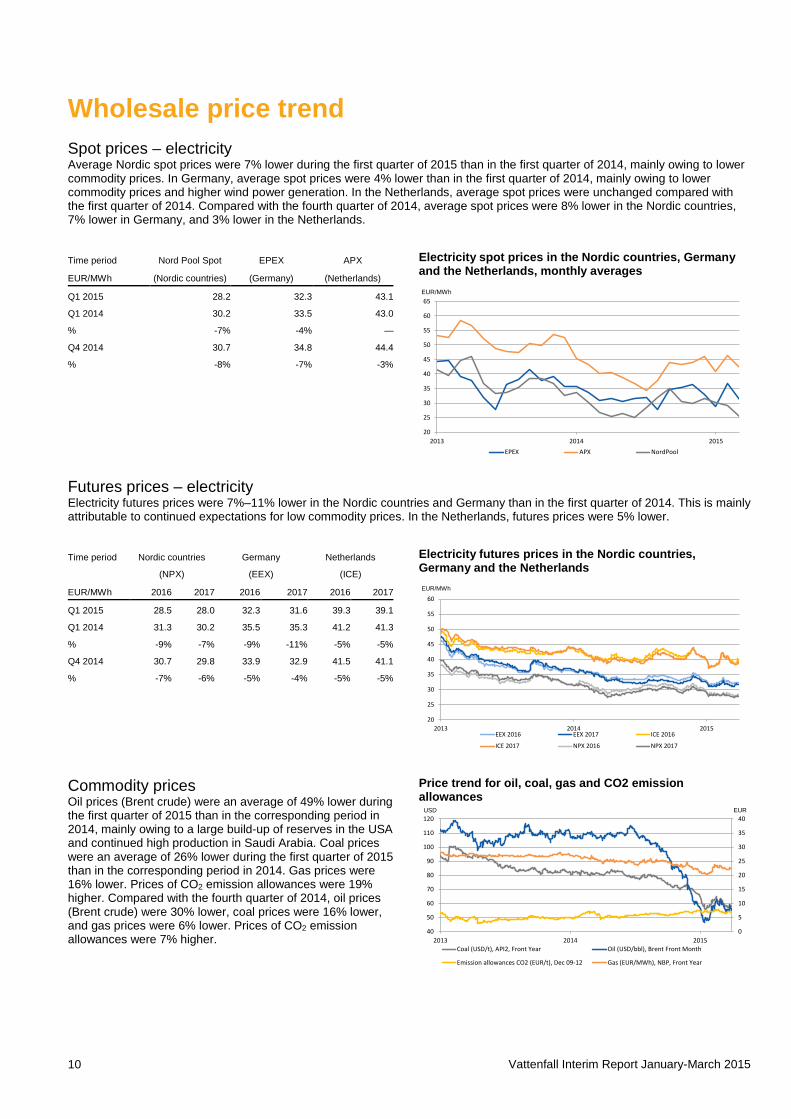
Wholesale price trend Spot prices – electricity Average Nordic spot prices were 7% lower during the first quarter of 2015 than in the first quarter of 2014, mainly owing to lower commodity prices. In Germany, average spot prices were 4% lower than in the first quarter of 2014, mainly owing to lower commodity prices and higher wind power generation. In the Netherlands, average spot prices were unchanged compared with the first quarter of 2014. Compared with the fourth quarter of 2014, average spot prices were 8% lower in the Nordic countries, 7% lower in Germany, and 3% lower in the Netherlands.
Time period Nord Pool Spot EPEX APX
EUR/MWh (Nordic countries) (Germany) (Netherlands)
Q1 2015 28.2 32.3 43.1
Q1 2014 30.2 33.5 43.0
% -7% -4% —
Q4 2014 30.7 34.8 44.4
% -8% -7% -3%
Electricity spot prices in the Nordic countries, Germany and the Netherlands, monthly averages
Futures prices – electricity Electricity futures prices were 7%–11% lower in the Nordic countries and Germany than in the first quarter of 2014. This is mainly attributable to continued expectations for low commodity prices. In the Netherlands, futures prices were 5% lower.
Time period Nordic countries Germany Netherlands
(NPX) (EEX) (ICE)
EUR/MWh 2016 2017 2016 2017 2016 2017
Q1 2015 28.5 28.0 32.3 31.6 39.3 39.1
Q1 2014 31.3 30.2 35.5 35.3 41.2 41.3
% -9% -7% -9% -11% -5% -5%
Q4 2014 30.7 29.8 33.9 32.9 41.5 41.1
% -7% -6% -5% -4% -5% -5%
Electricity futures prices in the Nordic countries, Germany and the Netherlands
Commodity prices Oil prices (Brent crude) were an average of 49% lower during the first quarter of 2015 than in the corresponding period in 2014, mainly owing to a large build-up of reserves in the USA and continued high production in Saudi Arabia. Coal prices were an average of 26% lower during the first quarter of 2015 than in the corresponding period in 2014. Gas prices were 16% lower. Prices of CO2 emission allowances were 19% higher. Compared with the fourth quarter of 2014, oil prices (Brent crude) were 30% lower, coal prices were 16% lower, and gas prices were 6% lower. Prices of CO2 emission allowances were 7% higher.
Price trend for oil, coal, gas and CO2 emission allowances
20
25
30
35
40
45
50
55
60
65
2013 2014 2015EPEX APX NordPool
EUR/MWh
20
25
30
35
40
45
50
55
60
2013 2014 2015EEX 2016 EEX 2017 ICE 2016
ICE 2017 NPX 2016 NPX 2017
EUR/MWh
0
5
10
15
20
25
30
35
40
40
50
60
70
80
90
100
110
120
2013 2014 2015Coal (USD/t), API2, Front Year Oil (USD/bbl), Brent Front Month
Emission allowances CO2 (EUR/t), Dec 09-12 Gas (EUR/MWh), NBP, Front Year
USD EUR
Vattenfall Interim Report January-March 2015 11
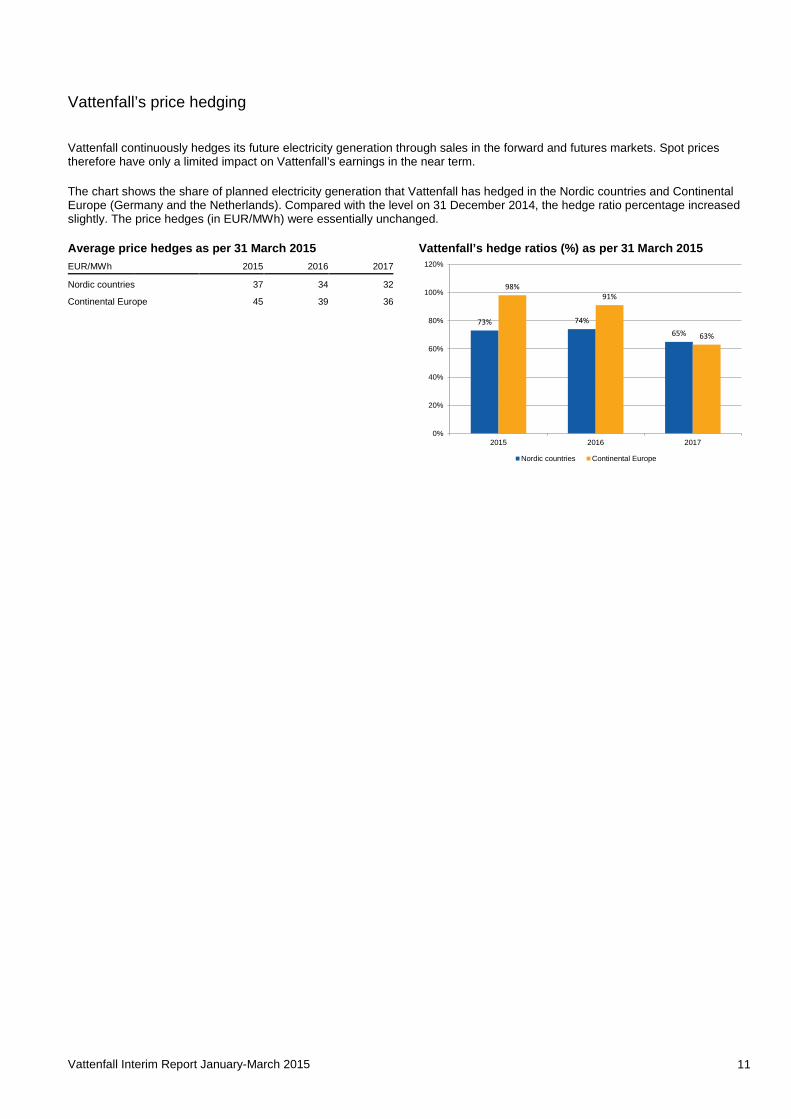
Vattenfall’s price hedging
Vattenfall continuously hedges its future electricity generation through sales in the forward and futures markets. Spot prices therefore have only a limited impact on Vattenfall’s earnings in the near term.
The chart shows the share of planned electricity generation that Vattenfall has hedged in the Nordic countries and Continental Europe (Germany and the Netherlands). Compared with the level on 31 December 2014, the hedge ratio percentage increased slightly. The price hedges (in EUR/MWh) were essentially unchanged.
Average price hedges as per 31 March 2015 EUR/MWh 2015 2016 2017
Nordic countries 37 34 32
Continental Europe 45 39 36
Vattenfall’s hedge ratios (%) as per 31 March 2015
73% 74%65%
98%91%
63%
0%
20%
40%
60%
80%
100%
120%
2015 2016 2017
Nordic countries Continental Europe
Vattenfall Interim Report January-March 2015 12
Nordic operating segment Full year
Last
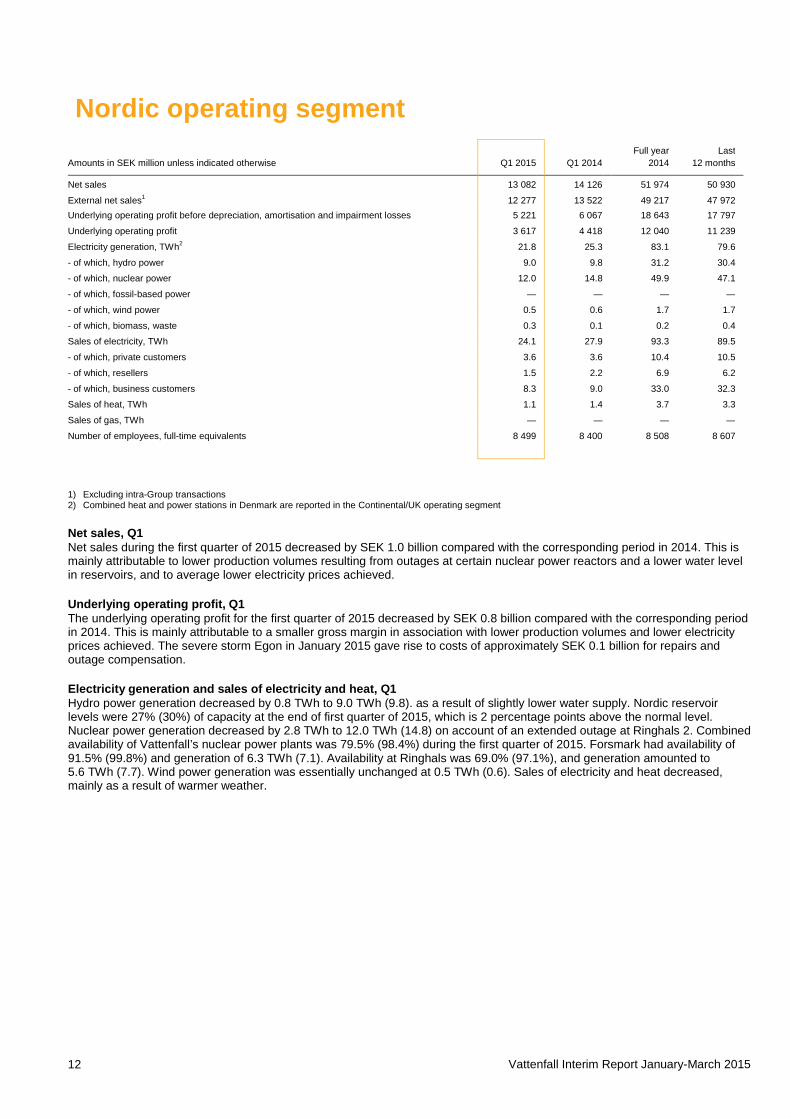
Amounts in SEK million unless indicated otherwise Q1 2015 Q1 2014 2014 12 months Net sales 13 082 14 126 51 974 50 930
External net sales1 12 277 13 522 49 217 47 972 Underlying operating profit before depreciation, amortisation and impairment losses 5 221 6 067 18 643 17 797
Underlying operating profit 3 617 4 418 12 040 11 239 Electricity generation, TWh2 21.8 25.3 83.1 79.6 - of which, hydro power 9.0 9.8 31.2 30.4 - of which, nuclear power 12.0 14.8 49.9 47.1 - of which, fossil-based power — — — — - of which, wind power 0.5 0.6 1.7 1.7 - of which, biomass, waste 0.3 0.1 0.2 0.4 Sales of electricity, TWh 24.1 27.9 93.3 89.5 - of which, private customers 3.6 3.6 10.4 10.5 - of which, resellers 1.5 2.2 6.9 6.2 - of which, business customers 8.3 9.0 33.0 32.3 Sales of heat, TWh 1.1 1.4 3.7 3.3 Sales of gas, TWh — — — — Number of employees, full-time equivalents 8 499 8 400 8 508 8 607
1) Excluding intra-Group transactions 2) Combined heat and power stations in Denmark are reported in the Continental/UK operating segment
Net sales, Q1 Net sales during the first quarter of 2015 decreased by SEK 1.0 billion compared with the corresponding period in 2014. This is mainly attributable to lower production volumes resulting from outages at certain nuclear power reactors and a lower water level in reservoirs, and to average lower electricity prices achieved.
Underlying operating profit, Q1 The underlying operating profit for the first quarter of 2015 decreased by SEK 0.8 billion compared with the corresponding period in 2014. This is mainly attributable to a smaller gross margin in association with lower production volumes and lower electricity prices achieved. The severe storm Egon in January 2015 gave rise to costs of approximately SEK 0.1 billion for repairs and outage compensation.
Electricity generation and sales of electricity and heat, Q1 Hydro power generation decreased by 0.8 TWh to 9.0 TWh (9.8). as a result of slightly lower water supply. Nordic reservoir levels were 27% (30%) of capacity at the end of first quarter of 2015, which is 2 percentage points above the normal level. Nuclear power generation decreased by 2.8 TWh to 12.0 TWh (14.8) on account of an extended outage at Ringhals 2. Combined availability of Vattenfall’s nuclear power plants was 79.5% (98.4%) during the first quarter of 2015. Forsmark had availability of 91.5% (99.8%) and generation of 6.3 TWh (7.1). Availability at Ringhals was 69.0% (97.1%), and generation amounted to 5.6 TWh (7.7). Wind power generation was essentially unchanged at 0.5 TWh (0.6). Sales of electricity and heat decreased, mainly as a result of warmer weather.
Vattenfall Interim Report January-March 2015 13
Continental/UK operating segment Full year
Last
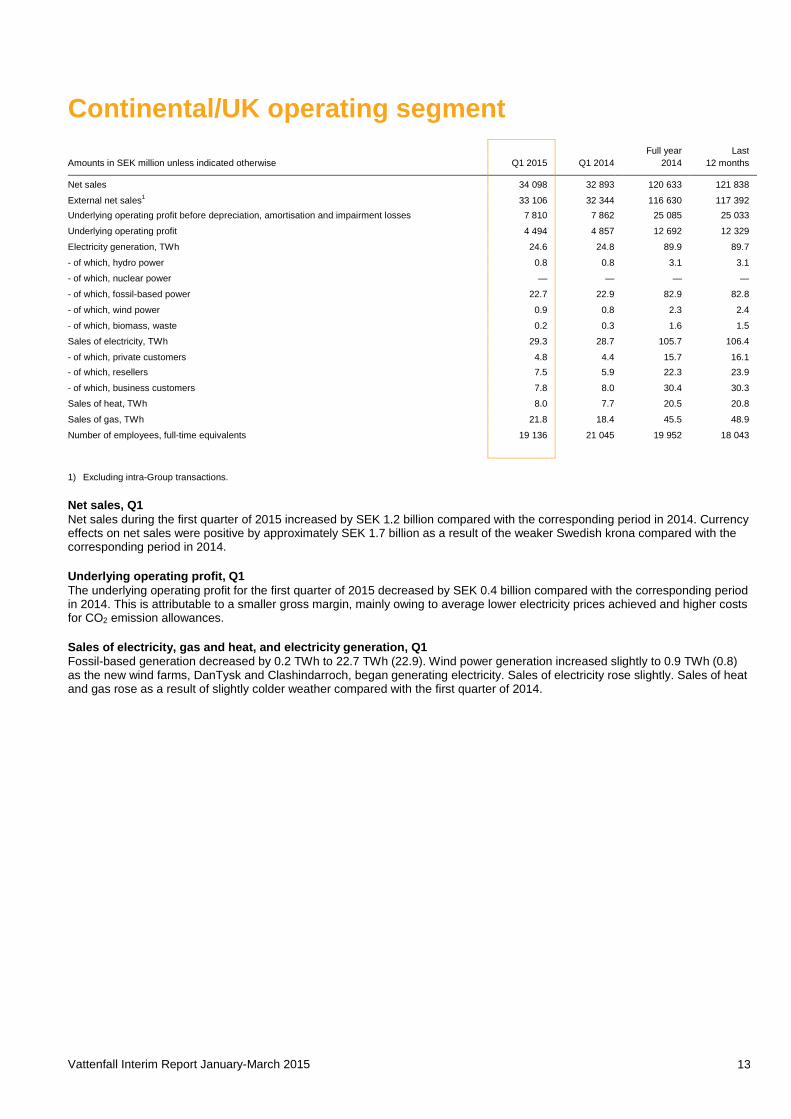
Amounts in SEK million unless indicated otherwise Q1 2015 Q1 2014 2014 12 months Net sales 34 098 32 893 120 633 121 838
External net sales1 33 106 32 344 116 630 117 392 Underlying operating profit before depreciation, amortisation and impairment losses 7 810 7 862 25 085 25 033
Underlying operating profit 4 494 4 857 12 692 12 329
Electricity generation, TWh 24.6 24.8 89.9 89.7
- of which, hydro power 0.8 0.8 3.1 3.1
- of which, nuclear power — — — —
- of which, fossil-based power 22.7 22.9 82.9 82.8
- of which, wind power 0.9 0.8 2.3 2.4
- of which, biomass, waste 0.2 0.3 1.6 1.5
Sales of electricity, TWh 29.3 28.7 105.7 106.4
- of which, private customers 4.8 4.4 15.7 16.1 - of which, resellers 7.5 5.9 22.3 23.9 - of which, business customers 7.8 8.0 30.4 30.3 Sales of heat, TWh 8.0 7.7 20.5 20.8 Sales of gas, TWh 21.8 18.4 45.5 48.9 Number of employees, full-time equivalents 19 136 21 045 19 952 18 043
1) Excluding intra-Group transactions.
Net sales, Q1 Net sales during the first quarter of 2015 increased by SEK 1.2 billion compared with the corresponding period in 2014. Currency effects on net sales were positive by approximately SEK 1.7 billion as a result of the weaker Swedish krona compared with the corresponding period in 2014.
Underlying operating profit, Q1 The underlying operating profit for the first quarter of 2015 decreased by SEK 0.4 billion compared with the corresponding period in 2014. This is attributable to a smaller gross margin, mainly owing to average lower electricity prices achieved and higher costs for CO2 emission allowances.
Sales of electricity, gas and heat, and electricity generation, Q1 Fossil-based generation decreased by 0.2 TWh to 22.7 TWh (22.9). Wind power generation increased slightly to 0.9 TWh (0.8) as the new wind farms, DanTysk and Clashindarroch, began generating electricity. Sales of electricity rose slightly. Sales of heat and gas rose as a result of slightly colder weather compared with the first quarter of 2014.
Vattenfall Interim Report January-March 2015 14
Other1
Full year
Last
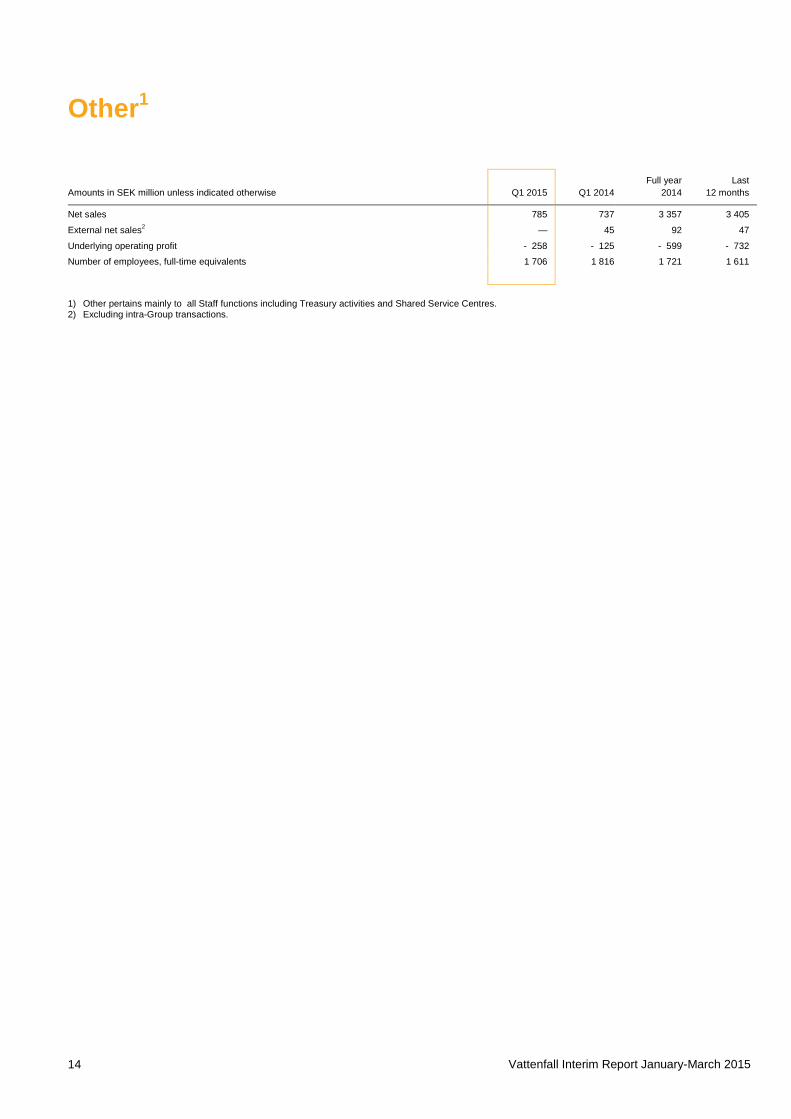
Amounts in SEK million unless indicated otherwise Q1 2015 Q1 2014 2014 12 months Net sales 785 737 3 357 3 405
External net sales2 — 45 92 47
Underlying operating profit - 258 - 125 - 599 - 732 Number of employees, full-time equivalents 1 706 1 816 1 721 1 611
1) Other pertains mainly to all Staff functions including Treasury activities and Shared Service Centres. 2) Excluding intra-Group transactions.
Vattenfall Interim Report January-March 2015 15
Consolidated income statement Full year
Last
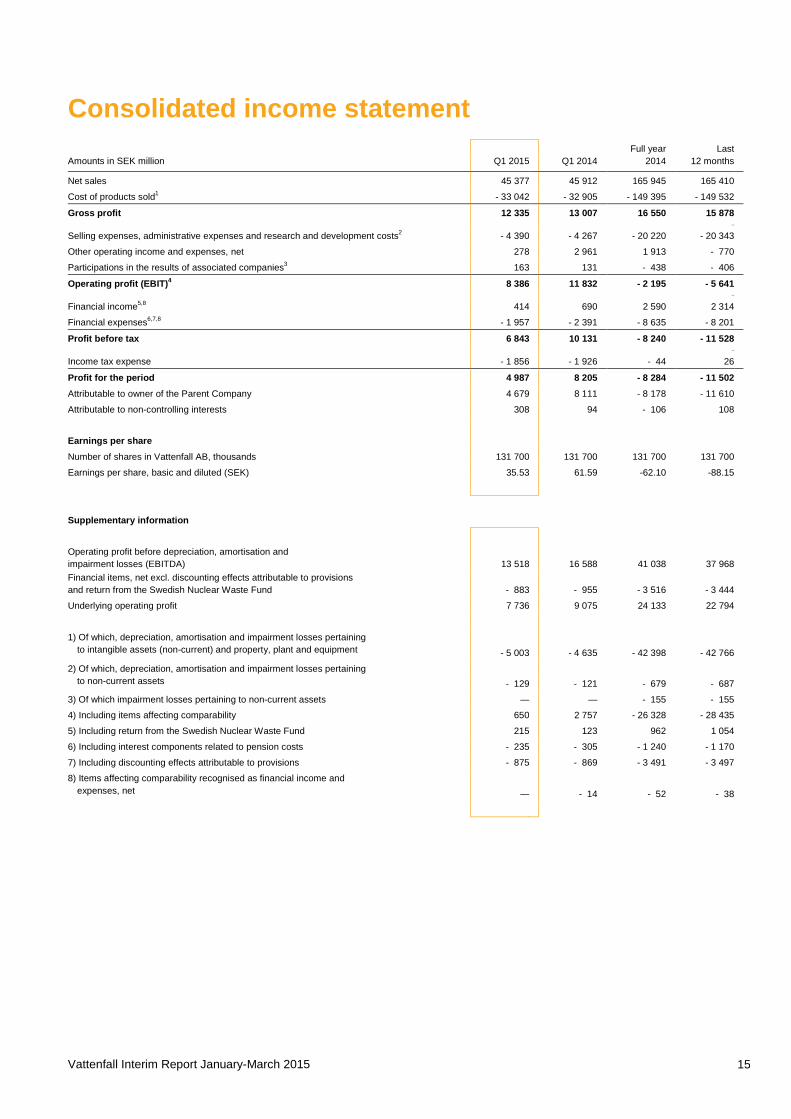
Amounts in SEK million Q1 2015 Q1 2014 2014 12 months
Net sales 45 377 45 912 165 945 165 410 Cost of products sold1 - 33 042 - 32 905 - 149 395 - 149 532
Gross profit 12 335 13 007 16 550 15 878 —
Selling expenses, administrative expenses and research and development costs2 - 4 390 - 4 267 - 20 220 - 20 343 Other operating income and expenses, net 278 2 961 1 913 - 770 Participations in the results of associated companies3 163 131 - 438 - 406
Operating profit (EBIT)4 8 386 11 832 - 2 195 - 5 641 —
Financial income5,8 414 690 2 590 2 314 Financial expenses6,7,8 - 1 957 - 2 391 - 8 635 - 8 201
Profit before tax 6 843 10 131 - 8 240 - 11 528 —
Income tax expense - 1 856 - 1 926 - 44 26
Profit for the period 4 987 8 205 - 8 284 - 11 502 Attributable to owner of the Parent Company 4 679 8 111 - 8 178 - 11 610 Attributable to non-controlling interests 308 94 - 106 108 Earnings per share Number of shares in Vattenfall AB, thousands 131 700 131 700 131 700 131 700 Earnings per share, basic and diluted (SEK) 35.53 61.59 -62.10 -88.15 Supplementary information
Operating profit before depreciation, amortisation and
impairment losses (EBITDA) 13 518 16 588 41 038 37 968 Financial items, net excl. discounting effects attributable to provisions
and return from the Swedish Nuclear Waste Fund - 883 - 955 - 3 516 - 3 444
Underlying operating profit 7 736 9 075 24 133 22 794 1) Of which, depreciation, amortisation and impairment losses pertaining to intangible assets (non-current) and property, plant and equipment - 5 003 - 4 635 - 42 398 - 42 766
2) Of which, depreciation, amortisation and impairment losses pertaining to non-current assets - 129 - 121 - 679 - 687
3) Of which impairment losses pertaining to non-current assets — — - 155 - 155 4) Including items affecting comparability 650 2 757 - 26 328 - 28 435 5) Including return from the Swedish Nuclear Waste Fund 215 123 962 1 054 6) Including interest components related to pension costs - 235 - 305 - 1 240 - 1 170 7) Including discounting effects attributable to provisions - 875 - 869 - 3 491 - 3 497 8) Items affecting comparability recognised as financial income and expenses, net — - 14 - 52 - 38
Vattenfall Interim Report January-March 2015 16
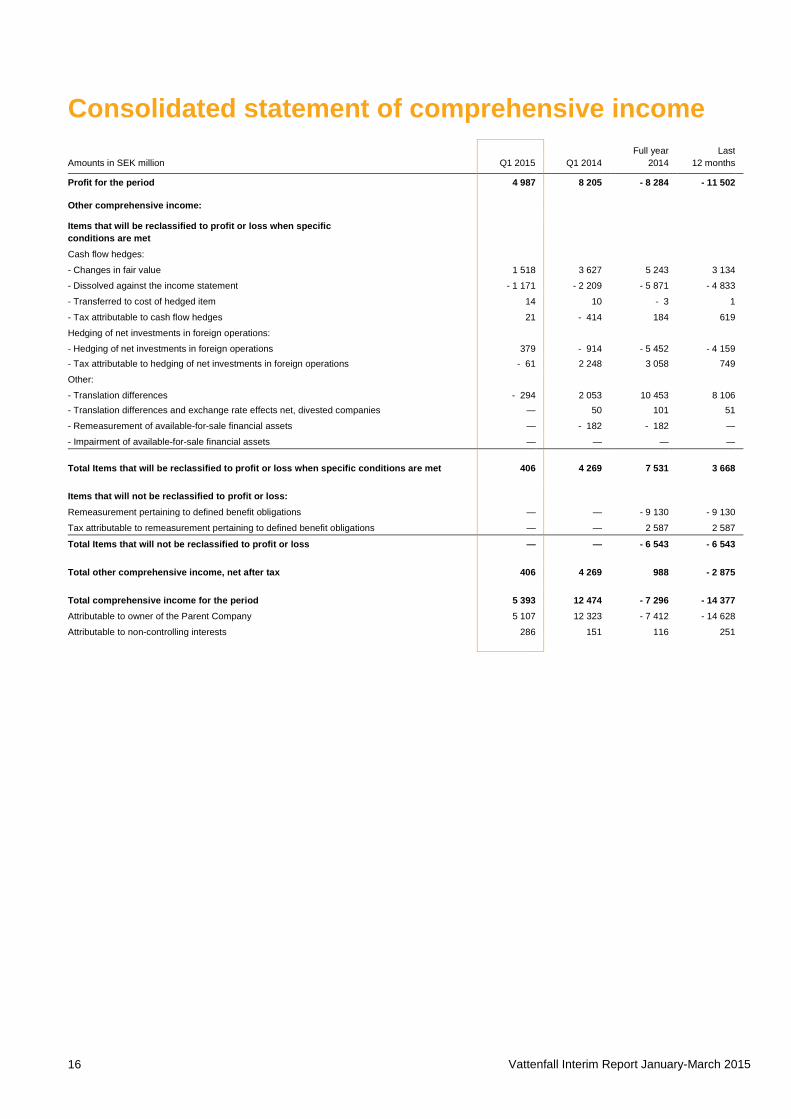
Consolidated statement of comprehensive income Full year Last Amounts in SEK million Q1 2015 Q1 2014 2014 12 months
Profit for the period 4 987 8 205 - 8 284 - 11 502
Other comprehensive income:
Items that will be reclassified to profit or loss when specific conditions are met Cash flow hedges:
- Changes in fair value 1 518 3 627 5 243 3 134
- Dissolved against the income statement - 1 171 - 2 209 - 5 871 - 4 833
- Transferred to cost of hedged item 14 10 - 3 1
- Tax attributable to cash flow hedges 21 - 414 184 619
Hedging of net investments in foreign operations:
- Hedging of net investments in foreign operations 379 - 914 - 5 452 - 4 159 - Tax attributable to hedging of net investments in foreign operations - 61 2 248 3 058 749
Other:
- Translation differences - 294 2 053 10 453 8 106 - Translation differences and exchange rate effects net, divested companies — 50 101 51
- Remeasurement of available-for-sale financial assets — - 182 - 182 —
- Impairment of available-for-sale financial assets — — — —
Total Items that will be reclassified to profit or loss when specific conditions are met 406 4 269 7 531 3 668 Items that will not be reclassified to profit or loss: Remeasurement pertaining to defined benefit obligations — — - 9 130 - 9 130
Tax attributable to remeasurement pertaining to defined benefit obligations — — 2 587 2 587
Total Items that will not be reclassified to profit or loss — — - 6 543 - 6 543 Total other comprehensive income, net after tax 406 4 269 988 - 2 875 Total comprehensive income for the period 5 393 12 474 - 7 296 - 14 377 Attributable to owner of the Parent Company 5 107 12 323 - 7 412 - 14 628
Attributable to non-controlling interests 286 151 116 251
Vattenfall Interim Report January-March 2015 17
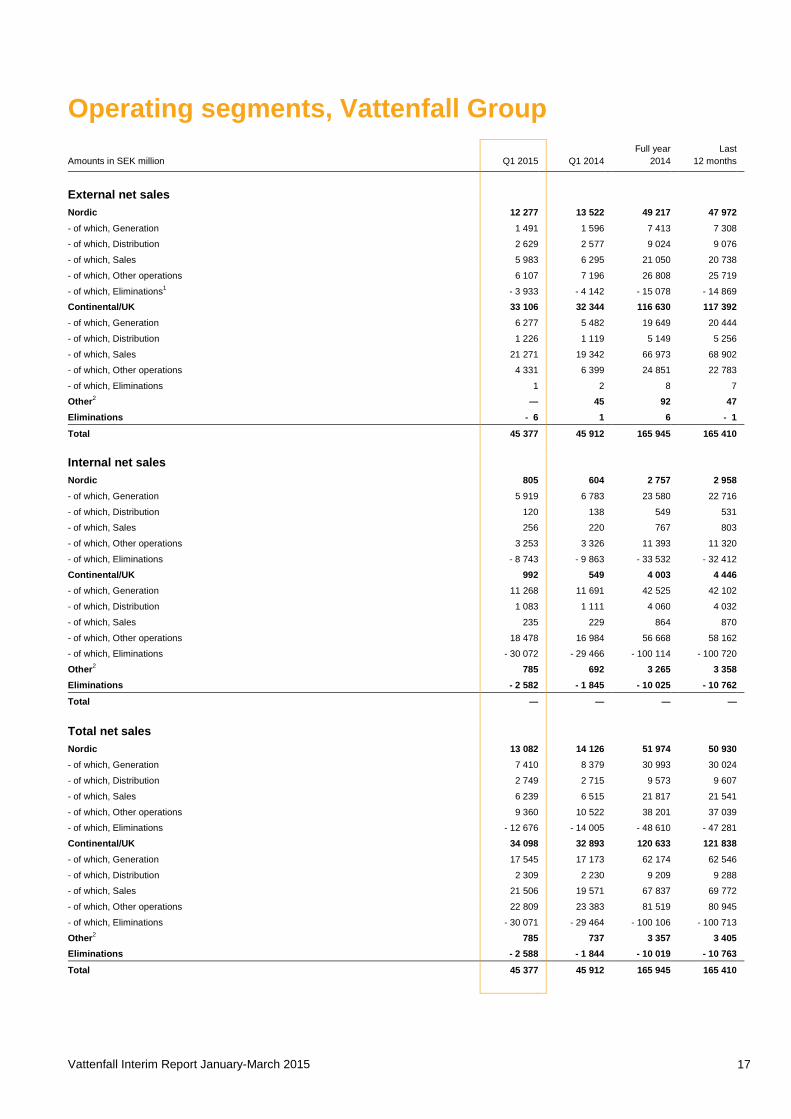
Operating segments, Vattenfall Group
Full year
Last
Amounts in SEK million Q1 2015 Q1 2014 2014 12 months
External net sales
Nordic 12 277 13 522 49 217 47 972 - of which, Generation 1 491 1 596 7 413 7 308 - of which, Distribution 2 629 2 577 9 024 9 076 - of which, Sales 5 983 6 295 21 050 20 738 - of which, Other operations 6 107 7 196 26 808 25 719 - of which, Eliminations1 - 3 933 - 4 142 - 15 078 - 14 869 Continental/UK 33 106 32 344 116 630 117 392 - of which, Generation 6 277 5 482 19 649 20 444 - of which, Distribution 1 226 1 119 5 149 5 256 - of which, Sales 21 271 19 342 66 973 68 902 - of which, Other operations 4 331 6 399 24 851 22 783 - of which, Eliminations 1 2 8 7
Other2 — 45 92 47 Eliminations - 6 1 6 - 1
Total 45 377 45 912 165 945 165 410 Internal net sales
Nordic 805 604 2 757 2 958 - of which, Generation 5 919 6 783 23 580 22 716 - of which, Distribution 120 138 549 531 - of which, Sales 256 220 767 803 - of which, Other operations 3 253 3 326 11 393 11 320 - of which, Eliminations - 8 743 - 9 863 - 33 532 - 32 412 Continental/UK 992 549 4 003 4 446 - of which, Generation 11 268 11 691 42 525 42 102 - of which, Distribution 1 083 1 111 4 060 4 032 - of which, Sales 235 229 864 870 - of which, Other operations 18 478 16 984 56 668 58 162 - of which, Eliminations - 30 072 - 29 466 - 100 114 - 100 720 Other2 785 692 3 265 3 358 Eliminations - 2 582 - 1 845 - 10 025 - 10 762
Total — — — —
Total net sales
Nordic 13 082 14 126 51 974 50 930 - of which, Generation 7 410 8 379 30 993 30 024
- of which, Distribution 2 749 2 715 9 573 9 607
- of which, Sales 6 239 6 515 21 817 21 541
- of which, Other operations 9 360 10 522 38 201 37 039
- of which, Eliminations - 12 676 - 14 005 - 48 610 - 47 281
Continental/UK 34 098 32 893 120 633 121 838 - of which, Generation 17 545 17 173 62 174 62 546
- of which, Distribution 2 309 2 230 9 209 9 288 - of which, Sales 21 506 19 571 67 837 69 772 - of which, Other operations 22 809 23 383 81 519 80 945 - of which, Eliminations - 30 071 - 29 464 - 100 106 - 100 713 Other2 785 737 3 357 3 405
Eliminations - 2 588 - 1 844 - 10 019 - 10 763
Total 45 377 45 912 165 945 165 410
Vattenfall Interim Report January-March 2015 18
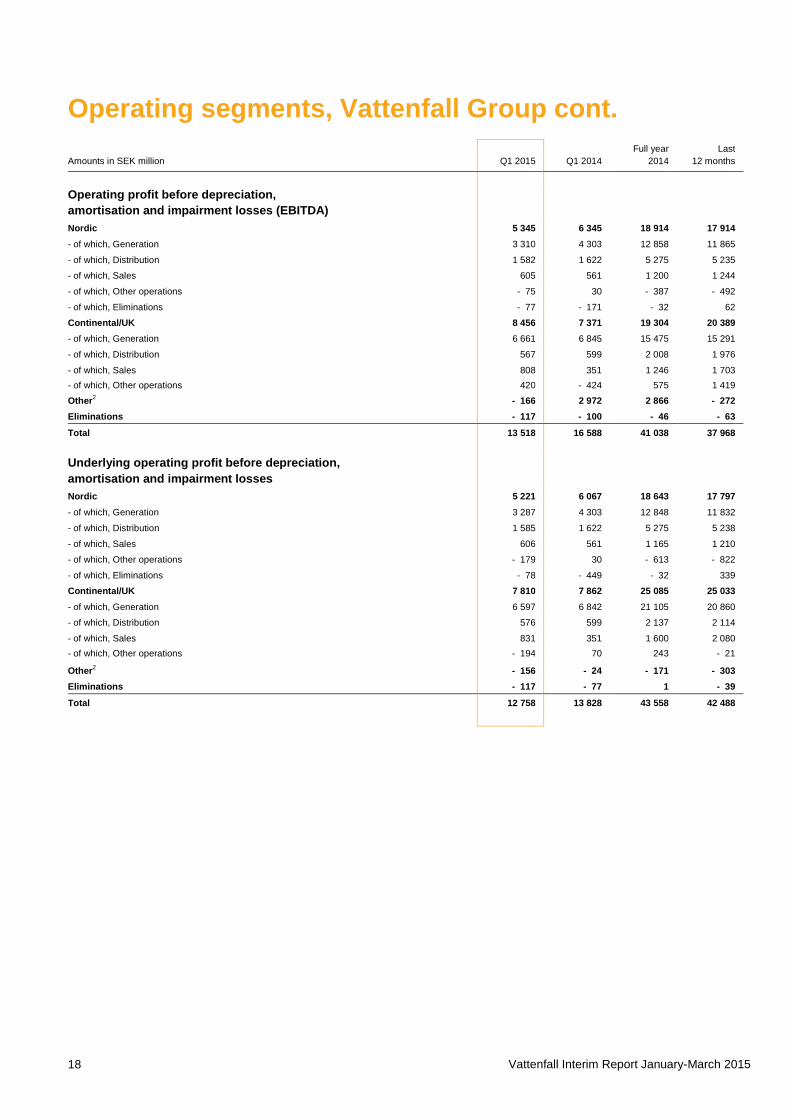
Operating segments, Vattenfall Group cont.
Full year
Last
Amounts in SEK million Q1 2015 Q1 2014 2014 12 months
Operating profit before depreciation, amortisation and impairment losses (EBITDA)
Nordic 5 345 6 345 18 914 17 914 - of which, Generation 3 310 4 303 12 858 11 865 - of which, Distribution 1 582 1 622 5 275 5 235 - of which, Sales 605 561 1 200 1 244 - of which, Other operations - 75 30 - 387 - 492 - of which, Eliminations - 77 - 171 - 32 62 Continental/UK 8 456 7 371 19 304 20 389 - of which, Generation 6 661 6 845 15 475 15 291 - of which, Distribution 567 599 2 008 1 976 - of which, Sales 808 351 1 246 1 703 - of which, Other operations 420 - 424 575 1 419 Other2 - 166 2 972 2 866 - 272
Eliminations - 117 - 100 - 46 - 63
Total 13 518 16 588 41 038 37 968
Underlying operating profit before depreciation, amortisation and impairment losses
Nordic 5 221 6 067 18 643 17 797 - of which, Generation 3 287 4 303 12 848 11 832 - of which, Distribution 1 585 1 622 5 275 5 238 - of which, Sales 606 561 1 165 1 210 - of which, Other operations - 179 30 - 613 - 822 - of which, Eliminations - 78 - 449 - 32 339 Continental/UK 7 810 7 862 25 085 25 033 - of which, Generation 6 597 6 842 21 105 20 860 - of which, Distribution 576 599 2 137 2 114 - of which, Sales 831 351 1 600 2 080 - of which, Other operations - 194 70 243 - 21 Other2 - 156 - 24 - 171
- 303
Eliminations - 117 - 77 1 - 39
Total 12 758 13 828 43 558 42 488
Vattenfall Interim Report January-March 2015 19
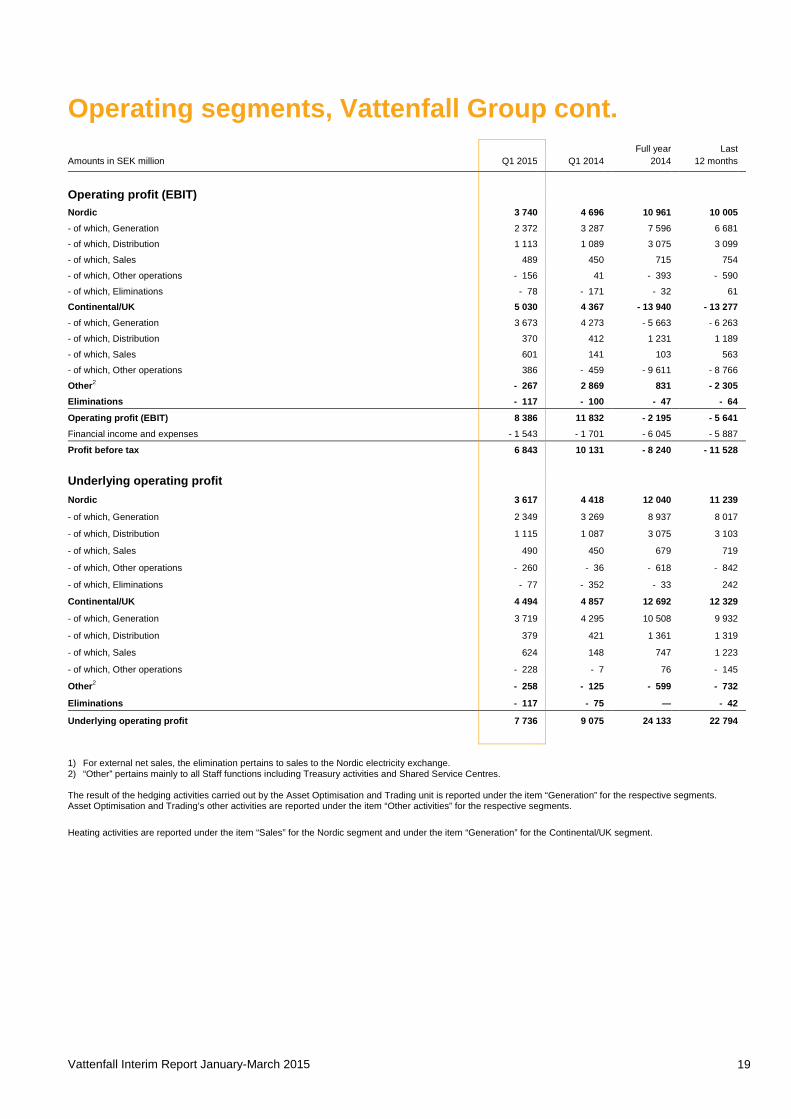
Operating segments, Vattenfall Group cont.
Full year
Last
Amounts in SEK million Q1 2015 Q1 2014 2014 12 months
Operating profit (EBIT)
Nordic 3 740 4 696 10 961 10 005 - of which, Generation 2 372 3 287 7 596 6 681
- of which, Distribution 1 113 1 089 3 075 3 099
- of which, Sales 489 450 715 754
- of which, Other operations - 156 41 - 393 - 590
- of which, Eliminations - 78 - 171 - 32 61
Continental/UK 5 030 4 367 - 13 940 - 13 277 - of which, Generation 3 673 4 273 - 5 663 - 6 263
- of which, Distribution 370 412 1 231 1 189
- of which, Sales 601 141 103 563
- of which, Other operations 386 - 459 - 9 611 - 8 766
Other2 - 267 2 869 831 - 2 305 Eliminations - 117 - 100 - 47 - 64
Operating profit (EBIT) 8 386 11 832 - 2 195 - 5 641 Financial income and expenses - 1 543 - 1 701 - 6 045 - 5 887
Profit before tax 6 843 10 131 - 8 240 - 11 528 Underlying operating profit
Nordic 3 617 4 418 12 040 11 239
- of which, Generation 2 349 3 269 8 937 8 017
- of which, Distribution 1 115 1 087 3 075 3 103
- of which, Sales 490 450 679 719
- of which, Other operations - 260 - 36 - 618 - 842
- of which, Eliminations - 77 - 352 - 33 242
Continental/UK 4 494 4 857 12 692 12 329
- of which, Generation 3 719 4 295 10 508 9 932
- of which, Distribution 379 421 1 361 1 319
- of which, Sales 624 148 747 1 223
- of which, Other operations - 228 - 7 76 - 145
Other2 - 258 - 125 - 599 - 732
Eliminations - 117 - 75 — - 42
Underlying operating profit 7 736 9 075 24 133 22 794
1) For external net sales, the elimination pertains to sales to the Nordic electricity exchange. 2) “Other” pertains mainly to all Staff functions including Treasury activities and Shared Service Centres. The result of the hedging activities carried out by the Asset Optimisation and Trading unit is reported under the item “Generation” for the respective segments. Asset Optimisation and Trading’s other activities are reported under the item “Other activities” for the respective segments.
Heating activities are reported under the item “Sales” for the Nordic segment and under the item “Generation” for the Continental/UK segment.
Vattenfall Interim Report January-March 2015 20
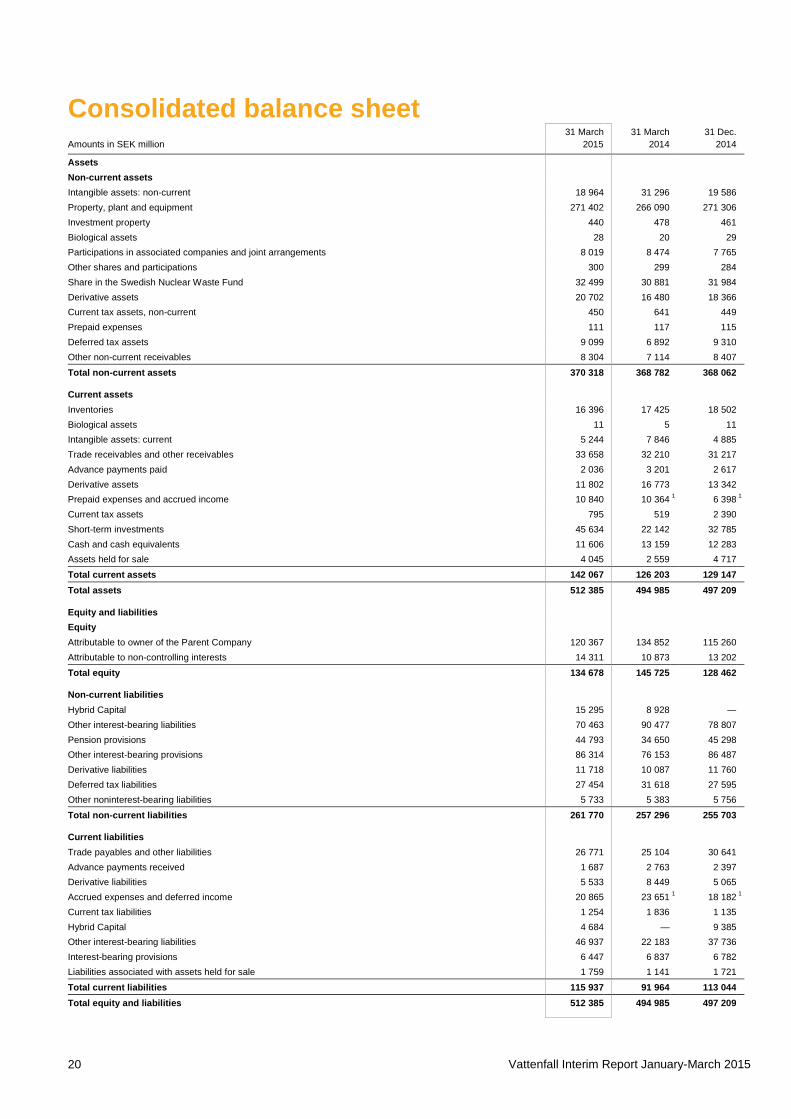
Consolidated balance sheet
31 March 31 March
31 Dec. Amounts in SEK million 2015 2014 2014
Assets Non-current assets Intangible assets: non-current 18 964 31 296 19 586
Property, plant and equipment 271 402 266 090 271 306 Investment property 440 478 461 Biological assets 28 20 29 Participations in associated companies and joint arrangements 8 019 8 474 7 765 Other shares and participations 300 299 284 Share in the Swedish Nuclear Waste Fund 32 499 30 881 31 984 Derivative assets 20 702 16 480 18 366 Current tax assets, non-current 450 641 449 Prepaid expenses 111 117 115 Deferred tax assets 9 099 6 892 9 310 Other non-current receivables 8 304 7 114 8 407
Total non-current assets 370 318 368 782 368 062
Current assets Inventories 16 396 17 425 18 502 Biological assets 11 5 11 Intangible assets: current 5 244 7 846 4 885 Trade receivables and other receivables 33 658 32 210 31 217 Advance payments paid 2 036 3 201 2 617 Derivative assets 11 802 16 773 13 342 Prepaid expenses and accrued income 10 840 10 364 1 6 398 1 Current tax assets 795 519 2 390 Short-term investments 45 634 22 142 32 785 Cash and cash equivalents 11 606 13 159 12 283 Assets held for sale 4 045 2 559 4 717
Total current assets 142 067 126 203 129 147 Total assets 512 385 494 985 497 209
Equity and liabilities Equity Attributable to owner of the Parent Company 120 367 134 852 115 260 Attributable to non-controlling interests 14 311 10 873 13 202
Total equity 134 678 145 725 128 462
Non-current liabilities Hybrid Capital 15 295 8 928 — Other interest-bearing liabilities 70 463 90 477 78 807 Pension provisions 44 793 34 650 45 298 Other interest-bearing provisions 86 314 76 153 86 487 Derivative liabilities 11 718 10 087 11 760 Deferred tax liabilities 27 454 31 618 27 595 Other noninterest-bearing liabilities 5 733 5 383 5 756
Total non-current liabilities 261 770 257 296 255 703
Current liabilities Trade payables and other liabilities 26 771 25 104 30 641 Advance payments received 1 687 2 763 2 397 Derivative liabilities 5 533 8 449 5 065 Accrued expenses and deferred income 20 865 23 651 1 18 182 1 Current tax liabilities 1 254 1 836 1 135 Hybrid Capital 4 684 — 9 385 Other interest-bearing liabilities 46 937 22 183 37 736 Interest-bearing provisions 6 447 6 837 6 782 Liabilities associated with assets held for sale 1 759 1 141 1 721
Total current liabilities 115 937 91 964 113 044 Total equity and liabilities 512 385 494 985 497 209
Vattenfall Interim Report January-March 2015 21
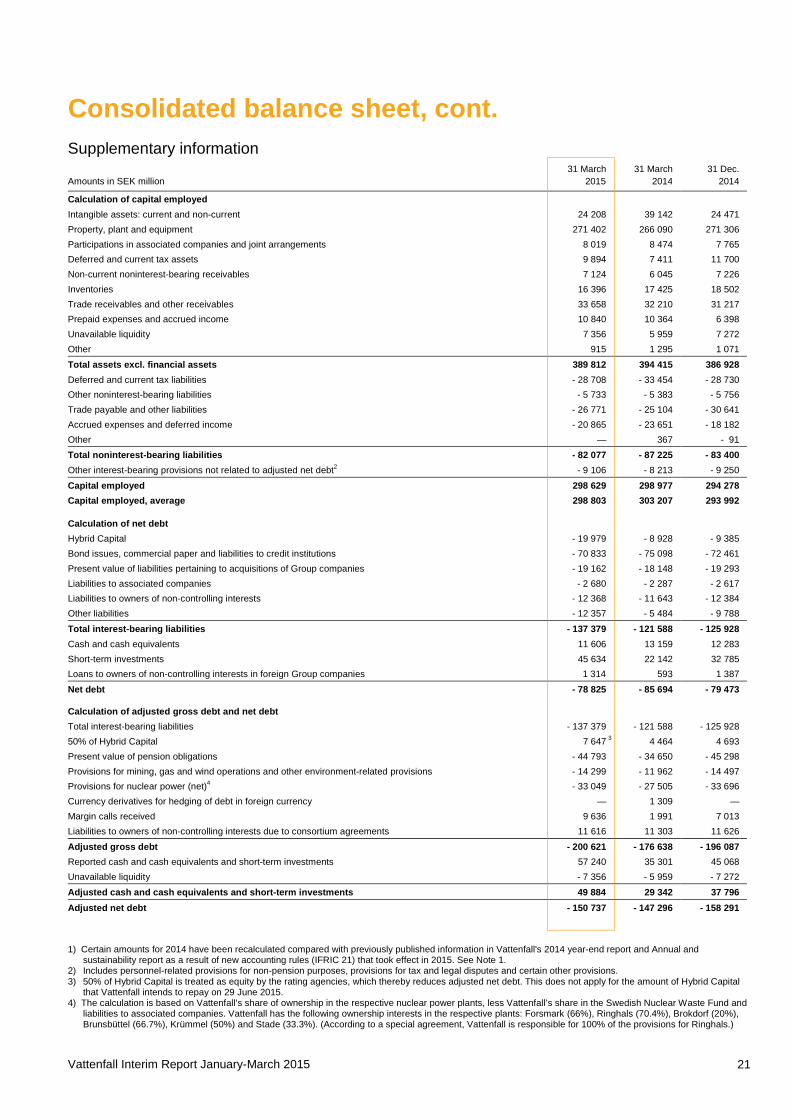
Consolidated balance sheet, cont. Supplementary information 31 March 31 March 31 Dec. Amounts in SEK million 2015 2014 2014
Calculation of capital employed Intangible assets: current and non-current 24 208 39 142 24 471
Property, plant and equipment 271 402 266 090 271 306 Participations in associated companies and joint arrangements 8 019 8 474 7 765 Deferred and current tax assets 9 894 7 411 11 700 Non-current noninterest-bearing receivables 7 124 6 045 7 226 Inventories 16 396 17 425 18 502 Trade receivables and other receivables 33 658 32 210 31 217 Prepaid expenses and accrued income 10 840 10 364 6 398 Unavailable liquidity 7 356 5 959 7 272 Other 915 1 295 1 071
Total assets excl. financial assets 389 812 394 415 386 928 Deferred and current tax liabilities - 28 708 - 33 454 - 28 730 Other noninterest-bearing liabilities - 5 733 - 5 383 - 5 756 Trade payable and other liabilities - 26 771 - 25 104 - 30 641 Accrued expenses and deferred income - 20 865 - 23 651 - 18 182 Other — 367 - 91
Total noninterest-bearing liabilities - 82 077 - 87 225 - 83 400 Other interest-bearing provisions not related to adjusted net debt2 - 9 106 - 8 213 - 9 250
Capital employed 298 629 298 977 294 278 Capital employed, average 298 803 303 207 293 992
Calculation of net debt Hybrid Capital - 19 979 - 8 928 - 9 385 Bond issues, commercial paper and liabilities to credit institutions - 70 833 - 75 098 - 72 461 Present value of liabilities pertaining to acquisitions of Group companies - 19 162 - 18 148 - 19 293 Liabilities to associated companies - 2 680 - 2 287 - 2 617 Liabilities to owners of non-controlling interests - 12 368 - 11 643 - 12 384 Other liabilities - 12 357 - 5 484 - 9 788
Total interest-bearing liabilities - 137 379 - 121 588 - 125 928 Cash and cash equivalents 11 606 13 159 12 283 Short-term investments 45 634 22 142 32 785 Loans to owners of non-controlling interests in foreign Group companies 1 314 593 1 387
Net debt - 78 825 - 85 694 - 79 473
Calculation of adjusted gross debt and net debt Total interest-bearing liabilities - 137 379 - 121 588 - 125 928 50% of Hybrid Capital 7 647 3 4 464 4 693 Present value of pension obligations - 44 793 - 34 650 - 45 298 Provisions for mining, gas and wind operations and other environment-related provisions - 14 299 - 11 962 - 14 497 Provisions for nuclear power (net)4 - 33 049 - 27 505 - 33 696 Currency derivatives for hedging of debt in foreign currency — 1 309 — Margin calls received 9 636 1 991 7 013 Liabilities to owners of non-controlling interests due to consortium agreements 11 616 11 303 11 626
Adjusted gross debt - 200 621 - 176 638 - 196 087 Reported cash and cash equivalents and short-term investments 57 240 35 301 45 068 Unavailable liquidity - 7 356 - 5 959 - 7 272
Adjusted cash and cash equivalents and short-term investments 49 884 29 342 37 796 Adjusted net debt - 150 737 - 147 296 - 158 291
1) Certain amounts for 2014 have been recalculated compared with previously published information in Vattenfall's 2014 year-end report and Annual and sustainability report as a result of new accounting rules (IFRIC 21) that took effect in 2015. See Note 1.
2) Includes personnel-related provisions for non-pension purposes, provisions for tax and legal disputes and certain other provisions. 3) 50% of Hybrid Capital is treated as equity by the rating agencies, which thereby reduces adjusted net debt. This does not apply for the amount of Hybrid Capital
that Vattenfall intends to repay on 29 June 2015. 4) The calculation is based on Vattenfall’s share of ownership in the respective nuclear power plants, less Vattenfall’s share in the Swedish Nuclear Waste Fund and
liabilities to associated companies. Vattenfall has the following ownership interests in the respective plants: Forsmark (66%), Ringhals (70.4%), Brokdorf (20%), Brunsbüttel (66.7%), Krümmel (50%) and Stade (33.3%). (According to a special agreement, Vattenfall is responsible for 100% of the provisions for Ringhals.)
Vattenfall Interim Report January-March 2015 22
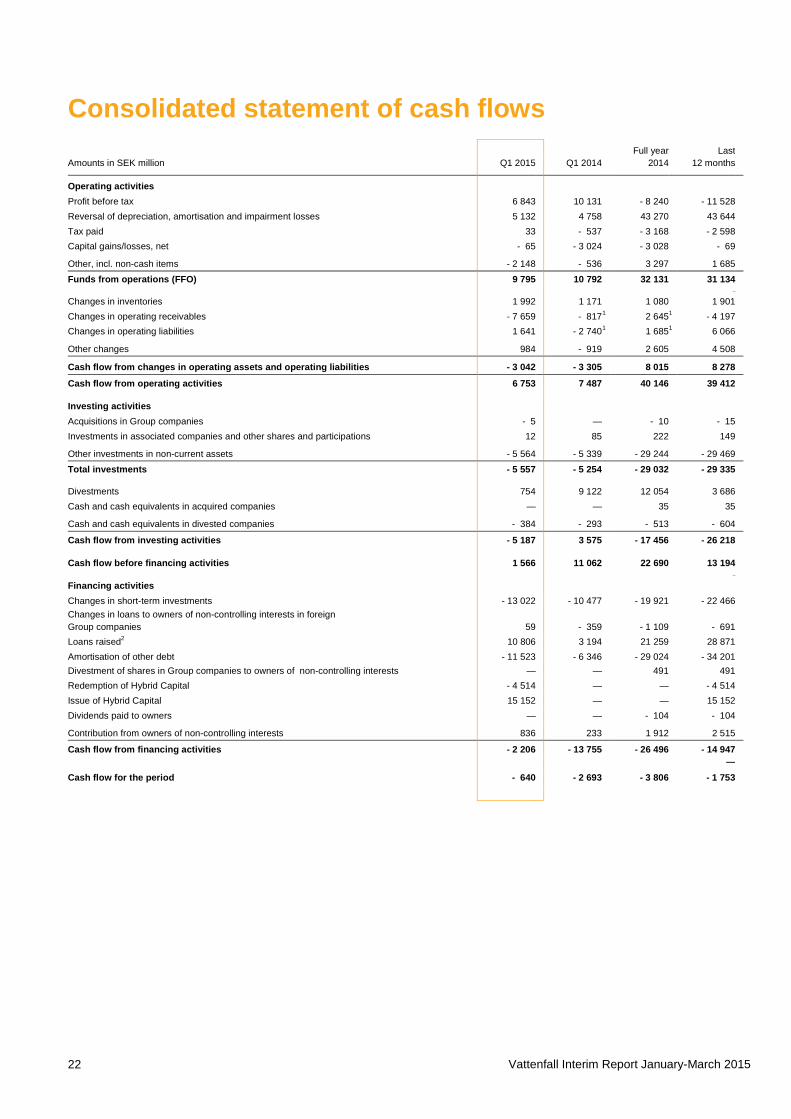
Consolidated statement of cash flows Full year
Last
Amounts in SEK million Q1 2015 Q1 2014 2014 12 months Operating activities
Profit before tax 6 843 10 131 - 8 240 - 11 528
Reversal of depreciation, amortisation and impairment losses 5 132 4 758 43 270 43 644
Tax paid 33 - 537 - 3 168 - 2 598
Capital gains/losses, net - 65 - 3 024 - 3 028 - 69
Other, incl. non-cash items - 2 148 - 536 3 297 1 685
Funds from operations (FFO) 9 795 10 792 32 131 31 134 —
Changes in inventories 1 992 1 171 1 080 1 901
Changes in operating receivables - 7 659 - 817 1 2 645 1 - 4 197
Changes in operating liabilities 1 641 - 2 740 1 1 685 1 6 066
Other changes 984 - 919 2 605 4 508
Cash flow from changes in operating assets and operating liabilities - 3 042 - 3 305 8 015 8 278
Cash flow from operating activities 6 753 7 487 40 146 39 412
Investing activities
Acquisitions in Group companies - 5 — - 10 - 15
Investments in associated companies and other shares and participations 12 85 222 149
Other investments in non-current assets - 5 564 - 5 339 - 29 244 - 29 469
Total investments - 5 557 - 5 254 - 29 032 - 29 335
Divestments 754 9 122 12 054 3 686
Cash and cash equivalents in acquired companies — — 35 35
Cash and cash equivalents in divested companies - 384 - 293 - 513 - 604
Cash flow from investing activities - 5 187 3 575 - 17 456 - 26 218
Cash flow before financing activities 1 566 11 062 22 690 13 194
—
Financing activities
Changes in short-term investments - 13 022 - 10 477 - 19 921 - 22 466
Changes in loans to owners of non-controlling interests in foreign Group companies 59 - 359 - 1 109 - 691
Loans raised2 10 806 3 194 21 259 28 871
Amortisation of other debt - 11 523 - 6 346 - 29 024 - 34 201
Divestment of shares in Group companies to owners of non-controlling interests — — 491 491
Redemption of Hybrid Capital - 4 514 — — - 4 514
Issue of Hybrid Capital 15 152 — — 15 152
Dividends paid to owners — — - 104 - 104
Contribution from owners of non-controlling interests 836 233 1 912 2 515
Cash flow from financing activities - 2 206 - 13 755 - 26 496 - 14 947 — Cash flow for the period - 640 - 2 693 - 3 806 - 1 753
Vattenfall Interim Report January-March 2015 23
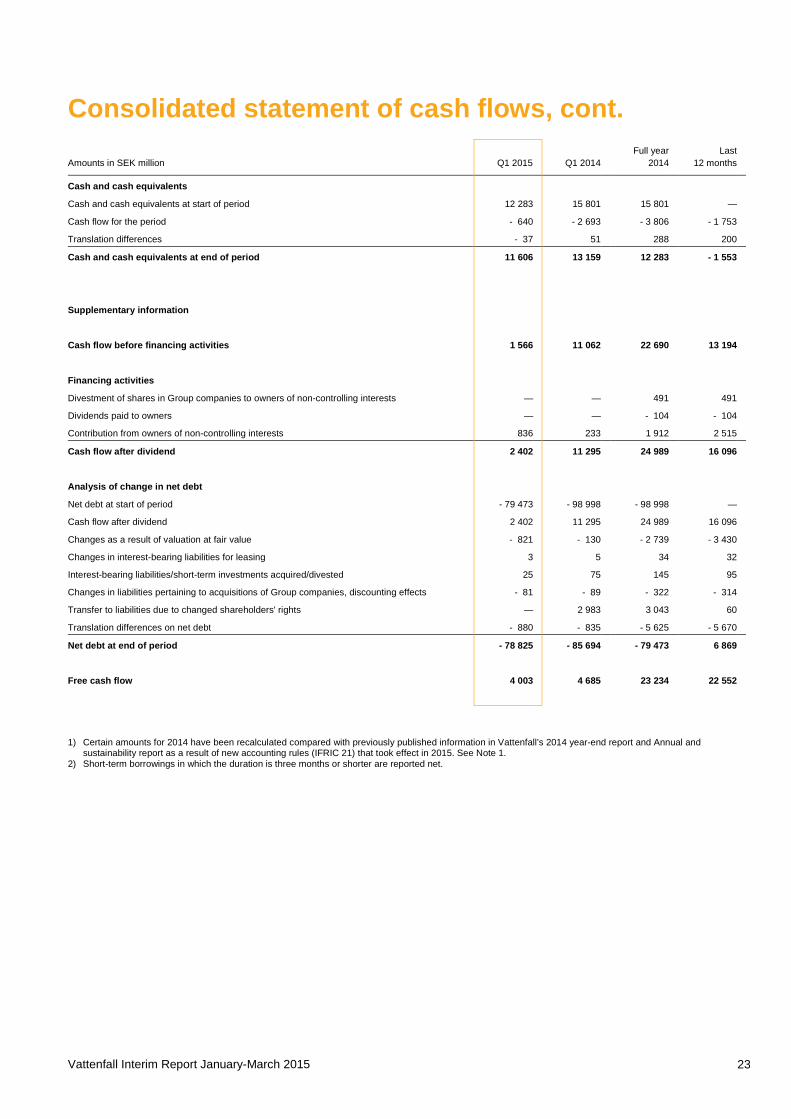
Consolidated statement of cash flows, cont. Full year Last
Amounts in SEK million Q1 2015 Q1 2014 2014 12 months Cash and cash equivalents
Cash and cash equivalents at start of period 12 283 15 801 15 801 —
Cash flow for the period - 640 - 2 693 - 3 806 - 1 753
Translation differences - 37 51 288 200
Cash and cash equivalents at end of period 11 606 13 159 12 283 - 1 553
Supplementary information
Cash flow before financing activities 1 566 11 062 22 690 13 194
Financing activities
Divestment of shares in Group companies to owners of non-controlling interests — — 491 491
Dividends paid to owners — — - 104 - 104
Contribution from owners of non-controlling interests 836 233 1 912 2 515
Cash flow after dividend 2 402 11 295 24 989 16 096
Analysis of change in net debt
Net debt at start of period - 79 473 - 98 998 - 98 998 —
Cash flow after dividend 2 402 11 295 24 989 16 096
Changes as a result of valuation at fair value - 821 - 130 - 2 739 - 3 430
Changes in interest-bearing liabilities for leasing 3 5 34 32
Interest-bearing liabilities/short-term investments acquired/divested 25 75 145 95
Changes in liabilities pertaining to acquisitions of Group companies, discounting effects - 81 - 89 - 322 - 314
Transfer to liabilities due to changed shareholders' rights — 2 983 3 043 60
Translation differences on net debt - 880 - 835 - 5 625 - 5 670
Net debt at end of period - 78 825 - 85 694 - 79 473 6 869
Free cash flow 4 003 4 685 23 234 22 552
1) Certain amounts for 2014 have been recalculated compared with previously published information in Vattenfall’s 2014 year-end report and Annual and sustainability report as a result of new accounting rules (IFRIC 21) that took effect in 2015. See Note 1.
2) Short-term borrowings in which the duration is three months or shorter are reported net.
Vattenfall Interim Report January-March 2015 24
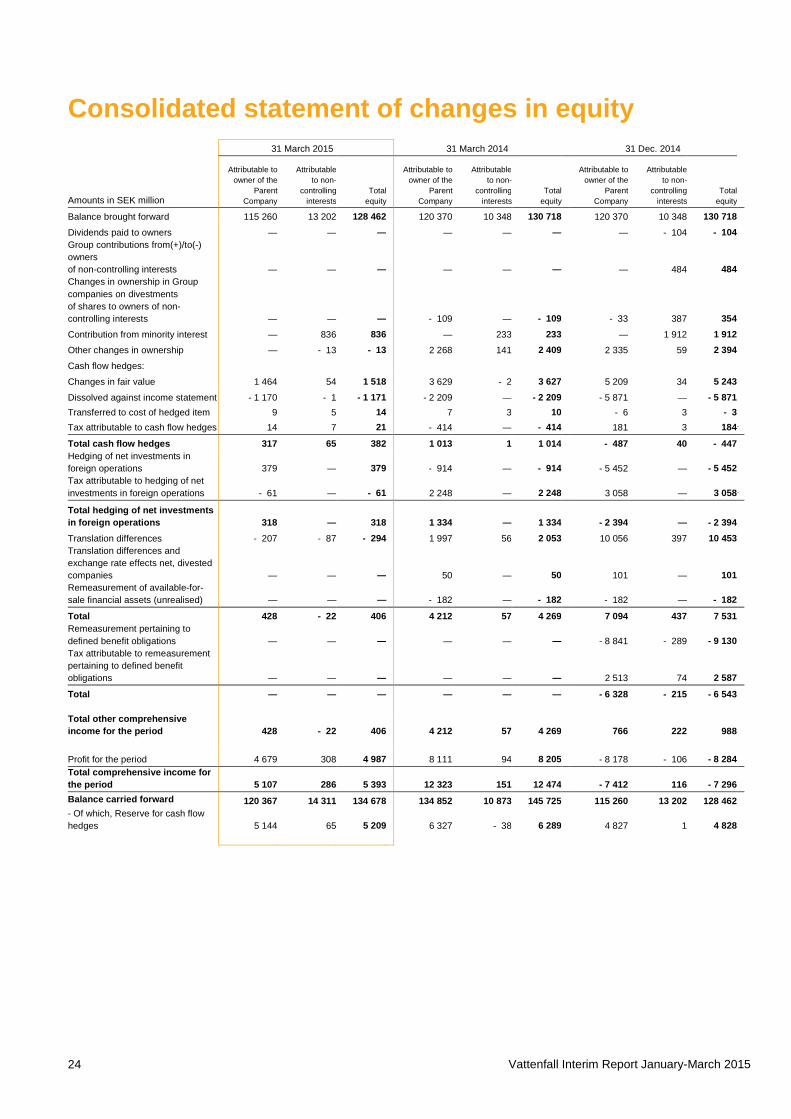
Consolidated statement of changes in equity 31 March 2015 31 March 2014 31 Dec. 2014
Amounts in SEK million
Attributable to owner of the
Parent Company
Attributable to non-
controlling interests
Total equity
Attributable to owner of the
Parent Company
Attributable to non-
controlling interests
Total equity
Attributable to owner of the
Parent Company
Attributable to non-
controlling interests
Total equity
Balance brought forward 115 260 13 202 128 462 120 370 10 348 130 718 120 370 10 348 130 718 Dividends paid to owners — — — — — — — - 104 - 104 Group contributions from(+)/to(-) owners of non-controlling interests — — — — — — — 484 484 Changes in ownership in Group companies on divestments of shares to owners of non-controlling interests — — — - 109 — - 109 - 33 387 354 Contribution from minority interest — 836 836 — 233 233 — 1 912 1 912 Other changes in ownership — - 13 - 13 2 268 141 2 409 2 335 59 2 394 Cash flow hedges:
Changes in fair value 1 464 54 1 518 3 629 - 2 3 627 5 209 34 5 243 Dissolved against income statement - 1 170 - 1 - 1 171 - 2 209 — - 2 209 - 5 871 — - 5 871 Transferred to cost of hedged item 9 5 14 7 3 10 - 6 3 - 3 Tax attributable to cash flow hedges 14 7 21 - 414 — - 414 181 3 184
Total cash flow hedges 317 65 382 1 013 1 1 014 - 487 40 - 447 Hedging of net investments in foreign operations 379 — 379 - 914 — - 914 - 5 452 — - 5 452 Tax attributable to hedging of net investments in foreign operations - 61 — - 61 2 248 — 2 248 3 058 — 3 058
Total hedging of net investments in foreign operations 318 — 318 1 334 — 1 334 - 2 394 — - 2 394 Translation differences - 207 - 87 - 294 1 997 56 2 053 10 056 397 10 453 Translation differences and exchange rate effects net, divested companies — — — 50 — 50 101 — 101 Remeasurement of available-for-sale financial assets (unrealised) — — — - 182 — - 182 - 182 — - 182
Total 428 - 22 406 4 212 57 4 269 7 094 437 7 531 Remeasurement pertaining to defined benefit obligations — — — — — — - 8 841 - 289 - 9 130 Tax attributable to remeasurement pertaining to defined benefit obligations — — — — — — 2 513 74 2 587
Total — — — — — — - 6 328 - 215 - 6 543
Total other comprehensive income for the period 428 - 22 406 4 212 57 4 269 766 222 988
Profit for the period 4 679 308 4 987 8 111 94 8 205 - 8 178 - 106 - 8 284 Total comprehensive income for the period 5 107 286 5 393 12 323 151 12 474 - 7 412 116 - 7 296 Balance carried forward 120 367 14 311 134 678 134 852 10 873 145 725 115 260 13 202 128 462 - Of which, Reserve for cash flow hedges 5 144 65 5 209 6 327 - 38 6 289 4 827 1 4 828
Vattenfall Interim Report January-March 2015 25
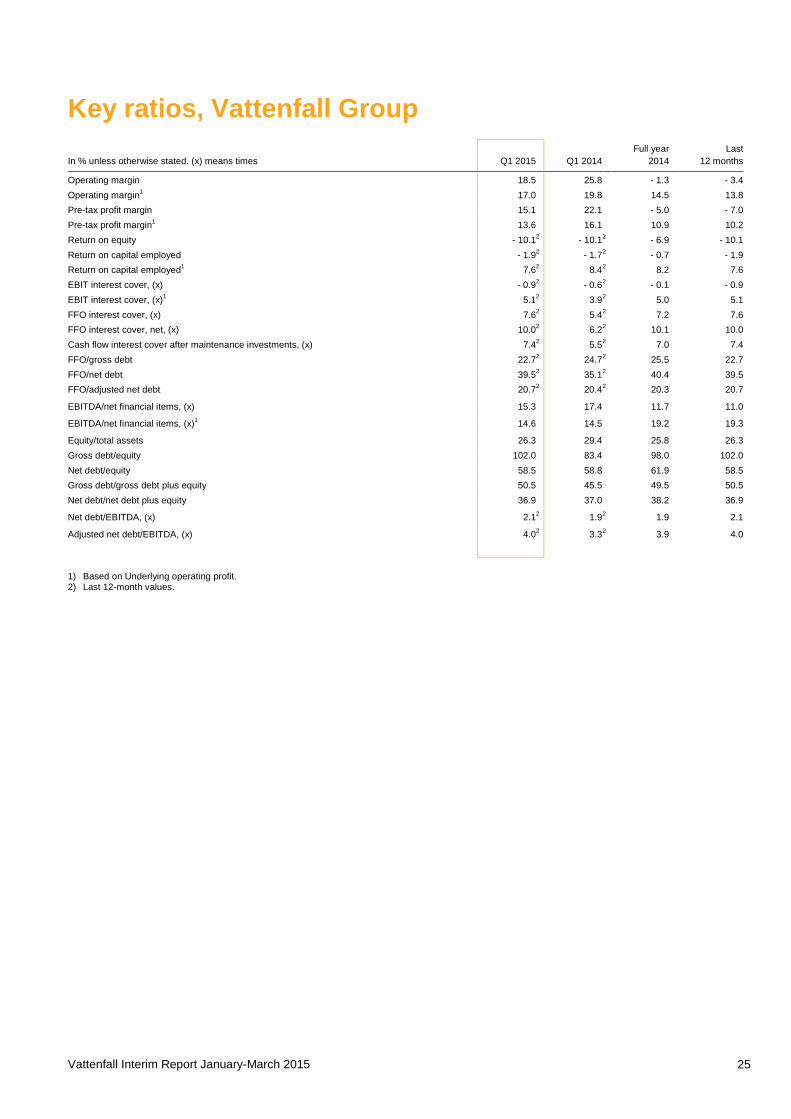
Key ratios, Vattenfall Group
Full year
Last
In % unless otherwise stated. (x) means times Q1 2015 Q1 2014 2014 12 months
Operating margin 18.5 25.8
- 1.3
- 3.4 Operating margin1 17.0 19.8
14.5
13.8
Pre-tax profit margin 15.1 22.1
- 5.0
- 7.0 Pre-tax profit margin1 13.6 16.1
10.9
10.2
Return on equity - 10.1 2 - 10.1 2 - 6.9
- 10.1 Return on capital employed - 1.9 2 - 1.7 2 - 0.7
- 1.9
Return on capital employed1 7.6 2 8.4 2 8.2
7.6 EBIT interest cover, (x) - 0.9 2 - 0.6 2 - 0.1
- 0.9
EBIT interest cover, (x)1 5.1 2 3.9 2 5.0
5.1 FFO interest cover, (x) 7.6 2 5.4 2 7.2
7.6
FFO interest cover, net, (x) 10.0 2 6.2 2 10.1
10.0 Cash flow interest cover after maintenance investments, (x) 7.4 2 5.5 2 7.0
7.4
FFO/gross debt 22.7 2 24.7 2 25.5
22.7 FFO/net debt 39.5 2 35.1 2 40.4
39.5
FFO/adjusted net debt 20.7 2 20.4 2 20.3
20.7
EBITDA/net financial items, (x) 15.3 17.4
11.7
11.0
EBITDA/net financial items, (x)1 14.6 14.5
19.2
19.3
Equity/total assets 26.3 29.4
25.8
26.3 Gross debt/equity 102.0 83.4
98.0
102.0
Net debt/equity 58.5 58.8
61.9
58.5 Gross debt/gross debt plus equity 50.5 45.5
49.5
50.5
Net debt/net debt plus equity 36.9 37.0
38.2
36.9
Net debt/EBITDA, (x) 2.1 2 1.9 2 1.9
2.1
Adjusted net debt/EBITDA, (x) 4.0 2 3.3 2 3.9
4.0
1) Based on Underlying operating profit. 2) Last 12-month values.
Vattenfall Interim Report January-March 2015 26
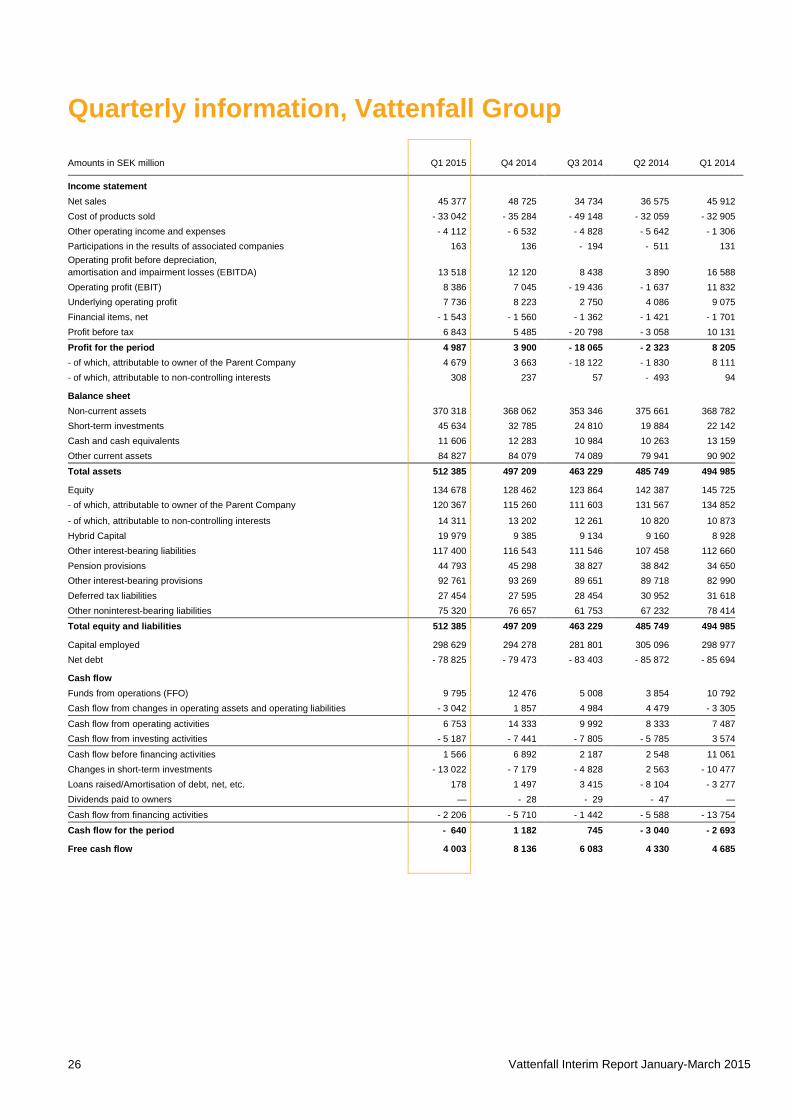
Quarterly information, Vattenfall Group
Amounts in SEK million Q1 2015 Q4 2014 Q3 2014 Q2 2014 Q1 2014
Income statement Net sales 45 377
48 725 34 734 36 575 45 912
Cost of products sold - 33 042
- 35 284 - 49 148 - 32 059 - 32 905 Other operating income and expenses - 4 112
- 6 532 - 4 828 - 5 642 - 1 306
Participations in the results of associated companies 163
136 - 194 - 511 131 Operating profit before depreciation, amortisation and impairment losses (EBITDA) 13 518
12 120 8 438 3 890 16 588
Operating profit (EBIT) 8 386
7 045 - 19 436 - 1 637 11 832 Underlying operating profit 7 736
8 223 2 750 4 086 9 075
Financial items, net - 1 543
- 1 560 - 1 362 - 1 421 - 1 701 Profit before tax 6 843 5 485 - 20 798 - 3 058 10 131
Profit for the period 4 987
3 900 - 18 065 - 2 323 8 205 - of which, attributable to owner of the Parent Company 4 679
3 663 - 18 122 - 1 830 8 111
- of which, attributable to non-controlling interests 308 237 57 - 493 94
Balance sheet
Non-current assets 370 318
368 062 353 346 375 661 368 782
Short-term investments 45 634
32 785 24 810 19 884 22 142 Cash and cash equivalents 11 606
12 283 10 984 10 263 13 159
Other current assets 84 827 84 079 74 089 79 941 90 902
Total assets 512 385
497 209 463 229 485 749 494 985
Equity 134 678
128 462 123 864 142 387 145 725 - of which, attributable to owner of the Parent Company 120 367
115 260 111 603 131 567 134 852
- of which, attributable to non-controlling interests 14 311 13 202 12 261 10 820 10 873 Hybrid Capital 19 979
9 385 9 134 9 160 8 928
Other interest-bearing liabilities 117 400
116 543 111 546 107 458 112 660 Pension provisions 44 793
45 298 38 827 38 842 34 650
Other interest-bearing provisions 92 761
93 269 89 651 89 718 82 990 Deferred tax liabilities 27 454
27 595 28 454 30 952 31 618
Other noninterest-bearing liabilities 75 320 76 657 61 753 67 232 78 414
Total equity and liabilities 512 385
497 209 463 229 485 749 494 985
Capital employed 298 629
294 278 281 801 305 096 298 977 Net debt - 78 825
- 79 473 - 83 403 - 85 872 - 85 694
Cash flow
Funds from operations (FFO) 9 795
12 476 5 008 3 854 10 792
Cash flow from changes in operating assets and operating liabilities - 3 042
1 857 4 984 4 479 - 3 305
Cash flow from operating activities 6 753 14 333 9 992 8 333 7 487 Cash flow from investing activities - 5 187
- 7 441 - 7 805 - 5 785 3 574
Cash flow before financing activities 1 566 6 892 2 187 2 548 11 061 Changes in short-term investments - 13 022
- 7 179 - 4 828 2 563 - 10 477
Loans raised/Amortisation of debt, net, etc. 178
1 497 3 415 - 8 104 - 3 277 Dividends paid to owners — - 28 - 29 - 47 —
Cash flow from financing activities - 2 206 - 5 710 - 1 442 - 5 588 - 13 754
Cash flow for the period - 640
1 182 745 - 3 040 - 2 693
Free cash flow 4 003 8 136 6 083 4 330 4 685
Vattenfall Interim Report January-March 2015 27
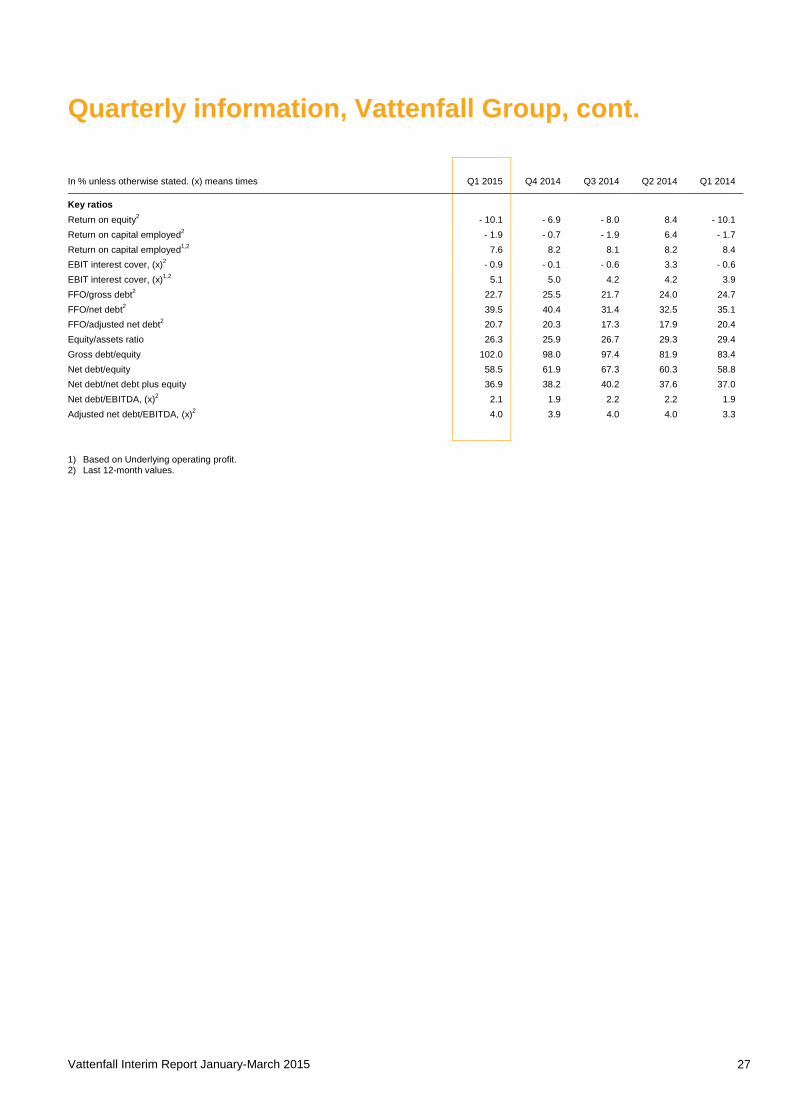
Quarterly information, Vattenfall Group, cont.
In % unless otherwise stated. (x) means times Q1 2015 Q4 2014 Q3 2014 Q2 2014 Q1 2014
Key ratios
Return on equity2 - 10.1 - 6.9 - 8.0 8.4 - 10.1 Return on capital employed2 - 1.9 - 0.7 - 1.9 6.4 - 1.7 Return on capital employed1,2 7.6 8.2 8.1 8.2 8.4 EBIT interest cover, (x)2 - 0.9 - 0.1 - 0.6 3.3 - 0.6 EBIT interest cover, (x)1,2 5.1 5.0 4.2 4.2 3.9 FFO/gross debt2 22.7 25.5 21.7 24.0 24.7 FFO/net debt2 39.5 40.4 31.4 32.5 35.1 FFO/adjusted net debt2 20.7 20.3 17.3 17.9 20.4 Equity/assets ratio 26.3 25.9 26.7 29.3 29.4 Gross debt/equity 102.0 98.0 97.4 81.9 83.4 Net debt/equity 58.5 61.9 67.3 60.3 58.8 Net debt/net debt plus equity 36.9 38.2 40.2 37.6 37.0 Net debt/EBITDA, (x)2 2.1 1.9 2.2 2.2 1.9 Adjusted net debt/EBITDA, (x)2 4.0 3.9 4.0 4.0 3.3
1) Based on Underlying operating profit. 2) Last 12-month values.
Vattenfall Interim Report January-March 2015 28
Note 1 Accounting policies, risks and uncertainties
Accounting policies The consolidated accounts for 2015 have been prepared, as for the 2014 year-end accounts, in accordance with International Financial Reporting Standards (IFRS) as endorsed by the European Commission for application within the EU, and the Swedish Annual Accounts Act. This interim report for the Group has been prepared in accordance with IAS 34 – Interim Financial Reporting, and the Swedish Annual Accounts Act. The accounting policies and calculation methods applied in this interim report are the same as those described in Vattenfall’s 2014 Annual and sustainability report (Note 3 to the consolidated accounts), except for the amended IFRSs endorsed by the EU and described below, which are effective as of the 2015 financial year.
IFRIC 21 – Levies. The interpretation clarifies when a liability for levies should be recognised. Levies are fees and taxes charged to companies by government authorities in accordance with laws and regulations, except income taxes, penalties and fines. The interpretation clarifies that a liability should be recognised when a company has an obligation to pay due to a past event. A liability is recognised progressively if the obligating event occurs over a period of time. If an obligation to pay a levy is triggered when a minimum threshold is reached, the liability is not recognised until the minimum threshold is reached. The interpretation has had only a marginal effect on Vattenfall’s financial statements. For Vattenfall, application of IFRIC 21 has entailed that property tax in Sweden is expensed in its entirety as per 1 January 2015 by just under SEK 3 billion, and that tax on the thermal effect in Sweden has been expensed in an amount just under SEK 0.8 billion, resulting in an increase in the balance sheet total as per this date by SEK 3.7 billion. Previously, the liability for Swedish property tax was recognised gradually during the year. The balance sheets for 2014 have been recalculated as a result of application of IFRIC 21. The balance sheet has been adjusted by SEK 2.8 billion as per 31 March 2014 and by SEK 0.8 billion as per 31 December 2014.
Amendments to IAS 19 – Defined Benefit Plans: Employee Contributions, include clarifications on how contributions to a pension plan from employees or third parties should be recognised. The clarifications have not changed the way Vattenfall recognises these fees.
Annual improvements to IFRSs 2010–2012 Cycle and Annual improvements to IFRSs 2011–2013 Cycle aim to streamline and clarify the accounting standards concerning presentation, recognition and measurement, including changes in terminology and amendments of an editorial nature. The amendments have not had any significant effect on Vattenfall’s financial statements.
Risks and uncertainties For a description of risks, uncertainties and risk management, please refer to Vattenfall’s 2014 Annual and sustainability report, pages 66-72. No other material changes have taken place since publication of the 2014 Annual and sustainability report.
Other Significant related-party transactions are described in Note 55 to the consolidated accounts in Vattenfall’s 2014 Annual and sustainability report. No material changes have taken place in relations or transactions with related parties compared with the description in the 2014 Annual and sustainability report.
Vattenfall Interim Report January-March 2015 29
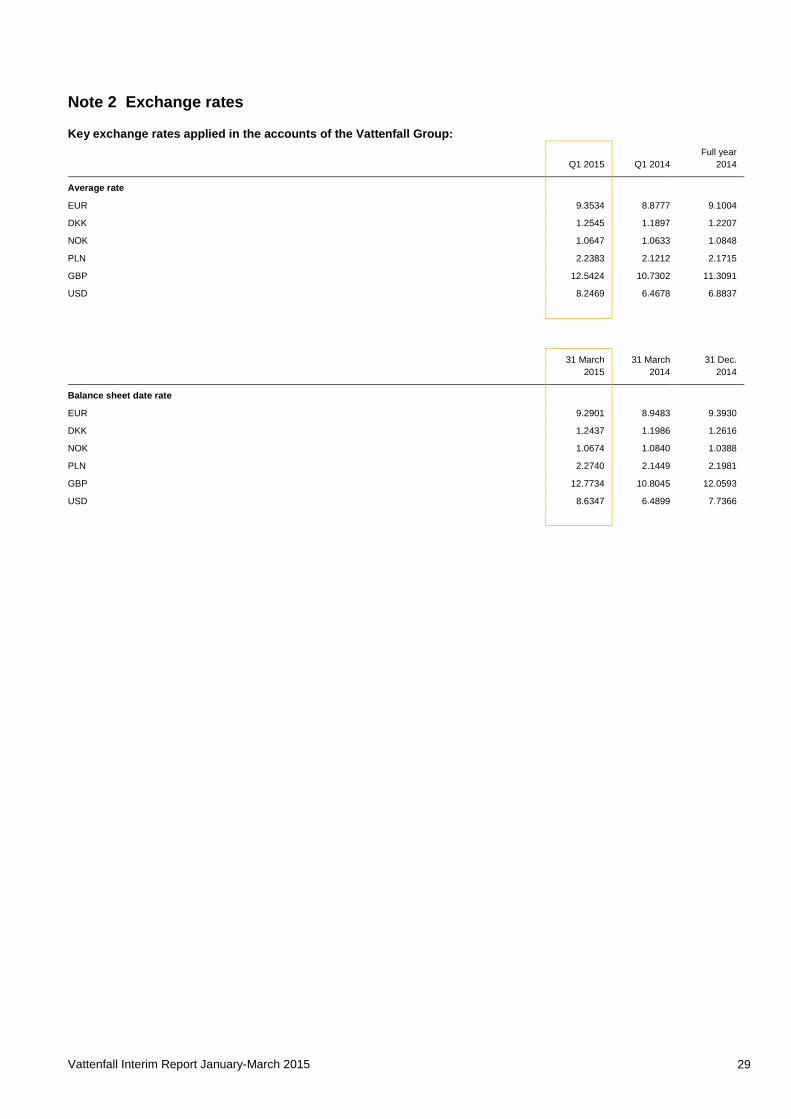
Note 2 Exchange rates
Key exchange rates applied in the accounts of the Vattenfall Group: Full year
Q1 2015 Q1 2014 2014 Average rate
EUR 9.3534 8.8777 9.1004
DKK 1.2545 1.1897 1.2207
NOK 1.0647 1.0633 1.0848
PLN 2.2383 2.1212 2.1715
GBP 12.5424 10.7302 11.3091
USD 8.2469 6.4678 6.8837
31 March 31 March 31 Dec.
2015 2014 2014 Balance sheet date rate
EUR 9.2901 8.9483 9.3930
DKK 1.2437 1.1986 1.2616
NOK 1.0674 1.0840 1.0388
PLN 2.2740 2.1449 2.1981
GBP 12.7734 10.8045 12.0593
USD 8.6347 6.4899 7.7366
Vattenfall Interim Report January-March 2015 30
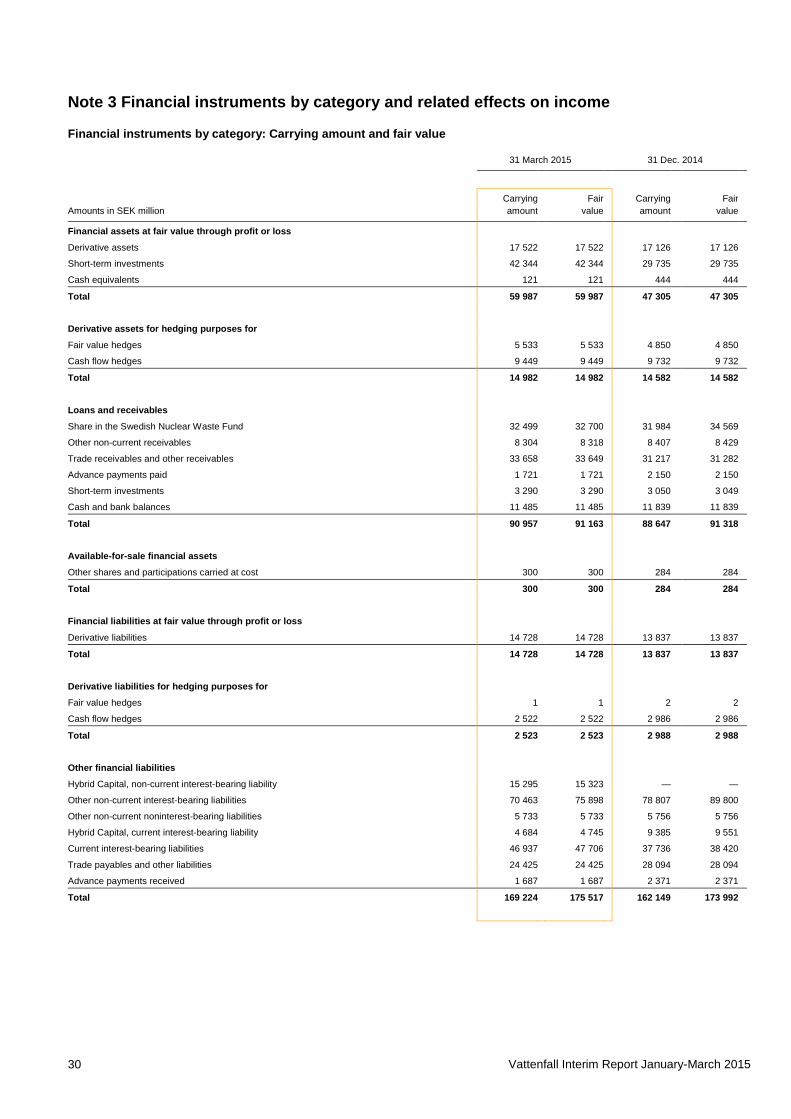
Note 3 Financial instruments by category and related effects on income
Financial instruments by category: Carrying amount and fair value 31 March 2015 31 Dec. 2014
Carrying Fair Carrying Fair Amounts in SEK million amount value amount value Financial assets at fair value through profit or loss Derivative assets 17 522
17 522 17 126 17 126
Short-term investments 42 344
42 344 29 735 29 735 Cash equivalents 121 121 444 444 Total 59 987 59 987 47 305 47 305
Derivative assets for hedging purposes for
Fair value hedges 5 533
5 533 4 850 4 850
Cash flow hedges 9 449 9 449 9 732 9 732 Total 14 982
14 982 14 582 14 582
Loans and receivables
Share in the Swedish Nuclear Waste Fund 32 499
32 700 31 984 34 569 Other non-current receivables 8 304
8 318 8 407 8 429
Trade receivables and other receivables 33 658
33 649 31 217 31 282 Advance payments paid 1 721
1 721 2 150 2 150
Short-term investments 3 290
3 290 3 050 3 049 Cash and bank balances 11 485 11 485 11 839 11 839 Total 90 957
91 163 88 647 91 318
Available-for-sale financial assets
Other shares and participations carried at cost 300 300 284 284 Total 300
300 284 284
Financial liabilities at fair value through profit or loss
Derivative liabilities 14 728 14 728 13 837 13 837 Total 14 728
14 728 13 837 13 837
Derivative liabilities for hedging purposes for
Fair value hedges 1
1 2 2 Cash flow hedges 2 522 2 522 2 986 2 986 Total 2 523
2 523 2 988 2 988
Other financial liabilities
Hybrid Capital, non-current interest-bearing liability 15 295
15 323 — — Other non-current interest-bearing liabilities 70 463
75 898 78 807 89 800
Other non-current noninterest-bearing liabilities 5 733
5 733 5 756 5 756 Hybrid Capital, current interest-bearing liability 4 684
4 745 9 385 9 551
Current interest-bearing liabilities 46 937
47 706 37 736 38 420 Trade payables and other liabilities 24 425
24 425 28 094 28 094
Advance payments received 1 687 1 687 2 371 2 371 Total 169 224 175 517 162 149 173 992
Vattenfall Interim Report January-March 2015 31
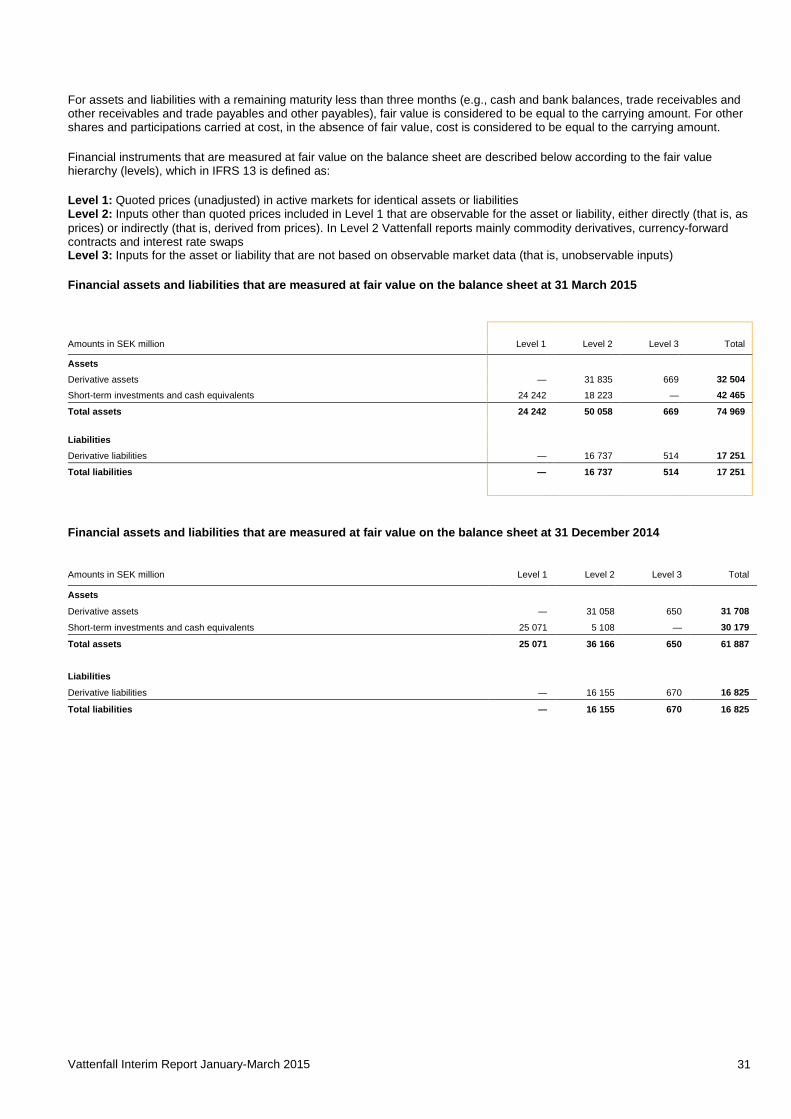
For assets and liabilities with a remaining maturity less than three months (e.g., cash and bank balances, trade receivables and other receivables and trade payables and other payables), fair value is considered to be equal to the carrying amount. For other shares and participations carried at cost, in the absence of fair value, cost is considered to be equal to the carrying amount.
Financial instruments that are measured at fair value on the balance sheet are described below according to the fair value hierarchy (levels), which in IFRS 13 is defined as:
Level 1: Quoted prices (unadjusted) in active markets for identical assets or liabilities Level 2: Inputs other than quoted prices included in Level 1 that are observable for the asset or liability, either directly (that is, as prices) or indirectly (that is, derived from prices). In Level 2 Vattenfall reports mainly commodity derivatives, currency-forward contracts and interest rate swaps Level 3: Inputs for the asset or liability that are not based on observable market data (that is, unobservable inputs)
Financial assets and liabilities that are measured at fair value on the balance sheet at 31 March 2015
Amounts in SEK million Level 1 Level 2 Level 3 Total
Assets
Derivative assets —
31 835
669 32 504
Short-term investments and cash equivalents 24 242 18 223 — 42 465
Total assets 24 242
50 058
669 74 969
Liabilities
Derivative liabilities — 16 737 514 17 251
Total liabilities — 16 737 514 17 251
Financial assets and liabilities that are measured at fair value on the balance sheet at 31 December 2014
Amounts in SEK million Level 1 Level 2 Level 3 Total Assets Derivative assets — 31 058 650 31 708 Short-term investments and cash equivalents 25 071 5 108 — 30 179 Total assets 25 071 36 166 650 61 887 Liabilities Derivative liabilities — 16 155 670 16 825 Total liabilities — 16 155 670 16 825
Vattenfall Interim Report January-March 2015 32
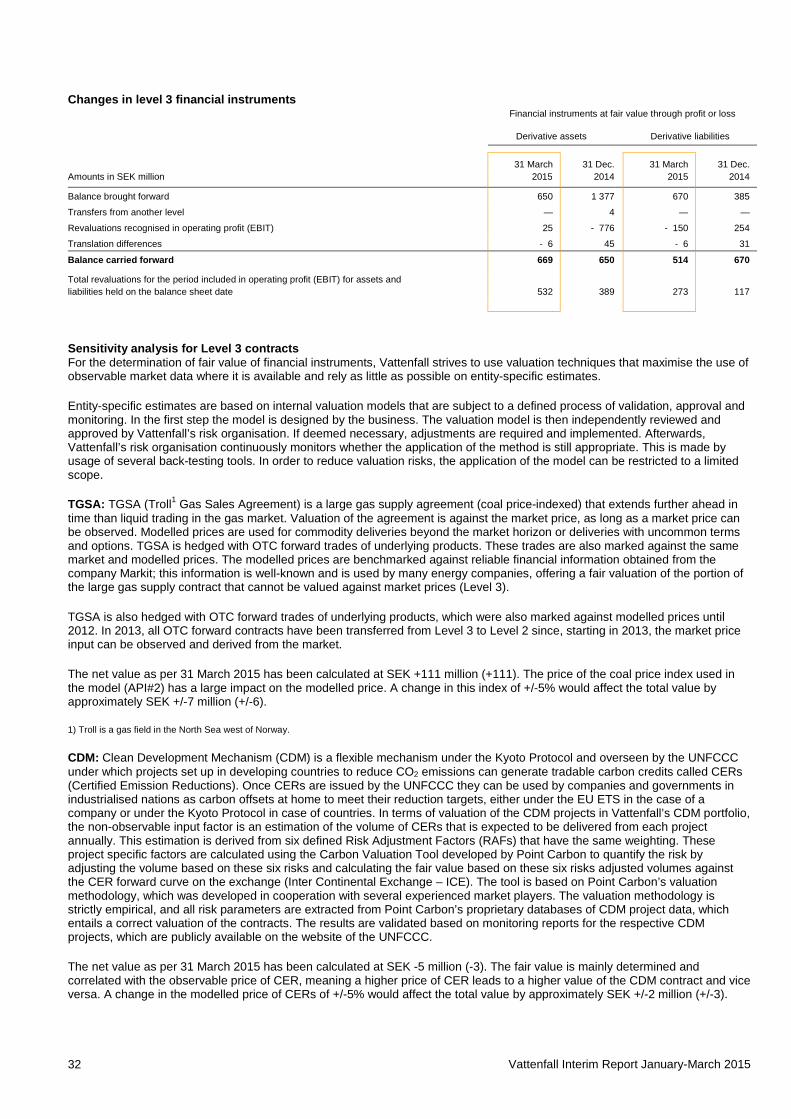
Changes in level 3 financial instruments Financial instruments at fair value through profit or loss
Derivative assets Derivative liabilities
31 March 31 Dec. 31 March 31 Dec.
Amounts in SEK million 2015 2014 2015 2014
Balance brought forward 650 1 377 670 385
Transfers from another level — 4 — —
Revaluations recognised in operating profit (EBIT) 25 - 776 - 150 254
Translation differences - 6 45 - 6 31
Balance carried forward 669 650 514 670
Total revaluations for the period included in operating profit (EBIT) for assets and liabilities held on the balance sheet date 532 389 273 117
Sensitivity analysis for Level 3 contracts For the determination of fair value of financial instruments, Vattenfall strives to use valuation techniques that maximise the use of observable market data where it is available and rely as little as possible on entity-specific estimates.
Entity-specific estimates are based on internal valuation models that are subject to a defined process of validation, approval and monitoring. In the first step the model is designed by the business. The valuation model is then independently reviewed and approved by Vattenfall’s risk organisation. If deemed necessary, adjustments are required and implemented. Afterwards, Vattenfall’s risk organisation continuously monitors whether the application of the method is still appropriate. This is made by usage of several back-testing tools. In order to reduce valuation risks, the application of the model can be restricted to a limited scope.
TGSA: TGSA (Troll1 Gas Sales Agreement) is a large gas supply agreement (coal price-indexed) that extends further ahead in time than liquid trading in the gas market. Valuation of the agreement is against the market price, as long as a market price can be observed. Modelled prices are used for commodity deliveries beyond the market horizon or deliveries with uncommon terms and options. TGSA is hedged with OTC forward trades of underlying products. These trades are also marked against the same market and modelled prices. The modelled prices are benchmarked against reliable financial information obtained from the company Markit; this information is well-known and is used by many energy companies, offering a fair valuation of the portion of the large gas supply contract that cannot be valued against market prices (Level 3).
TGSA is also hedged with OTC forward trades of underlying products, which were also marked against modelled prices until 2012. In 2013, all OTC forward contracts have been transferred from Level 3 to Level 2 since, starting in 2013, the market price input can be observed and derived from the market.
The net value as per 31 March 2015 has been calculated at SEK +111 million (+111). The price of the coal price index used in the model (API#2) has a large impact on the modelled price. A change in this index of +/-5% would affect the total value by approximately SEK +/-7 million (+/-6).
1) Troll is a gas field in the North Sea west of Norway.
CDM: Clean Development Mechanism (CDM) is a flexible mechanism under the Kyoto Protocol and overseen by the UNFCCC under which projects set up in developing countries to reduce CO2 emissions can generate tradable carbon credits called CERs (Certified Emission Reductions). Once CERs are issued by the UNFCCC they can be used by companies and governments in industrialised nations as carbon offsets at home to meet their reduction targets, either under the EU ETS in the case of a company or under the Kyoto Protocol in case of countries. In terms of valuation of the CDM projects in Vattenfall’s CDM portfolio, the non-observable input factor is an estimation of the volume of CERs that is expected to be delivered from each project annually. This estimation is derived from six defined Risk Adjustment Factors (RAFs) that have the same weighting. These project specific factors are calculated using the Carbon Valuation Tool developed by Point Carbon to quantify the risk by adjusting the volume based on these six risks and calculating the fair value based on these six risks adjusted volumes against the CER forward curve on the exchange (Inter Continental Exchange – ICE). The tool is based on Point Carbon’s valuation methodology, which was developed in cooperation with several experienced market players. The valuation methodology is strictly empirical, and all risk parameters are extracted from Point Carbon’s proprietary databases of CDM project data, which entails a correct valuation of the contracts. The results are validated based on monitoring reports for the respective CDM projects, which are publicly available on the website of the UNFCCC.
The net value as per 31 March 2015 has been calculated at SEK -5 million (-3). The fair value is mainly determined and correlated with the observable price of CER, meaning a higher price of CER leads to a higher value of the CDM contract and vice versa. A change in the modelled price of CERs of +/-5% would affect the total value by approximately SEK +/-2 million (+/-3).
Vattenfall Interim Report January-March 2015 33
Long-term electricity contracts: Vattenfall has long-term electricity contracts with a customer extending until 2019 that include embedded derivatives in which the electricity price for the customer is coupled to the price development of aluminium and exchange rate movements of the Norwegian krone (NOK) in relation to the US dollar (USD). Reliable market quotations for aluminium are available for a period of 27 months forward in time. Vattenfall has estimated that the use of modelled prices provides reliable values for valuation of the period beyond 27 months, that is, the time horizon during which market quotations are not available until the contracts’ expiration date. For modelling the prices, a Monte-Carlo simulation is used. Valuation is done on a monthly basis. The value of the embedded derivative is defined as the difference between the total contract value and the fair value of a fixed price agreement concluded at the same time and for same time horizon as the actual contract was concluded. Furthermore, changes in fair value are analysed every month by comparing changes in market price for aluminium and the USD/NOK exchange rate.
The value as per 31 March 2015 has been calculated at SEK +78 million (+99). The price of aluminium is the factor that has the greatest bearing on the modelled price. An increase of the price for aluminium leads to a higher fair value and vice versa. A change in the price of aluminium of +/-5% would affect the total value by approximately SEK +/-45 million (+/-48).
Virtual Gas Storage contracts: A virtual gas storage contract is a contract, that allows Vattenfall to store gas without owning a gas storage facility. The virtual gas storage contracts include constraints to the maximum storage capacity and the maximum injection and withdrawal per day. The valuation of the contract is based on the storage, injections and withdrawal fees included in the contract, the expected spread between gas prices in the summer and winter which is observable and the optionality value, which is marked to model (Level 3). The valuation methodology is based on a backward estimation of the value of the contracts under different price and operational scenarios and a forward step that selects the optimal exercise. The price scenarios are based on simulating the forward prices until the beginning of their respective delivery periods and the simulation of the daily spot prices during the delivery period. The spot prices are simulated using the forward prices as a starting point. Finally, the spot volatility is calibrated using three years of historical data. The valuation models and calibration of the valuation models are approved and validated by Vattenfall’s risk organisation.
The net value as per 31 March 2015 has been calculated at SEK 105 million (+97) and is most sensitive to the optionality volatility. A change in the value of the daily volatility of +/-5% would affect the total value by approximately +/- SEK 10 million (+/-69).
Gas swing contracts: A gas swing contract is a contract that provides flexibility on the timing and amount of gas purchases. The contract is based on a price formula with a maximum and minimum annual and daily gas quantity. The valuation of the contract is based on observable price difference between the contract prices and indexes and the optional value, which is marked to model (Level 3). The valuation methodology is based on a backward estimation of the value of the contracts under different price and operational scenarios and a forward step that selects the optimal exercise. The price scenarios are based on simulating the forward prices until the beginning of their respective delivery periods and the simulation of the daily spot prices during the delivery period. The spot prices are simulated using the forward prices as a starting point. Finally, the spot volatility is calibrated using three years of historical data. The valuation models and calibration of the valuation models are approved and validated by Vattenfall’s risk organisation.
The net value as per 31 March 2015 has been calculated at SEK -133 million (-328) and is most sensitive to the optionality volatility. A change in the value of the daily volatility of +/-5% would affect the total value by approximately -/+ SEK 5 million (-/+8).
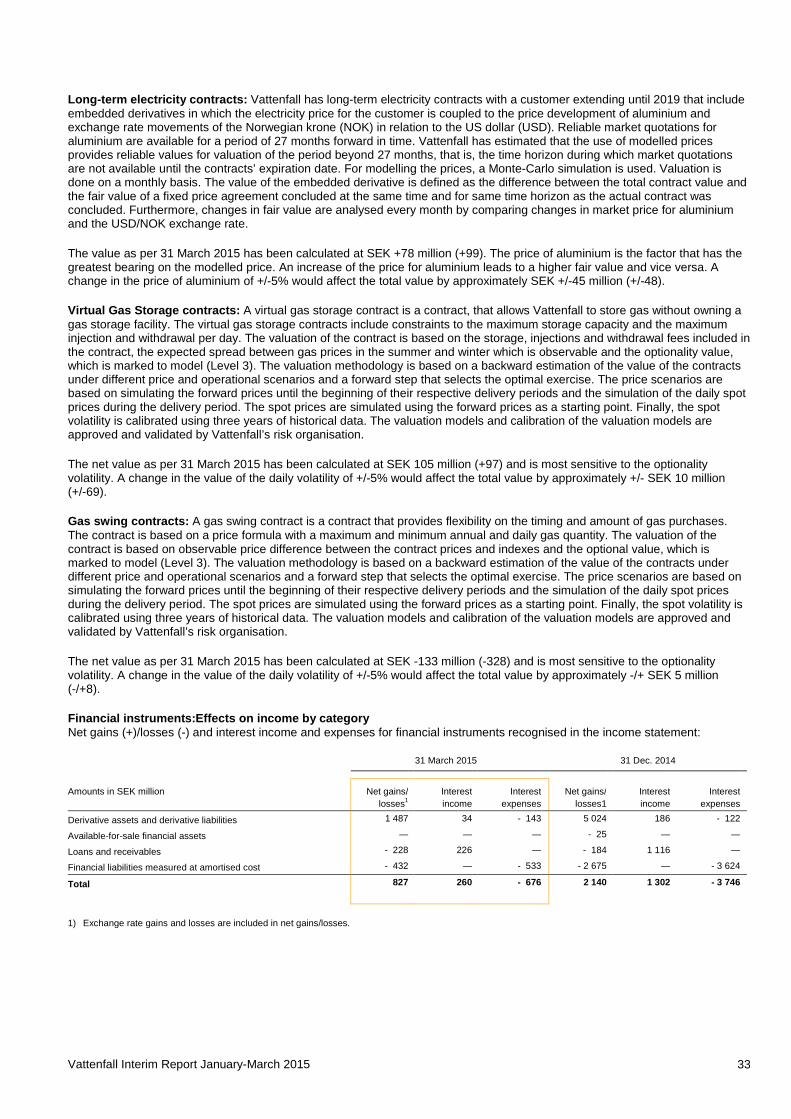
Financial instruments:Effects on income by category Net gains (+)/losses (-) and interest income and expenses for financial instruments recognised in the income statement:
31 March 2015 31 Dec. 2014
Amounts in SEK million Net gains/ losses1
Interest income
Interest expenses
Net gains/ losses1
Interest income
Interest expenses
Derivative assets and derivative liabilities 1 487 34 - 143 5 024 186 - 122
Available-for-sale financial assets — — — - 25 — —
Loans and receivables - 228 226 — - 184 1 116 —
Financial liabilities measured at amortised cost - 432 — - 533 - 2 675 — - 3 624
Total 827 260 - 676 2 140 1 302 - 3 746
1) Exchange rate gains and losses are included in net gains/losses.
Vattenfall Interim Report January-March 2015 34
The Parent Company Vattenfall AB Accounting policies The Parent Company Vattenfall AB’s accounts are prepared in accordance with the Swedish Annual Accounts Act and recommendation RFR 2 – Accounting for Legal Entities, issued by the Swedish Financial Reporting Board. The accounting policies used in this report are the same as those described in Vattenfall’s 2014 Annual and sustainability report (Note 2 to the Parent Company accounts).
Q1 2015 A condensed income statement and balance sheet for the Parent Company are presented below.
• Net sales amounted to SEK 8,677 million (8,888) • Profit before appropriations and tax was SEK 3,537 million (1,337) • Earnings were affected by the following:
o Dividends of SEK 2,363 million. o A small capital gain from the sale of entire shareholding in Övertorneå Värmeverk AB o A capital gain of SEK 59 million from the liquidation of Vattenfall VätterEl AB
• The balance sheet total was SEK 273,927 million (31 December: 267,526) • During the period, Vattenfall issued hybrid bonds of SEK 6 billion and EUR 1 billion, respectively (slightly more than SEK 15
billion combined. The aim was to refinance Vattenfall’s existing hybrid bond and to use the remaining for general corporate purposes. For more information see page 4, Important events Q1 2015
• Investments during the period amounted to SEK 40 million (32) • Cash and cash equivalents, and short-term investments amounted to SEK 49,550 million (31 December: 35,059)
Risks and uncertainties For a description of risks, uncertainties and risk management, please refer to Vattenfall’s 2014 Annual and sustainability report, pages 66-72. No material changes have taken place since publication of the 2014 Annual and sustainability report.
Other Significant related-party transactions are described in Note 39 to the Parent Company accounts in Vattenfall’s 2014 Annual and sustainability report. No material changes have taken place in relations or transactions with related parties compared with the description in the 2014 Annual and sustainability report.
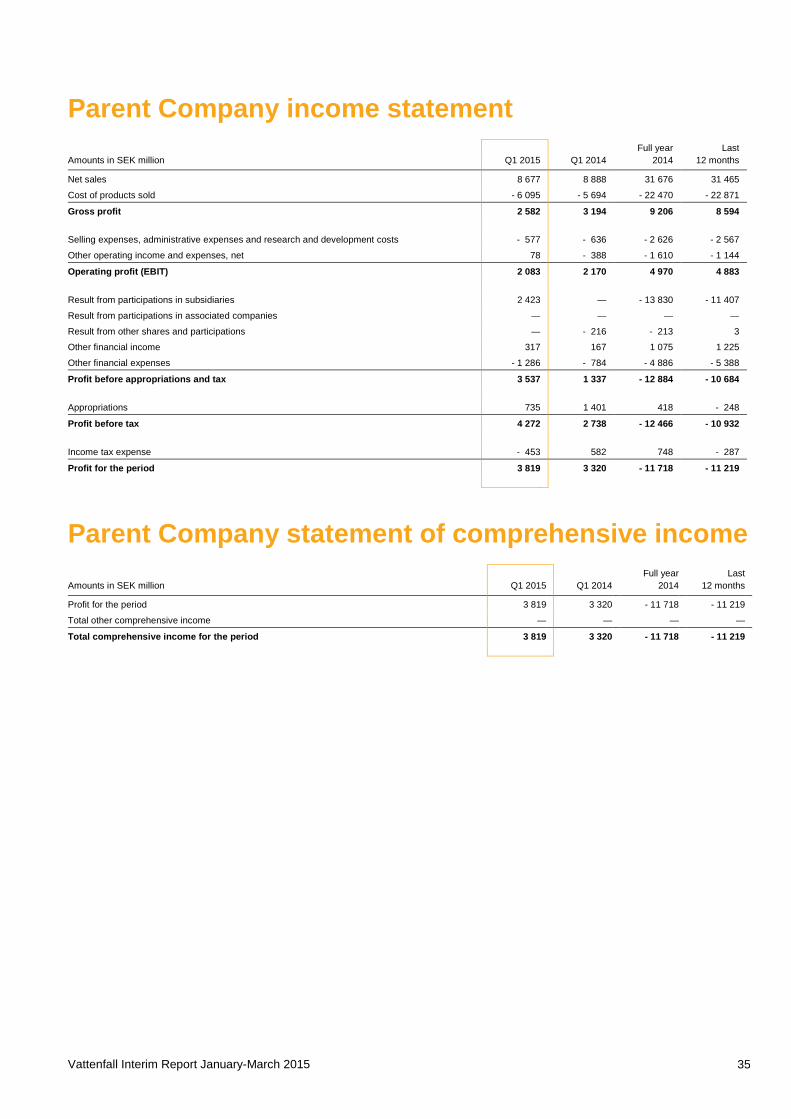
Vattenfall Interim Report January-March 2015 35
Parent Company income statement
Full year Last Amounts in SEK million Q1 2015 Q1 2014 2014 12 months
Net sales 8 677 8 888 31 676 31 465
Cost of products sold - 6 095 - 5 694 - 22 470 - 22 871
Gross profit 2 582 3 194 9 206 8 594
Selling expenses, administrative expenses and research and development costs - 577 - 636 - 2 626 - 2 567
Other operating income and expenses, net 78 - 388 - 1 610 - 1 144
Operating profit (EBIT) 2 083 2 170 4 970 4 883
Result from participations in subsidiaries 2 423 — - 13 830 - 11 407
Result from participations in associated companies — — — —
Result from other shares and participations — - 216 - 213 3
Other financial income 317 167 1 075 1 225
Other financial expenses - 1 286 - 784 - 4 886 - 5 388
Profit before appropriations and tax 3 537 1 337 - 12 884 - 10 684
Appropriations 735 1 401 418 - 248
Profit before tax 4 272 2 738 - 12 466 - 10 932
Income tax expense - 453 582 748 - 287
Profit for the period 3 819 3 320 - 11 718 - 11 219
Parent Company statement of comprehensive income
Full year Last Amounts in SEK million Q1 2015 Q1 2014 2014 12 months
Profit for the period 3 819 3 320 - 11 718 - 11 219 Total other comprehensive income — — — —
Total comprehensive income for the period 3 819 3 320 - 11 718 - 11 219
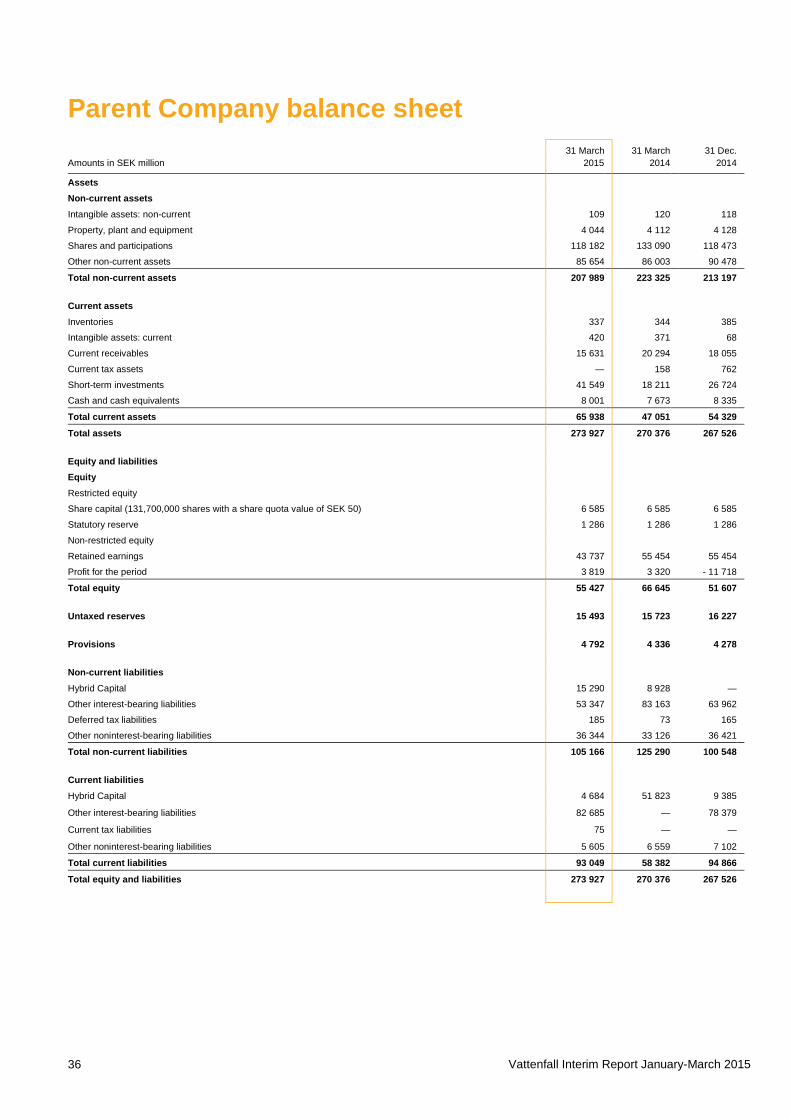
Vattenfall Interim Report January-March 2015 36
Parent Company balance sheet 31 March 31 March 31 Dec. Amounts in SEK million 2015 2014 2014
Assets
Non-current assets
Intangible assets: non-current 109 120 118
Property, plant and equipment 4 044 4 112 4 128
Shares and participations 118 182 133 090 118 473
Other non-current assets 85 654 86 003 90 478
Total non-current assets 207 989 223 325 213 197
Current assets
Inventories 337 344 385
Intangible assets: current 420 371 68
Current receivables 15 631 20 294 18 055
Current tax assets — 158 762
Short-term investments 41 549 18 211 26 724
Cash and cash equivalents 8 001 7 673 8 335
Total current assets 65 938 47 051 54 329
Total assets 273 927 270 376 267 526 Equity and liabilities
Equity
Restricted equity
Share capital (131,700,000 shares with a share quota value of SEK 50) 6 585 6 585 6 585
Statutory reserve 1 286 1 286 1 286
Non-restricted equity
Retained earnings 43 737 55 454 55 454
Profit for the period 3 819 3 320 - 11 718
Total equity 55 427 66 645 51 607
Untaxed reserves 15 493 15 723 16 227
Provisions 4 792 4 336 4 278
Non-current liabilities Hybrid Capital 15 290 8 928 —
Other interest-bearing liabilities 53 347 83 163 63 962
Deferred tax liabilities 185 73 165
Other noninterest-bearing liabilities 36 344 33 126 36 421
Total non-current liabilities 105 166 125 290 100 548
Current liabilities
Hybrid Capital 4 684 51 823 9 385
Other interest-bearing liabilities 82 685 — 78 379
Current tax liabilities 75 — —
Other noninterest-bearing liabilities 5 605 6 559 7 102
Total current liabilities 93 049 58 382 94 866
Total equity and liabilities 273 927 270 376 267 526
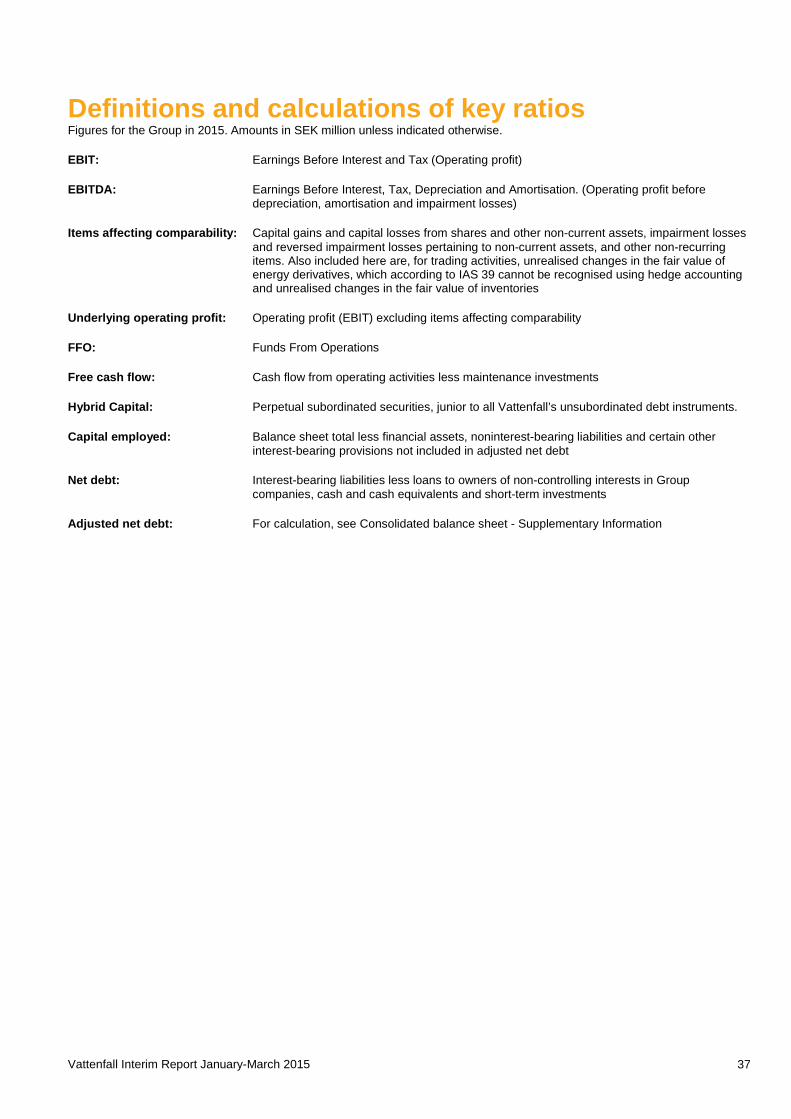
Vattenfall Interim Report January-March 2015 37
Definitions and calculations of key ratios Figures for the Group in 2015. Amounts in SEK million unless indicated otherwise.
EBIT: Earnings Before Interest and Tax (Operating profit)
EBITDA: Earnings Before Interest, Tax, Depreciation and Amortisation. (Operating profit before depreciation, amortisation and impairment losses)
Items affecting comparability: Capital gains and capital losses from shares and other non-current assets, impairment losses and reversed impairment losses pertaining to non-current assets, and other non-recurring items. Also included here are, for trading activities, unrealised changes in the fair value of energy derivatives, which according to IAS 39 cannot be recognised using hedge accounting and unrealised changes in the fair value of inventories
Underlying operating profit: Operating profit (EBIT) excluding items affecting comparability
FFO: Funds From Operations
Free cash flow: Cash flow from operating activities less maintenance investments
Hybrid Capital: Perpetual subordinated securities, junior to all Vattenfall’s unsubordinated debt instruments.
Capital employed: Balance sheet total less financial assets, noninterest-bearing liabilities and certain other interest-bearing provisions not included in adjusted net debt
Net debt: Interest-bearing liabilities less loans to owners of non-controlling interests in Group companies, cash and cash equivalents and short-term investments
Adjusted net debt: For calculation, see Consolidated balance sheet - Supplementary Information
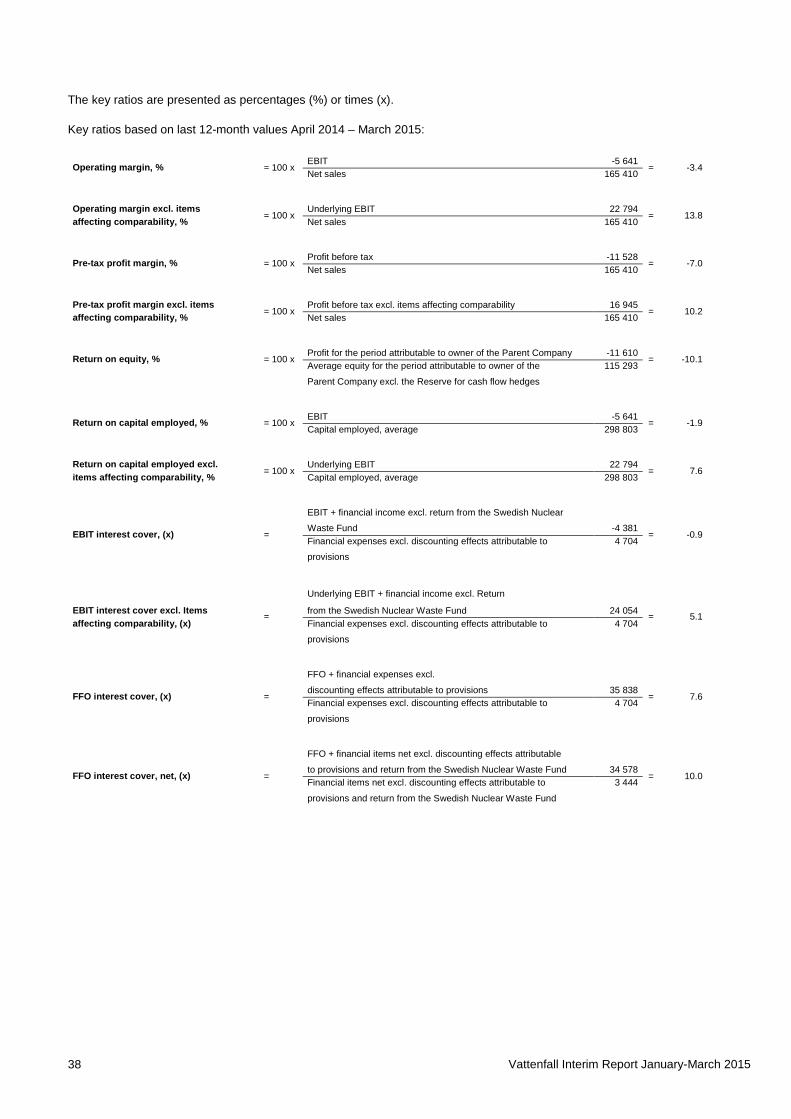
Vattenfall Interim Report January-March 2015 38
The key ratios are presented as percentages (%) or times (x).
Key ratios based on last 12-month values April 2014 – March 2015:
Operating margin, % = 100 x EBIT -5 641
= -3.4 Net sales 165 410
Operating margin excl. items = 100 x
Underlying EBIT 22 794 = 13.8 affecting comparability, % Net sales 165 410
Pre-tax profit margin, % = 100 x Profit before tax -11 528
= -7.0 Net sales 165 410
Pre-tax profit margin excl. items = 100 x
Profit before tax excl. items affecting comparability 16 945 = 10.2 affecting comparability, % Net sales 165 410
Return on equity, % = 100 x Profit for the period attributable to owner of the Parent Company -11 610
= -10.1 Average equity for the period attributable to owner of the 115 293
Parent Company excl. the Reserve for cash flow hedges
Return on capital employed, % = 100 x EBIT -5 641
= -1.9 Capital employed, average 298 803
Return on capital employed excl. = 100 x
Underlying EBIT 22 794 = 7.6 items affecting comparability, % Capital employed, average 298 803
EBIT + financial income excl. return from the Swedish Nuclear
EBIT interest cover, (x) = Waste Fund -4 381
= -0.9 Financial expenses excl. discounting effects attributable to 4 704
provisions
Underlying EBIT + financial income excl. Return
EBIT interest cover excl. Items = from the Swedish Nuclear Waste Fund 24 054 = 5.1 affecting comparability, (x) Financial expenses excl. discounting effects attributable to 4 704
provisions
FFO + financial expenses excl.
FFO interest cover, (x) = discounting effects attributable to provisions 35 838
= 7.6 Financial expenses excl. discounting effects attributable to 4 704
provisions
FFO + financial items net excl. discounting effects attributable
FFO interest cover, net, (x) = to provisions and return from the Swedish Nuclear Waste Fund 34 578
= 10.0 Financial items net excl. discounting effects attributable to 3 444
provisions and return from the Swedish Nuclear Waste Fund
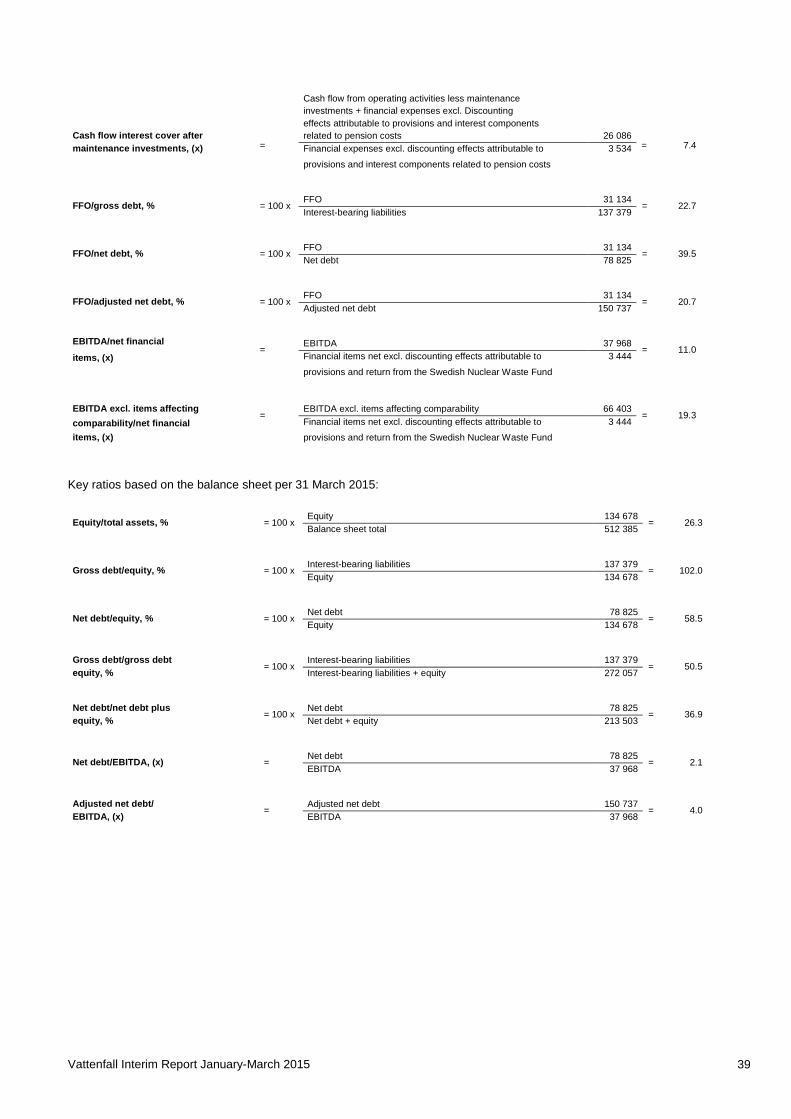
Vattenfall Interim Report January-March 2015 39
Cash flow from operating activities less maintenance investments + financial expenses excl. Discounting
Cash flow interest cover after =
effects attributable to provisions and interest components related to pension costs 26 086
= 7.4 maintenance investments, (x) Financial expenses excl. discounting effects attributable to 3 534
provisions and interest components related to pension costs
FFO/gross debt, % = 100 x FFO 31 134
= 22.7 Interest-bearing liabilities 137 379
FFO/net debt, % = 100 x FFO 31 134
= 39.5 Net debt 78 825
FFO/adjusted net debt, % = 100 x FFO 31 134
= 20.7 Adjusted net debt 150 737
EBITDA/net financial =
EBITDA 37 968 = 11.0
items, (x) Financial items net excl. discounting effects attributable to 3 444
provisions and return from the Swedish Nuclear Waste Fund
EBITDA excl. items affecting =
EBITDA excl. items affecting comparability 66 403 = 19.3
comparability/net financial Financial items net excl. discounting effects attributable to 3 444
items, (x) provisions and return from the Swedish Nuclear Waste Fund
Key ratios based on the balance sheet per 31 March 2015:
Equity/total assets, % = 100 x Equity 134 678
= 26.3 Balance sheet total 512 385
Gross debt/equity, % = 100 x Interest-bearing liabilities 137 379
= 102.0 Equity 134 678
Net debt/equity, % = 100 x Net debt 78 825
= 58.5 Equity 134 678
Gross debt/gross debt = 100 x
Interest-bearing liabilities 137 379 = 50.5 equity, % Interest-bearing liabilities + equity 272 057
Net debt/net debt plus = 100 x
Net debt 78 825 = 36.9 equity, % Net debt + equity 213 503
Net debt/EBITDA, (x) = Net debt 78 825
= 2.1 EBITDA 37 968
Adjusted net debt/ =
Adjusted net debt 150 737 = 4.0 EBITDA, (x) EBITDA 37 968
Vattenfall Interim Report January-March 2015 40
Interim report signature Solna, 28 April 2015 Magnus Hall President and Chief Executive Officer
This interim report has not been reviewed by the company’s auditor.
Financial calendar Interim report January–June, 21 July 2015
Interim report January–September, 27 October 2015
Year-end report, 3 February 2016 (preliminary)
Contact information Vattenfall AB (publ) SE-169 92 Stockholm Corporate identity number 556036-2138 T +46-8-739 50 00 www.vattenfall.com www.vattenfall.se
Magnus Hall President and CEO T +46-8-739 50 09
Ingrid Bonde CFO T +46-8-739 60 06
Klaus Aurich Head of Investor Relations T +46-8-739 65 14 or +46-70-539 65 14