Embed Size (px)
Citation preview
Marketing Research Assignment – Wendy´s Case
Martin Meister – Boston University
1
THE WENDY´S CASE
A DEMOSTRATION HOW MARKETING RESEARCH AND ANALYSIS CAN
HELP RESOLVING A MANAGEMENT DECISION PROBLEM
Martin Meister – [email protected]
Boston University - MET AD 856 fall 2012 – Professor Vladimir Zlatev
February 27, 2012
Marketing Research Assignment – Wendy´s Case
Martin Meister – Boston University
2
Table of Contents
Introduction ...................................................................................................................................................... 3
1. - Problem Definition ....................................................................................................................................... 3
a. - Background to the problem...................................................................................................................... 3
b. - Statement to the problem........................................................................................................................ 4
2. - Approach to the Problem ............................................................................................................................. 5
3. - Research Design ........................................................................................................................................... 8
a. - Information needs ................................................................................................................................... 8
b. - Data Collection of Primary Sources........................................................................................................... 9
c. - Measurement and scaling techniques ....................................................................................................... 9
d. - Questionnaire develop and pretesting ..................................................................................................... 9
e. - Sampling techniques .............................................................................................................................. 10
f. - Data plan analysis ................................................................................................................................... 10
4. - Data Analysis ............................................................................................................................................. 10
a. - Methodology ......................................................................................................................................... 10
b. - Plan of Data Analysis .............................................................................................................................. 11
5. – Results from the Data Analysis................................................................................................................... 11
6. - Limitation and Risks ................................................................................................................................... 19
7. - Conclusions and Recommendations ........................................................................................................... 19
a. - Conclusions ............................................................................................................................................ 19
b. – Recommendations for the Management Decision Problem ................................................................... 20
c. - Recommendation for future studies ....................................................................................................... 20
Appendix A - Market Analysis ........................................................................................................................... 21
Appendix B – Market Information .................................................................................................................... 23
Appendix C – Schematic for Recording the Results ........................................................................................... 27
Appendix D – Plots with relation of the Frequency of Visits and Health Concerns ............................................. 28
Appendix E – Plot with relation between Quality and Visits to the Restaurants ................................................. 29
Resources ........................................................................................................................................................ 30
Marketing Research Assignment – Wendy´s Case
Martin Meister – Boston University
3
Introduction
Wendy´s is a restaurant chain that is immersed in the Fast Food Restaurant Industry where we can find
companies that compete in different segments, being Burger, Sandwich, Snacks/Beverages, Chicken and Pizza
the most important. Each restaurant is in competition with other food service operations within some
geographical area. These quick service restaurants are highly competitive and include well established
competitors. Quality, variety, convenience, price and value perception of food products offered, locations,
quality and speed of service are the competitive key advantages (10-K Annual Report, 2010).
By system wide sales, Wendy´s Company is the number 4 in the US; behind McDonalds, Subway and Burger King
(see table B.1 and chart B.1, Appendix B). For the year 2010, it has almost 6.000 restaurants (owns or
franchises) and approximately $ 8,3 billion in sales.
Wendy´s is recognized as a traditional brand with quality food and service, great taste, with focus on fresh
never frozen ground beefs that offers burgers and fries as well as alternative items such as baked potatoes ,
chili and salad, they have a standard menu featuring hamburgers and chicken breast sandwiches (Malhotra,
2010).
1. - Problem Definition
a. - Background to the problem
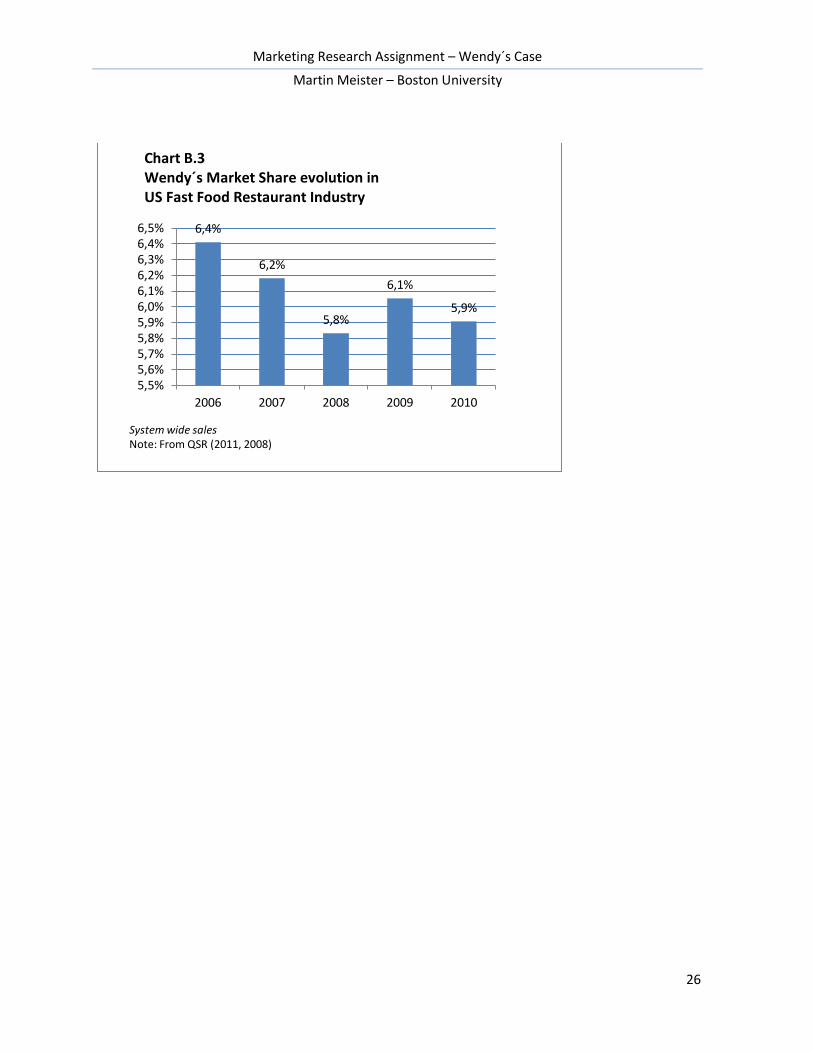
Analyzing the information from the last 5 years we can conclude that Wendy´s is losing Market Share in the US
Fast Food Restaurant Industry (charts B.2 and B.3, Appendix B).
The reasons are related with internal and external problems. Since his founder Dave Thomas died on 2002, the
company continued to perform well for the next 3 years. But on the following ones had problems of branding
the company without Mr. Thomas, management distractions from the merge with the company Arby´s, a lack of
Marketing Research Assignment – Wendy´s Case
Martin Meister – Boston University
4
creating new innovative menus and not meeting entirely the slogan of the freshness of their products (Wong,
2009).
Now they are facing the activity of competitor´s product innovation. “Rivals have caught up to the menu
innovations of Wendy´s” (Malhotra, 2010).
By the other hand, the market has grown more than Wendy´s (Table B.3, Appendix B), and mainly because of
the develop of chains related with more healthy menus (Subway), snacks and beverage (Dunkin´ Donuts,
Starbucks) and product innovation, service improvement and convenient prices (McDonalds).
b. - Statement to the problem
Management Decision Problem (MDP)
Should Wendy´s introduce a new Healthy Menu line to increase their sales?
Marketing Research Problem (MRP)
Determine the consumers´ preferences and purchase intentions for a new Healthy Menu line to be introduced
in Wendy´s restaurants.
Specific Components of the Marketing Research Problem
1. - What is the market share of the Fast Food Restaurant Industry?
2. - Is the restaurant consumers´ visits movement in the last year (more or less often) related with health
concerns?
3. - What are the consumers´ characteristics and their relation with healthy food concerns?
4. - What is the consumers’ perception of the restaurant chains, in relation to healthy food products?
5. - Do the customers´ healthy food concerns impact in the fast food restaurant industry?
Marketing Research Assignment – Wendy´s Case
Martin Meister – Boston University
5
2. - Approach to the Problem
Objective Evidence
When analyzing the Fast Food Industry market we can conclude that in the last years it has grown more than 3
percent per year. In this period the restaurant chains that have grown more are related with the development
of fresh less-fat menus, snack and beverages and product innovation. Other important issue is the need for the
US consumers to eat healthy. According to the National Center for Health Statistics, 66.5 percent of adults are
overweight or obese.
Taking all this information in consideration, we think that creating a healthy menu will be plus in the fast food
restaurant industry.
Verbal Model
The potential consumer has the necessity of alimentation and looks for the available alternatives, becomes
aware of the fast food restaurants. The subject evaluates the different restaurant alternatives in terms of the
variables: quality, price, speed, variety, location, etc. of the products and services offered and compare them
with his punctual needs. Based on this evaluation and depending on the importance of this critical decision
variables will form a degree of preference for the restaurant. If this preference is strong enough, the customer
will eat at that restaurant.
Research Questions
Component 1
Is the established market share in this study related with the determined in the exploratory secondary data
research?
Marketing Research Assignment – Wendy´s Case
Martin Meister – Boston University
6
What variables impact significantly the market share of the restaurants?
Explore the potential of the market and with what variables could be related.
Component 2
With what could be this market frequency of use movement related?
What variables impact the restaurant´s frequency of use of the restaurants?
Has any relationship with healthy food consumption concerns?
Explore the consumers that show indecision, with what is related?
Component 3
Is there any significant difference between the demographic and psychographic characteristics of the
consumers and the restaurant chain they use frequently?
What is the difference between the regular customer of Wendy´s, the one from the competitors and the one
that’s have concern about consumption of healthy food.
Has any impact on the frequency of use?
Component 4
Do perceptions vary depending on other variables that healthy concern?
Component 5
Do the healthy food concerns impact in the marker share?
Does the quality evaluation of the restaurant be related with healthy food concerns?
Do the healthy food concerns impact and the restaurant´s growth/shrink?
Marketing Research Assignment – Wendy´s Case
Martin Meister – Boston University
7
Hypothesis
Component 1
The marker share of the fast food restaurant industry is very similar of the one obtained from the exploratory
secondary data study. The relative positions in the ranking are similar.
Component 2
The more often/less often frequency of patronage is related with the perception of variety of the menus,
product innovation, healthy concerns and quality.
Component 3
The consumers’ characteristics that tend to have concerns about more healthy foods should different from the
one how not, especially in order to age, income, education, employment and family group.
Component 4
Consumers differentiate the restaurant chains in relation to quality of the brand and the healthy variable could
be significant for the election of the restaurant and could cause a change of brand.
Component 5
Although the impact of eating healthy food is a crescent issue, at this moment the impact should bounded to a
specific targeted customers.
Marketing Research Assignment – Wendy´s Case
Martin Meister – Boston University
8
Specification of information needed
Component 1
This is the market share according to the perception of the customers; therefore we need preferences of eaten
food from a list of the most important fast food restaurants within grades of usage. As secondary data we need
the ranking of fast food restaurants.
Component 2
We need to know with this same list of restaurants to ask the change in the frequency of use in a period of time.
Component 3
The consumers’ psychographic and demographic profiles and their healthy food concerns.
Component 4
The consumers’ perceptions related with different variables of decision for choosing a restaurant in particular
and the concerns in the consumption of healthy food.
Component 5
Know healthy food concerns of the customers, estimation of the market share, frequency of use/consumption,
evaluation of quality, estimation of grow/shrink of each restaurant.
3. - Research Design
a. - Information needs
There has to be collection of specific information for studying customer demographics and awareness of
different competing fast-food chains including Wendy´s; the satisfaction responses of consumers in terms of
Marketing Research Assignment – Wendy´s Case
Martin Meister – Boston University
9
family orientation, perceived quality, healthy foods concerns and the patronage preferences of customers in
terms of amount and frequency of visits.
b. - Data Collection of Primary Sources
The primary source to gather the information has to be a descriptive survey method with written structured
direct questionnaire with fixed-alternative questions that will require the respondent to select from a
predetermined set of responses. The survey will be administered with personal in-home interviews that will
allow flexibility in the design and diversity of questions. There won’t be monetary stimuli.
c. - Measurement and scaling techniques
To develop the survey there will be a noncomparative scaling technique with itemized rating scale with Likert
scales and semantic differential scales with some reverse score questions. The construction of the scales will be
structured with different number of scale categories, with balanced scales for the favorable and unfavorable
categories, odd number of categories, in some cases will use nonforced answers like “prefer not to answer” or
“n/a”, for the nature and degree of verbal description the survey will use of verbal and numerical scale
categories, finally the physical form will be with horizontal, categories with boxes and units with positive
numerical values. When asking preference statements multi-item scales will be used. For some question we will
use ordinal scales for measuring demographic questions for example.
d. - Questionnaire develop and pretesting
The questionnaire will gather all the information needed defined in the Approach to the Problem. The
interviewed method will be made in person, which means face to face with the respondents. A professional
external firm will do the fieldwork. The amount of questions will be no more than 25 questions to be answered
in no more than one hour. The questions will be structured, with multiple-choice, dichotomous and scales
options.
For pretesting, the questionnaire will be tested with employees of Wendy´s and a test sample of potential
consumers.
Marketing Research Assignment – Wendy´s Case
Martin Meister – Boston University
10
e. - Sampling techniques
The elements of the Target Population are adult males of females as Elements, the Sampling units are
households, the extent is the US continental territory and the time is the year 2008. As it is important to have
the information of the households with a large territory, area cluster sampling technique with a two-stage
sampling will be used. The sample size will be in the typical ranges between 1.000 and 2.500. For this case we
will point a size of 1.500. An alternative technique is to use only cluster sampling also with two-stage sampling.
f. - Data plan analysis
For analyzing the results, a data preparation process will be used. That includes the questionnaire checking,
editing and reviewing the questionnaire, codding the responses, transcribing the data obtained, data cleaning
for the consistency checks and treatment of missing responses, statistically adjustment of data and selecting the
data analysis strategy. For this last stage we will use a wide range of statistical techniques as: Frequency
Distribution, Cross Tabulation, Hypothesis Testing, One-way Anova and Correlation and Regression. The election
will be related with the variables involved, and if we are looking for percentages or mean or statistical relevance
or high level of correlation between variables.
4. - Data Analysis
The data that we are going for the statistical analysis comes from the survey conducted by Wendy´s (Malhotra,
2010, p. 814-820). We are going to use several statistical techniques for the approaches and the use of the IMB
SPSS software to make the analysis.
a. - Methodology
Through every of the 5 Marketing Research Problem Components we will try to prove or reject their related
Hypothesis. The statistical techniques that we are going to use are Frequency Distribution to analyze
percentages and relative rankings and positions, Cross Tabulations when we need to study relation between
variables, amounts, percentages and significance of the relations, One-way Anova when we are looking for
Marketing Research Assignment – Wendy´s Case
Martin Meister – Boston University
11
statistical significance of the influence of the independent in the dependent ones, Regression to evaluate if
there is a significant statistical correlation between those variables, to find which of the several independent
variables can explain variations in the dependent variables and, finally Hypothesis Testing to prove our
hypothesis.
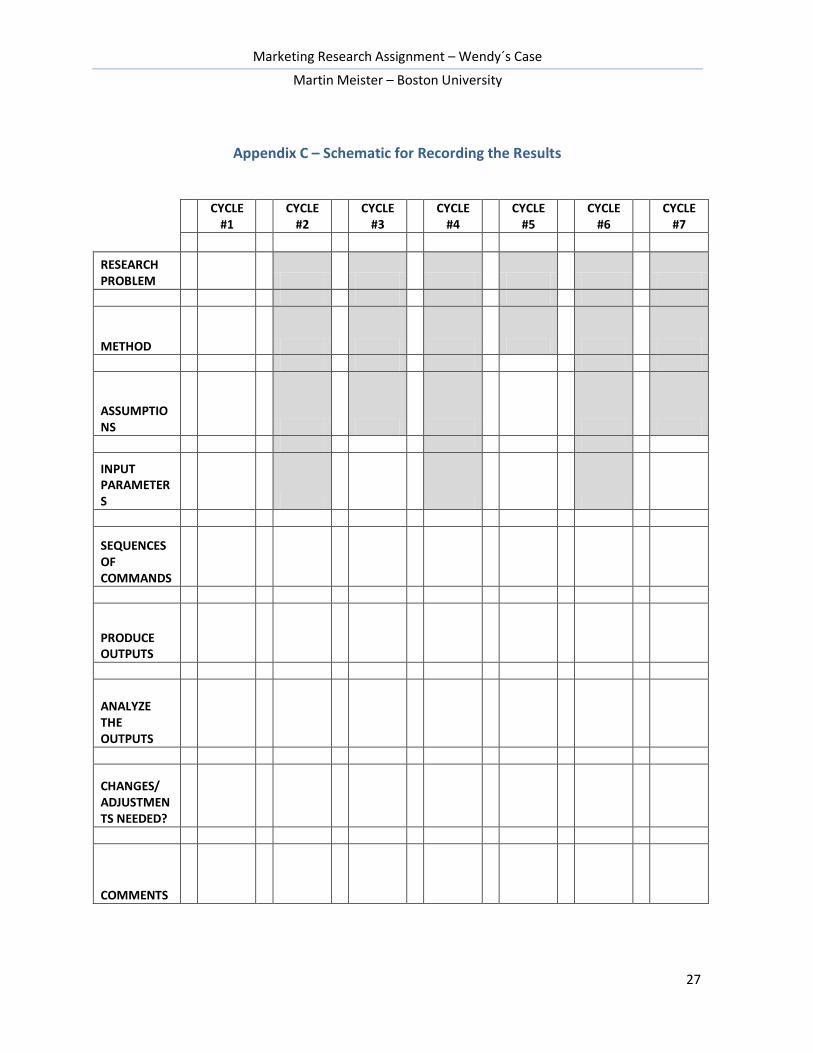
b. - Plan of Data Analysis
As we mention in the methodology, the plan is to analyze the 5 Components of the Marketing Research
Problem and test their related Hypothesis with different statistical technique; we will record the results in
several schematics sheets (see appendix C) each of the applied statics including: number of the marketing
research problem component, method of the selected technique, assumptions, input parameters, sequence of
commands, produce outputs, summary of the results, change or the adjustments needed and comments.
5. – Results from the Data Analysis
Remember that we are resolving the MRP: “Determine the consumers´ preferences and purchase intentions for
a new Healthy Menu line to be introduced in Wendy´s restaurants”. For that we have defined 5 components of
this MRP.
Component 1: What is the market share of the Fast Food Restaurant Industry?
The Hypothesis is that the market share determined with the analysis is similar of the one obtained in the
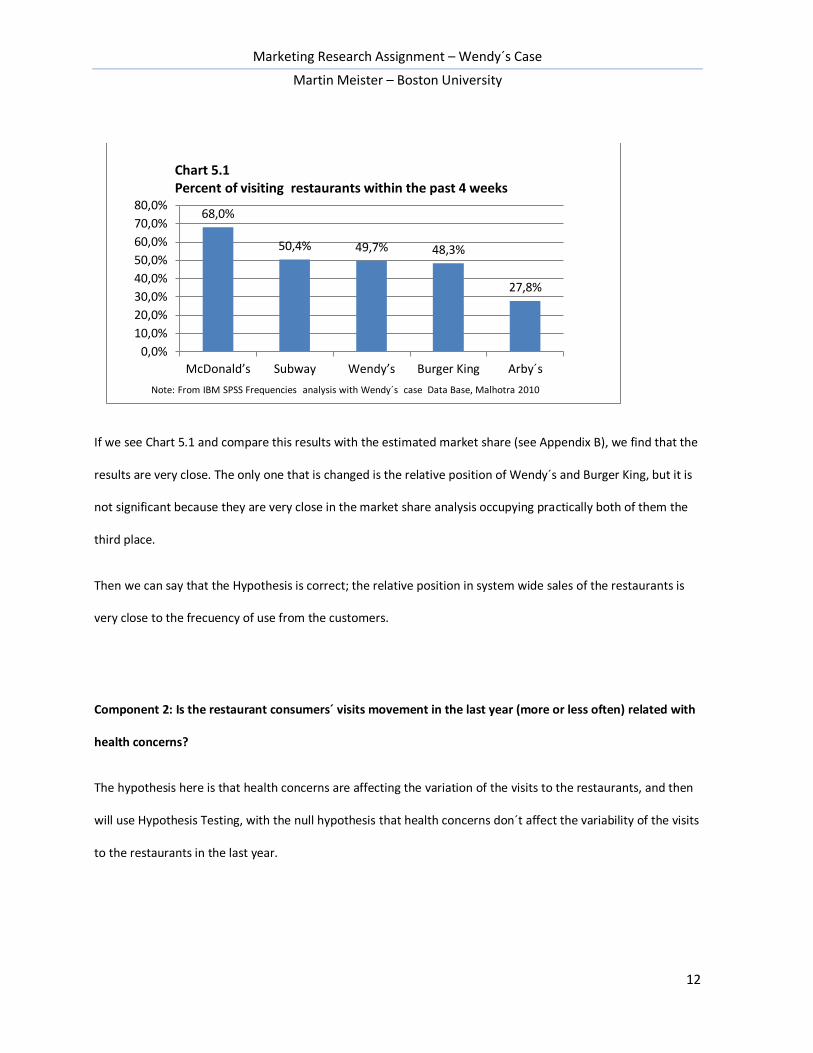
exploratory secondary data study. For this we are going to use Frequency Distribution analysis to tabulate the
variable 3a “when the last time that the customers went to each restaurant was” considering only the
customers within the past 4 week of less, the other ones seem to be too far (more than 4 week to 3 months or
more than 3 months ago).
Marketing Research Assignment – Wendy´s Case
Martin Meister – Boston University
12
If we see Chart 5.1 and compare this results with the estimated market share (see Appendix B), we find that the
results are very close. The only one that is changed is the relative position of Wendy´s and Burger King, but it is
not significant because they are very close in the market share analysis occupying practically both of them the
third place.
Then we can say that the Hypothesis is correct; the relative position in system wide sales of the restaurants is
very close to the frecuency of use from the customers.
Component 2: Is the restaurant consumers´ visits movement in the last year (more or less often) related with
health concerns?
The hypothesis here is that health concerns are affecting the variation of the visits to the restaurants, and then
will use Hypothesis Testing, with the null hypothesis that health concerns don´t affect the variability of the visits
to the restaurants in the last year.
68,0%
50,4% 49,7% 48,3%
27,8%
0,0%
10,0%
20,0%
30,0%
40,0%
50,0%
60,0%
70,0%
80,0%
McDonald’s Subway Wendy’s Burger King Arby´s
Chart 5.1 Percent of visiting restaurants within the past 4 weeks
Note: From IBM SPSS Frequencies analysis with Wendy´s case Data Base, Malhotra 2010
Marketing Research Assignment – Wendy´s Case
Martin Meister – Boston University
13
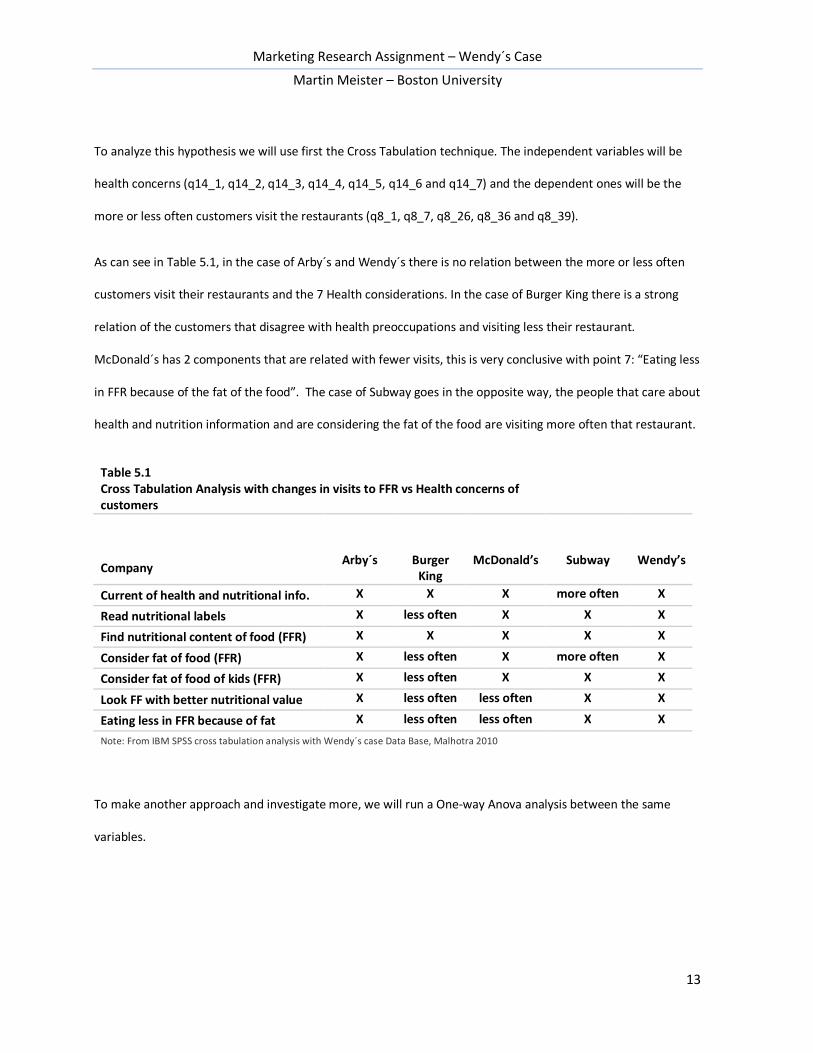
To analyze this hypothesis we will use first the Cross Tabulation technique. The independent variables will be
health concerns (q14_1, q14_2, q14_3, q14_4, q14_5, q14_6 and q14_7) and the dependent ones will be the
more or less often customers visit the restaurants (q8_1, q8_7, q8_26, q8_36 and q8_39).
As can see in Table 5.1, in the case of Arby´s and Wendy´s there is no relation between the more or less often
customers visit their restaurants and the 7 Health considerations. In the case of Burger King there is a strong
relation of the customers that disagree with health preoccupations and visiting less their restaurant.
McDonald´s has 2 components that are related with fewer visits, this is very conclusive with point 7: “Eating less
in FFR because of the fat of the food”. The case of Subway goes in the opposite way, the people that care about
health and nutrition information and are considering the fat of the food are visiting more often that restaurant.
Table 5.1 Cross Tabulation Analysis with changes in visits to FFR vs Health concerns of
customers
Company
Arby´s Burger King
McDonald’s Subway Wendy’s
Current of health and nutritional info. X X X more often X
Read nutritional labels X less often X X X
Find nutritional content of food (FFR) X X X X X
Consider fat of food (FFR) X less often X more often X
Consider fat of food of kids (FFR) X less often X X X
Look FF with better nutritional value X less often less often X X
Eating less in FFR because of fat X less often less often X X
Note: From IBM SPSS cross tabulation analysis with Wendy´s case Data Base, Malhotra 2010
To make another approach and investigate more, we will run a One-way Anova analysis between the same
variables.
Marketing Research Assignment – Wendy´s Case
Martin Meister – Boston University
14
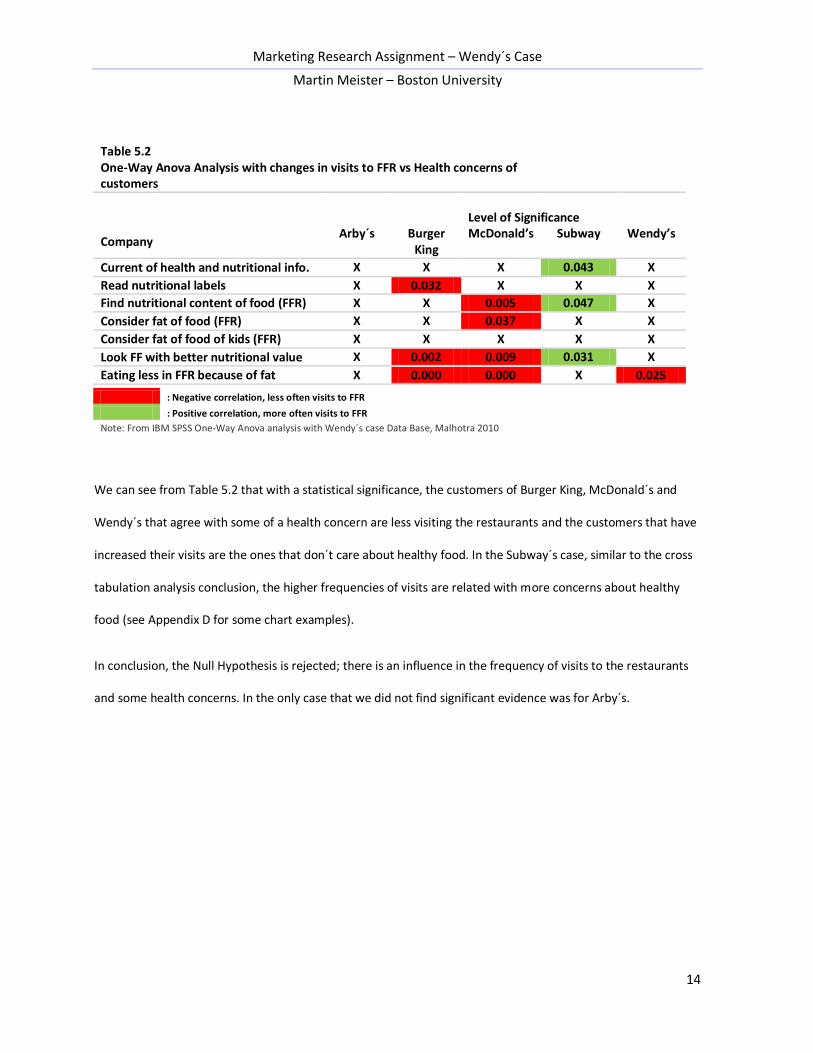
Table 5.2 One-Way Anova Analysis with changes in visits to FFR vs Health concerns of customers
Level of Significance
Company
Arby´s Burger King
McDonald’s Subway Wendy’s
Current of health and nutritional info. X X X 0.043 X
Read nutritional labels X 0.032 X X X
Find nutritional content of food (FFR) X X 0.005 0.047 X
Consider fat of food (FFR) X X 0.037 X X
Consider fat of food of kids (FFR) X X X X X
Look FF with better nutritional value X 0.002 0.009 0.031 X
Eating less in FFR because of fat X 0.000 0.000 X 0.025
: Negative correlation, less often visits to FFR
: Positive correlation, more often visits to FFR
Note: From IBM SPSS One-Way Anova analysis with Wendy´s case Data Base, Malhotra 2010
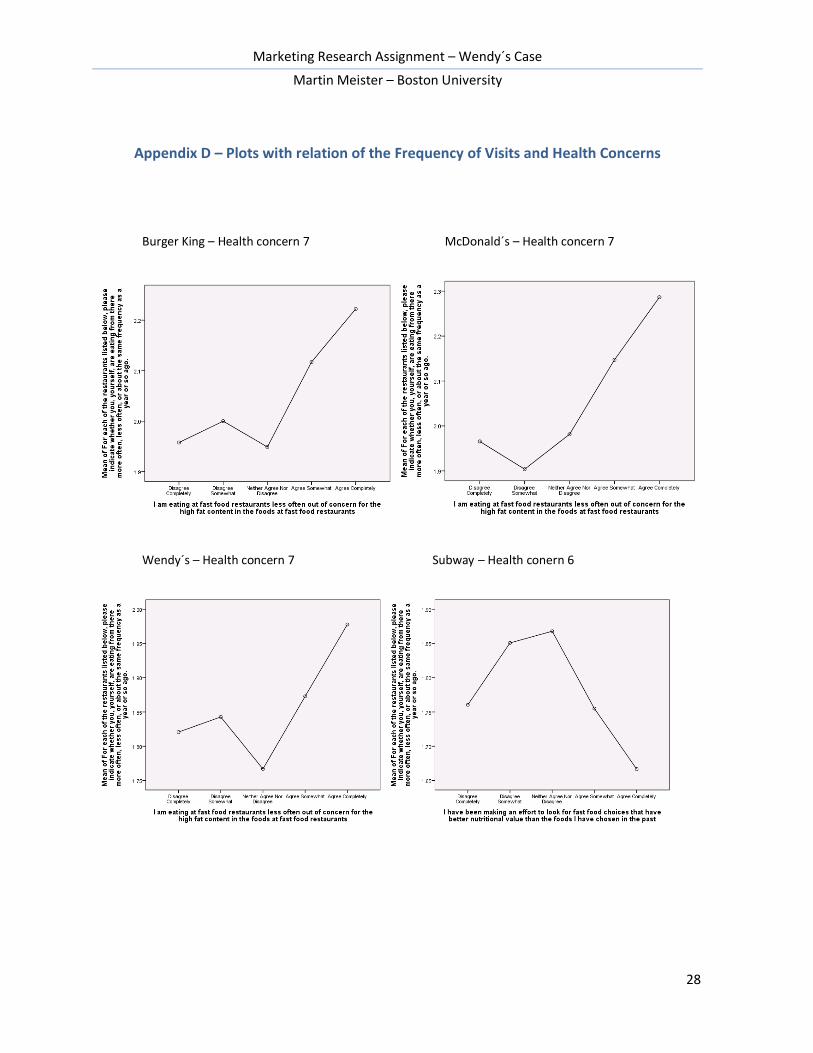
We can see from Table 5.2 that with a statistical significance, the customers of Burger King, McDonald´s and
Wendy´s that agree with some of a health concern are less visiting the restaurants and the customers that have
increased their visits are the ones that don´t care about healthy food. In the Subway´s case, similar to the cross
tabulation analysis conclusion, the higher frequencies of visits are related with more concerns about healthy
food (see Appendix D for some chart examples).
In conclusion, the Null Hypothesis is rejected; there is an influence in the frequency of visits to the restaurants
and some health concerns. In the only case that we did not find significant evidence was for Arby´s.
Marketing Research Assignment – Wendy´s Case
Martin Meister – Boston University
15
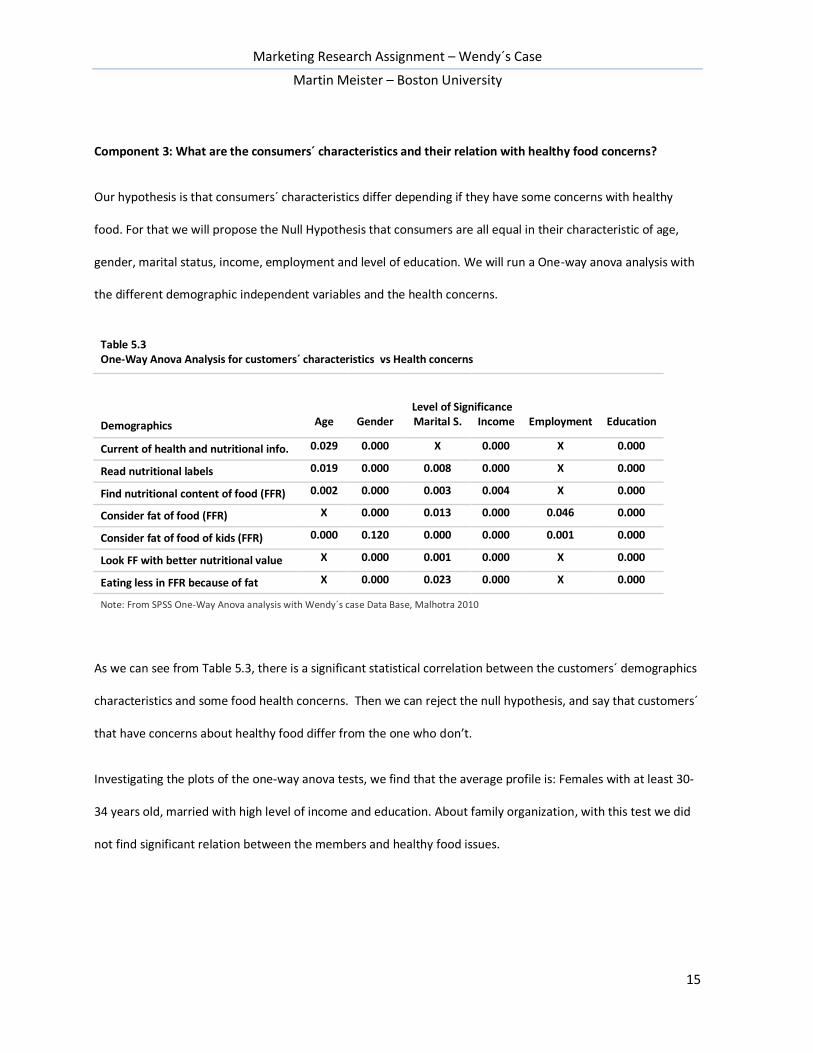
Component 3: What are the consumers´ characteristics and their relation with healthy food concerns?
Our hypothesis is that consumers´ characteristics differ depending if they have some concerns with healthy
food. For that we will propose the Null Hypothesis that consumers are all equal in their characteristic of age,
gender, marital status, income, employment and level of education. We will run a One-way anova analysis with
the different demographic independent variables and the health concerns.
Table 5.3 One-Way Anova Analysis for customers ́characteristics vs Health concerns
Level of Significance
Demographics Age Gender Marital S. Income Employment Education
Current of health and nutritional info. 0.029 0.000 X 0.000 X 0.000
Read nutritional labels 0.019 0.000 0.008 0.000 X 0.000
Find nutritional content of food (FFR) 0.002 0.000 0.003 0.004 X 0.000
Consider fat of food (FFR) X 0.000 0.013 0.000 0.046 0.000
Consider fat of food of kids (FFR) 0.000 0.120 0.000 0.000 0.001 0.000
Look FF with better nutritional value X 0.000 0.001 0.000 X 0.000
Eating less in FFR because of fat X 0.000 0.023 0.000 X 0.000
Note: From SPSS One-Way Anova analysis with Wendy´s case Data Base, Malhotra 2010
As we can see from Table 5.3, there is a significant statistical correlation between the customers´ demographics
characteristics and some food health concerns. Then we can reject the null hypothesis, and say that customers´
that have concerns about healthy food differ from the one who don’t.
Investigating the plots of the one-way anova tests, we find that the average profile is: Females with at least 30-
34 years old, married with high level of income and education. About family organization, with this test we did
not find significant relation between the members and healthy food issues.
Marketing Research Assignment – Wendy´s Case
Martin Meister – Boston University
16
Component 4: What is the consumers’ perception of the restaurant chains, in relation to healthy food
products?
The hypothesis here is that consumers difference each restaurant depending on the perceived quality and food
health concerns.
For quality we are going to use a Regression Test because we want to find if there is correlation (R Square)
between the variables and a One-way Anova Test to ratify if there is any statistical significance relationship. We
will run the test with the question q9 that measures de perceived quality of the restaurants (terrible to perfect)
and the variable S3a that are the amount of visits if the last 4 weeks.
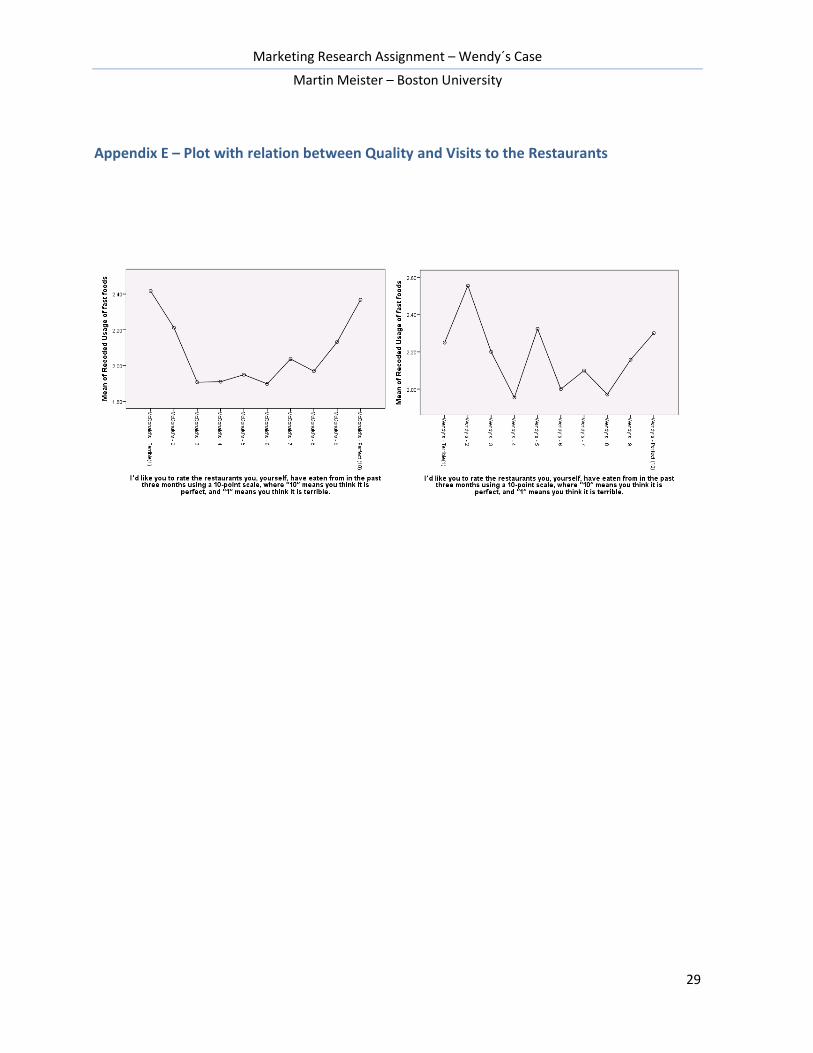
We find that the relation between perceived quality and visits to the restaurant has a very poor correlation,
with an R2 of 0.017, which mean no correction at all. When we run the One-way Anova Test we find significance
relation with quality with the visits to McDonald´s and Wendy´s, buy when we see the plots the correlation does
not have meaning at all (see Appendix E).
In relation to the healthy concerns and the amount a visits, we will use a One-way Anova crossing the variables
of health concerns (q14_1, q14_2, q14_3, q14_4, q14_5, q14_6, q14_7) and the last time visit each restaurant
(q3_1, q3_7, q3_26, q3_36 and q3_39).
Marketing Research Assignment – Wendy´s Case
Martin Meister – Boston University
17
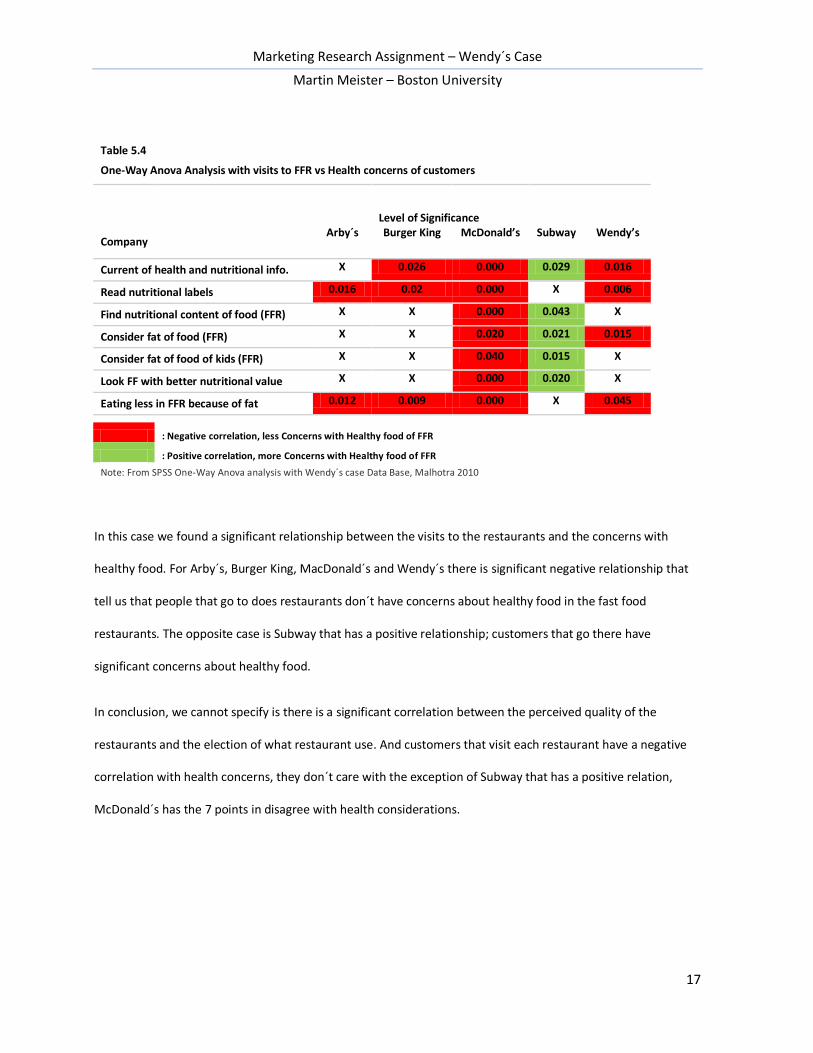
Table 5.4
One-Way Anova Analysis with visits to FFR vs Health concerns of customers
Level of Significance
Company
Arby´s Burger King McDonald’s Subway Wendy’s
Current of health and nutritional info. X 0.026 0.000 0.029 0.016
Read nutritional labels 0.016 0.02 0.000 X 0.006
Find nutritional content of food (FFR) X X 0.000 0.043 X
Consider fat of food (FFR) X X 0.020 0.021 0.015
Consider fat of food of kids (FFR) X X 0.040 0.015 X
Look FF with better nutritional value X X 0.000 0.020 X
Eating less in FFR because of fat 0.012 0.009 0.000 X 0.045
: Negative correlation, less Concerns with Healthy food of FFR
: Positive correlation, more Concerns with Healthy food of FFR
Note: From SPSS One-Way Anova analysis with Wendy´s case Data Base, Malhotra 2010
In this case we found a significant relationship between the visits to the restaurants and the concerns with
healthy food. For Arby´s, Burger King, MacDonald´s and Wendy´s there is significant negative relationship that
tell us that people that go to does restaurants don´t have concerns about healthy food in the fast food
restaurants. The opposite case is Subway that has a positive relationship; customers that go there have
significant concerns about healthy food.
In conclusion, we cannot specify is there is a significant correlation between the perceived quality of the
restaurants and the election of what restaurant use. And customers that visit each restaurant have a negative
correlation with health concerns, they don´t care with the exception of Subway that has a positive relation,
McDonald´s has the 7 points in disagree with health considerations.
Marketing Research Assignment – Wendy´s Case
Martin Meister – Boston University
18
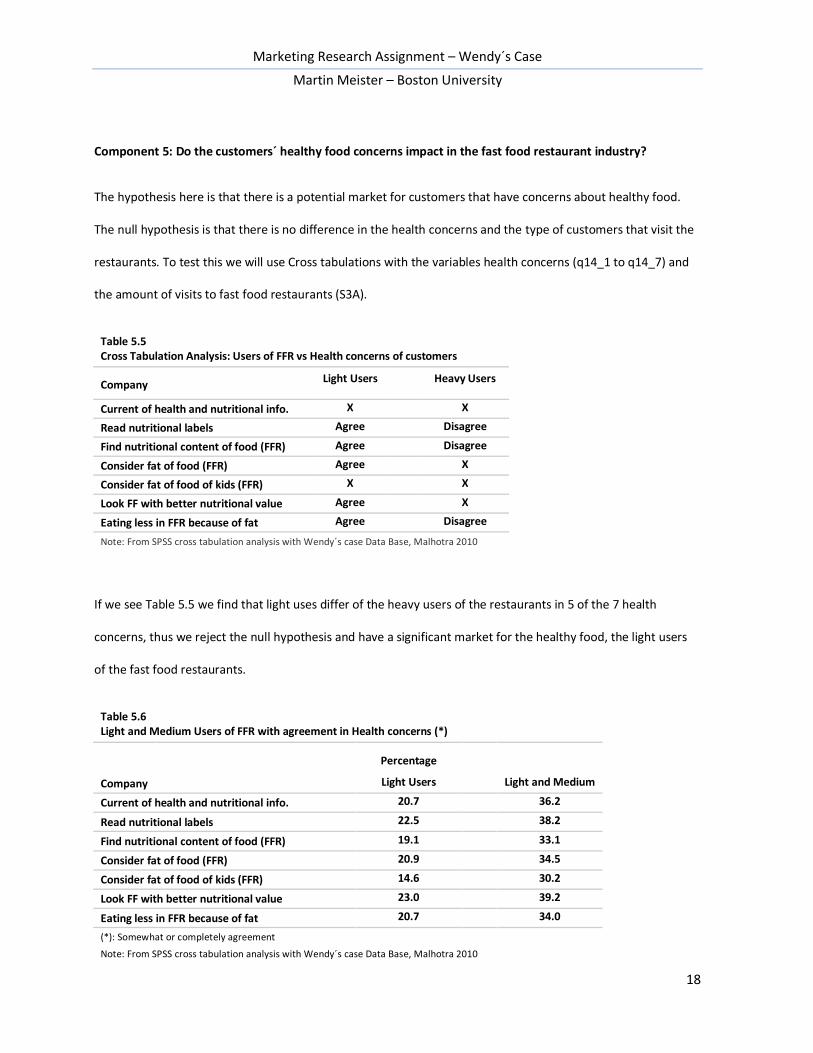
Component 5: Do the customers´ healthy food concerns impact in the fast food restaurant industry?
The hypothesis here is that there is a potential market for customers that have concerns about healthy food.
The null hypothesis is that there is no difference in the health concerns and the type of customers that visit the
restaurants. To test this we will use Cross tabulations with the variables health concerns (q14_1 to q14_7) and
the amount of visits to fast food restaurants (S3A).
Table 5.5 Cross Tabulation Analysis: Users of FFR vs Health concerns of customers
Company
Light Users Heavy Users
Current of health and nutritional info. X X
Read nutritional labels Agree Disagree
Find nutritional content of food (FFR) Agree Disagree
Consider fat of food (FFR) Agree X
Consider fat of food of kids (FFR) X X
Look FF with better nutritional value Agree X
Eating less in FFR because of fat Agree Disagree
Note: From SPSS cross tabulation analysis with Wendy´s case Data Base, Malhotra 2010
If we see Table 5.5 we find that light uses differ of the heavy users of the restaurants in 5 of the 7 health
concerns, thus we reject the null hypothesis and have a significant market for the healthy food, the light users
of the fast food restaurants.
Table 5.6 Light and Medium Users of FFR with agreement in Health concerns (*)
Percentage
Company Light Users Light and Medium
Current of health and nutritional info. 20.7 36.2
Read nutritional labels 22.5 38.2
Find nutritional content of food (FFR) 19.1 33.1
Consider fat of food (FFR) 20.9 34.5
Consider fat of food of kids (FFR) 14.6 30.2
Look FF with better nutritional value 23.0 39.2
Eating less in FFR because of fat 20.7 34.0
(*): Somewhat or completely agreement
Note: From SPSS cross tabulation analysis with Wendy´s case Data Base, Malhotra 2010
Marketing Research Assignment – Wendy´s Case
Martin Meister – Boston University
19
If we see Table 5.6 we can find that in average 1 of 3 the customers are light and medium users of the
restaurants and in the case of light users they have relevant concerns in 5 of the 7 topics about healthy food.
6. - Limitation and Risks
Although this study has kept all the procedures and process of an optimal marketing research project there are
some limitations that can come from potential sources of error like random sampling errors, that occurs
because the particular sample is an imperfect representation of the population of interest, and nonsampling
errors that can be attributed to sources other than sampling (random or nonrandom), like errors in the problem
definition, approach, scales, questionnaire design, interviewing methods, and data preparation and analysis
(Malhotra, 2010).
In this particular case, the survey was designed and developed for investigating a wide range of concerns that
Wendy´s has about their competitors, customers patronage preferences, customers demographic profiles but
not precisely and specifically answer the marketing research problem defined in this study. That’s why the
conclusions have that limitation; however they continue to be statistically valid.
7. - Conclusions and Recommendations
a. - Conclusions
Of the analysis made with the different statistical techniques to the survey conducted by Wendy´s (Malhotra,
2010, p.814-820) we can conclude that:
Visits to fast food restaurants within the last 4 weeks match very closely with the estimations of
market share of the System Wide Sales of the Fast Food Industry (see Appendix B).
The customers of Burger King, McDonald´s and Wendy´s that have significant concerns about healthy
food tend to go less often to the restaurants. In the case of Subway it is the opposite, customers that
have rising health concerns are going more often. For Arby´s we did not find correlations.
Marketing Research Assignment – Wendy´s Case
Martin Meister – Boston University
20
With statistical significance, the average profile of the healthy concerned consumers´ is: Female,
middle aged, married with high level of income and education.
We didn´t find significant relationship between the amount of visits and the perceived quality.
The visitors of the restaurants don´t care about health topics, with the exception of Subway.
Light users of the fast food restaurants have strong healthy food habits concerns and they represent
almost the 20 percent of all the customers, if we add the medium users we have 1/3 of the customers.
b. – Recommendations for the Management Decision Problem
We recommend generating the healthy light menu line to attract the light and medium users of the fast food
restaurants because they represent 1/3 of all the visitors and they agree with the concerns about health care
and can increase their visits to the restaurant. Subway Company is an example of growing sales and gain of
market share with a statistical significance for health concerns of their customers.
We don’t´ recommend changing other menus because consumers don’t relate in a significant way Wendy´s with
health topics. According to the targeted customers, at the beginning this menu must be offered in the middle
upper class restaurants for middle aged customers, preferably trying to attract female customers.
c. - Recommendation for future studies
For future marketing research design we propose to improve these topics:
Use exploratory research in the way of survey of expert s and focus groups to identify broad range of
MRP to solve the principal MDP, identify alternative courses of action and develop new hypothesis.
Use causal research to conduct several experiments to test new menus or beverages, and gather
information about the reception of them.
Concerning to the survey, they can include question related to sensibility of price and brand changes
possibility, what customers like and want to eat and the disposition of brand change, ask for quality of
the food, service, cleanliness, why they choose different restaurants.
Marketing Research Assignment – Wendy´s Case
Martin Meister – Boston University
21
Appendix A - Market Analysis
In the past 5 years, the Fast Food Restaurant industry has grown more than 3.2 percent average per year (Table
3, Appendix A). The Companies that had the higher rates of growth were Dunkin´ Donuts with a 7.8 percent,
Subway with a 7.5 percent, Starbucks with a 7.5 percent and McDonalds with a 3.9 percent. Except
McDonalds, the other companies are related with Sandwiches, Snacks and Beverages.
The chain Subway has focused in the niche of fast food in a healthy way; they become the default for healthy
and fast meal. Health information is listed on their packing and marketing material (Whitford, 2010). There are
over 2 million combinations that customers can create, differentiation is the most for the customers, and they
can choose to be entirely healthy (Alarcon, 2009).
Although Dunkin´ Donuts and Starbucks are in the fast food industry, they are not directly competing in the
lunch or dinner segment, they are in the beverage and snack segment, but still can be considered. For example
Dunkin´ Donuts has lunch main dishes (Fast Food Facts, 2009) and both of them compete directly in the
breakfast or in-between meals opportunities. This two companies are far by not been considered as “junk food”
suppliers.
Finally McDonalds is the largest fast food restaurant chain in the US, with the 23 percent of the market share.
They have grown almost 4 percent per year the last 5 years, and their main strategy is focused on reinvent
product innovation, like real fruit smoothies or Angus snack raps, new drinks and beverages, etc. (Oches, 2011).
Since 2003 the company has not hesitated to move into market segments of competitors like Starbucks,
Wendy´s and Blockbuster with experiments in consumer favorites (Forbes, 2010). According to the analyst R.J.
Hottovy from the Morning Star, the success in McDonald’s sales is related in creating a more attractive menu
and environment in its stores and consumers seeking less expensive food options (Forbes 2010).
By the other hand, we have the other group of 6 restaurant chains that have grown less that the average (Table
B.3, Appendix B). We can count in this group of worst ones the chains KFC, Burger King and Pizza Hut. A special
case is KFC that has lost sales in this period (2.3 percent average per year). All these brands are related with the
Marketing Research Assignment – Wendy´s Case
Martin Meister – Boston University
22
traditional fast food industry: burgers, fries, chicken and pizzas. More or less they have had administration and
management problems, low product innovation and away from healthy food menu´s.
This brings us an important consideration, the need for the US consumers to eat healthy: According to the
National Center for Health Statistics, 66.5 percent of adults are overweight or obese; 32 percent of adults
obese. Just as alarming if not more so, childhood obesity is escalating; tripling since the 1970's. 17 percent of
adolescents and 19 percent of children are overweight (Schaefer, 2010).
Marketing Research Assignment – Wendy´s Case
Martin Meister – Boston University
23
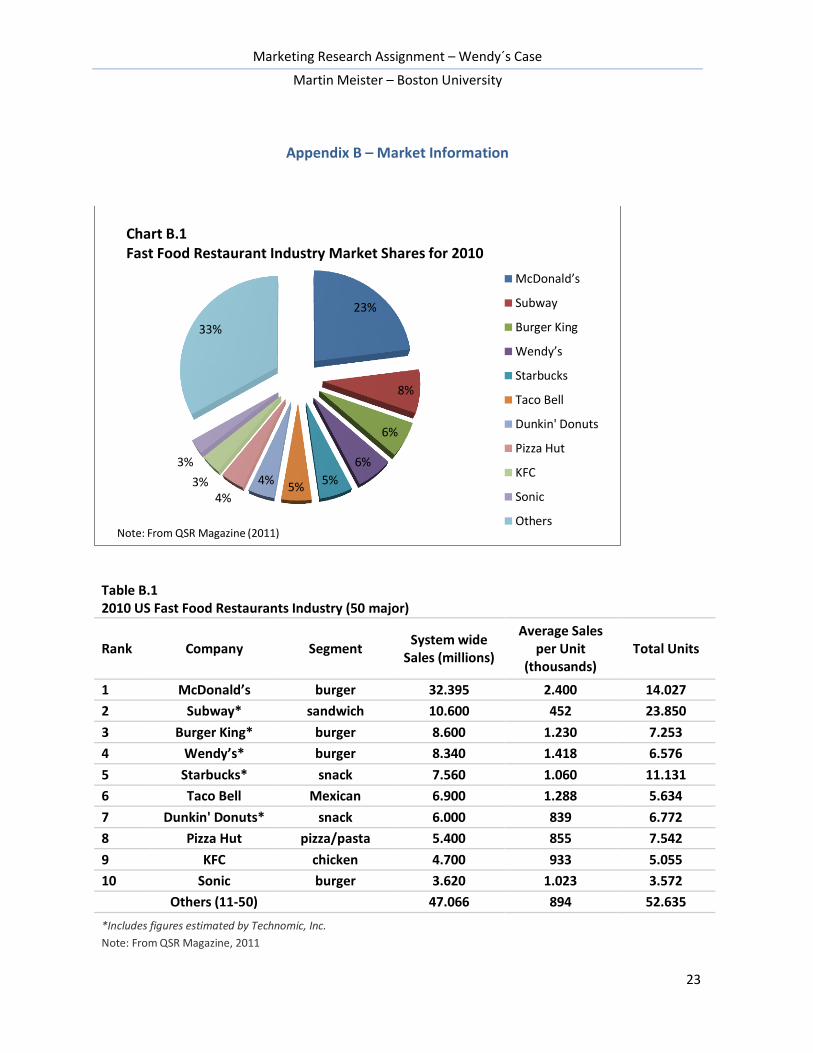
Appendix B – Market Information
Table B.1
2010 US Fast Food Restaurants Industry (50 major)
Rank Company Segment
System wide Sales (millions)
Average Sales per Unit
(thousands)
Total Units
1 McDonald’s burger 32.395 2.400 14.027
2 Subway* sandwich 10.600 452 23.850
3 Burger King* burger 8.600 1.230 7.253
4 Wendy’s* burger 8.340 1.418 6.576
5 Starbucks* snack 7.560 1.060 11.131
6 Taco Bell Mexican 6.900 1.288 5.634
7 Dunkin' Donuts* snack 6.000 839 6.772
8 Pizza Hut pizza/pasta 5.400 855 7.542
9 KFC chicken 4.700 933 5.055
10 Sonic burger 3.620 1.023 3.572
Others (11-50) 47.066 894 52.635
*Includes figures estimated by Technomic, Inc. Note: From QSR Magazine, 2011
23%
8%
6%
6%
5% 5%
4%
4% 3%
3%
33%
McDonald’s
Subway
Burger King
Wendy’s
Starbucks
Taco Bell
Dunkin' Donuts
Pizza Hut
KFC
Sonic
Others
Chart B.1 Fast Food Restaurant Industry Market Shares for 2010
Note: From QSR Magazine (2011)
Marketing Research Assignment – Wendy´s Case
Martin Meister – Boston University
24
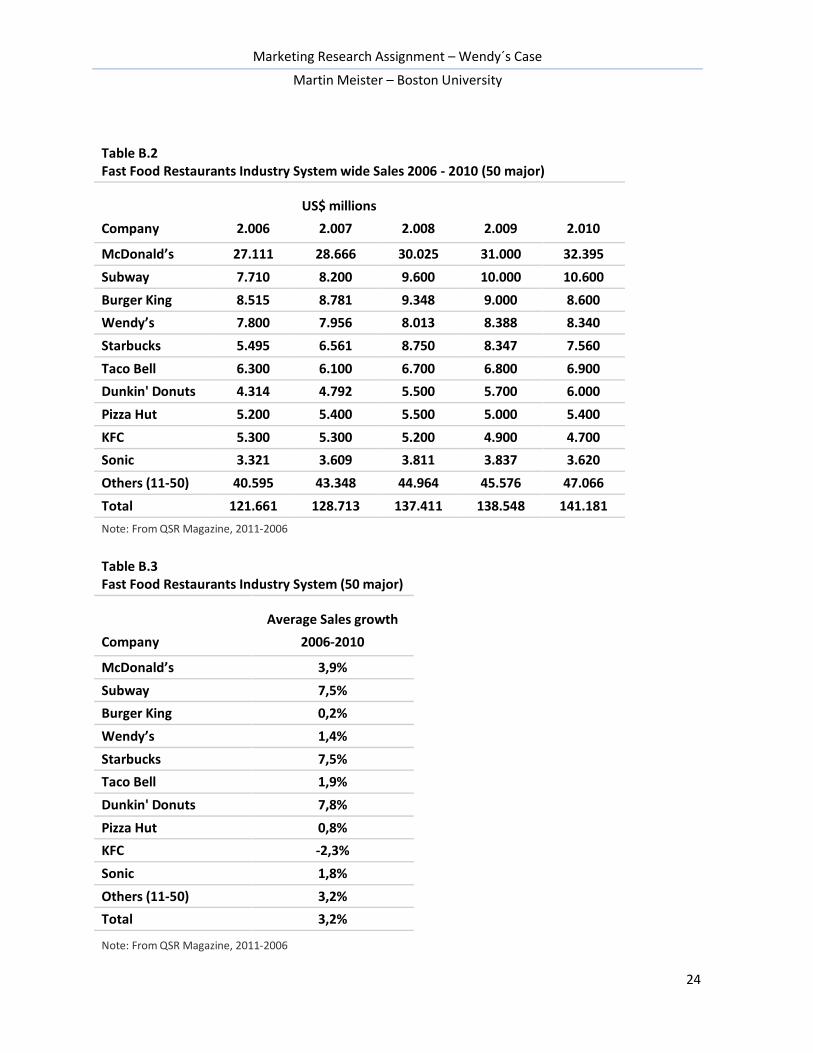
Table B.2 Fast Food Restaurants Industry System wide Sales 2006 - 2010 (50 major)
US$ millions
Company 2.006 2.007 2.008 2.009 2.010
McDonald’s 27.111 28.666 30.025 31.000 32.395
Subway 7.710 8.200 9.600 10.000 10.600
Burger King 8.515 8.781 9.348 9.000 8.600
Wendy’s 7.800 7.956 8.013 8.388 8.340
Starbucks 5.495 6.561 8.750 8.347 7.560
Taco Bell 6.300 6.100 6.700 6.800 6.900
Dunkin' Donuts 4.314 4.792 5.500 5.700 6.000
Pizza Hut 5.200 5.400 5.500 5.000 5.400
KFC 5.300 5.300 5.200 4.900 4.700
Sonic 3.321 3.609 3.811 3.837 3.620
Others (11-50) 40.595 43.348 44.964 45.576 47.066
Total 121.661 128.713 137.411 138.548 141.181
Note: From QSR Magazine, 2011-2006
Table B.3
Fast Food Restaurants Industry System (50 major)
Average Sales growth
Company 2006-2010
McDonald’s 3,9%
Subway 7,5%
Burger King 0,2%
Wendy’s 1,4%
Starbucks 7,5%
Taco Bell 1,9%
Dunkin' Donuts 7,8%
Pizza Hut 0,8%
KFC -2,3%
Sonic 1,8%
Others (11-50) 3,2%
Total 3,2%
Note: From QSR Magazine, 2011-2006
Marketing Research Assignment – Wendy´s Case
Martin Meister – Boston University
25
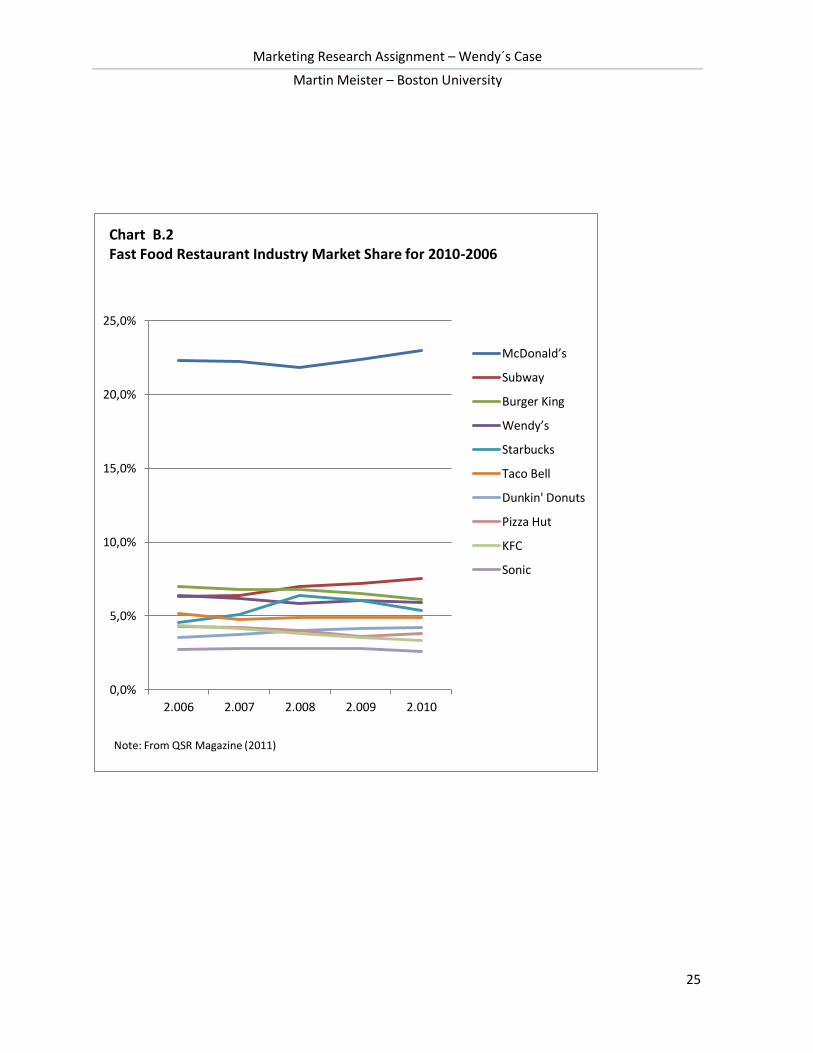
0,0%
5,0%
10,0%
15,0%
20,0%
25,0%
2.006 2.007 2.008 2.009 2.010
McDonald’s
Subway
Burger King
Wendy’s
Starbucks
Taco Bell
Dunkin' Donuts
Pizza Hut
KFC
Sonic
Chart B.2 Fast Food Restaurant Industry Market Share for 2010-2006
Note: From QSR Magazine (2011)
Marketing Research Assignment – Wendy´s Case
Martin Meister – Boston University
26
6,4%
6,2%
5,8%
6,1%
5,9%
5,5%5,6%5,7%5,8%5,9%6,0%6,1%6,2%6,3%6,4%6,5%
2006 2007 2008 2009 2010
Chart B.3 Wendy´s Market Share evolution in US Fast Food Restaurant Industry
System wide sales Note: From QSR (2011, 2008)
Marketing Research Assignment – Wendy´s Case
Martin Meister – Boston University
27
Appendix C – Schematic for Recording the Results
CYCLE #1
CYCLE #2
CYCLE #3
CYCLE #4
CYCLE #5
CYCLE #6
CYCLE #7
RESEARCH PROBLEM
METHOD
ASSUMPTIONS
INPUT PARAMETERS
SEQUENCES OF COMMANDS
PRODUCE OUTPUTS
ANALYZE THE OUTPUTS
CHANGES/ ADJUSTMENTS NEEDED?
COMMENTS
Marketing Research Assignment – Wendy´s Case
Martin Meister – Boston University
28
Appendix D – Plots with relation of the Frequency of Visits and Health Concerns
Burger King – Health concern 7 McDonald´s – Health concern 7
Wendy´s – Health concern 7 Subway – Health conern 6
Marketing Research Assignment – Wendy´s Case
Martin Meister – Boston University
29
Appendix E – Plot with relation between Quality and Visits to the Restaurants
Marketing Research Assignment – Wendy´s Case
Martin Meister – Boston University
30
Resources
Fast Food Facts (2009). Overview of Fast Food Market. Retrieved on January 29, 2012 from http://fastfoodmarketing.org/media/FastFoodFACTS_Report_Results.pdf Oches, Sam (2011, 8). The Top Quick-serve and Fast-casual brands in the Nation. QSR Magazine. Retrieved on January 29, 2012 from http://www.qsrmagazine.com/reports/2011-qsr-50 QSR Quality & Speed for Restaurant Success (2008, 8). Retrieved on January 29, 2012 from http://us.vocuspr.com/Newsroom/ViewAttachment.aspx?SiteName=SonicNewsXML&attachmentid=1aeecf95-1cb2-41ce-a194-0dd517057e42&attachmenttype=F&entity=News&entityid=25713643 10-K Annual Report (2010). Wendy´s Company. Retrieved on January 29, 2012 from http://ir.wendysarbys.com/phoenix.zhtml?c=67548&p=irol-sec&secCat01.2_rs=61&secCat01.2_rc=10&control_selectgroup=0 Alarcon, C. (2009, 9). Subway to Launch new brand strategy. Marketing Week. Retrieved on February 11, 2012 from http://www.marketingweek.co.uk/subway-to-launch-new-brand-strategy/3004226.article Whitford J. (2010). Subway to Launch New Brand Strategy. Retrieved on February 9, 2012 from http://www.joshwhitford.com/2010/04/29/subway-restaurant-awesome-marketing-strategies/ Subway Company (http://www.subway.com) Schaefer P. (2010). Healthy Fast Food: Oxymoron or Competitive Advantaje? Retrieved on February 10, 2012 from http://www.franchiseknowhow.com/articles/healthy-food.htm Malhotra, Naresh (2010). Marketing Research: An Applied Orientation, 6th ed. New Jersey: Pearson Education, Inc. Forbes (2010, 8). McDonalds Strategy pays off Again in October. Retrieved on February 13, 2012 from http://www.forbes.com/2010/11/08/mcdonalds-same-store-sales-markets-equities-restaurant.html Wong, E. (2009, 10). Why´Fressness´Is Wendy´s New Marketing Ingredient. Retrieved on February 13, 2012 from http://www.foodservice.csnews.com/top-story-why__freshness__is_wendy_s_new_marketing_ingredient-466.html