Embed Size (px)
Citation preview
© 2015 Continuum Analytics- Confidential & Proprietary
Creating Interactive Portfolio Risk and Performance Metric Monitoring Dashboards with Bokeh
Steve Taylor Duane Lawrence
Strata NYC 2015

© 2015 Continuum Analytics- Confidential & Proprietary
Who We AreSteve Taylor (Sr. Quantitative Engineer)
– Worked in a variety of buy and sell side roles as a quant risk and research roles for 6+ years
– Background in math/physics. Gives talks, teaches, and publishes regularly
Duane Lawrence (Director of Sales Engineering) – 20 years enterprise software architecture and
deployment experience – Background in computer science
2
© 2015 Continuum Analytics- Confidential & Proprietary
AGENDA
• The Typical Quantitative Finance Workflow • How Risk Analyses are Built and Deployed • Where Bokeh Fits In • Interactive Risk Dashboard Demo/Code Skim • How Continuum Can Help
3
© 2015 Continuum Analytics- Confidential & Proprietary
4
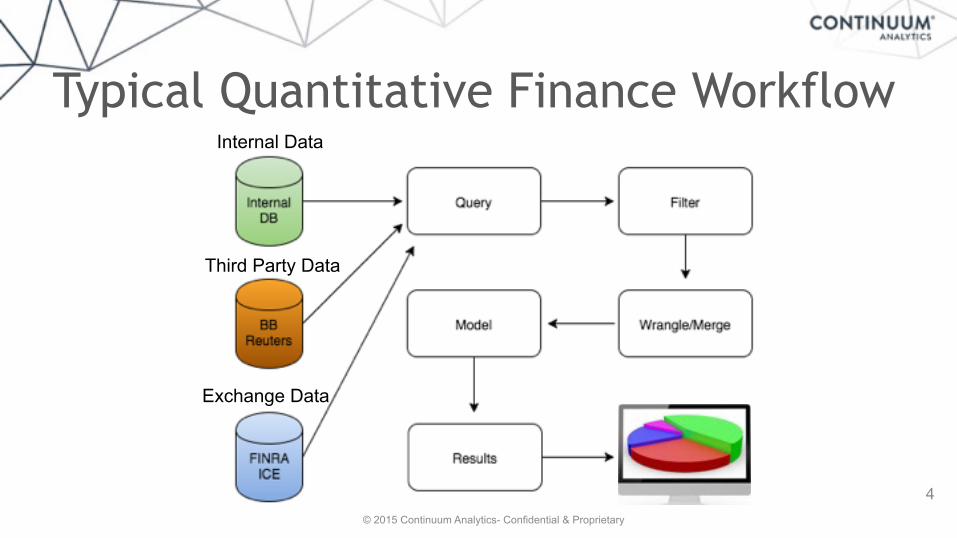
Typical Quantitative Finance WorkflowInternal Data
Third Party Data
Exchange Data
© 2015 Continuum Analytics- Confidential & Proprietary
5
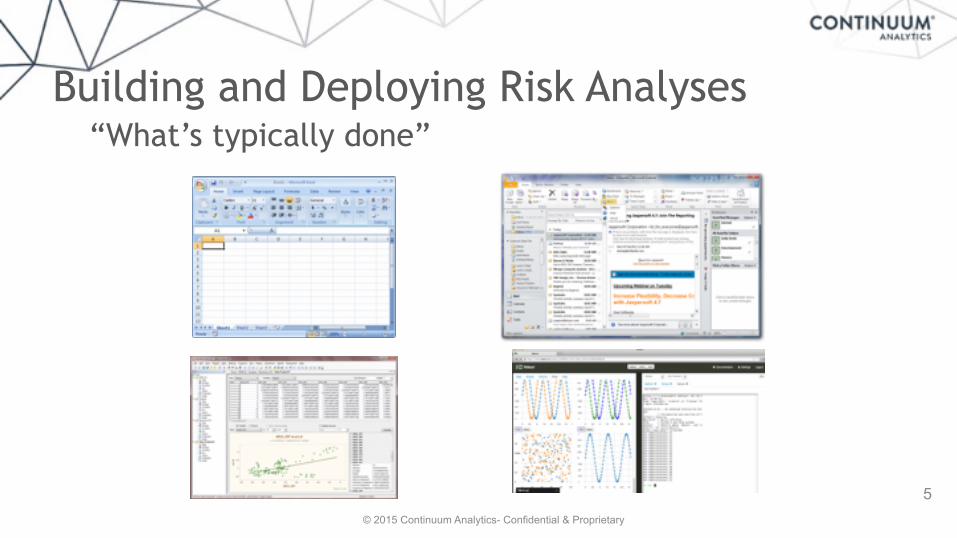
Building and Deploying Risk Analyses“What’s typically done”
© 2015 Continuum Analytics- Confidential & Proprietary
6
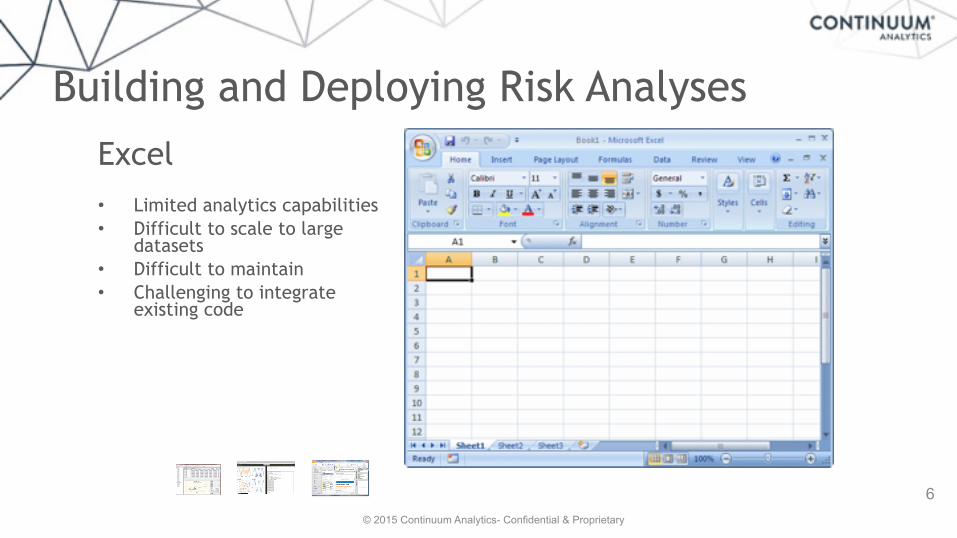
Building and Deploying Risk AnalysesExcel • Limited analytics capabilities • Difficult to scale to large
datasets • Difficult to maintain • Challenging to integrate
existing code
© 2015 Continuum Analytics- Confidential & Proprietary
7
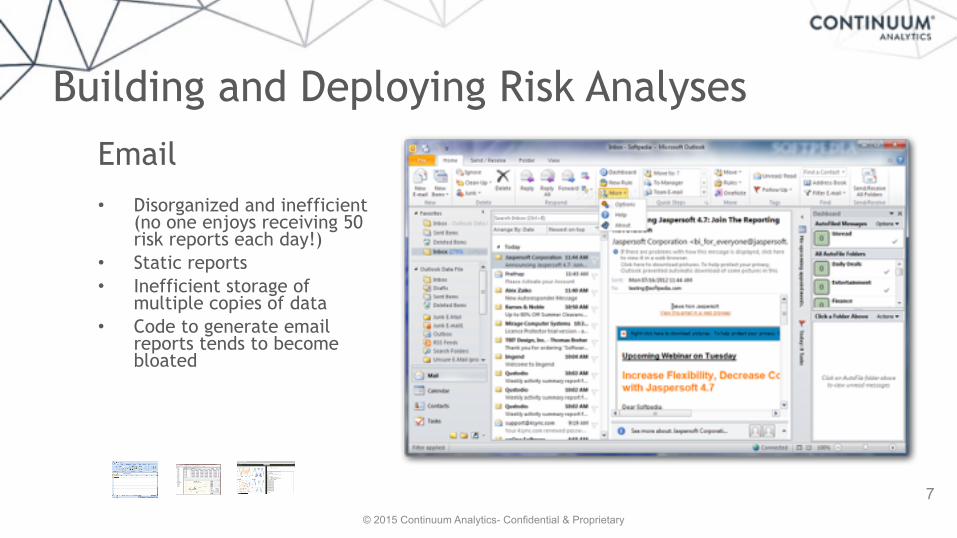
Building and Deploying Risk AnalysesEmail • Disorganized and inefficient
(no one enjoys receiving 50 risk reports each day!)
• Static reports • Inefficient storage of
multiple copies of data • Code to generate email
reports tends to become bloated
© 2015 Continuum Analytics- Confidential & Proprietary
8
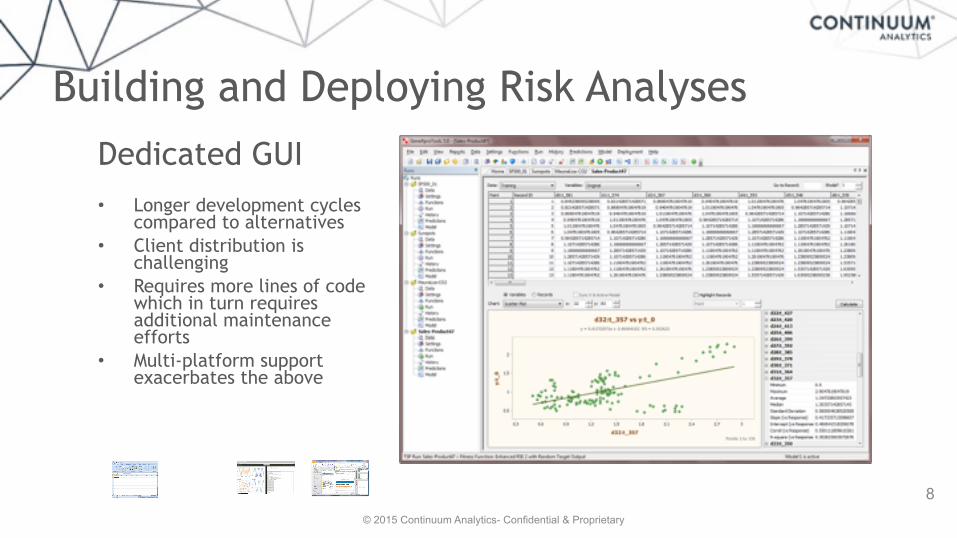
Building and Deploying Risk AnalysesDedicated GUI • Longer development cycles
compared to alternatives • Client distribution is
challenging • Requires more lines of code
which in turn requires additional maintenance efforts
• Multi-platform support exacerbates the above
© 2015 Continuum Analytics- Confidential & Proprietary
9
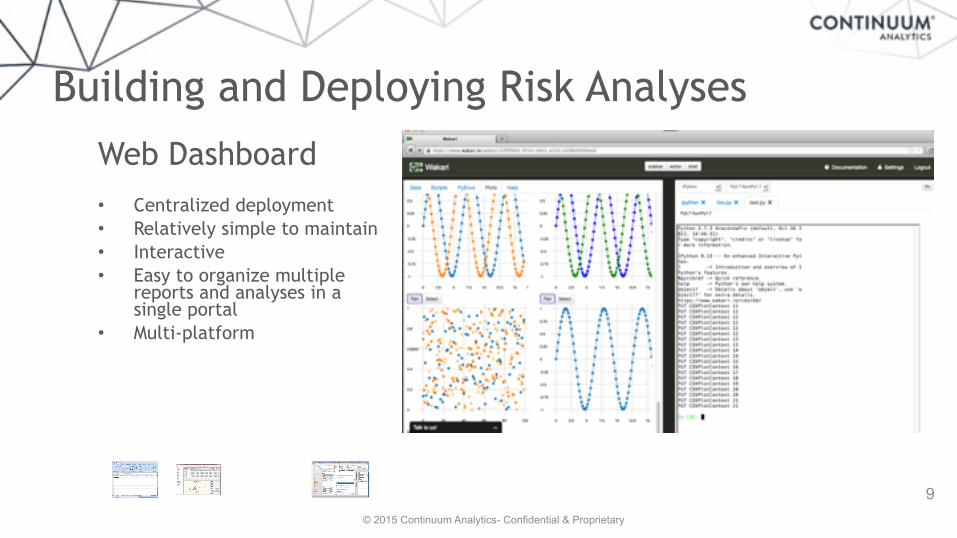
Building and Deploying Risk AnalysesWeb Dashboard • Centralized deployment • Relatively simple to maintain • Interactive • Easy to organize multiple
reports and analyses in a single portal
• Multi-platform
© 2015 Continuum Analytics- Confidential & Proprietary
Where Bokeh Fits
10
• Interactive web visualization w/o writing Javascript • Quick to develop (hours to days per dashboard, not
weeks) • Minimal code required (~100-400 lines per dashboard) • Wide variety of input widgets • Efficient use of browser resources • Server based plotting for handling and streaming
large data sets
Easily create that dashboard
© 2015 Continuum Analytics- Confidential & Proprietary
11
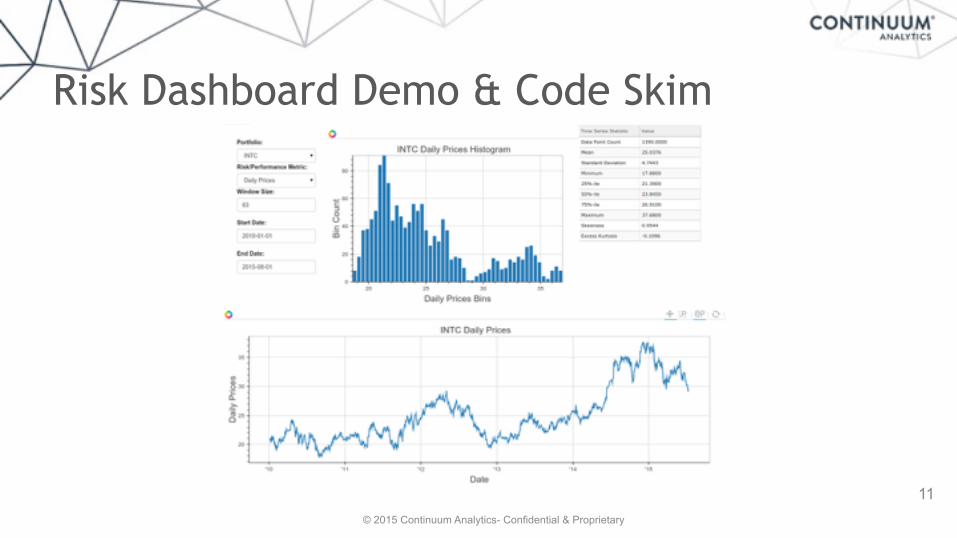
Risk Dashboard Demo & Code Skim
© 2015 Continuum Analytics- Confidential & Proprietary
How Continuum Can Help
12
Continuum Analytics provides consulting services, including:
• Customized dashboard design, development, trading-specific data analysis & visualization, and maintenance
• Internal and external data integration • Deployment • Authentication, maintenance, and support on an on-
needed basis
© 2015 Continuum Analytics- Confidential & Proprietary
Additional Info
13
Demo code: http://bit.ly/bokeh_risk
Duane: [email protected] Steve: [email protected]