Embed Size (px)
Citation preview

5 EXCEL COMMANDS USED TO CREATE AN INTERACTIVE DASHBOARD
RAMAN DHIMAN INDIAN INSTITUTE OF MANAGEMENT (IIM) SHILLONG
Also MBA Candidate for IESE Business School, Spain
(FT Global MBA ranking – Rank 7th for IESE)
§ To present Short, Crisp and Clear information to the audience. (The dashboard which I am going to show you has around 200 excel sheets in the background from which this dashboard is pulling actual data collected during my research)
§ Top management reviews. (Management will neither have time or interest to go thru data in my 200 excel sheets, but what they are interested in is the Short and crisp output in one snapshot)
§ Faster way of consolidating information (Once you have created the standard tables at the back end for the dashboard, the next time you go for a research you just need to plug information in the standard tables, and the Output on dashboard will change automatically)
§ You can make it Interactive / Easy to play with information
(Top Management is always interested in looking at the results if we change one, two or three variables. So with the help if Dashboard you can select different variables and see what is the effect instantly)
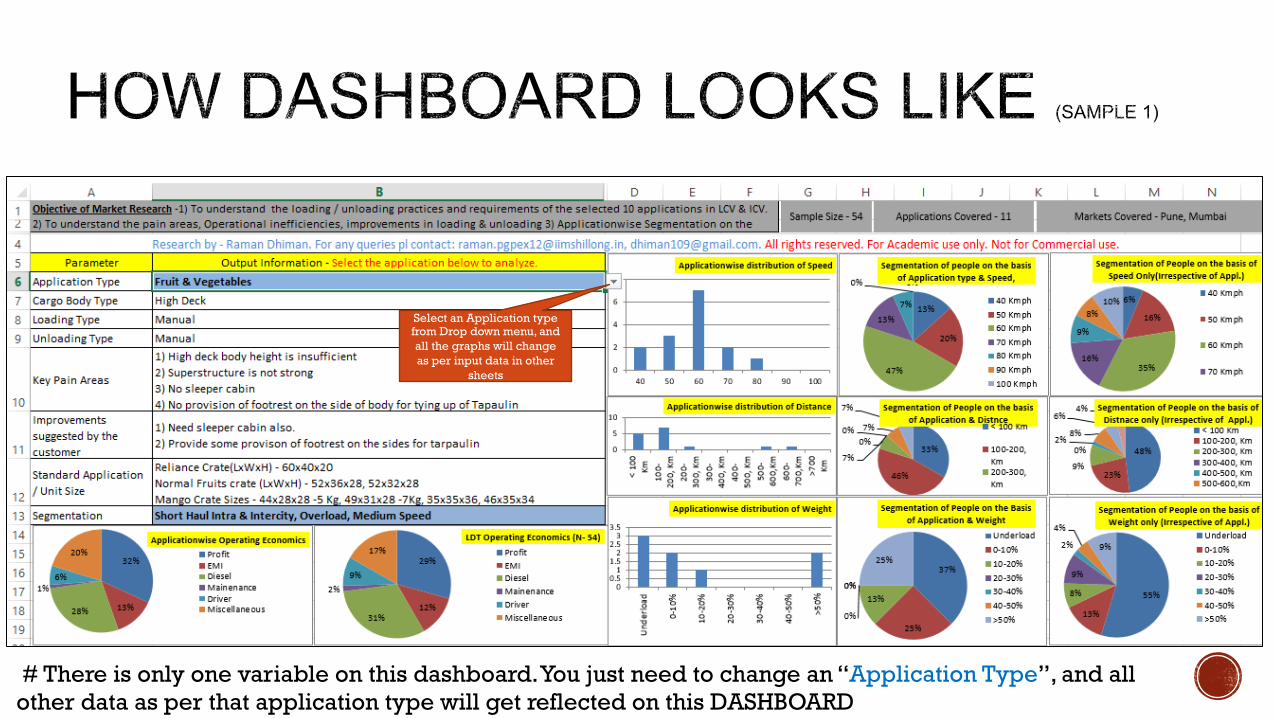
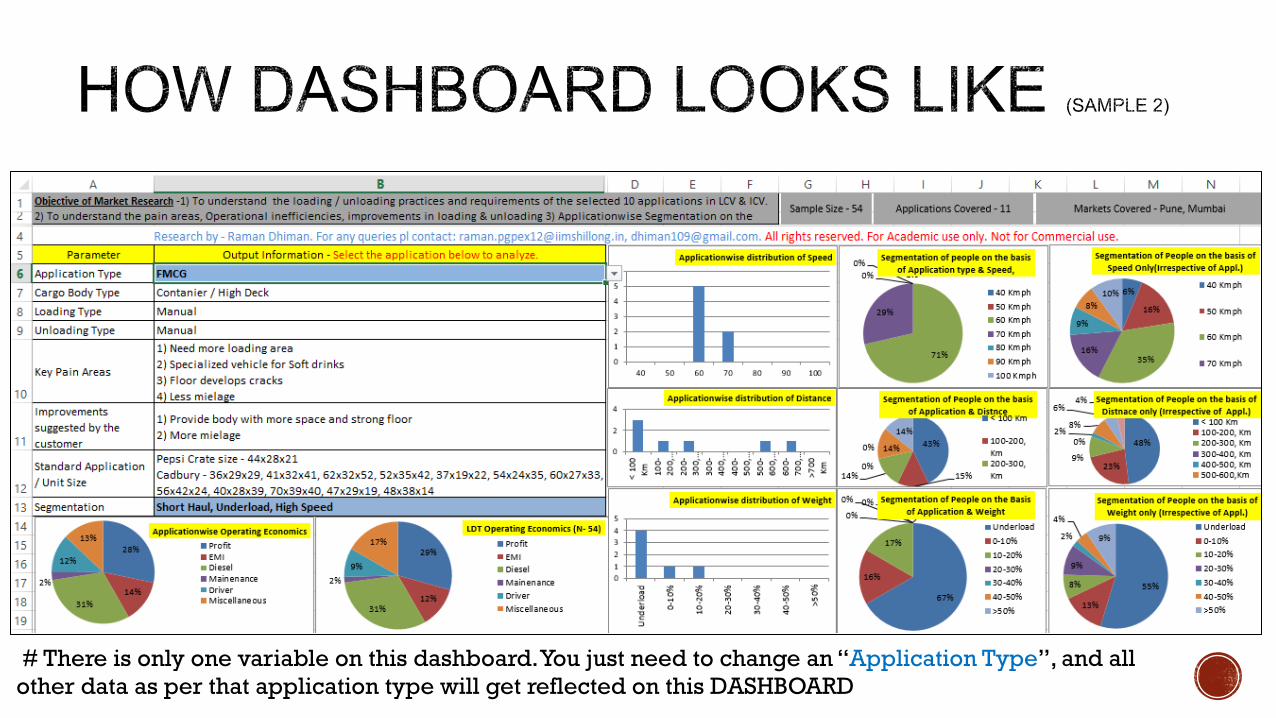
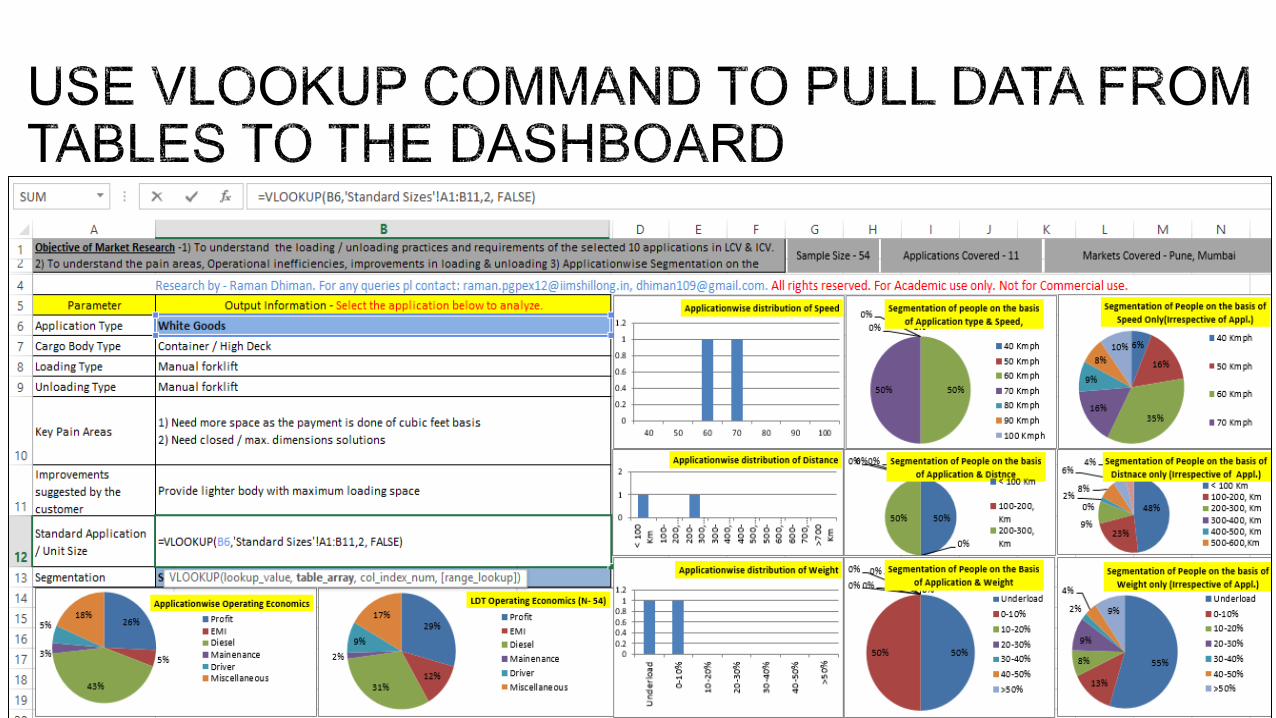
Select an Application type from Drop down menu, and all the graphs will change as per input data in other
sheets
# There is only one variable on this dashboard. You just need to change an “Application Type”, and all other data as per that application type will get reflected on this DASHBOARD
# There is only one variable on this dashboard. You just need to change an “Application Type”, and all other data as per that application type will get reflected on this DASHBOARD

Keep track of the excel commands used for arriving at the results
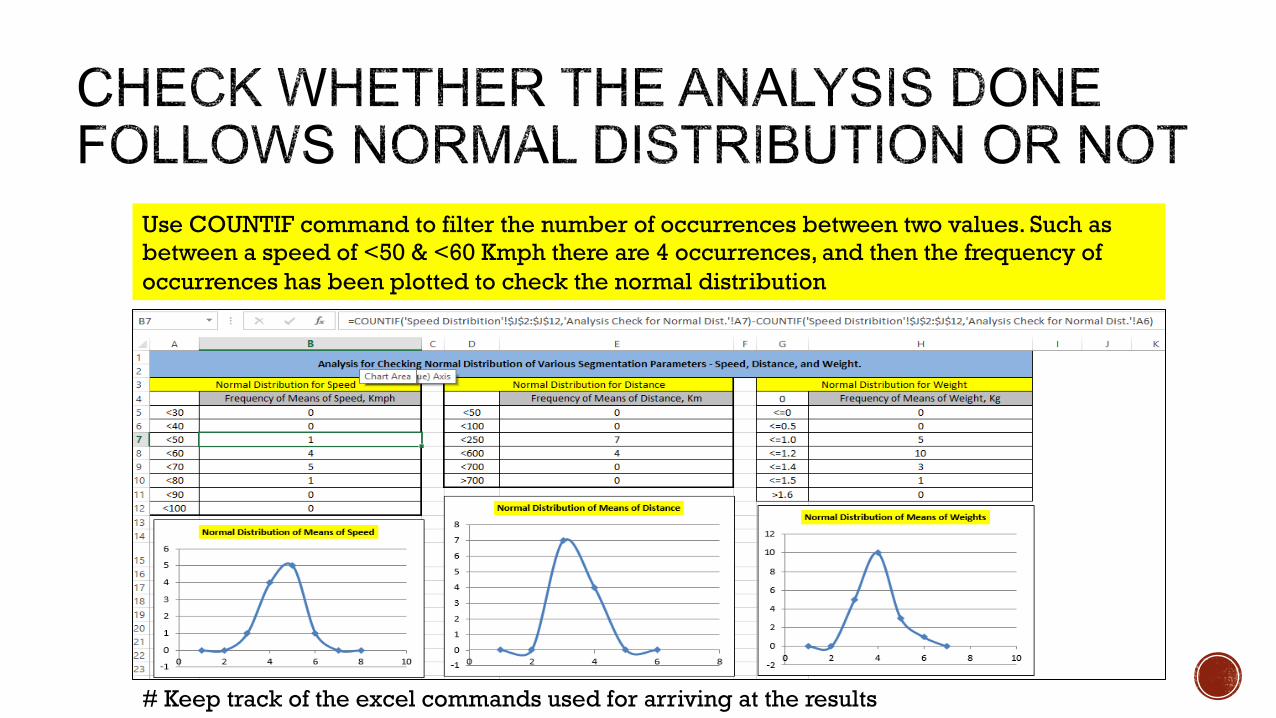
# Keep track of the excel commands used for arriving at the results
Use COUNTIF command to filter the number of occurrences between two values. Such as between a speed of <50 & <60 Kmph there are 4 occurrences, and then the frequency of occurrences has been plotted to check the normal distribution
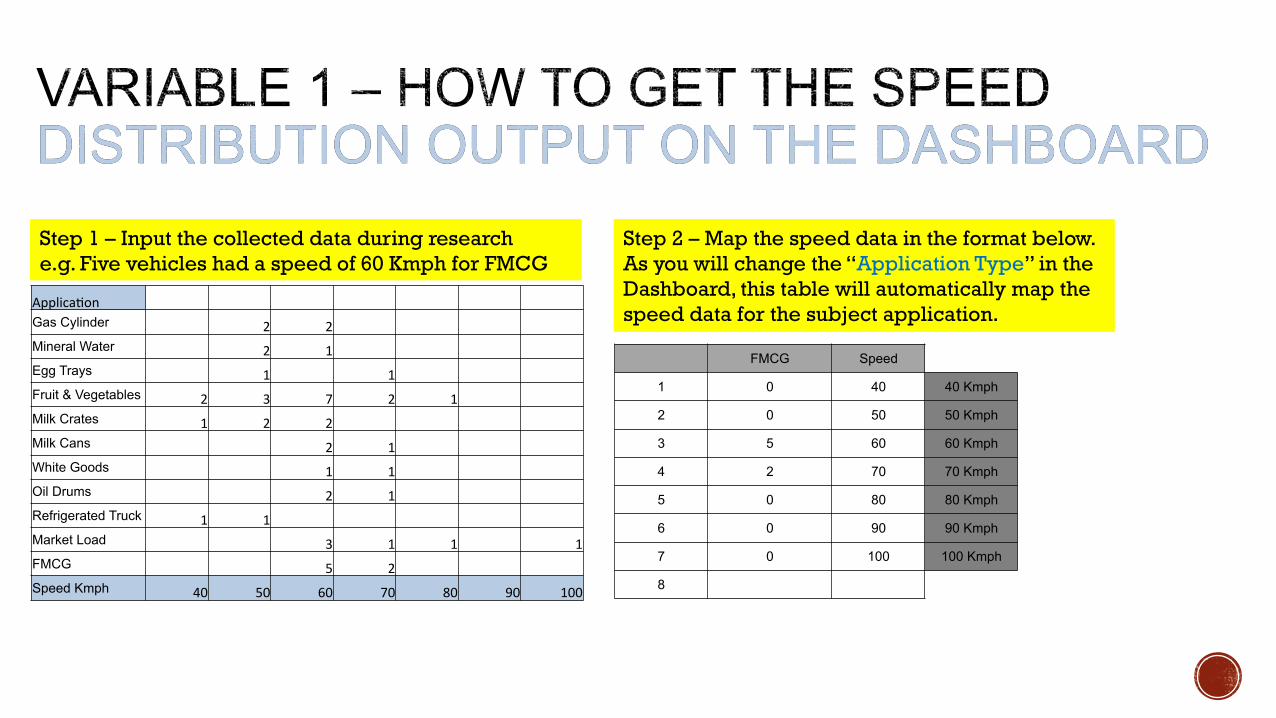
Applica'on 1 2 3 4 5 6 7 Gas Cylinder 2 2 Mineral Water 2 1 Egg Trays 1 1 Fruit & Vegetables 2 3 7 2 1 Milk Crates 1 2 2 Milk Cans 2 1 White Goods 1 1 Oil Drums 2 1 Refrigerated Truck 1 1 Market Load 3 1 1 1 FMCG 5 2 Speed Kmph 40 50 60 70 80 90 100
Step 1 – Input the collected data during research e.g. Five vehicles had a speed of 60 Kmph for FMCG
FMCG Speed
1 0 40 40 Kmph
2 0 50 50 Kmph
3 5 60 60 Kmph
4 2 70 70 Kmph
5 0 80 80 Kmph
6 0 90 90 Kmph
7 0 100 100 Kmph
8
Step 2 – Map the speed data in the format below. As you will change the “Application Type” in the Dashboard, this table will automatically map the speed data for the subject application.
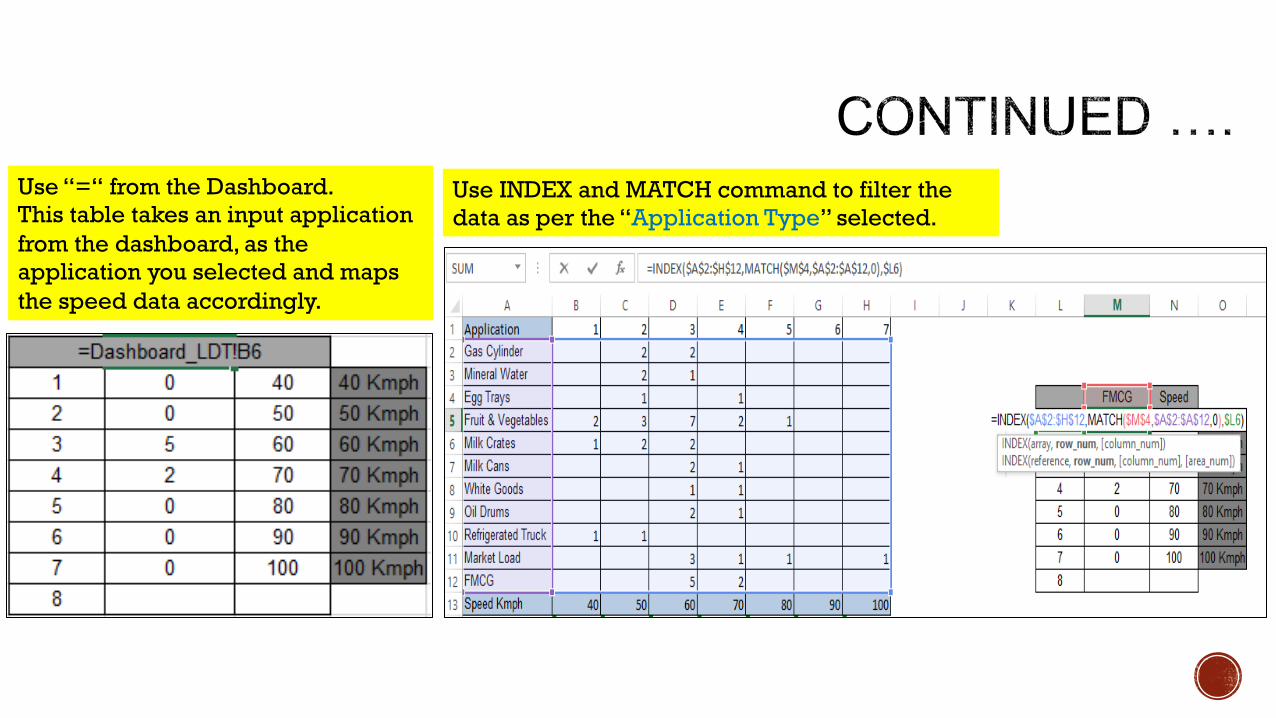
Use “=“ from the Dashboard. This table takes an input application from the dashboard, as the application you selected and maps the speed data accordingly.
Use INDEX and MATCH command to filter the data as per the “Application Type” selected.
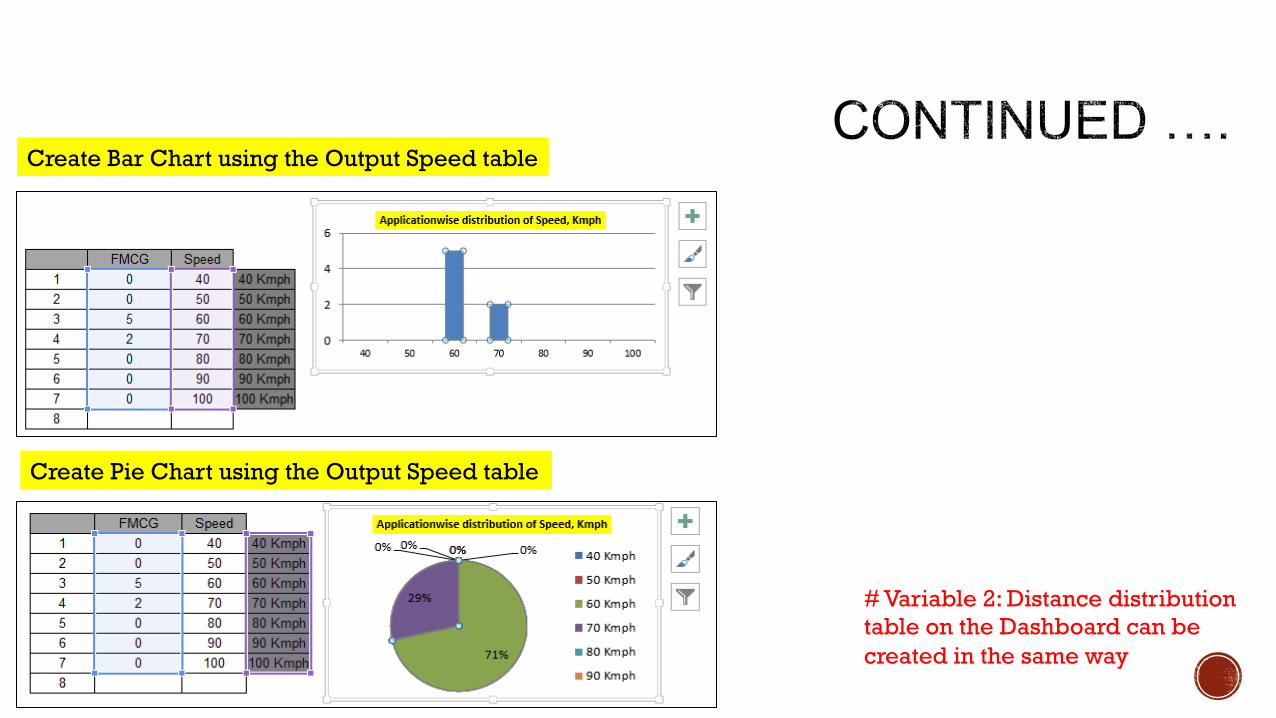
Create Bar Chart using the Output Speed table
Create Pie Chart using the Output Speed table
# Variable 2: Distance distribution table on the Dashboard can be created in the same way
SFC 407
SFC 407
Pick Up
SFC7
09
SFC 909
LPT 407
LPT 709
Ultra
10.4TH
D
Ultra 9.6
Ultra
LPT 909
LPT 1109
BB 914
BB12
14
Eicher
11.10
Eicher
10.50
Eicher
10.90 /
Canter
AL Ecomet
HD
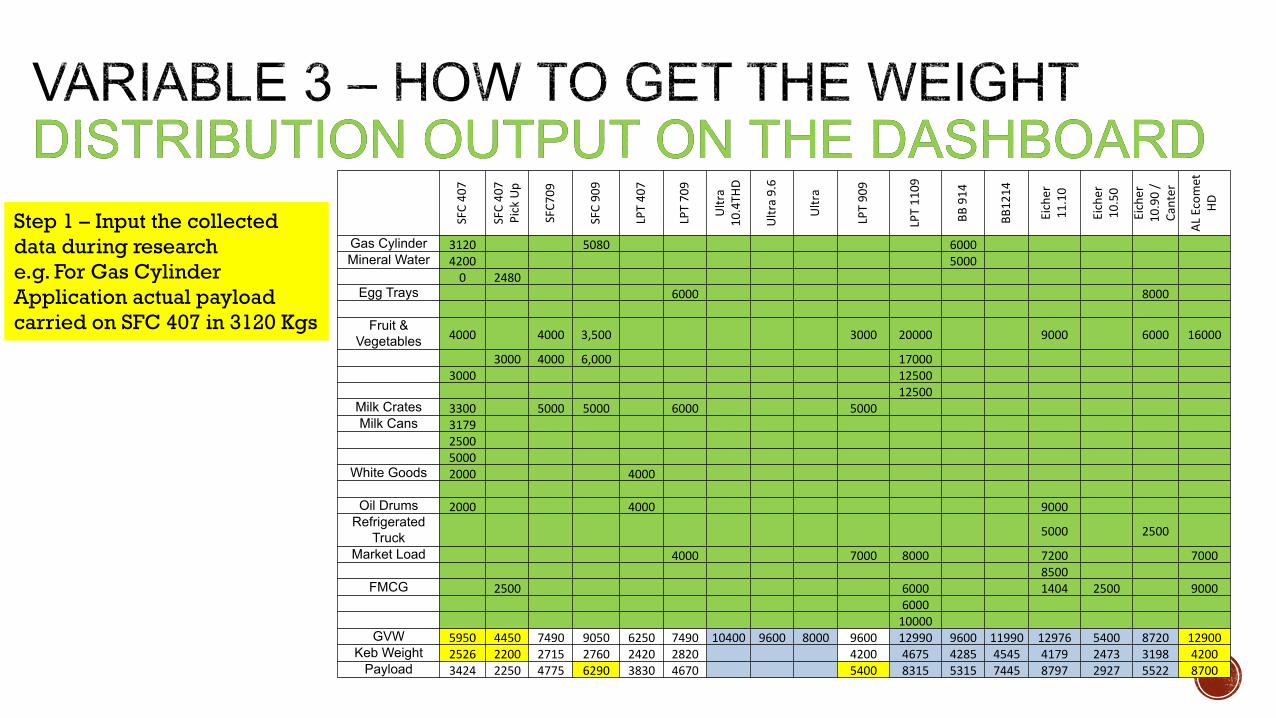
Gas Cylinder 3120 5080 6000 Mineral Water 4200 5000
0 2480 Egg Trays 6000 8000
Fruit &
Vegetables 4000 4000 3,500 3000 20000 9000 6000 16000
3000 4000 6,000 17000 3000 12500 12500
Milk Crates 3300 5000 5000 6000 5000 Milk Cans 3179
2500 5000
White Goods 2000 4000
Oil Drums 2000 4000 9000 Refrigerated
Truck 5000 2500
Market Load 4000 7000 8000 7200 7000 8500
FMCG 2500 6000 1404 2500 9000 6000 10000
GVW 5950 4450 7490 9050 6250 7490 10400 9600 8000 9600 12990 9600 11990 12976 5400 8720 12900 Keb Weight 2526 2200 2715 2760 2420 2820 4200 4675 4285 4545 4179 2473 3198 4200
Payload 3424 2250 4775 6290 3830 4670 5400 8315 5315 7445 8797 2927 5522 8700
Step 1 – Input the collected data during research e.g. For Gas Cylinder Application actual payload carried on SFC 407 in 3120 Kgs
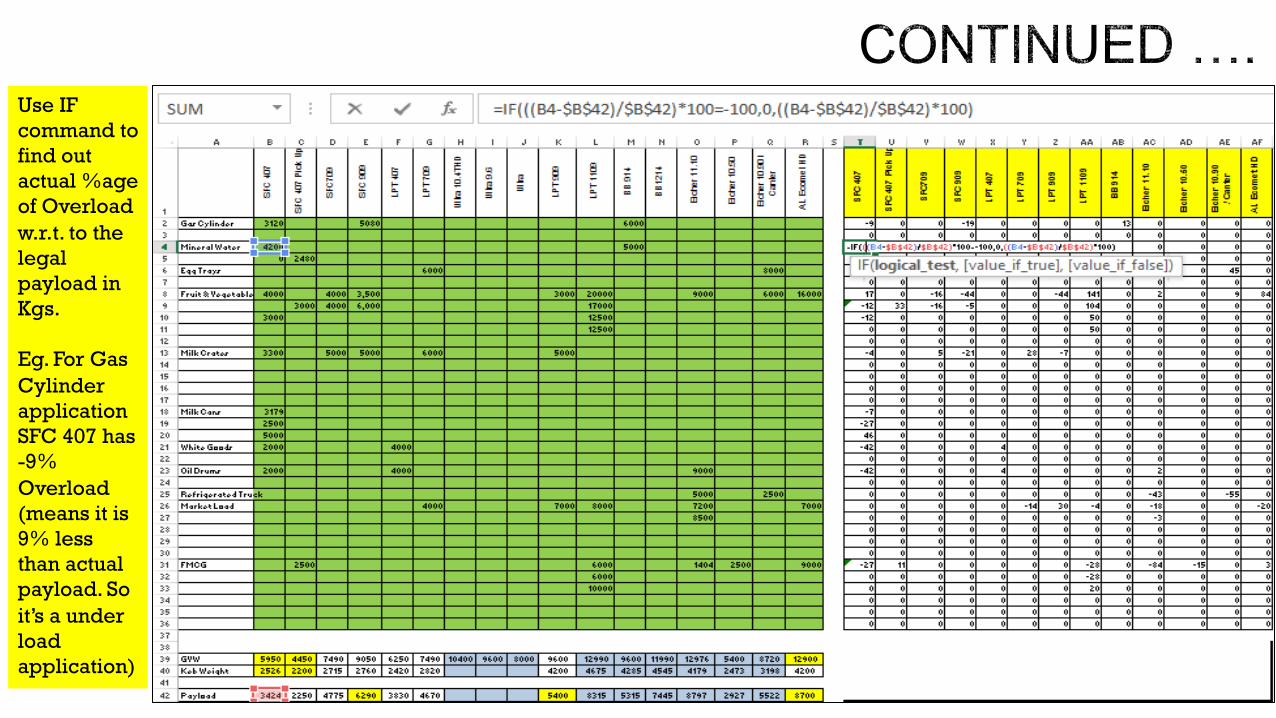
Use IF command to find out actual %age of Overload w.r.t. to the legal payload in Kgs. Eg. For Gas Cylinder application SFC 407 has -9% Overload (means it is 9% less than actual payload. So it’s a under load application)
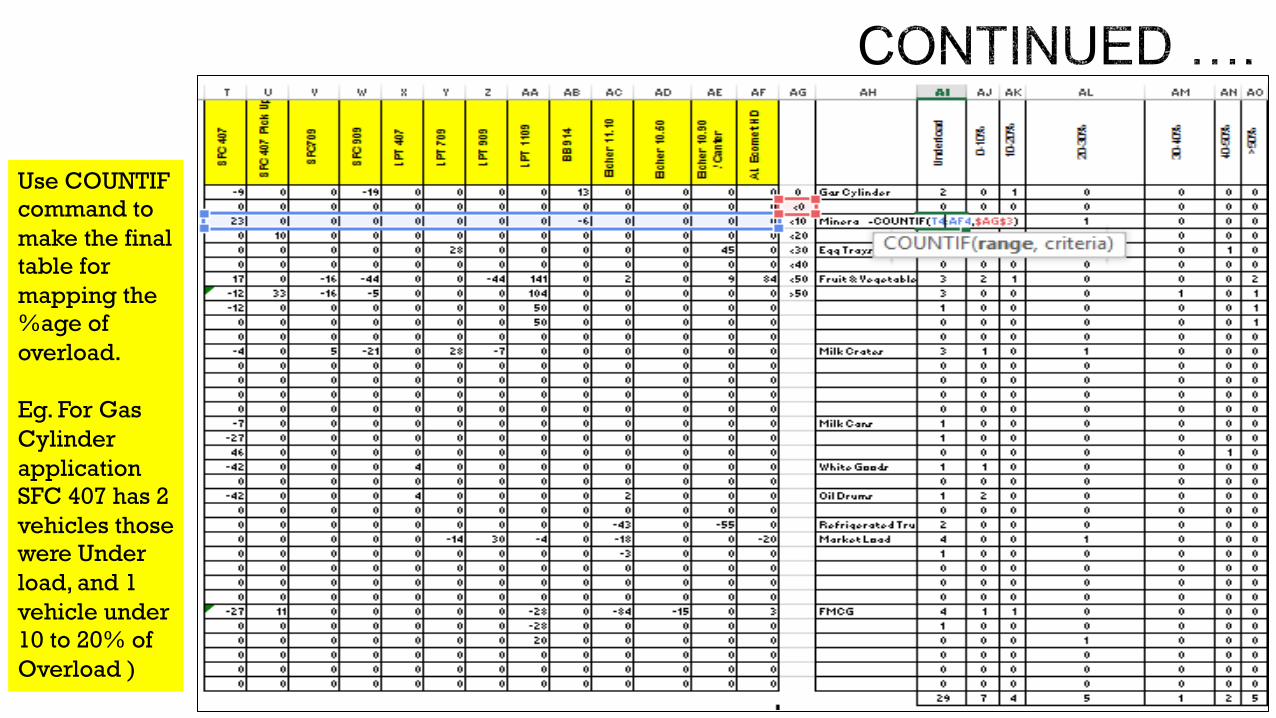
Use COUNTIF command to make the final table for mapping the %age of overload. Eg. For Gas Cylinder application SFC 407 has 2 vehicles those were Under load, and 1 vehicle under 10 to 20% of Overload )
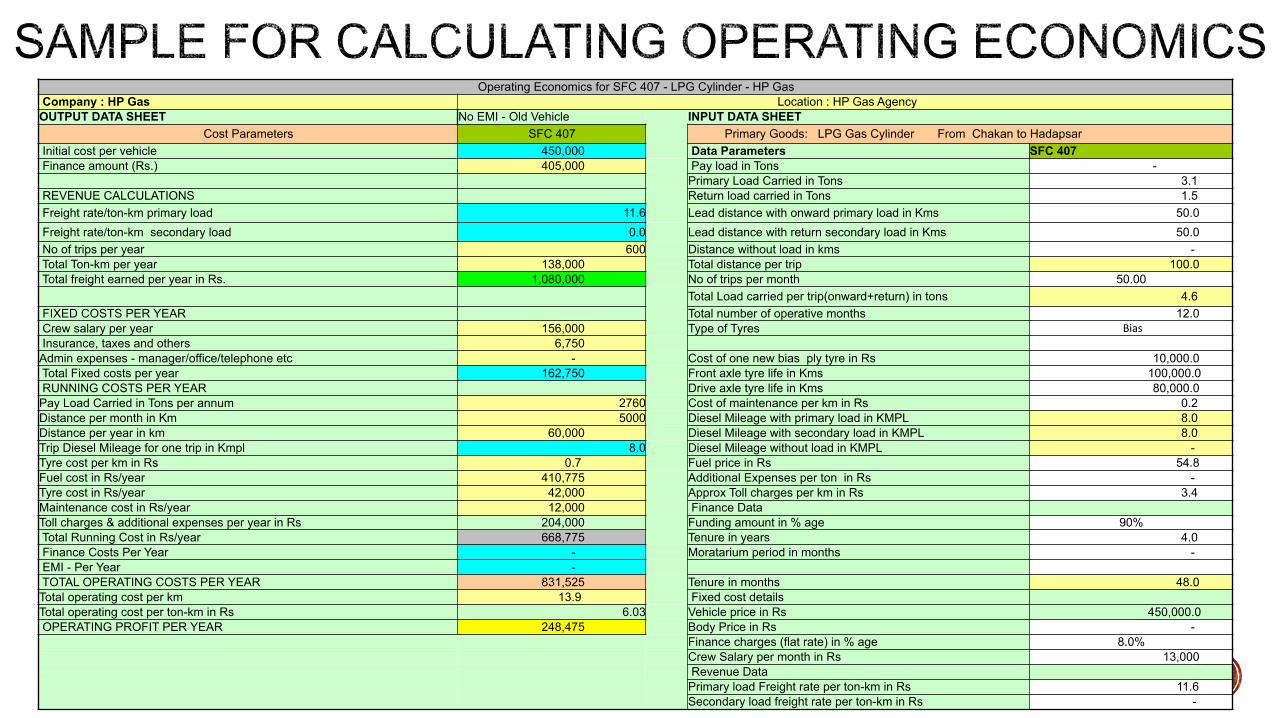
Operating Economics for SFC 407 - LPG Cylinder - HP Gas Company : HP Gas Location : HP Gas Agency OUTPUT DATA SHEET No EMI - Old Vehicle INPUT DATA SHEET
Cost Parameters SFC 407 Primary Goods: LPG Gas Cylinder From Chakan to Hadapsar Initial cost per vehicle 450,000 Data Parameters SFC 407 Finance amount (Rs.) 405,000 Pay load in Tons - Primary Load Carried in Tons 3.1 REVENUE CALCULATIONS Return load carried in Tons 1.5 Freight rate/ton-km primary load 11.6 Lead distance with onward primary load in Kms 50.0 Freight rate/ton-km secondary load 0.0 Lead distance with return secondary load in Kms 50.0 No of trips per year 600 Distance without load in kms - Total Ton-km per year 138,000 Total distance per trip 100.0 Total freight earned per year in Rs. 1,080,000 No of trips per month 50.00 Total Load carried per trip(onward+return) in tons 4.6 FIXED COSTS PER YEAR Total number of operative months 12.0 Crew salary per year 156,000 Type of Tyres Bias Insurance, taxes and others 6,750 Admin expenses - manager/office/telephone etc - Cost of one new bias ply tyre in Rs 10,000.0 Total Fixed costs per year 162,750 Front axle tyre life in Kms 100,000.0 RUNNING COSTS PER YEAR Drive axle tyre life in Kms 80,000.0 Pay Load Carried in Tons per annum 2760 Cost of maintenance per km in Rs 0.2 Distance per month in Km 5000 Diesel Mileage with primary load in KMPL 8.0 Distance per year in km 60,000 Diesel Mileage with secondary load in KMPL 8.0 Trip Diesel Mileage for one trip in Kmpl 8.0 Diesel Mileage without load in KMPL - Tyre cost per km in Rs 0.7 Fuel price in Rs 54.8 Fuel cost in Rs/year 410,775 Additional Expenses per ton in Rs - Tyre cost in Rs/year 42,000 Approx Toll charges per km in Rs 3.4 Maintenance cost in Rs/year 12,000 Finance Data Toll charges & additional expenses per year in Rs 204,000 Funding amount in % age 90% Total Running Cost in Rs/year 668,775 Tenure in years 4.0 Finance Costs Per Year - Moratarium period in months - EMI - Per Year - TOTAL OPERATING COSTS PER YEAR 831,525 Tenure in months 48.0 Total operating cost per km 13.9 Fixed cost details Total operating cost per ton-km in Rs 6.03 Vehicle price in Rs 450,000.0 OPERATING PROFIT PER YEAR 248,475 Body Price in Rs - Finance charges (flat rate) in % age 8.0% Crew Salary per month in Rs 13,000 Revenue Data Primary load Freight rate per ton-km in Rs 11.6 Secondary load freight rate per ton-km in Rs -
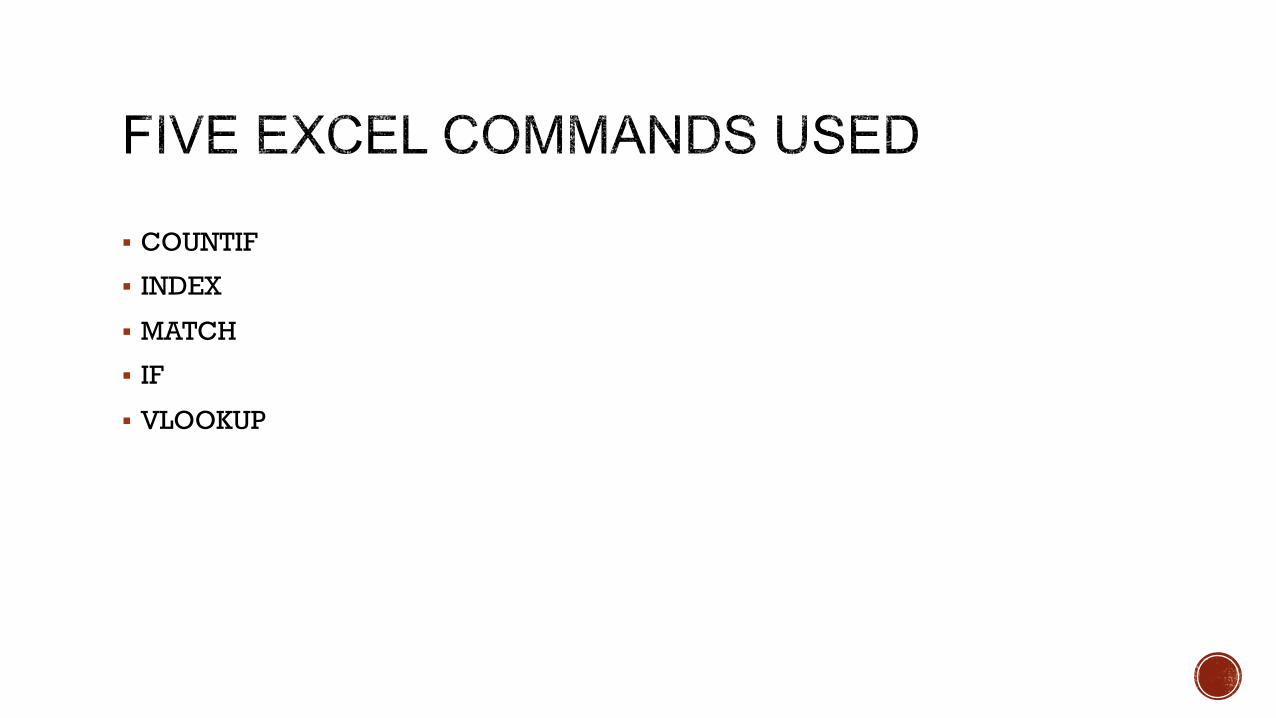
§ COUNTIF
§ INDEX
§ MATCH
§ IF
§ VLOOKUP
Like this you may create DASHBOARD for any other data type or research as well.
You may please reach out to me for an excel sheet or email me for more understanding or any support required pertaining to your DASHBOARD problem.
You may reach me on:
@United States of America