Embed Size (px)
Citation preview
Responding to ContextUsing data to design experiences that care about customers
@hollielubbock @codeandtheory
@hollielubbock
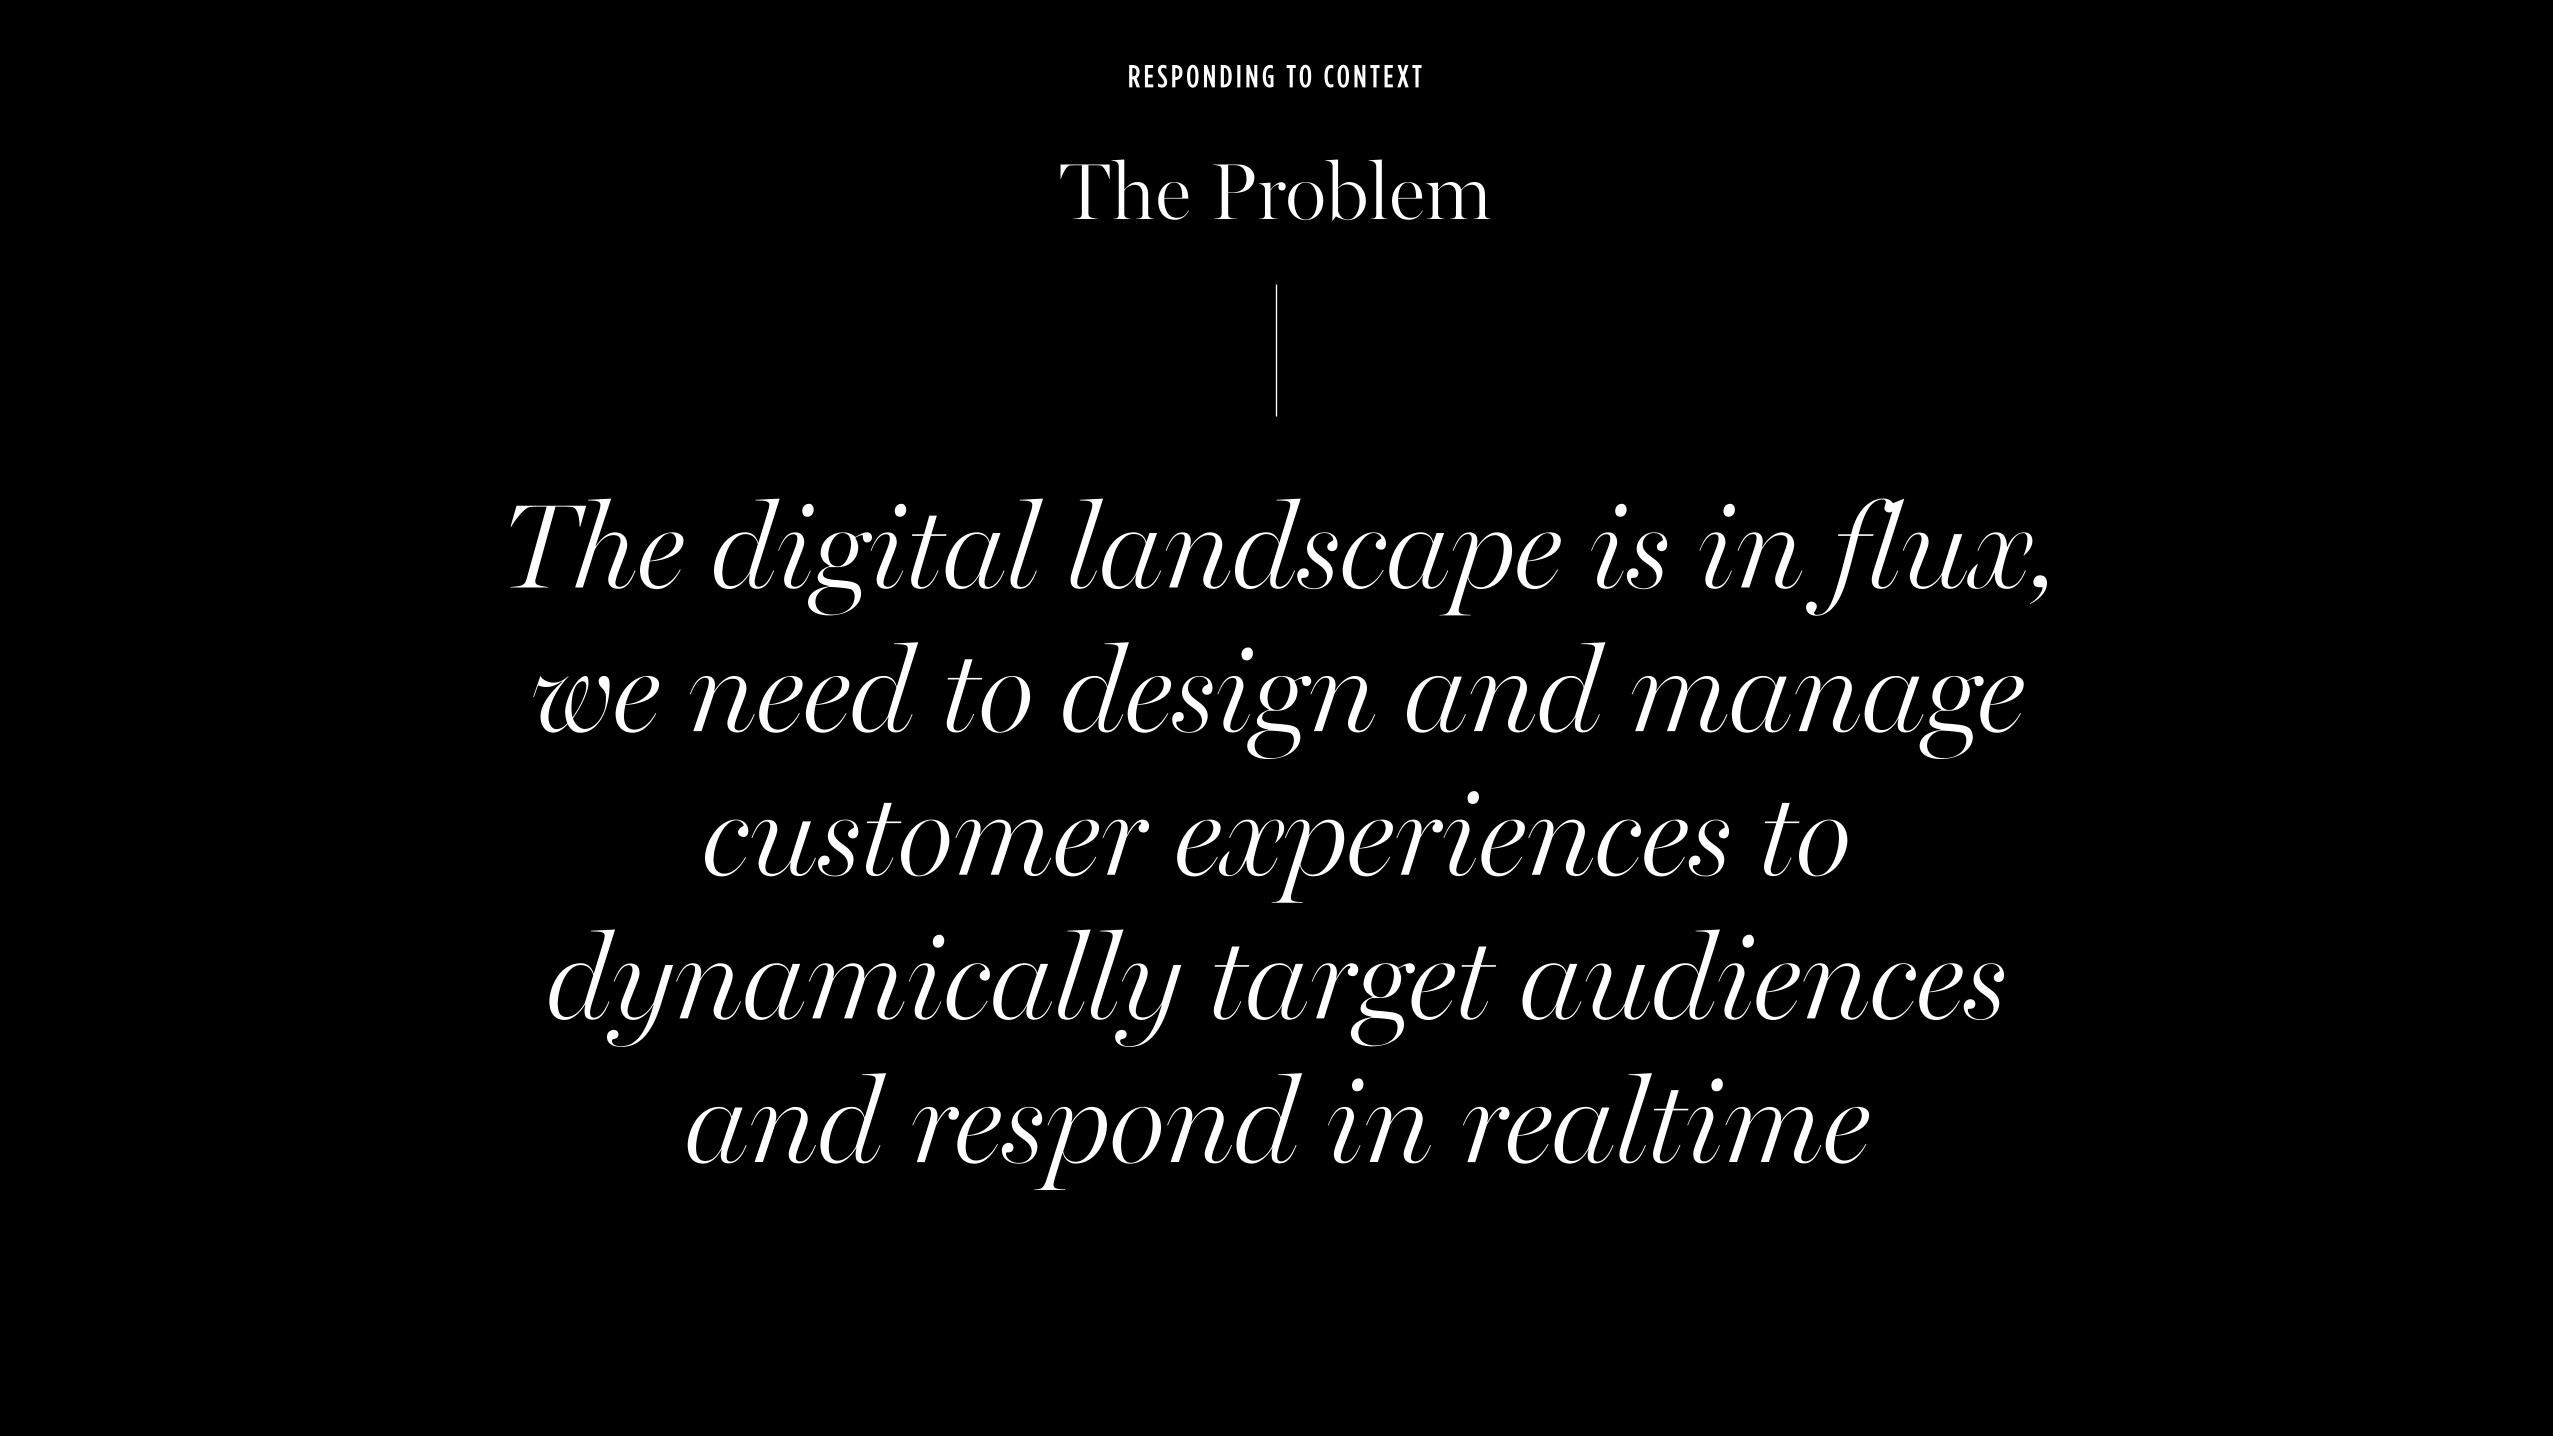
The digital landscape is in flux, we need to design and manage
customer experiences to dynamically target audiences
and respond in realtime
The Problem
R E S P O N D I N G TO CO N T E X T
@hollielubbock
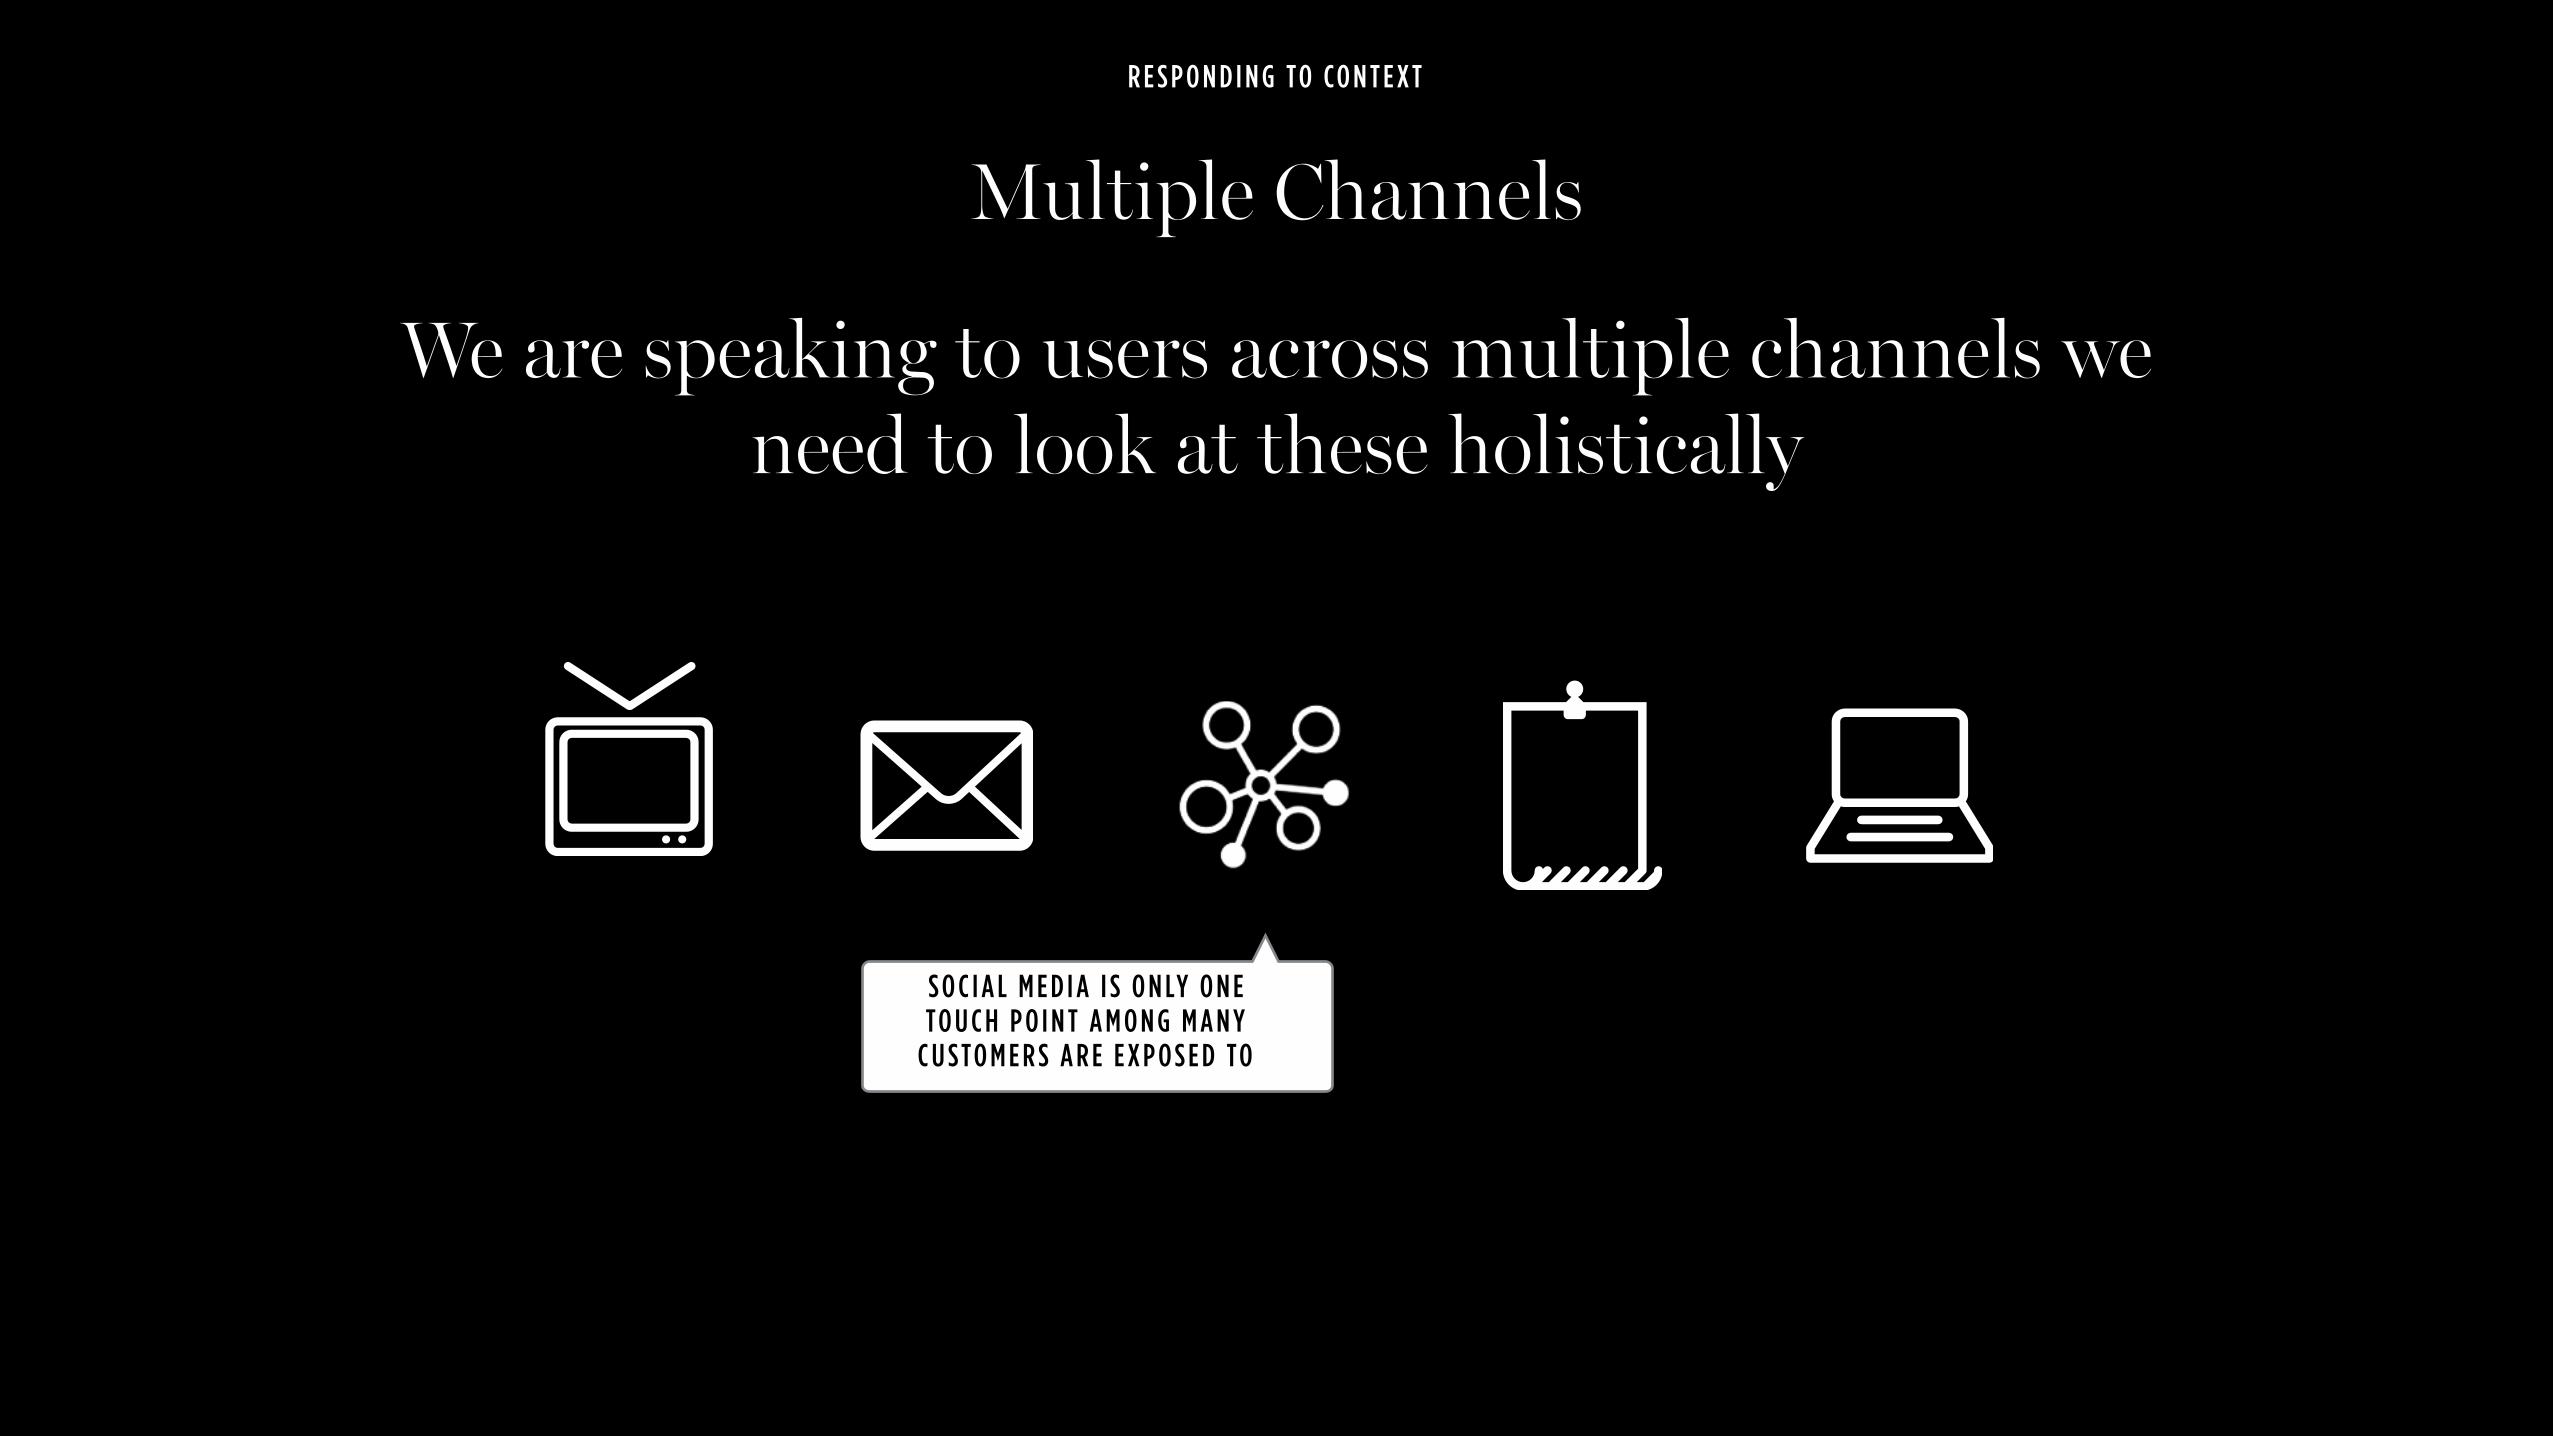
Multiple Channels
R E S P O N D I N G TO CO N T E X T
S O C I A L M E D I A I S O N LY O N E TO U C H P O I N T A M O N G M A N Y
C U S TO M E R S A R E E X P O S E D TO
We are speaking to users across multiple channels we need to look at these holistically
@hollielubbock
Filter Bubbles
R E S P O N D I N G TO CO N T E X T
U S E R S V I E W S O F T H E I N F O R M AT I O N O N T H E I N T E R N E T I S E V E N M O R E F I LT E R E D
"collectively, these filters will isolate people in information bubbles only partly of their own choosing, and the inaccurate beliefs they form
as a result may be difficult to correct.”
Paul Resnick and colleagues University of Michigan's School of Information
@hollielubbock
Tailored Content
R E S P O N D I N G TO CO N T E X T
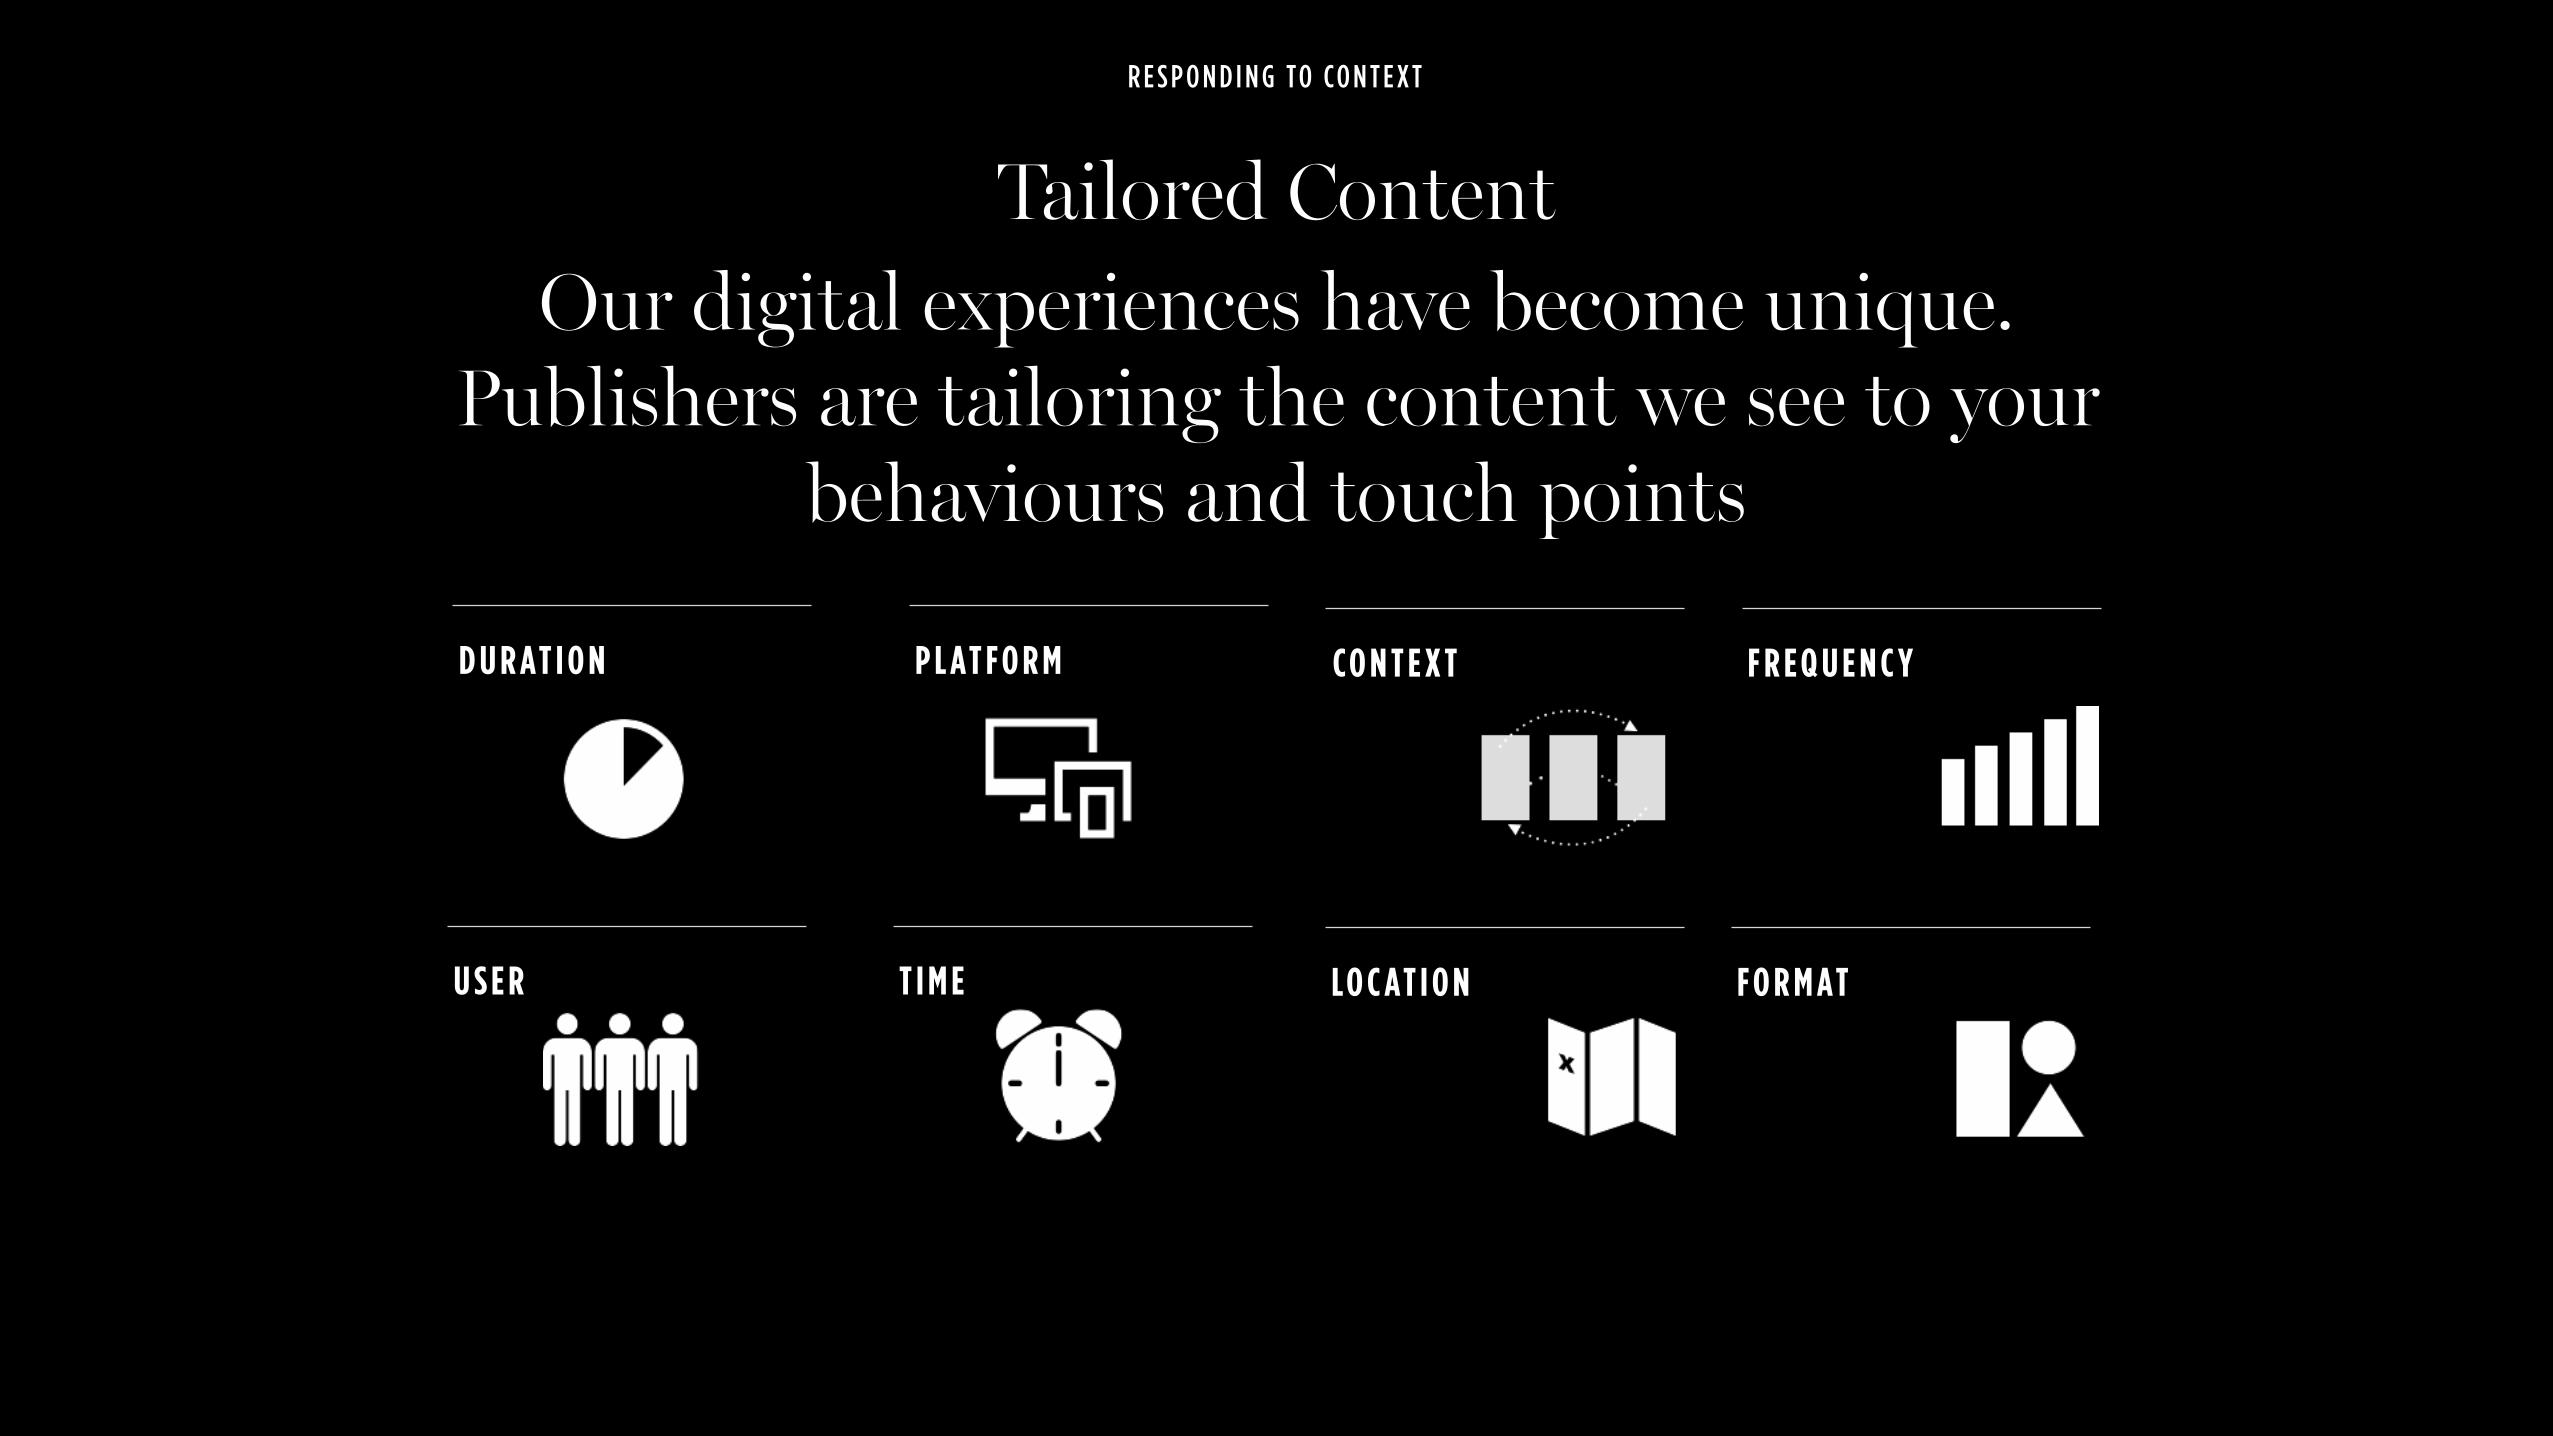
D U R AT I O N P L AT F O R M
U S E R T I M E
CO N T E X T F R E Q U E N C Y
LO C AT I O N F O R M AT
Our digital experiences have become unique. Publishers are tailoring the content we see to your
behaviours and touch points
@hollielubbock
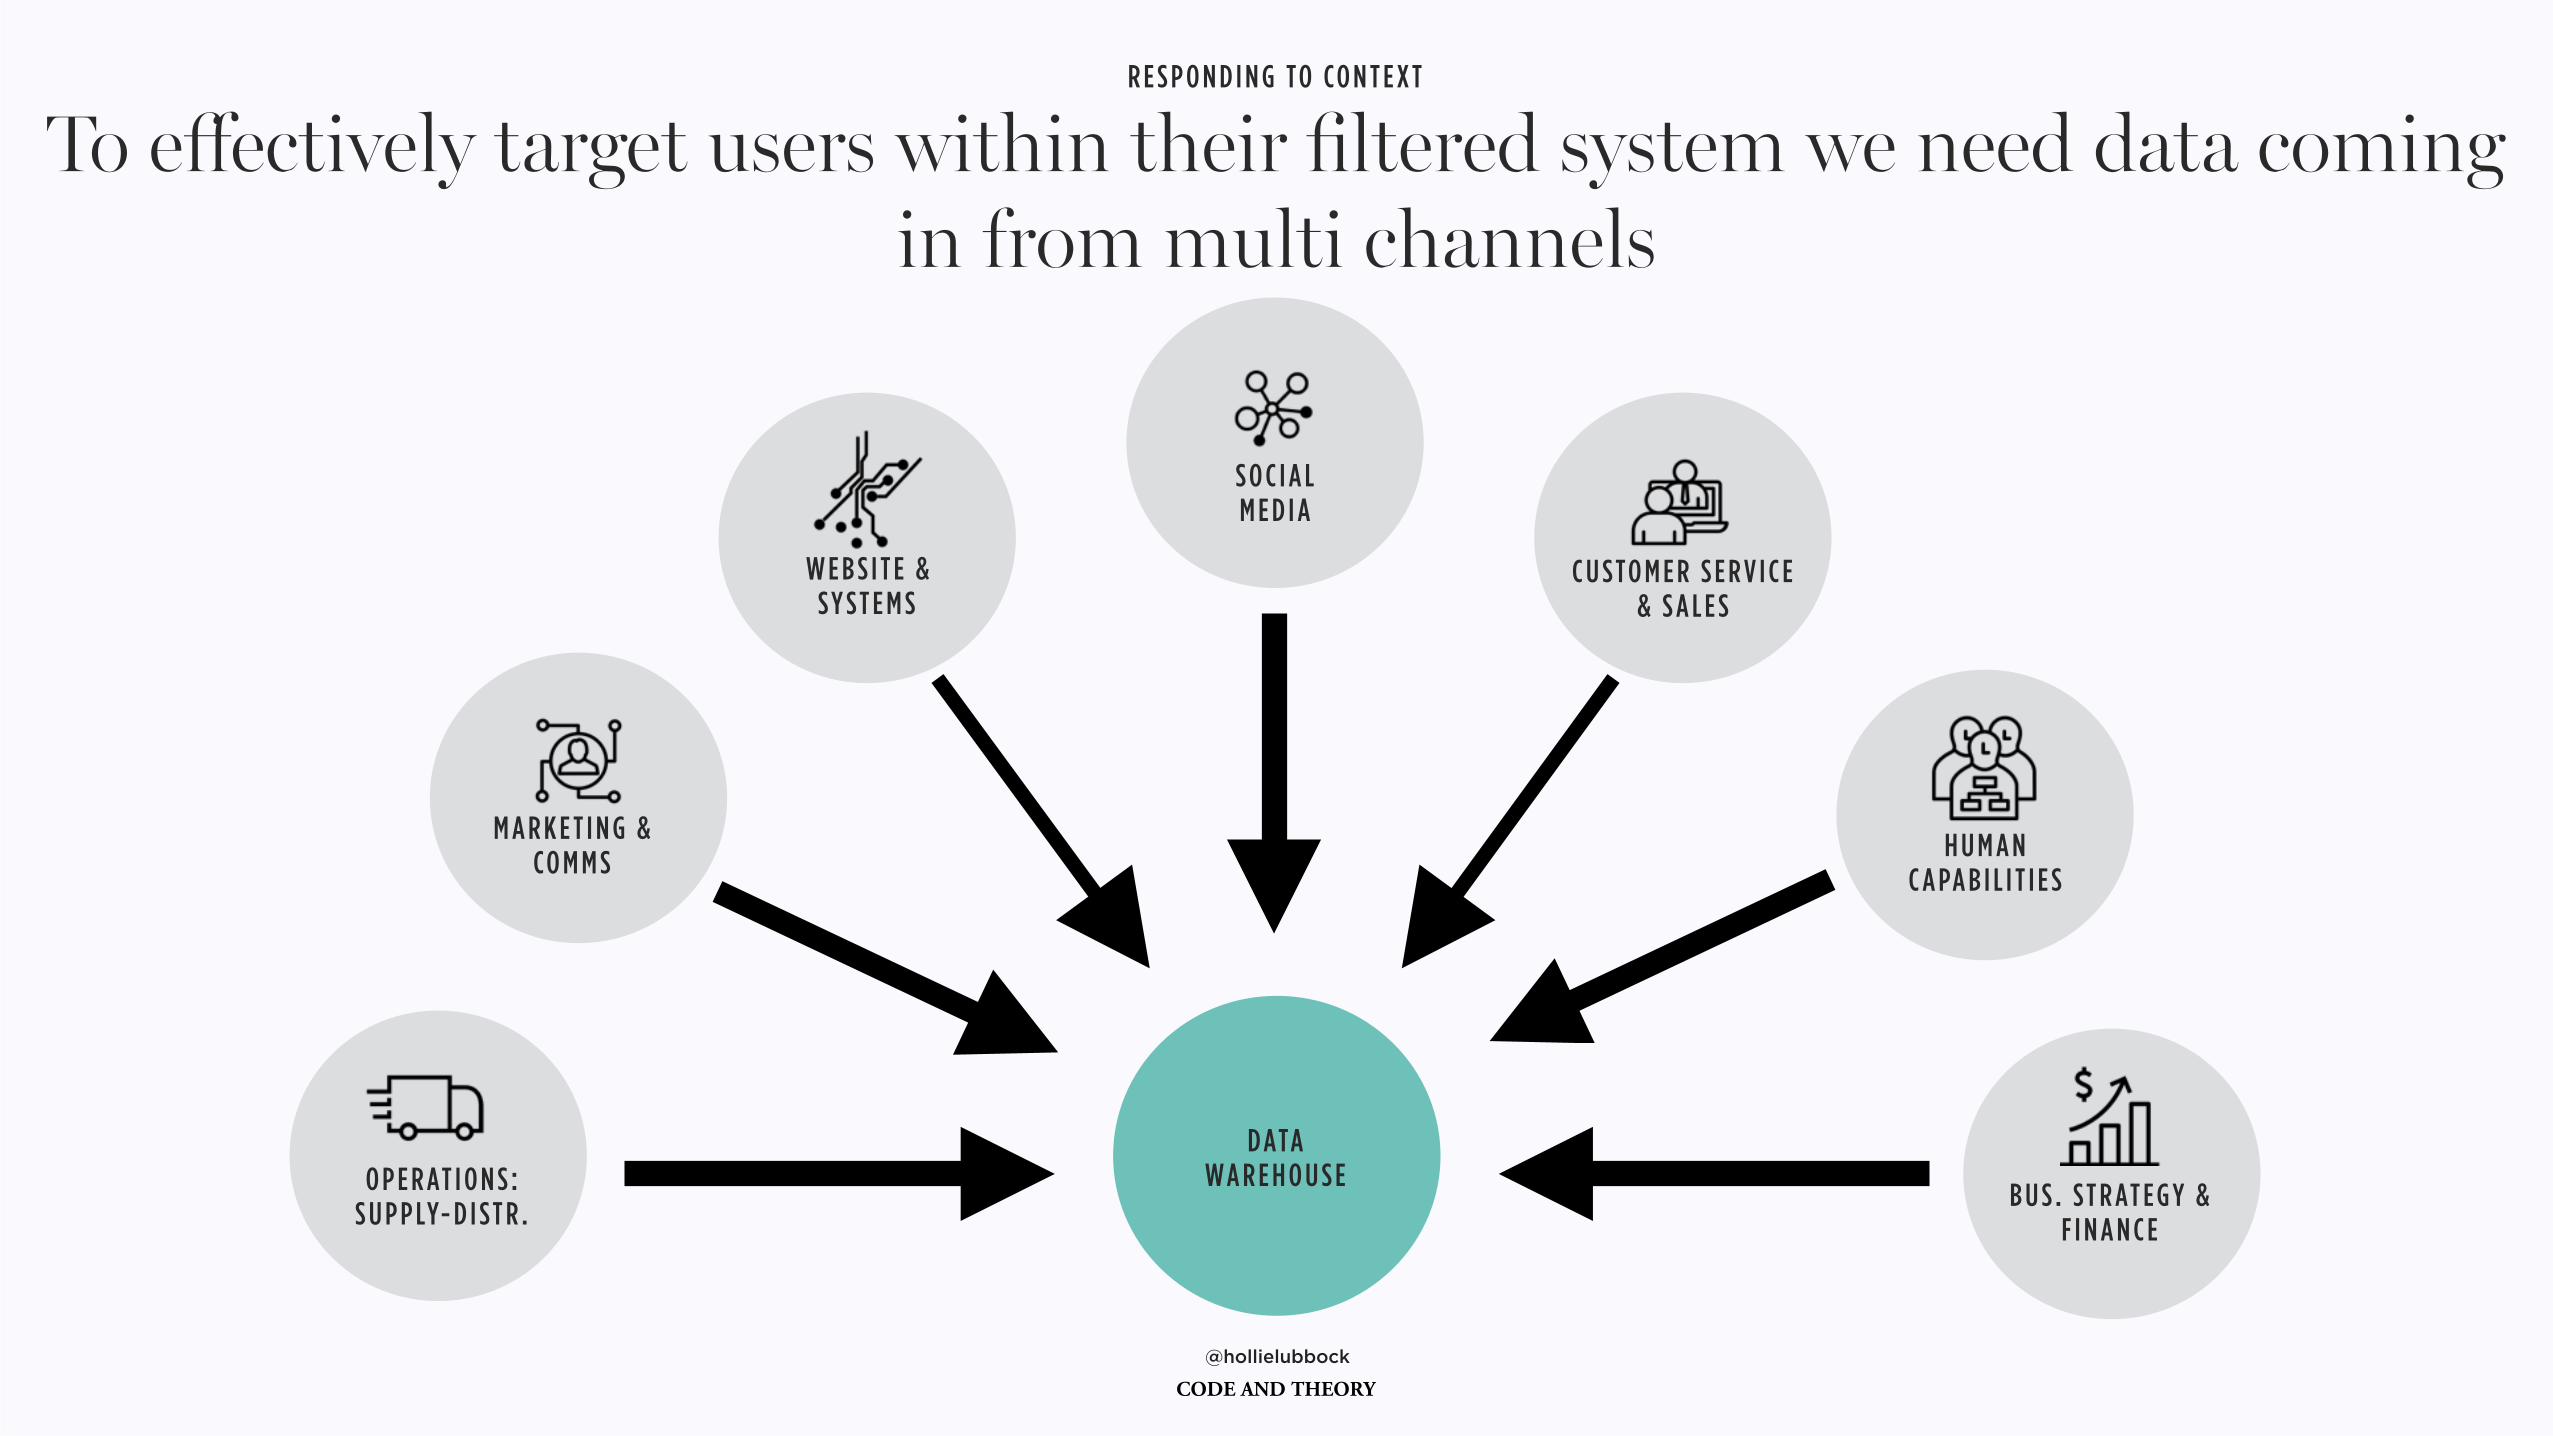
To effectively target users within their filtered system we need data coming in from multi channels
R E S P O N D I N G TO CO N T E X T
B U S . S T R AT E G Y & F I N A N C E
M A R K E T I N G & CO M M S
C U S TO M E R S E R V I C E & S A L E S
O P E R AT I O N S : S U P P LY- D I S T R .
H U M A N C A PA B I L I T I E S
W E B S I T E & S Y S T E M S
D ATA W A R E H O U S E
S O C I A L M E D I A
@hollielubbock
R E S P O N D I N G TO CO N T E X T
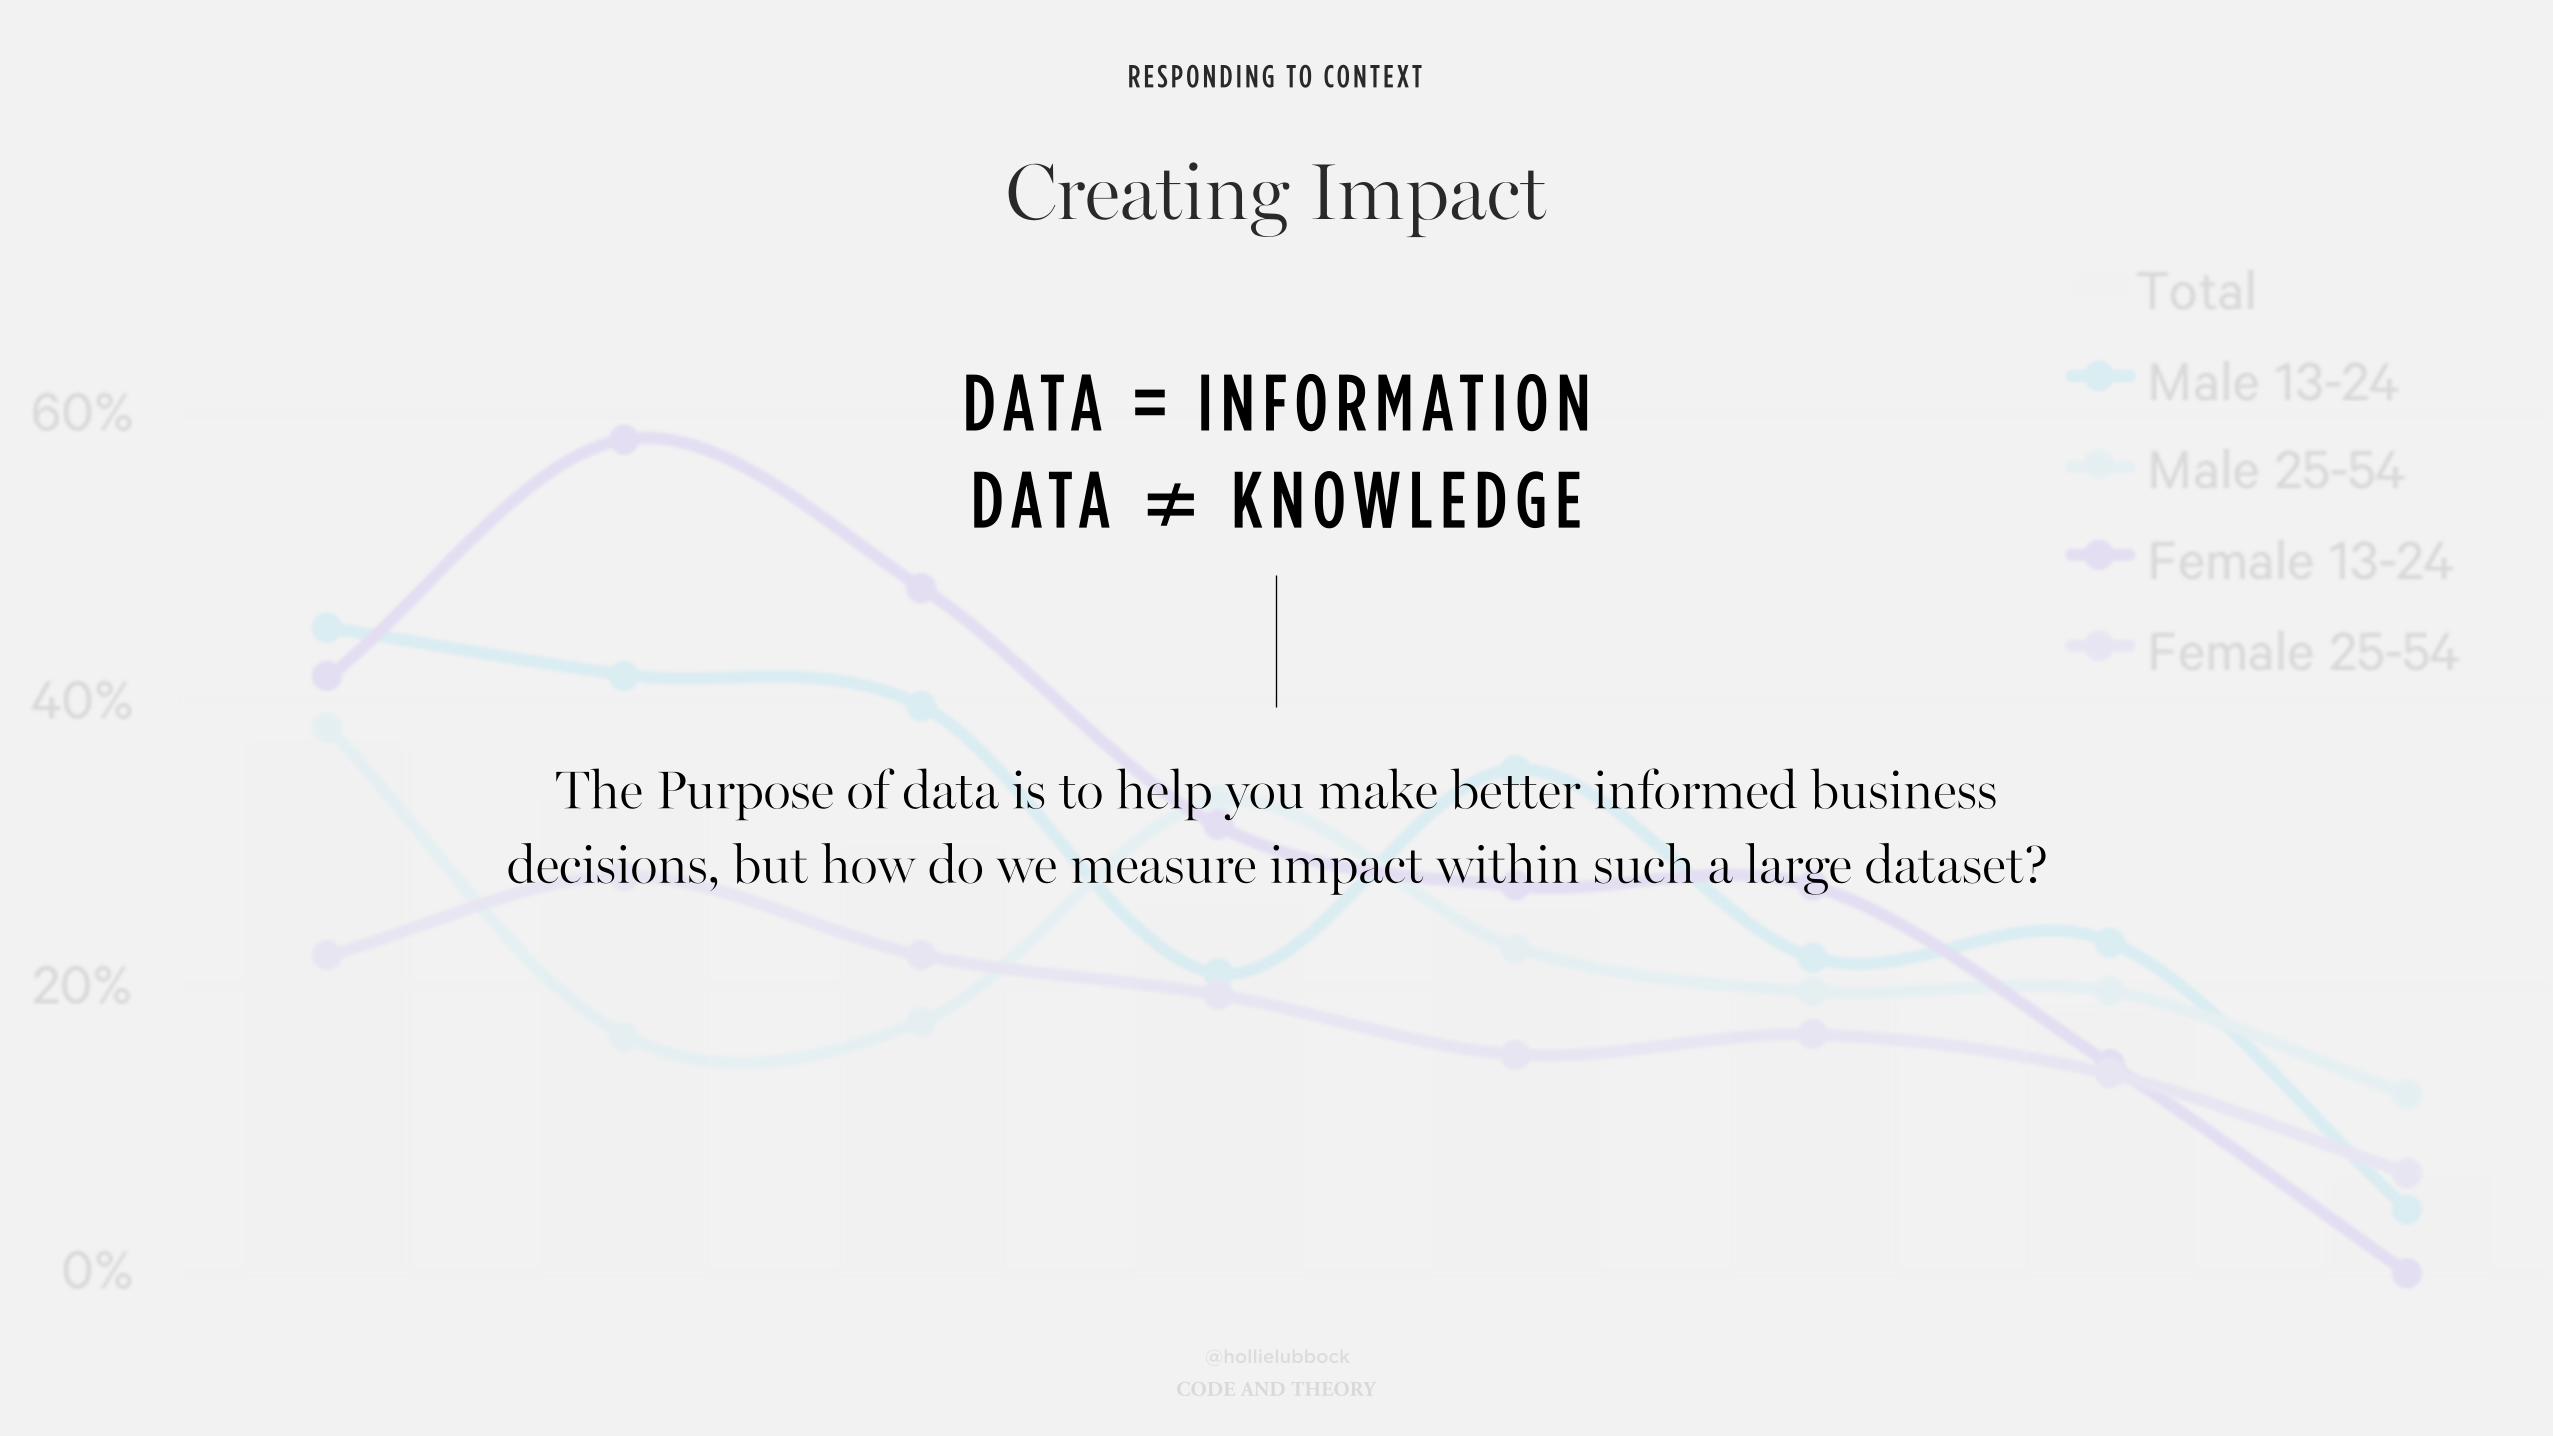
Creating Impact
D ATA = I N F O R M AT I O N D ATA ≠ K N O W L E D G E
The Purpose of data is to help you make better informed business decisions, but how do we measure impact within such a large dataset?
@hollielubbock
We have so much data coming in, we don’t have time
to respond to it effectively So is it actually useful?
Ummm
R E S P O N D I N G TO CO N T E X T
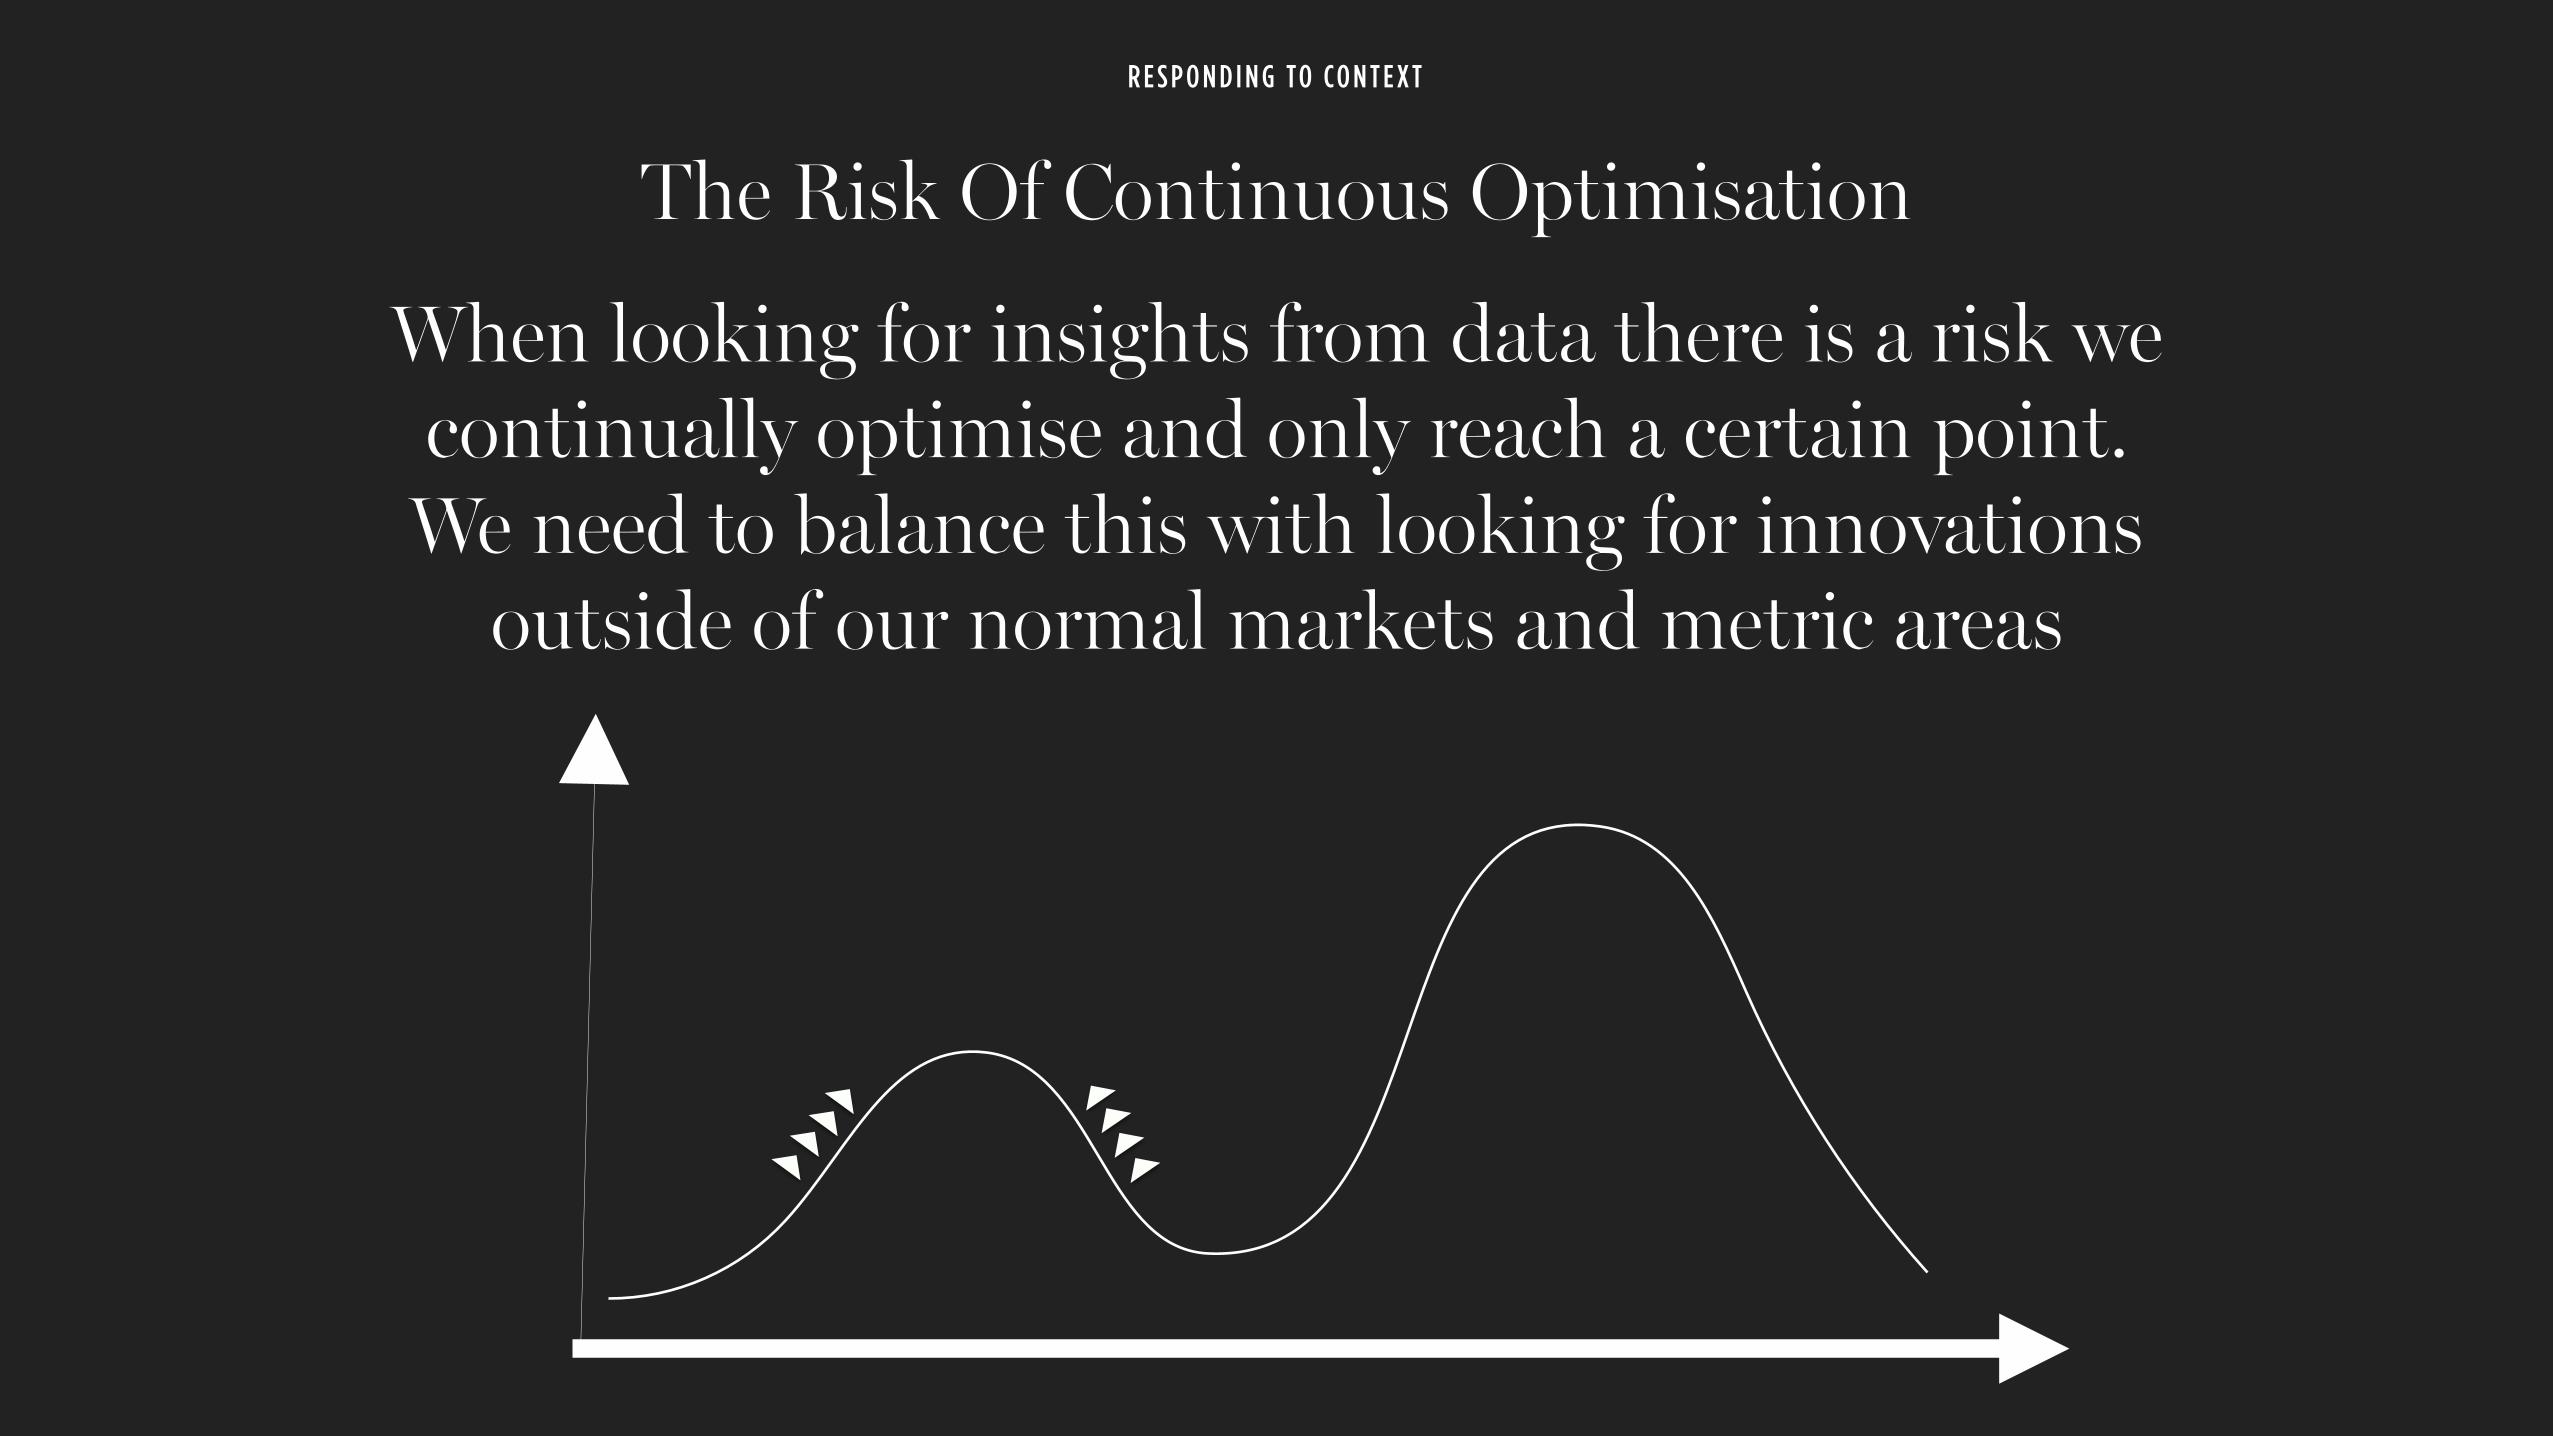
The Risk Of Continuous Optimisation
R E S P O N D I N G TO CO N T E X T
When looking for insights from data there is a risk we continually optimise and only reach a certain point. We need to balance this with looking for innovations
outside of our normal markets and metric areas
@hollielubbock
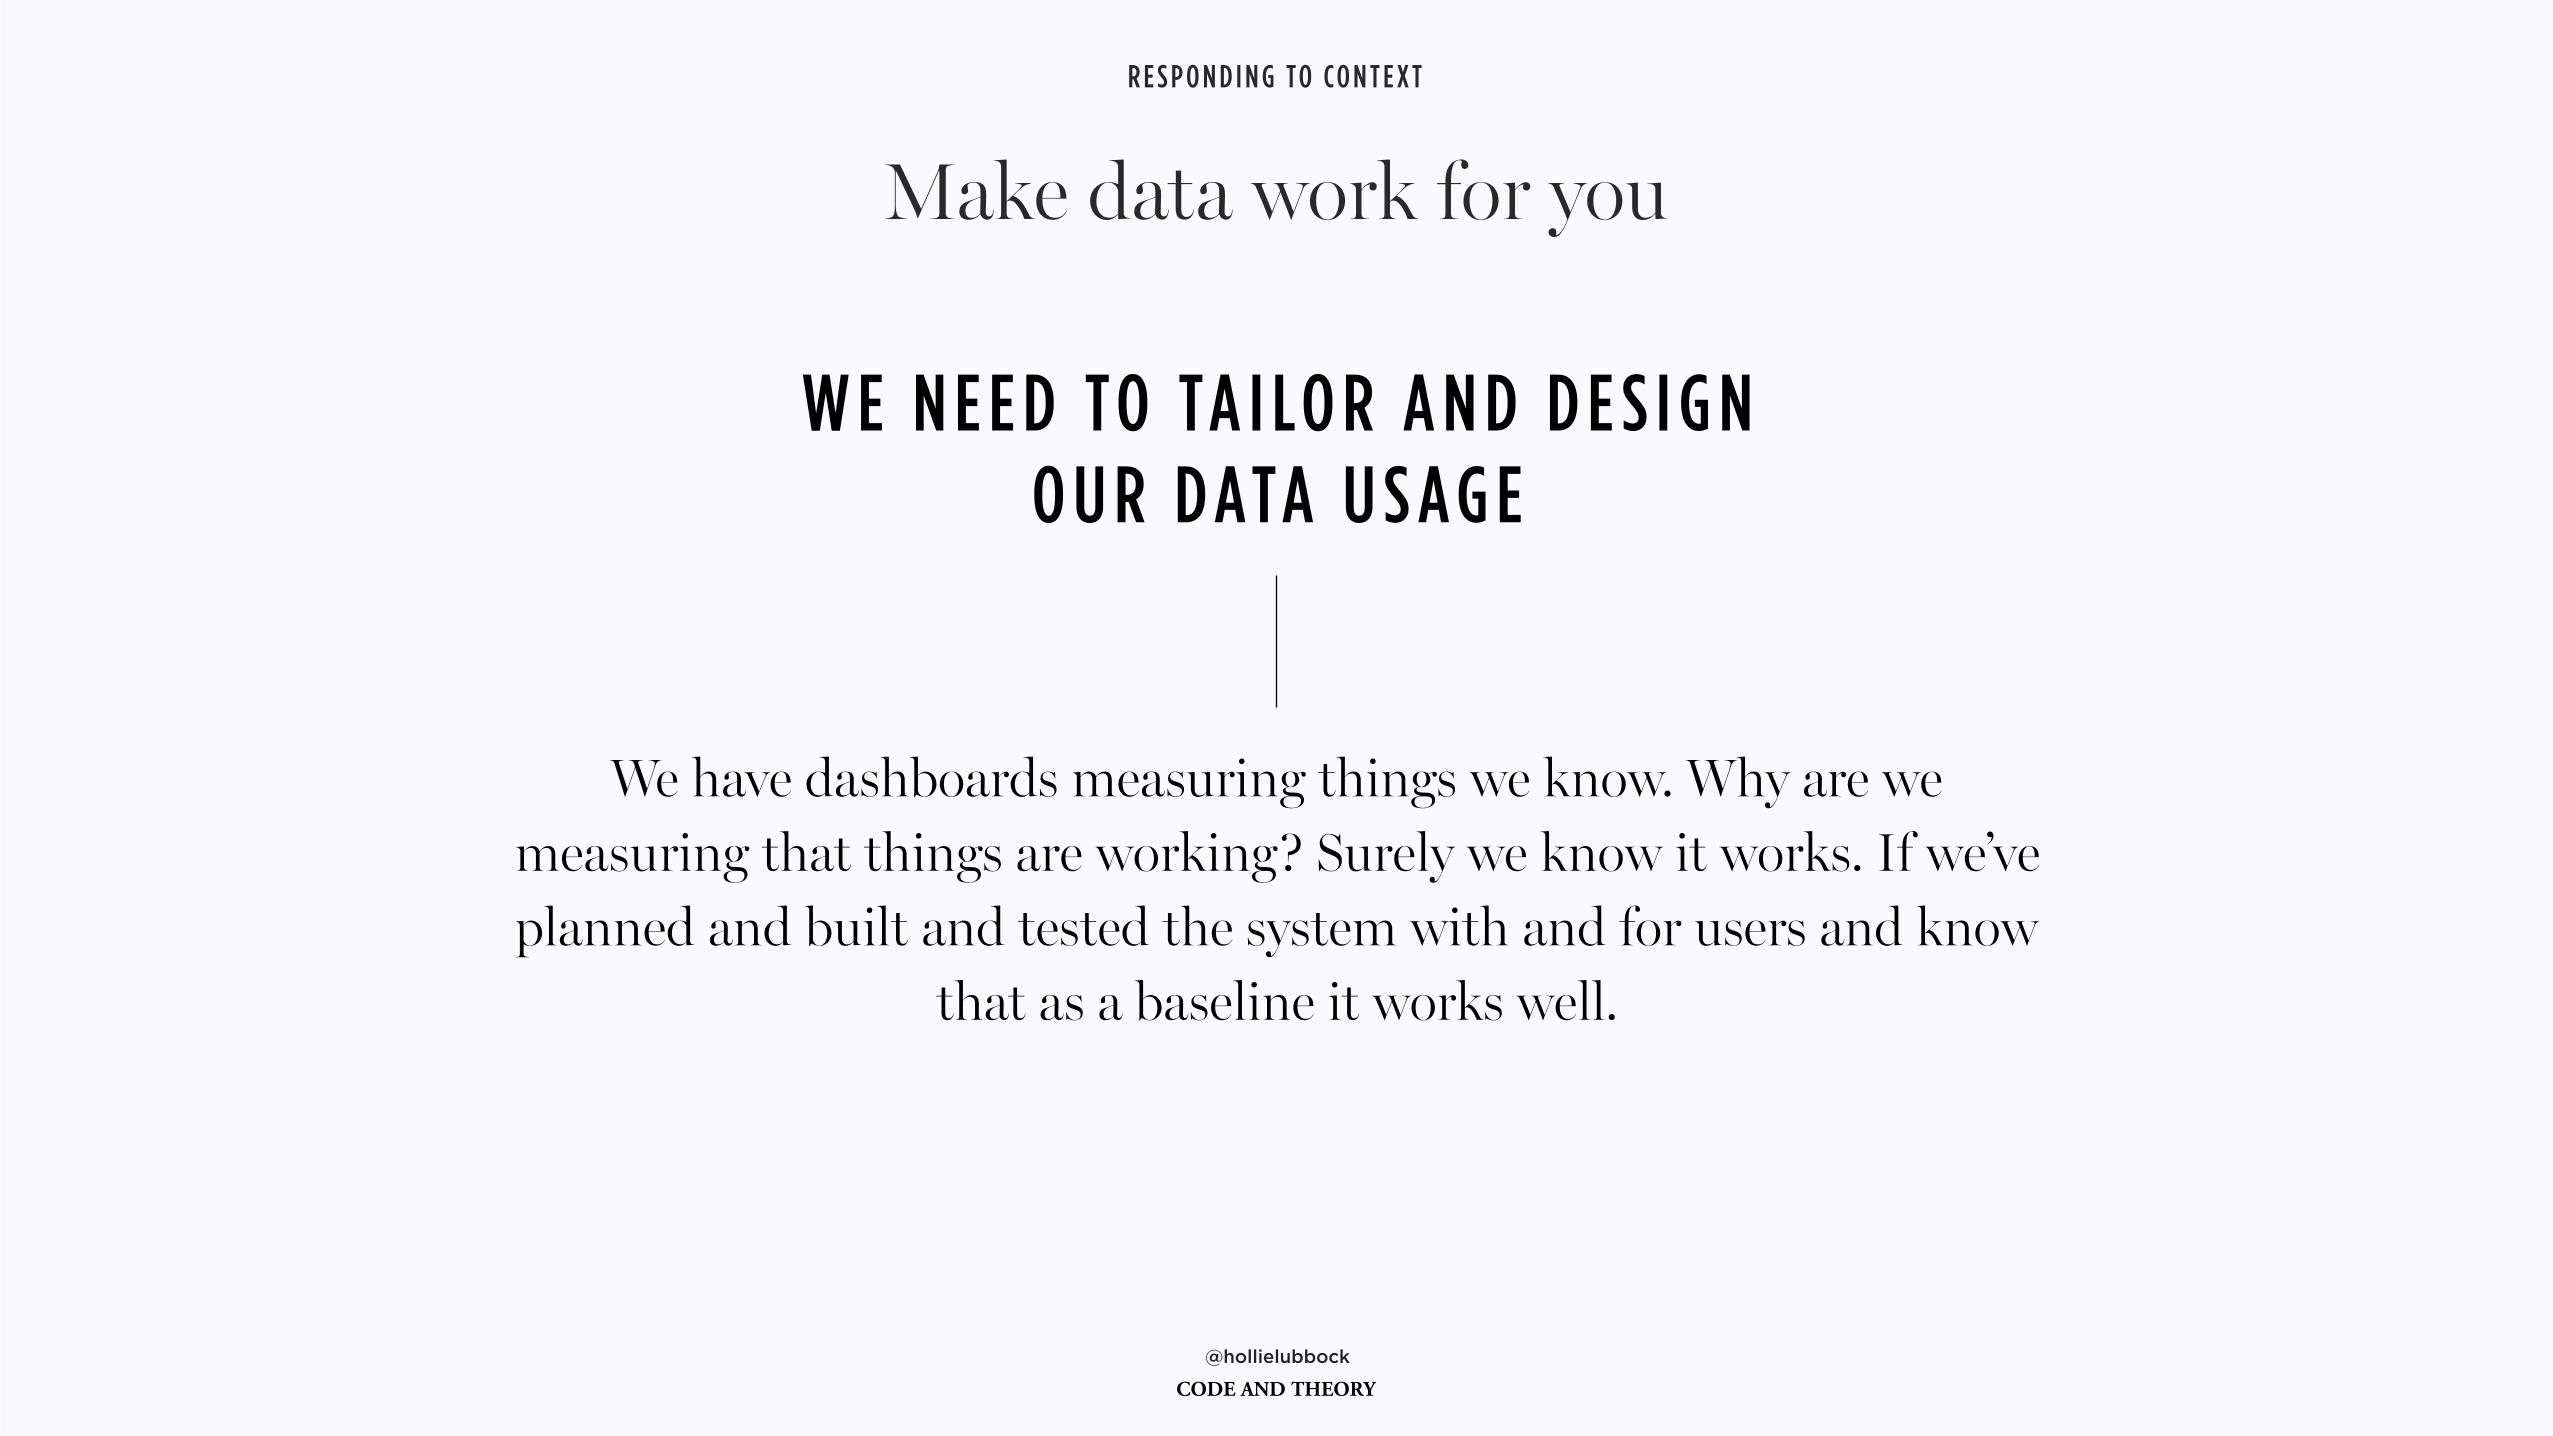
W E N E E D TO TA I LO R A N D D E S I G N O U R D ATA U S A G E
We have dashboards measuring things we know. Why are we measuring that things are working? Surely we know it works. If we’ve planned and built and tested the system with and for users and know
that as a baseline it works well.
Make data work for you
R E S P O N D I N G TO CO N T E X T
@hollielubbock
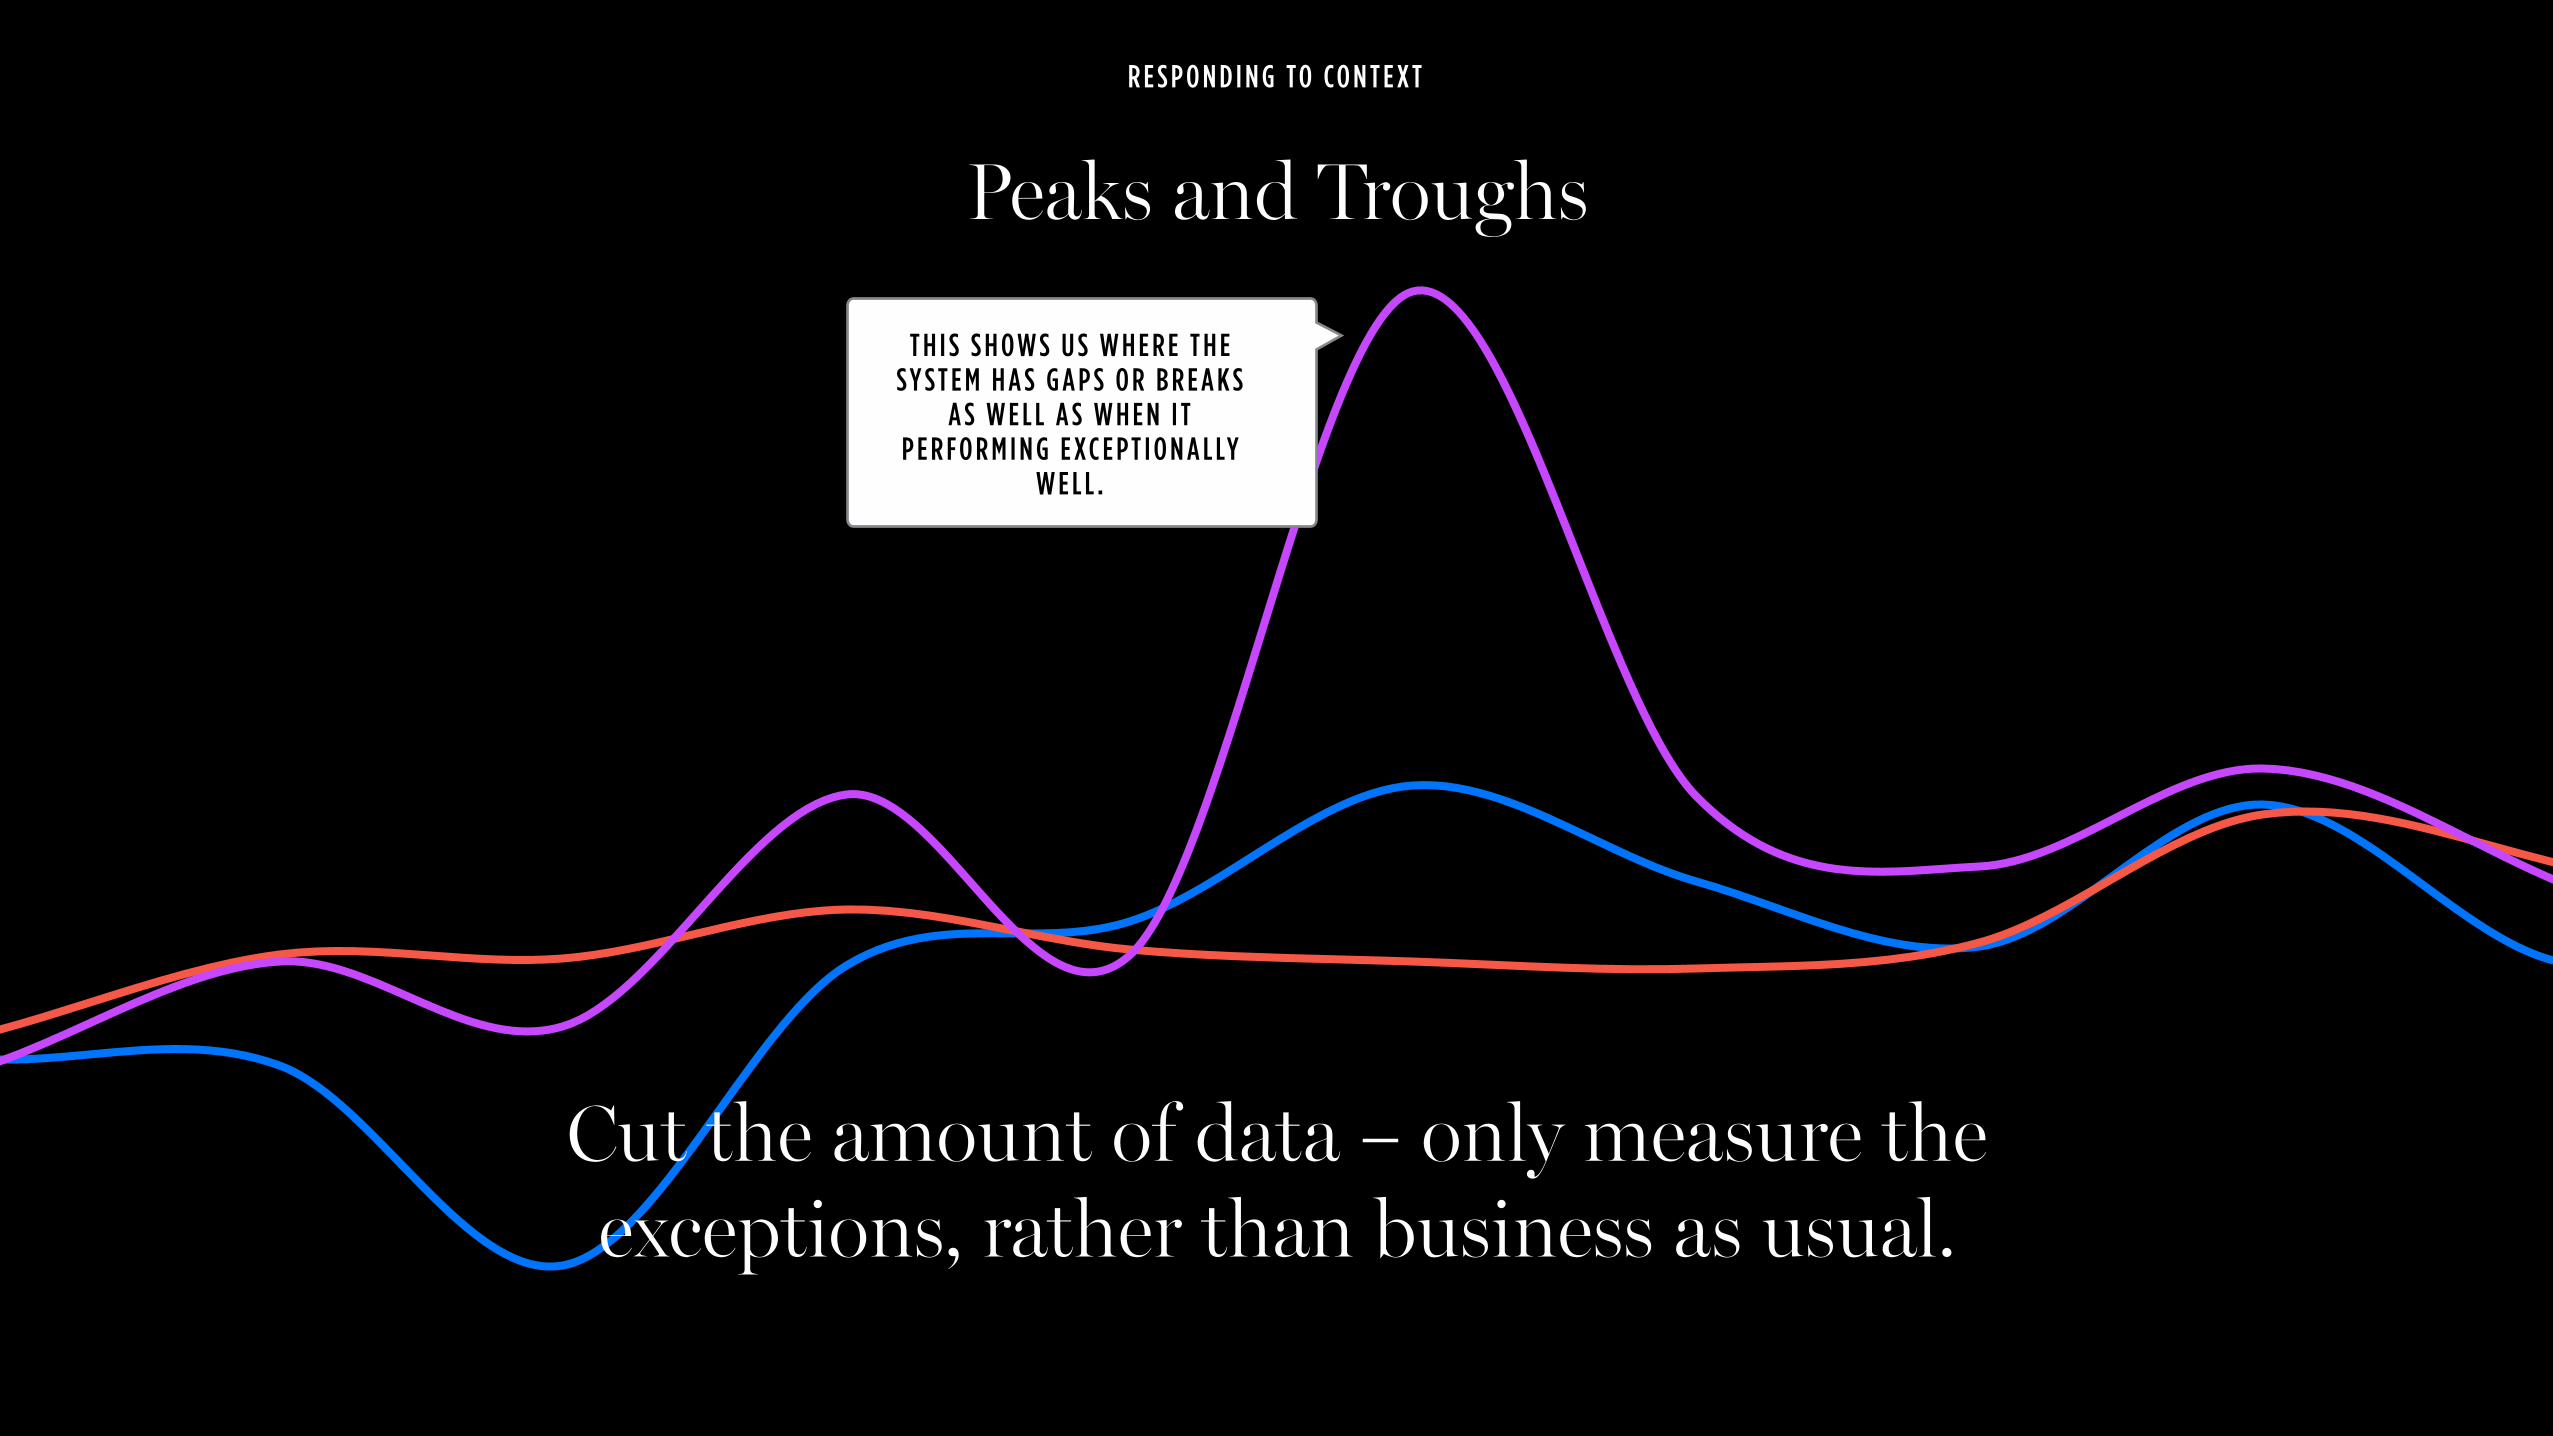
Peaks and Troughs
R E S P O N D I N G TO CO N T E X T
£-
£10,000,000.00
£20,000,000.00
£30,000,000.00
£40,000,000.00
£50,000,000.00
40 41 42 43 44 45 46 47 48 49 50
T H I S S H O W S U S W H E R E T H E S Y S T E M H A S G A P S O R B R E A K S
A S W E L L A S W H E N I T P E R F O R M I N G E XC E P T I O N A L LY
W E L L .
Cut the amount of data – only measure the exceptions, rather than business as usual.
@hollielubbock
Combine exceptions with segmentation of early adopter
behaviours to predict how users will behave in the future.
Future Proof Your Data Strategy
R E S P O N D I N G TO CO N T E X T
@hollielubbock
D ATA T E L L S U S W H AT, W H E N A N D W H O B U T N OT W H Y U S E R S A R E B E H AV I N G A C E R TA I N W AY
But Why?
R E S P O N D I N G TO CO N T E X T
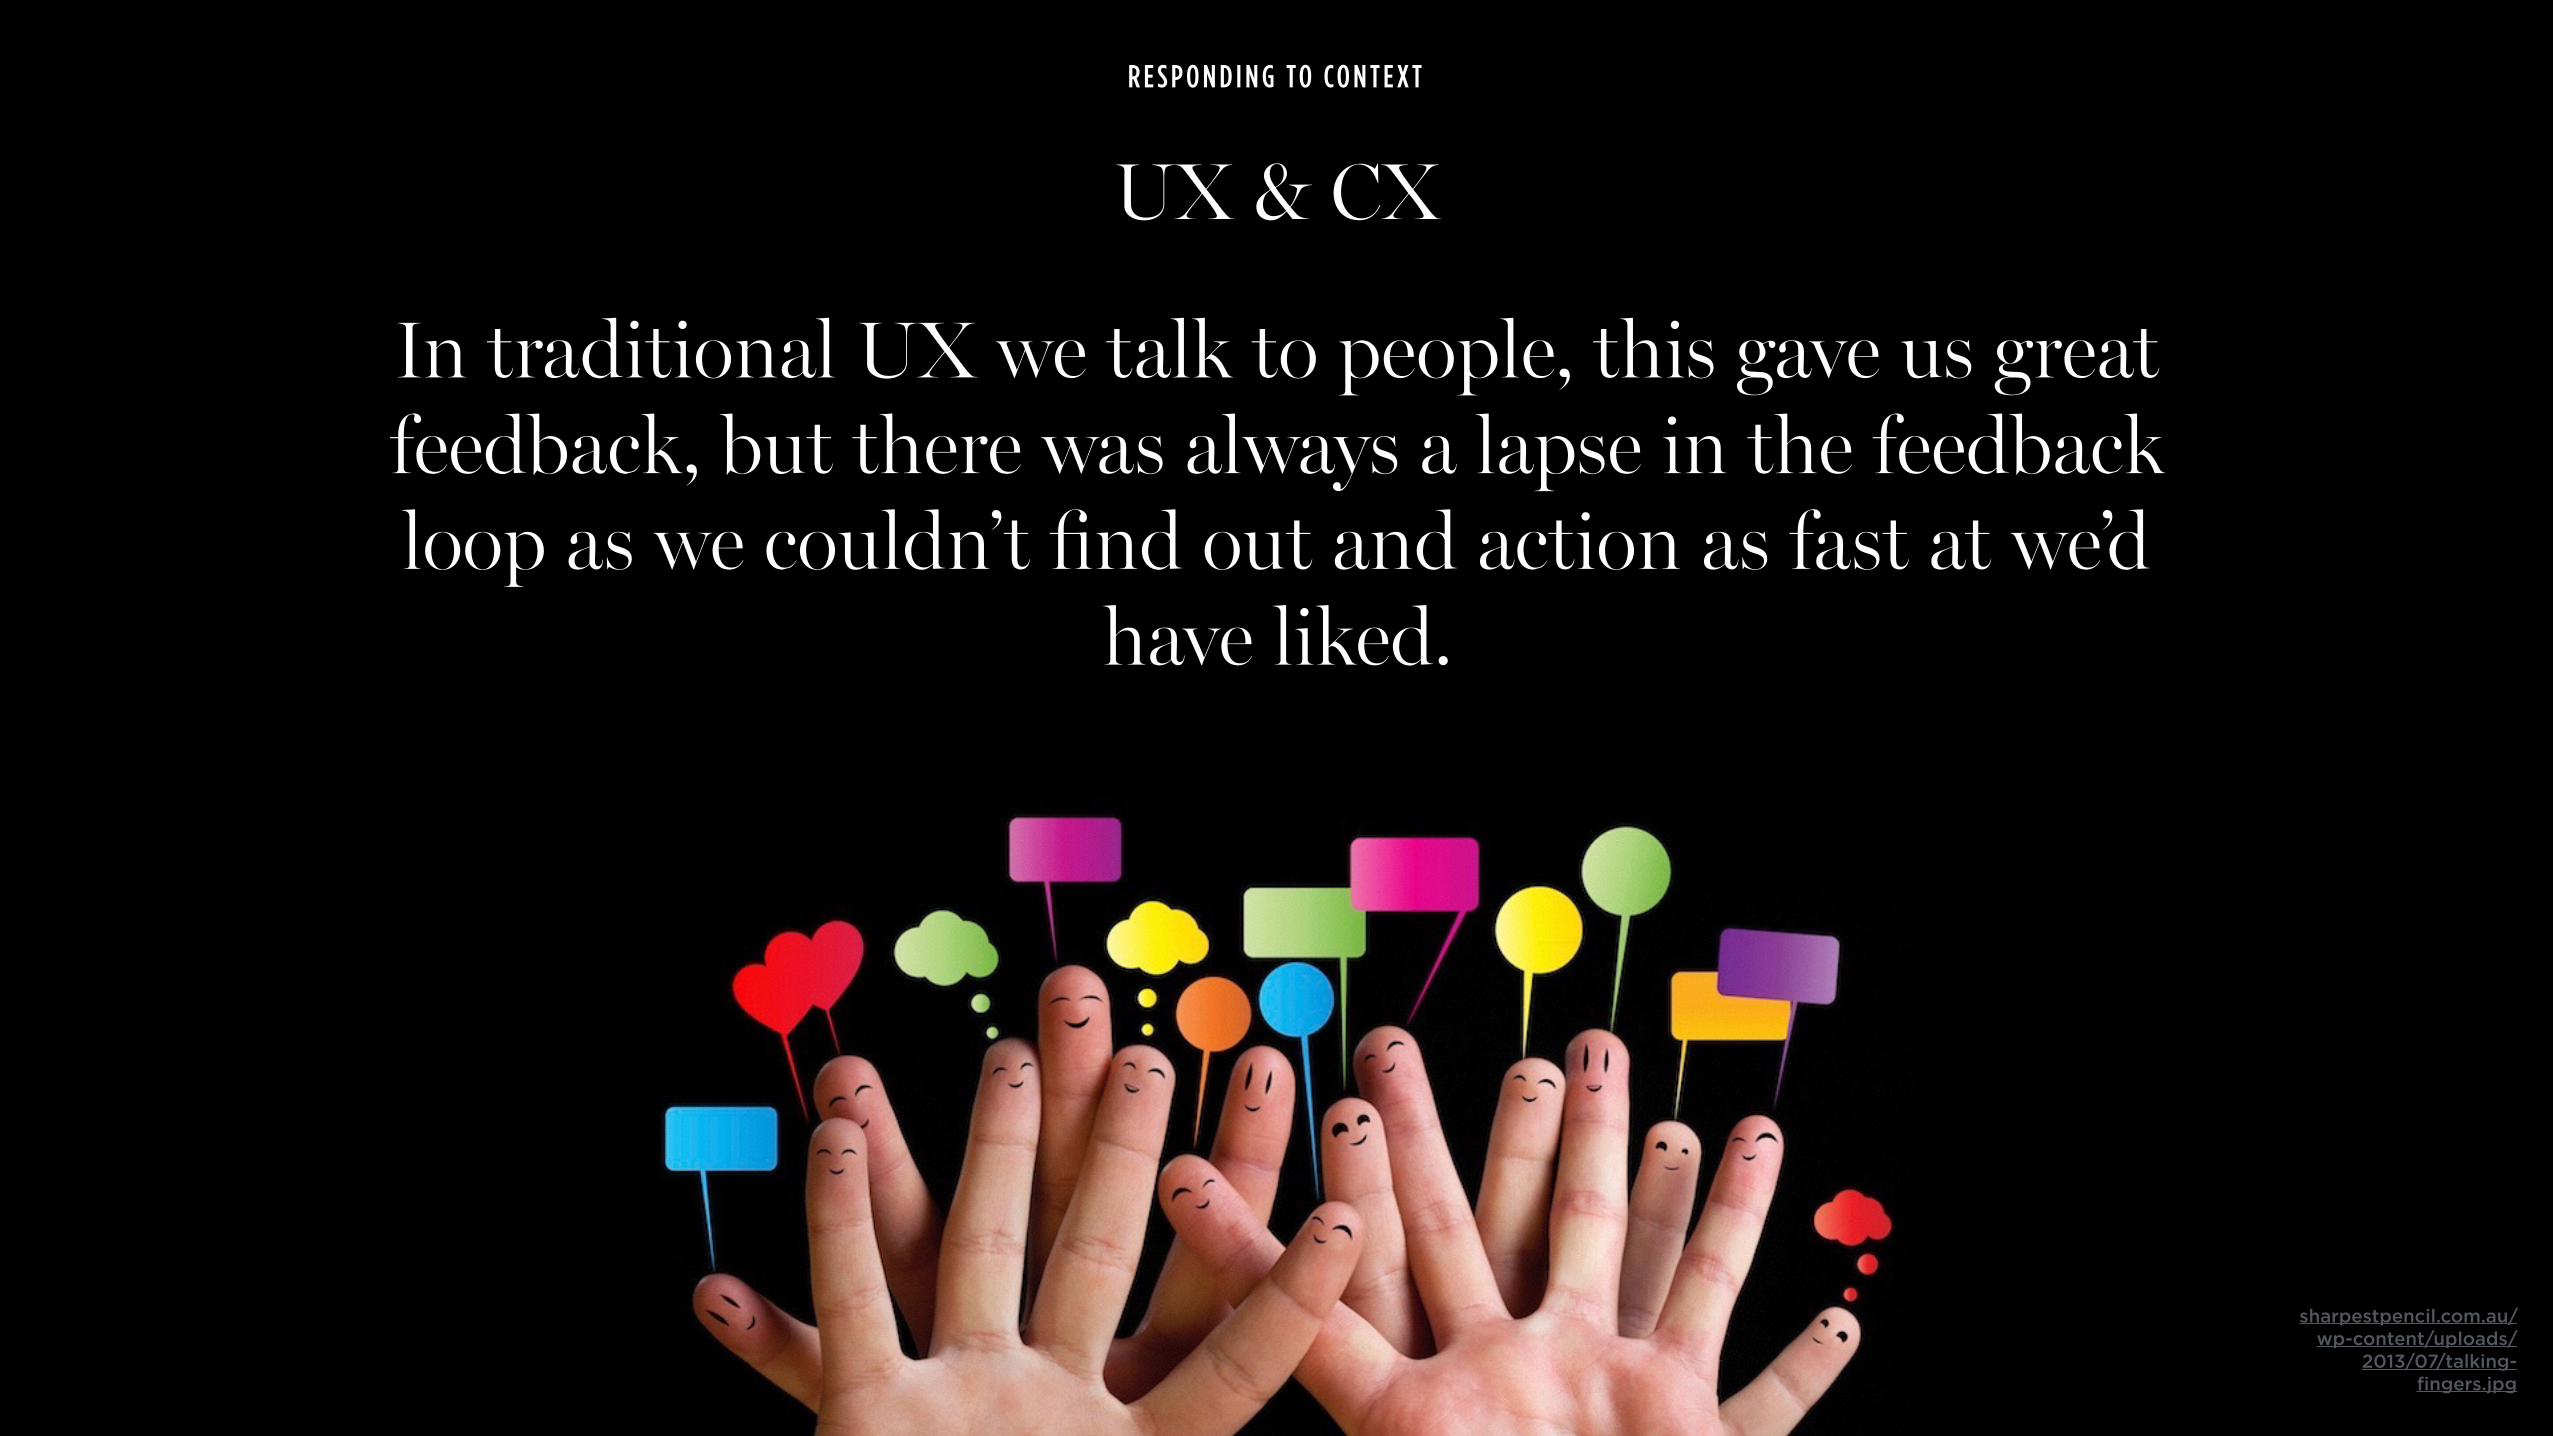
UX & CX
R E S P O N D I N G TO CO N T E X T
sharpestpencil.com.au/wp-content/uploads/
2013/07/talking-fingers.jpg
In traditional UX we talk to people, this gave us great feedback, but there was always a lapse in the feedback loop as we couldn’t find out and action as fast at we’d
have liked.
@hollielubbock
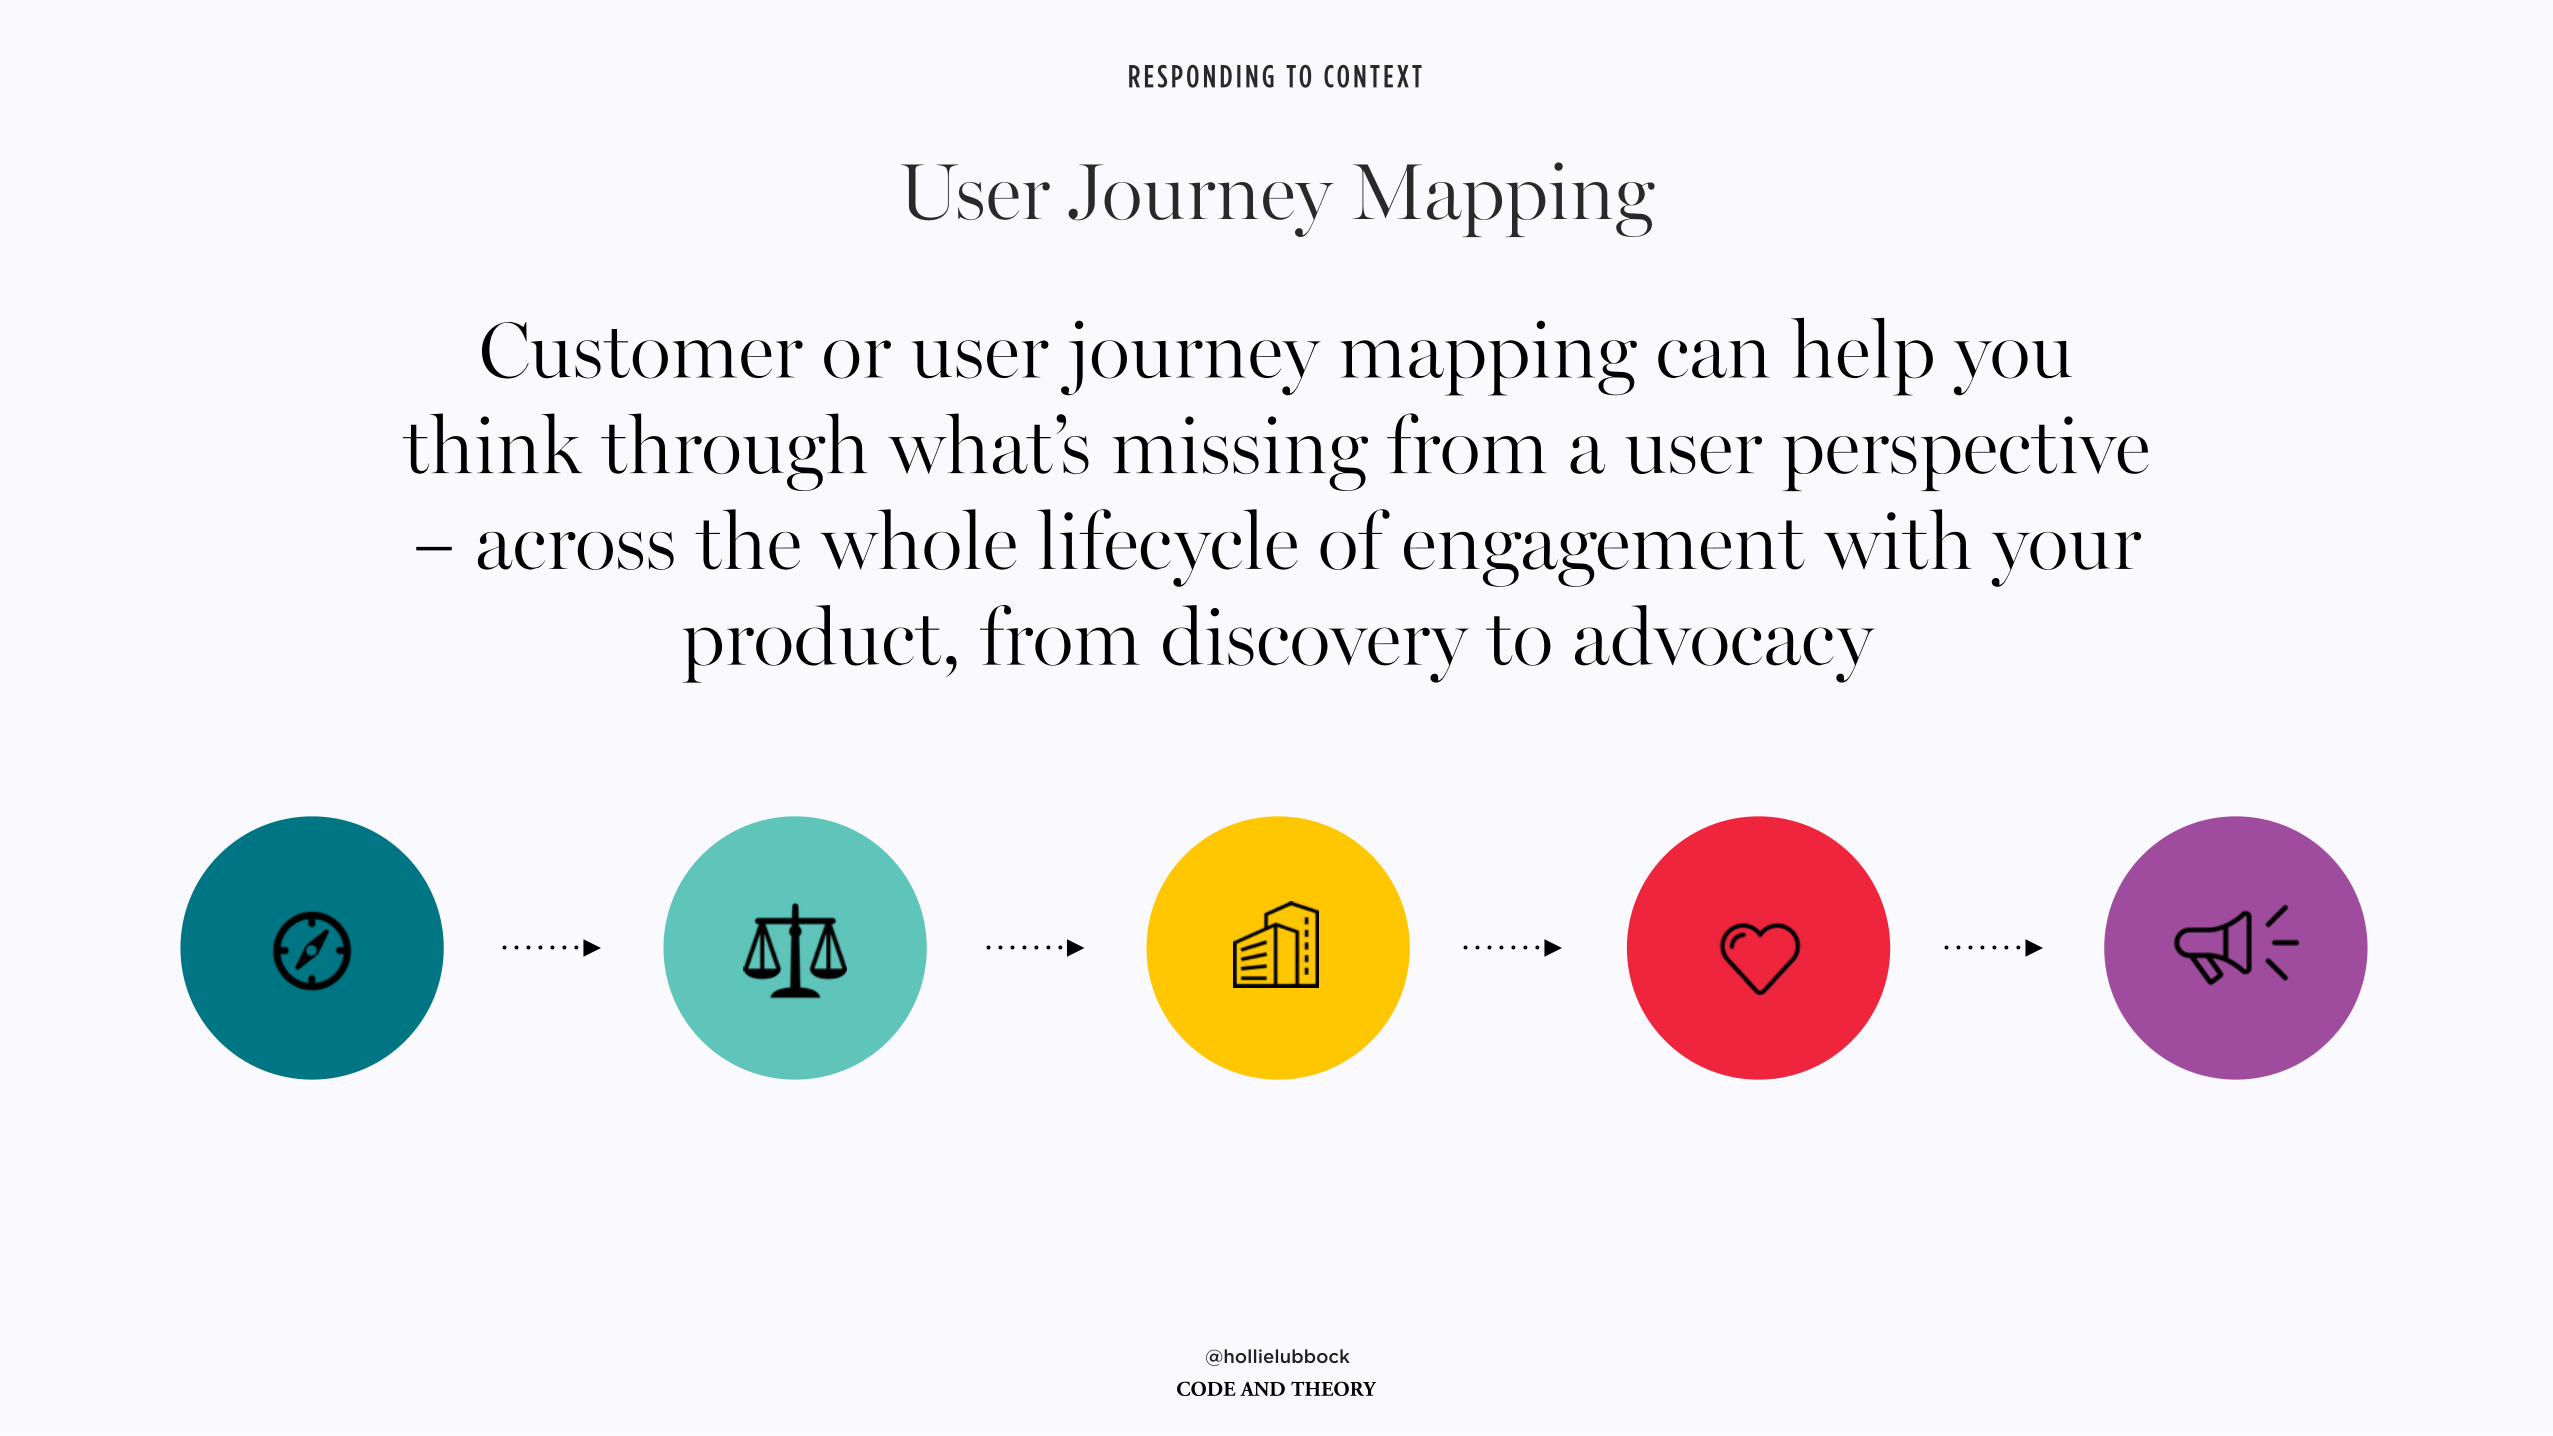
User Journey Mapping
R E S P O N D I N G TO CO N T E X T
Customer or user journey mapping can help you think through what’s missing from a user perspective – across the whole lifecycle of engagement with your
product, from discovery to advocacy
@hollielubbock
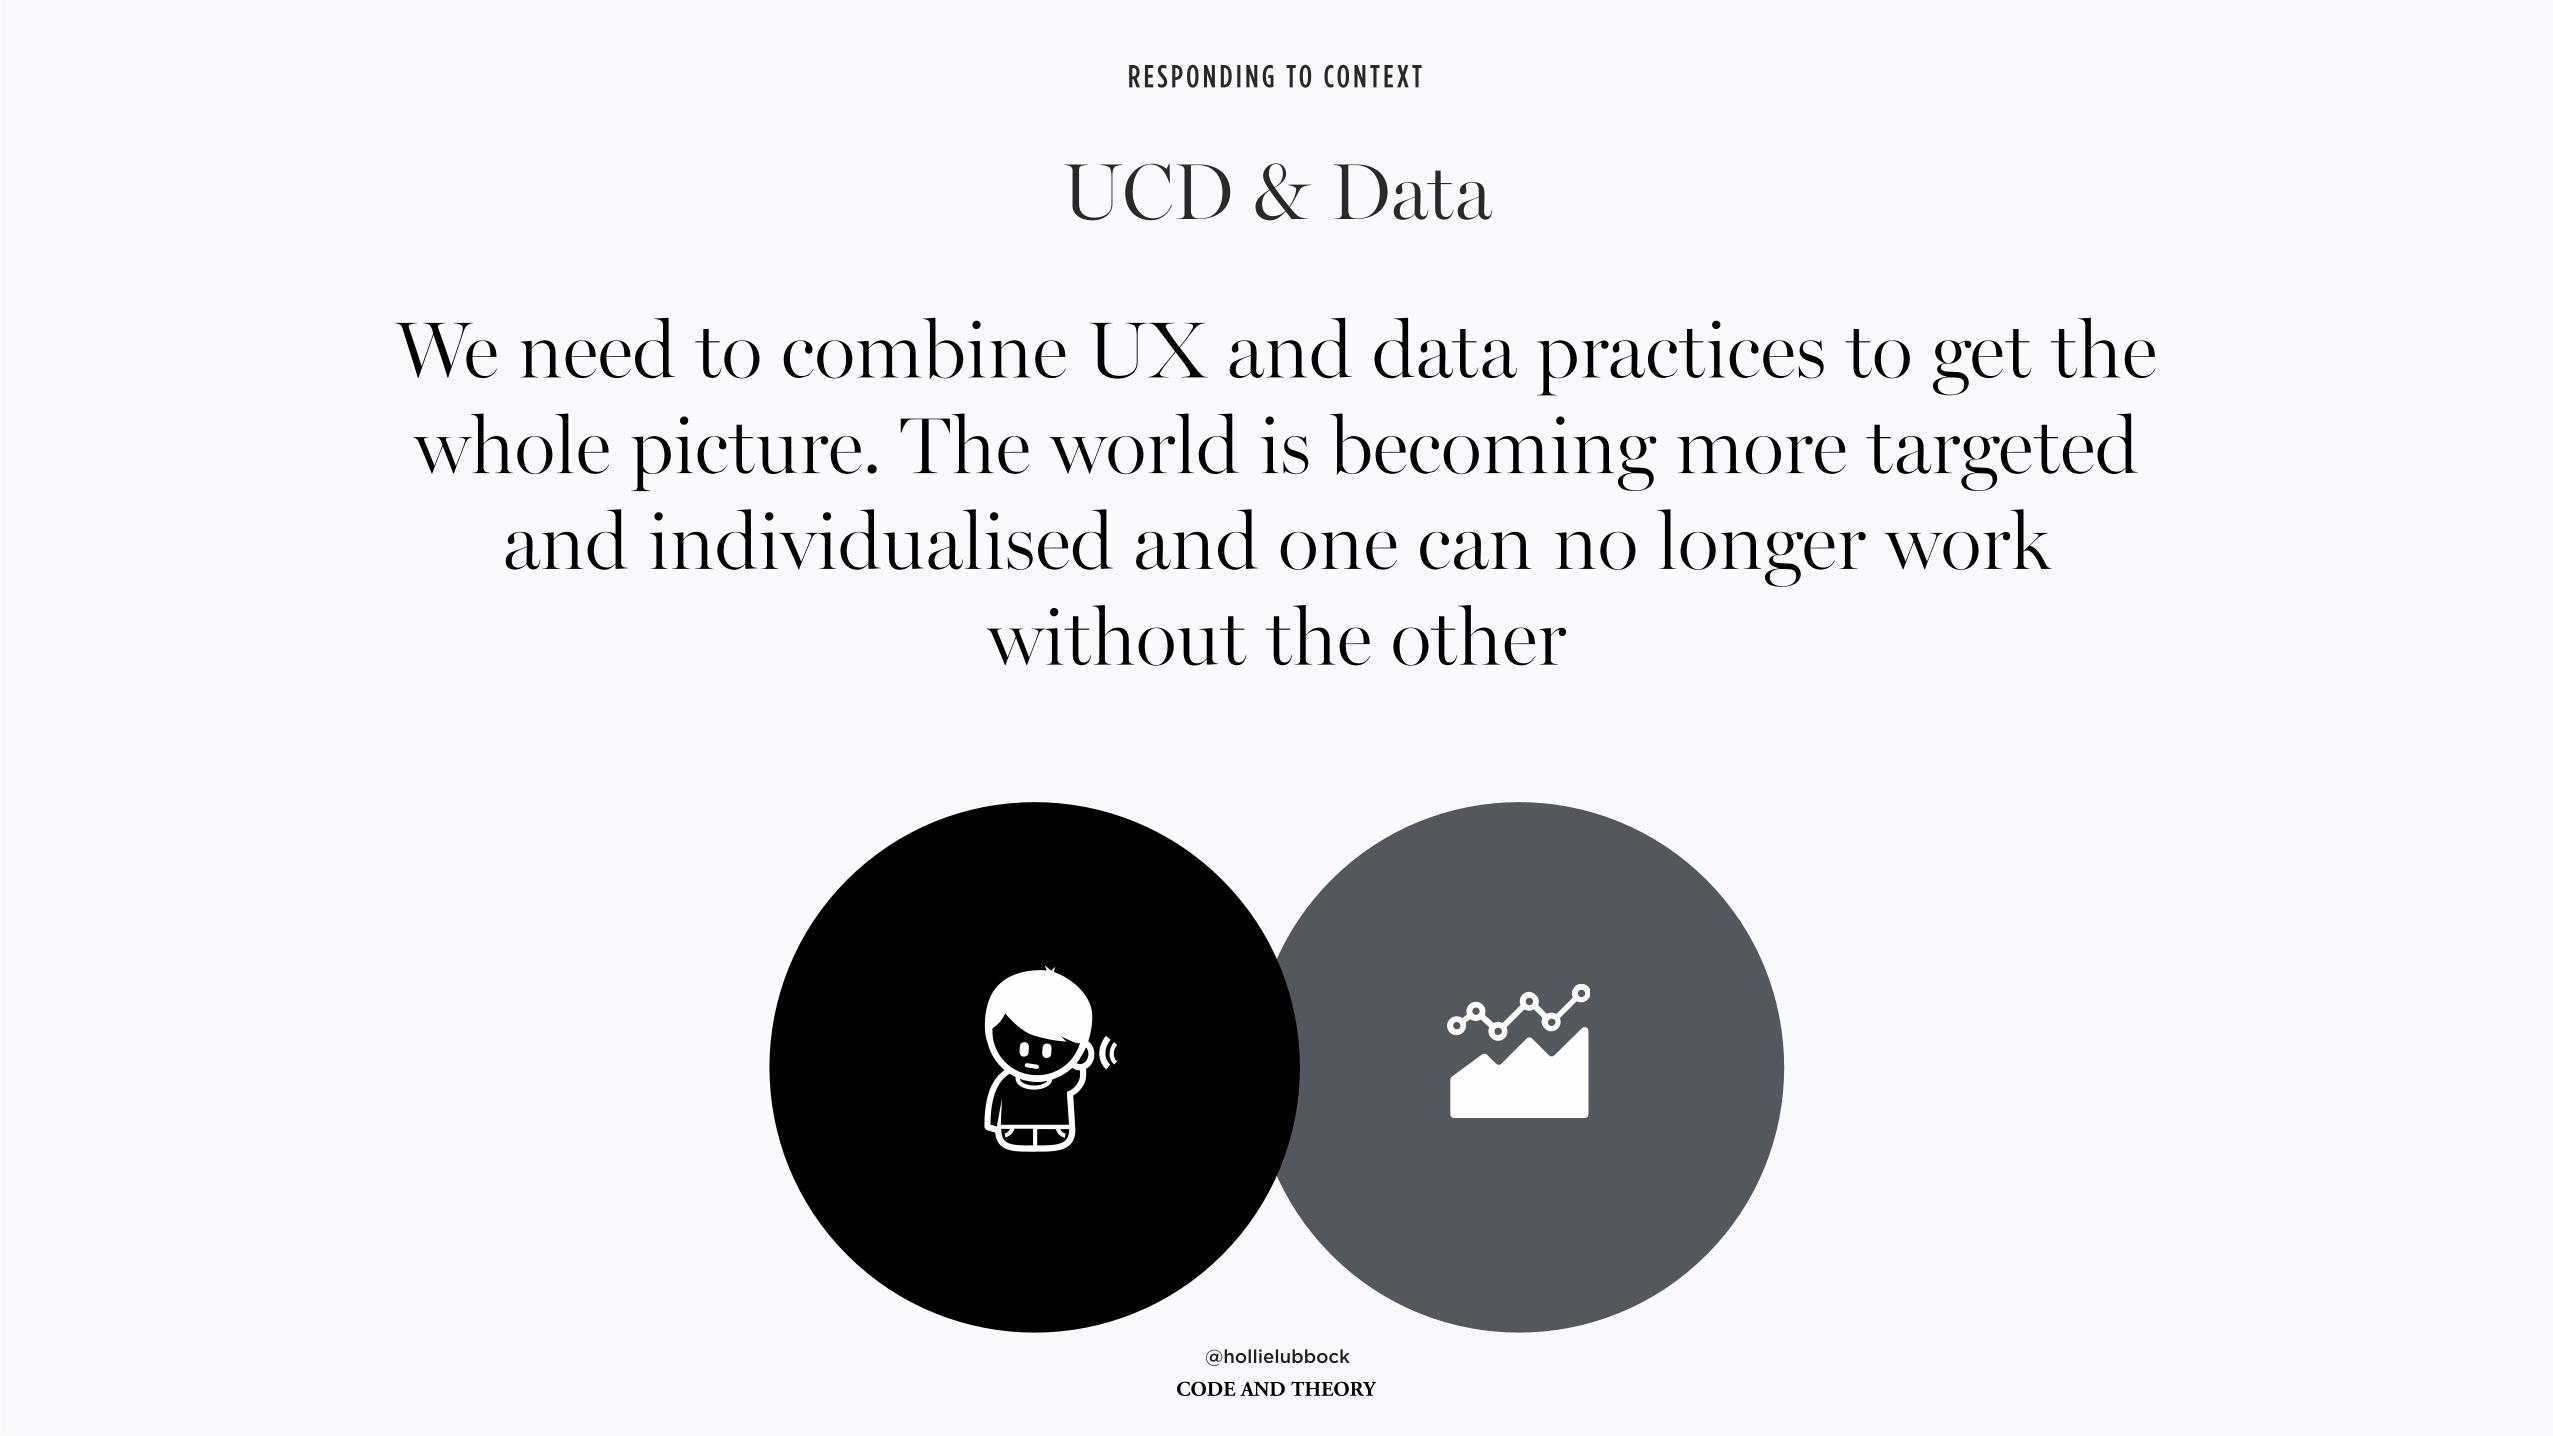
UCD & Data
R E S P O N D I N G TO CO N T E X T
We need to combine UX and data practices to get the whole picture. The world is becoming more targeted
and individualised and one can no longer work without the other
@hollielubbock
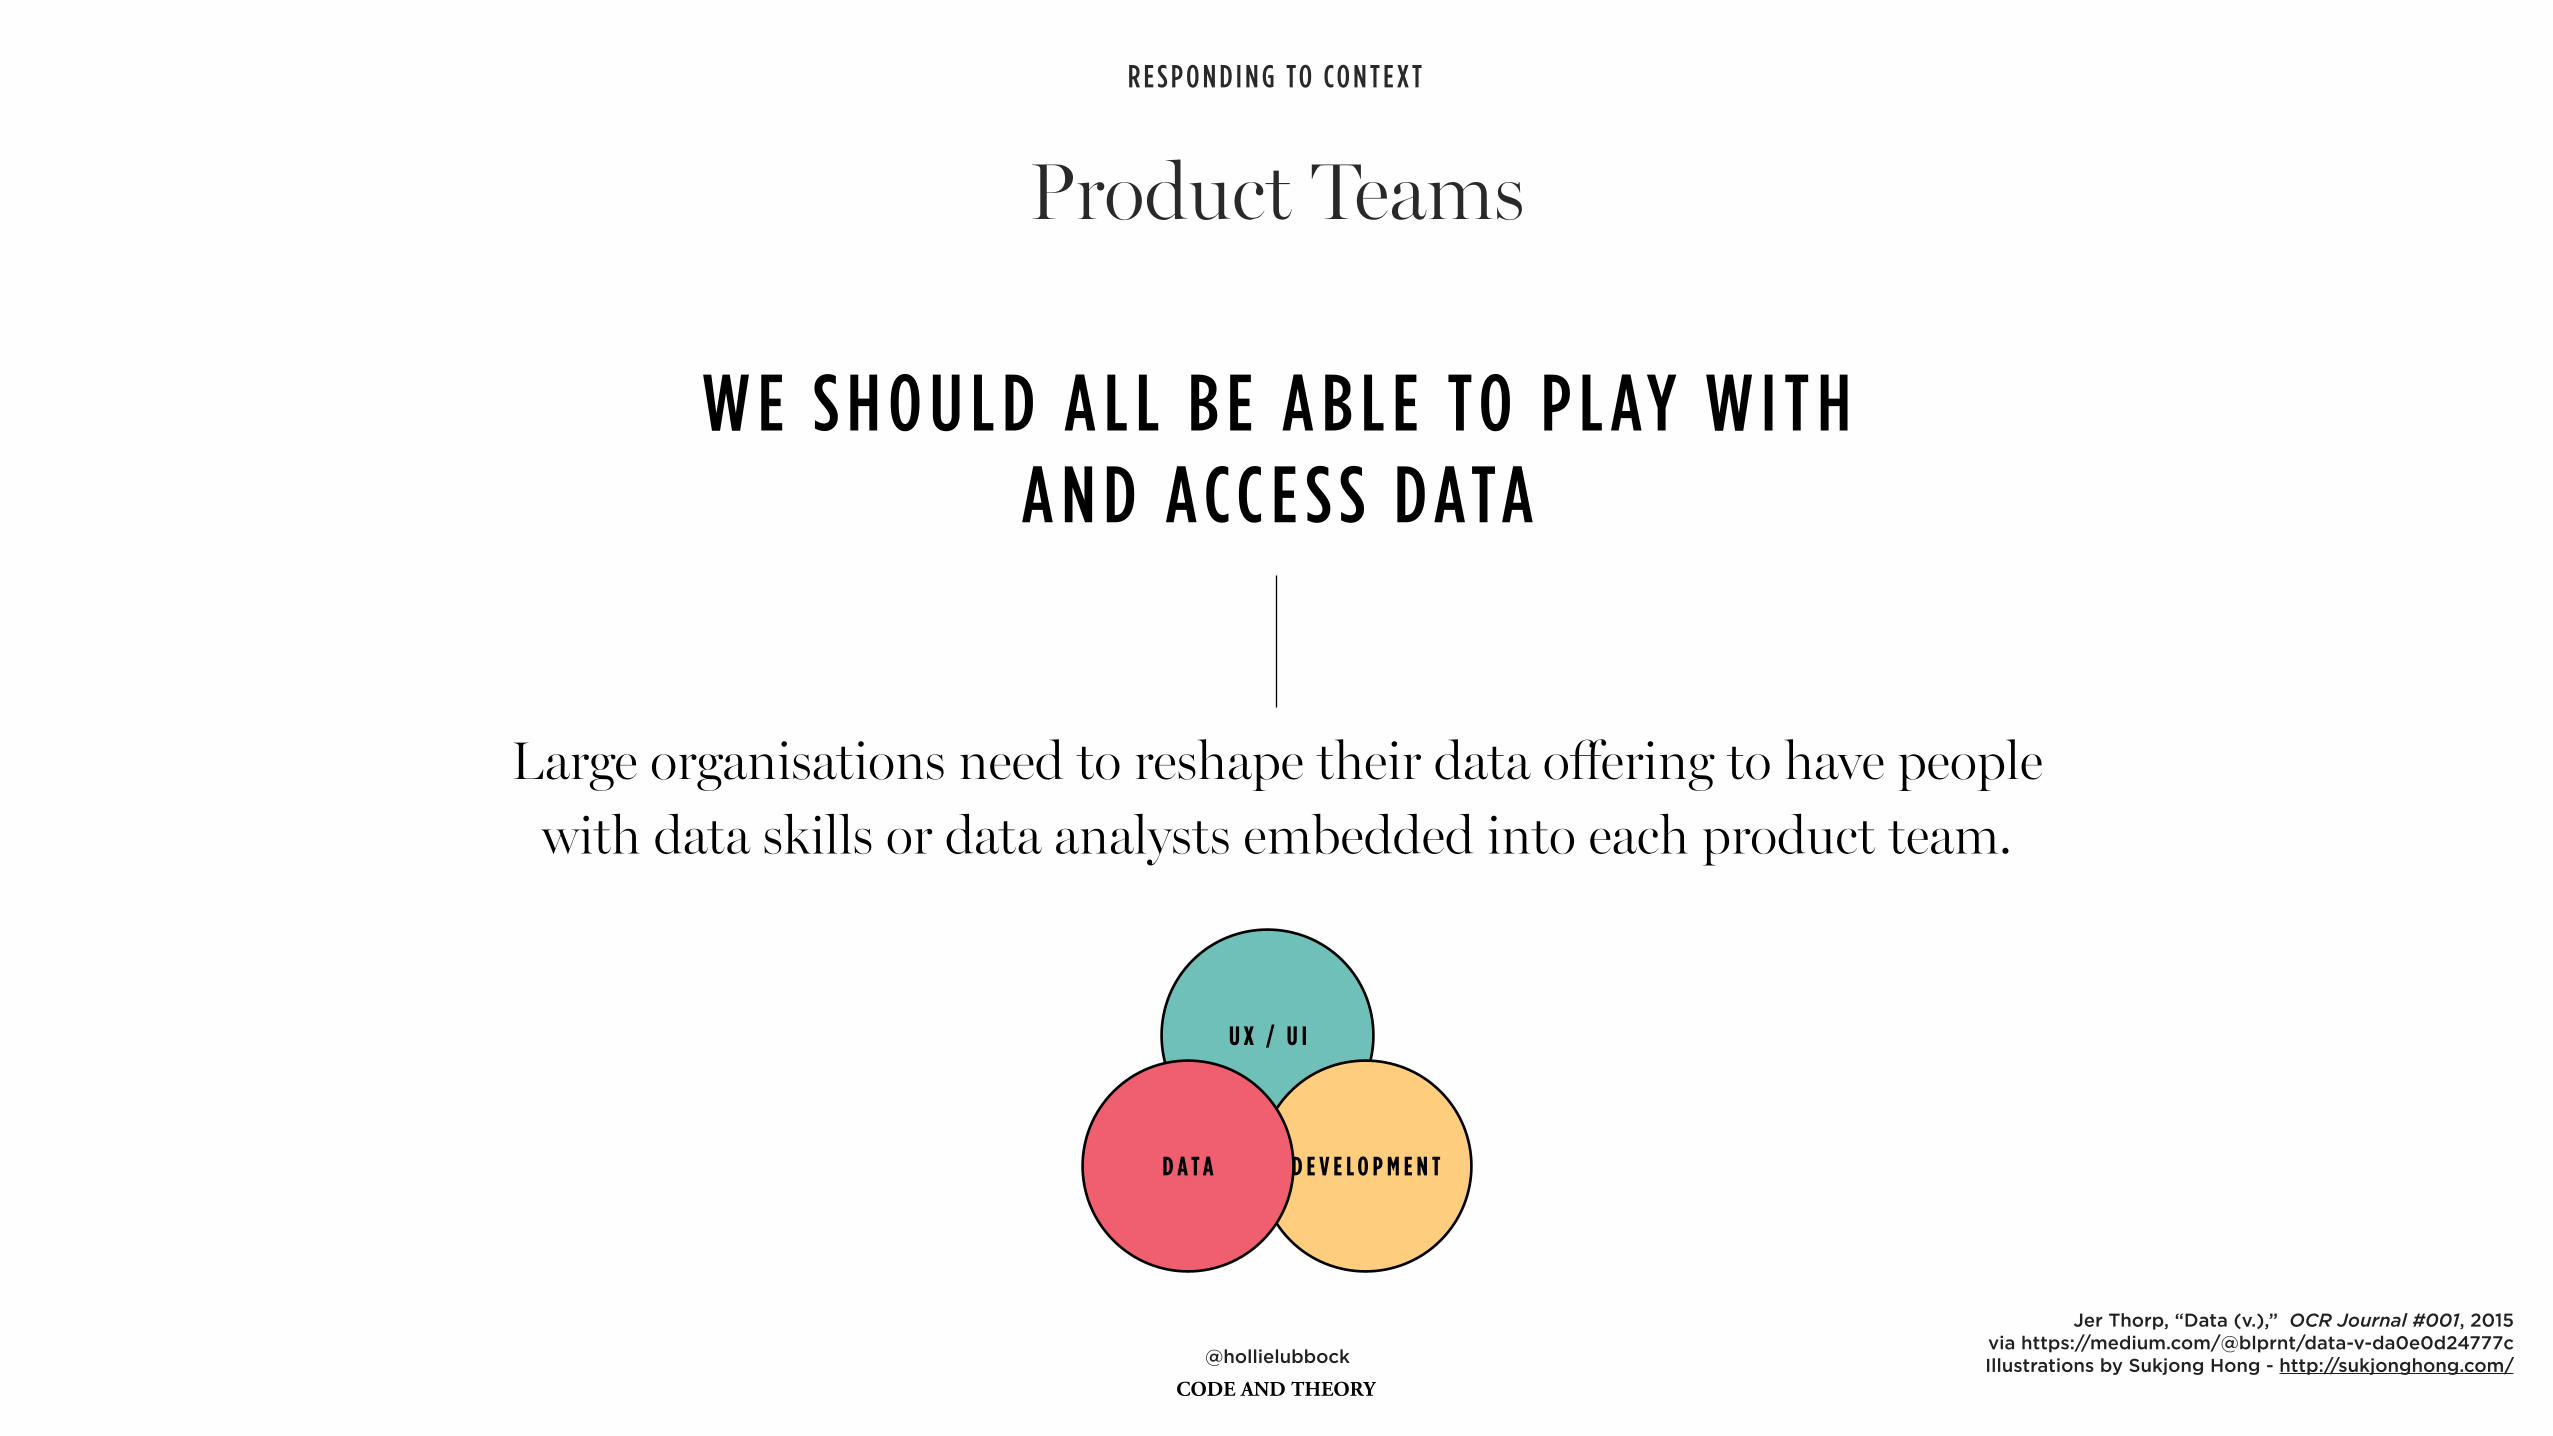
W E S H O U L D A L L B E A B L E TO P L AY W I T H A N D A CC E S S D ATA
Large organisations need to reshape their data offering to have people with data skills or data analysts embedded into each product team.
Product Teams
R E S P O N D I N G TO CO N T E X T
Jer Thorp, “Data (v.),” OCR Journal #001, 2015 via https://medium.com/@blprnt/data-v-da0e0d24777c Illustrations by Sukjong Hong - http://sukjonghong.com/
U X / U I
D E V E L O P M E N TD A T A
@hollielubbock
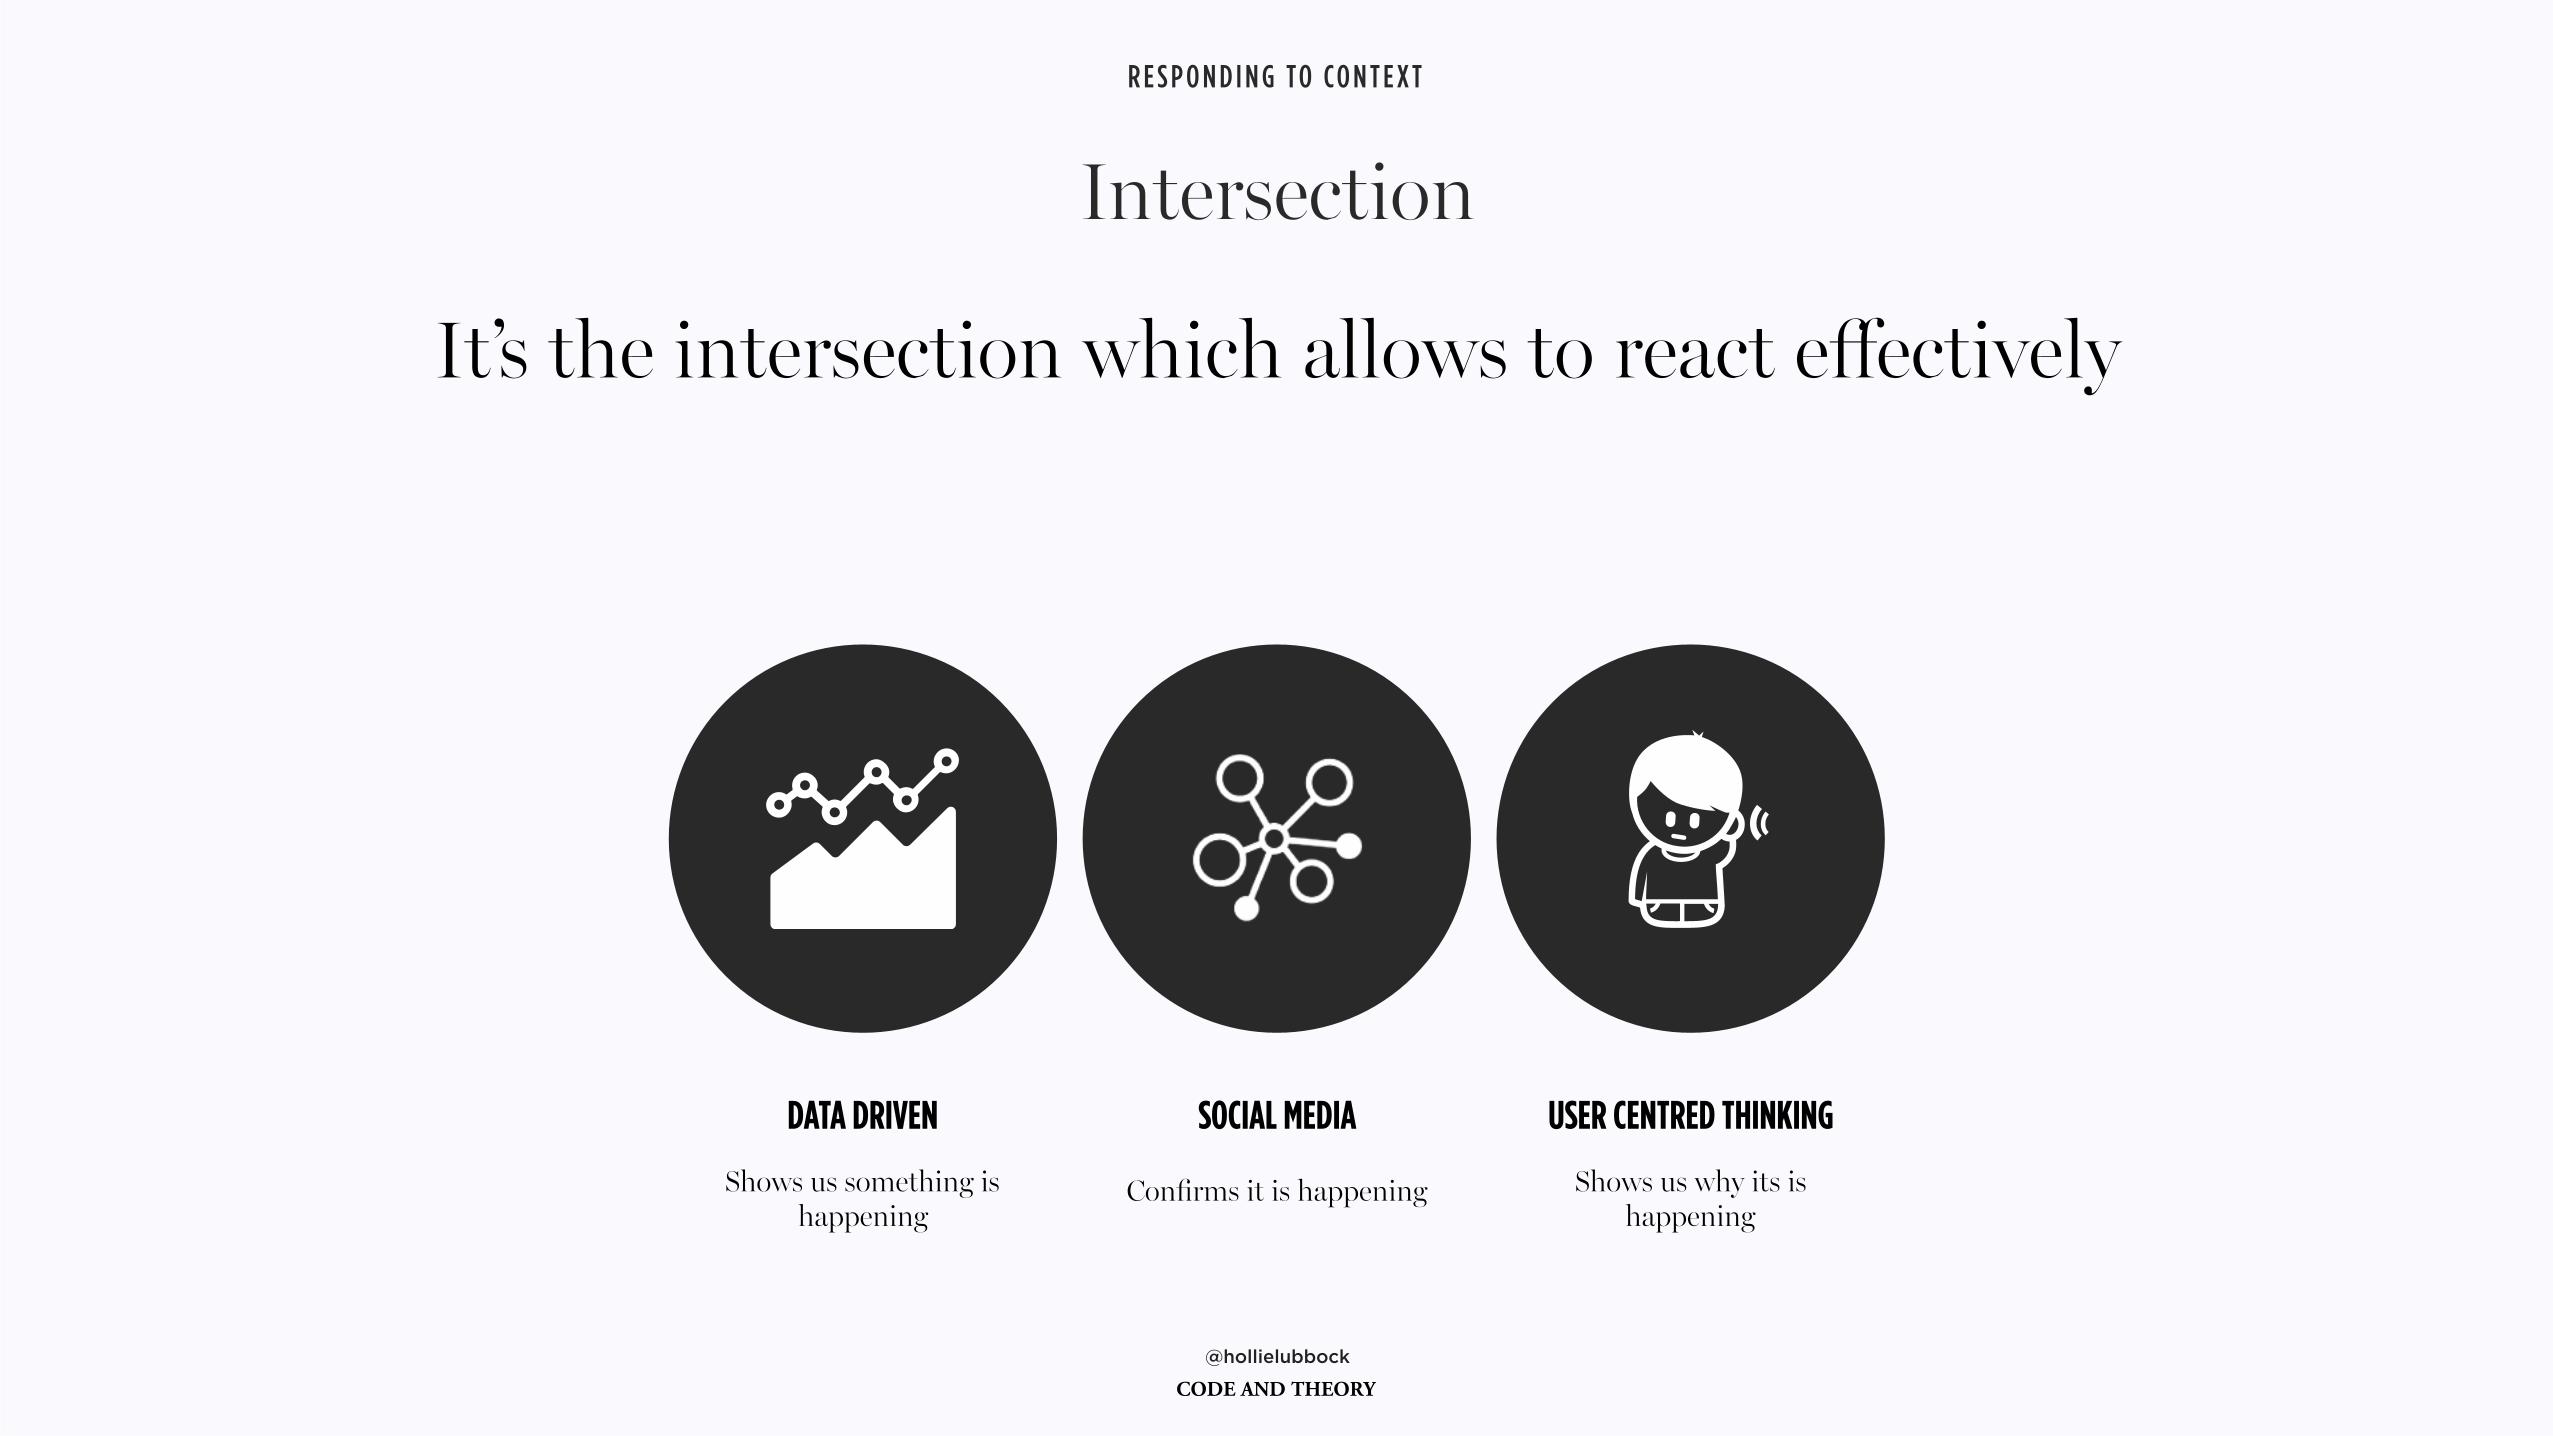
Intersection
R E S P O N D I N G TO CO N T E X T
SOCIAL MEDIA
Confirms it is happening
USER CENTRED THINKING
Shows us why its is happening
DATA DRIVEN
Shows us something is happening
It’s the intersection which allows to react effectively
How do we use data at Code & Theory?
So then…
R E S P O N D I N G TO CO N T E X T
@hollielubbock
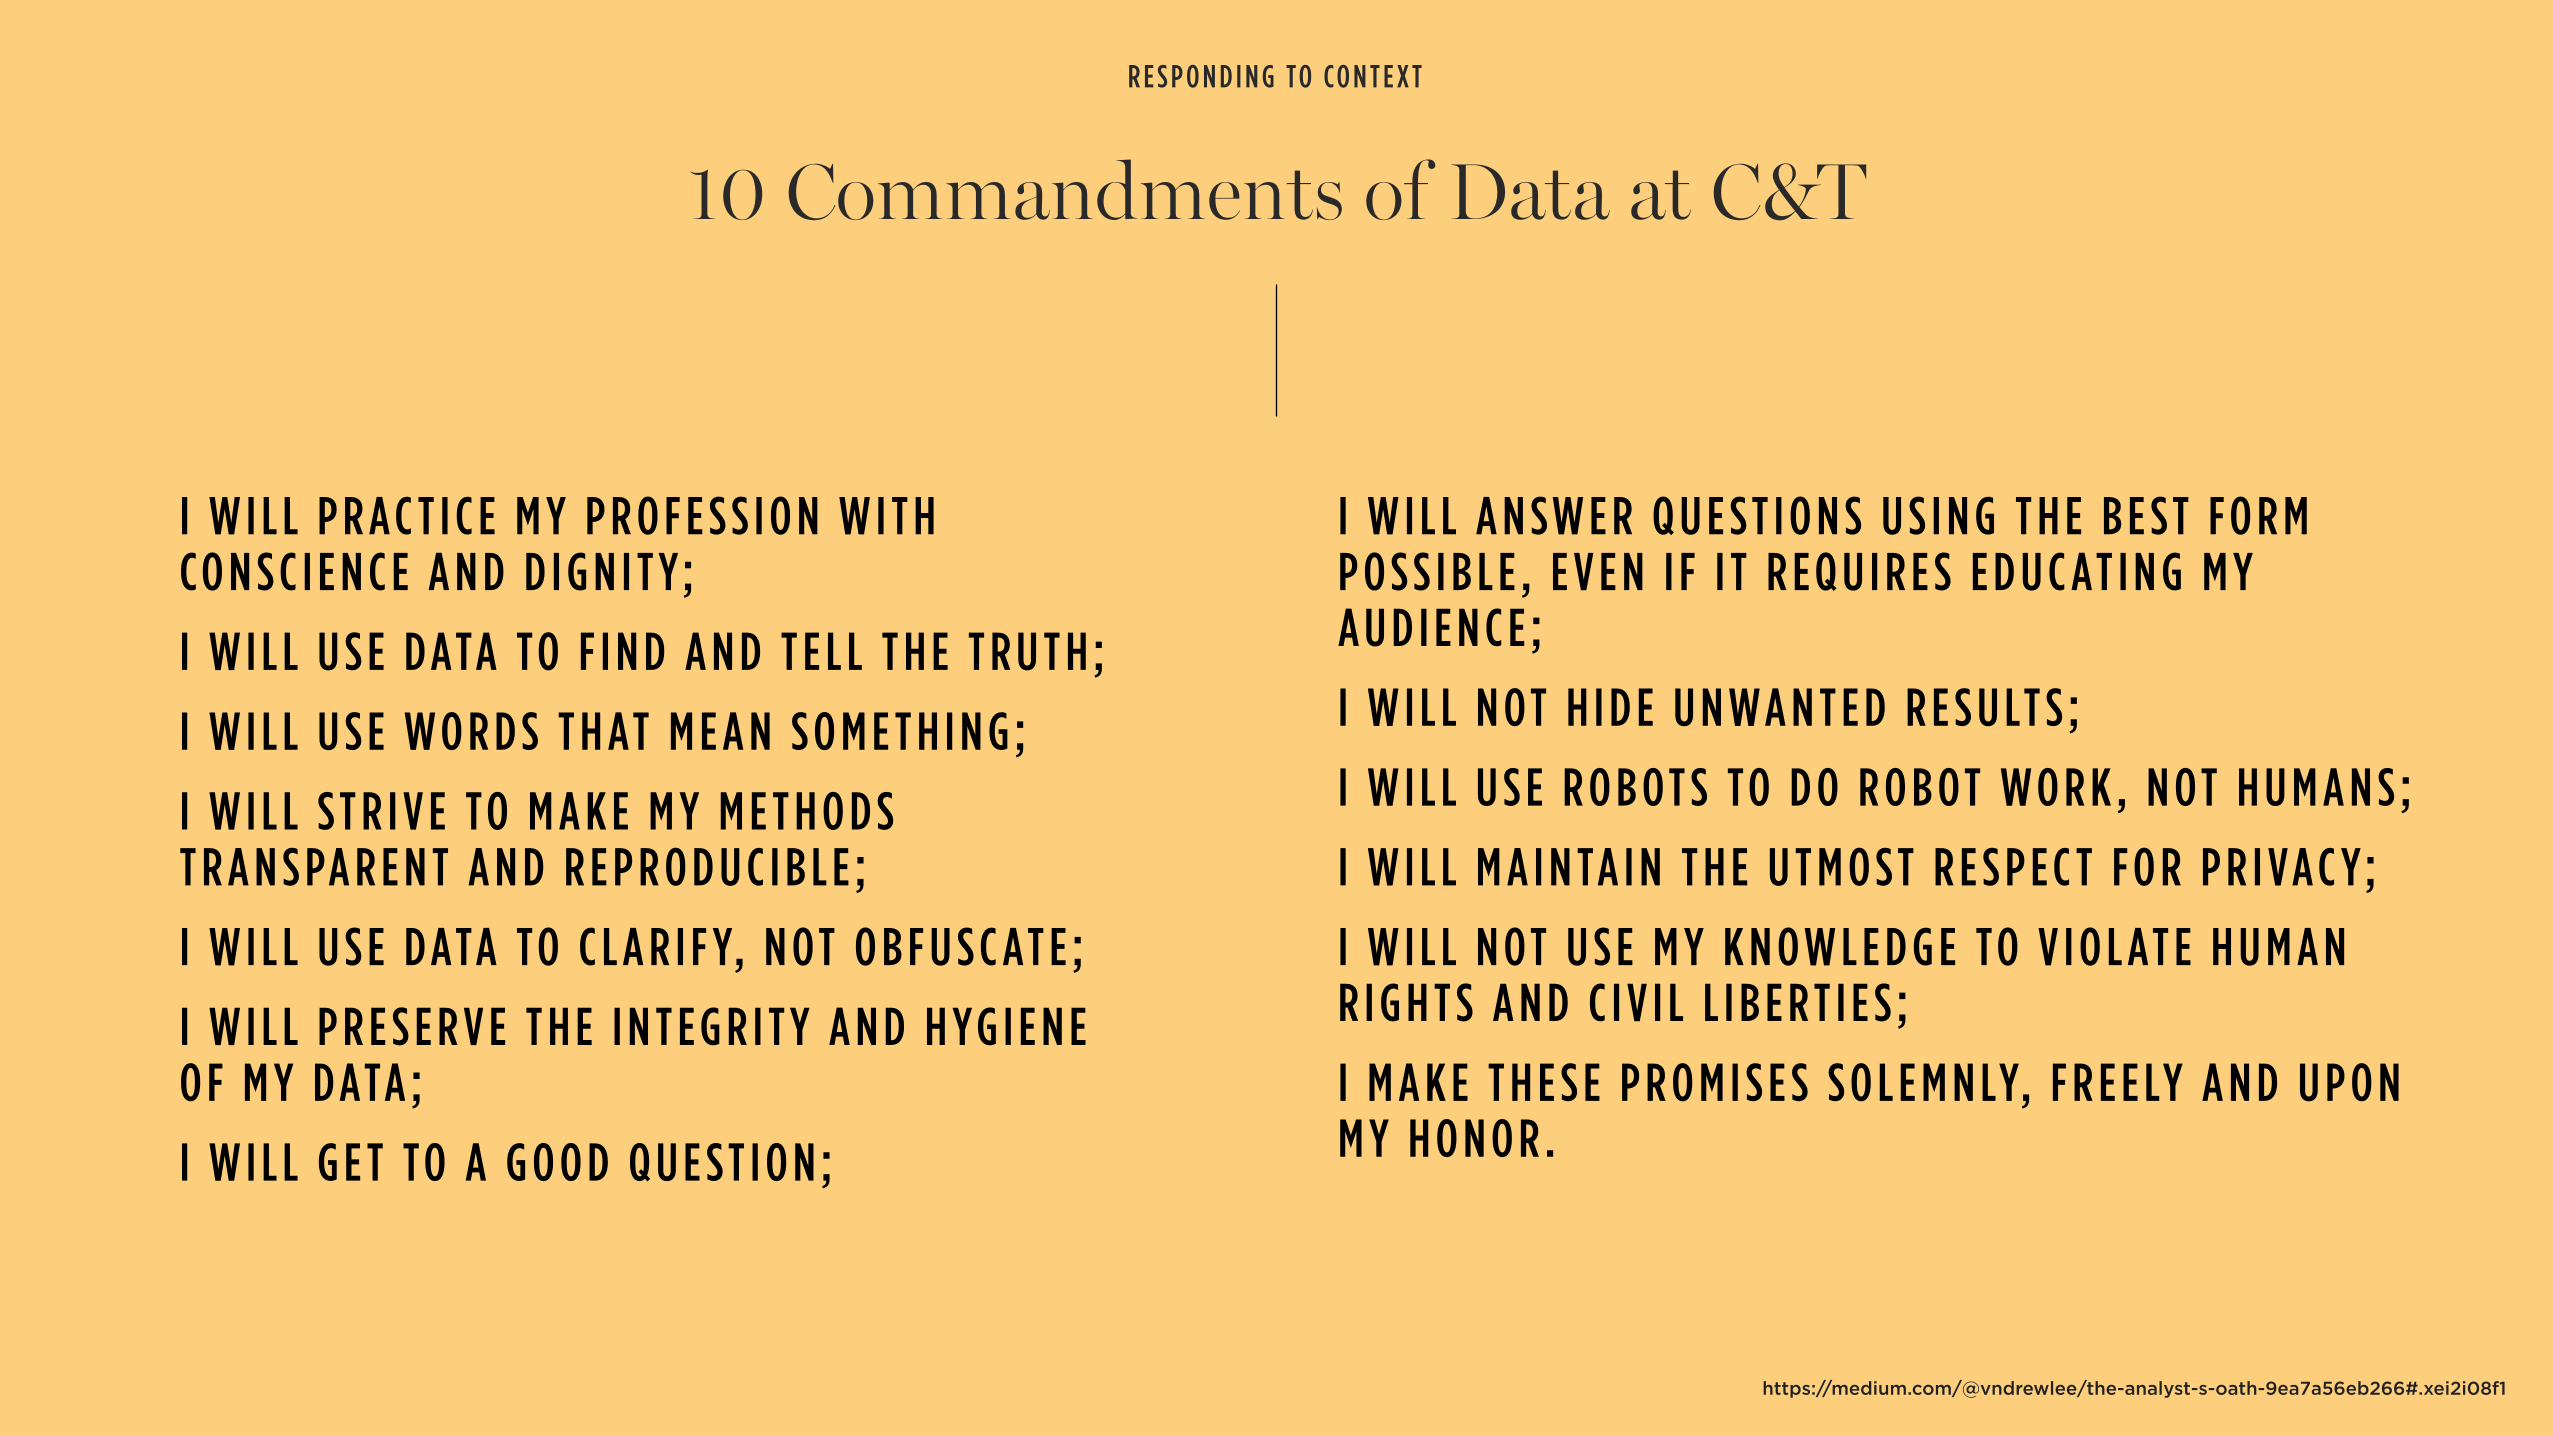
I W I L L P R A C T I C E M Y P R O F E S S I O N W I T H CO N S C I E N C E A N D D I G N I T Y;
I W I L L U S E D ATA TO F I N D A N D T E L L T H E T R U T H ;
I W I L L U S E W O R D S T H AT M E A N S O M E T H I N G ;
I W I L L S T R I V E TO M A K E M Y M E T H O D S T R A N S PA R E N T A N D R E P R O D U C I B L E ;
I W I L L U S E D ATA TO C L A R I F Y, N OT O B F U S C AT E ;
I W I L L P R E S E R V E T H E I N T E G R I T Y A N D H YG I E N E O F M Y D ATA ;
I W I L L G E T TO A G O O D Q U E S T I O N ;
10 Commandments of Data at C&T
R E S P O N D I N G TO CO N T E X T
I W I L L A N SW E R Q U E S T I O N S U S I N G T H E B E S T F O R M P O S S I B L E , E V E N I F I T R E Q U I R E S E D U C AT I N G M Y A U D I E N C E ;
I W I L L N OT H I D E U N W A N T E D R E S U LT S ;
I W I L L U S E R O B OT S TO D O R O B OT W O R K , N OT H U M A N S ;
I W I L L M A I N TA I N T H E U T M O S T R E S P E C T F O R P R I VA C Y;
I W I L L N OT U S E M Y K N O W L E D G E TO V I O L AT E H U M A N R I G H T S A N D C I V I L L I B E R T I E S ;
I M A K E T H E S E P R O M I S E S S O L E M N LY, F R E E LY A N D U P O N M Y H O N O R .
https://medium.com/@vndrewlee/the-analyst-s-oath-9ea7a56eb266#.xei2i08f1
@hollielubbock
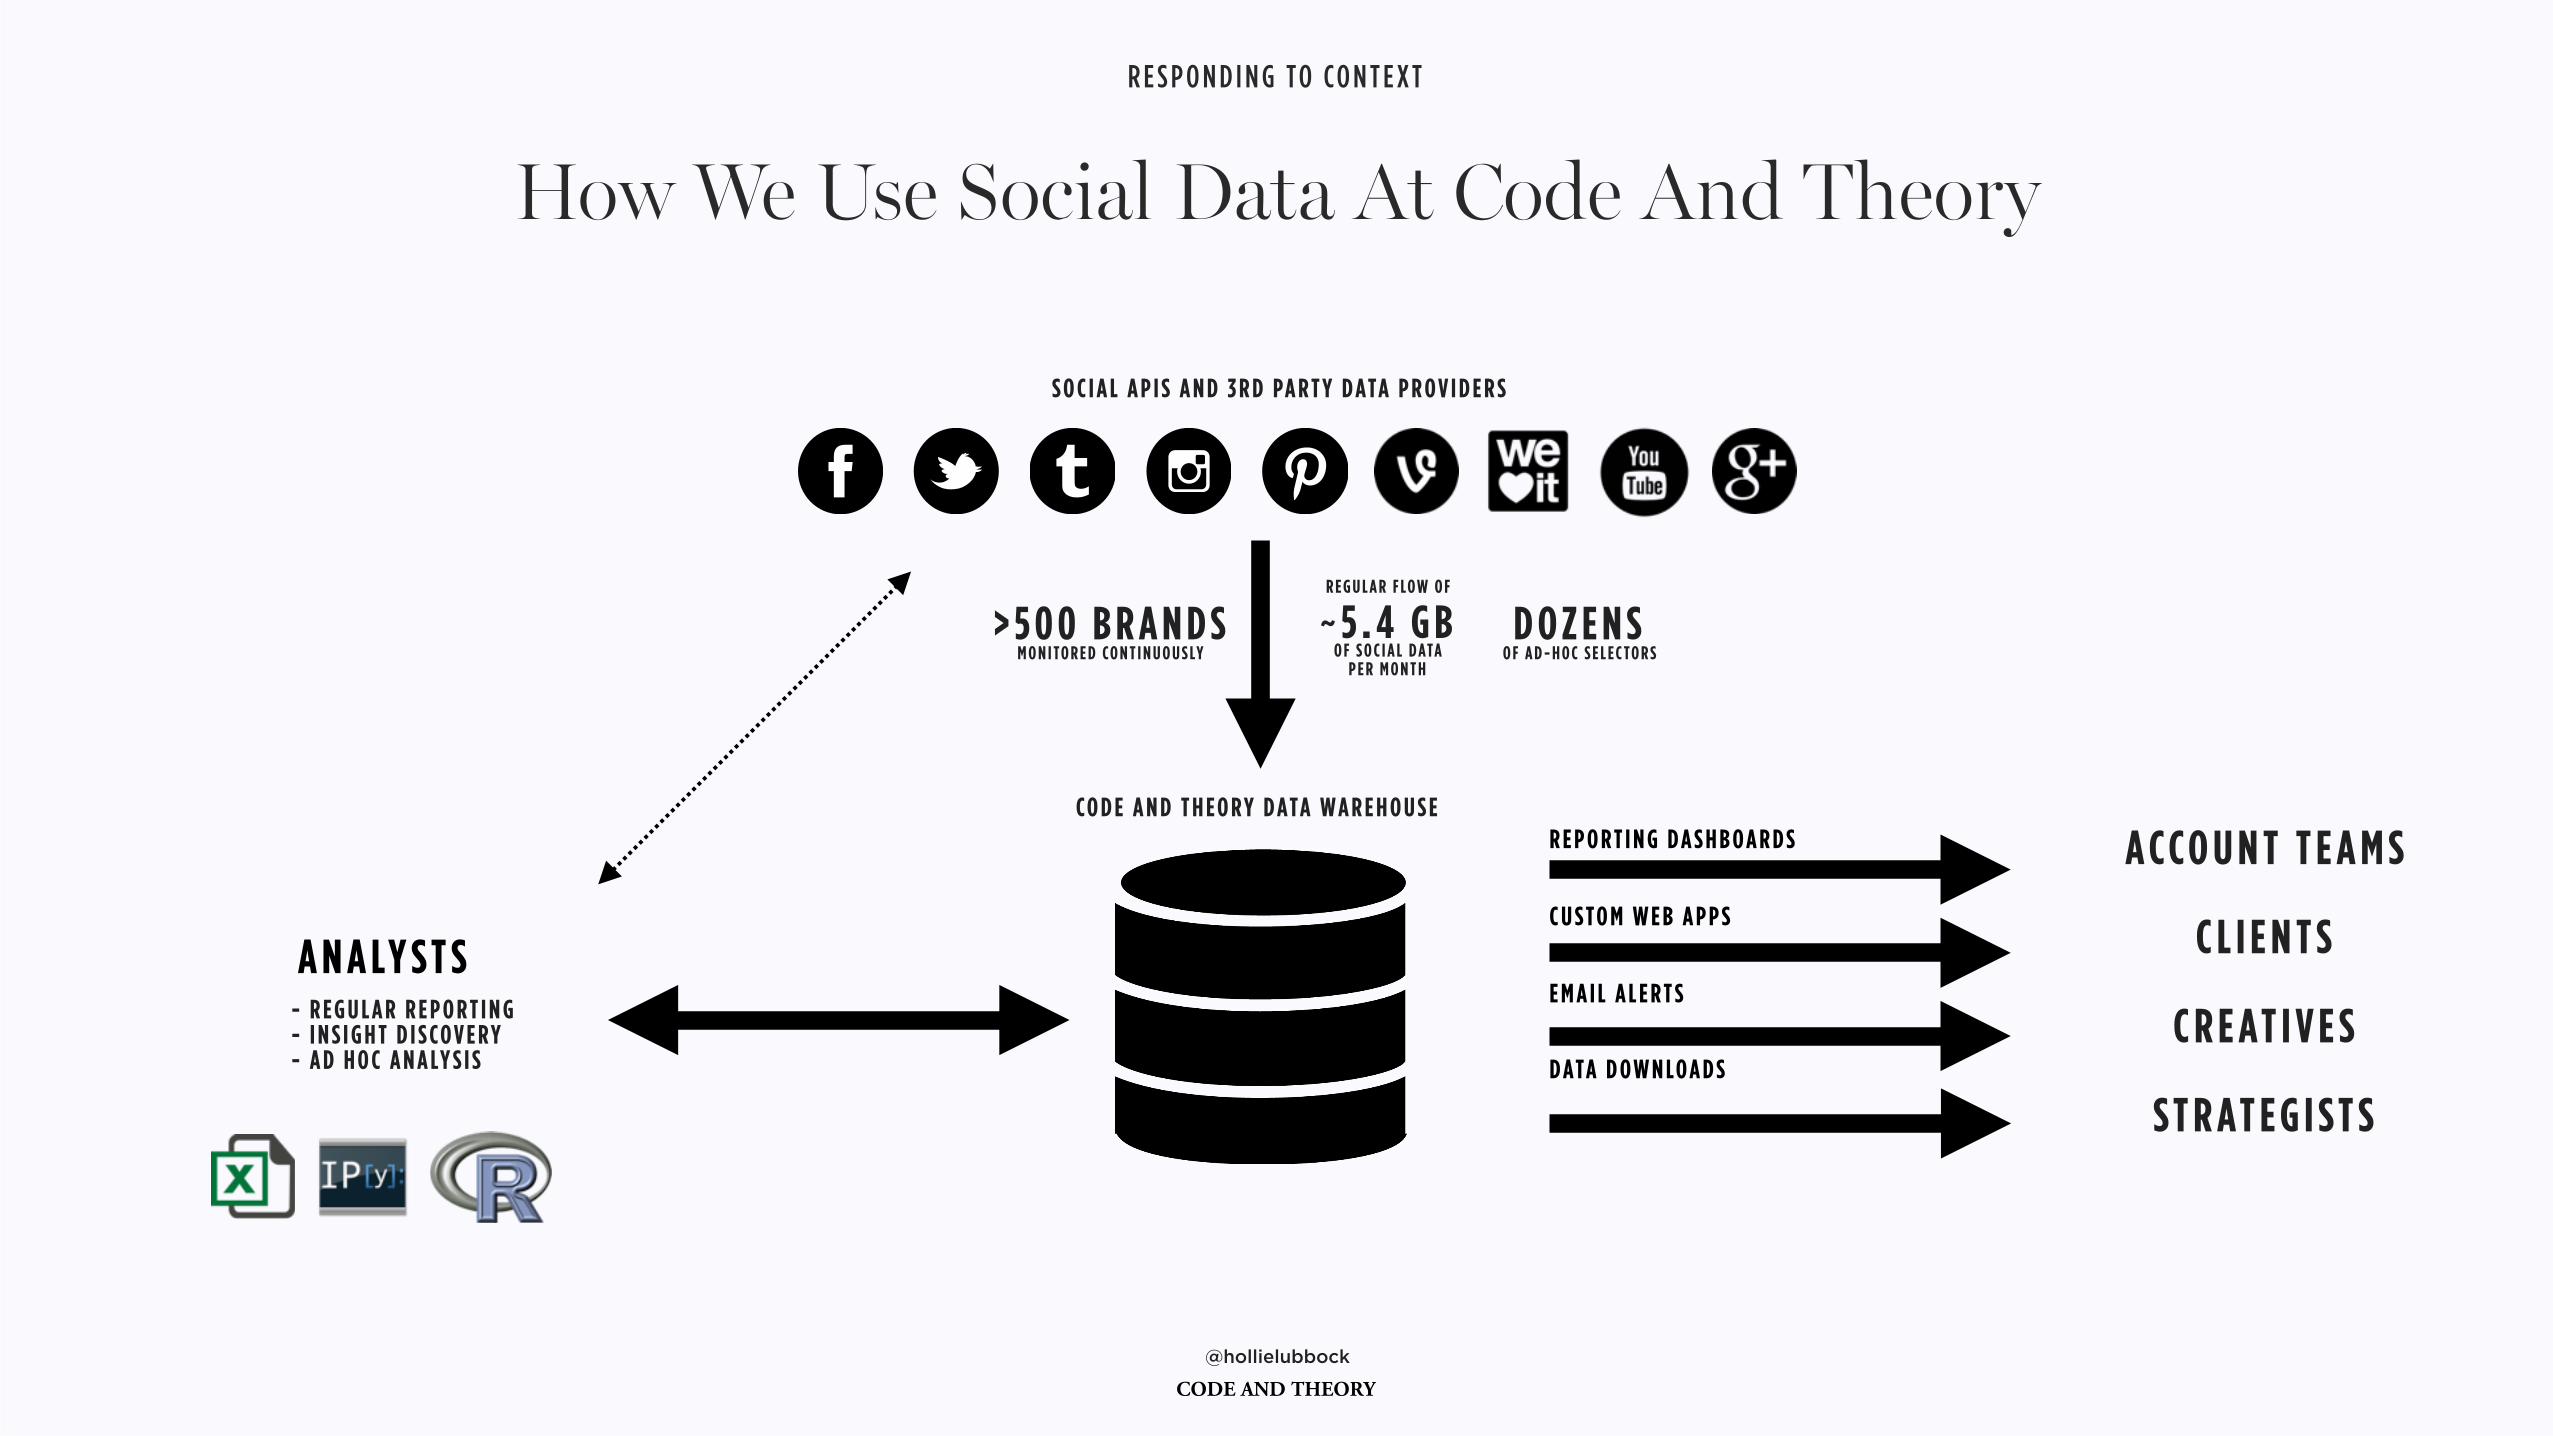
R E G U L A R F LO W O F
~ 5 . 4 G B O F S O C I A L D ATA
P E R M O N T H
CO D E A N D T H E O R Y D ATA W A R E H O U S E
- R E G U L A R R E P O R T I N G - I N S I G H T D I S CO V E R Y - A D H O C A N A LY S I S
C L I E N T S
C R E AT I V E S
S T R AT E G I S T S
A CCO U N T T E A M S
A N A LY S T S
R E P O R T I N G D A S H B O A R D S
C U S T O M W E B A P P S
E M A I L A L E R T S
D ATA D O W N LO A D S
> 5 0 0 B R A N D S M O N I T O R E D CO N T I N U O U S LY
D O Z E N S O F A D - H O C S E L E C T O R S
S O C I A L A P I S A N D 3 R D PA R T Y D ATA P R O V I D E R S
How We Use Social Data At Code And Theory
R E S P O N D I N G TO CO N T E X T
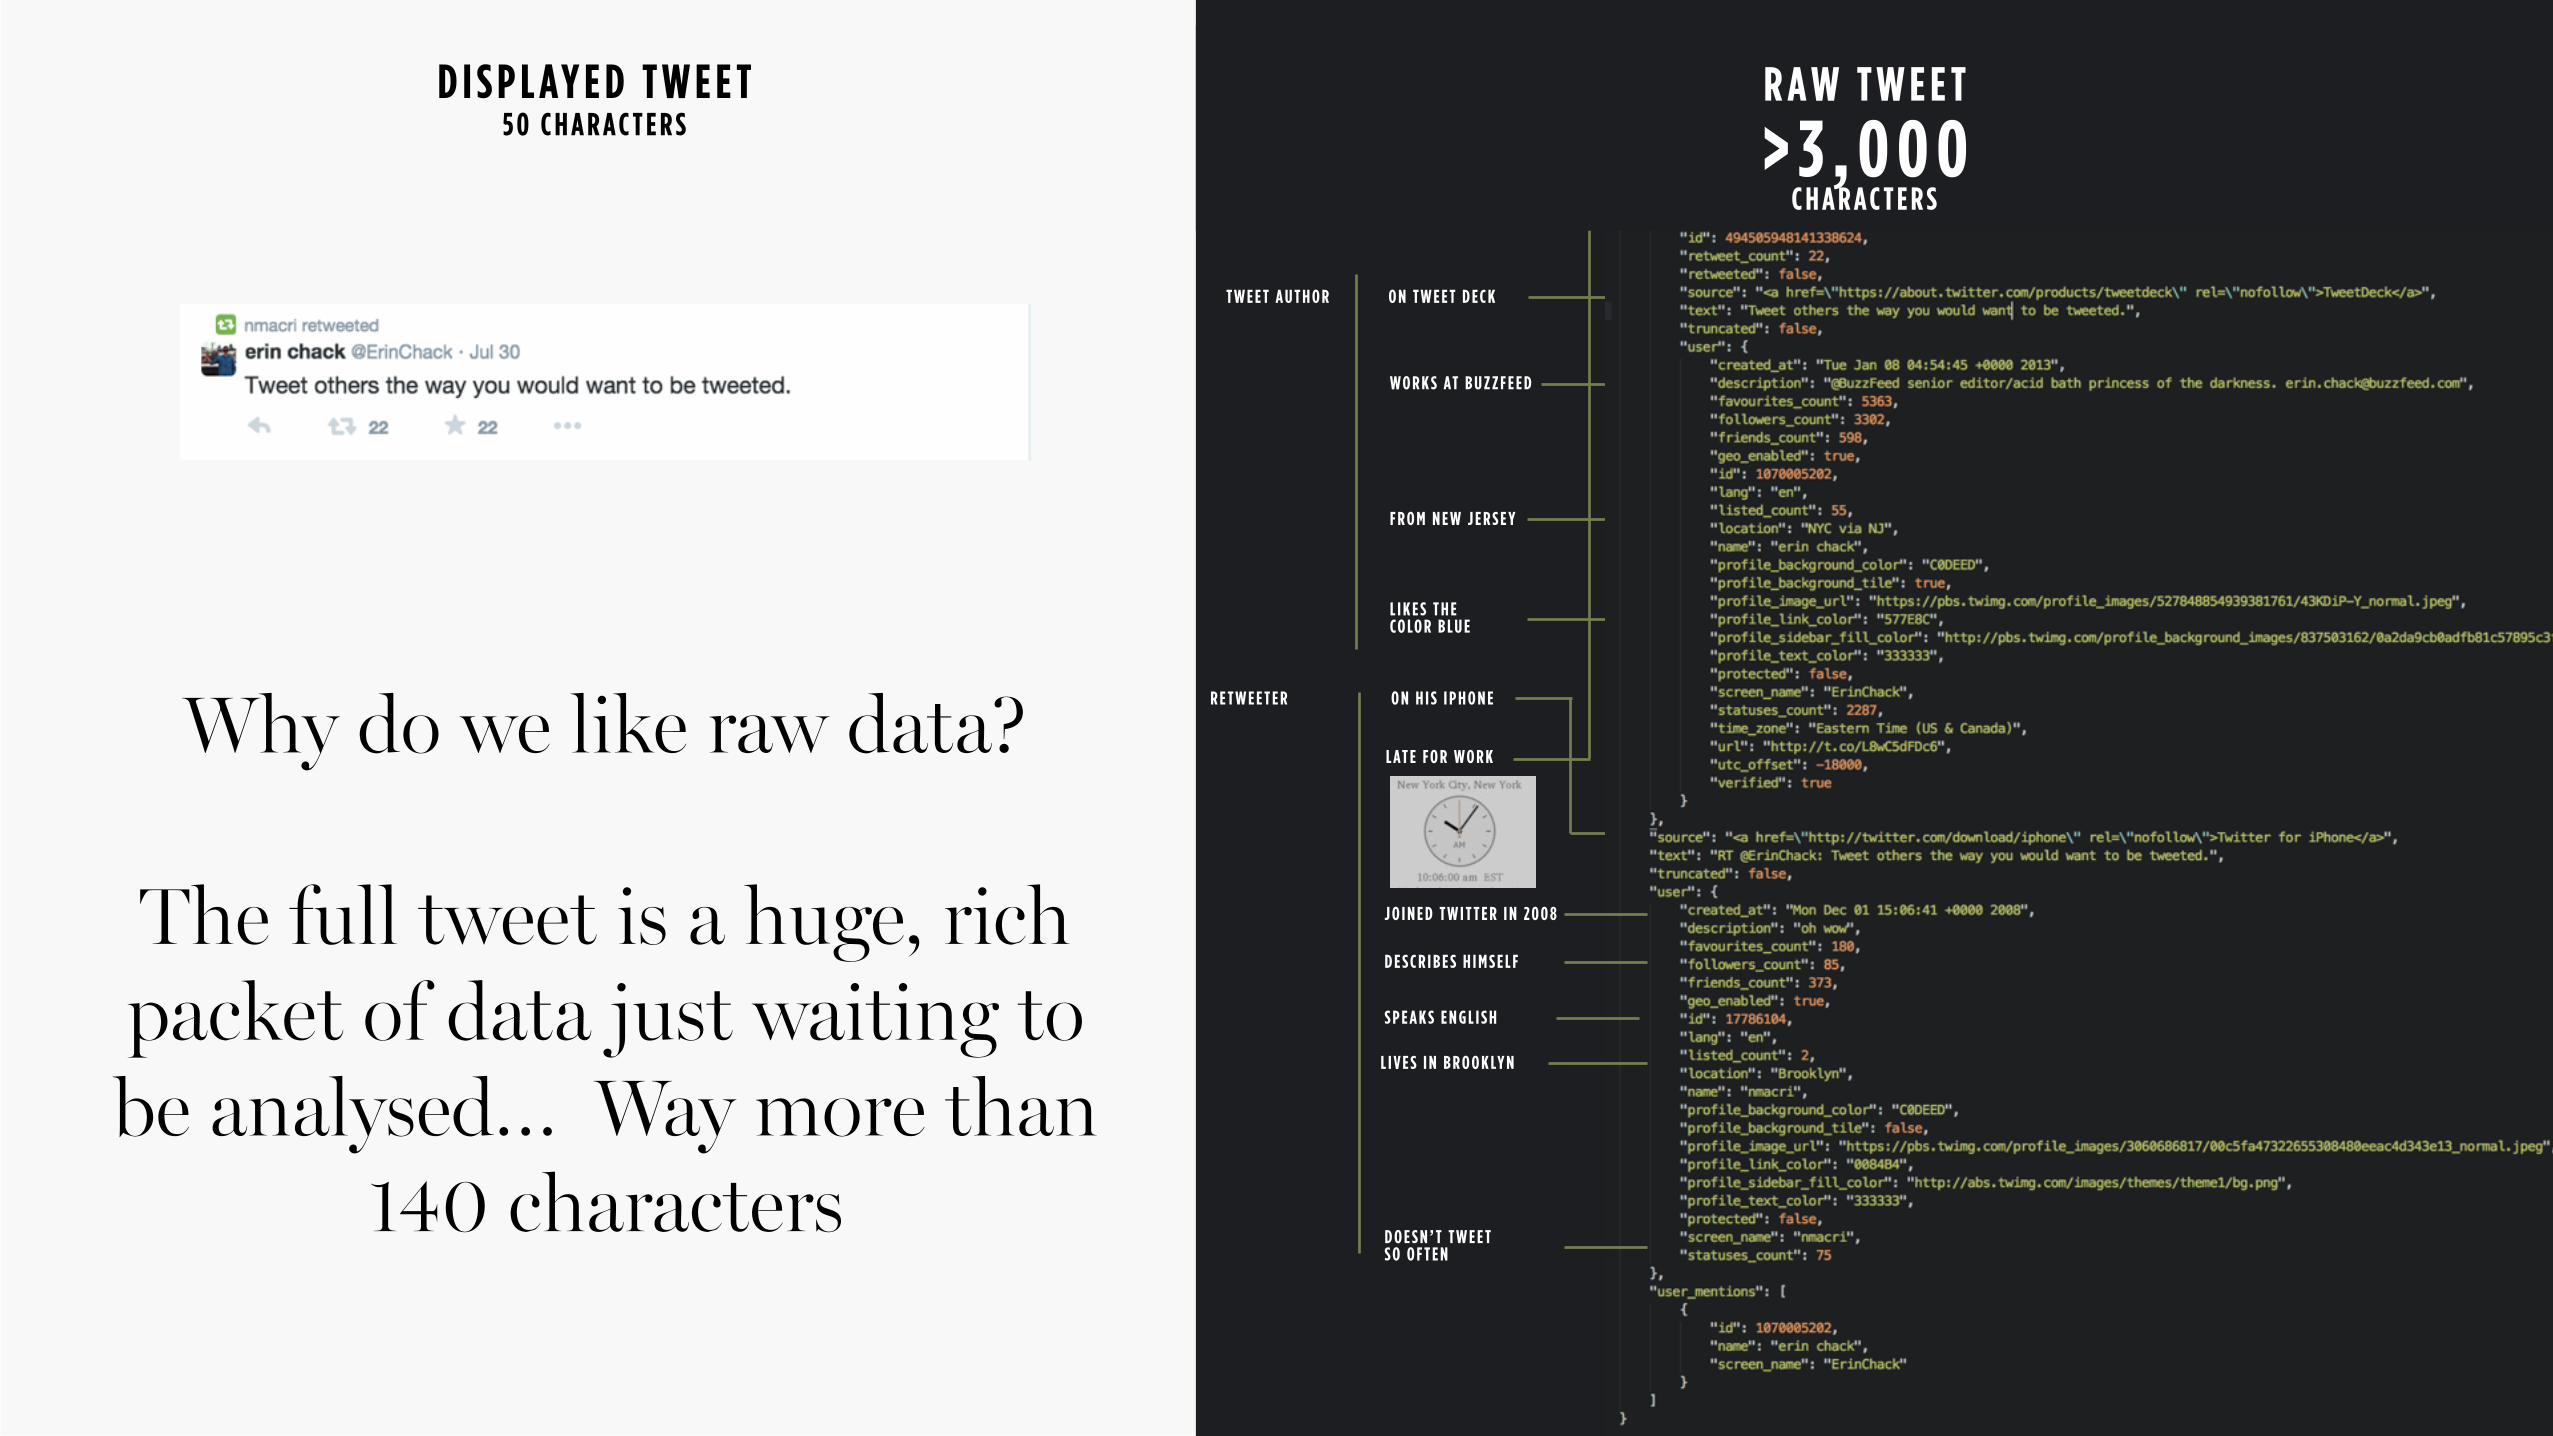
L I V E S I N B R O O K LY N
S P E A K S E N G L I S H
D O E S N ’ T T W E E T S O O F T E N
W O R K S AT B U Z Z F E E D
O N T W E E T D E C K
O N H I S I P H O N E
L AT E F O R W O R K
F R O M N E W J E R S E Y
D E S C R I B E S H I M S E L F
J O I N E D T W I T T E R I N 2 0 0 8
L I K E S T H E CO LO R B L U E
T W E E T A U T H O R
R E T W E E T E R
D I S P L AY E D T W E E T 5 0 C H A R A C T E R S
R A W T W E E T
> 3 , 0 0 0 C H A R A C T E R S
Why do we like raw data?
The full tweet is a huge, rich packet of data just waiting to be analysed… Way more than
140 characters
@hollielubbock
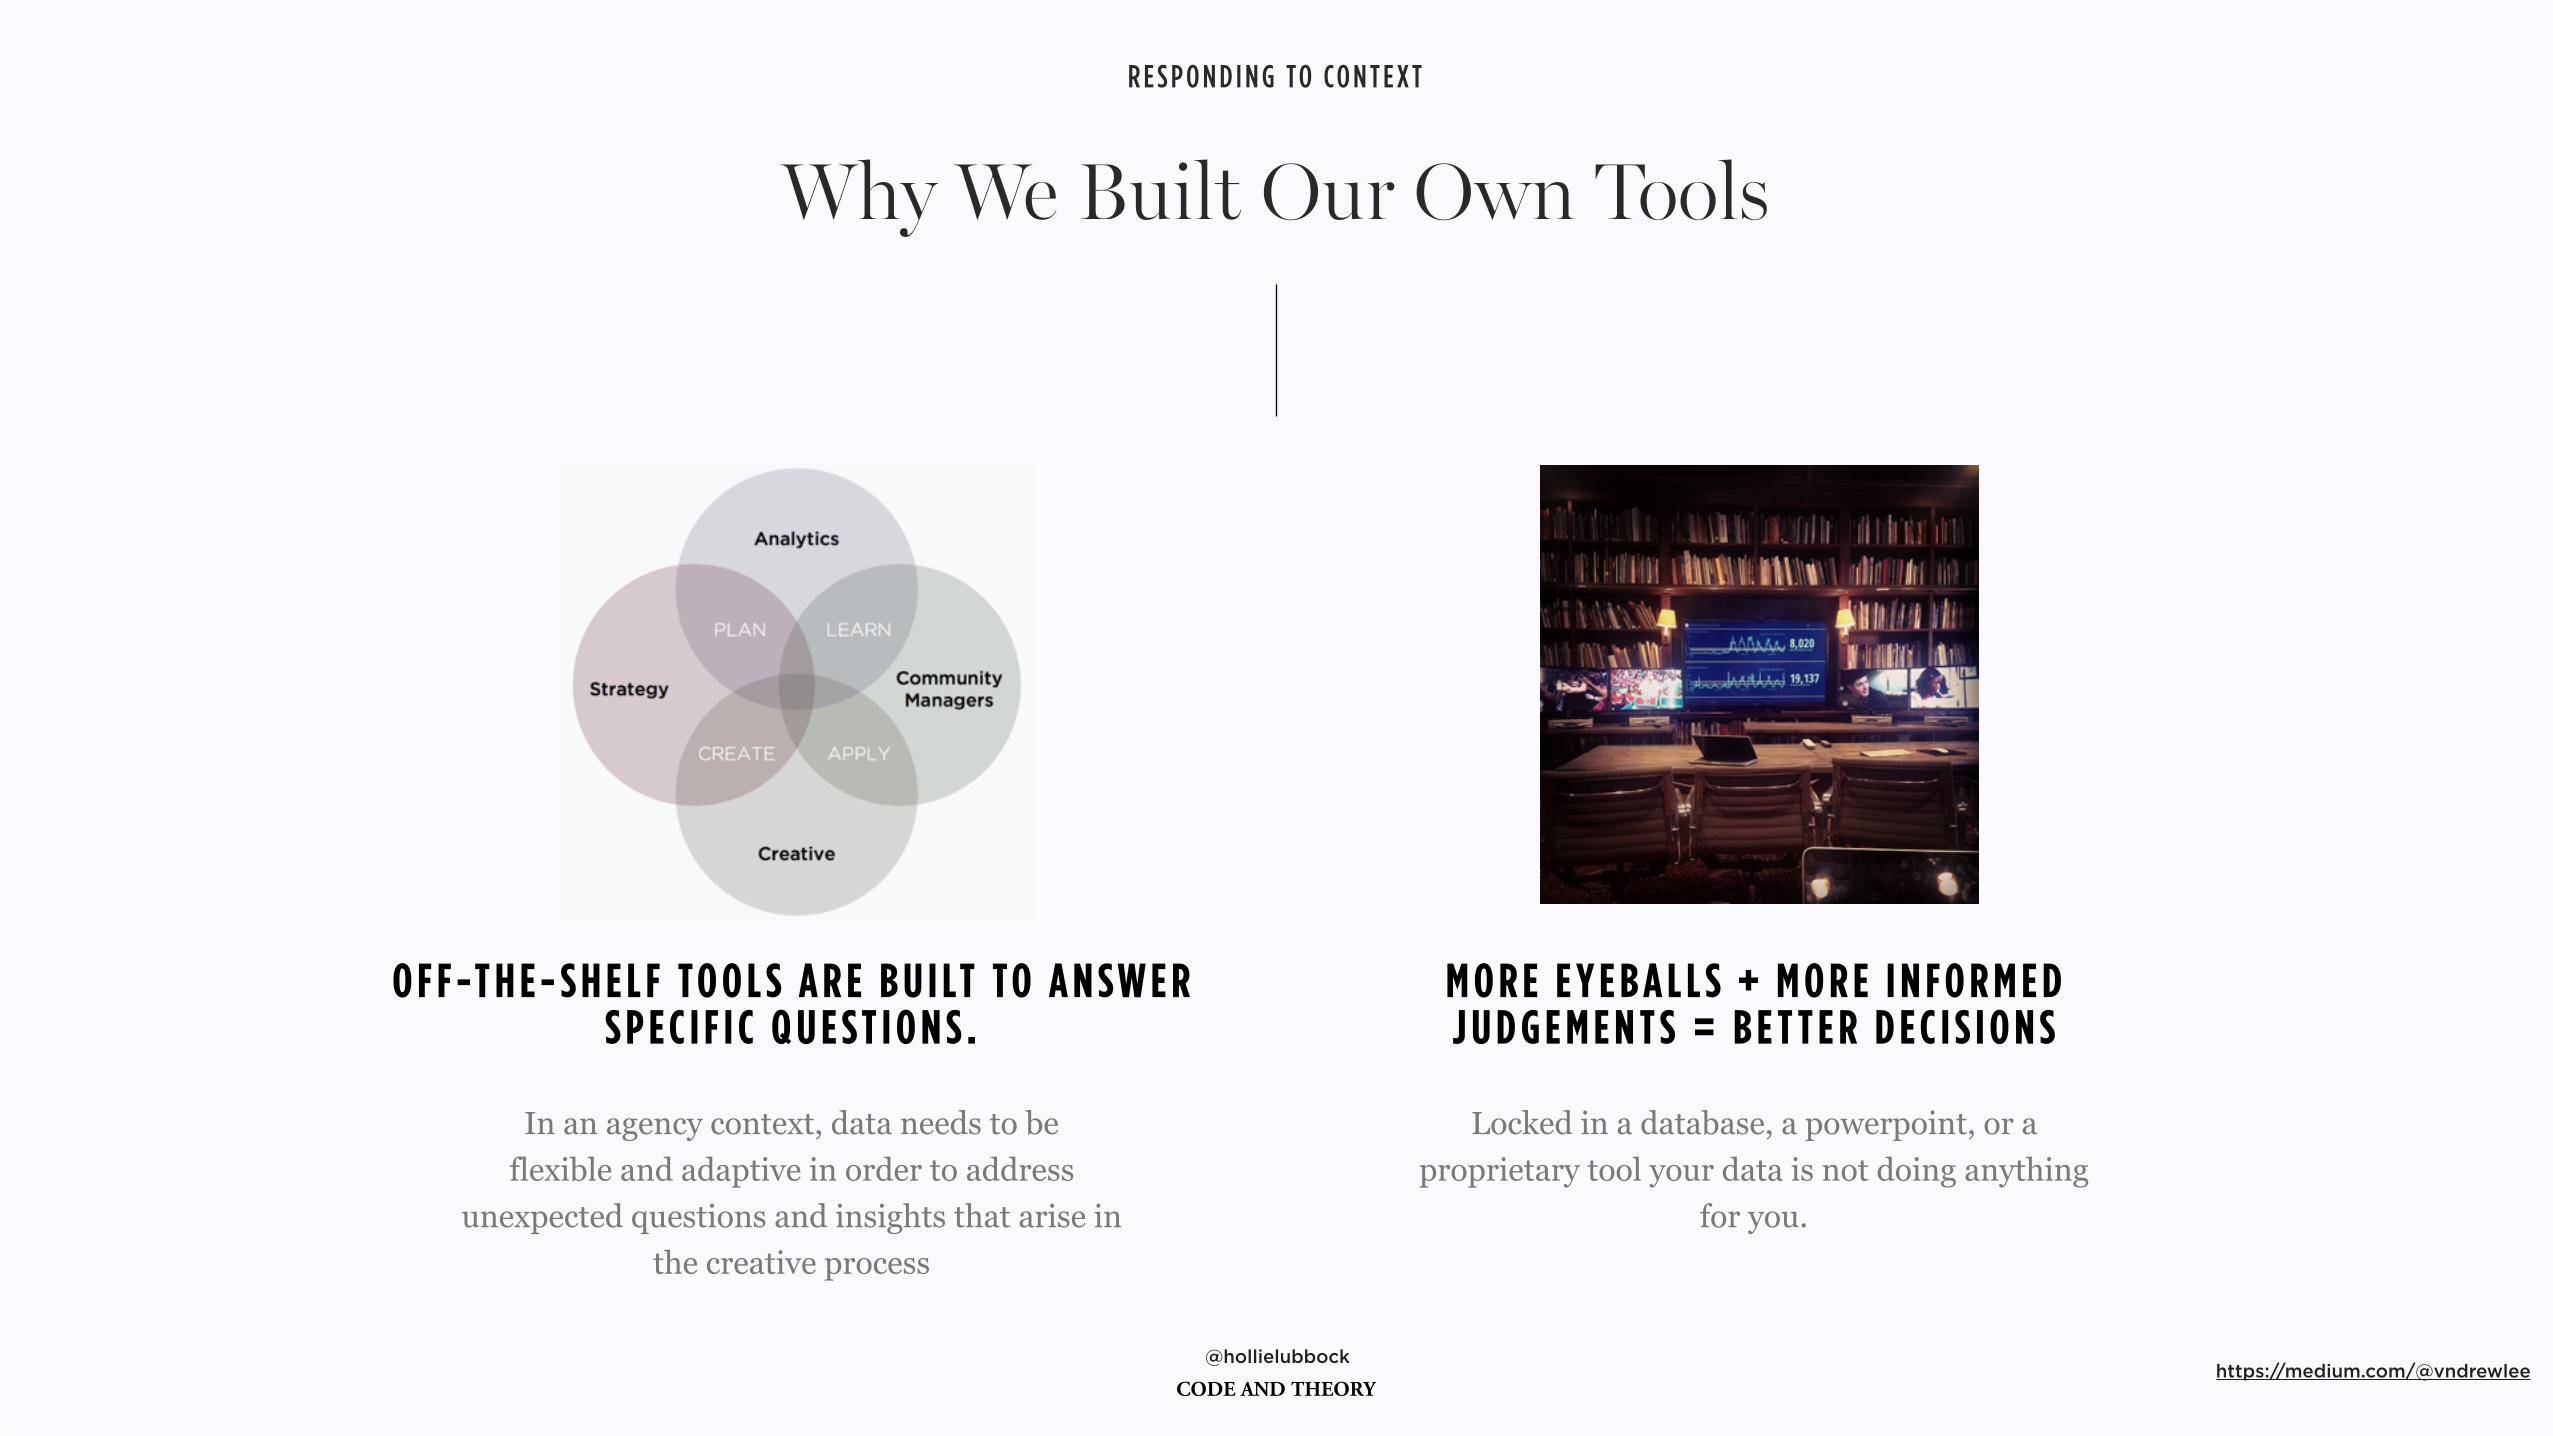
O F F -T H E - S H E L F T O O L S A R E B U I LT T O A N S W E R S P E C I F I C Q U E S T I O N S .
In an agency context, data needs to be flexible and adaptive in order to address
unexpected questions and insights that arise in the creative process
https://medium.com/@vndrewlee
Why We Built Our Own Tools
R E S P O N D I N G TO CO N T E X T
M O R E E Y E B A L L S + M O R E I N F O R M E D J U D G E M E N T S = B E T T E R D E C I S I O N S
Locked in a database, a powerpoint, or a proprietary tool your data is not doing anything
for you.
@hollielubbock
D ATA S T R AT E G Y = M E A S U R E M E N T S T R AT E G Y
Data is the measurable digital footprint of every part of your business. Data is the substance that allows us to effectively measure and optimise. To be effective, your data strategy must align to the
measurement strategy and in turn be clearly mapped to the business strategy
Strategy
R E S P O N D I N G TO CO N T E X T
@hollielubbock
Foursquare
Case study
R E S P O N D I N G TO CO N T E X T
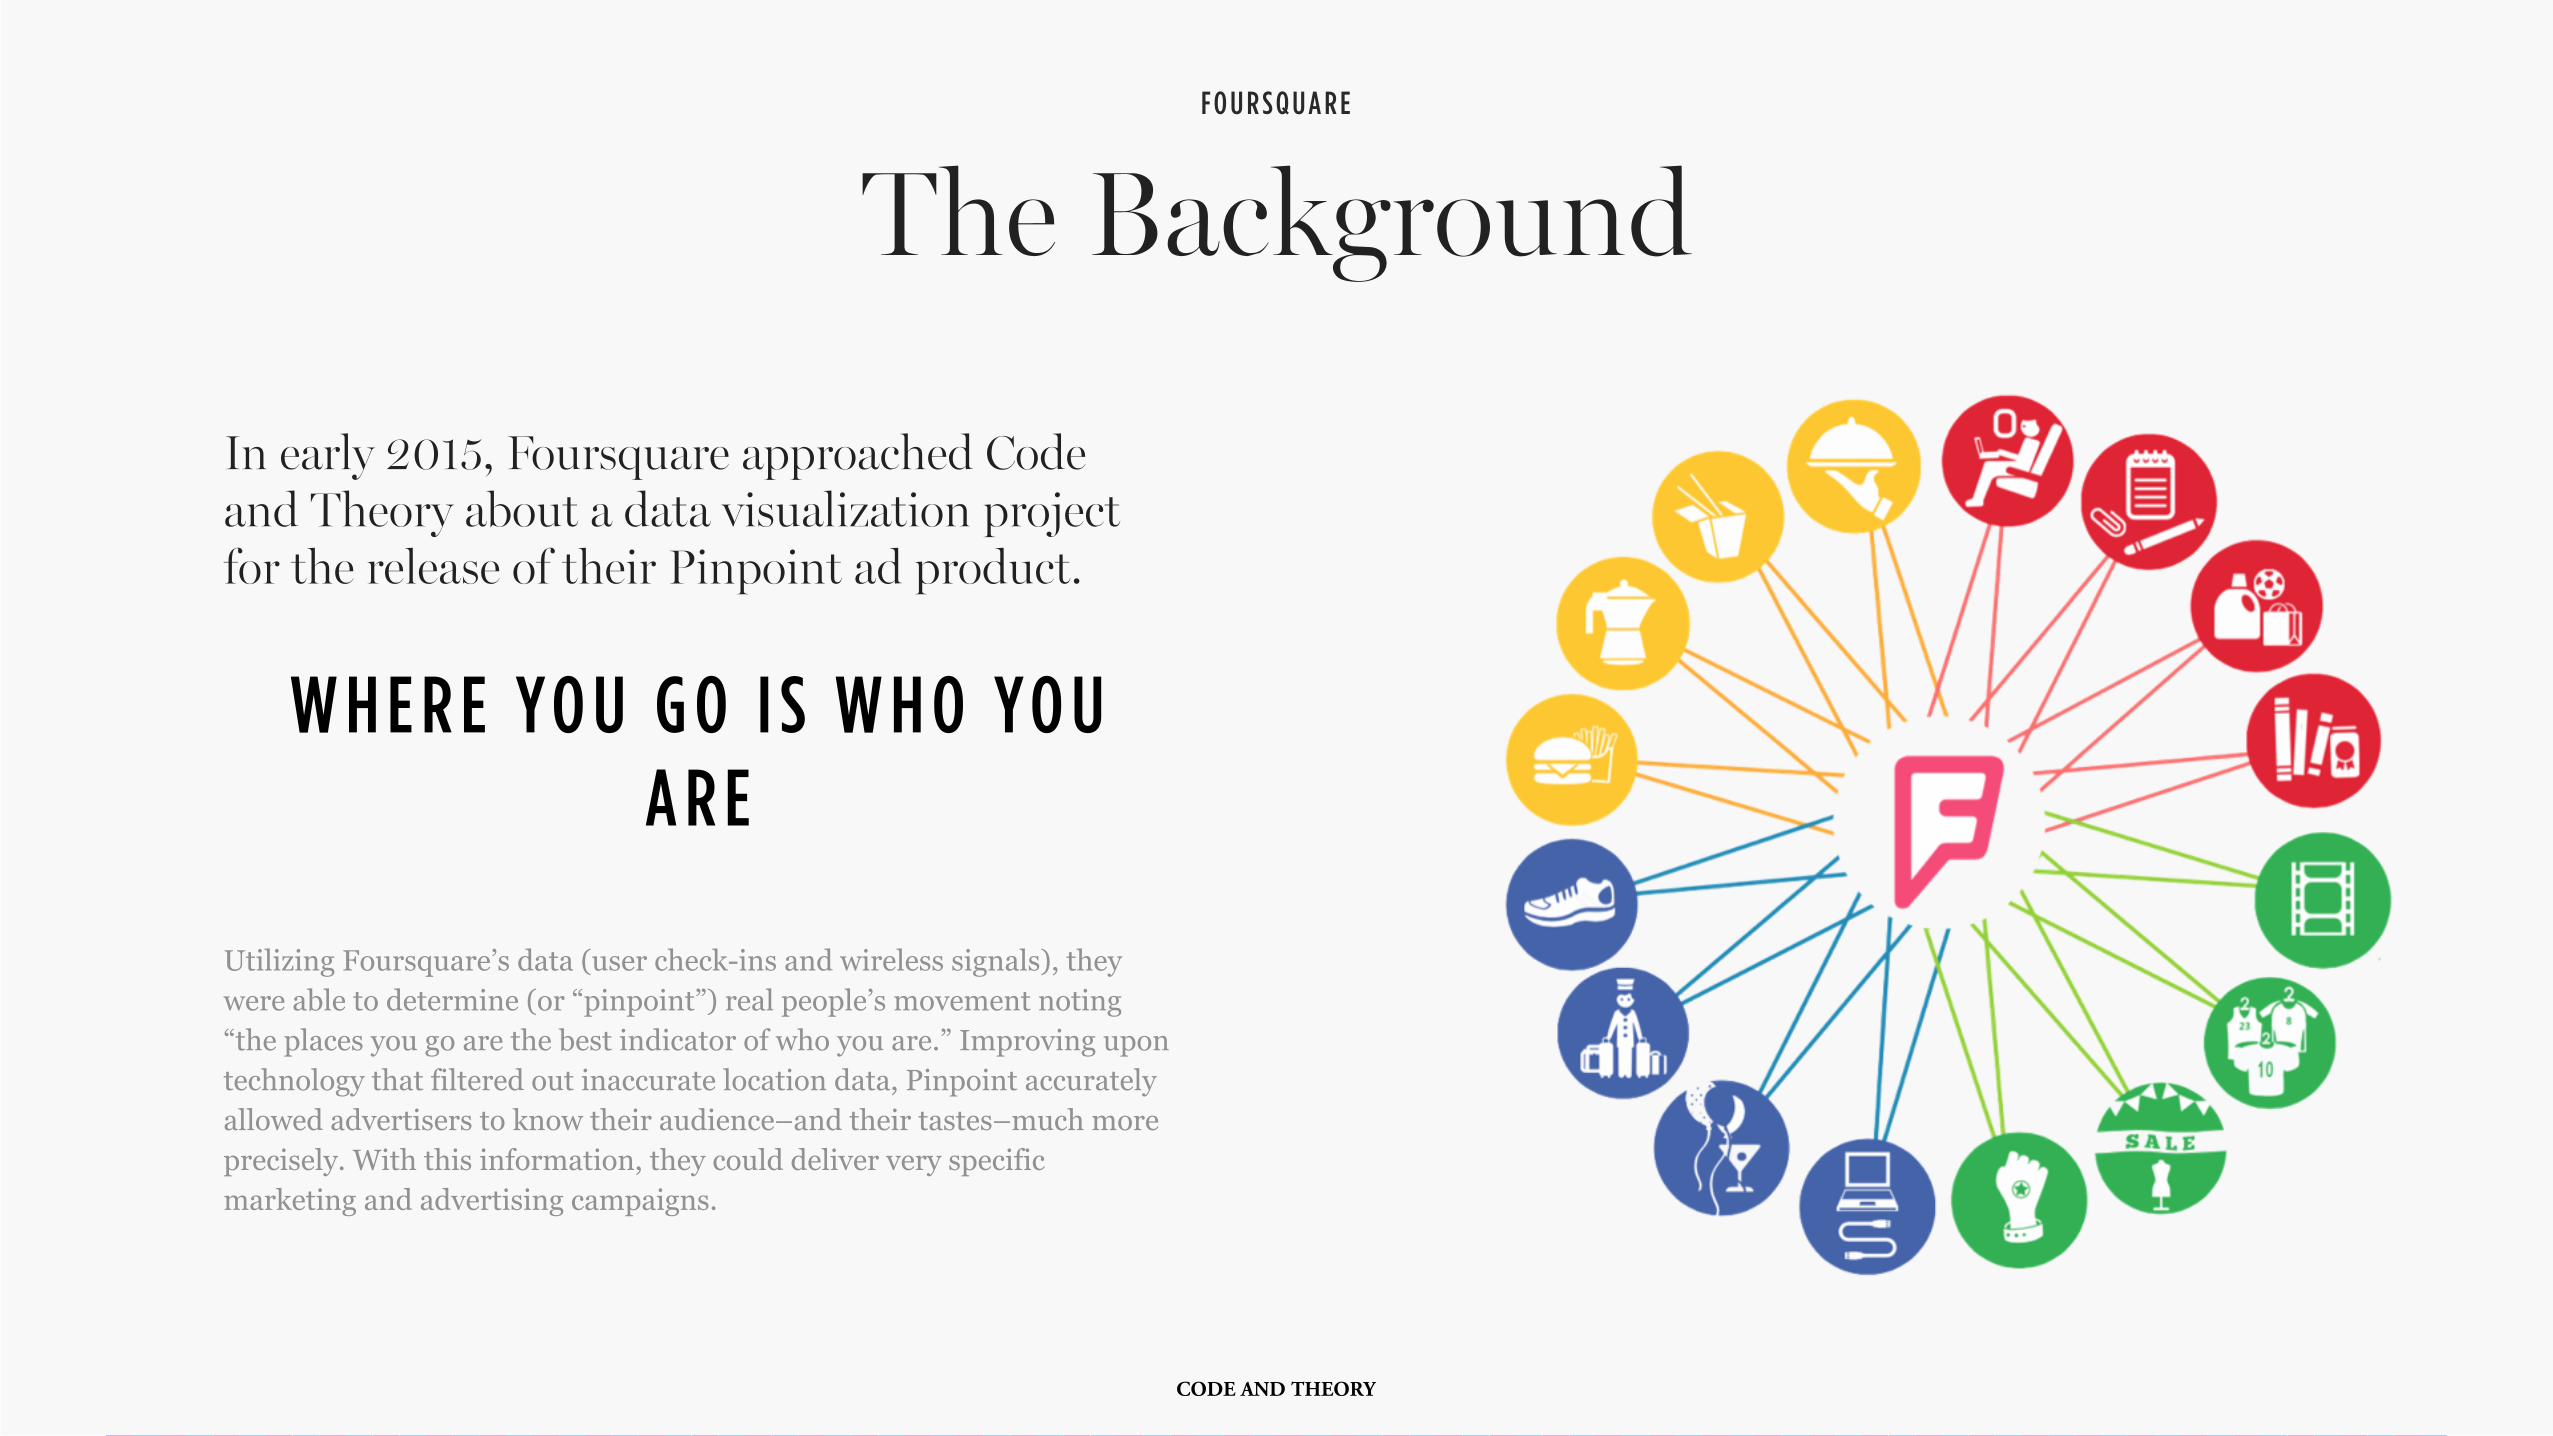
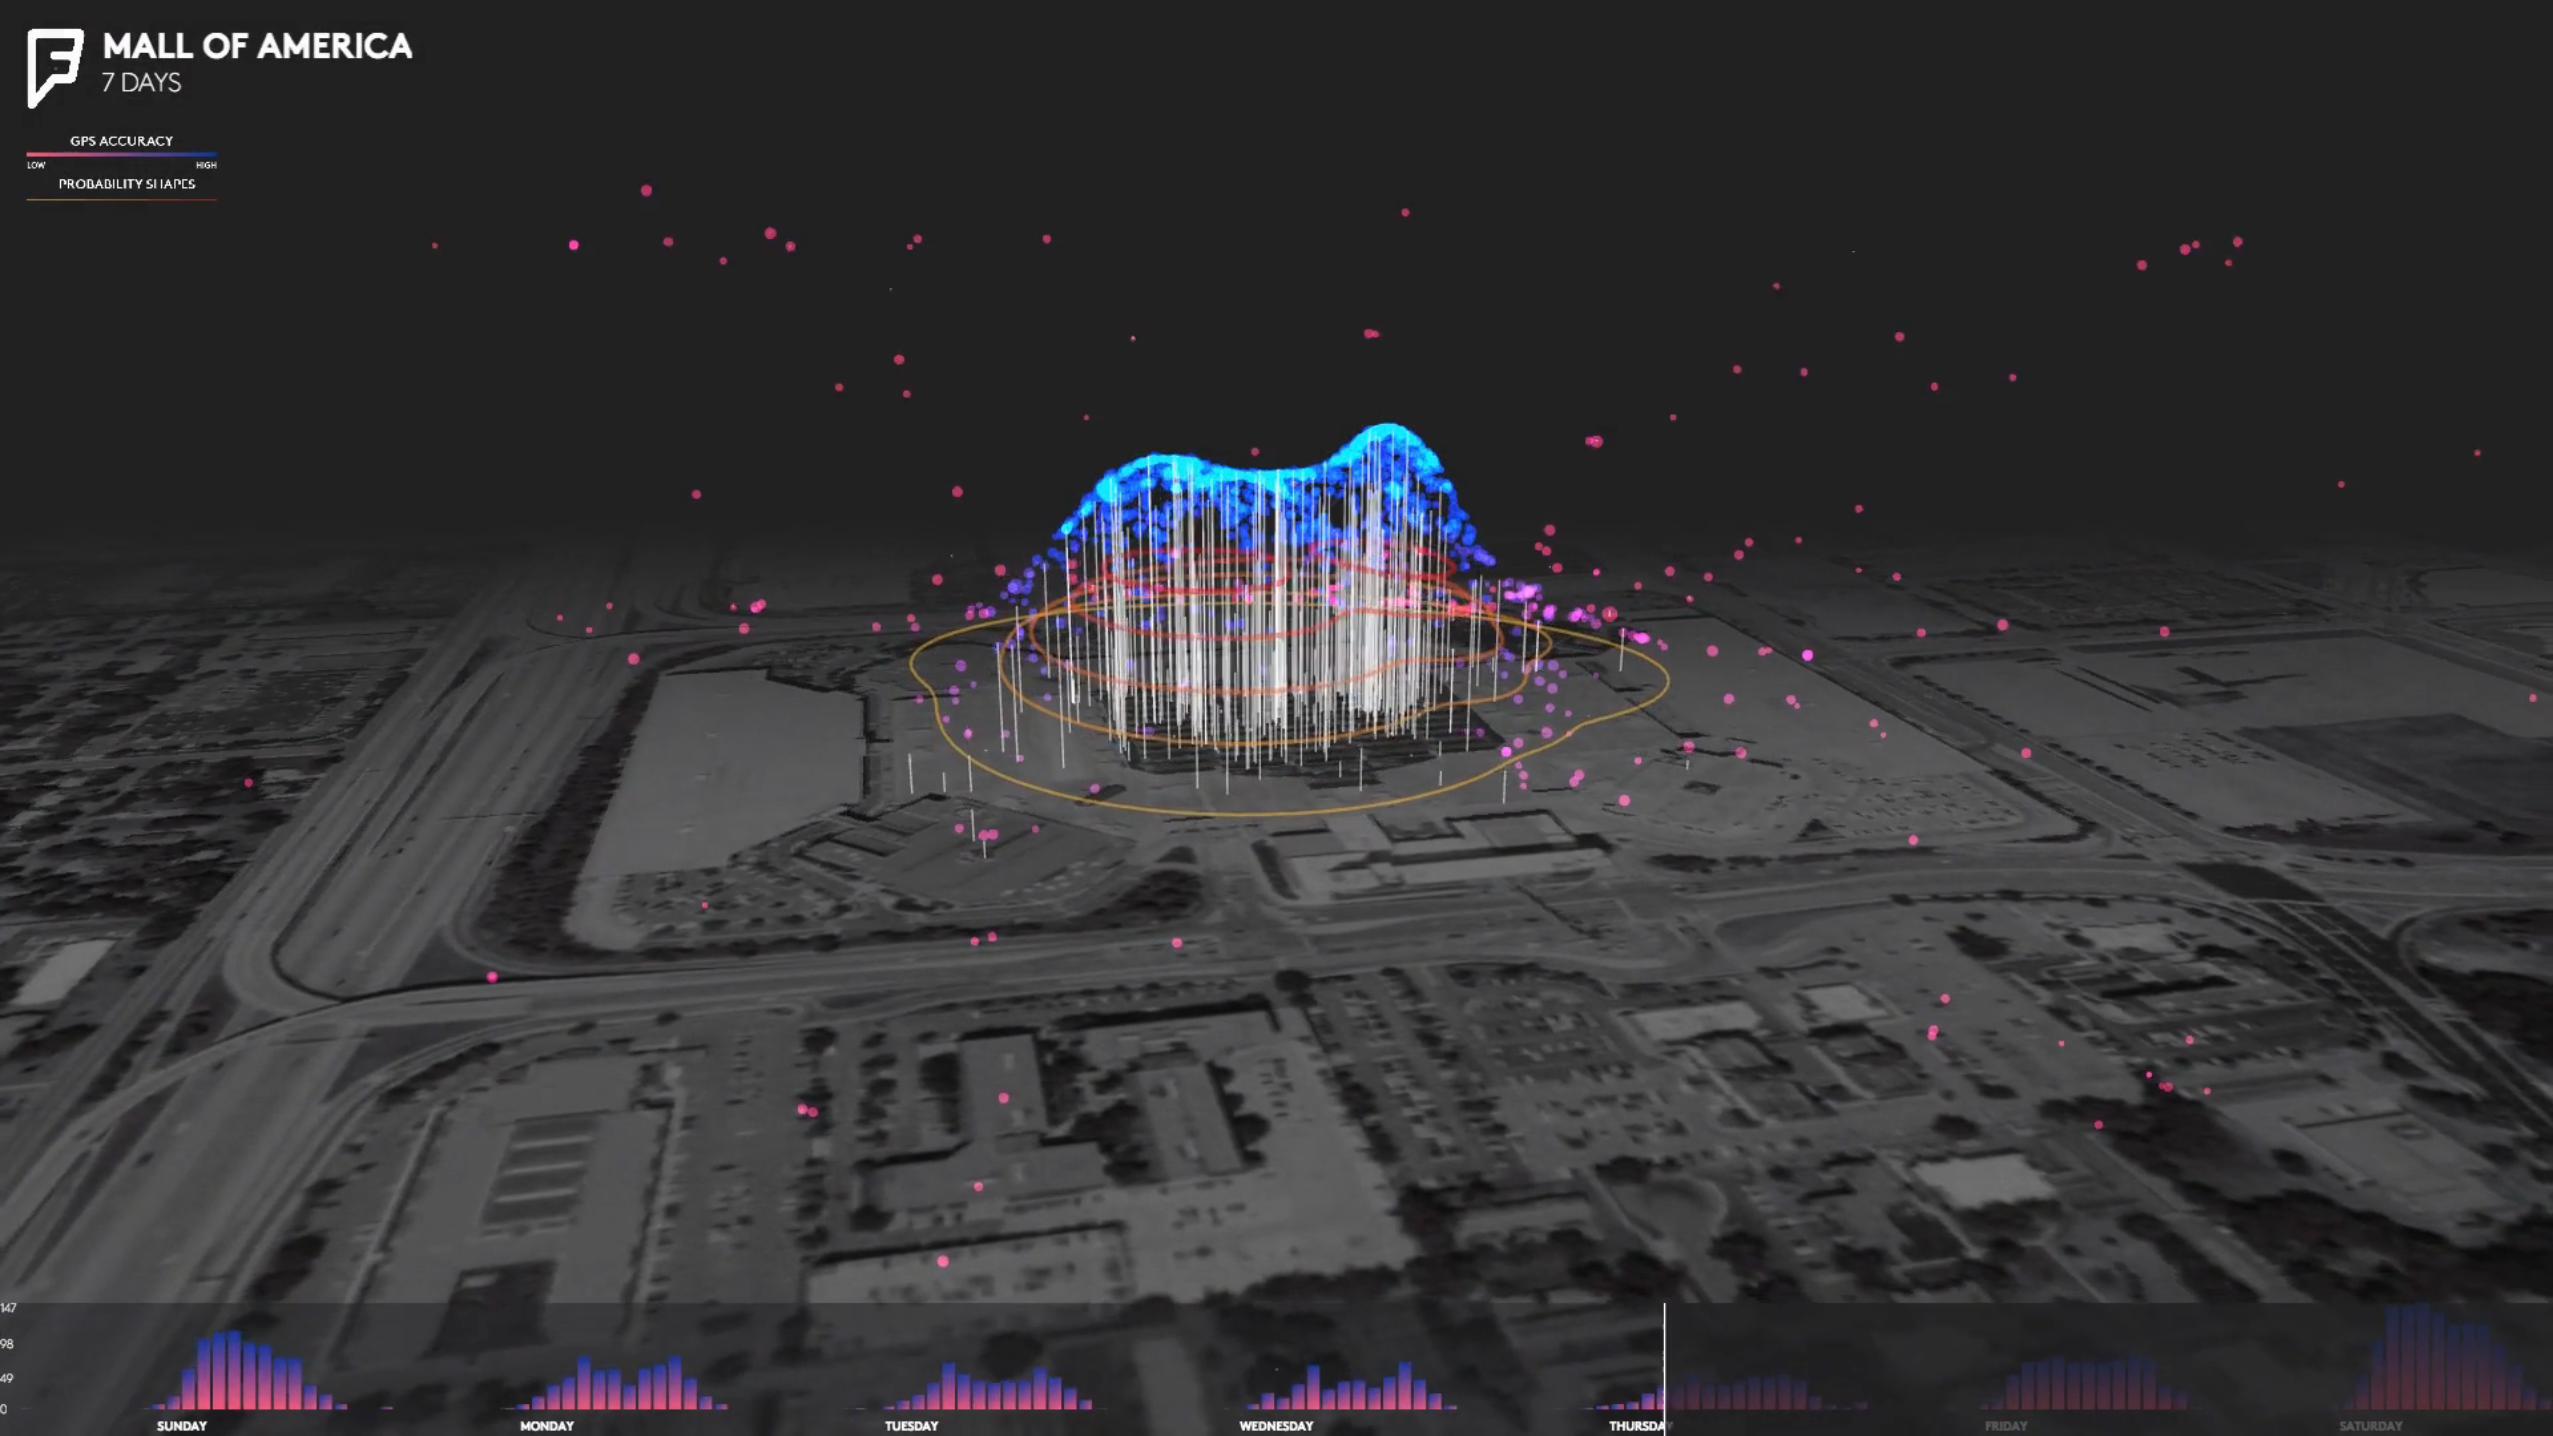
The BackgroundF O U R S Q U A R E
In early 2015, Foursquare approached Code and Theory about a data visualization project for the release of their Pinpoint ad product.
W H E R E YO U G O I S W H O YO U A R E
Utilizing Foursquare’s data (user check-ins and wireless signals), they were able to determine (or “pinpoint”) real people’s movement noting “the places you go are the best indicator of who you are.” Improving upon technology that filtered out inaccurate location data, Pinpoint accurately allowed advertisers to know their audience–and their tastes–much more precisely. With this information, they could deliver very specific marketing and advertising campaigns.
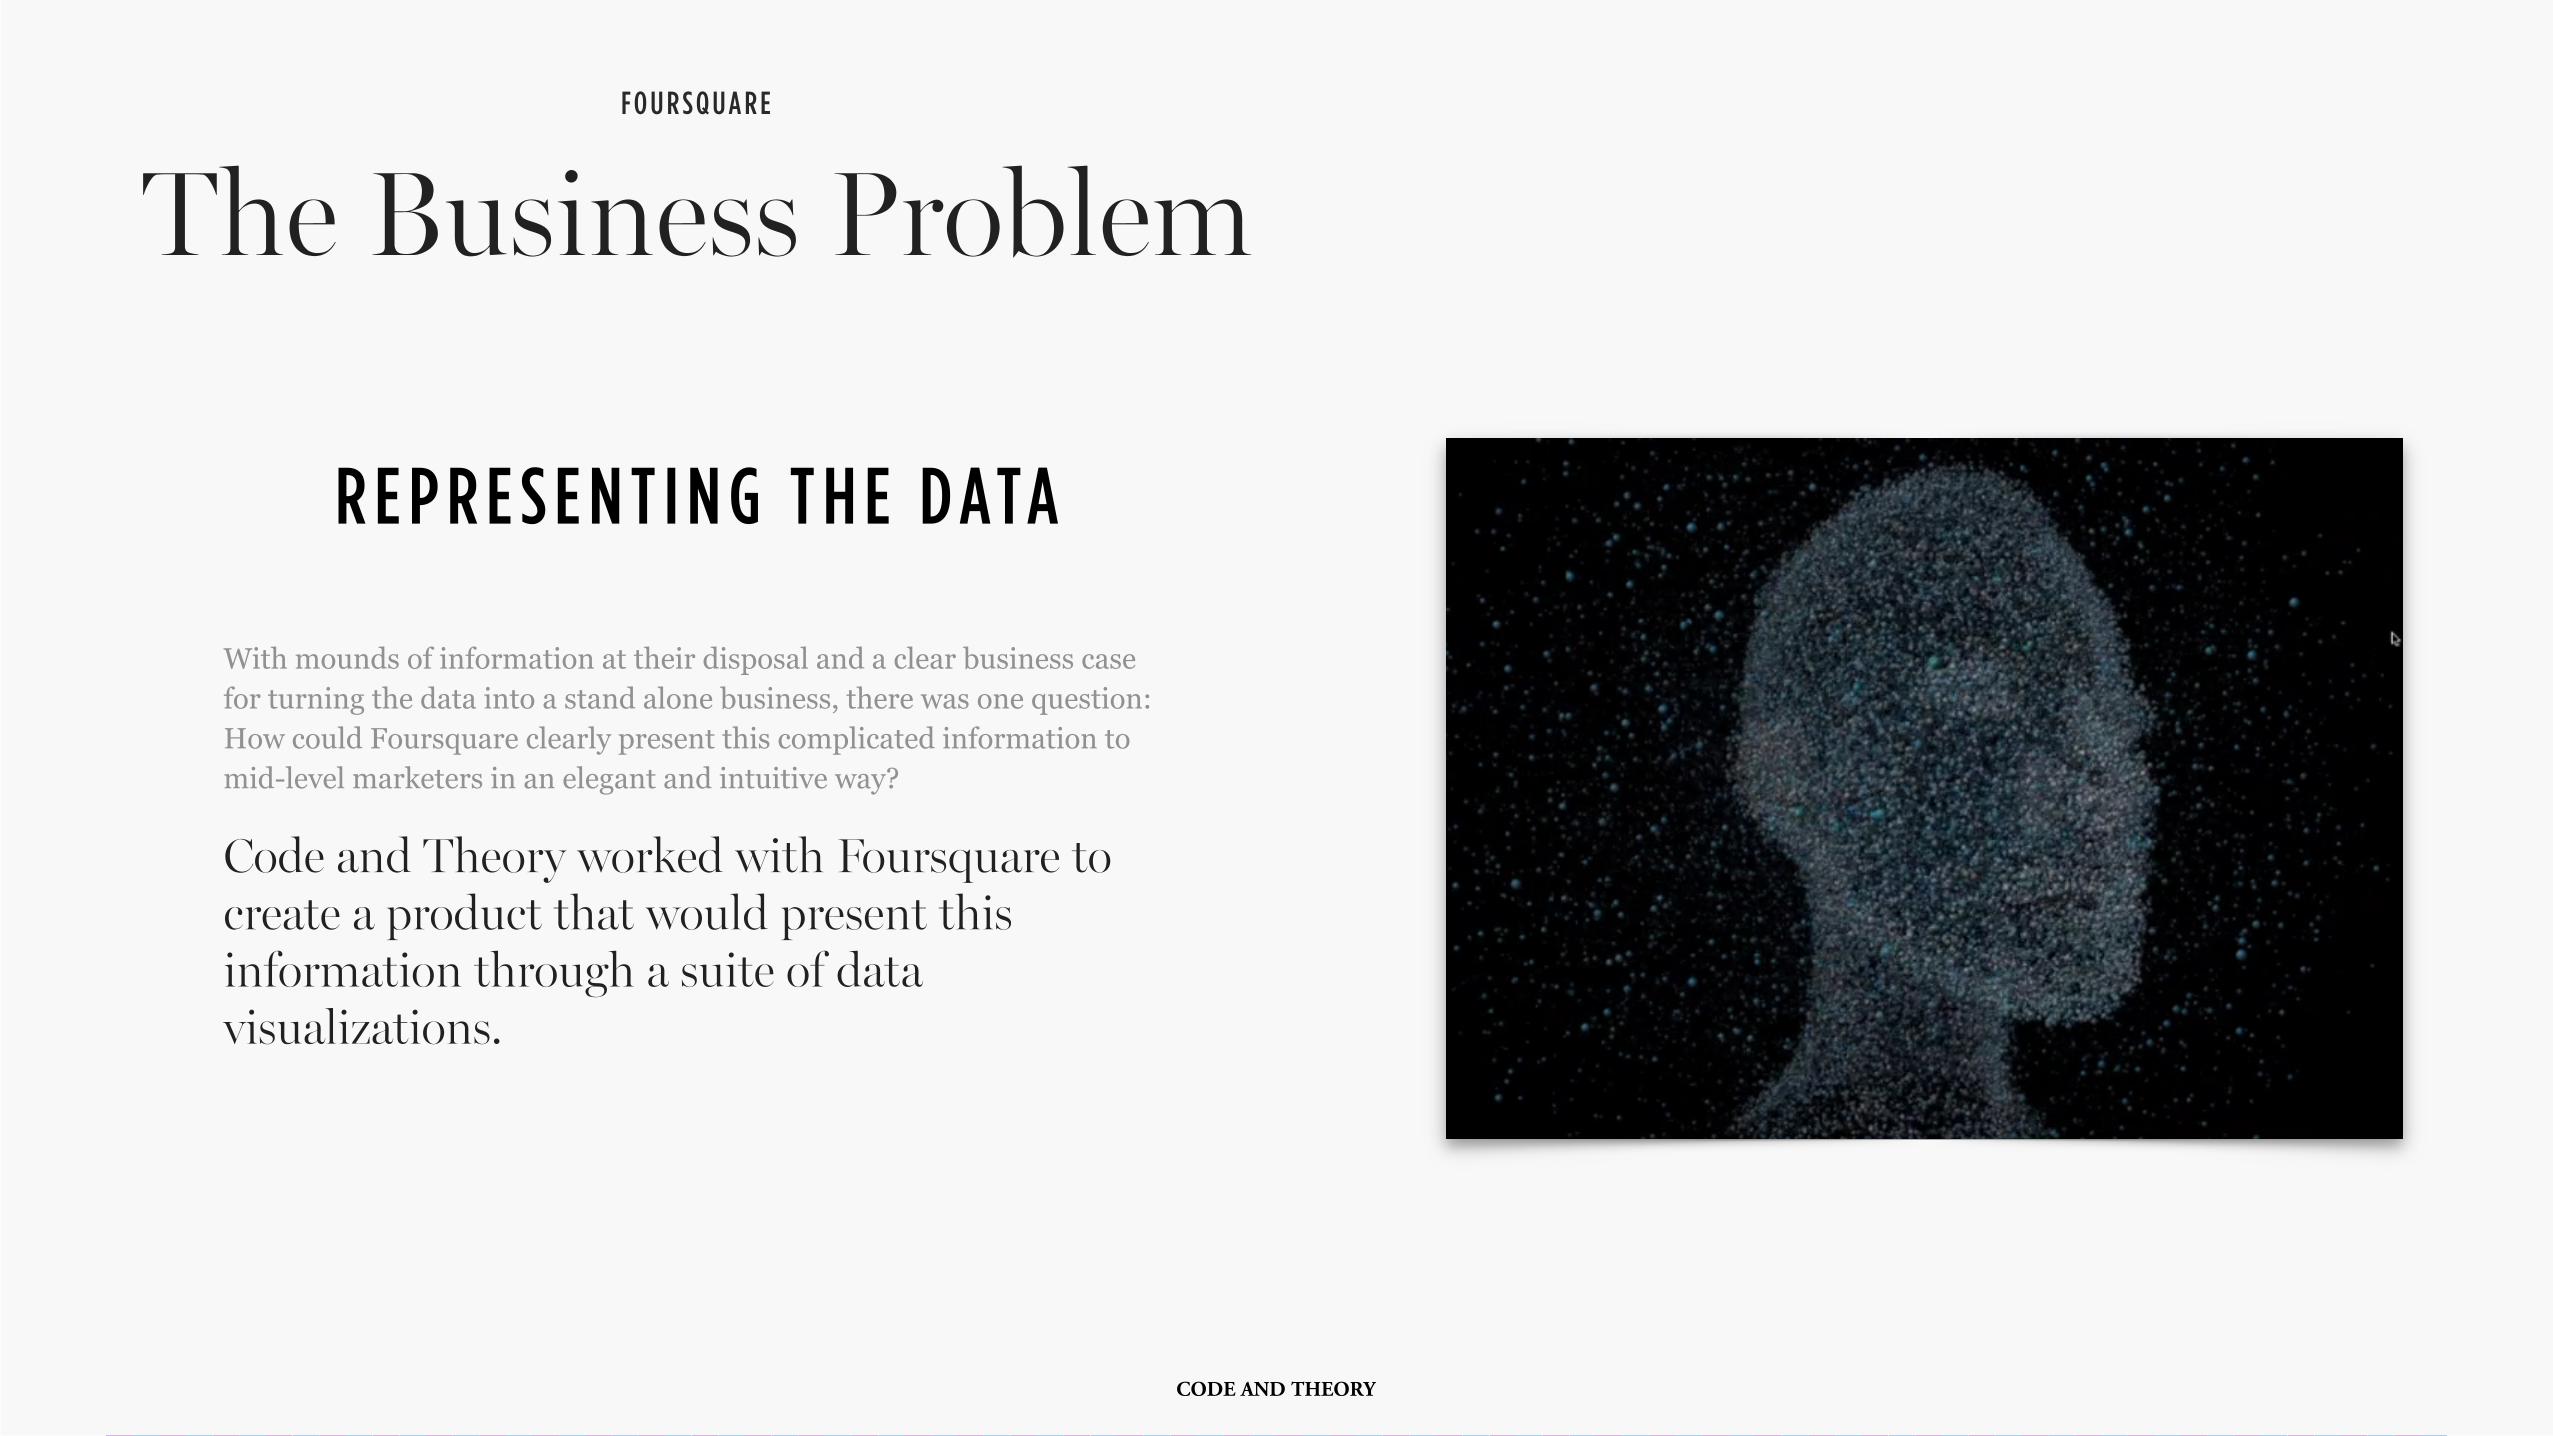
R E P R E S E N T I N G T H E D ATA
With mounds of information at their disposal and a clear business case for turning the data into a stand alone business, there was one question: How could Foursquare clearly present this complicated information to mid-level marketers in an elegant and intuitive way?
Code and Theory worked with Foursquare to create a product that would present this information through a suite of data visualizations.
The Business ProblemF O U R S Q U A R E
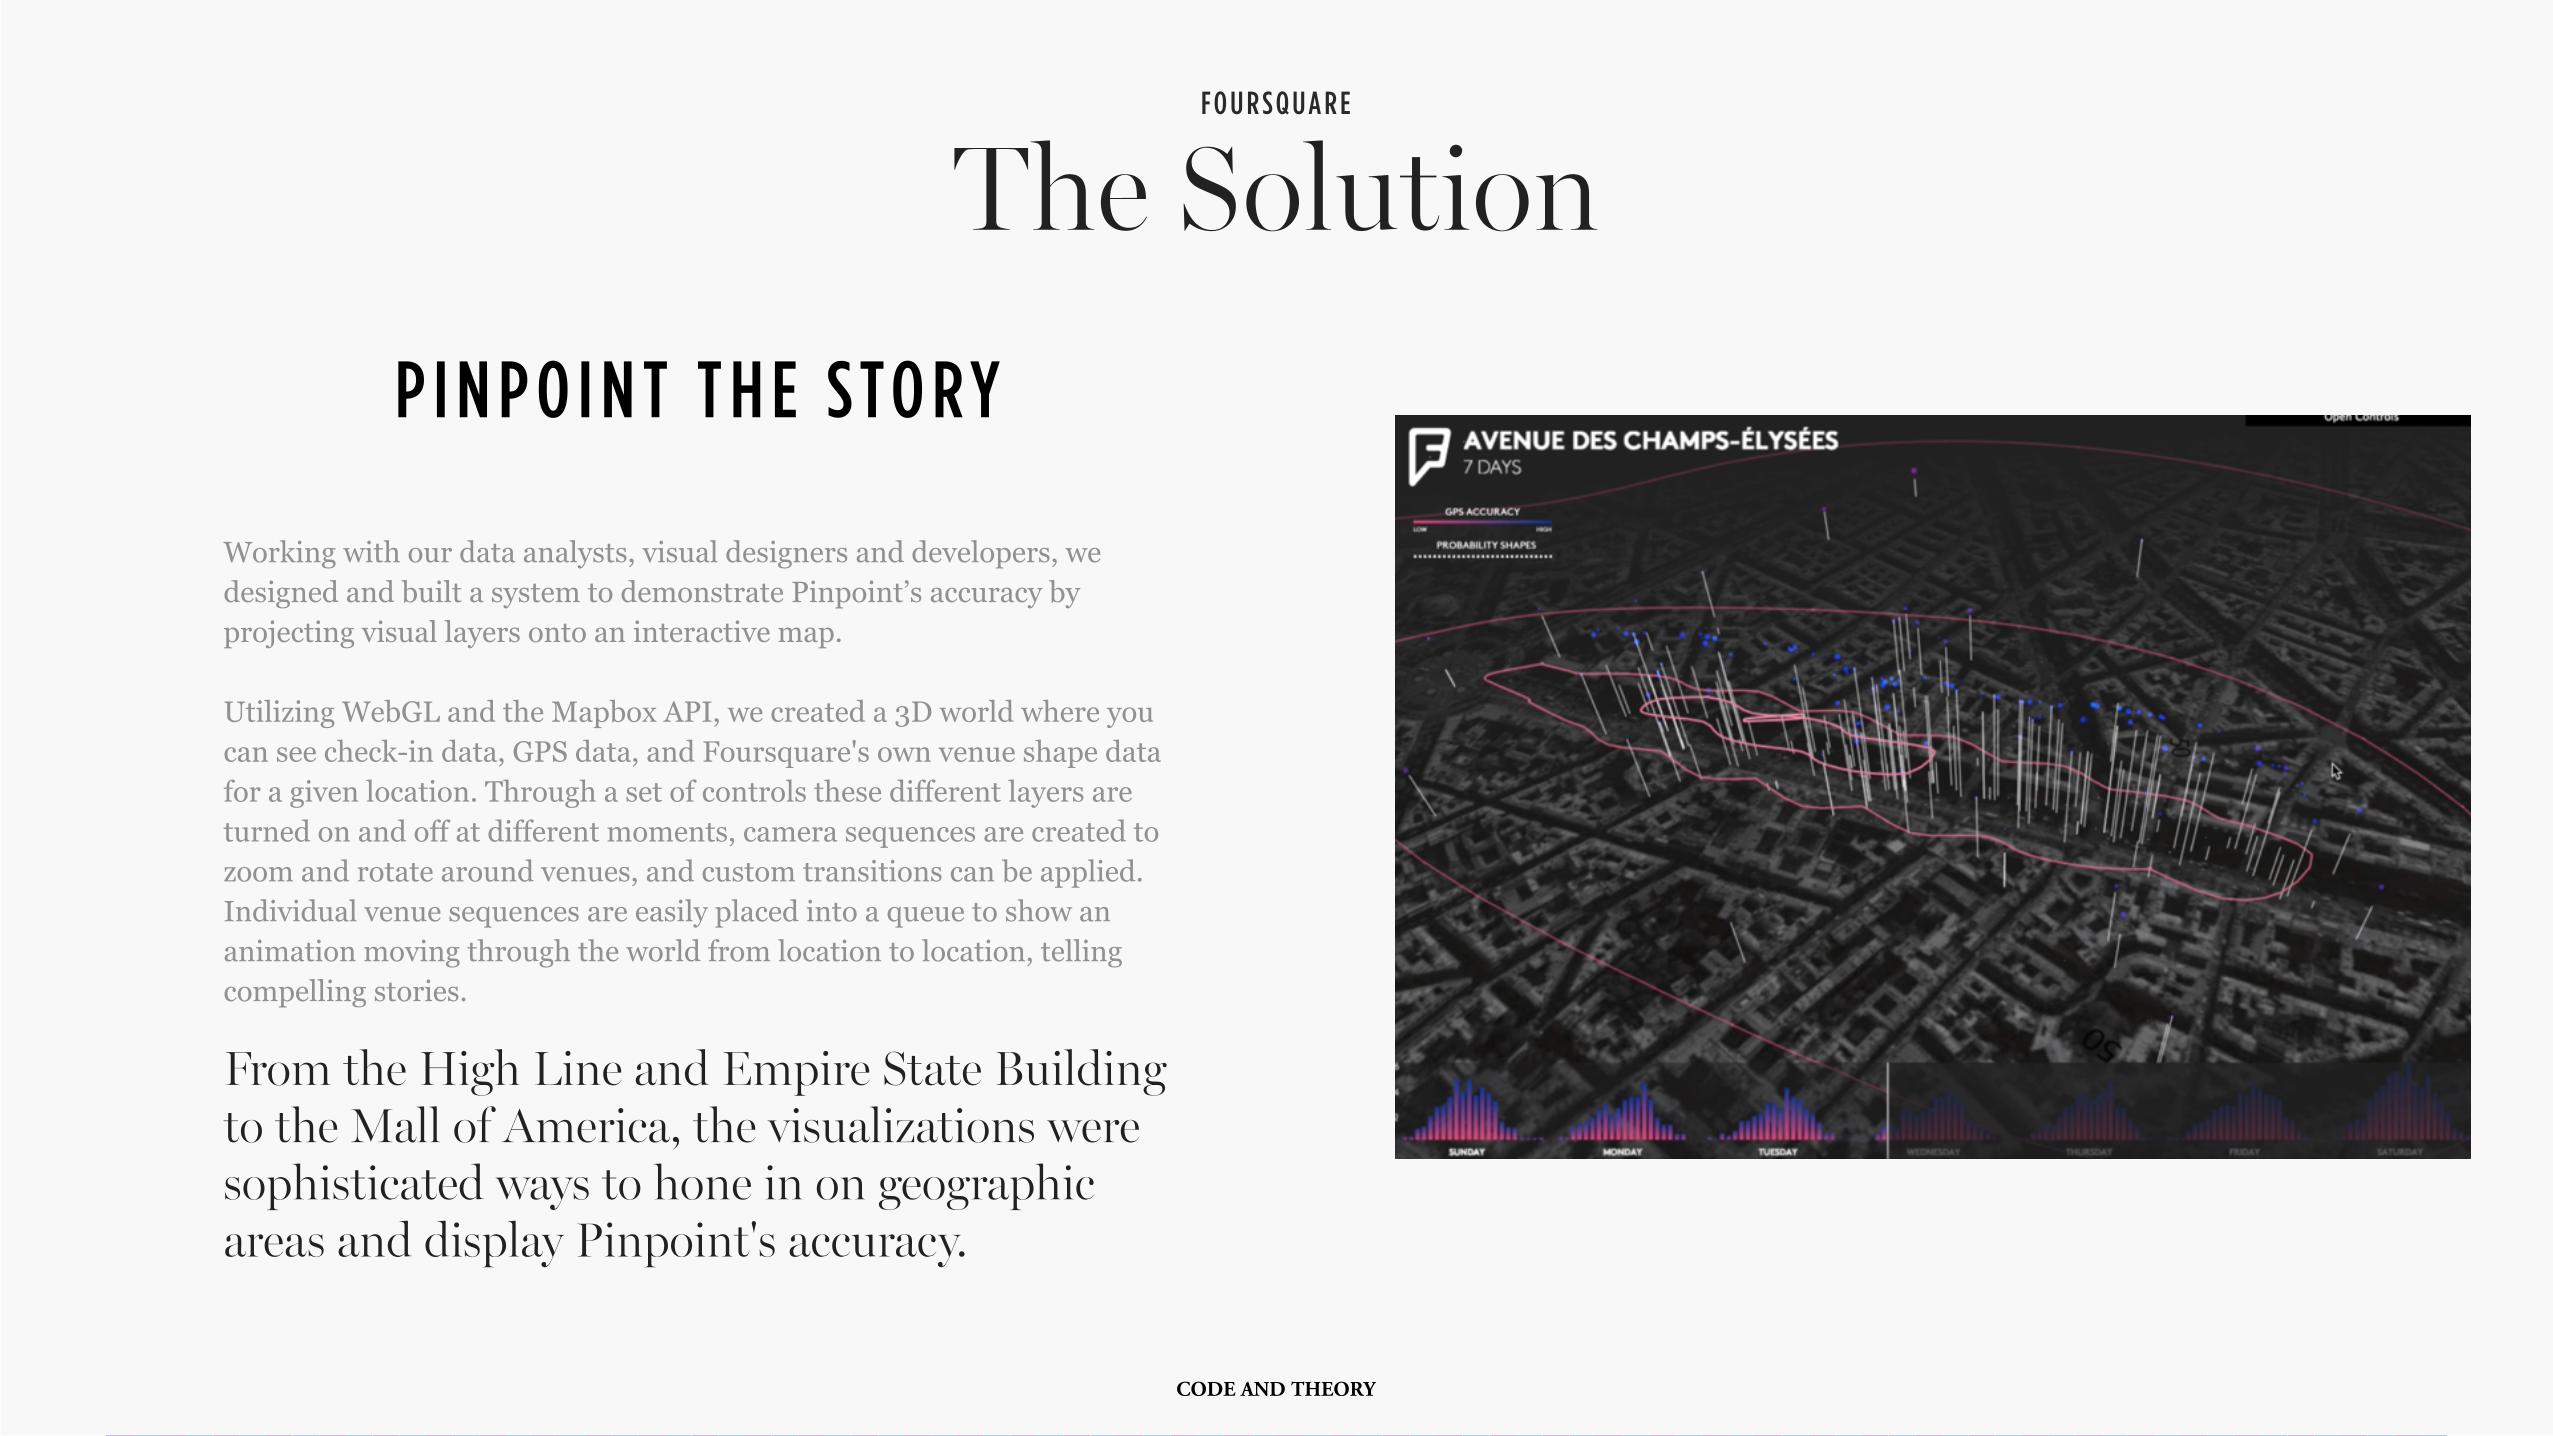
P I N P O I N T T H E S TO R Y
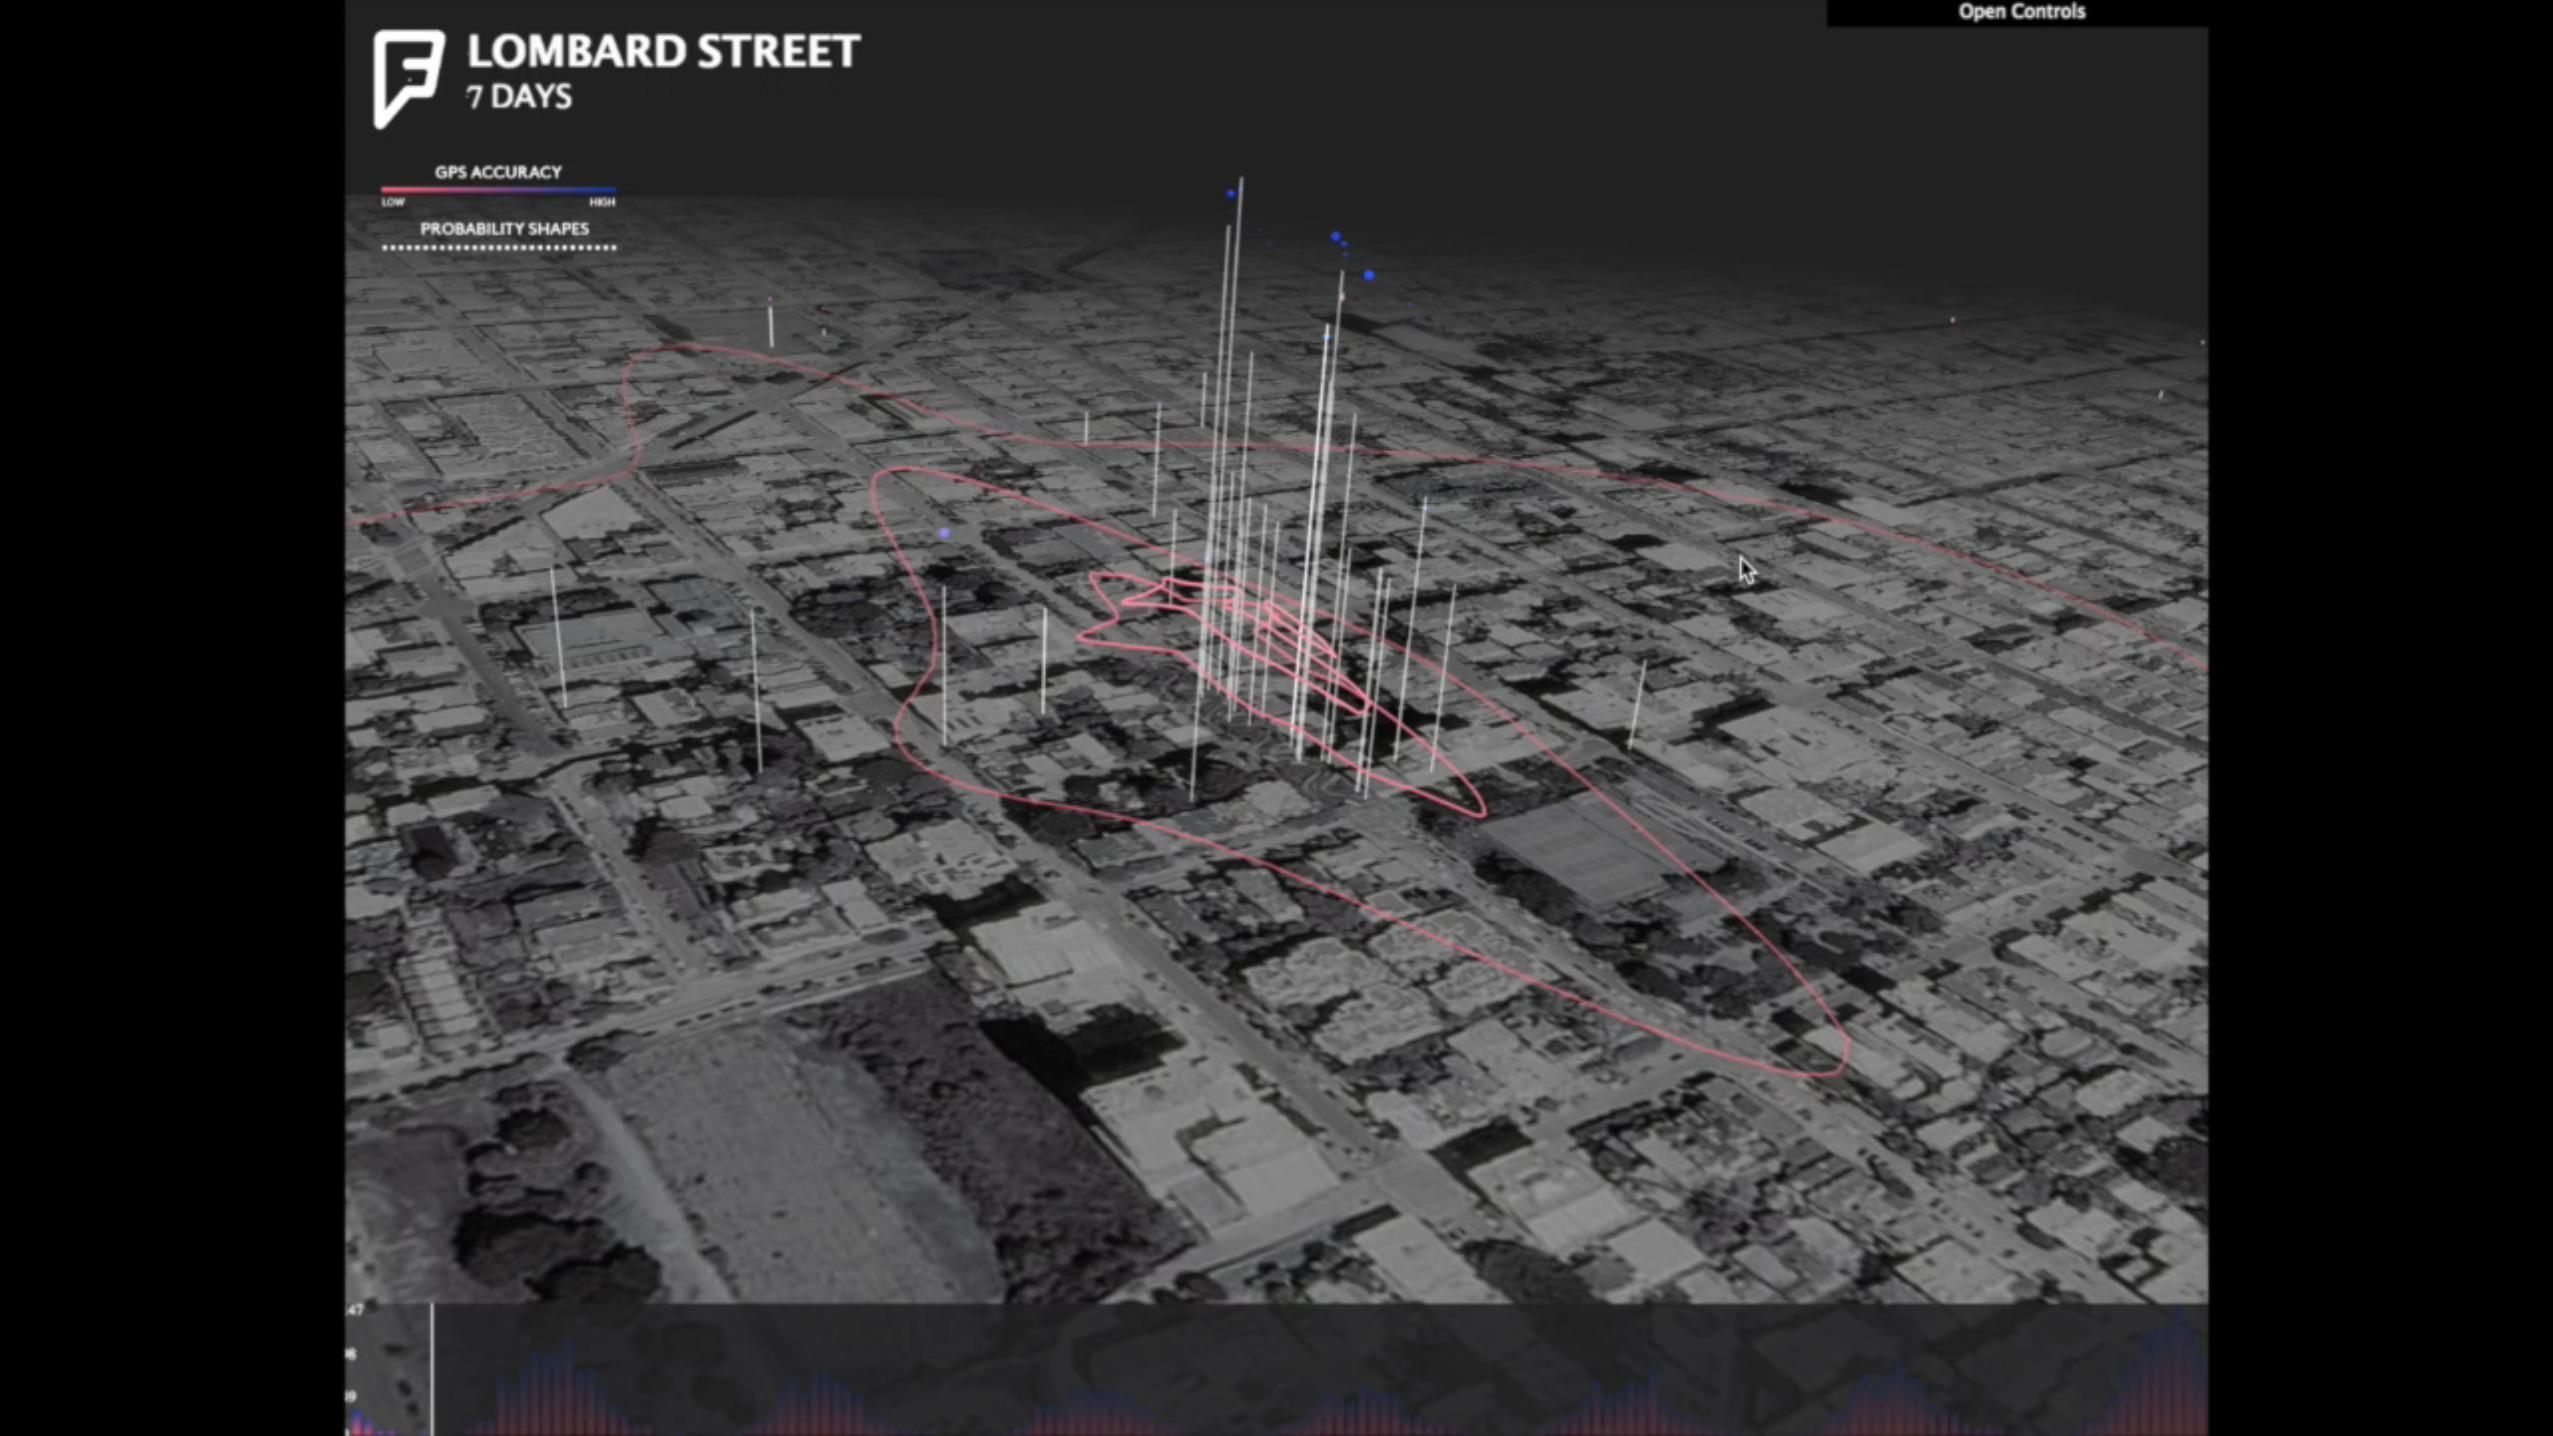
Working with our data analysts, visual designers and developers, we designed and built a system to demonstrate Pinpoint’s accuracy by projecting visual layers onto an interactive map.
Utilizing WebGL and the Mapbox API, we created a 3D world where you can see check-in data, GPS data, and Foursquare's own venue shape data for a given location. Through a set of controls these different layers are turned on and off at different moments, camera sequences are created to zoom and rotate around venues, and custom transitions can be applied. Individual venue sequences are easily placed into a queue to show an animation moving through the world from location to location, telling compelling stories.
From the High Line and Empire State Building to the Mall of America, the visualizations were sophisticated ways to hone in on geographic areas and display Pinpoint's accuracy.
The SolutionF O U R S Q U A R E
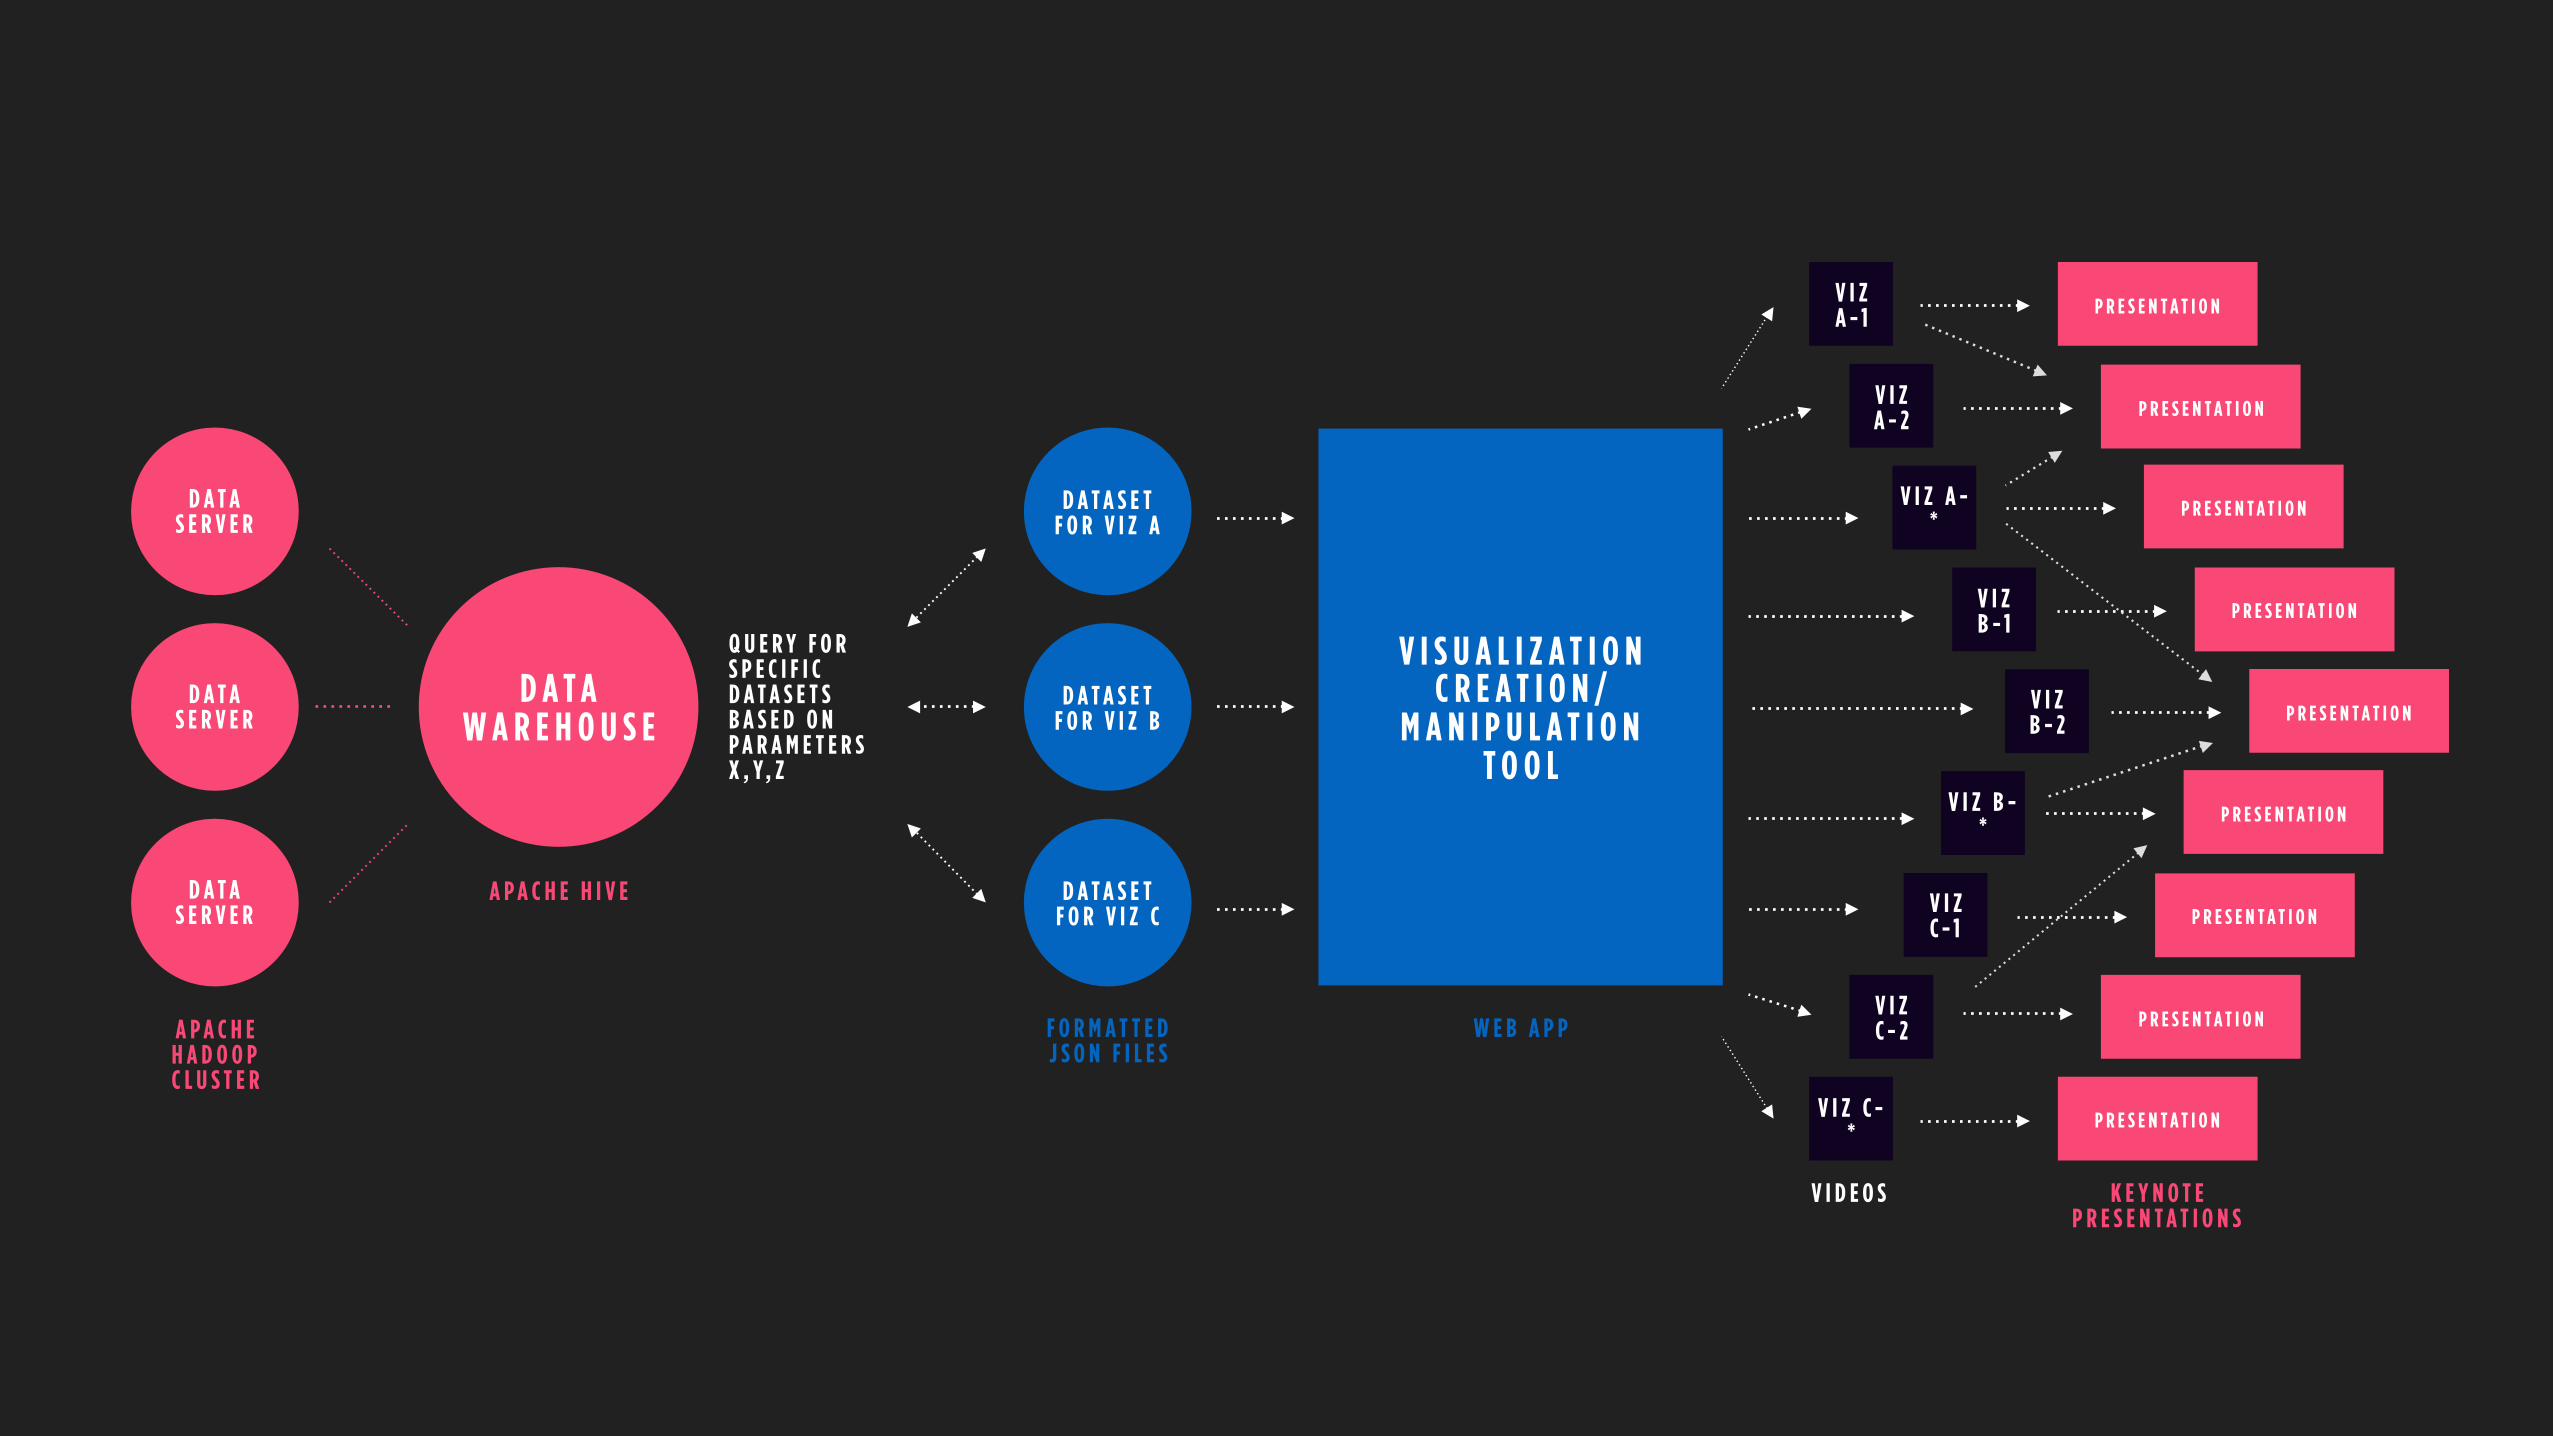
D A T A W A R E H O U S E
D A T A S E R V E R
D A T A S E R V E R
D A T A S E R V E R
A P A C H E H A D O O P C L U S T E R
A P A C H E H I V E
Q U E R Y F O R S P E C I F I C D A T A S E T S B A S E D O N P A R A M E T E R S X , Y , Z
D A T A S E T F O R V I Z A
D A T A S E T F O R V I Z B
D A T A S E T F O R V I Z C
F O R M A T T E D J S O N F I L E S
V I S U A L I Z A T I O N C R E A T I O N /
M A N I P U L A T I O N T O O L
W E B A P P
V I Z A - 1
V I Z A - 2
V I Z A -*
V I Z C - 1
V I Z C - 2
V I Z C -*
V I Z B - 1
V I Z B - 2
V I Z B -*
V I D E O S
P R E S E N T A T I O N
P R E S E N T A T I O N
P R E S E N T A T I O N
P R E S E N T A T I O N
P R E S E N T A T I O N
P R E S E N T A T I O N
P R E S E N T A T I O N
P R E S E N T A T I O N
P R E S E N T A T I O N
K E Y N O T E P R E S E N T A T I O N S
@hollielubbock
Essie
Case study
R E S P O N D I N G TO CO N T E X T
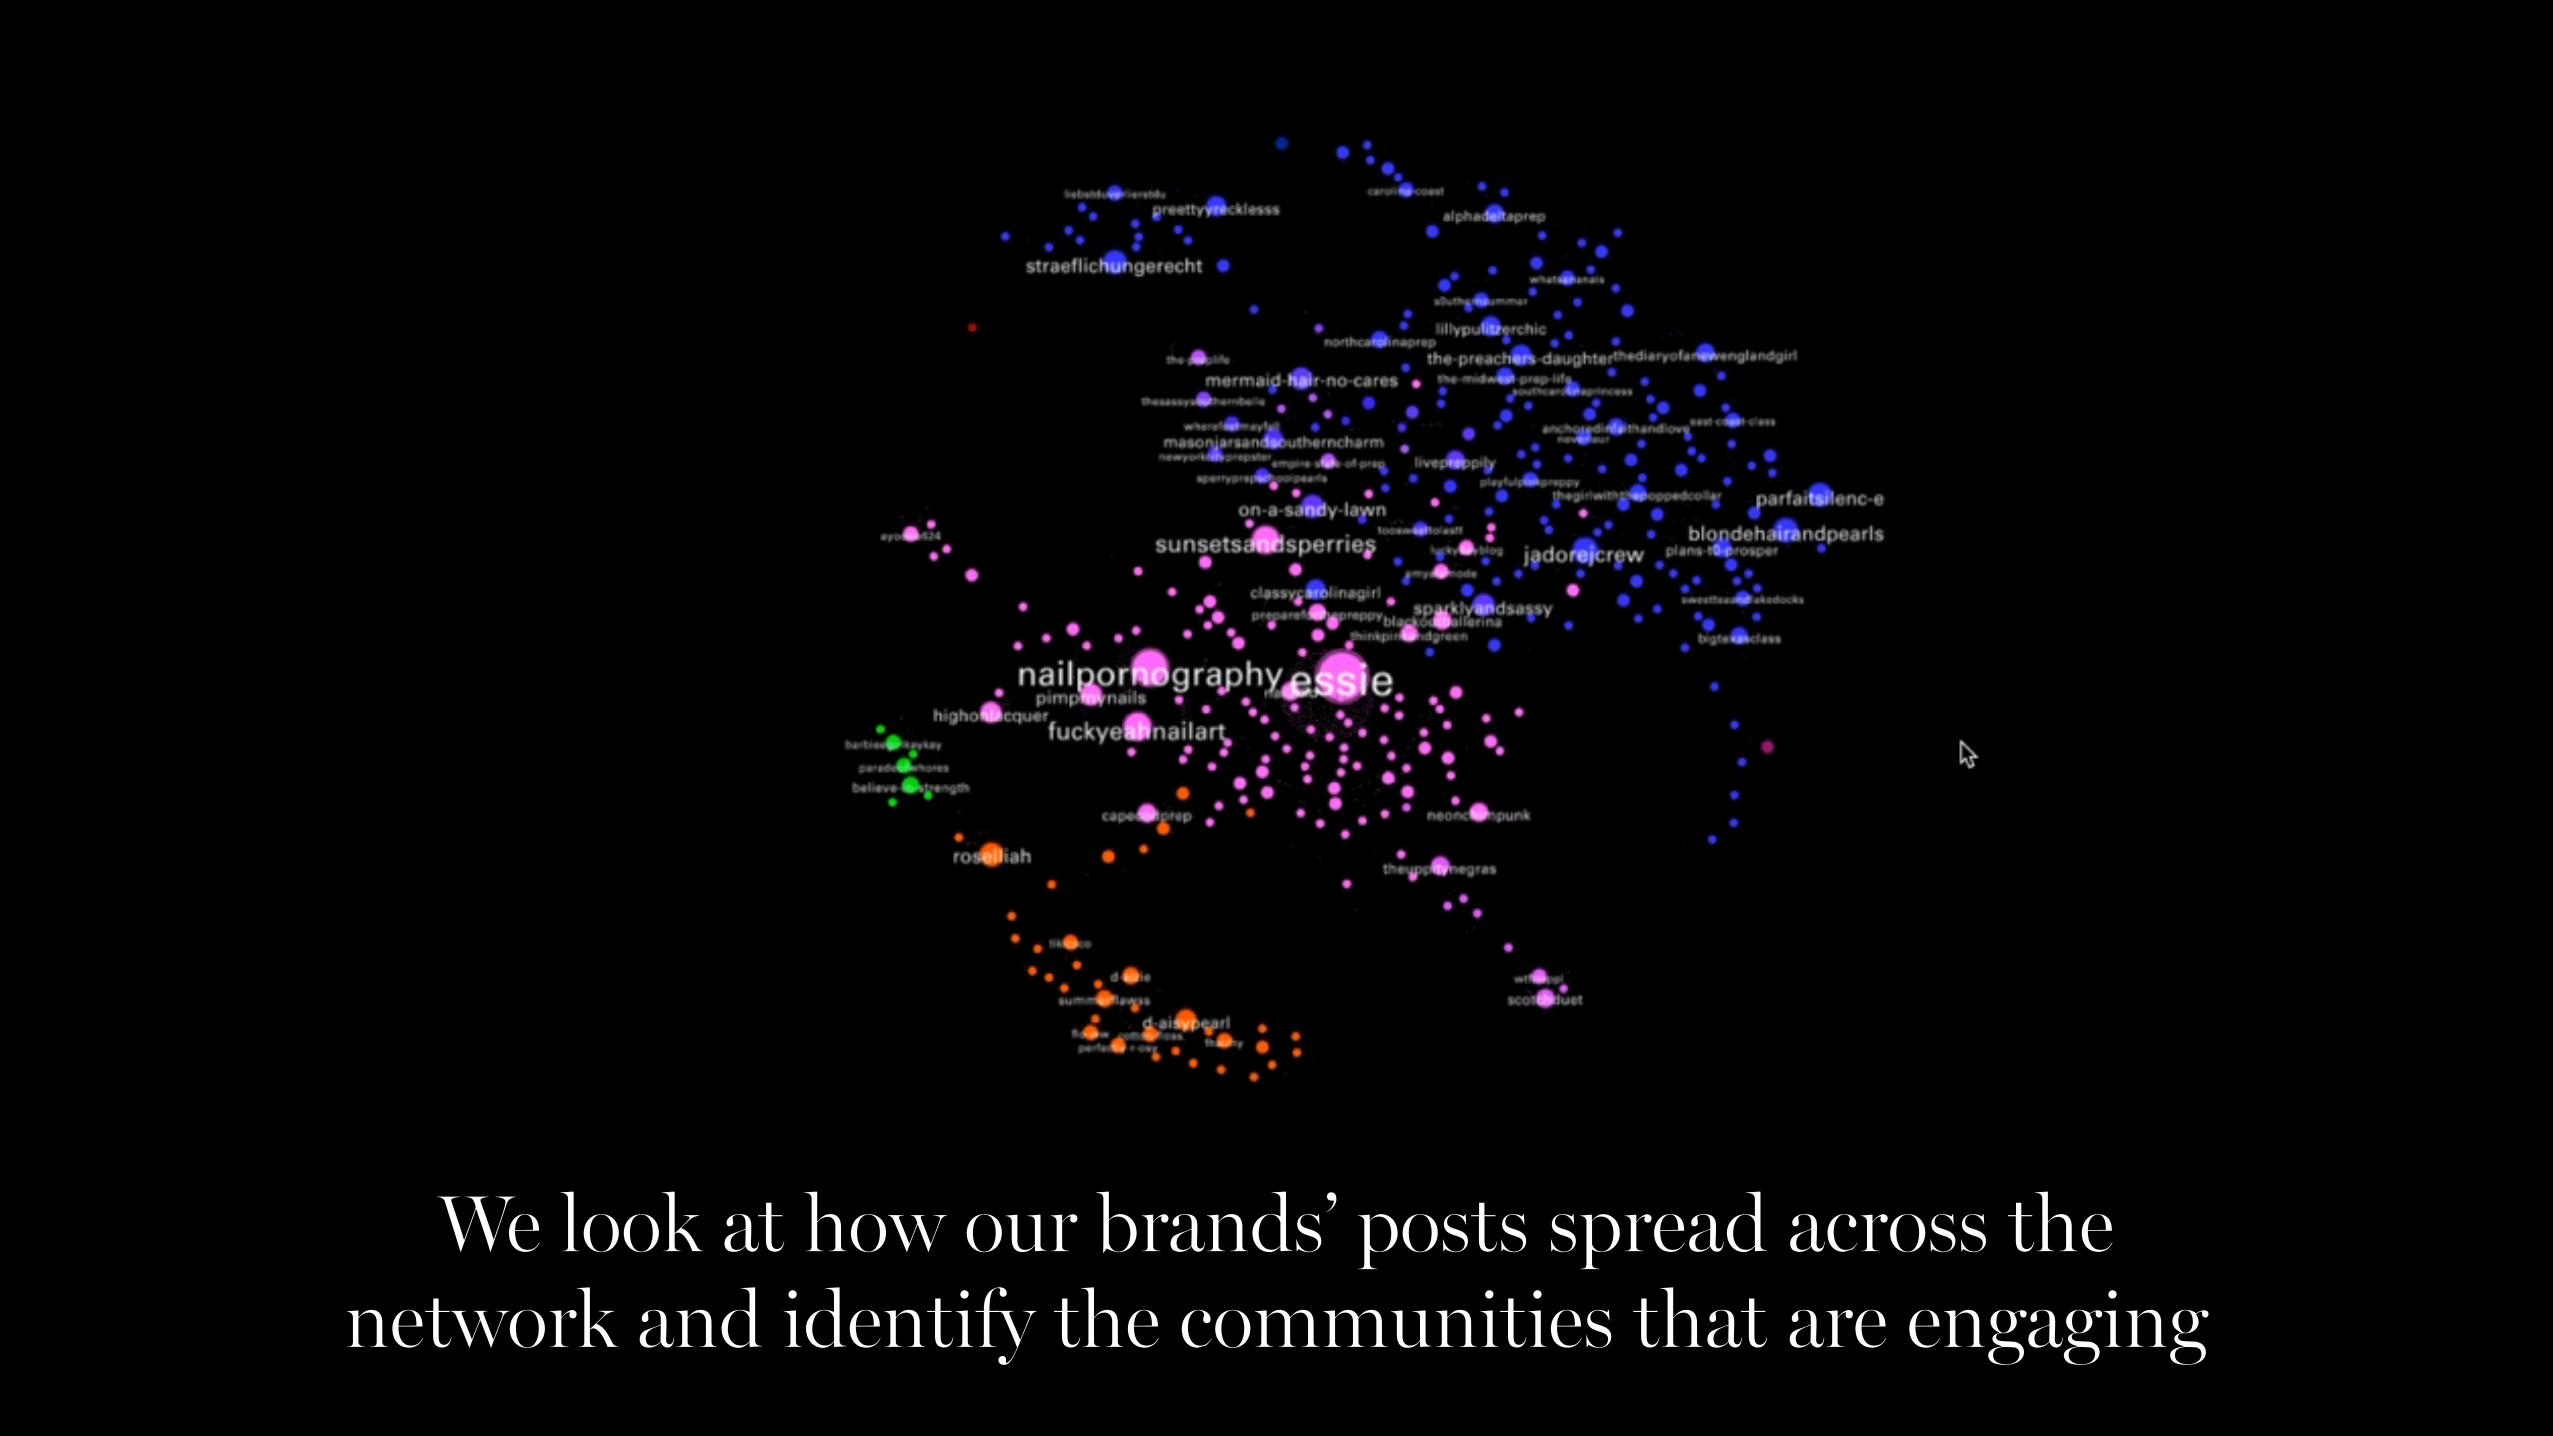
We look at how our brands’ posts spread across the network and identify the communities that are engaging
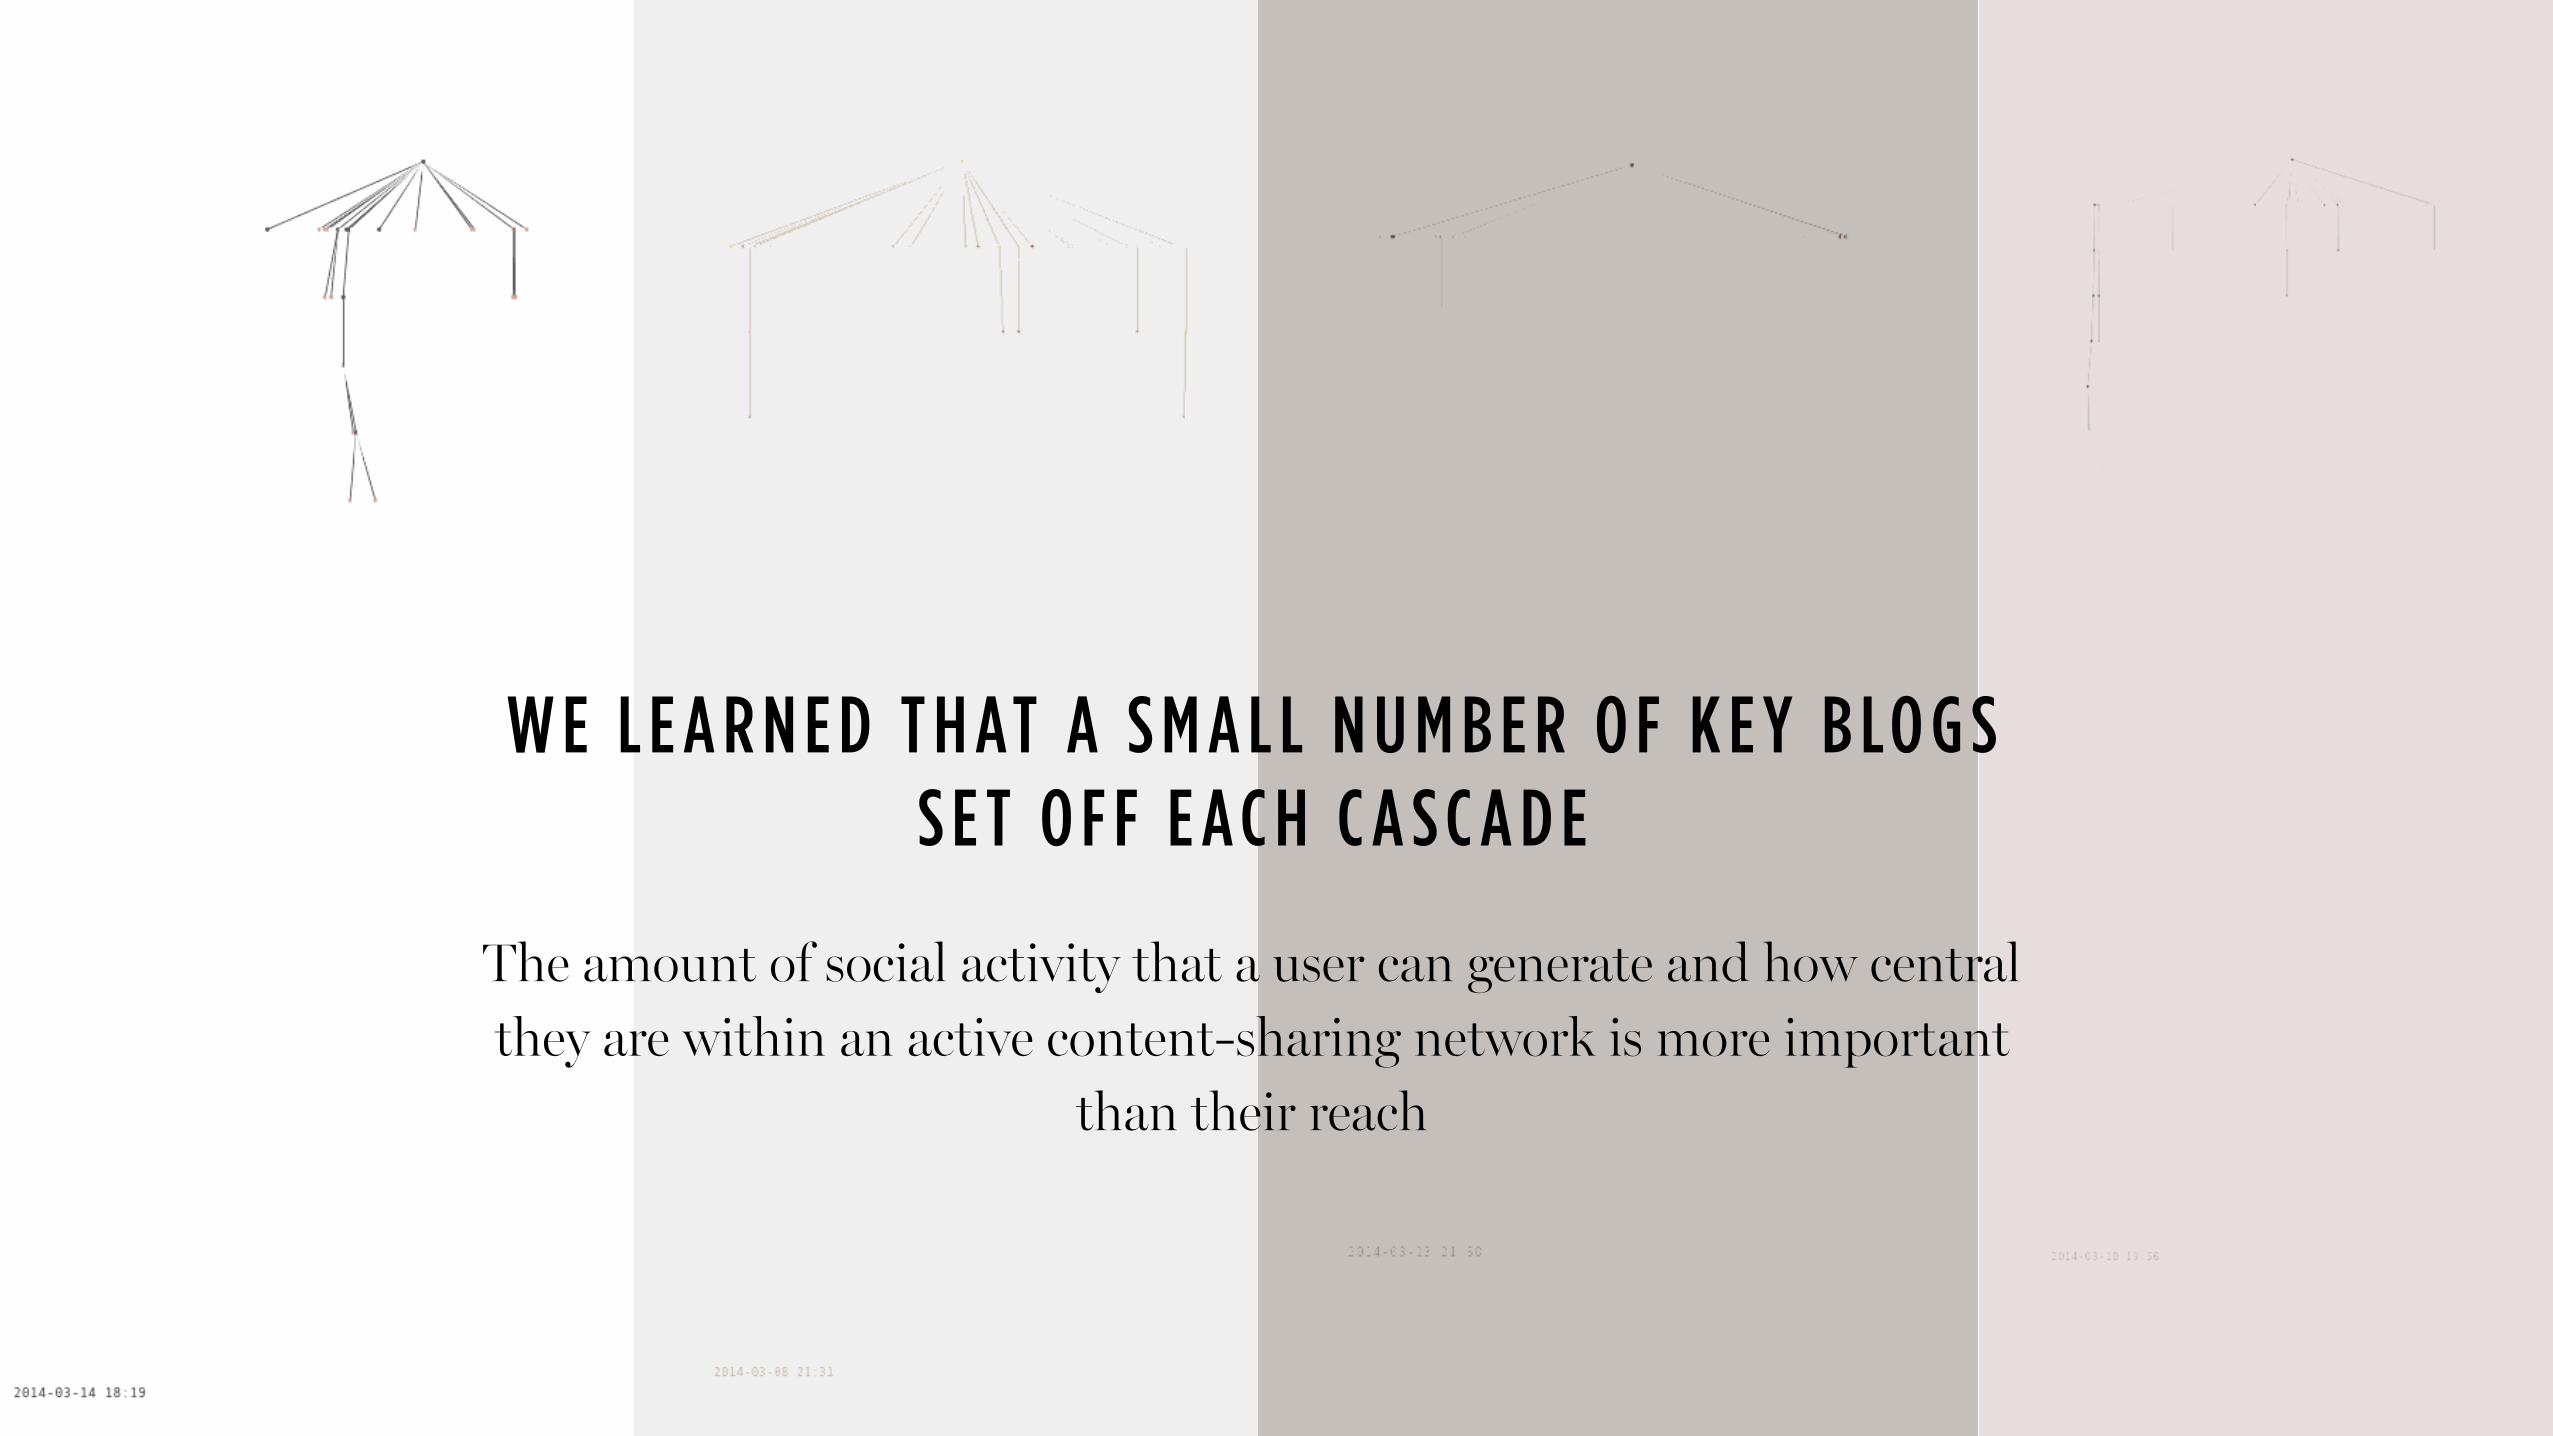
W E L E A R N E D T H AT A S M A L L N U M B E R O F K E Y B LO G S S E T O F F E A C H C A S C A D E
The amount of social activity that a user can generate and how central they are within an active content-sharing network is more important
than their reach
@hollielubbock
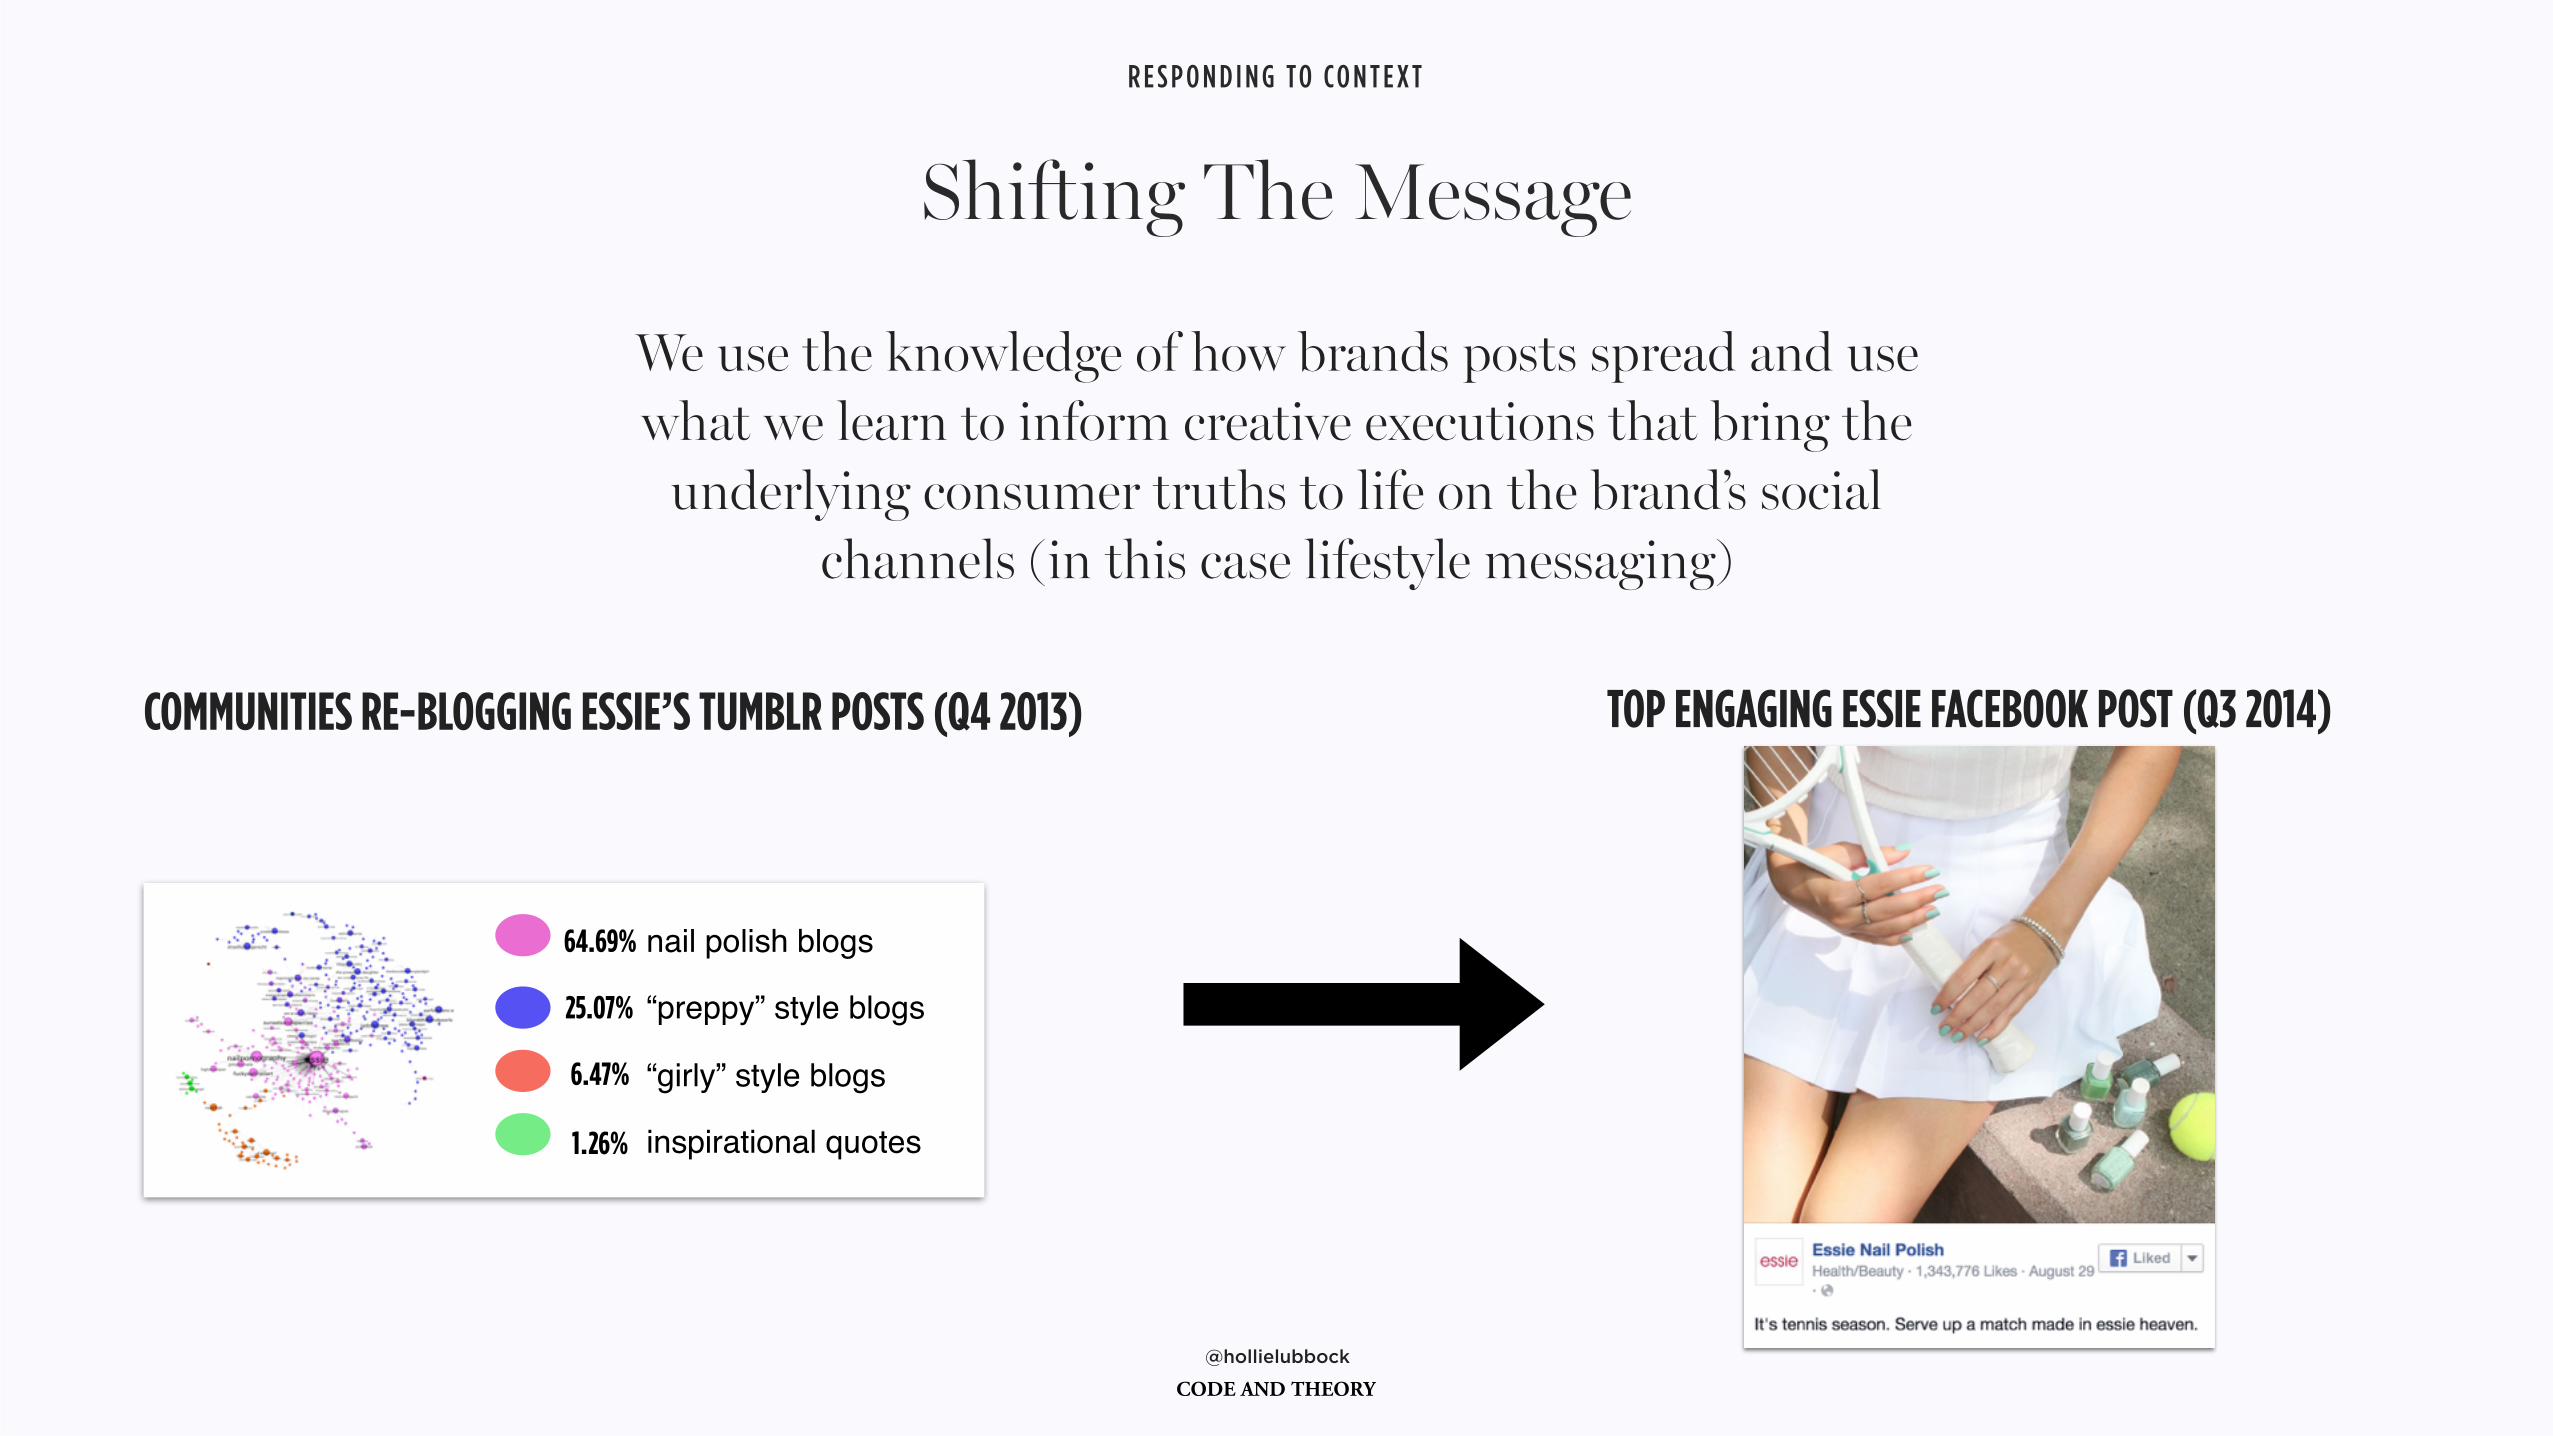
COMMUNITIES RE-BLOGGING ESSIE’S TUMBLR POSTS (Q4 2013)
64.69% nail polish blogs
25.07% “preppy” style blogs
6.47% “girly” style blogs
1.26% inspirational quotes
TOP ENGAGING ESSIE FACEBOOK POST (Q3 2014)
We use the knowledge of how brands posts spread and use what we learn to inform creative executions that bring the
underlying consumer truths to life on the brand’s social channels (in this case lifestyle messaging)
Shifting The Message
R E S P O N D I N G TO CO N T E X T
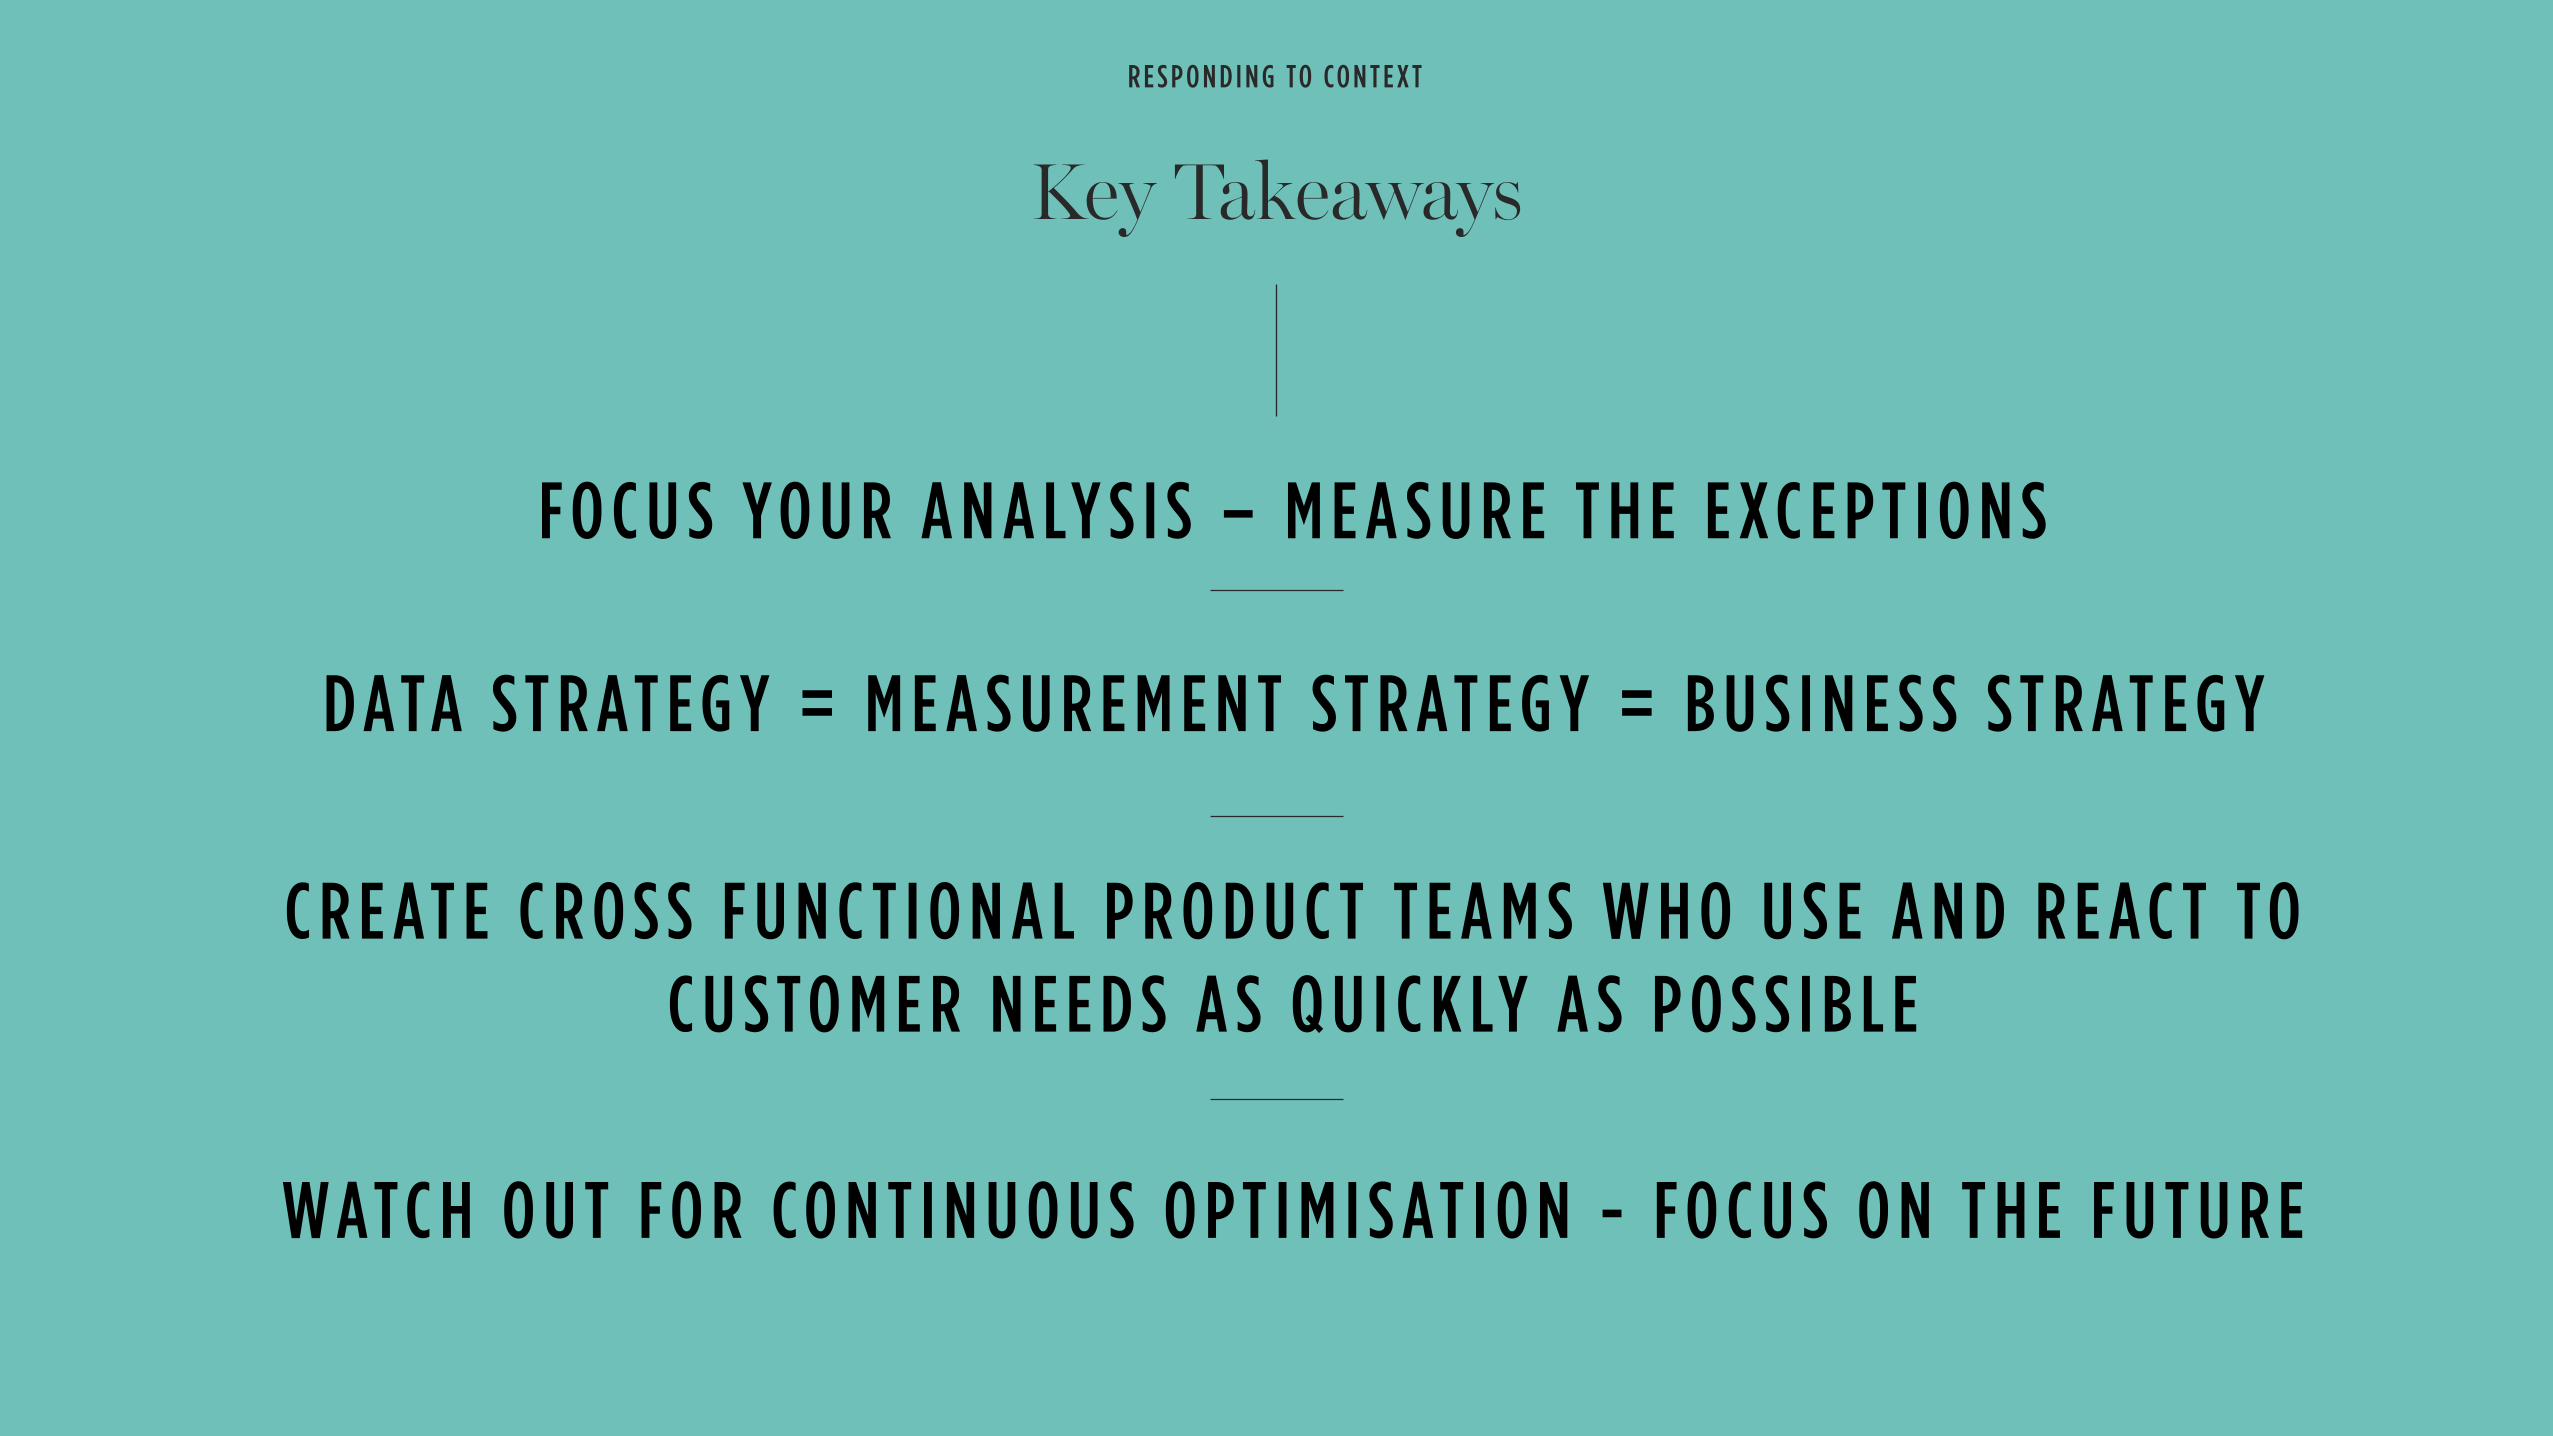
Key Takeaways
F O C U S YO U R A N A LY S I S – M E A S U R E T H E E XC E P T I O N S
D ATA S T R AT E G Y = M E A S U R E M E N T S T R AT E G Y = B U S I N E S S S T R AT E G Y
C R E AT E C R O S S F U N C T I O N A L P R O D U C T T E A M S W H O U S E A N D R E A C T TO C U S TO M E R N E E D S A S Q U I C K LY A S P O S S I B L E
W ATC H O U T F O R CO N T I N U O U S O P T I M I S AT I O N - F O C U S O N T H E F U T U R E
R E S P O N D I N G TO CO N T E X T
Thank you!
@hollielubbock @codeandtheory