Embed Size (px)
Citation preview
Road Accidents In Bangladesh
Prepared by: Tanvir Hasan M 140204565 Nusrat Sharmin M140204568
Jagannath University, Dhaka.
Department of Marketing
Context:
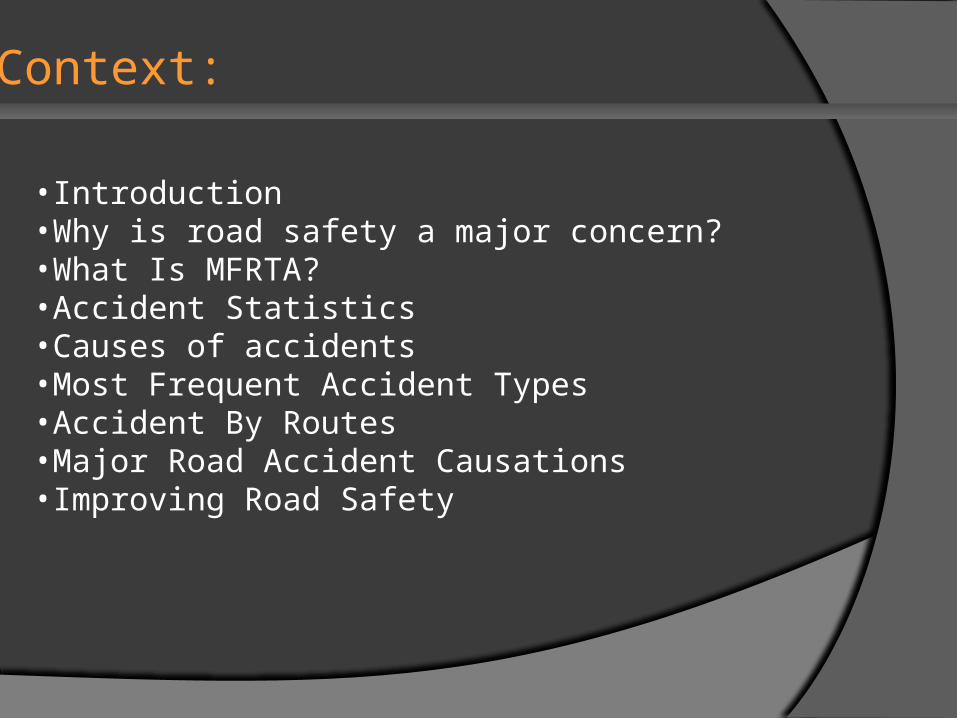
•Introduction•Why is road safety a major concern?•What Is MFRTA?•Accident Statistics•Causes of accidents•Most Frequent Accident Types•Accident By Routes•Major Road Accident Causations•Improving Road Safety
Introduction :
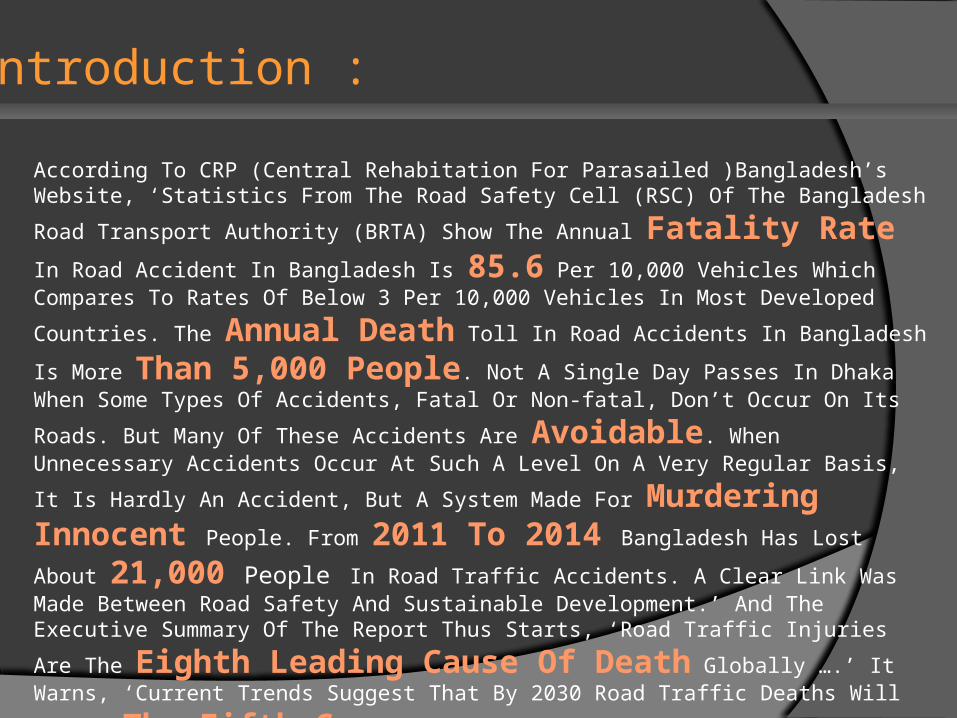
According To CRP (Central Rehabitation For Parasailed )Bangladesh’s Website, ‘Statistics From The Road Safety Cell (RSC) Of The Bangladesh Road Transport
Authority (BRTA) Show The Annual Fatality Rate In Road Accident In
Bangladesh Is 85.6 Per 10,000 Vehicles Which Compares To Rates Of Below 3 Per
10,000 Vehicles In Most Developed Countries. The Annual Death Toll In
Road Accidents In Bangladesh Is More Than 5,000 People. Not A Single Day Passes In Dhaka When Some Types Of Accidents, Fatal Or Non-fatal, Don’t
Occur On Its Roads. But Many Of These Accidents Are Avoidable. When Unnecessary Accidents Occur At Such A Level On A Very Regular Basis, It Is Hardly
An Accident, But A System Made For Murdering Innocent People. From
2011 To 2014 Bangladesh Has Lost About 21,000 People In Road Traffic Accidents. A Clear Link Was Made Between Road Safety And Sustainable Development.’ And The Executive Summary Of The Report Thus Starts, ‘Road Traffic
Injuries Are The Eighth Leading Cause Of Death Globally ….’ It Warns, ‘Current Trends Suggest That By 2030 Road Traffic Deaths Will Become
The Fifth Cause Of Death Unless Urgent Action Is Taken.
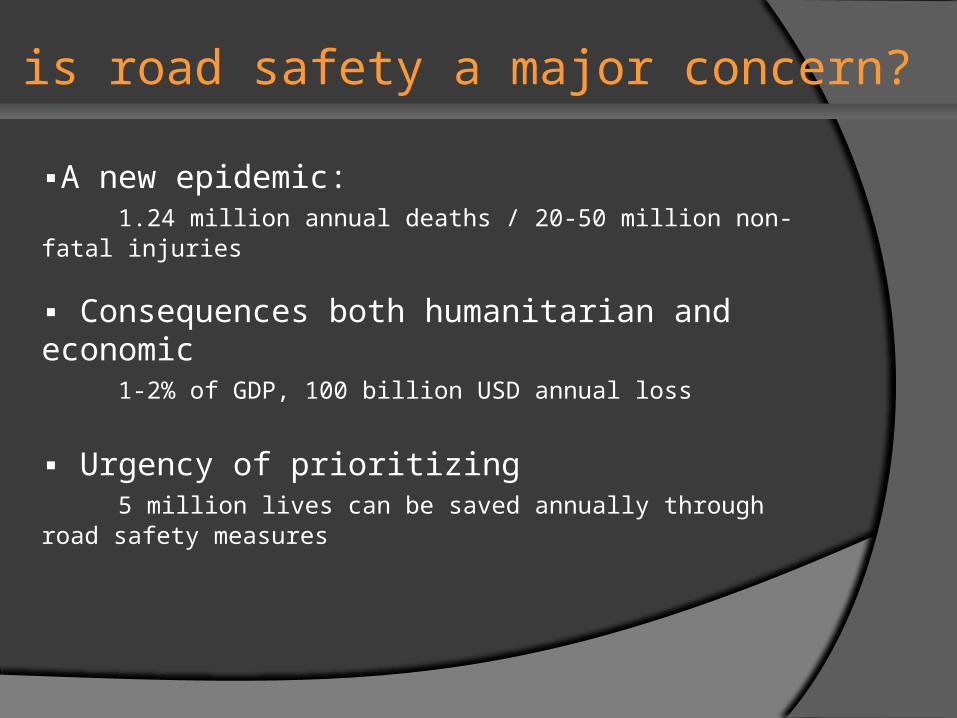
Why is road safety a major concern?
▪A new epidemic: 1.24 million annual deaths / 20-50 million non-fatal injuries
▪ Consequences both humanitarian and economic 1-2% of GDP, 100 billion USD annual loss
▪ Urgency of prioritizing 5 million lives can be saved annually through road safety measures
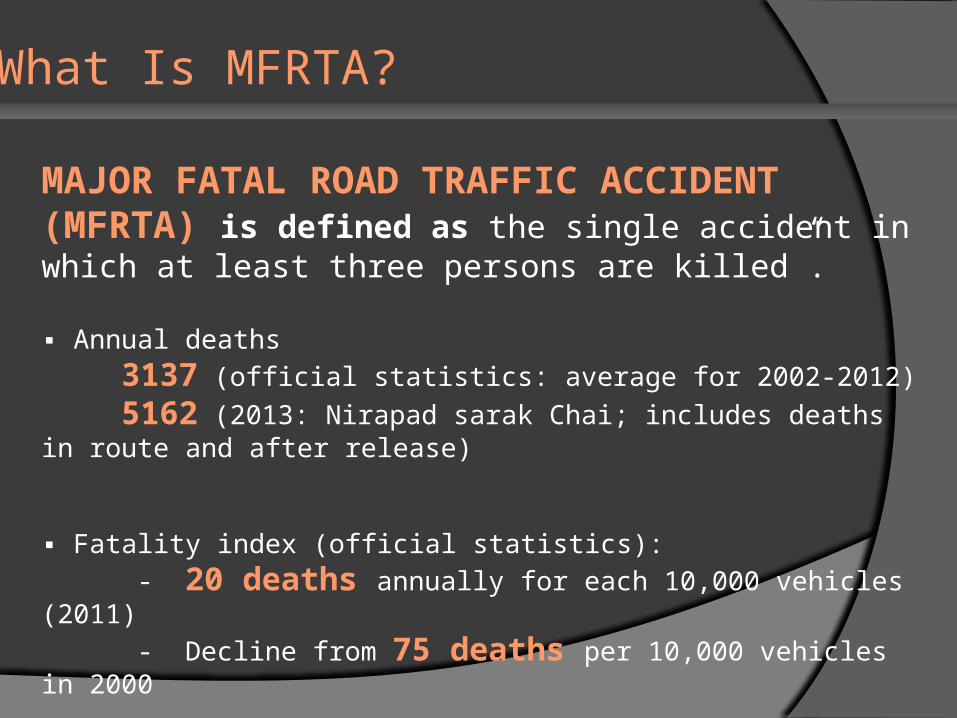
What Is MFRTA?
MAJOR FATAL ROAD TRAFFIC ACCIDENT (MFRTA) is defined as the single accident in which at least three persons are killed”.
▪ Annual deaths 3137 (official statistics: average for 2002-2012) 5162 (2013: Nirapad sarak Chai; includes deaths in route and after release)
▪ Fatality index (official statistics): - 20 deaths annually for each 10,000 vehicles (2011) - Decline from 75 deaths per 10,000 vehicles in 2000
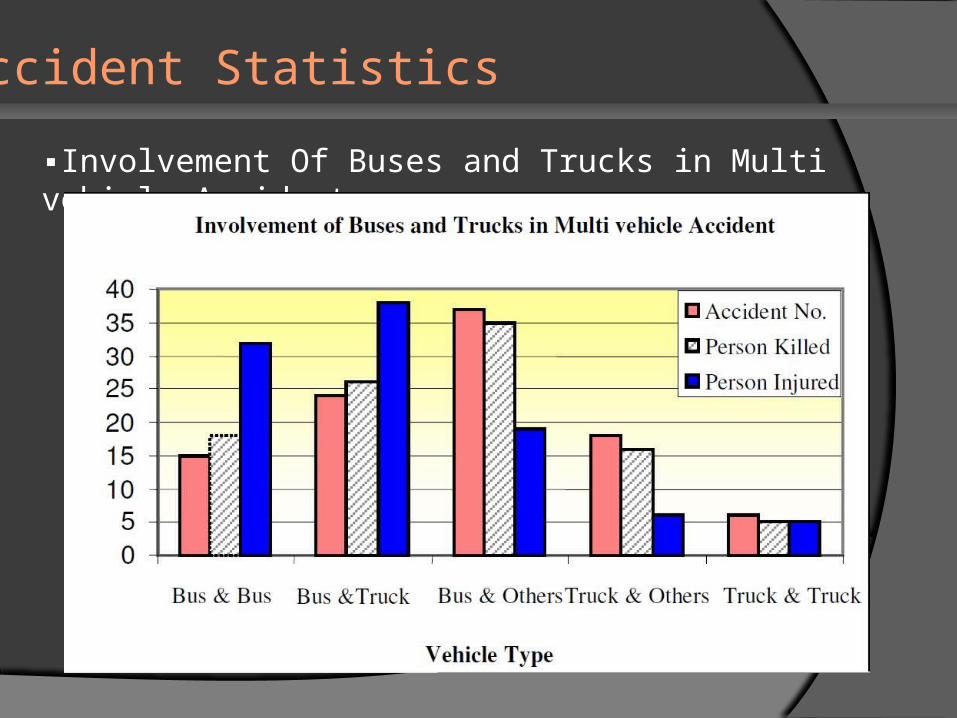
Accident Statistics
▪Involvement Of Buses and Trucks in Multi vehicle Accident
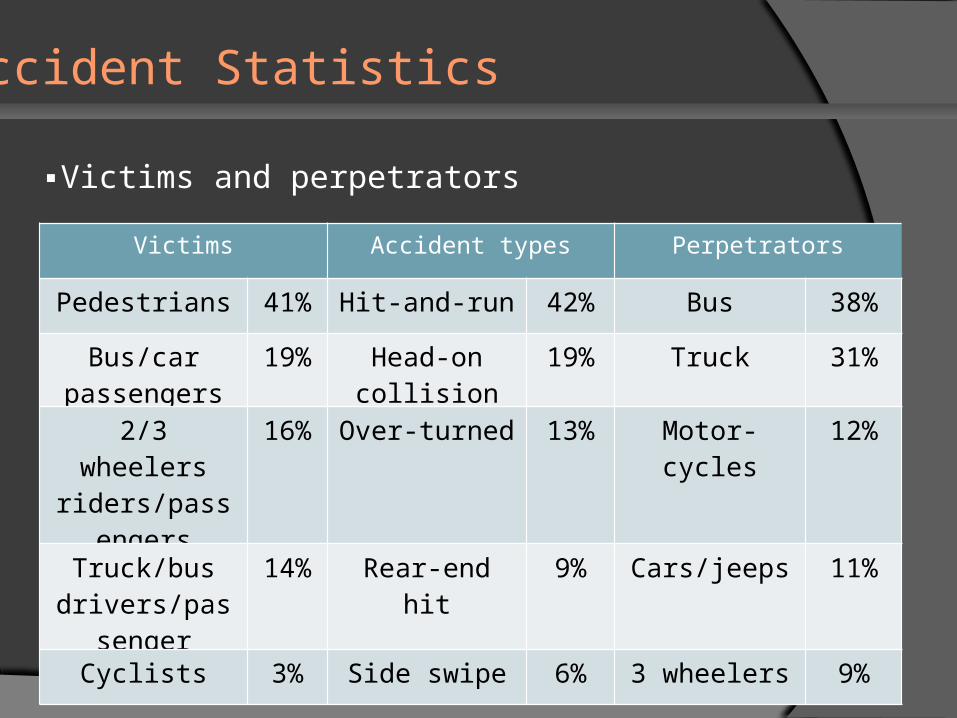
Accident Statistics
▪Victims and perpetrators
Victims Accident types Perpetrators
Pedestrians 41% Hit-and-run 42% Bus 38%
Bus/car passengers
19% Head-on collision
19% Truck 31%
2/3 wheelers riders/passen
gers
16% Over-turned 13% Motor-cycles 12%
Truck/bus drivers/passe
nger
14% Rear-end hit 9% Cars/jeeps 11%
Cyclists 3% Side swipe 6% 3 wheelers 9%
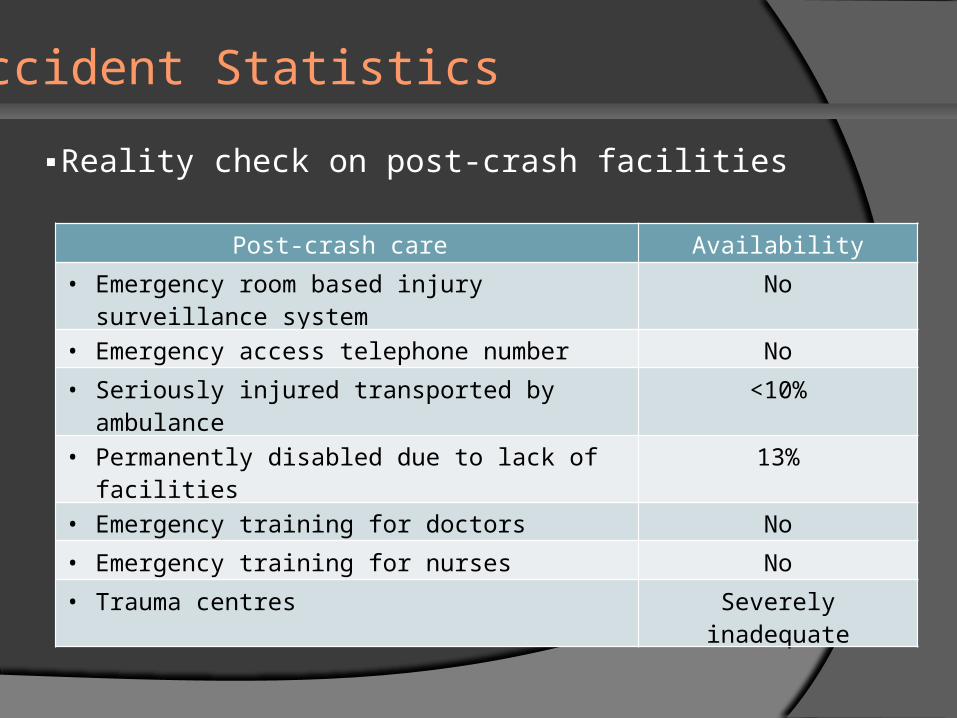
Accident Statistics
▪Reality check on post-crash facilities
Post-crash care Availability
• Emergency room based injury surveillance system No
• Emergency access telephone number No
• Seriously injured transported by ambulance <10%
• Permanently disabled due to lack of facilities 13%
• Emergency training for doctors No
• Emergency training for nurses No
• Trauma centres Severely inadequate
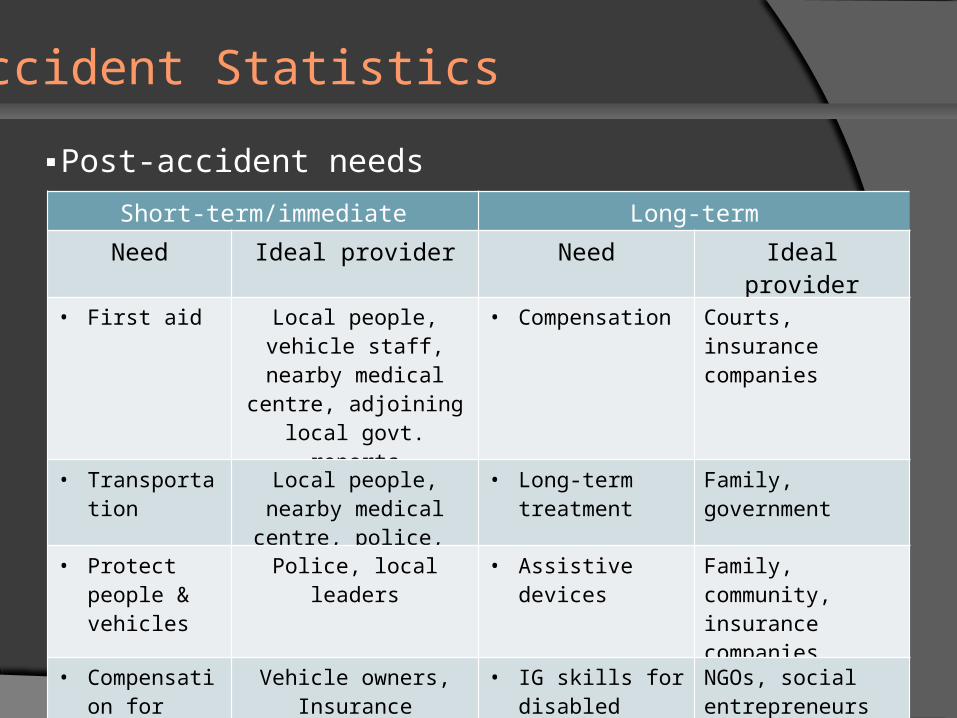
Accident Statistics
▪Post-accident needsShort-term/immediate Long-term
Need Ideal provider Need Ideal provider
• First aid Local people, vehicle staff, nearby medical
centre, adjoining local govt. reports
• Compensation Courts, insurance companies
• Transportation
Local people, nearby medical centre,
police,
• Long-term treatment
Family, government
• Protect people & vehicles
Police, local leaders • Assistive devices
Family, community, insurance companies
• Compensation for victim
Vehicle owners, Insurance companies
• IG skills for disabled
NGOs, social entrepreneurs
• Employment for alternative family member
Government, community
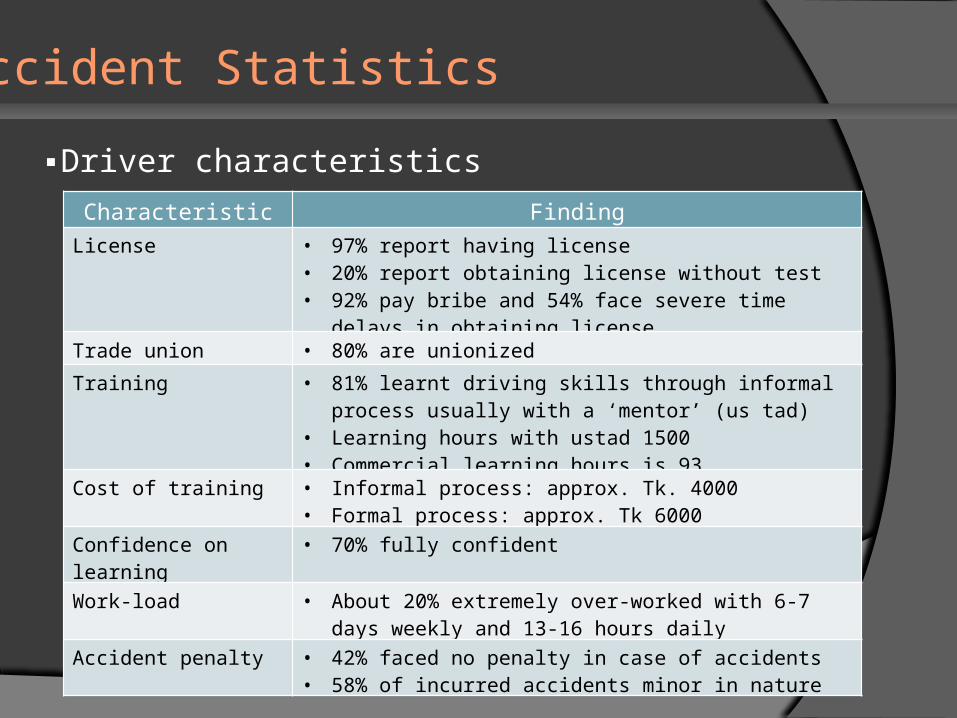
Accident Statistics
▪Driver characteristicsCharacteristic Finding
License • 97% report having license• 20% report obtaining license without test• 92% pay bribe and 54% face severe time delays in
obtaining license
Trade union • 80% are unionized
Training • 81% learnt driving skills through informal process usually with a ‘mentor’ (us tad)
• Learning hours with ustad 1500• Commercial learning hours is 93
Cost of training • Informal process: approx. Tk. 4000• Formal process: approx. Tk 6000
Confidence on learning
• 70% fully confident
Work-load • About 20% extremely over-worked with 6-7 days weekly and 13-16 hours daily
Accident penalty • 42% faced no penalty in case of accidents• 58% of incurred accidents minor in nature
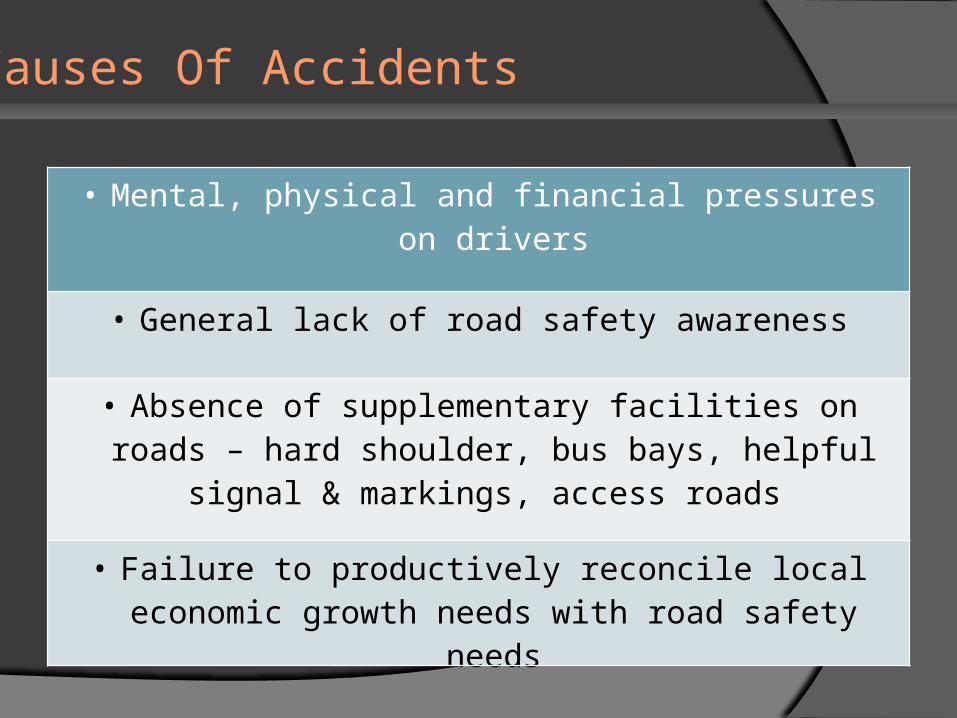
Causes Of Accidents
• Mental, physical and financial pressures on drivers
• General lack of road safety awareness
• Absence of supplementary facilities on roads – hard shoulder, bus bays, helpful signal &
markings, access roads
• Failure to productively reconcile local economic growth needs with road safety needs
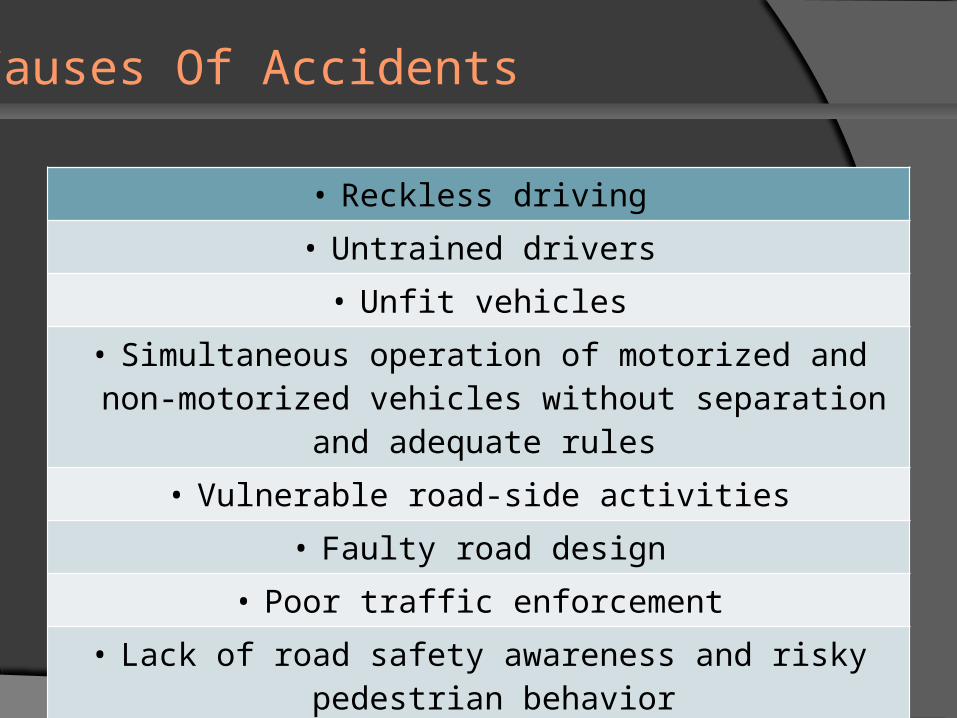
• Reckless driving
• Untrained drivers
• Unfit vehicles
• Simultaneous operation of motorized and non-motorized vehicles without separation and
adequate rules
• Vulnerable road-side activities
• Faulty road design
• Poor traffic enforcement
• Lack of road safety awareness and risky pedestrian behavior
• Culture of impunity and poor legal redress
Causes Of Accidents
•Most Frequent Accident Types
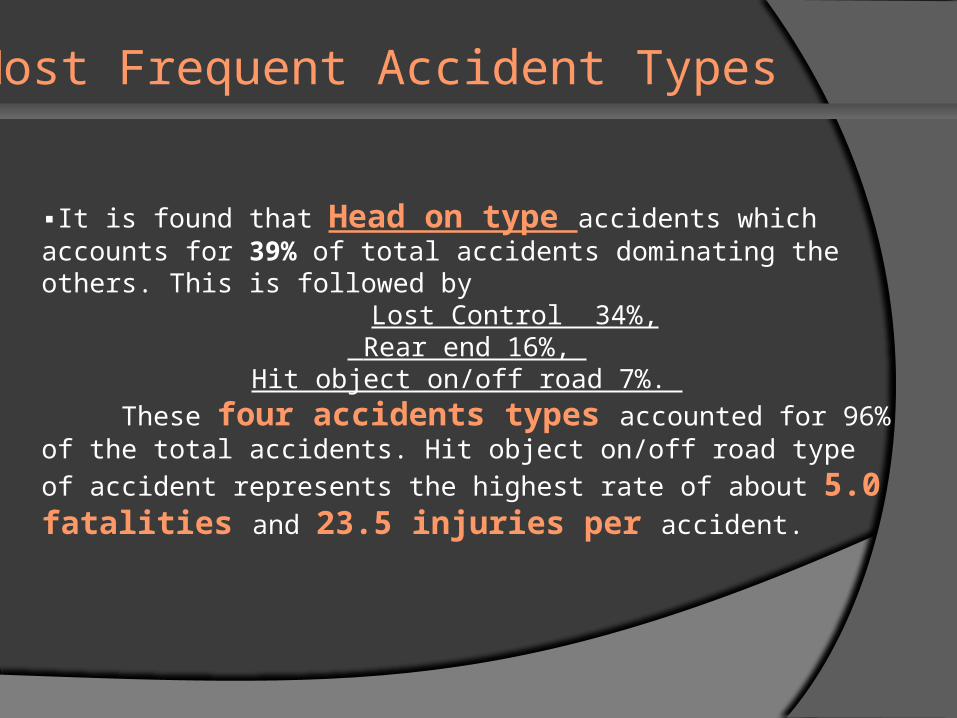
▪It is found that Head on type accidents which accounts for 39% of total accidents dominating the others. This is followed by
Lost Control 34%, Rear end 16%,
Hit object on/off road 7%. These four accidents types accounted for 96% of the total accidents. Hit object on/off road type of accident represents the highest rate of about 5.0 fatalities and 23.5 injuries per accident.
•Accident By Routes
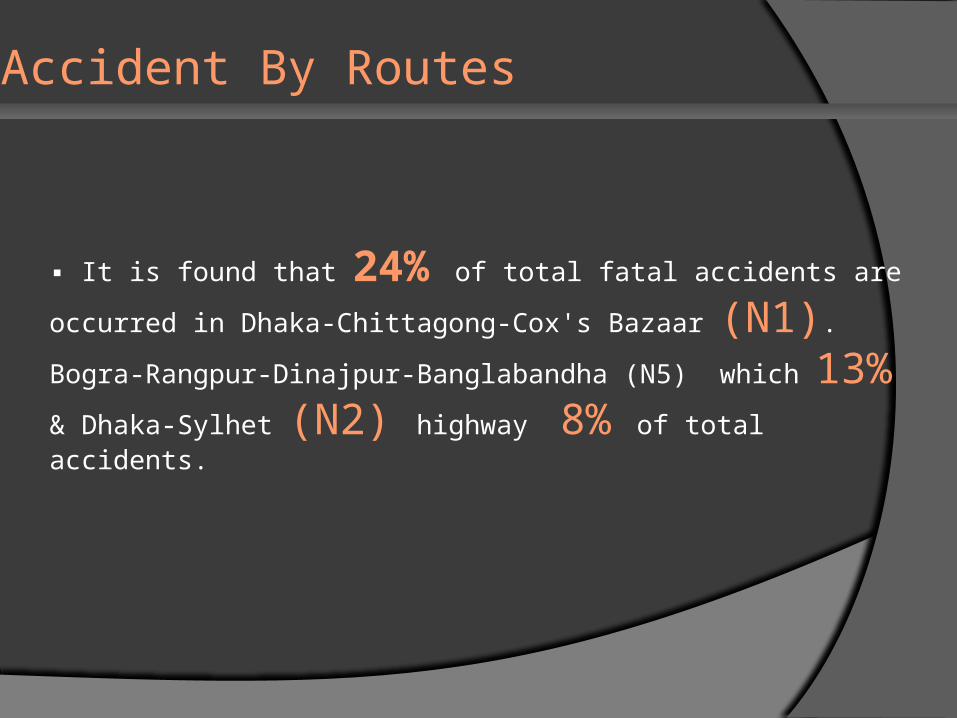
▪ It is found that 24% of total fatal accidents are occurred in
Dhaka-Chittagong-Cox's Bazaar (N1). Bogra-Rangpur-Dinajpur-
Banglabandha (N5) which 13% & Dhaka-Sylhet (N2) highway 8% of total accidents.
•Accident By Routes
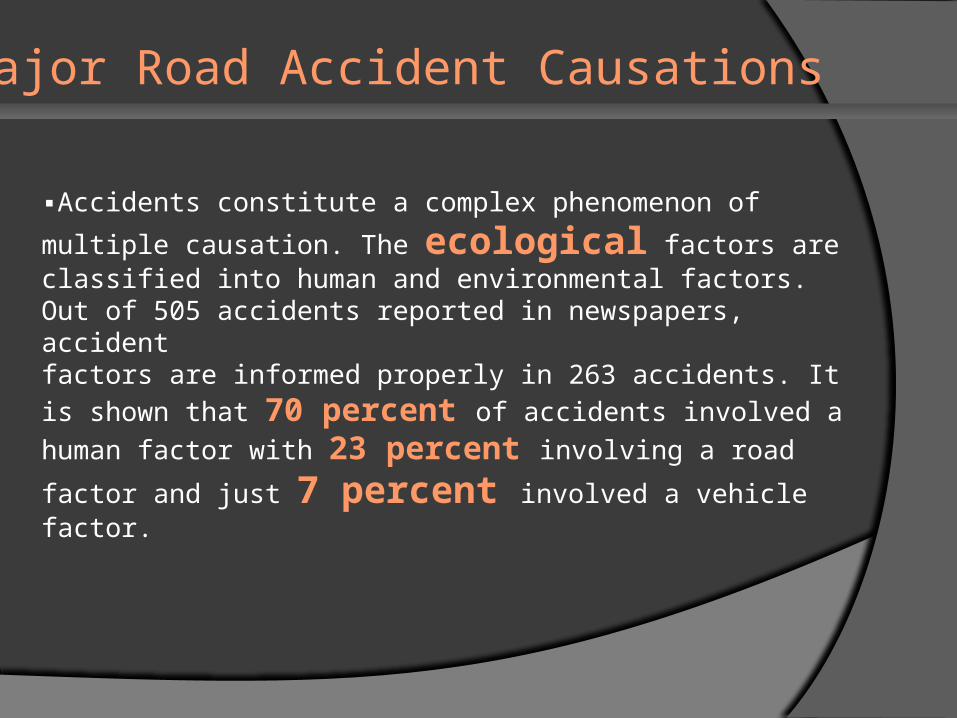
•Major Road Accident Causations
▪Accidents constitute a complex phenomenon of multiple
causation. The ecological factors are classified into human and environmental factors.Out of 505 accidents reported in newspapers, accidentfactors are informed properly in 263 accidents. It is shown that 70 percent of accidents involved a human factor
with 23 percent involving a road factor and just 7 percent involved a vehicle factor.
•Improving Road Safety
Development Of Countermeasures:
▪ Direct Countermeasures▪ Indirect Countermeasures
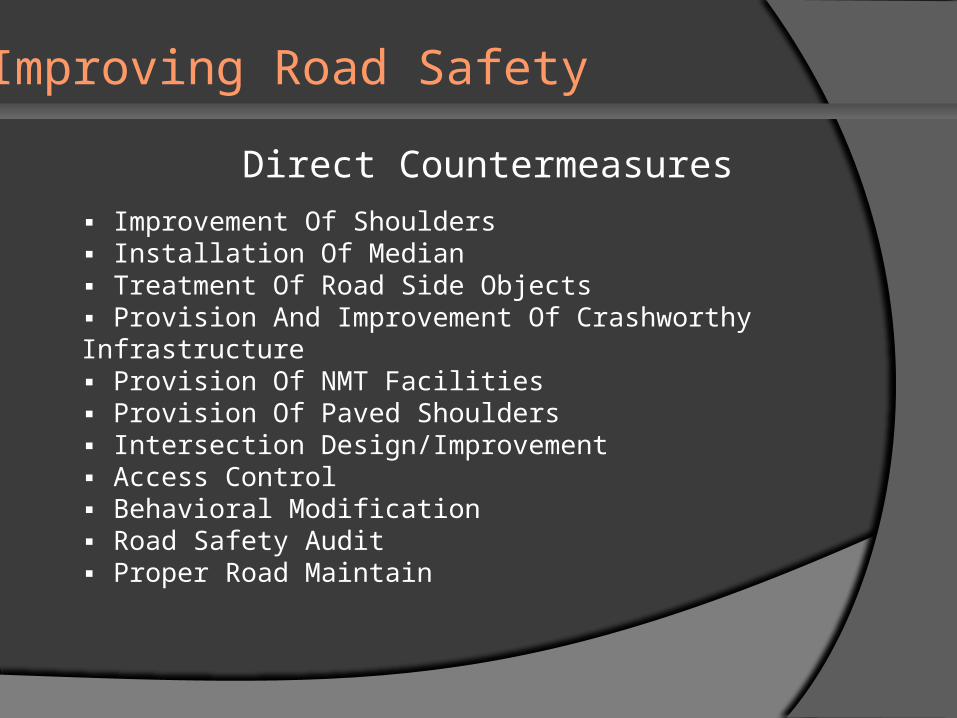
•Improving Road Safety
Direct Countermeasures▪ Improvement Of Shoulders▪ Installation Of Median▪ Treatment Of Road Side Objects▪ Provision And Improvement Of Crashworthy Infrastructure▪ Provision Of NMT Facilities▪ Provision Of Paved Shoulders▪ Intersection Design/Improvement▪ Access Control▪ Behavioral Modification▪ Road Safety Audit▪ Proper Road Maintain
•Improving Road Safety
Indirect Countermeasures
▪ Controlling Speed▪ Properly Trained Drivers By Authorized Centers.▪ Emergency Medical Care▪ Safety Improvement

And be careful…..