Embed Size (px)
Citation preview
Sugar Tax: A kick start to a healthier lifestyle?
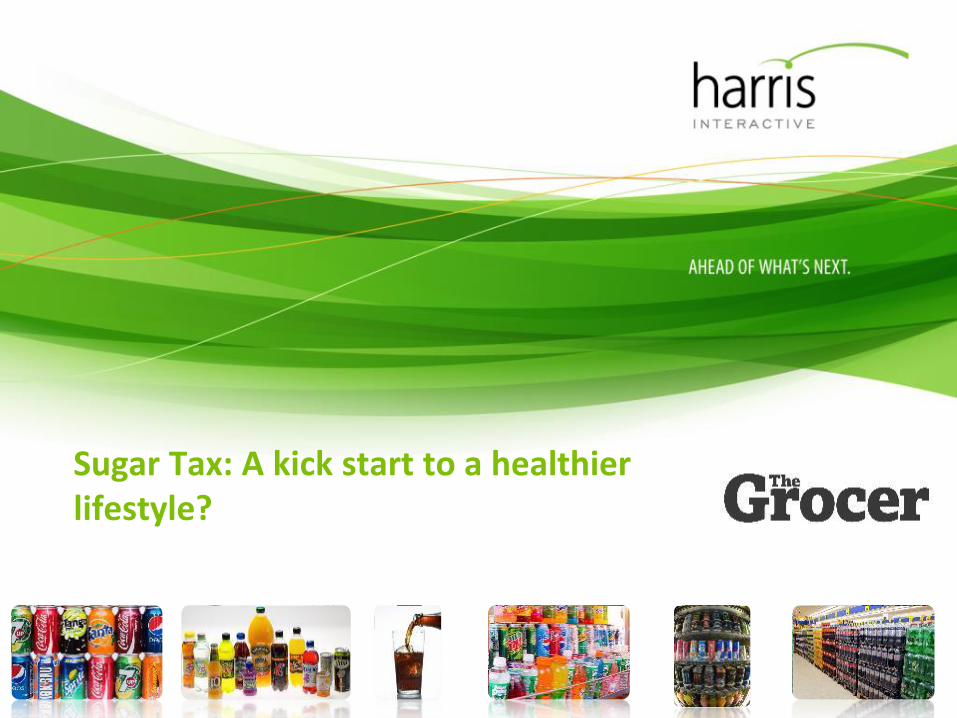
45% of the British public are concerned about the health effects of sugary soft drinks and support the idea of introducing a sugar tax to address this.
The idea gets more support from women than men
© Harris Interactive 2
35%
21%
45%35% are opposed to the idea of a “health tax” on sugary soft drinks
45% support the idea of a “health tax” on sugary soft drinks
Don’t know
Q1. There have been growing calls for sugary soft drinks to be taxed to address the damage they do to the health of the nations. Do you
support this idea?
Base: All respondents (2,030)
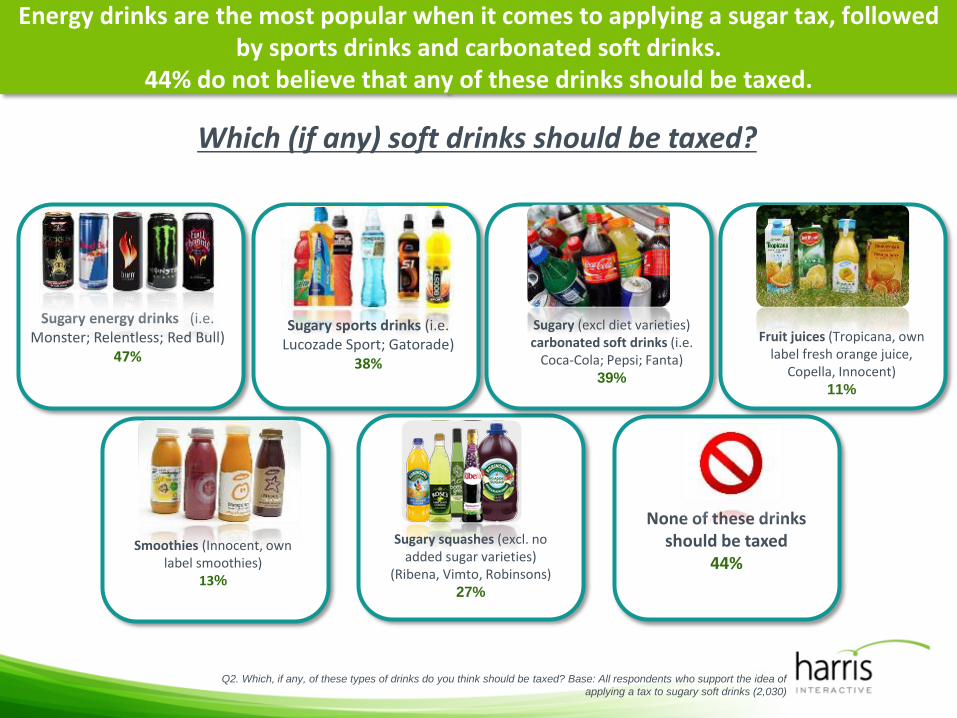
Energy drinks are the most popular when it comes to applying a sugar tax, followed by sports drinks and carbonated soft drinks.
44% do not believe that any of these drinks should be taxed.
None of these drinks should be taxed
44%
Which (if any) soft drinks should be taxed?
Sugary energy drinks (i.e. Monster; Relentless; Red Bull)
47%
Sugary sports drinks (i.e. Lucozade Sport; Gatorade)
38%
Sugary (excl diet varieties) carbonated soft drinks (i.e.
Coca-Cola; Pepsi; Fanta)39%
Fruit juices (Tropicana, own label fresh orange juice,
Copella, Innocent)11%
Smoothies (Innocent, own label smoothies)
13%
Sugary squashes (excl. no added sugar varieties)
(Ribena, Vimto, Robinsons)27%
Q2. Which, if any, of these types of drinks do you think should be taxed? Base: All respondents who support the idea of
applying a tax to sugary soft drinks (2,030)
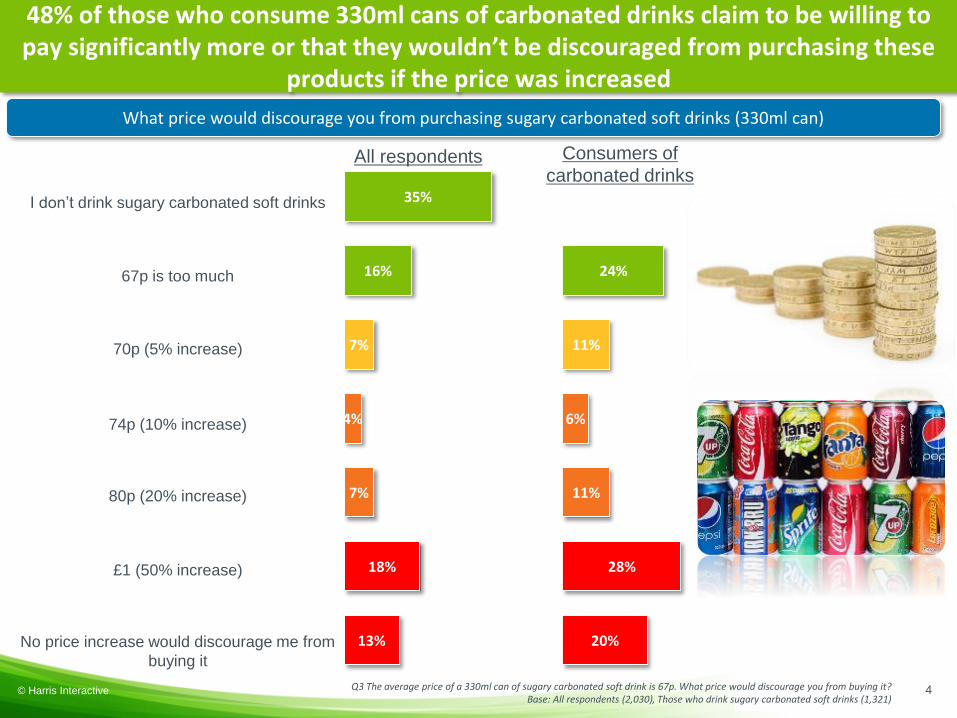
24%
11%
6%
11%
28%
20%
© Harris Interactive 4Q3 The average price of a 330ml can of sugary carbonated soft drink is 67p. What price would discourage you from buying it?Base: All respondents (2,030), Those who drink sugary carbonated soft drinks (1,321)
I don’t drink sugary carbonated soft drinks 35%
16%
7%
4%
7%
18%
13%
67p is too much
70p (5% increase)
74p (10% increase)
80p (20% increase)
£1 (50% increase)
No price increase would discourage me from
buying it
48% of those who consume 330ml cans of carbonated drinks claim to be willing to pay significantly more or that they wouldn’t be discouraged from purchasing these
products if the price was increased
All respondents Consumers of
carbonated drinks
What price would discourage you from purchasing sugary carbonated soft drinks (330ml can)
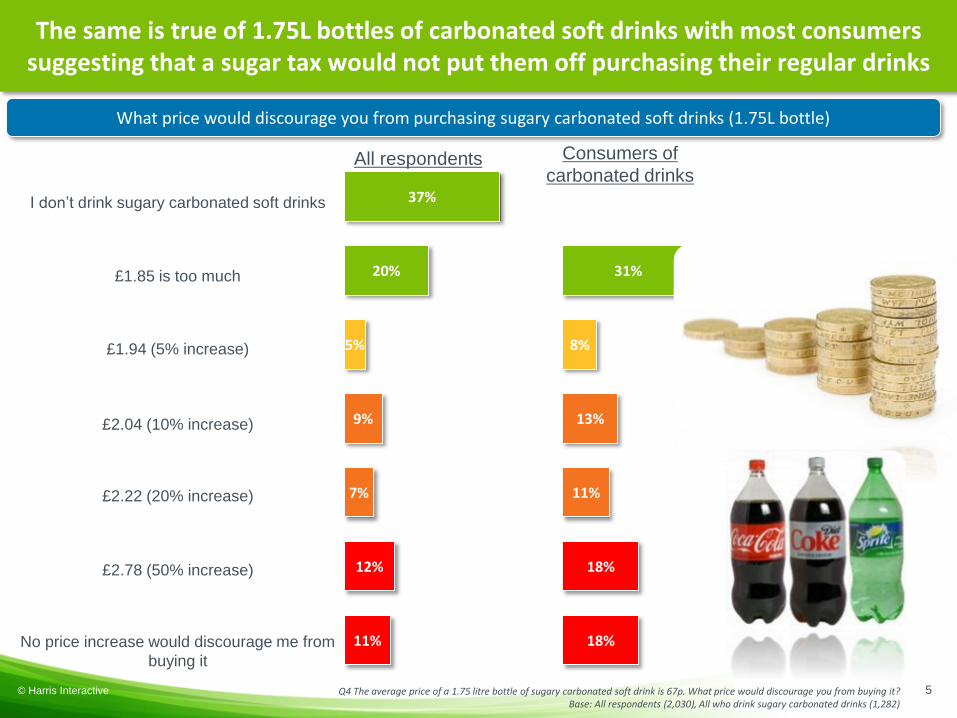
31%
8%
13%
11%
18%
18%
© Harris Interactive 5Q4 The average price of a 1.75 litre bottle of sugary carbonated soft drink is 67p. What price would discourage you from buying it? Base: All respondents (2,030), All who drink sugary carbonated drinks (1,282)
The same is true of 1.75L bottles of carbonated soft drinks with most consumers suggesting that a sugar tax would not put them off purchasing their regular drinks
I don’t drink sugary carbonated soft drinks 37%
20%
5%
9%
7%
12%
11%
£1.85 is too much
£1.94 (5% increase)
£2.04 (10% increase)
£2.22 (20% increase)
£2.78 (50% increase)
No price increase would discourage me from
buying it
All respondents Consumers of
carbonated drinks
What price would discourage you from purchasing sugary carbonated soft drinks (1.75L bottle)
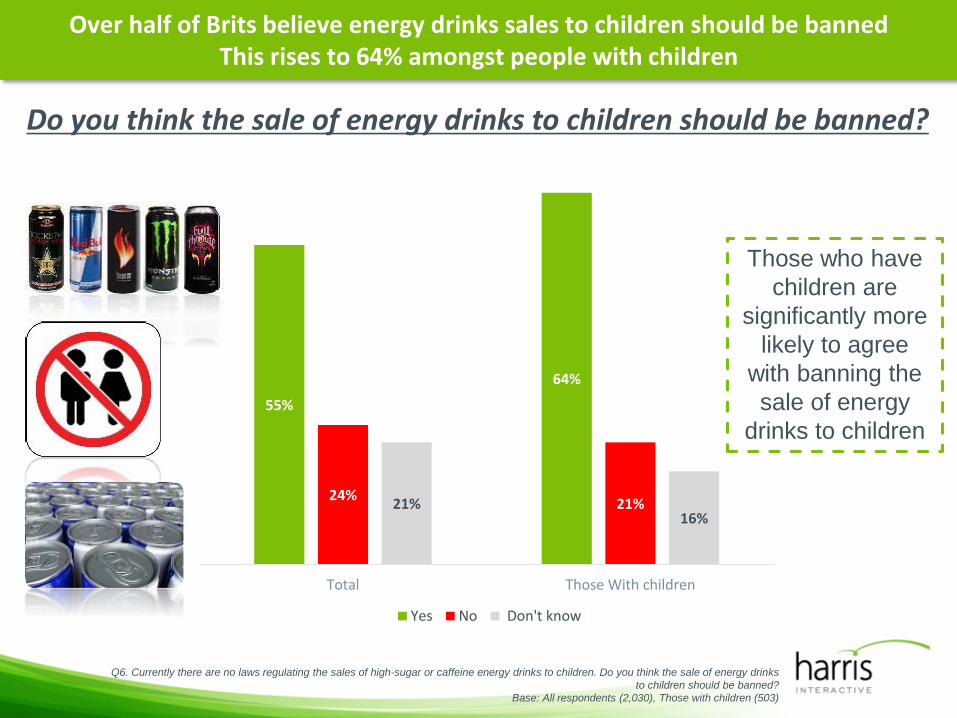
Over half of Brits believe energy drinks sales to children should be bannedThis rises to 64% amongst people with children
Do you think the sale of energy drinks to children should be banned?
Q6. Currently there are no laws regulating the sales of high-sugar or caffeine energy drinks to children. Do you think the sale of energy drinks
to children should be banned?
Base: All respondents (2,030), Those with children (503)
55%
64%
24%21%21%
16%
Total Those With children
Yes No Don't know
Those who have
children are
significantly more
likely to agree
with banning the
sale of energy
drinks to children
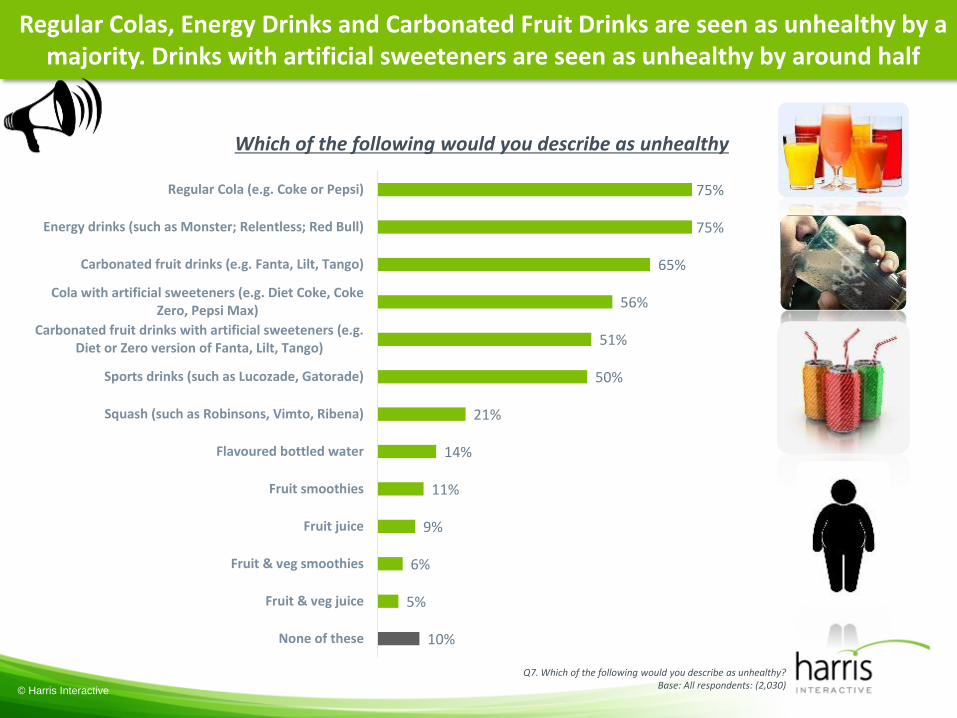
Regular Colas, Energy Drinks and Carbonated Fruit Drinks are seen as unhealthy by a majority. Drinks with artificial sweeteners are seen as unhealthy by around half
© Harris Interactive
Which of the following would you describe as unhealthy
Q7. Which of the following would you describe as unhealthy?Base: All respondents: (2,030)
10%
5%
6%
9%
11%
14%
21%
50%
51%
56%
65%
75%
75%
None of these
Fruit & veg juice
Fruit & veg smoothies
Fruit juice
Fruit smoothies
Flavoured bottled water
Squash (such as Robinsons, Vimto, Ribena)
Sports drinks (such as Lucozade, Gatorade)
Carbonated fruit drinks with artificial sweeteners (e.g.Diet or Zero version of Fanta, Lilt, Tango)
Cola with artificial sweeteners (e.g. Diet Coke, CokeZero, Pepsi Max)
Carbonated fruit drinks (e.g. Fanta, Lilt, Tango)
Energy drinks (such as Monster; Relentless; Red Bull)
Regular Cola (e.g. Coke or Pepsi)
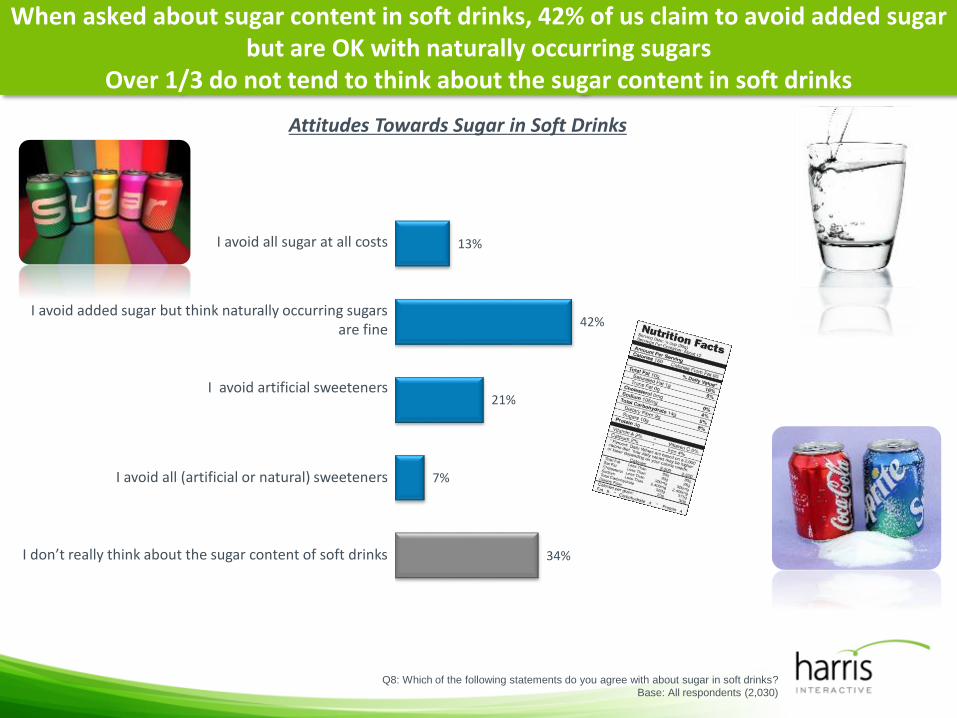
When asked about sugar content in soft drinks, 42% of us claim to avoid added sugar but are OK with naturally occurring sugars
Over 1/3 do not tend to think about the sugar content in soft drinks
I avoid all sugar at all costs
I avoid added sugar but think naturally occurring sugars are fine
I avoid artificial sweeteners
I avoid all (artificial or natural) sweeteners
I don’t really think about the sugar content of soft drinks
13%
42%
21%
7%
34%
Attitudes Towards Sugar in Soft Drinks
Q8: Which of the following statements do you agree with about sugar in soft drinks?
Base: All respondents (2,030)
Appendix –Approach & Demographics
9© Harris Interactive
• We conducted an online omnibus survey with 2,030 adults aged 16+ across England,
Scotland, and Wales between 10th and 18th March 2015
• The survey took place using the Toluna online panel
• The Harris Omnibus interviews members of the
general public who have opted in and voluntarily agreed to participate
in online research studies. Through careful recruitment and management, we are able to
rapidly survey large numbers of the general population and accurately represent the
views of the nation.
• We have over 400,000 active panellists in the UK and our panel is used solely for
market and opinion research. Members are contacted at random and invited to take
part in a survey.
Approach and Panel
© Harris Interactive 10
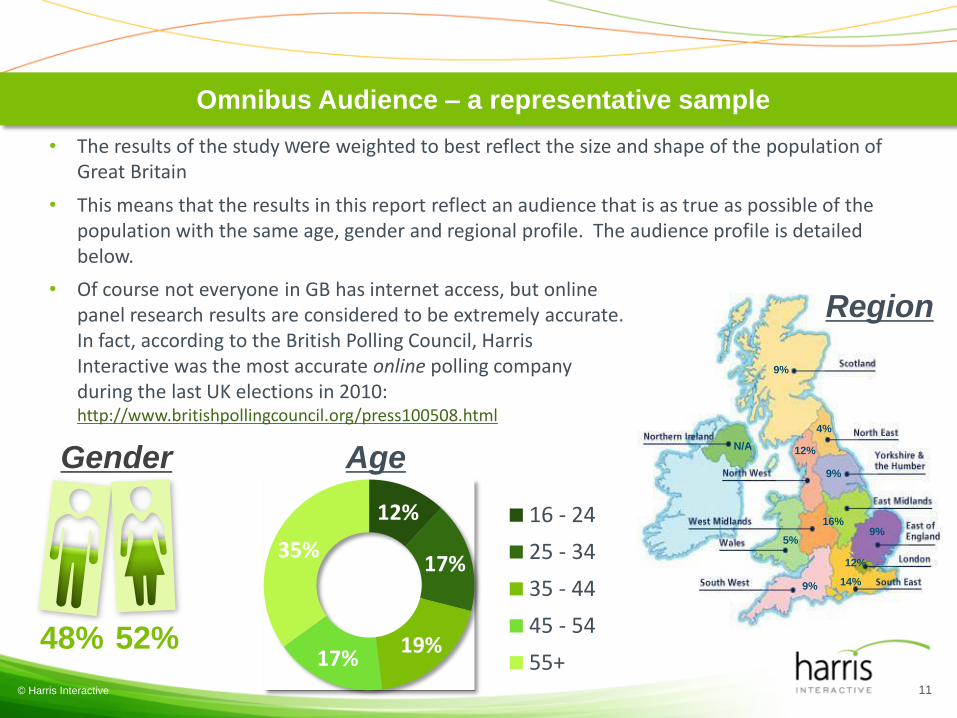
Omnibus Audience – a representative sample
12%
9%
4%
9%
9%16%
9%
5%
14%
12%
© Harris Interactive 11
• The results of the study were weighted to best reflect the size and shape of the population of Great Britain
• This means that the results in this report reflect an audience that is as true as possible of the population with the same age, gender and regional profile. The audience profile is detailed below.
• Of course not everyone in GB has internet access, but online panel research results are considered to be extremely accurate. In fact, according to the British Polling Council, Harris Interactive was the most accurate online polling company during the last UK elections in 2010: http://www.britishpollingcouncil.org/press100508.html
N/A
Gender Age
Region
48% 52%
12%
17%
19%17%
35%
16 - 24
25 - 34
35 - 44
45 - 54
55+
Lucia Juliano | Head of Consumer & Retail Research | [email protected]
079 89 39 22 51 | 0161 242 1365 | 0161 242 1360
For Further Information please contact :
© Harris Interactive