Embed Size (px)
Citation preview
Taming GC Pauses for Humongous Java
Heaps in Spark Graph Computing
Eric Kaczmarek – Senior Java Performance Architect, Intel Corporation
Liqi Yi – Senior Performance Engineer, Intel Corporation

Legal Disclaimer• Intel may make changes to specifications and product descriptions at any time, without notice. Designers must not rely on the absence
or characteristics of any features or instructions marked "reserved" or "undefined". Intel reserves these for future definition and shall have no responsibility whatsoever for conflicts or incompatibilities arising from future changes to them. The information here is subject to change without notice. Do not finalize a design with this information.
The products described in this document may contain design defects or errors known as errata which may cause the product to deviate from published specifications. Current characterized errata are available on request.
Contact your local Intel sales office or your distributor to obtain the latest specifications and before placing your product order.
Tests document performance of components on a particular test, in specific systems. Differences in hardware, software, or configuration will affect actual performance. Consult other sources of information to evaluate performance as you consider your purchase.
• For more complete information about performance and benchmark results, visit http://www.intel.com/performance.
• Results have been estimated based on internal Intel analysis and are provided for informational purposes only. Any difference in system hardware or software design or configuration may affect actual performance.
• Results have been simulated and are provided for informational purposes only. Results were derived using simulations run on an architecture simulator or model. Any difference in system hardware or software design or configuration may affect actual performance.
• Intel does not control or audit the design or implementation of third party benchmark data or Web sites referenced in this document. Intel encourages all of its customers to visit the referenced Web sites or others where similar performance benchmark data are reported and confirm whether the referenced benchmark data are accurate and reflect performance of systems available for purchase.
• Intel and the Intel logo are trademarks of Intel Corporation in the U.S. and other countries.
• *Other names and brands may be claimed as the property of others.
• Copyright © 2015 Intel Corporation. All rights reserved.
Motivation
• Spark uses memory aggressively
• Growing memory capacity (200+GB not uncommon)
• Lengthy stop the world garbage collection burdens
applications
• Need for a more efficient GC algorithm to tame 100GB+
Java Heap
Garbage Collectors in JDK 8• Parallel Compacting Collector
– -XX:+UseParallelOldGC
– Throughput friendly collector
• Concurrent Mark Sweep (CMS) Collector
– -XX:+UseConcMarkSweepGC
– Low latency collector for heap < 32GB
• Garbage First (G1) Collector
– -XX:+UseG1GC
– Low latency collector
G1 Collector Promises
• Concurrent marking
• Nature compaction
• Simplified tuning
• Low and predictable latency
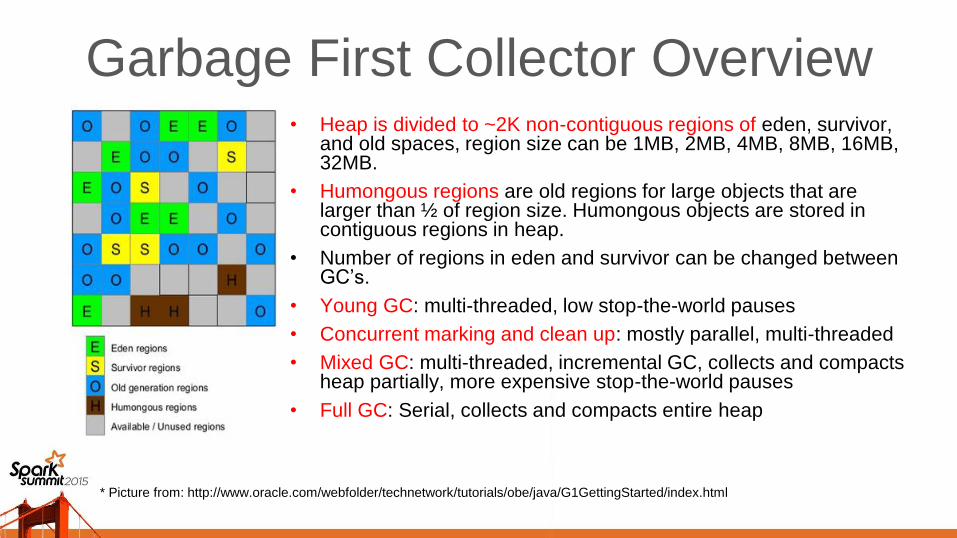
Garbage First Collector Overview• Heap is divided to ~2K non-contiguous regions of eden, survivor,
and old spaces, region size can be 1MB, 2MB, 4MB, 8MB, 16MB, 32MB.
• Humongous regions are old regions for large objects that are larger than ½ of region size. Humongous objects are stored in contiguous regions in heap.
• Number of regions in eden and survivor can be changed between GC’s.
• Young GC: multi-threaded, low stop-the-world pauses
• Concurrent marking and clean up: mostly parallel, multi-threaded
• Mixed GC: multi-threaded, incremental GC, collects and compacts heap partially, more expensive stop-the-world pauses
• Full GC: Serial, collects and compacts entire heap
* Picture from: http://www.oracle.com/webfolder/technetwork/tutorials/obe/java/G1GettingStarted/index.html
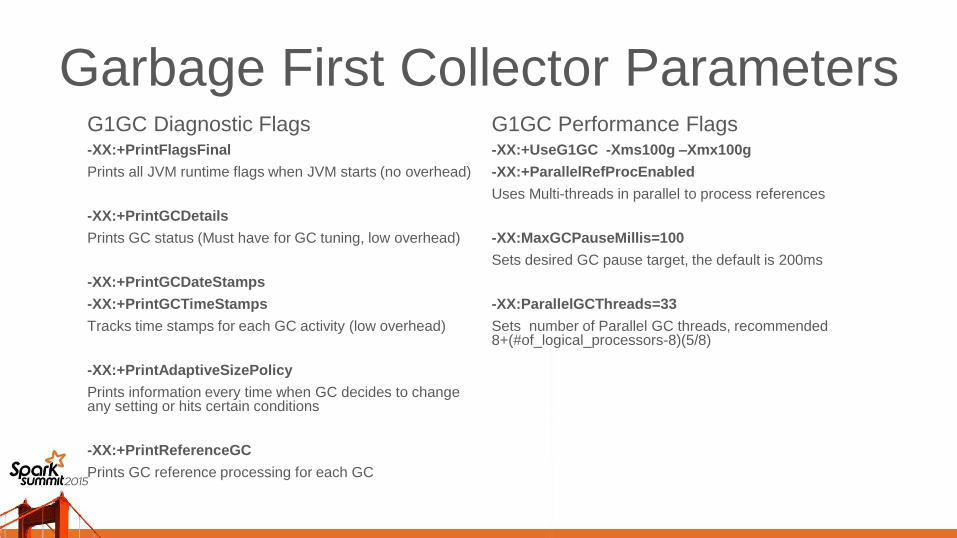
Garbage First Collector ParametersG1GC Diagnostic Flags-XX:+PrintFlagsFinal
Prints all JVM runtime flags when JVM starts (no overhead)
-XX:+PrintGCDetails
Prints GC status (Must have for GC tuning, low overhead)
-XX:+PrintGCDateStamps
-XX:+PrintGCTimeStamps
Tracks time stamps for each GC activity (low overhead)
-XX:+PrintAdaptiveSizePolicy
Prints information every time when GC decides to change any setting or hits certain conditions
-XX:+PrintReferenceGC
Prints GC reference processing for each GC
G1GC Performance Flags-XX:+UseG1GC -Xms100g –Xmx100g
-XX:+ParallelRefProcEnabled
Uses Multi-threads in parallel to process references
-XX:MaxGCPauseMillis=100
Sets desired GC pause target, the default is 200ms
-XX:ParallelGCThreads=33
Sets number of Parallel GC threads, recommended 8+(#of_logical_processors-8)(5/8)
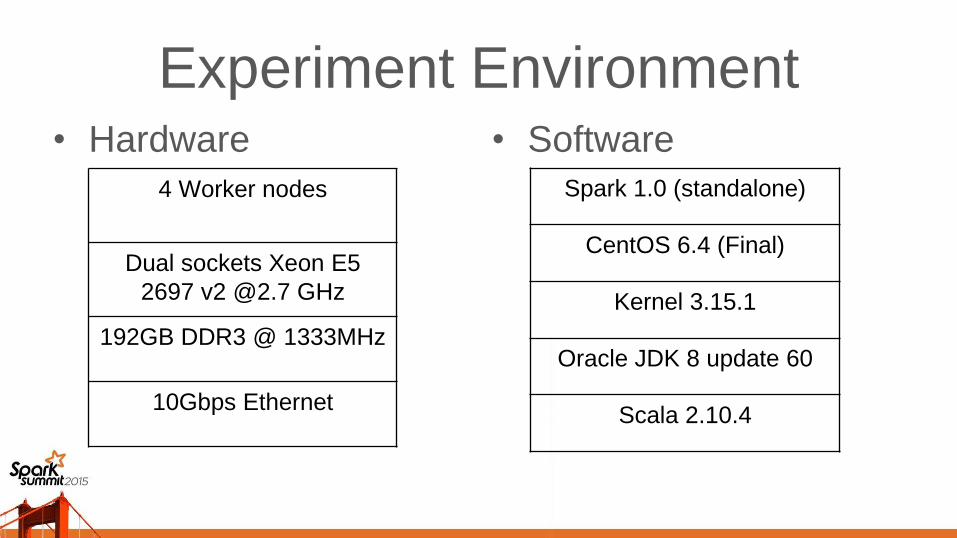
Experiment Environment• Hardware • Software
Spark 1.0 (standalone)
CentOS 6.4 (Final)
Kernel 3.15.1
Oracle JDK 8 update 60
Scala 2.10.4
4 Worker nodes
Dual sockets Xeon E5
2697 v2 @2.7 GHz
192GB DDR3 @ 1333MHz
10Gbps Ethernet
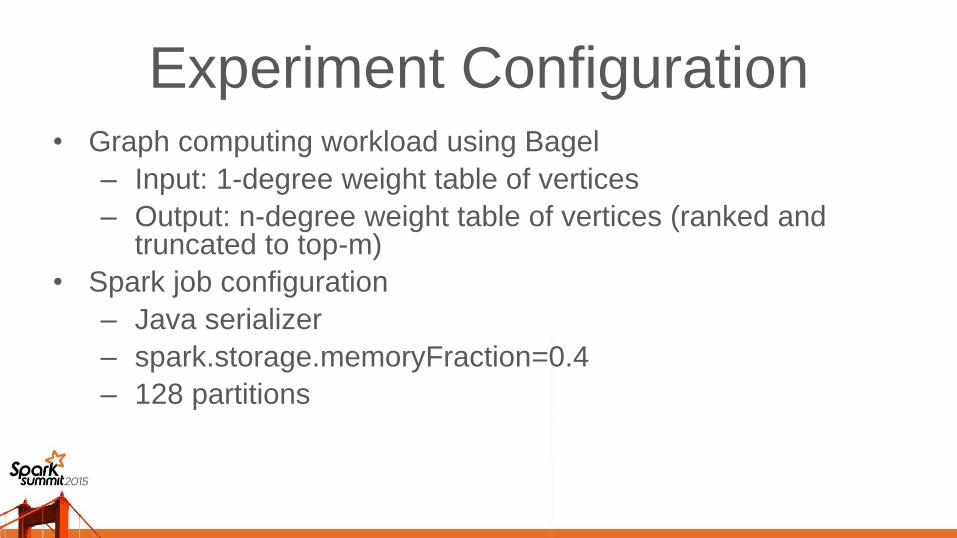
Experiment Configuration• Graph computing workload using Bagel
– Input: 1-degree weight table of vertices
– Output: n-degree weight table of vertices (ranked and truncated to top-m)
• Spark job configuration
– Java serializer
– spark.storage.memoryFraction=0.4
– 128 partitions
G1 Baseline
0.01
0.1
1
10
100
1000
16:30:43 16:32:10 16:33:36 16:35:02 16:36:29 16:37:55 16:39:22 16:40:48
GC
pause t
ime (
sec)
Time stamp
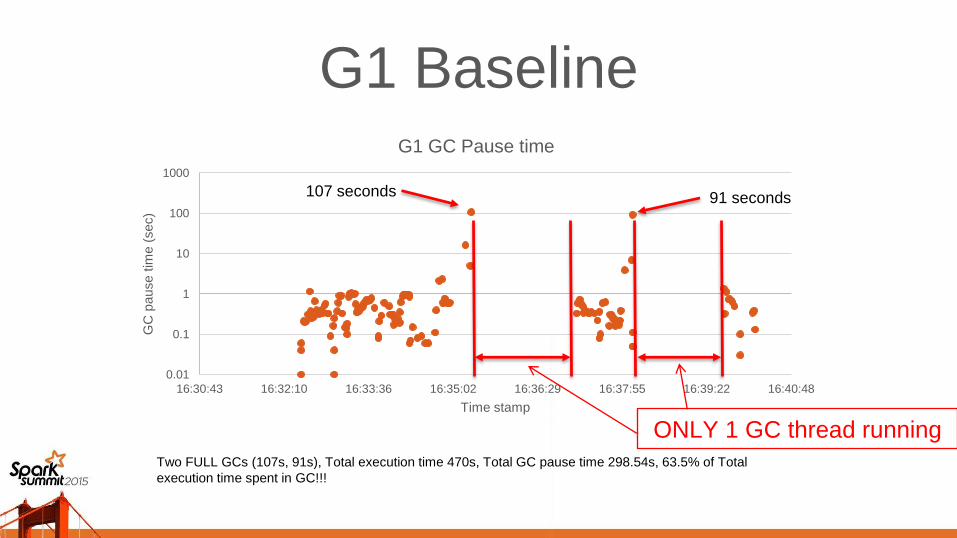
G1 GC Pause time
Two FULL GCs (107s, 91s), Total execution time 470s, Total GC pause time 298.54s, 63.5% of Total
execution time spent in GC!!!
107 seconds 91 seconds
ONLY 1 GC thread running
How to Improve GC Behavior1. Enable GC logging
2. Look for outliers (long pauses) in the logs
3. Understand the root of long GC pauses
4. Tune GC command line to avoid or alleviate the symptoms
5. Examine logs and repeat at step #2 (multiple iterations)
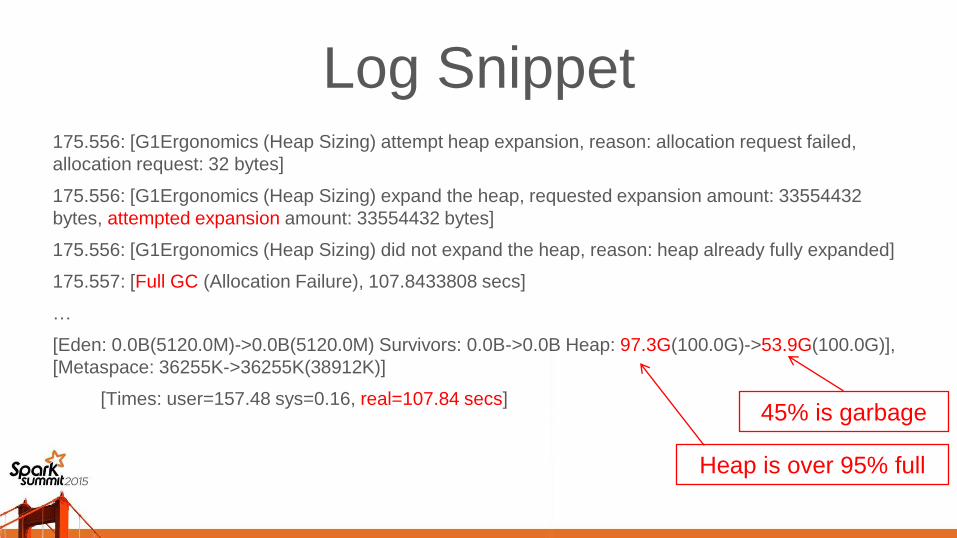
Log Snippet175.556: [G1Ergonomics (Heap Sizing) attempt heap expansion, reason: allocation request failed,
allocation request: 32 bytes]
175.556: [G1Ergonomics (Heap Sizing) expand the heap, requested expansion amount: 33554432
bytes, attempted expansion amount: 33554432 bytes]
175.556: [G1Ergonomics (Heap Sizing) did not expand the heap, reason: heap already fully expanded]
175.557: [Full GC (Allocation Failure), 107.8433808 secs]
…
[Eden: 0.0B(5120.0M)->0.0B(5120.0M) Survivors: 0.0B->0.0B Heap: 97.3G(100.0G)->53.9G(100.0G)],
[Metaspace: 36255K->36255K(38912K)]
[Times: user=157.48 sys=0.16, real=107.84 secs]
Heap is over 95% full
45% is garbage
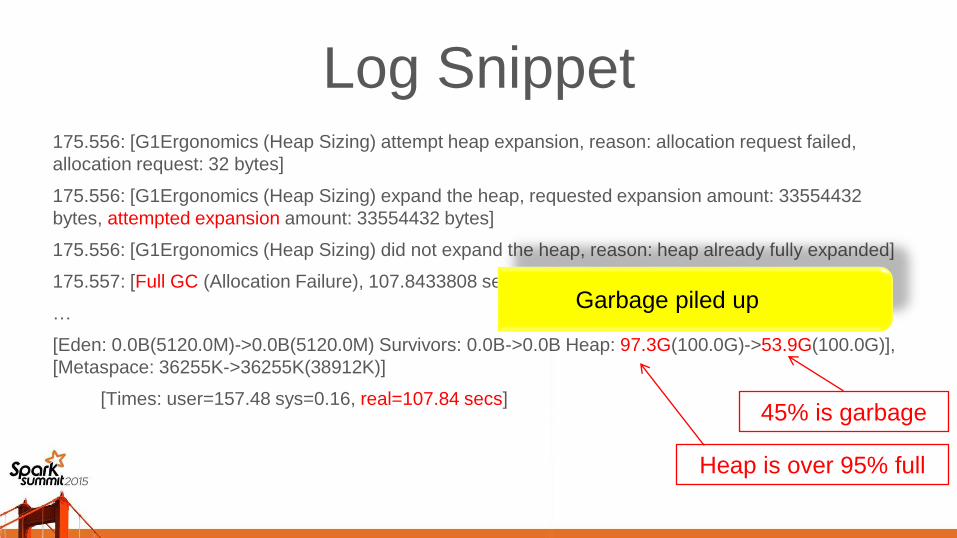
Garbage piled up
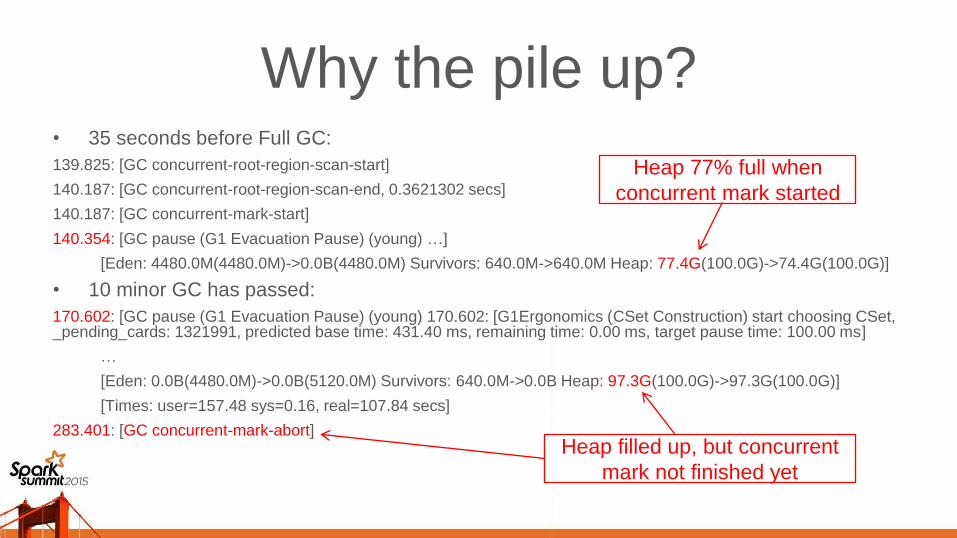
Why the pile up?• 35 seconds before Full GC:
139.825: [GC concurrent-root-region-scan-start]
140.187: [GC concurrent-root-region-scan-end, 0.3621302 secs]
140.187: [GC concurrent-mark-start]
140.354: [GC pause (G1 Evacuation Pause) (young) …]
[Eden: 4480.0M(4480.0M)->0.0B(4480.0M) Survivors: 640.0M->640.0M Heap: 77.4G(100.0G)->74.4G(100.0G)]
• 10 minor GC has passed:
170.602: [GC pause (G1 Evacuation Pause) (young) 170.602: [G1Ergonomics (CSet Construction) start choosing CSet, _pending_cards: 1321991, predicted base time: 431.40 ms, remaining time: 0.00 ms, target pause time: 100.00 ms]
…
[Eden: 0.0B(4480.0M)->0.0B(5120.0M) Survivors: 640.0M->0.0B Heap: 97.3G(100.0G)->97.3G(100.0G)]
[Times: user=157.48 sys=0.16, real=107.84 secs]
283.401: [GC concurrent-mark-abort]
Heap 77% full when
concurrent mark started
Heap filled up, but concurrent
mark not finished yet
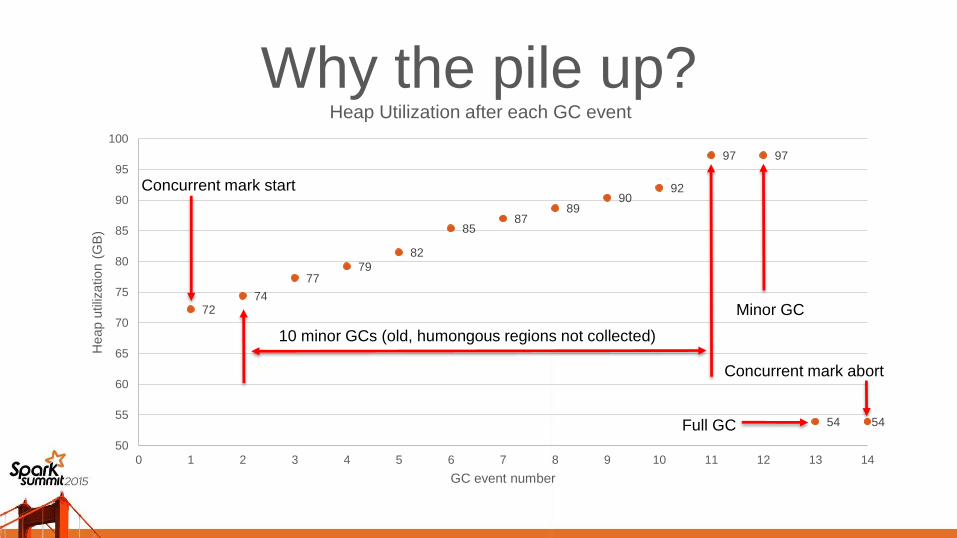
Why the pile up?
7274
7779
82
8587
8990
92
97 97
54 54
50
55
60
65
70
75
80
85
90
95
100
0 1 2 3 4 5 6 7 8 9 10 11 12 13 14
Heap u
tiliz
atio
n (
GB
)
GC event number
Heap Utilization after each GC event
Full GC
Concurrent mark abort
10 minor GCs (old, humongous regions not collected)
Minor GC
Concurrent mark start
Root Causes and Solutions• Concurrent marking phase needs speed up
– Concurrent phase did not finish before Full GC happens
– Concurrent marking phase must be completed before mixed GC could happen
• More aggressive concurrent phase
– Increase concurrent threads from 8(default) to 20
-XX:ConcGCThreads=20
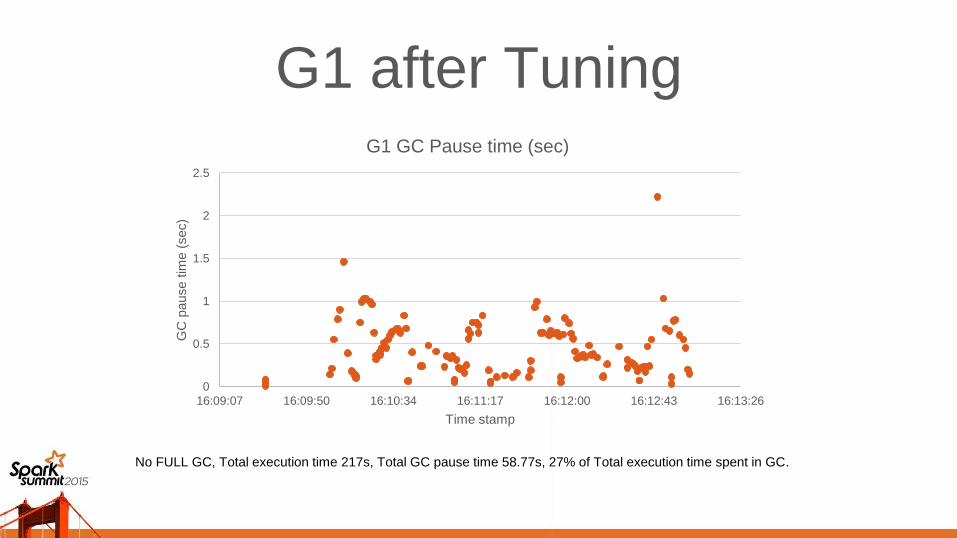
G1 after Tuning
0
0.5
1
1.5
2
2.5
16:09:07 16:09:50 16:10:34 16:11:17 16:12:00 16:12:43 16:13:26
GC
pause t
ime (
sec)
Time stamp
G1 GC Pause time (sec)
No FULL GC, Total execution time 217s, Total GC pause time 58.77s, 27% of Total execution time spent in GC.
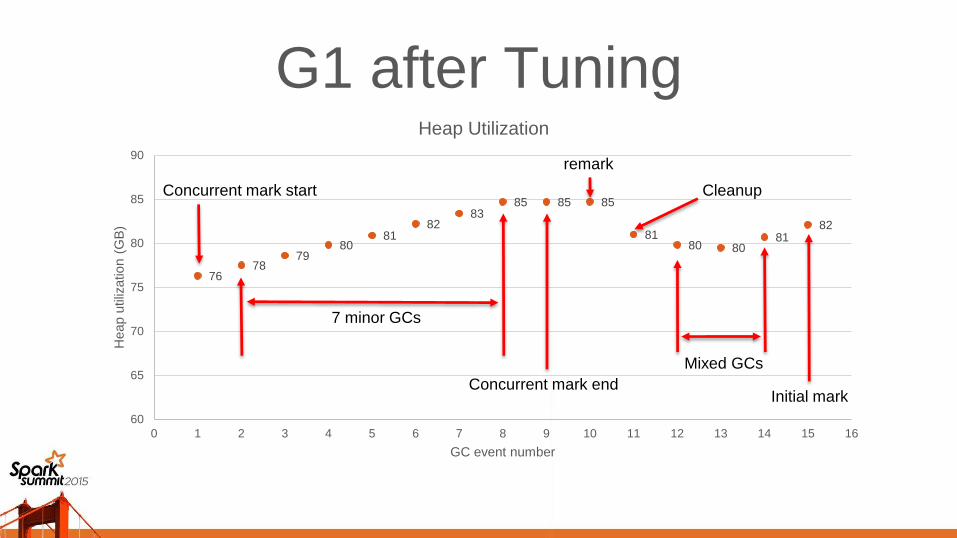
G1 after Tuning
7678
7980
8182
8385 85 85
8180 80
8182
60
65
70
75
80
85
90
0 1 2 3 4 5 6 7 8 9 10 11 12 13 14 15 16
Heap u
tiliz
atio
n (
GB
)
GC event number
Heap Utilization
Concurrent mark end
remark
Cleanup
Initial mark
Concurrent mark start
7 minor GCs
Mixed GCs
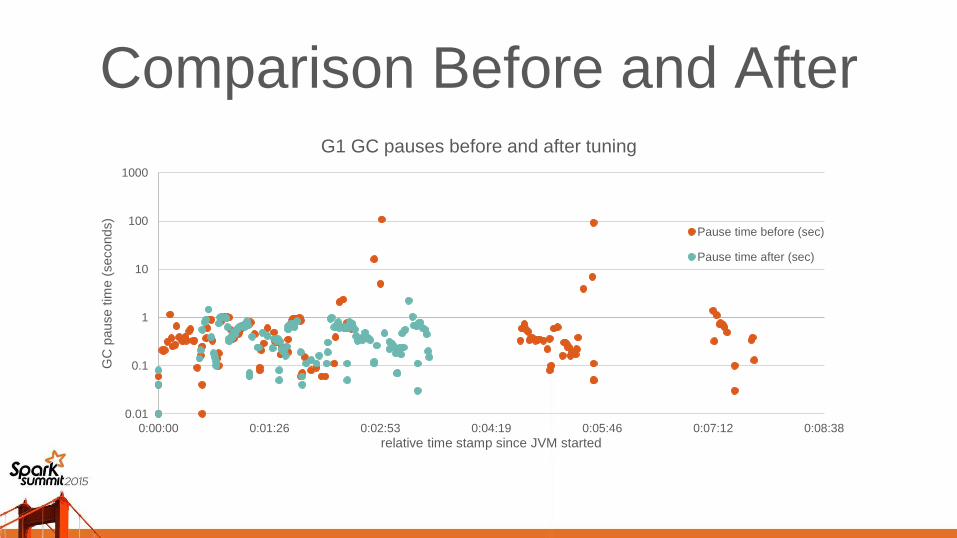
Comparison Before and After
0.01
0.1
1
10
100
1000
0:00:00 0:01:26 0:02:53 0:04:19 0:05:46 0:07:12 0:08:38
GC
pause t
ime (
seconds)
relative time stamp since JVM started
G1 GC pauses before and after tuning
Pause time before (sec)
Pause time after (sec)
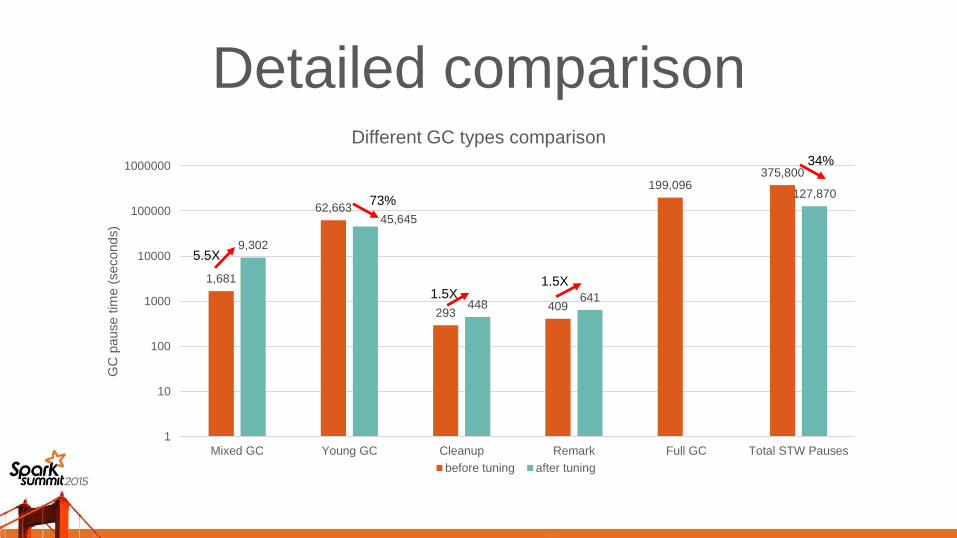
1,681
62,663
293409
199,096375,800
9,302
45,645
448641
127,870
1
10
100
1000
10000
100000
1000000
Mixed GC Young GC Cleanup Remark Full GC Total STW Pauses
GC
pause t
ime (
seconds)
Different GC types comparison
before tuning after tuning
5.5X
73%
1.5X1.5X
34%
Detailed comparison
Conclusion– JDK8u60 G1 collector works well for large Java Heaps (100+
GB)
– Default G1 settings still do not offer best performance
• Requires tuning
– Tuned G1 provides low GC pauses for Spark running with large heaps (100+GB)
Acknowledging
• Yu (Jenny) Zhang – Oracle Corp.
• Yanping Wang – Intel Corp.
• Liye Zhang - Intel Corp.
• Jie (Grace) Huang - Intel Corp.

ContactsEric Kaczmarek
Liqi Yi
Additional resources• https://blogs.oracle.com/g1gc/
• http://www.infoq.com/articles/G1-One-Garbage-Collector-To-Rule-Them-All
• http://www.oracle.com/webfolder/technetwork/tutorials/obe/java/G1GettingStarted/index.html#Clear
CT
• https://blogs.oracle.com/g1gc/entry/g1gc_logs_how_to_print