Embed Size (px)
Citation preview
WebSparkle Analytics
What gets measured, gets managed.Peter Drucker
A division of Gandhi Consultants Private Limited1002, Paigah Plaza, Basheerbagh, Hyderabad 500 034
Ph: 040 23552803 9848251541Email: [email protected]
What is Data Analysis all about
• Business Intelligence/Data Analytics is a method of analyzing historical data to make informed decisions and predict future results.
• It’s strength lies in the ability to drill down from summary data – whether it is graphed or not.
• An example would be drilling down on sales figures, starting with year, then drilling down to a particular quarter, and then to a month(s) within that quarter.
What is data visualization
• A picture is worth a thousand words!
• That’s why, visualization.
• Data visualization is the presentation of data, very often, gigabytes and terabytes, in a pictorial or graphical format.
How analysis of data can help you
• Sales - Track sales over period, geography, products, customers, forecasting
• Customers – Know you customers, their preferences, what they buy and how much, how quickly they pay
• Products – Know your fast selling products, how to track inventories, how much to invest, slow moving VS fast moving inventories
• Employees – their performance vs salary,
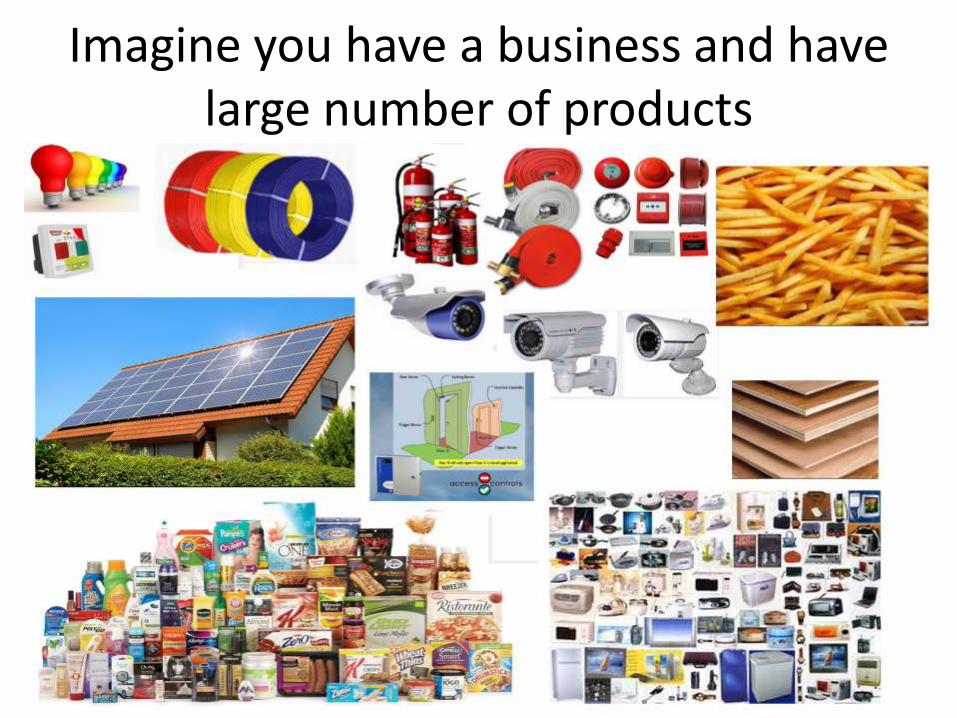
Imagine you have a business and have large number of products
And a large number of customers
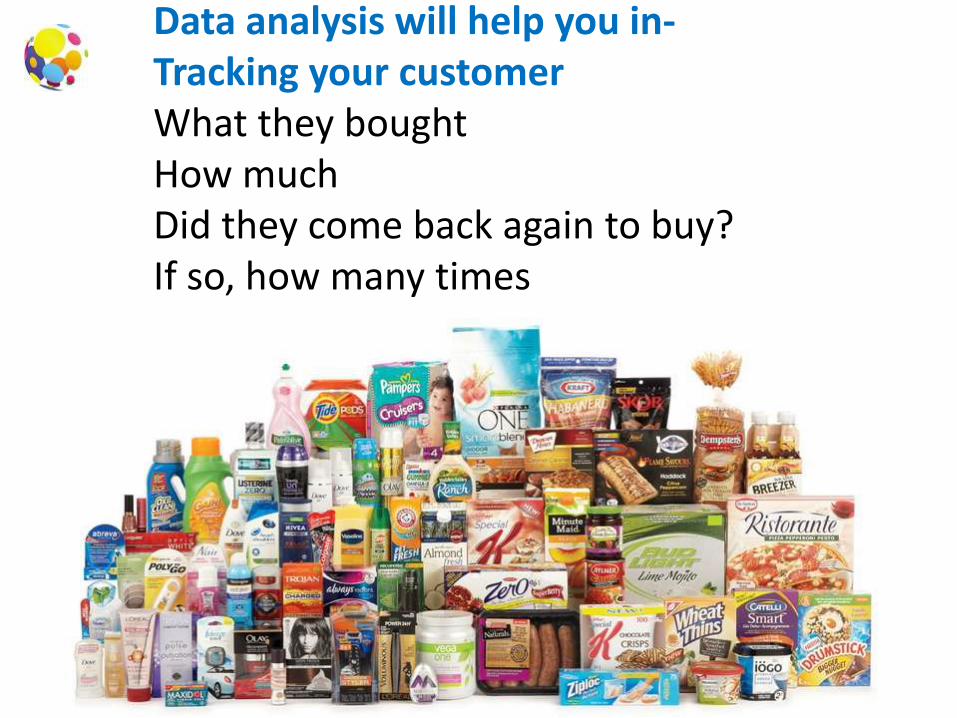
Data analysis will help you in-Tracking your customer What they boughtHow muchDid they come back again to buy?If so, how many times
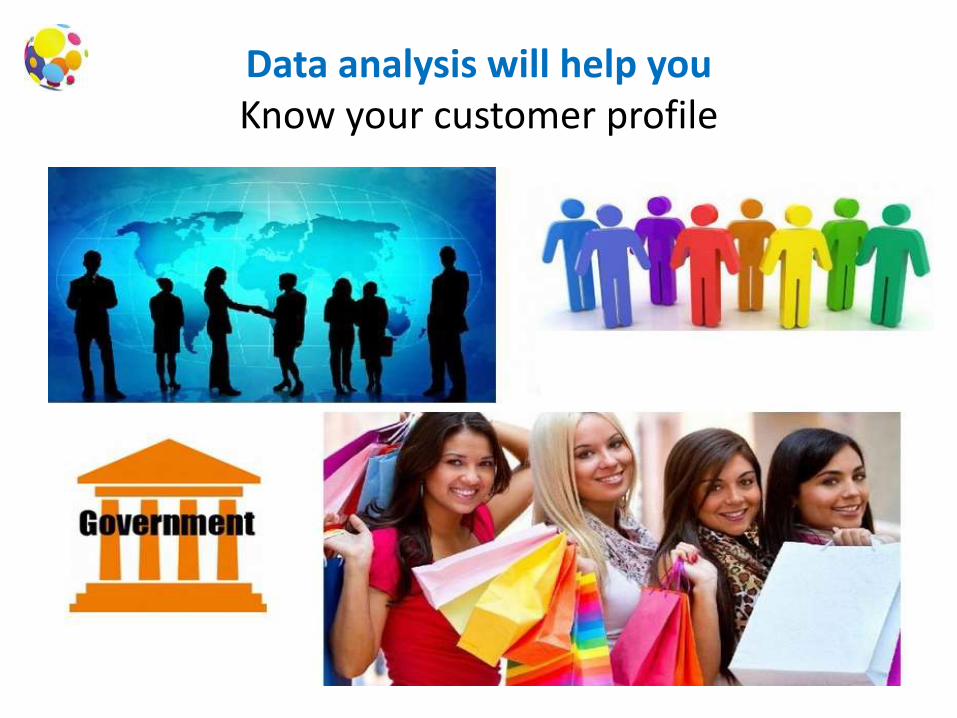
Data analysis will help youKnow your customer profile
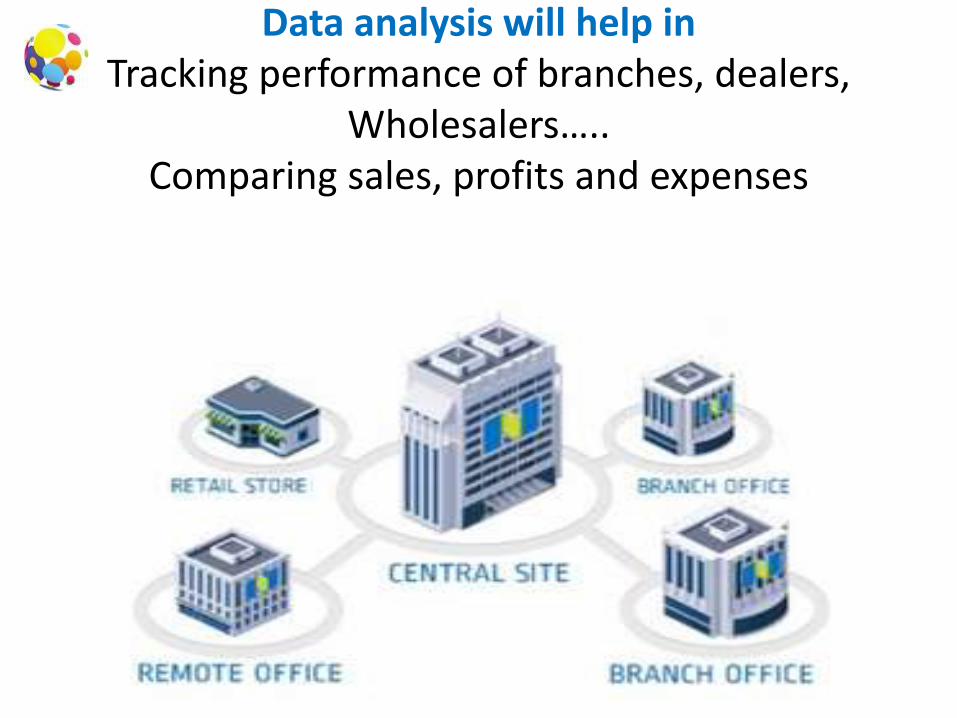
Data analysis will help inTracking performance of branches, dealers,
Wholesalers…..Comparing sales, profits and expenses
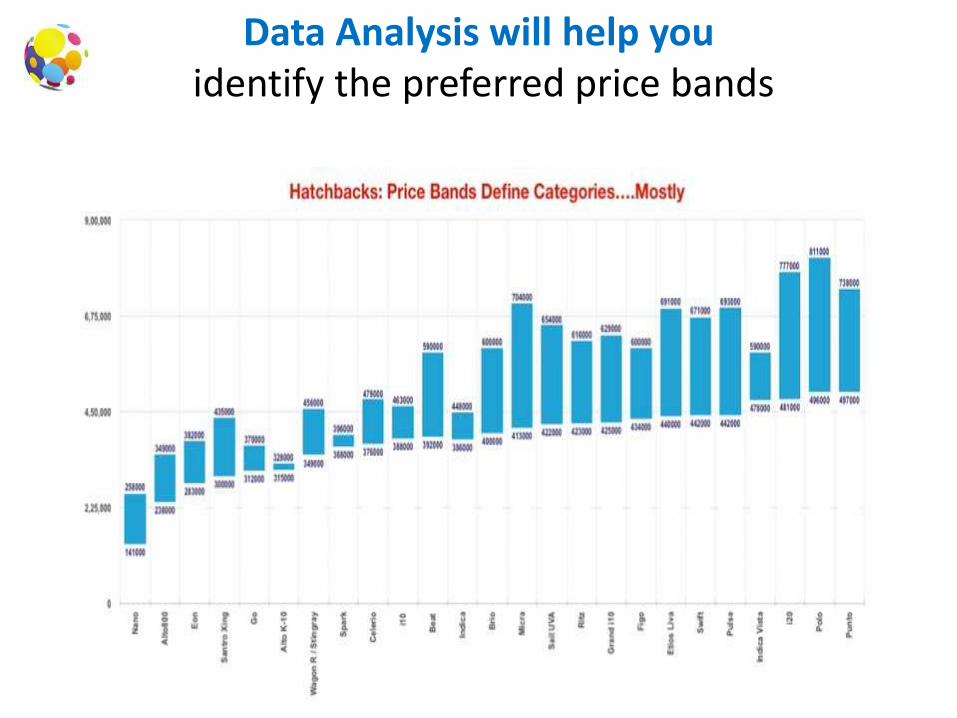
Data Analysis will help youidentify the preferred price bands
Don’t you think it would help if you knew your customer preferences and
their buying patterns?
Having this knowledge will help you target your customers better and address their requirements more
sharply.
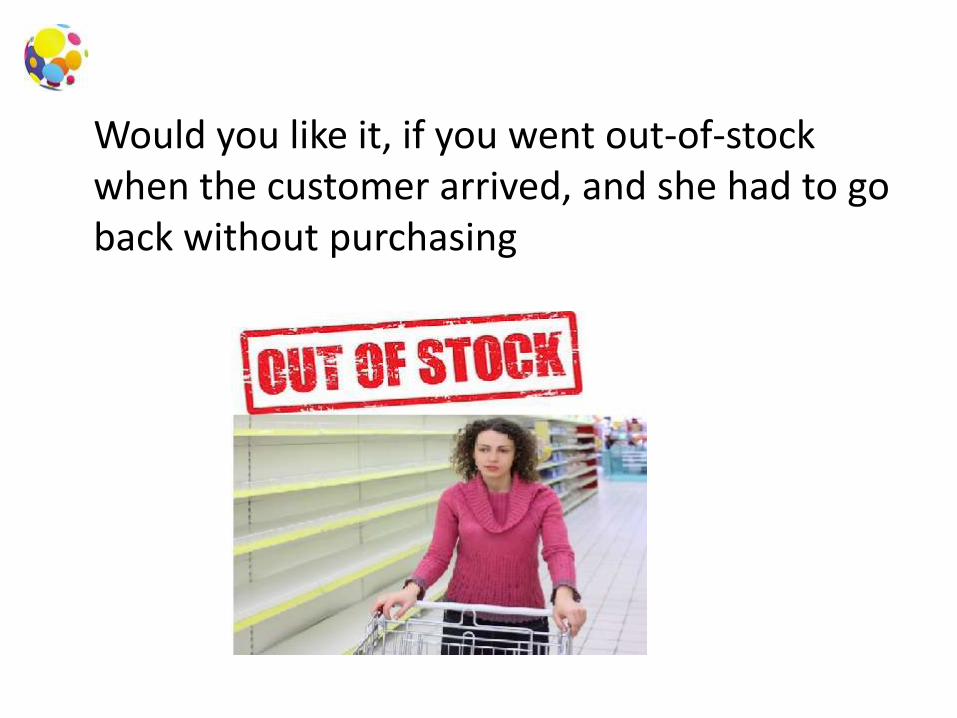
Would you like it, if you went out-of-stock when the customer arrived, and she had to go back without purchasing
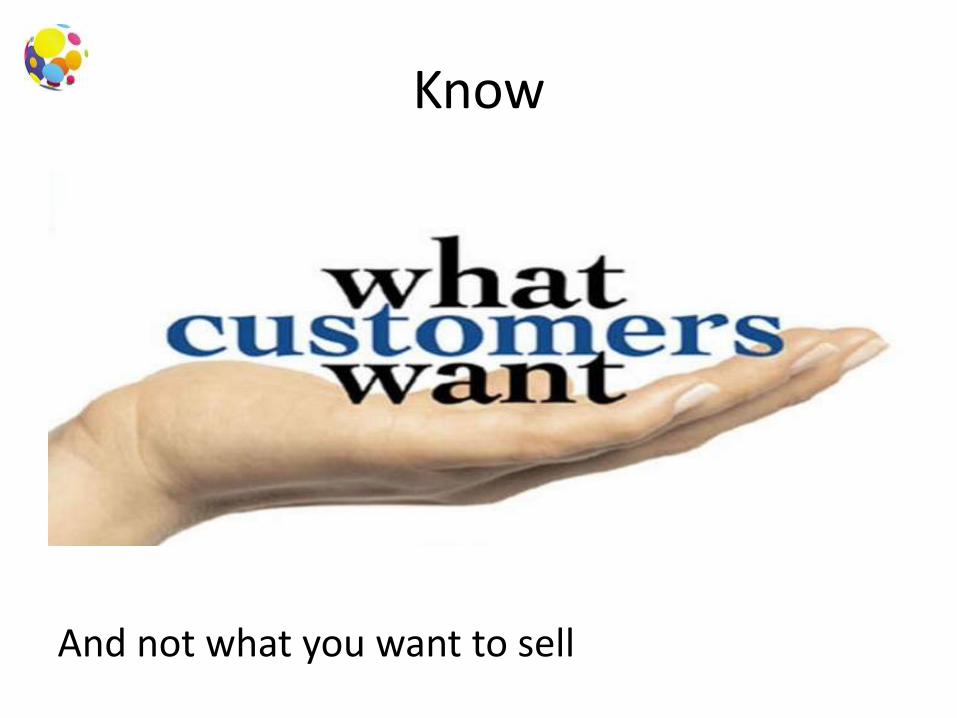
Know
And not what you want to sell
Data Analysis will help you
• Never to go out-of-stock for in-demand products
• Never buy and stock too much of which is not in demand
• And always have control of inventories
Data Analysis will help identify
• Top selling Products
• Top profit-making products
• Loss making products, if any
• Doing this will help you re-arrange your marketing strategies to focus more on the profitable options.
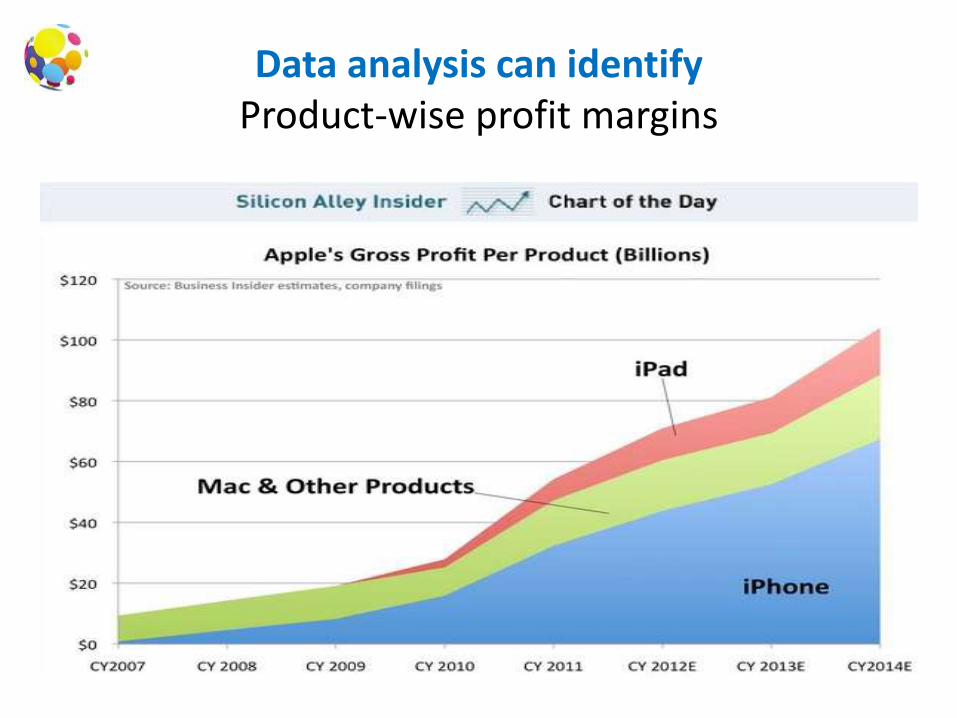
Data analysis can identifyProduct-wise profit margins
Customer experience
• You went to a showroom, and no one came to greet you immediately, or
• If their product knowledge was poor, or
• If the showroom itself was not appealing?
• Would you like to visit such a place once again?
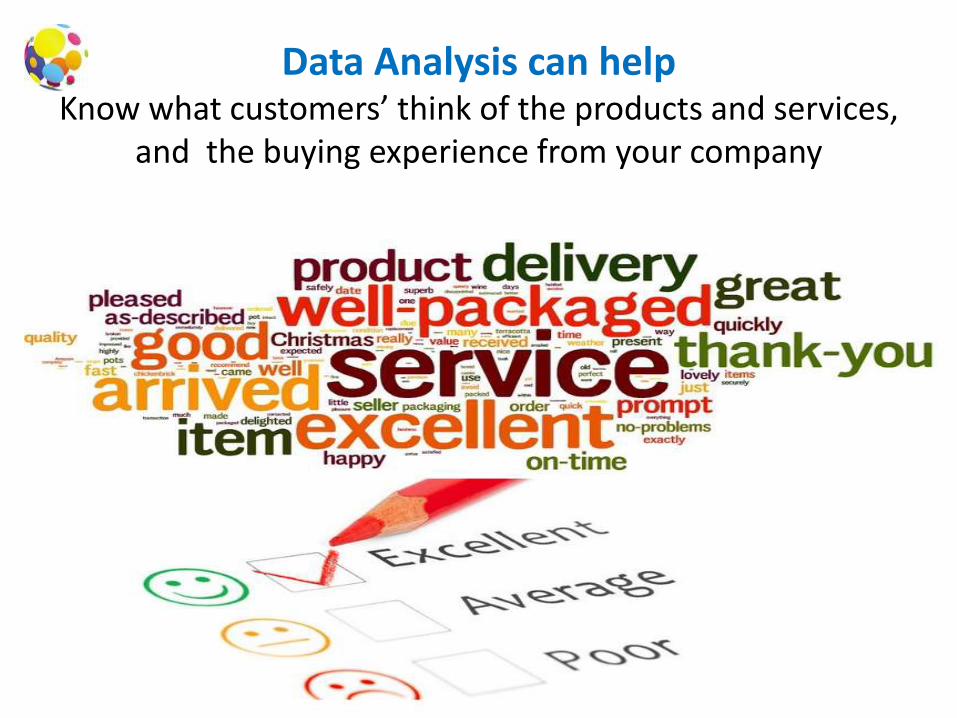
Data Analysis can helpKnow what customers’ think of the products and services,
and the buying experience from your company
If
• a 5 star hotel
• a hospital
• retail store
• a car showroom
• a service center
• a hospital
• Or any other business
knew what the customers thought of them, they could do so much to enhance their buying experience.
And thereby increase the profits.
Data Analysis can help your business in a wide range of areas
• Tracking Profits – YoY and QoQ
• Revenue - YoY and QoQ
• Returning customers
• Branch performance tracking
• Revenue to expenses tracking - YoY and QoQ
• Forecasting
• Plant & Machinery – Usage, downtime and revenue generated
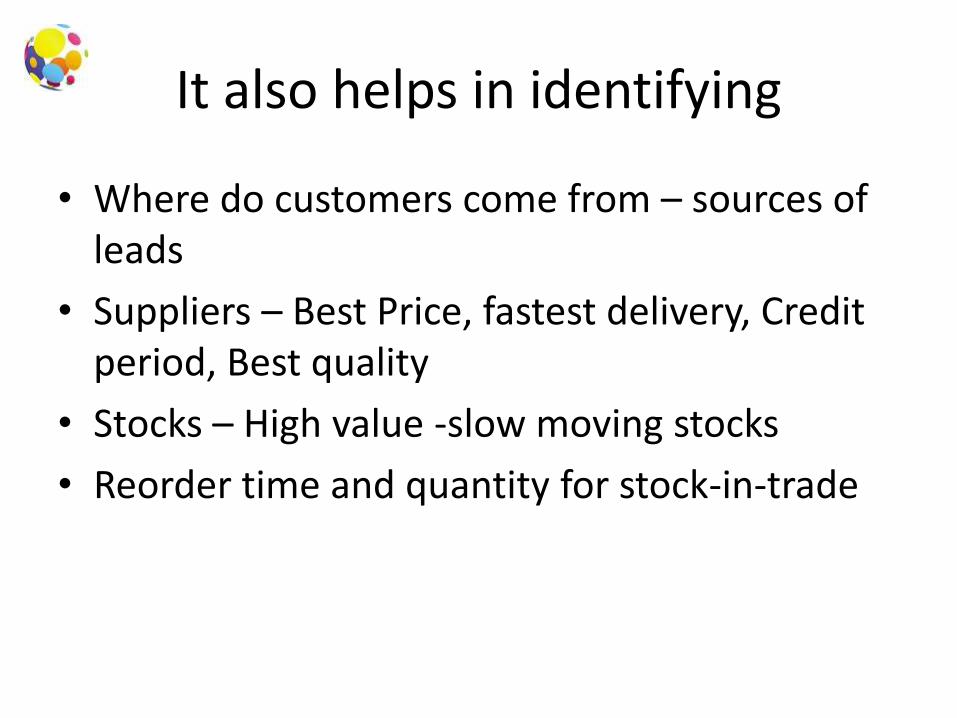
It also helps in identifying
• Where do customers come from – sources of leads
• Suppliers – Best Price, fastest delivery, Credit period, Best quality
• Stocks – High value -slow moving stocks
• Reorder time and quantity for stock-in-trade
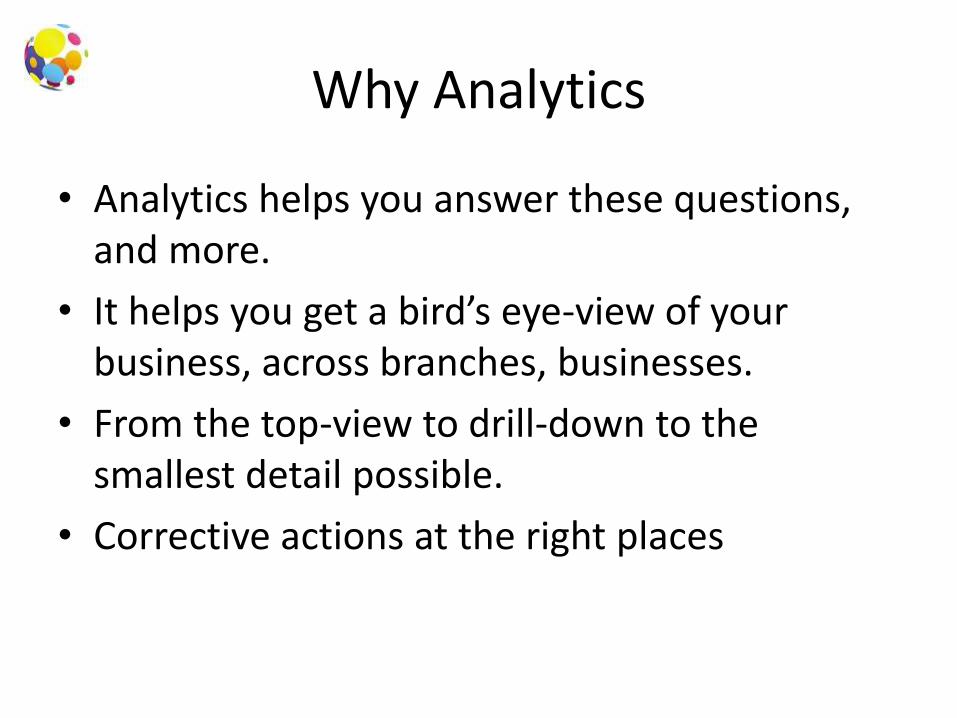
Why Analytics
• Analytics helps you answer these questions, and more.
• It helps you get a bird’s eye-view of your business, across branches, businesses.
• From the top-view to drill-down to the smallest detail possible.
• Corrective actions at the right places
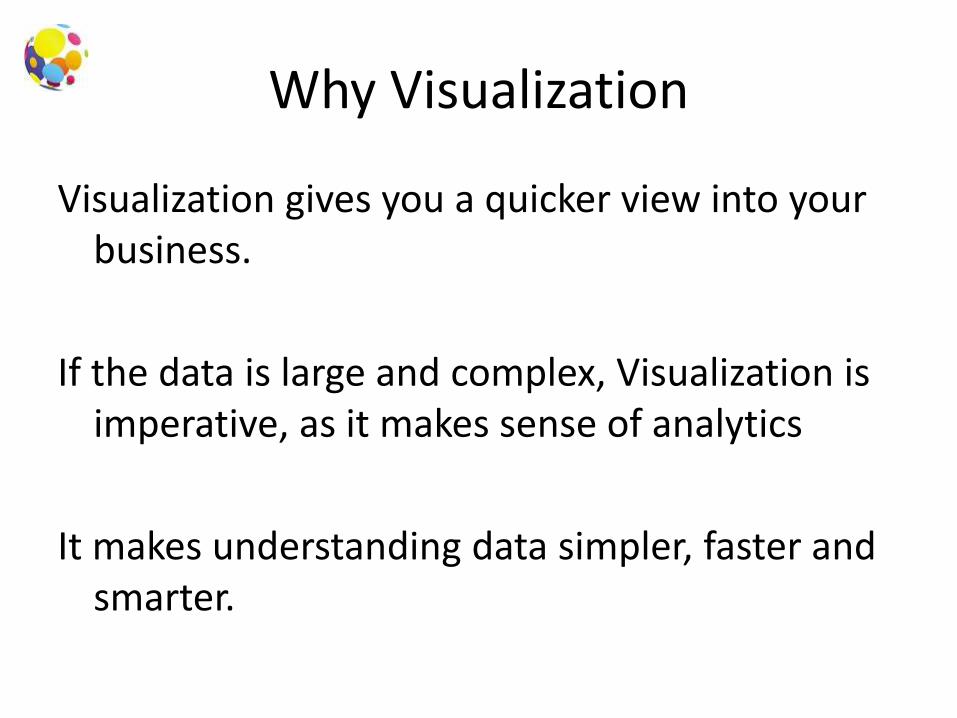
Why Visualization
Visualization gives you a quicker view into your business.
If the data is large and complex, Visualization is imperative, as it makes sense of analytics
It makes understanding data simpler, faster and smarter.
Successful analytics should lead to higher Return-on-investment and
better decision making

Thank you