Embed Size (px)
Citation preview
Franchises and Fascias: Who is leading the way in the world of food retailing? How do Symbol Fascias stack up versus the bigger players…….
© Harris Interactive
The study results disclosed in this report may not be used for advertising, marketing, or promotional purposes without the prior written consent of Harris Interactive. Products and brand names are trademarks or registered trademarks of their respective owners.
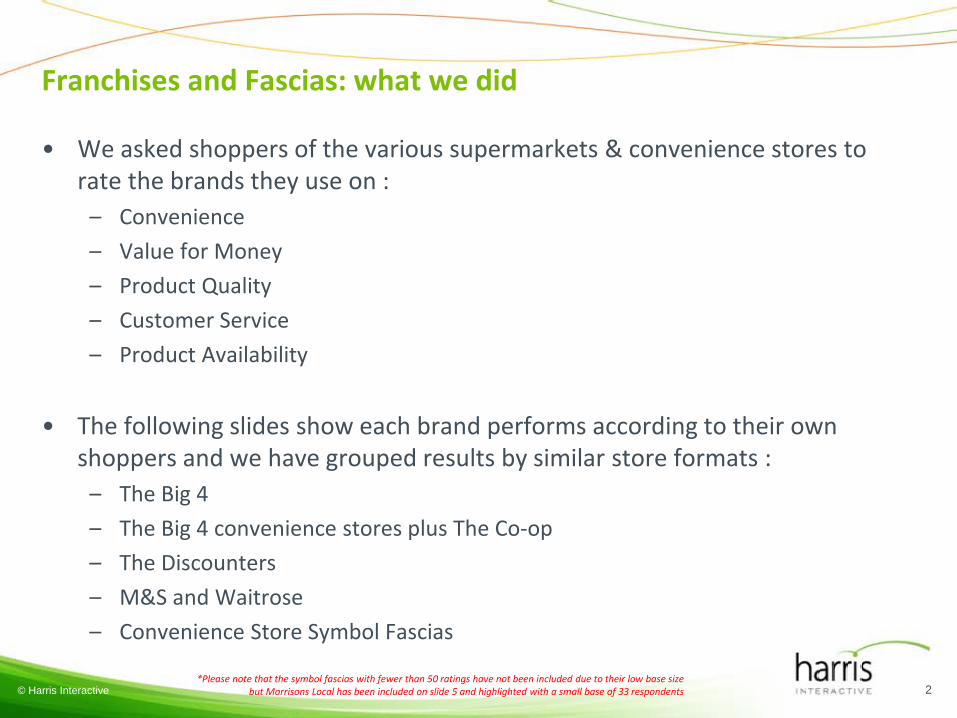
Franchises and Fascias: what we did
• We asked shoppers of the various supermarkets & convenience stores to rate the brands they use on :
– Convenience– Value for Money– Product Quality– Customer Service– Product Availability
• The following slides show each brand performs according to their own shoppers and we have grouped results by similar store formats :
– The Big 4– The Big 4 convenience stores plus The Co-op– The Discounters– M&S and Waitrose– Convenience Store Symbol Fascias
© Harris Interactive 2*Please note that the symbol fascias with fewer than 50 ratings have not been included due to their low base size
but Morrisons Local has been included on slide 5 and highlighted with a small base of 33 respondents
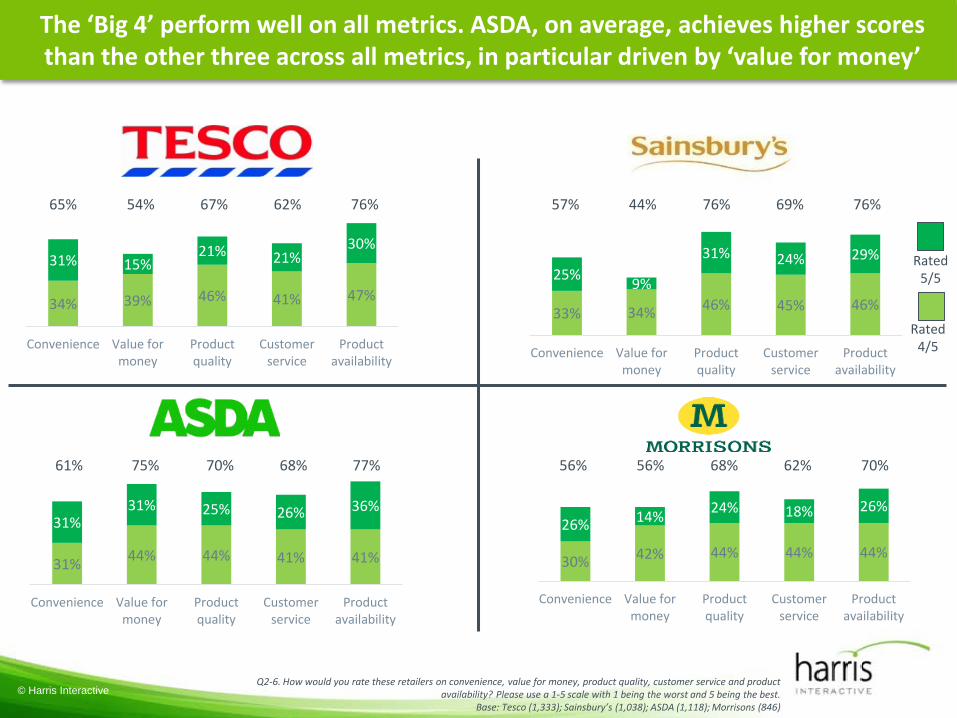
© Harris InteractiveQ2-6. How would you rate these retailers on convenience, value for money, product quality, customer service and product
availability? Please use a 1-5 scale with 1 being the worst and 5 being the best.Base: Tesco (1,333); Sainsbury’s (1,038); ASDA (1,118); Morrisons (846)
The ‘Big 4’ perform well on all metrics. ASDA, on average, achieves higher scores than the other three across all metrics, in particular driven by ‘value for money’
34% 39% 46% 41% 47%
31% 15%21% 21%
30%
Convenience Value formoney
Productquality
Customerservice
Productavailability
Rated 5/5
Rated 4/5
31% 44% 44% 41% 41%
31%31% 25% 26% 36%
Convenience Value formoney
Productquality
Customerservice
Productavailability
30% 42% 44% 44% 44%
26% 14% 24% 18% 26%
Convenience Value formoney
Productquality
Customerservice
Productavailability
33% 34% 46% 45% 46%
25% 9%
31% 24% 29%
Convenience Value formoney
Productquality
Customerservice
Productavailability
65%
56%75%61%
57%76%
70%77%
76%62%
62%68%
69%67%
68%70%
76%54%
56%
44%
27% 18%40% 37% 28%
34%
4%
16% 15%11%
Convenience Value formoney
Productquality
Customerservice
Productavailability
© Harris InteractiveQ2-6. How would you rate these retailers on convenience, value for money, product quality, customer service and product
availability? Please use a 1-5 scale with 1 being the worst and 5 being the best.Base: Tesco Express/Metro (449); Sainsbury’s Local (239); M Local (33)* CAUTION low base; The Co-operative Food (626)
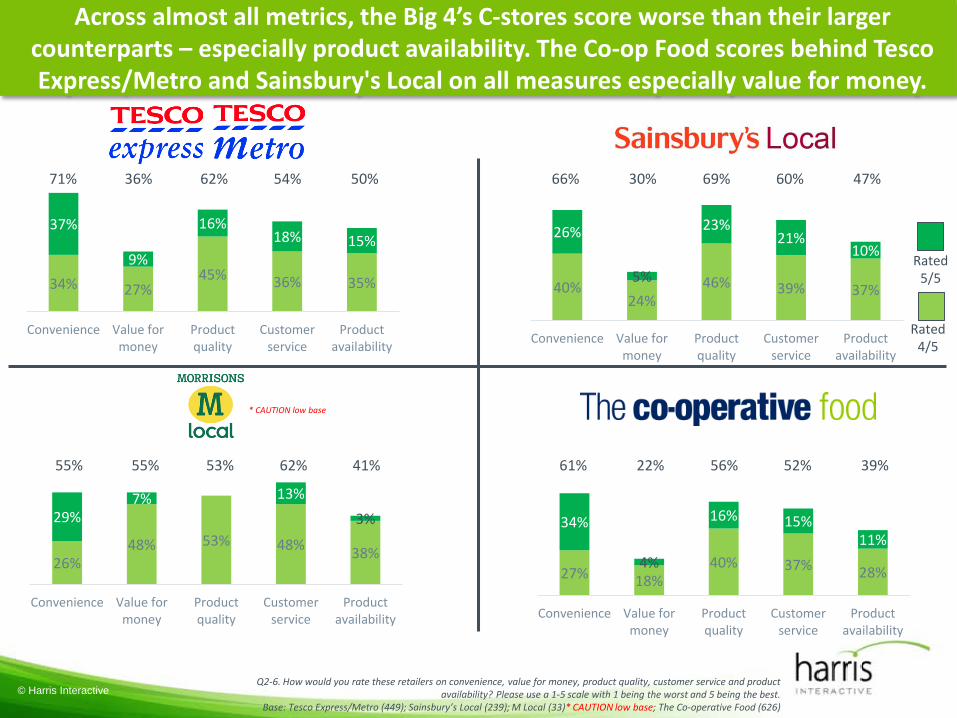
Across almost all metrics, the Big 4’s C-stores score worse than their larger counterparts – especially product availability. The Co-op Food scores behind Tesco Express/Metro and Sainsbury's Local on all measures especially value for money.
34% 27%45% 36% 35%
37%
9%
16%18% 15%
Convenience Value formoney
Productquality
Customerservice
Productavailability
26%48% 53% 48% 38%
29%7% 13%
3%
Convenience Value formoney
Productquality
Customerservice
Productavailability
40%24%
46% 39% 37%
26%
5%
23%21%
10%
Convenience Value formoney
Productquality
Customerservice
Productavailability
71%
61%55%55%
66%50%
39%41%
47%54%
52%62%
60%62%
56%53%
69%36%
22%
30%
Rated 5/5
Rated 4/5
* CAUTION low base
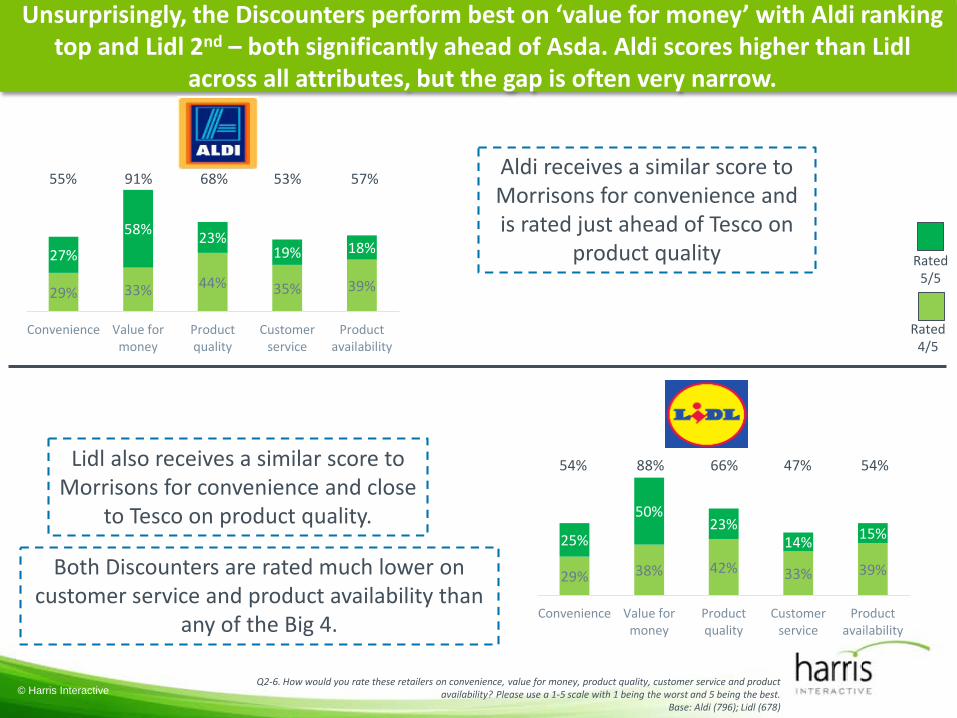
29% 33% 44% 35% 39%
27%
58% 23%19% 18%
Convenience Value formoney
Productquality
Customerservice
Productavailability
29% 38% 42% 33% 39%
25%
50%23%
14% 15%
Convenience Value formoney
Productquality
Customerservice
Productavailability
© Harris InteractiveQ2-6. How would you rate these retailers on convenience, value for money, product quality, customer service and product
availability? Please use a 1-5 scale with 1 being the worst and 5 being the best.Base: Aldi (796); Lidl (678)
Unsurprisingly, the Discounters perform best on ‘value for money’ with Aldi ranking top and Lidl 2nd – both significantly ahead of Asda. Aldi scores higher than Lidl
across all attributes, but the gap is often very narrow.
55%
54%
57%
54%
53%
47%
68%
66%
91%
88%Lidl also receives a similar score to Morrisons for convenience and close
to Tesco on product quality.
Aldi receives a similar score to Morrisons for convenience and is rated just ahead of Tesco on
product quality Rated 5/5
Rated 4/5
Both Discounters are rated much lower on customer service and product availability than
any of the Big 4.
34% 24% 30% 32%48%
21%8%
60% 47% 26%
Convenience Value formoney
Productquality
Customerservice
Productavailability
33% 23% 24%41% 42%
10%6%
67% 37% 25%
Convenience Value formoney
Productquality
Customerservice
Productavailability
© Harris InteractiveQ2-6. How would you rate these retailers on convenience, value for money, product quality, customer service and product
availability? Please use a 1-5 scale with 1 being the worst and 5 being the best.Base: M&S (542); Waitrose/Little Waitrose (287)
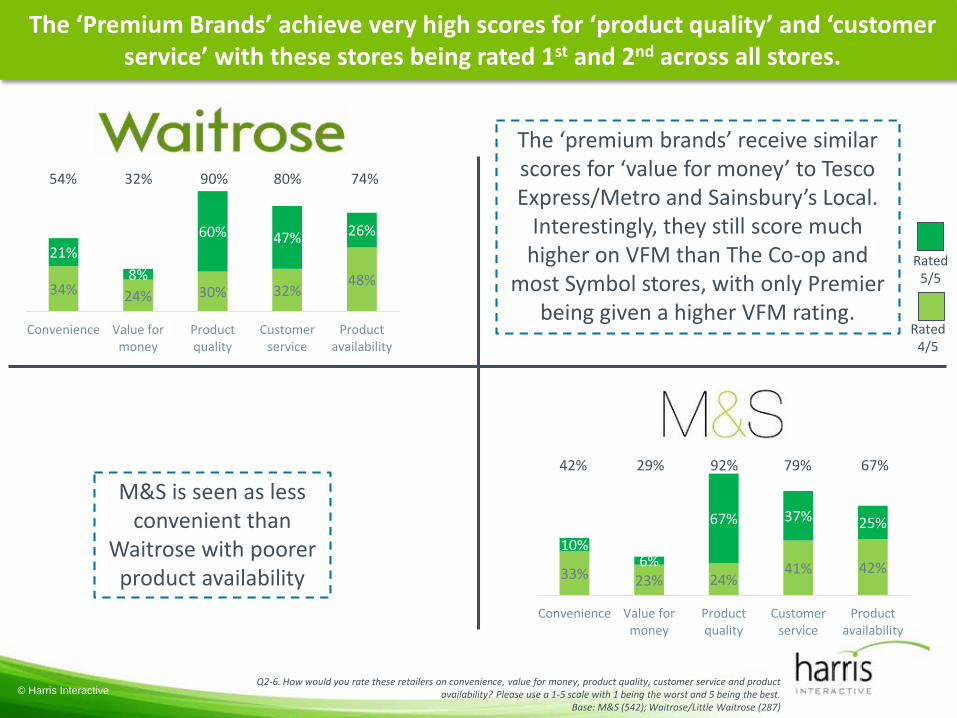
The ‘Premium Brands’ achieve very high scores for ‘product quality’ and ‘customer service’ with these stores being rated 1st and 2nd across all stores.
54%
42%
74%
67%79%
90%
92%
32%
29%
M&S is seen as less convenient than
Waitrose with poorer product availability
The ‘premium brands’ receive similar scores for ‘value for money’ to Tesco Express/Metro and Sainsbury’s Local.
Interestingly, they still score much higher on VFM than The Co-op and
most Symbol stores, with only Premier being given a higher VFM rating.
80%
Rated 5/5
Rated 4/5
42%26% 23%
38% 33%
31%
4% 7%
9% 8%
Convenience Value formoney
Productquality
Customerservice
Productavailability
© Harris InteractiveQ2-6. How would you rate these retailers on convenience, value for money, product quality, customer service and product
availability? Please use a 1-5 scale with 1 being the worst and 5 being the best.Base: Spar (137); Costcutter (67); Londis (51)
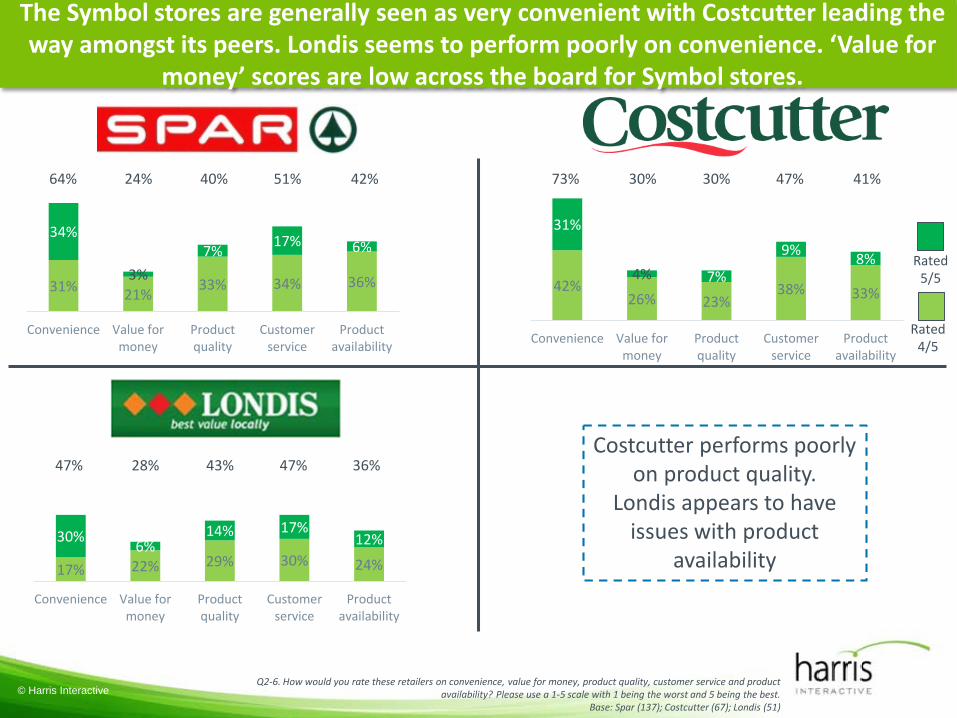
The Symbol stores are generally seen as very convenient with Costcutter leading the way amongst its peers. Londis seems to perform poorly on convenience. ‘Value for
money’ scores are low across the board for Symbol stores.
31% 21% 33% 34% 36%
34%
3%7% 17% 6%
Convenience Value formoney
Productquality
Customerservice
Productavailability
17% 22% 29% 30% 24%
30% 6%14% 17%
12%
Convenience Value formoney
Productquality
Customerservice
Productavailability
64%
28%47%
73%42%
36%
41%51%
47%
47%40%
43%
30%24% 30%
Costcutter performs poorly on product quality.
Londis appears to have issues with product
availability
Rated 5/5
Rated 4/5
© Harris InteractiveQ2-6. How would you rate these retailers on convenience, value for money, product quality, customer service and product
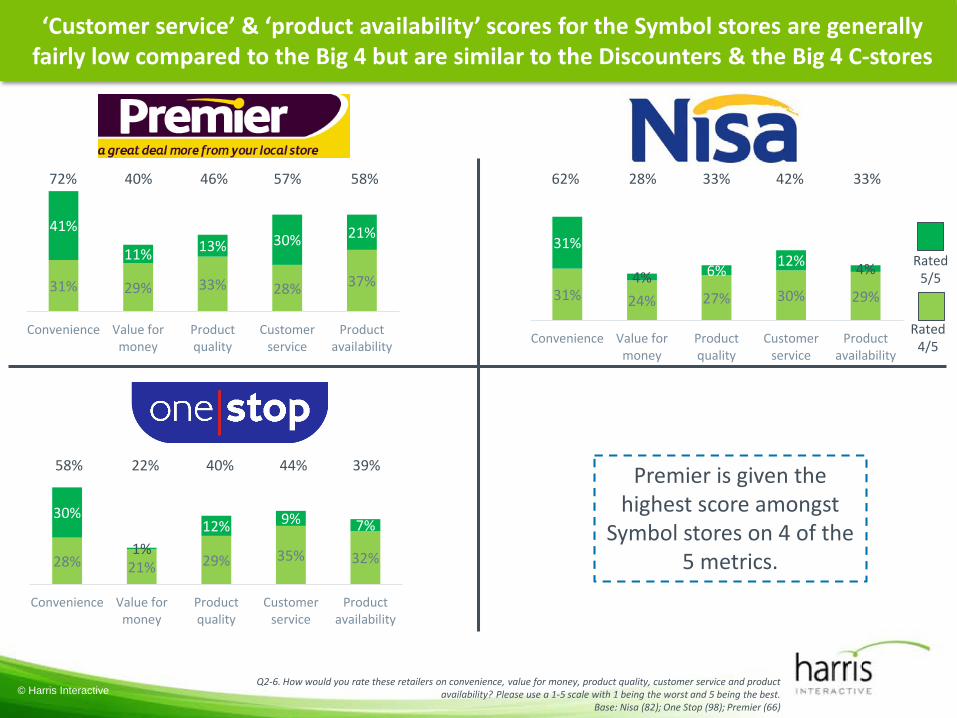
availability? Please use a 1-5 scale with 1 being the worst and 5 being the best.Base: Nisa (82); One Stop (98); Premier (66)
‘Customer service’ & ‘product availability’ scores for the Symbol stores are generally fairly low compared to the Big 4 but are similar to the Discounters & the Big 4 C-stores
31% 29% 33% 28% 37%
41%
11% 13% 30% 21%
Convenience Value formoney
Productquality
Customerservice
Productavailability
28% 21% 29% 35% 32%
30%
1%12% 9% 7%
Convenience Value formoney
Productquality
Customerservice
Productavailability
31% 24% 27% 30% 29%
31%
4% 6% 12% 4%
Convenience Value formoney
Productquality
Customerservice
Productavailability
72%
22%58%
62%58%
39%
33%57%
44%
42%46%
40%
33%40% 28%
Premier is given the highest score amongst
Symbol stores on 4 of the 5 metrics.
Rated 5/5
Rated 4/5
Summary of Performance
10© Harris Interactive
© Harris Interactive 11
1st 2nd 3rd
Convenience
Value for money
Product quality
Customer service
Product availability
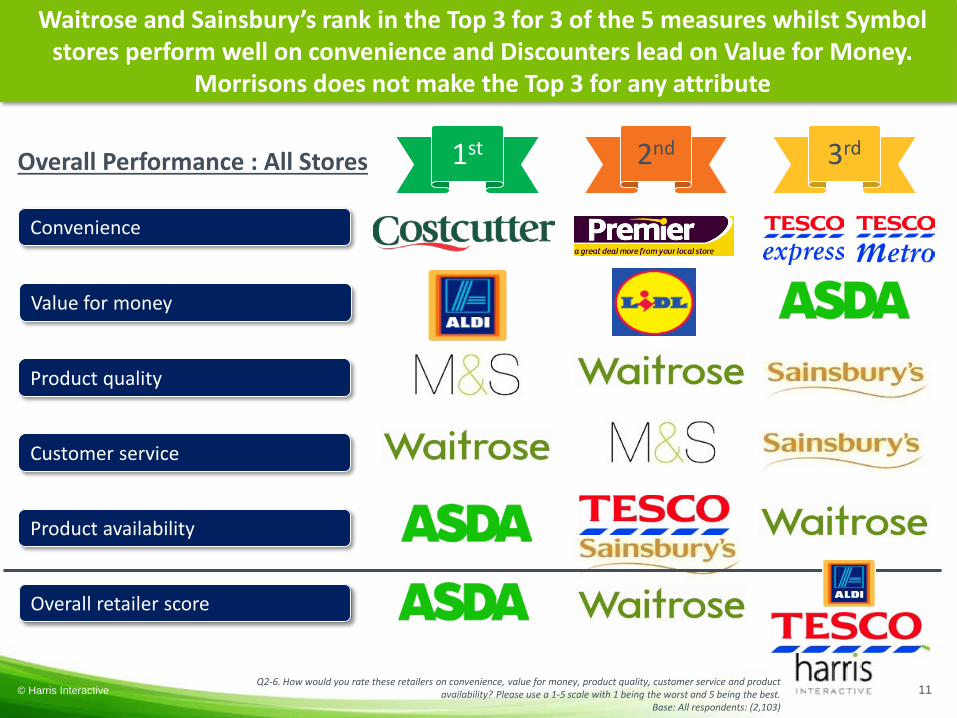
Q2-6. How would you rate these retailers on convenience, value for money, product quality, customer service and product availability? Please use a 1-5 scale with 1 being the worst and 5 being the best.
Base: All respondents: (2,103)
Waitrose and Sainsbury’s rank in the Top 3 for 3 of the 5 measures whilst Symbol stores perform well on convenience and Discounters lead on Value for Money.
Morrisons does not make the Top 3 for any attribute
Overall retailer score
Overall Performance : All Stores
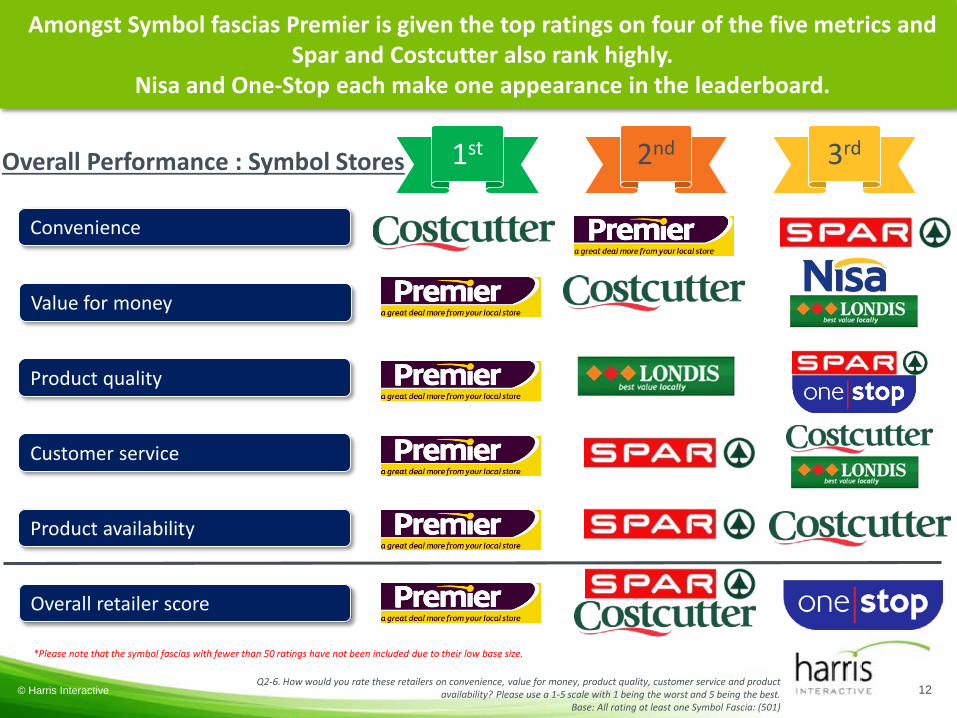
© Harris Interactive 12
1st 2nd 3rd
Convenience
Value for money
Product quality
Customer service
Product availability
Q2-6. How would you rate these retailers on convenience, value for money, product quality, customer service and product availability? Please use a 1-5 scale with 1 being the worst and 5 being the best.
Base: All rating at least one Symbol Fascia: (501)
Amongst Symbol fascias Premier is given the top ratings on four of the five metrics and Spar and Costcutter also rank highly.
Nisa and One-Stop each make one appearance in the leaderboard.
Overall retailer score
*Please note that the symbol fascias with fewer than 50 ratings have not been included due to their low base size.
Overall Performance : Symbol Stores
Appendix –Approach & Demographics
13© Harris Interactive
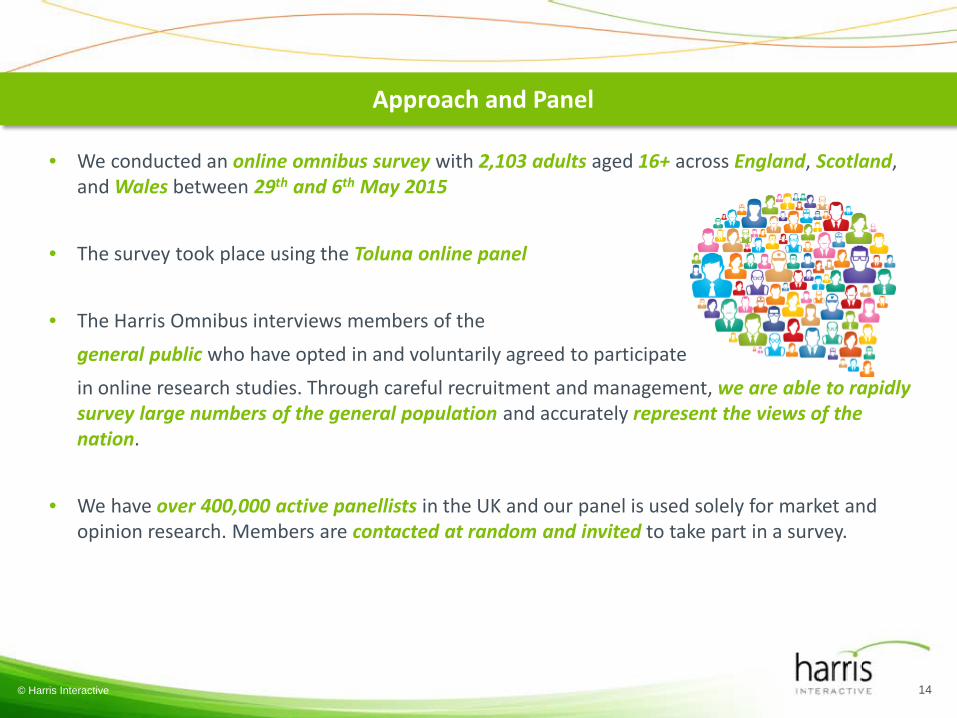
• We conducted an online omnibus survey with 2,103 adults aged 16+ across England, Scotland, and Wales between 29th and 6th May 2015
• The survey took place using the Toluna online panel
• The Harris Omnibus interviews members of the general public who have opted in and voluntarily agreed to participate in online research studies. Through careful recruitment and management, we are able to rapidly survey large numbers of the general population and accurately represent the views of the nation.
• We have over 400,000 active panellists in the UK and our panel is used solely for market and opinion research. Members are contacted at random and invited to take part in a survey.
Approach and Panel
© Harris Interactive 14
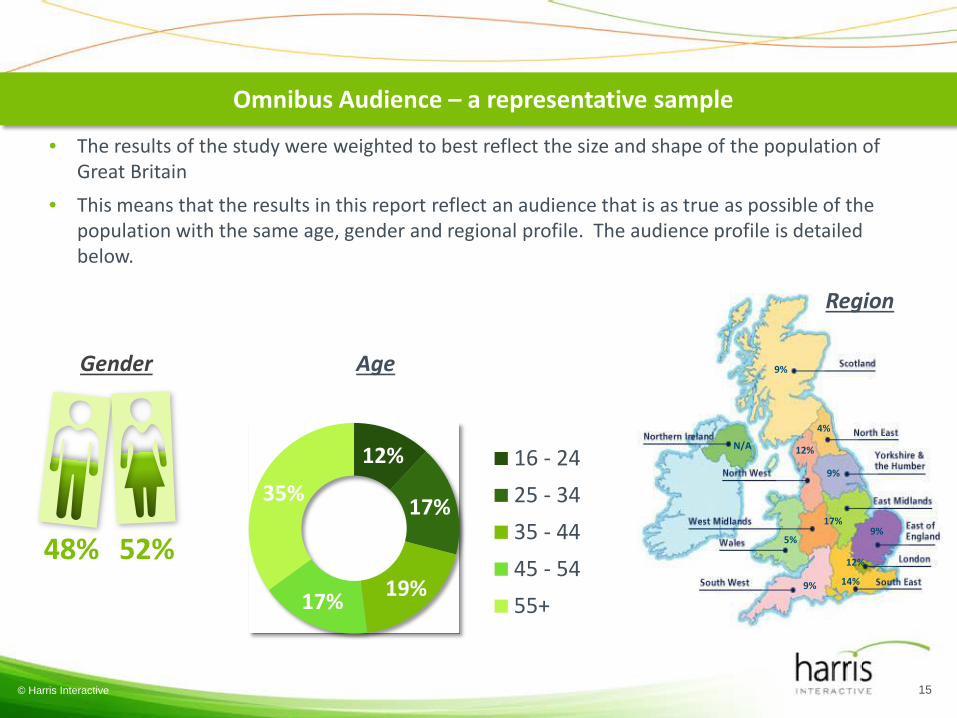
Omnibus Audience – a representative sample
12%
9%
4%
9%
9%17%
9%
5%
14%
12%
© Harris Interactive 15
• The results of the study were weighted to best reflect the size and shape of the population of Great Britain
• This means that the results in this report reflect an audience that is as true as possible of the population with the same age, gender and regional profile. The audience profile is detailed below.
N/A
Gender Age
Region
48% 52%
12%
17%
19%17%
35%16 - 2425 - 3435 - 4445 - 5455+
Lucia Juliano | Head of Consumer & Retail Research | [email protected] 89 39 22 51 | 0161 242 1365 | 0161 242 1360
For Further Information please contact :
© Harris Interactive