Embed Size (px)
Citation preview
1
CHAPTER - 1
INTRODUCTION
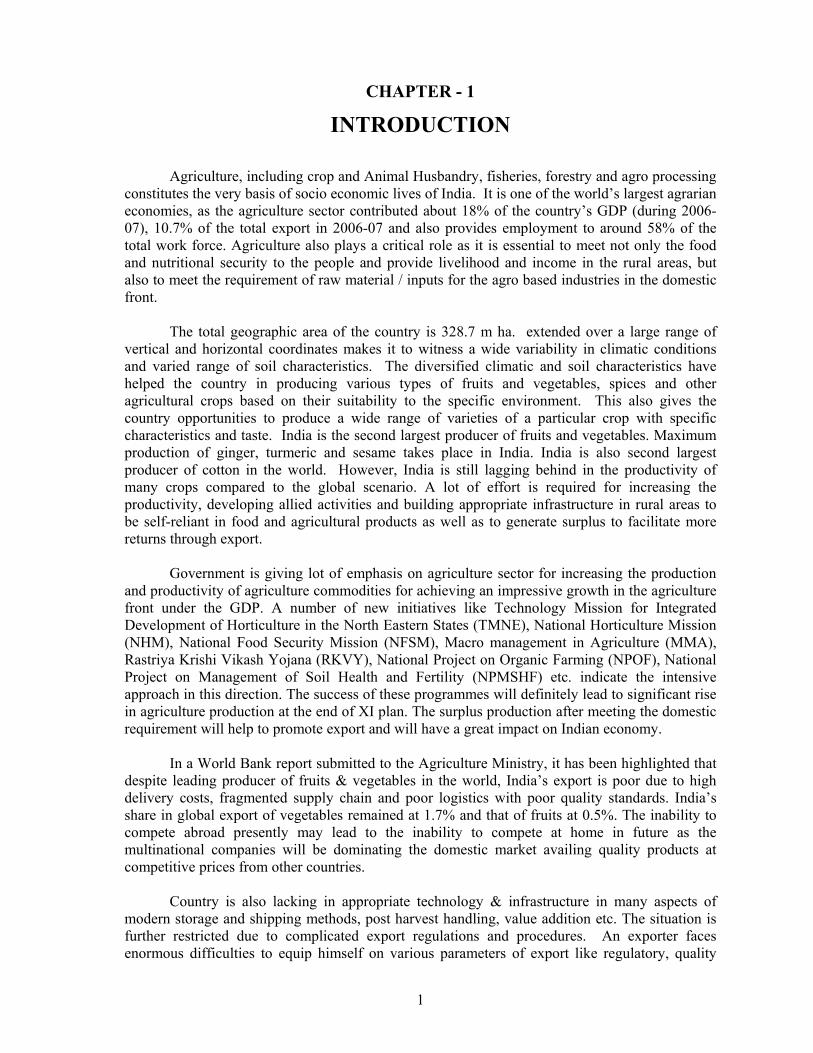
Agriculture, including crop and Animal Husbandry, fisheries, forestry and agro processing constitutes the very basis of socio economic lives of India. It is one of the world’s largest agrarian economies, as the agriculture sector contributed about 18% of the country’s GDP (during 2006-07), 10.7% of the total export in 2006-07 and also provides employment to around 58% of the total work force. Agriculture also plays a critical role as it is essential to meet not only the food and nutritional security to the people and provide livelihood and income in the rural areas, but also to meet the requirement of raw material / inputs for the agro based industries in the domestic front.
The total geographic area of the country is 328.7 m ha. extended over a large range of vertical and horizontal coordinates makes it to witness a wide variability in climatic conditions and varied range of soil characteristics. The diversified climatic and soil characteristics have helped the country in producing various types of fruits and vegetables, spices and other agricultural crops based on their suitability to the specific environment. This also gives the country opportunities to produce a wide range of varieties of a particular crop with specific characteristics and taste. India is the second largest producer of fruits and vegetables. Maximum production of ginger, turmeric and sesame takes place in India. India is also second largest producer of cotton in the world. However, India is still lagging behind in the productivity of many crops compared to the global scenario. A lot of effort is required for increasing the productivity, developing allied activities and building appropriate infrastructure in rural areas to be self-reliant in food and agricultural products as well as to generate surplus to facilitate more returns through export.
Government is giving lot of emphasis on agriculture sector for increasing the production and productivity of agriculture commodities for achieving an impressive growth in the agriculture front under the GDP. A number of new initiatives like Technology Mission for Integrated Development of Horticulture in the North Eastern States (TMNE), National Horticulture Mission (NHM), National Food Security Mission (NFSM), Macro management in Agriculture (MMA), Rastriya Krishi Vikash Yojana (RKVY), National Project on Organic Farming (NPOF), National Project on Management of Soil Health and Fertility (NPMSHF) etc. indicate the intensive approach in this direction. The success of these programmes will definitely lead to significant rise in agriculture production at the end of XI plan. The surplus production after meeting the domestic requirement will help to promote export and will have a great impact on Indian economy.
In a World Bank report submitted to the Agriculture Ministry, it has been highlighted that despite leading producer of fruits & vegetables in the world, India’s export is poor due to high delivery costs, fragmented supply chain and poor logistics with poor quality standards. India’s share in global export of vegetables remained at 1.7% and that of fruits at 0.5%. The inability to compete abroad presently may lead to the inability to compete at home in future as the multinational companies will be dominating the domestic market availing quality products at competitive prices from other countries.
Country is also lacking in appropriate technology & infrastructure in many aspects of modern storage and shipping methods, post harvest handling, value addition etc. The situation is further restricted due to complicated export regulations and procedures. An exporter faces enormous difficulties to equip himself on various parameters of export like regulatory, quality
2
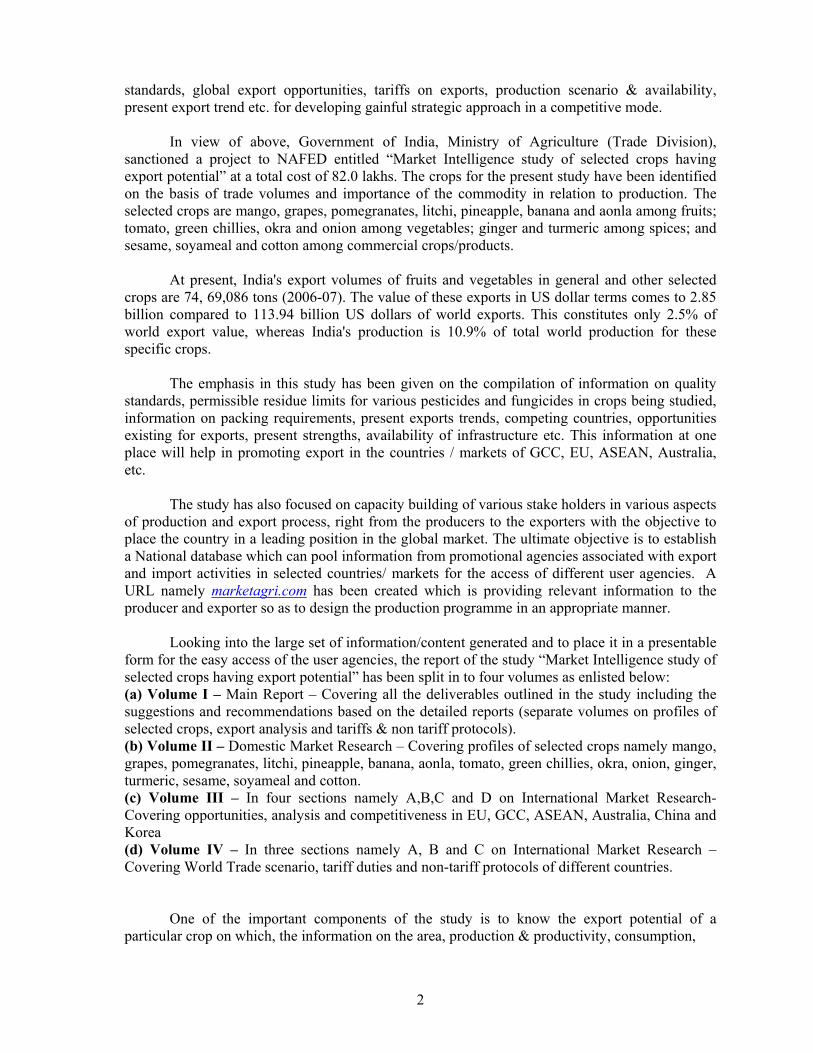
standards, global export opportunities, tariffs on exports, production scenario & availability, present export trend etc. for developing gainful strategic approach in a competitive mode.
In view of above, Government of India, Ministry of Agriculture (Trade Division),
sanctioned a project to NAFED entitled “Market Intelligence study of selected crops having export potential” at a total cost of 82.0 lakhs. The crops for the present study have been identified on the basis of trade volumes and importance of the commodity in relation to production. The selected crops are mango, grapes, pomegranates, litchi, pineapple, banana and aonla among fruits; tomato, green chillies, okra and onion among vegetables; ginger and turmeric among spices; and sesame, soyameal and cotton among commercial crops/products.
At present, India's export volumes of fruits and vegetables in general and other selected crops are 74, 69,086 tons (2006-07). The value of these exports in US dollar terms comes to 2.85 billion compared to 113.94 billion US dollars of world exports. This constitutes only 2.5% of world export value, whereas India's production is 10.9% of total world production for these specific crops.
The emphasis in this study has been given on the compilation of information on quality standards, permissible residue limits for various pesticides and fungicides in crops being studied, information on packing requirements, present exports trends, competing countries, opportunities existing for exports, present strengths, availability of infrastructure etc. This information at one place will help in promoting export in the countries / markets of GCC, EU, ASEAN, Australia, etc.
The study has also focused on capacity building of various stake holders in various aspects of production and export process, right from the producers to the exporters with the objective to place the country in a leading position in the global market. The ultimate objective is to establish a National database which can pool information from promotional agencies associated with export and import activities in selected countries/ markets for the access of different user agencies. A URL namely marketagri.com has been created which is providing relevant information to the producer and exporter so as to design the production programme in an appropriate manner.
Looking into the large set of information/content generated and to place it in a presentable form for the easy access of the user agencies, the report of the study “Market Intelligence study of selected crops having export potential” has been split in to four volumes as enlisted below: (a) Volume I – Main Report – Covering all the deliverables outlined in the study including the suggestions and recommendations based on the detailed reports (separate volumes on profiles of selected crops, export analysis and tariffs & non tariff protocols). (b) Volume II – Domestic Market Research – Covering profiles of selected crops namely mango, grapes, pomegranates, litchi, pineapple, banana, aonla, tomato, green chillies, okra, onion, ginger, turmeric, sesame, soyameal and cotton. (c) Volume III – In four sections namely A,B,C and D on International Market Research- Covering opportunities, analysis and competitiveness in EU, GCC, ASEAN, Australia, China and Korea (d) Volume IV – In three sections namely A, B and C on International Market Research – Covering World Trade scenario, tariff duties and non-tariff protocols of different countries.
One of the important components of the study is to know the export potential of a particular crop on which, the information on the area, production & productivity, consumption,
3
post harvest losses procuring markets and surplus production is pre-requisite. Therefore, domestic market research was conducted on fruits (mango, grapes, pomegranate, pineapple, litchi, banana & aonla) vegetables (onion, tomato, okra and green chilly), spices (ginger and turmeric), sesame seeds, soyameal and cotton.
Information, thus collected, has been incorporated in various crop profiles. These profiles essentially provide information on production, local consumption, procurement, various aspects of marketing and export. These profiles are first of kind write-ups on these crops having commercial angle.
The information collected on the crops mentioned above is primarily on acreage under cultivation, total production and productivity per hectare area, area under crop in different states, production and productivity there in, description of few export worthy varieties, harvesting season, arrival pattern in markets etc. Also in this collected information are details of concentrated pockets of cultivation and catchment areas of markets and Mandies.
In addition, the information on Agmark, description of grades and standards, packaging
for export, export and export potential (including domestic strengths and measures for enhancing exports), prices prevailing in international markets, procurement prices, storage details, documents required for exports, chain of events from harvest to shipment, expenses likely to be incurred on post-harvest handling, treatment, transport to port and freight charges ( by air or sea as the case may be) have also been given in the profiles.
In nutshell, profiles contain all the information required for export purposes. The crop profiles have been prepared for following commodities: (a) Fruits
• Mango • Grapes • Pomegranate • Pineapple • Litchi • Banana • Aonla.
(b) Vegetables
• Onion • Tomato • Okra • Green Chilly.
(c) Spices
• Ginger • Turmeric
(d) Commercial crops
• Sesame seeds • Soyameal • Cotton.
4
CHAPTER- 2
MANGO
1. Introduction
Mango (Mangifera indica Linn) is the most important fruit of India and is known as “King of fruits”. The fruit is cultivated in the largest area i.e. 2,021 thousand ha and the production is around 12.5 million tons, contributing 40.1% of the total world production of mango. The main mango producing states in India are Andhra Pradesh (25%), Uttar Pradesh (21%), Karnataka (9.8%), Bihar (9.7%), Gujarat (6.1%) and Maharashtra (5.09%)
Total export of mangoes from India is 79.06 thousand tons, valuing Rs. 141.9 crores during 2006-07. India exports mango to over 50 countries worldwide. India’s exports to UAE, Saudi Arabia, Qatar, Bahrain, UK, Kuwait, Singapore, Malaysia and Bangladesh together account for 97% of total exports of fresh mangoes from India.
World scenario
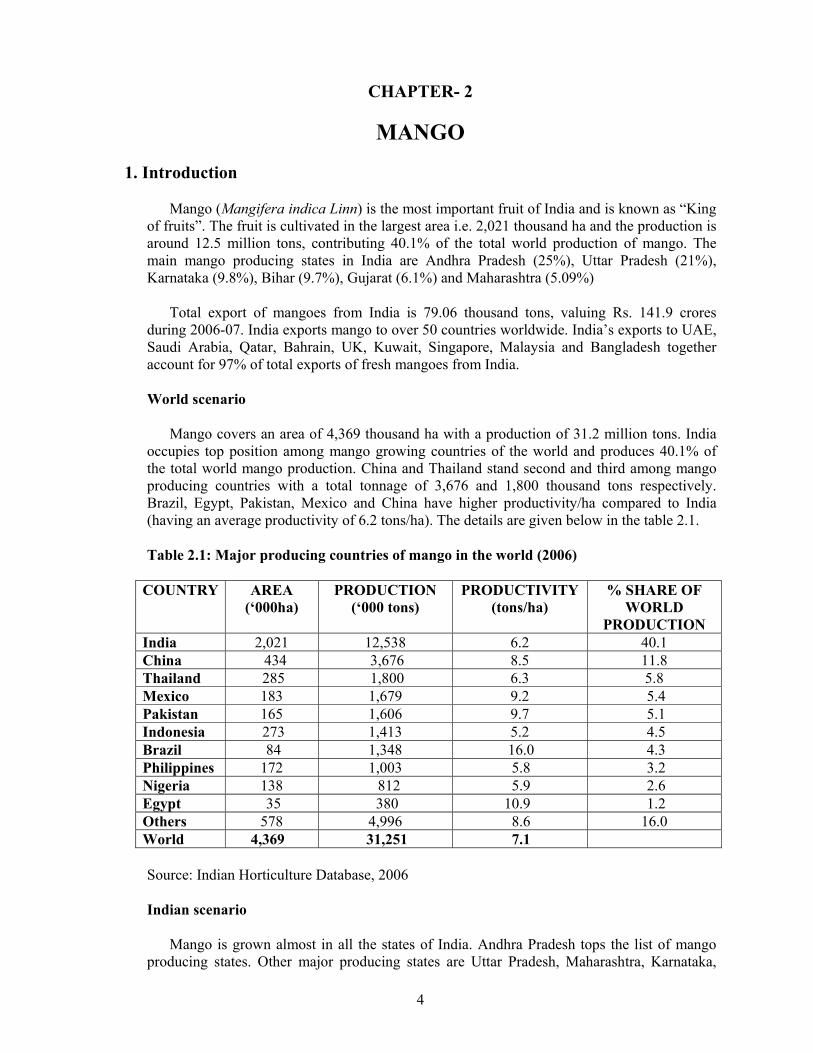
Mango covers an area of 4,369 thousand ha with a production of 31.2 million tons. India occupies top position among mango growing countries of the world and produces 40.1% of the total world mango production. China and Thailand stand second and third among mango producing countries with a total tonnage of 3,676 and 1,800 thousand tons respectively. Brazil, Egypt, Pakistan, Mexico and China have higher productivity/ha compared to India (having an average productivity of 6.2 tons/ha). The details are given below in the table 2.1.
Table 2.1: Major producing countries of mango in the world (2006)
COUNTRY AREA (‘000ha)
PRODUCTION (‘000 tons)
PRODUCTIVITY (tons/ha)
% SHARE OF WORLD
PRODUCTION India 2,021 12,538 6.2 40.1 China 434 3,676 8.5 11.8 Thailand 285 1,800 6.3 5.8 Mexico 183 1,679 9.2 5.4 Pakistan 165 1,606 9.7 5.1 Indonesia 273 1,413 5.2 4.5 Brazil 84 1,348 16.0 4.3 Philippines 172 1,003 5.8 3.2 Nigeria 138 812 5.9 2.6 Egypt 35 380 10.9 1.2 Others 578 4,996 8.6 16.0 World 4,369 31,251 7.1
Source: Indian Horticulture Database, 2006
Indian scenario
Mango is grown almost in all the states of India. Andhra Pradesh tops the list of mango producing states. Other major producing states are Uttar Pradesh, Maharashtra, Karnataka,
5
Bihar and Gujarat. Rest of the states has quite less production. The details are given below in the table 2.2.
Table 2.2: Showing the area production and productivity of mango in India
YEAR AREA(000’ ha)
PRODUCTION (000’tons)
PRODUCTIVITY (tons/ha)
2001-02 1,575.8 10,020.2 6.4 2002-03 1,623.4 12,733.2 7.8 2003-04 1,906.7 11,490.0 6.0 2004-05 1,970.4 11,829.7 6.0 2005-06 2,020.6 12,537.9 6.2
Source: Indian Horticulture Database, 2006
2. Major producing states with production of last three years
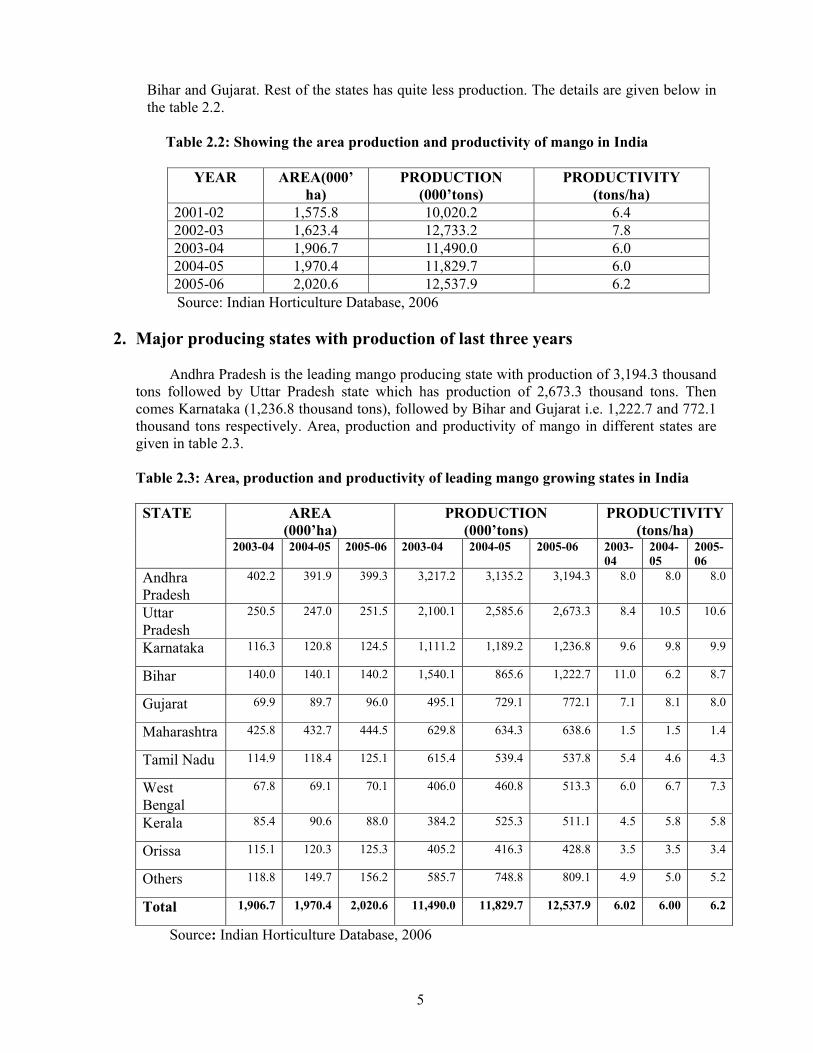
Andhra Pradesh is the leading mango producing state with production of 3,194.3 thousand tons followed by Uttar Pradesh state which has production of 2,673.3 thousand tons. Then comes Karnataka (1,236.8 thousand tons), followed by Bihar and Gujarat i.e. 1,222.7 and 772.1 thousand tons respectively. Area, production and productivity of mango in different states are given in table 2.3.
Table 2.3: Area, production and productivity of leading mango growing states in India
AREA (000’ha)
PRODUCTION (000’tons)
PRODUCTIVITY (tons/ha)
STATE
2003-04
2004-05 2005-06 2003-04 2004-05 2005-06 2003-04
2004-05
2005-06
Andhra Pradesh
402.2 391.9 399.3 3,217.2 3,135.2 3,194.3 8.0 8.0 8.0
Uttar Pradesh
250.5 247.0 251.5 2,100.1 2,585.6 2,673.3 8.4 10.5 10.6
Karnataka 116.3 120.8 124.5 1,111.2 1,189.2 1,236.8 9.6 9.8 9.9
Bihar 140.0 140.1 140.2 1,540.1 865.6 1,222.7 11.0 6.2 8.7
Gujarat 69.9 89.7 96.0 495.1 729.1 772.1 7.1 8.1 8.0
Maharashtra 425.8 432.7 444.5 629.8 634.3 638.6 1.5 1.5 1.4
Tamil Nadu 114.9 118.4 125.1 615.4 539.4 537.8 5.4 4.6 4.3
West Bengal
67.8 69.1 70.1 406.0 460.8 513.3 6.0 6.7 7.3
Kerala 85.4 90.6 88.0 384.2 525.3 511.1 4.5 5.8 5.8
Orissa 115.1 120.3 125.3 405.2 416.3 428.8 3.5 3.5 3.4
Others 118.8 149.7 156.2 585.7 748.8 809.1 4.9 5.0 5.2
Total 1,906.7 1,970.4 2,020.6 11,490.0 11,829.7 12,537.9 6.02 6.00 6.2
Source: Indian Horticulture Database, 2006
6
3. Description of commercially grown varieties
There are near about 30 varieties of mangoes which are grown commercially. Some of the most important varieties have been listed below in the table 2.4.
Table 2.4: Shows the varietal characteristics of commercially grown mangoes
Variety Characteristics Alphonso This variety is medium in size, ovate oblique in shape and orange
yellow in colour. The pulp is yellow to orange in colour. It is soft, firm and fibreless. It is a mid-season variety.
Banganpalli The flesh is firm to meaty, fibreless. Fruit is large in size and obliquely oval in shape. The colour of fruit is golden yellow. Good keeping quality and a mid season variety.
Chausa Fruit is large in size, ovate to oval oblique in shape and light yellow in colour. It is a late variety.
Dashehri Fruit size is medium, shape is oblong to oblong-oblique and fruit colour is yellow. The pulp is firm and fibreless and a mid season variety.
Langra Fruit is of medium size, ovate shape and lettuce green in colour.The lemon-yellow flesh is juicy and flavourful. It is scarcely fibrous, a mid season variety.
Totapuri Fruit size is medium to large, shape is oblong with necked base and colour is golden yellow. Flesh is cadmium yellow and fibreless, a mid season variety.
Kesar Fruits are medium sized, flesh is sweet and fibreless. Colour is apricot yellow with red blush, an early season variety.
4. Good Agricultural Practices (GAP)
• Adoption of improved cultivars. • Adoption of high density planting in cultivars • Regulating flowering and increasing intensity of flowering. • Pruning malformed mango shoots at bearing stage • Alternate bearing needs to be managed by reducing fruiting during a year by adoption
of pruning and thinning practices. • Providing life saving irrigation at the critical stage of fruit growth etc. • Integrated nutrient and water management. • Management of spongy tissue through sod mulching. • Integrated pest and disease management practices and timely control of pests and
diseases, especially mango hopper, mango mealy bug and sprays of Bavistin at fruit development stage especially after rains.
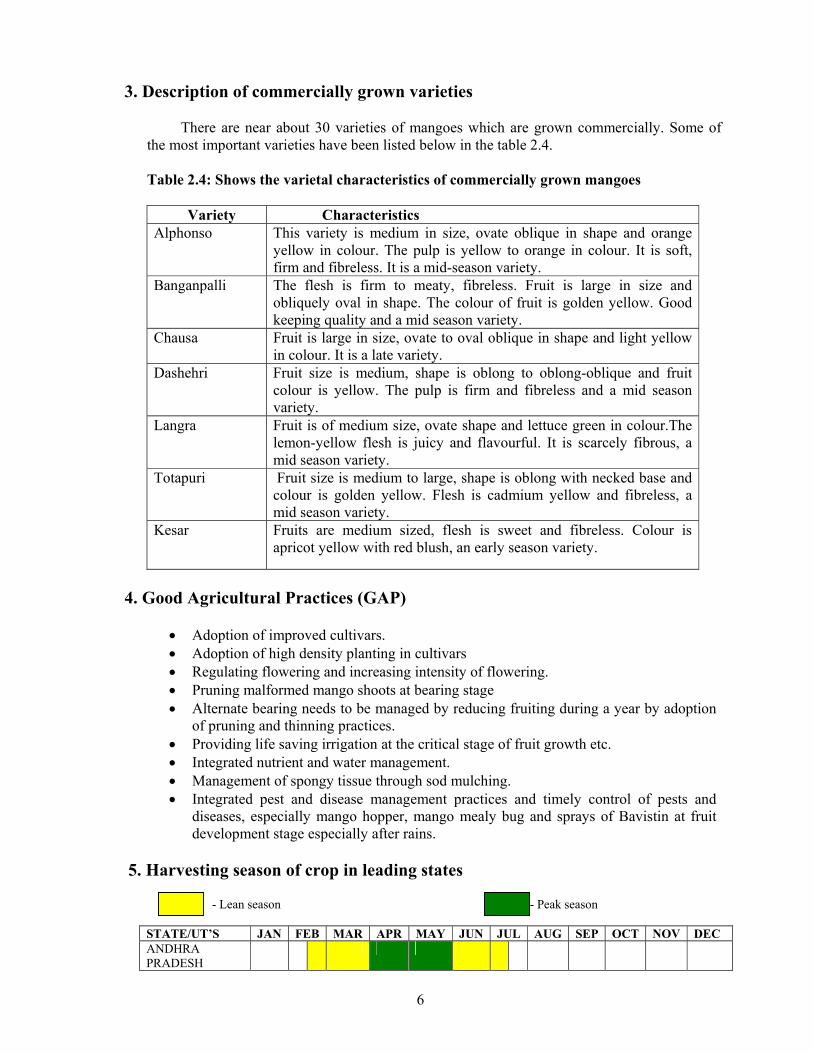
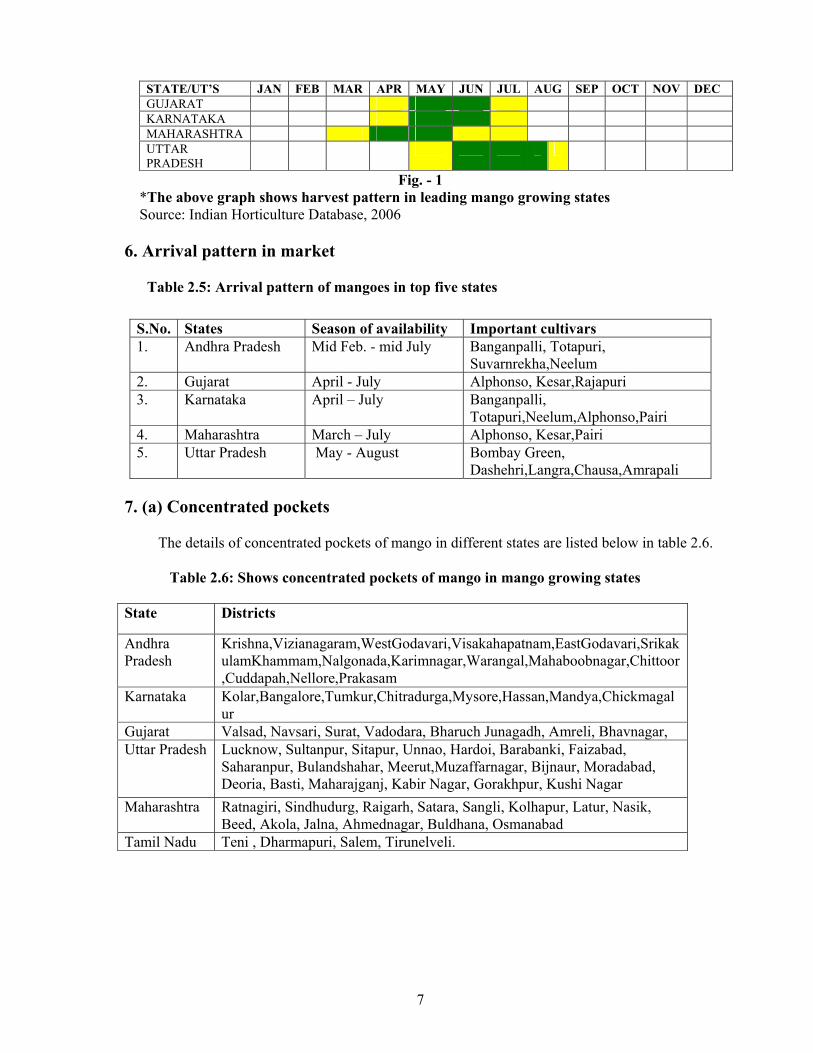
5. Harvesting season of crop in leading states
- Lean season - Peak season
STATE/UT’S JAN FEB MAR APR MAY JUN JUL AUG SEP OCT NOV DEC ANDHRA PRADESH
7
STATE/UT’S JAN FEB MAR APR MAY JUN JUL AUG SEP OCT NOV DEC GUJARAT KARNATAKA MAHARASHTRA UTTAR PRADESH
Fig. - 1 *The above graph shows harvest pattern in leading mango growing states Source: Indian Horticulture Database, 2006
6. Arrival pattern in market
Table 2.5: Arrival pattern of mangoes in top five states
7. (a) Concentrated pockets
The details of concentrated pockets of mango in different states are listed below in table 2.6.
Table 2.6: Shows concentrated pockets of mango in mango growing states
State Districts
Andhra Pradesh
Krishna,Vizianagaram,WestGodavari,Visakahapatnam,EastGodavari,SrikakulamKhammam,Nalgonada,Karimnagar,Warangal,Mahaboobnagar,Chittoor,Cuddapah,Nellore,Prakasam
Karnataka Kolar,Bangalore,Tumkur,Chitradurga,Mysore,Hassan,Mandya,Chickmagalur
Gujarat Valsad, Navsari, Surat, Vadodara, Bharuch Junagadh, Amreli, Bhavnagar, Uttar Pradesh Lucknow, Sultanpur, Sitapur, Unnao, Hardoi, Barabanki, Faizabad,
Saharanpur, Bulandshahar, Meerut,Muzaffarnagar, Bijnaur, Moradabad, Deoria, Basti, Maharajganj, Kabir Nagar, Gorakhpur, Kushi Nagar
Maharashtra Ratnagiri, Sindhudurg, Raigarh, Satara, Sangli, Kolhapur, Latur, Nasik, Beed, Akola, Jalna, Ahmednagar, Buldhana, Osmanabad
Tamil Nadu Teni , Dharmapuri, Salem, Tirunelveli.
S.No. States Season of availability Important cultivars 1. Andhra Pradesh Mid Feb. - mid July Banganpalli, Totapuri,
Suvarnrekha,Neelum 2. Gujarat April - July Alphonso, Kesar,Rajapuri 3. Karnataka April – July Banganpalli,
Totapuri,Neelum,Alphonso,Pairi 4. Maharashtra March – July Alphonso, Kesar,Pairi 5. Uttar Pradesh May - August Bombay Green,
Dashehri,Langra,Chausa,Amrapali
8
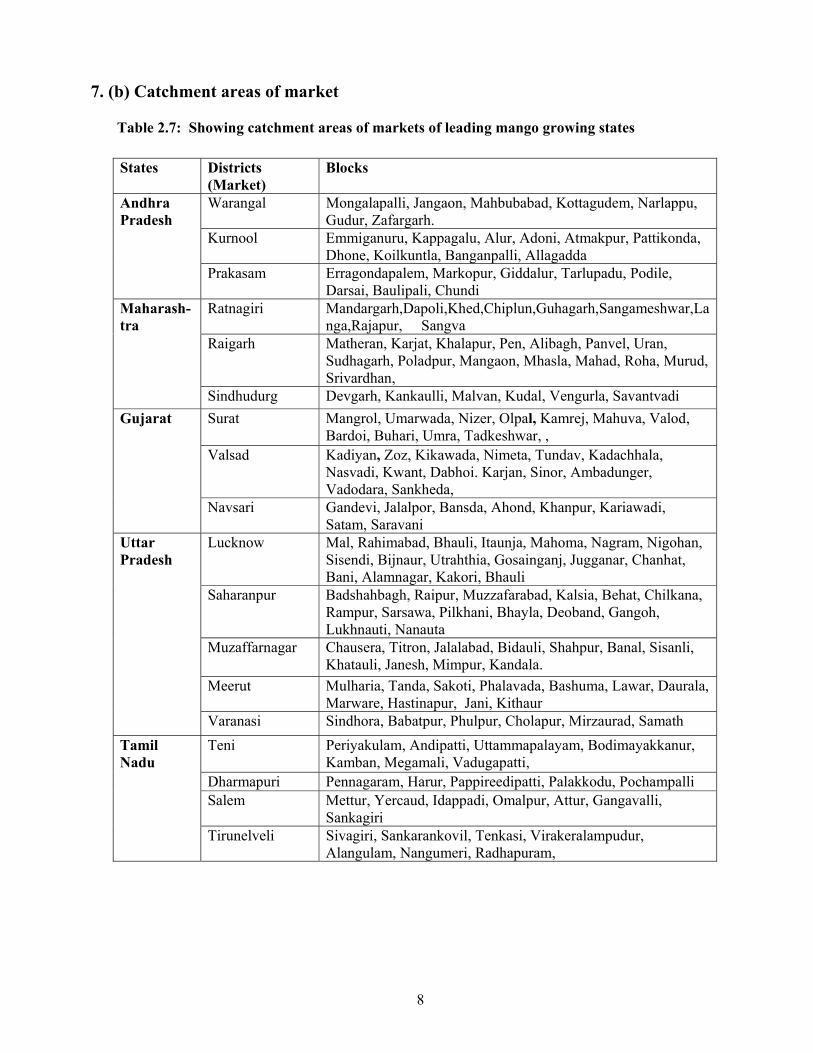
7. (b) Catchment areas of market
Table 2.7: Showing catchment areas of markets of leading mango growing states
States Districts (Market)
Blocks
Warangal Mongalapalli, Jangaon, Mahbubabad, Kottagudem, Narlappu, Gudur, Zafargarh.
Kurnool Emmiganuru, Kappagalu, Alur, Adoni, Atmakpur, Pattikonda, Dhone, Koilkuntla, Banganpalli, Allagadda
Andhra Pradesh
Prakasam Erragondapalem, Markopur, Giddalur, Tarlupadu, Podile, Darsai, Baulipali, Chundi
Ratnagiri Mandargarh,Dapoli,Khed,Chiplun,Guhagarh,Sangameshwar,Langa,Rajapur, Sangva
Raigarh Matheran, Karjat, Khalapur, Pen, Alibagh, Panvel, Uran, Sudhagarh, Poladpur, Mangaon, Mhasla, Mahad, Roha, Murud, Srivardhan,
Maharash-tra
Sindhudurg Devgarh, Kankaulli, Malvan, Kudal, Vengurla, Savantvadi Surat Mangrol, Umarwada, Nizer, Olpal, Kamrej, Mahuva, Valod,
Bardoi, Buhari, Umra, Tadkeshwar, , Valsad Kadiyan, Zoz, Kikawada, Nimeta, Tundav, Kadachhala,
Nasvadi, Kwant, Dabhoi. Karjan, Sinor, Ambadunger, Vadodara, Sankheda,
Gujarat
Navsari Gandevi, Jalalpor, Bansda, Ahond, Khanpur, Kariawadi, Satam, Saravani
Lucknow Mal, Rahimabad, Bhauli, Itaunja, Mahoma, Nagram, Nigohan, Sisendi, Bijnaur, Utrahthia, Gosainganj, Jugganar, Chanhat, Bani, Alamnagar, Kakori, Bhauli
Saharanpur Badshahbagh, Raipur, Muzzafarabad, Kalsia, Behat, Chilkana, Rampur, Sarsawa, Pilkhani, Bhayla, Deoband, Gangoh, Lukhnauti, Nanauta
Muzaffarnagar Chausera, Titron, Jalalabad, Bidauli, Shahpur, Banal, Sisanli, Khatauli, Janesh, Mimpur, Kandala.
Meerut Mulharia, Tanda, Sakoti, Phalavada, Bashuma, Lawar, Daurala, Marware, Hastinapur, Jani, Kithaur
Uttar Pradesh
Varanasi Sindhora, Babatpur, Phulpur, Cholapur, Mirzaurad, Samath Teni Periyakulam, Andipatti, Uttammapalayam, Bodimayakkanur,
Kamban, Megamali, Vadugapatti, Dharmapuri Pennagaram, Harur, Pappireedipatti, Palakkodu, Pochampalli Salem Mettur, Yercaud, Idappadi, Omalpur, Attur, Gangavalli,
Sankagiri
Tamil Nadu
Tirunelveli Sivagiri, Sankarankovil, Tenkasi, Virakeralampudur, Alangulam, Nangumeri, Radhapuram,
9
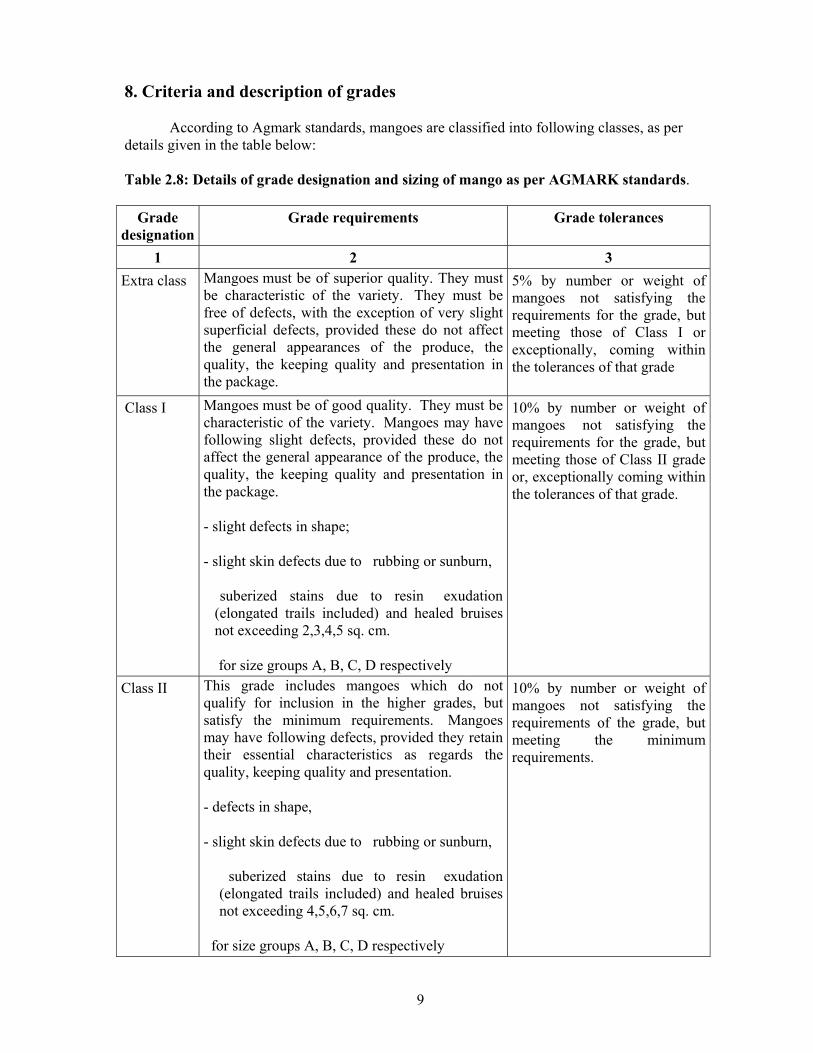
8. Criteria and description of grades According to Agmark standards, mangoes are classified into following classes, as per
details given in the table below:
Table 2.8: Details of grade designation and sizing of mango as per AGMARK standards.
Grade designation
Grade requirements Grade tolerances
1 2 3 Extra class Mangoes must be of superior quality. They must
be characteristic of the variety. They must be free of defects, with the exception of very slight superficial defects, provided these do not affect the general appearances of the produce, the quality, the keeping quality and presentation in the package.
5% by number or weight of mangoes not satisfying the requirements for the grade, but meeting those of Class I or exceptionally, coming within the tolerances of that grade
Class I Mangoes must be of good quality. They must be characteristic of the variety. Mangoes may have following slight defects, provided these do not affect the general appearance of the produce, the quality, the keeping quality and presentation in the package.
- slight defects in shape;
- slight skin defects due to rubbing or sunburn,
suberized stains due to resin exudation (elongated trails included) and healed bruises not exceeding 2,3,4,5 sq. cm.
for size groups A, B, C, D respectively
10% by number or weight of mangoes not satisfying the requirements for the grade, but meeting those of Class II grade or, exceptionally coming within the tolerances of that grade.
Class II This grade includes mangoes which do not qualify for inclusion in the higher grades, but satisfy the minimum requirements. Mangoes may have following defects, provided they retain their essential characteristics as regards the quality, keeping quality and presentation.
- defects in shape,
- slight skin defects due to rubbing or sunburn,
suberized stains due to resin exudation (elongated trails included) and healed bruises not exceeding 4,5,6,7 sq. cm.
for size groups A, B, C, D respectively
10% by number or weight of mangoes not satisfying the requirements of the grade, but meeting the minimum requirements.
10
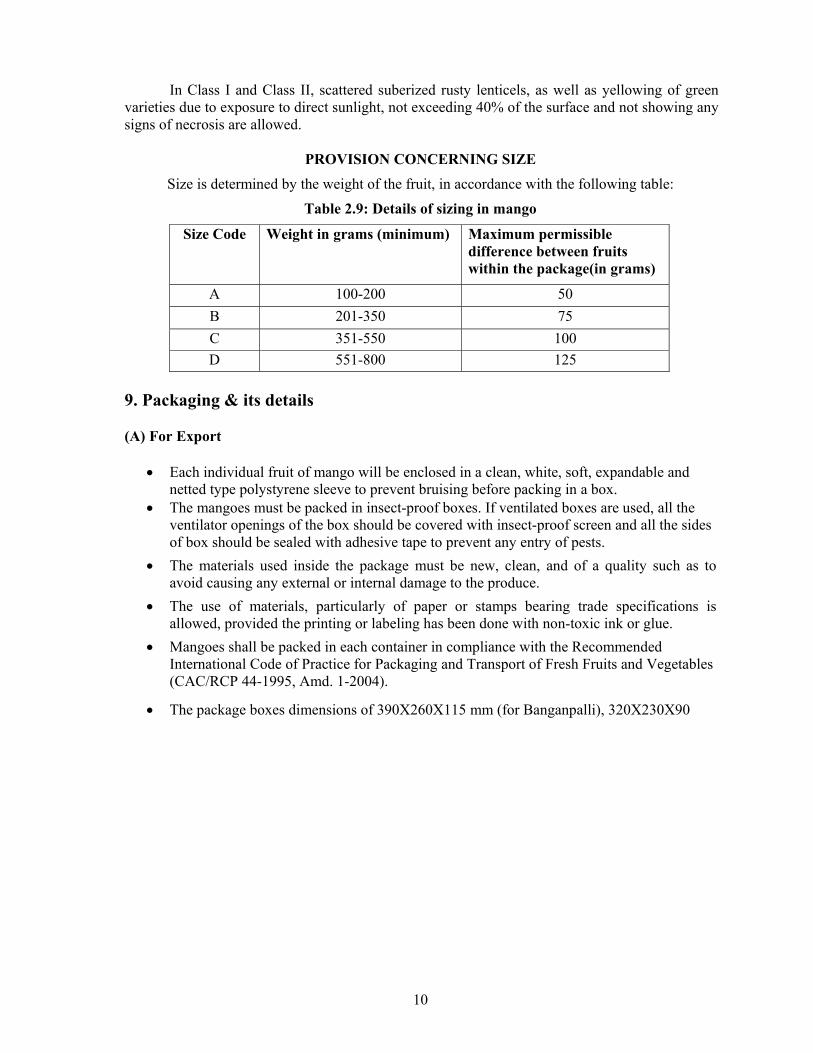
In Class I and Class II, scattered suberized rusty lenticels, as well as yellowing of green varieties due to exposure to direct sunlight, not exceeding 40% of the surface and not showing any signs of necrosis are allowed.
PROVISION CONCERNING SIZE
Size is determined by the weight of the fruit, in accordance with the following table:
Table 2.9: Details of sizing in mango
Size Code Weight in grams (minimum) Maximum permissible difference between fruits within the package(in grams)
A 100-200 50 B 201-350 75 C 351-550 100 D 551-800 125
9. Packaging & its details
(A) For Export
• Each individual fruit of mango will be enclosed in a clean, white, soft, expandable and netted type polystyrene sleeve to prevent bruising before packing in a box.
• The mangoes must be packed in insect-proof boxes. If ventilated boxes are used, all the ventilator openings of the box should be covered with insect-proof screen and all the sides of box should be sealed with adhesive tape to prevent any entry of pests.
• The materials used inside the package must be new, clean, and of a quality such as to avoid causing any external or internal damage to the produce.
• The use of materials, particularly of paper or stamps bearing trade specifications is allowed, provided the printing or labeling has been done with non-toxic ink or glue.
• Mangoes shall be packed in each container in compliance with the Recommended International Code of Practice for Packaging and Transport of Fresh Fruits and Vegetables (CAC/RCP 44-1995, Amd. 1-2004).
• The package boxes dimensions of 390X260X115 mm (for Banganpalli), 320X230X90
11
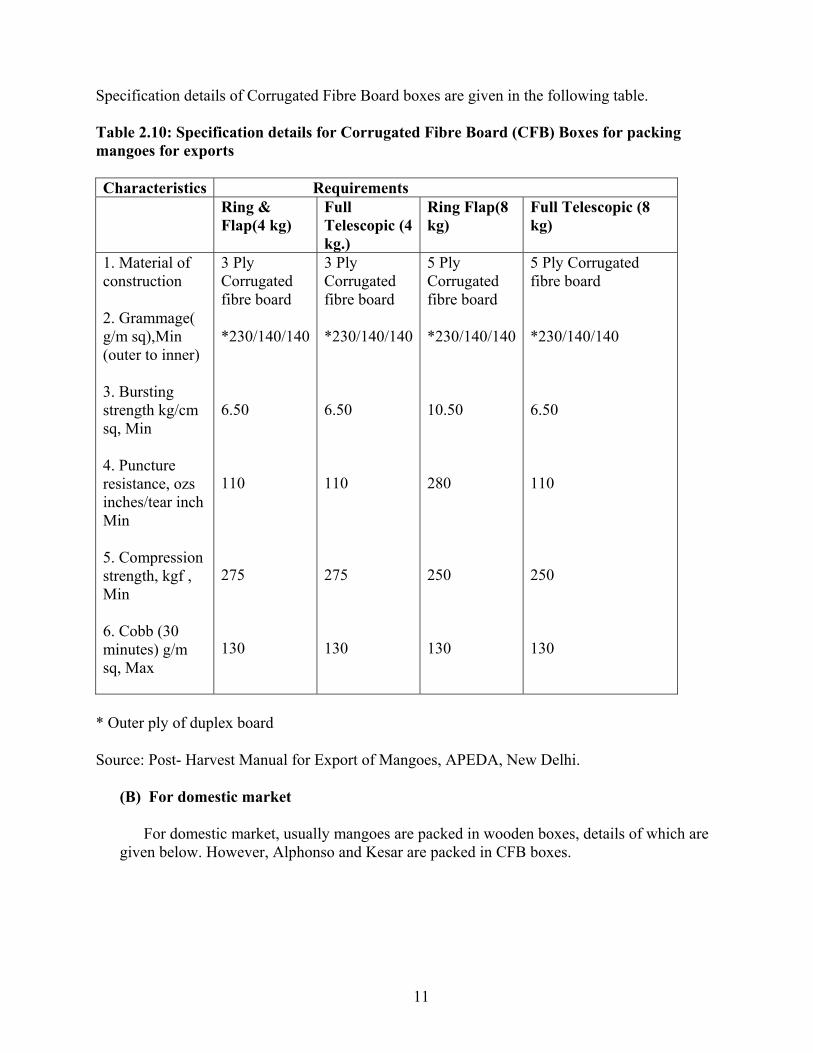
Specification details of Corrugated Fibre Board boxes are given in the following table. Table 2.10: Specification details for Corrugated Fibre Board (CFB) Boxes for packing mangoes for exports Characteristics Requirements Ring &
Flap(4 kg) Full Telescopic (4 kg.)
Ring Flap(8 kg)
Full Telescopic (8 kg)
1. Material of construction
2. Grammage( g/m sq),Min (outer to inner)
3. Bursting strength kg/cm sq, Min
4. Puncture resistance, ozs inches/tear inch Min
5. Compression strength, kgf , Min
6. Cobb (30 minutes) g/m sq, Max
3 Ply Corrugated fibre board
*230/140/140 6.50 110 275 130
3 Ply Corrugated fibre board
*230/140/140 6.50 110 275 130
5 Ply Corrugated fibre board
*230/140/140 10.50 280 250 130
5 Ply Corrugated fibre board
*230/140/140 6.50 110 250 130
* Outer ply of duplex board
Source: Post- Harvest Manual for Export of Mangoes, APEDA, New Delhi.
(B) For domestic market
For domestic market, usually mangoes are packed in wooden boxes, details of which are given below. However, Alphonso and Kesar are packed in CFB boxes.
12
Table 2.11: Specifications of wooden boxes for domestic marketing
Type of Carton Inner Dimension(cm)
Capacity (kgs)
Wooden crates
45X30X30 (Ratnagiri)
21.6X21.6X42 (Malihabad )
16-18
10-11
10. Distribution of produce from primary to terminal market
• Mangoes grown in different parts of the country are transported to the big cities for marketing.
• The fruits produced in Andhra Pradesh and Tamil Nadu find markets in Nagpur, Bombay, and Calcutta.
• The important wholesale mango markets in India are Calcutta, Delhi, Bombay, Madras, Ahmedabad, Pune and Nagpur.
• Mangoes for these big markets are usually collected at the central places in all the mango-growing areas, e.g., in Uttar Pradesh, Lucknow and Varanasi; in Gujarat, Gandevi, Gadat and Amalsar talukas; and in Maharashtra, Ratnagiri and Vengurla.
• Delhi and Bombay are the most important markets for despatch of mangoes. At Delhi all the mangoes are assembled at Sabzimandi, Ashoka market, and at Bombay at Crawford and Byculla markets for distribution.
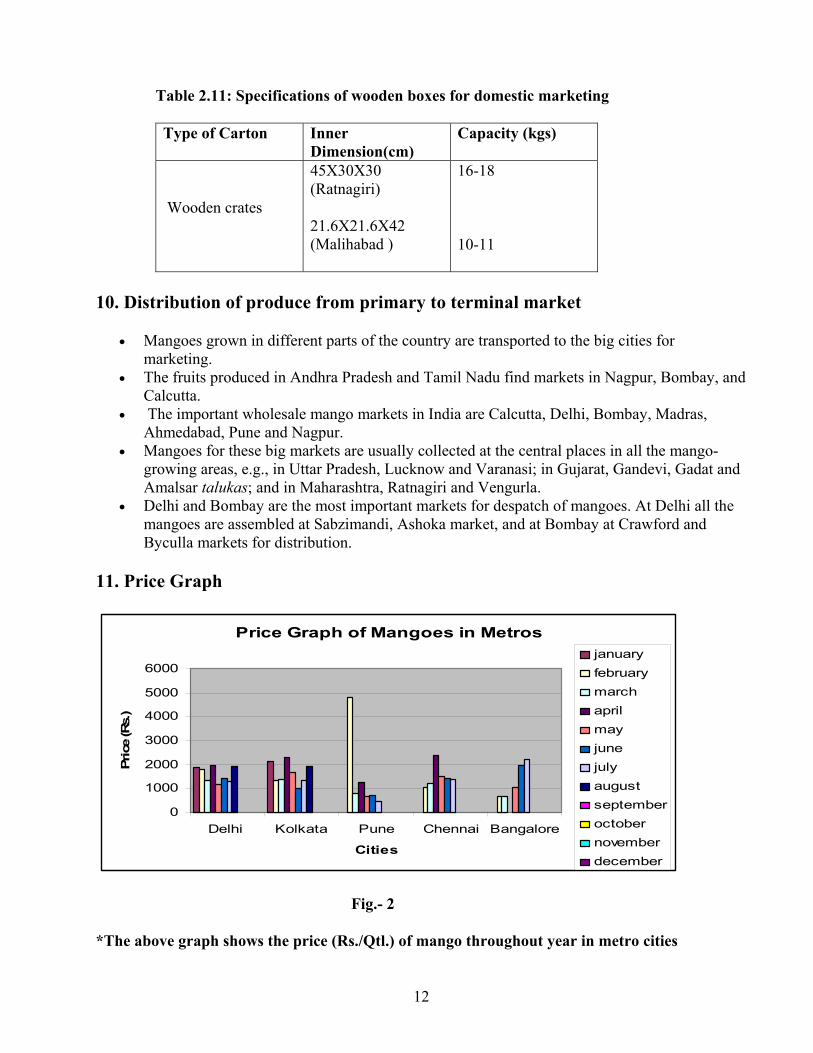
11. Price Graph
Price Graph of Mangoes in Metros
0
1000
2000
3000
4000
5000
6000
Delhi Kolkata Pune Chennai Bangalore
Cities
Pric
e (R
s.)
januaryfebruarymarchaprilmayjunejulyaugustseptemberoctobernovemberdecember
Fig.- 2
*The above graph shows the price (Rs./Qtl.) of mango throughout year in metro cities
13
12. Exports and export potential
A. Domestic strengths for exporting mango
Domestic strengths for exporting mango from India are listed below:
• India occupies top position in total production among mango growing countries of the world. • India cultivates a wide variety of mangoes; some of them are very colourful and attractive
with par excellence edible quality. • Mangoes are cultivated with sizeable production in almost all the states i.e. Andhra Pradesh,
Uttar Pradesh, Maharashtra, Gujarat, Tamil Nadu etc. • Transfer of technology for cultivation of mango is easy as in many states; farmers have
formed associations/cooperatives. • In Maharashtra state mango growers are quite innovative. • Agri Export Zones for facilitating exports have been established in almost all mango growing
areas. • Packhouses on modern lines have been provided in all mango exporting regions i.e. in
Ratnagiri and Sindhudurg in Maharashtra and in Navsari and Borsad in Gujarat for Alphonso variety; in Latur and Aurangabad for Kesar mango; in Saharanpur and Malihabad in U.P. for Dashehari and Chausa mangoes.
• Facilities for facilitating mango exports like Post-harvest Management Centre have been established at Malihabad and Saharanpur. Similarly a mango Export Facility Centre has been established at Ratnagiri.
• Mango farmers of Alphonso and Kesar are already being trained in GLOBALGAP requirements.
• Mango growers of Saharanpur have already branded their product as “NAWAB” mango. • Facilities for Vapour Heat Treatment and irradiation for eliminating fruit fly have already
been set up. • India is in advantageous position, as it is nearer to Middle East countries compared to
Australia, Kenya etc. main suppliers in Middle East.
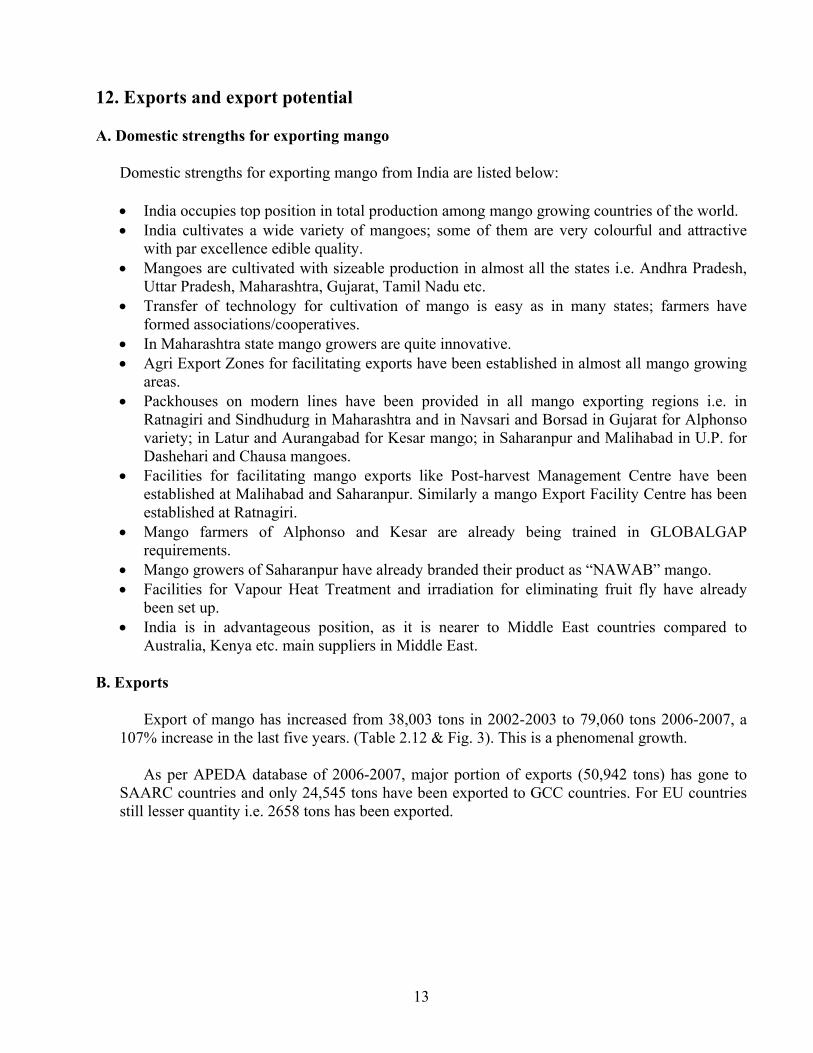
B. Exports
Export of mango has increased from 38,003 tons in 2002-2003 to 79,060 tons 2006-2007, a 107% increase in the last five years. (Table 2.12 & Fig. 3). This is a phenomenal growth.
As per APEDA database of 2006-2007, major portion of exports (50,942 tons) has gone to
SAARC countries and only 24,545 tons have been exported to GCC countries. For EU countries still lesser quantity i.e. 2658 tons has been exported.
14
Table 2.12: Export of mango for last five years
Source: APEDA Database, 2006-07
01000020000300004000050000600007000080000
Qua
ntity
in to
ns
2002
-200
3
2003
-200
4
2004
-200
5
2005
-200
6
2006
-200
7Years
Export of mango for last five years
Fig. - 3
C. Export potential
Export potential of mangoes from India is discussed for different groups of countries as mentioned below:
(i) GCC Countries GCC countries imported 1, 44,042 tons during 2006 and there is 15% increase in demand from the year 2003. India exported only 24,545 tons to GCC countries during 2006-2007. Out of this, as much as 22,045 tons were exported to UAE. Next in order, 1323 tons were sent to Saudi Arabia. However, there is tremendous scope for expanding exports to these countries, as India produces finest quality mangoes. According to comtrade database 2006, as much as 63,519 tons were imported by UAE, 48,330 tons by Saudi Arabia, 16,438 tons by Oman and 8900 tons by Kuwait, 3617 tons by Bahrain and 3238 tons by Qatar. Indian penetration to Saudi Arabian market and markets of Oman and Kuwait is negligible and need to be accelerated by nurturing these markets.
Year Quantity(tons) Value(in Rs.Lakh) 2002-2003 38003 8419.42003-2004 60551 11051.92004-2005 53480 8961.02005-2006 69606 12811.12006-2007 79060 14193.9
15
India's total exports are substantial during March – April months and reduce significantly during May onwards because of competition from Pakistan. India must explore reducing costs Kesar variety of mango which is much more acceptable by increased productivity and make available through reefer containers,. We must target at least 40,000 to 50,000 tons of exports to GCC countries in next 4-5 years period of the total imports of 1,44,042 tons.
(ii) EU countries
EU countries import mangoes varying from 2, 50,000 tons to 3, 00,000 tons every year. There is 31% increase in demand from the year 2003. However, during 2006-07, only 2519 tons were exported from India. Out of this, maximum quantity was exported to UK (1883 tons). India is not able to penetrate other EU countries in a significant way. The exports to EU countries so far, are more or less consistent. The main reason for the absence of upsurge of export of mangoes to EU is supply of mangoes by countries like Brazil, Peru, and Israel etc. at cheaper rates. Thus, India must lower the cost of production by increasing productivity. Apart from above, the other reason is that the EU market has become used to appreciate only coloured mangoes. Consumers at times pay higher price for these coloured mangoes. Even superior edible quality of Indian mangoes does not get much attention before coloured mangoes like Tommy Atkins, Kent and Haden. Realising this, Research Institutes in India have bred coloured varieties like Arka Anmol, Arka Puneet, Pusa Arunima, Ambika etc. However, their commercial productivity, acceptability in EU markets etc should be assessed on priority within definite time framework. The above mentioned coloured varieties are not only attractive but have very good edible quality.
(iii) ASEAN countries
ASEAN countries are importing mangoes to the tune of 50,327tons (2006). Major importers are Malaysia (23,521 tons), Singapore (16,027 tons). Vietnam (7212 tons), Indonesia (1103), and Thailand (262 tons). However exports of mango from India to ASEAN countries are only 332 tons to Malaysia and 230 tons to Singapore and 20 tons to Vietnam during 2006-2007. This is negligible as compared to what is potential; however, Thailand is able to supply mangoes at much cheaper price to Malaysia and Singapore, the main importers. Therefore, the strategy for India may be to make available cheaper mangoes like Totapuri (Banglora) in Malaysian market on one hand and campaign for quality and having red blush varieties like Suvarnrekha, Kesar and Alphonso varieties on the other hand for Singapore market. Market for high quality mangoes will have to be nurtured. For competing with Thailand, variety like Totapuri (Banglora) need to be explored and require to be exported from Eastern Port of Andhra Pradesh to save on logistic costs. Side by side India must reduce the cost of production by increasing the productivity. Perhaps with this strategy, we may target a volume of 6000-8000 tons of mango in next 4-5 years.
(iv) Hong Kong
Hong Kong is a centre for trade for fruits and vegetables and imported up to 42,422 tons and exported 19,988 tons of mangoes during the year 2006. The prices prevailing in Hong Kong market are also quite high. However, India has exported only 49 tons during 2006.Therefore; concerted campaign needs to be launched for our quality mangoes in this market.
16
(v) Pacific Rim countries and China Pacific Rim countries comprise Australia, Japan, Korea etc. and potential for exports of mangoes to these countries is given below: (a) Australia
Australia imported only 810 tons during 2006. However, Australia has very strict regulations for entry of Indian mangoes in their country. Australia has put mangoes from India under Import Risk Analysis (IRA). By this, Australia is to identify and classify potential quarantine risks and develop policies to manage them. Provisional IRA has been released, but still one cannot export mangoes to Australia, till it is totally finalized. At present, Indo-Australian agreement is under negotiation, and export of mangoes should be covered in the agreement. There should be no difficulty, as India has already standardized irradiation treatment for eliminating fruit fly, which is acceptable to Australia.
(b) South Korea
South Korea has imported 1235 tons of mangoes during 2006. At present South Korea has high duties on imported mangoes, however, India is likely to finalize Free Trade Agreement with Korea soon and it is hoped that export of mangoes to S. Korea will begin.
(c) Japan
According to comtrade database, Japan imported 12586 tons of mangoes in 2006. Japan has a requirement of Vapour Heat Treatment (VHT) for eliminating fruit fly. India has already established facilities for VHT treatment and exported 74 tons during 2006. However, even then export of mangoes has not accelerated to Japan, which needs to be taken up.
(d) China
China has only moderate import duties on export of mangoes to China under Asia Pacific Trade Agreement. Some amount of mangoes has already been exported to China. There is good scope of exporting mangoes to China, as it imported to the tune of 23,763 tons during 2006 (comtrade database). India is in a position to fulfill all the requirements of importing country from plant protection, quarantine and hygienic angles.
(e) U.S.A and Canada
According to comtrade database, USA imported 2, 98,088 tons of mangoes and Canada imported 42,161 tons during the year 2006. India did not export any mangoes to U.S.A during 2006 but exported 75 tons to Canada during the year (2006). MOU has been signed between USA and India for export of mangoes to USA. India has already provided irradiation facilities at a number of locations. There should be no further difficulty in exporting mangoes both to U.S.A. and Canada.
D. Measures for enhancing competitiveness for exporting mangoes
Following measures need to be adopted for enhancing competitiveness:
17
• Protocol for CA and MA storage for sea shipping needs to be perfected suiting to all exportable varieties of mango, so that shelf life can be extended and we can compete with Thailand in South East Asia.
• Similarly, if sea shipping protocol is perfected, India can stand competitively with Australia, Kenya etc. for exporting to Middle East countries and can effectively enter EU market.
• Main emphasis needs to be laid on cost reduction by increasing productivity per hectare which is very low, so that India can compete with Pakistan and other countries which supply mangoes at lower price.
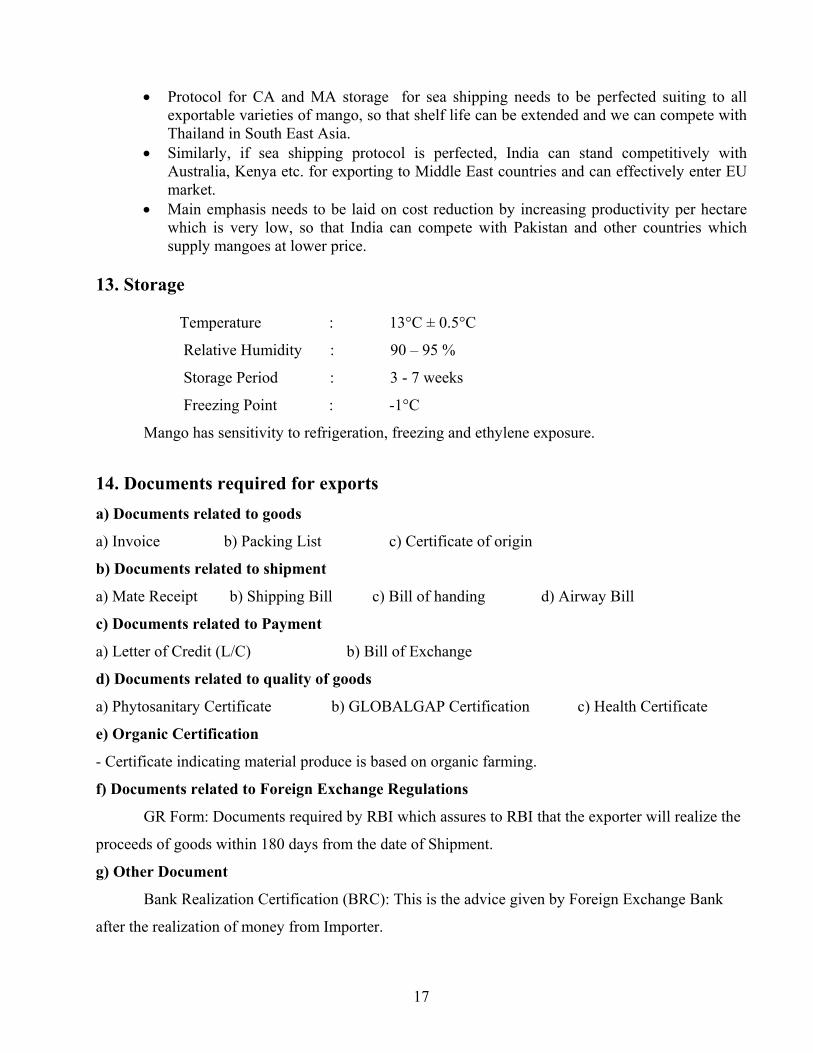
13. Storage Temperature : 13°C ± 0.5°C
Relative Humidity : 90 – 95 %
Storage Period : 3 - 7 weeks
Freezing Point : -1°C
Mango has sensitivity to refrigeration, freezing and ethylene exposure.
14. Documents required for exports a) Documents related to goods
a) Invoice b) Packing List c) Certificate of origin
b) Documents related to shipment
a) Mate Receipt b) Shipping Bill c) Bill of handing d) Airway Bill
c) Documents related to Payment
a) Letter of Credit (L/C) b) Bill of Exchange
d) Documents related to quality of goods
a) Phytosanitary Certificate b) GLOBALGAP Certification c) Health Certificate
e) Organic Certification
- Certificate indicating material produce is based on organic farming.
f) Documents related to Foreign Exchange Regulations
GR Form: Documents required by RBI which assures to RBI that the exporter will realize the
proceeds of goods within 180 days from the date of Shipment.
g) Other Document
Bank Realization Certification (BRC): This is the advice given by Foreign Exchange Bank
after the realization of money from Importer.
18
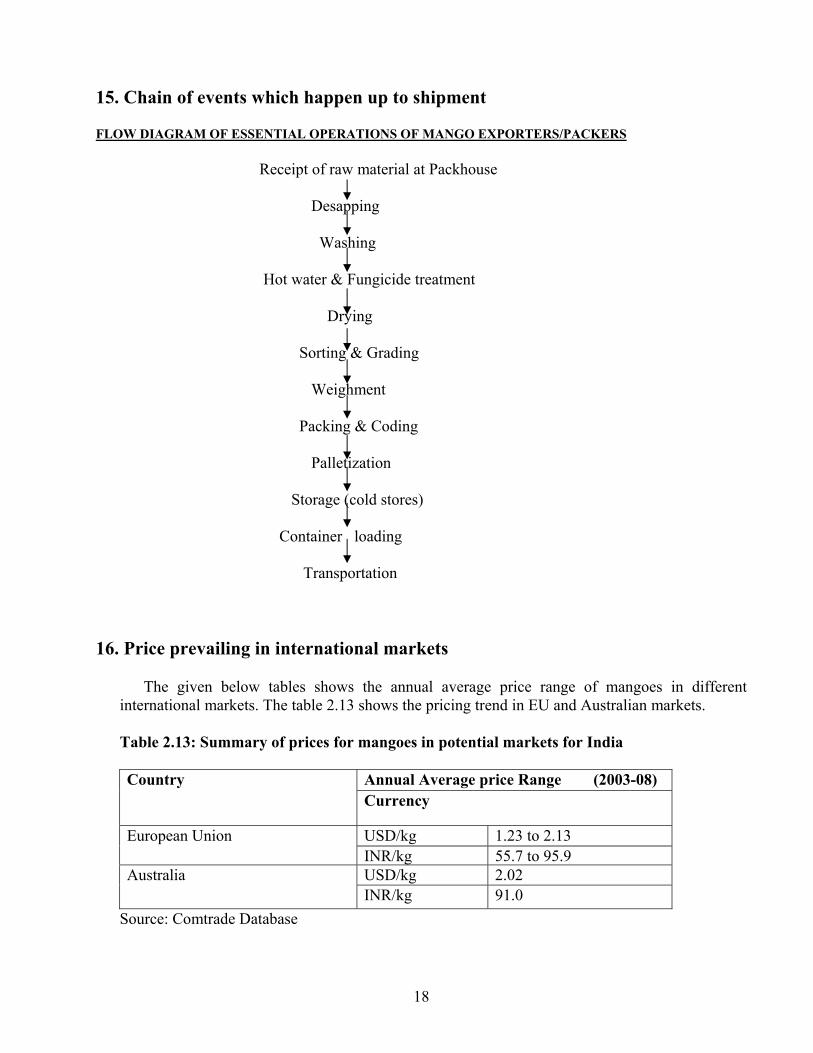
15. Chain of events which happen up to shipment
FLOW DIAGRAM OF ESSENTIAL OPERATIONS OF MANGO EXPORTERS/PACKERS Receipt of raw material at Packhouse Desapping Washing Hot water & Fungicide treatment Drying Sorting & Grading Weighment Packing & Coding Palletization Storage (cold stores) Container loading Transportation
16. Price prevailing in international markets
The given below tables shows the annual average price range of mangoes in different international markets. The table 2.13 shows the pricing trend in EU and Australian markets.
Table 2.13: Summary of prices for mangoes in potential markets for India
Annual Average price Range (2003-08) Country Currency
USD/kg 1.23 to 2.13 European Union INR/kg 55.7 to 95.9 USD/kg 2.02 Australia INR/kg 91.0
Source: Comtrade Database
19
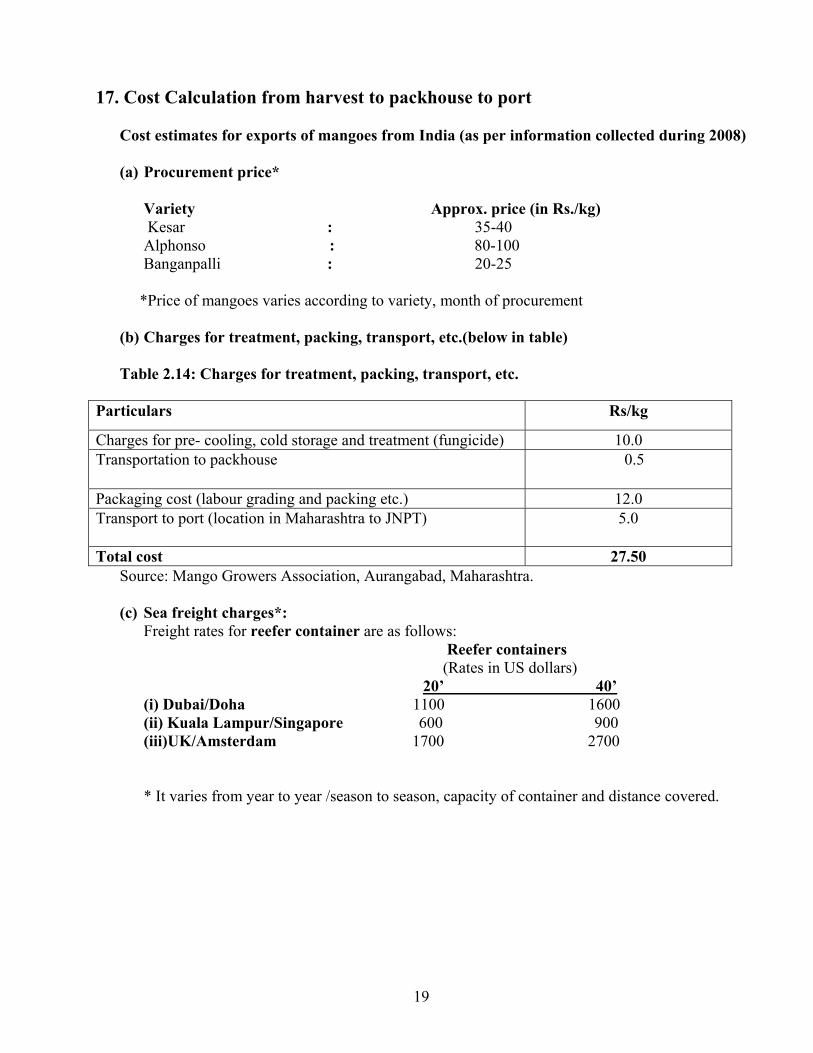
17. Cost Calculation from harvest to packhouse to port
Cost estimates for exports of mangoes from India (as per information collected during 2008)
(a) Procurement price*
Variety Approx. price (in Rs./kg) Kesar : 35-40 Alphonso : 80-100 Banganpalli : 20-25
*Price of mangoes varies according to variety, month of procurement (b) Charges for treatment, packing, transport, etc.(below in table) Table 2.14: Charges for treatment, packing, transport, etc.
Source: Mango Growers Association, Aurangabad, Maharashtra. (c) Sea freight charges*:
Freight rates for reefer container are as follows: Reefer containers (Rates in US dollars) 20’ 40’
(i) Dubai/Doha 1100 1600 (ii) Kuala Lampur/Singapore 600 900 (iii)UK/Amsterdam 1700 2700 * It varies from year to year /season to season, capacity of container and distance covered.
Particulars Rs/kg
Charges for pre- cooling, cold storage and treatment (fungicide) 10.0 Transportation to packhouse 0.5
Packaging cost (labour grading and packing etc.) 12.0 Transport to port (location in Maharashtra to JNPT) 5.0
Total cost 27.50
20
CHAPTER- 3
GRAPES
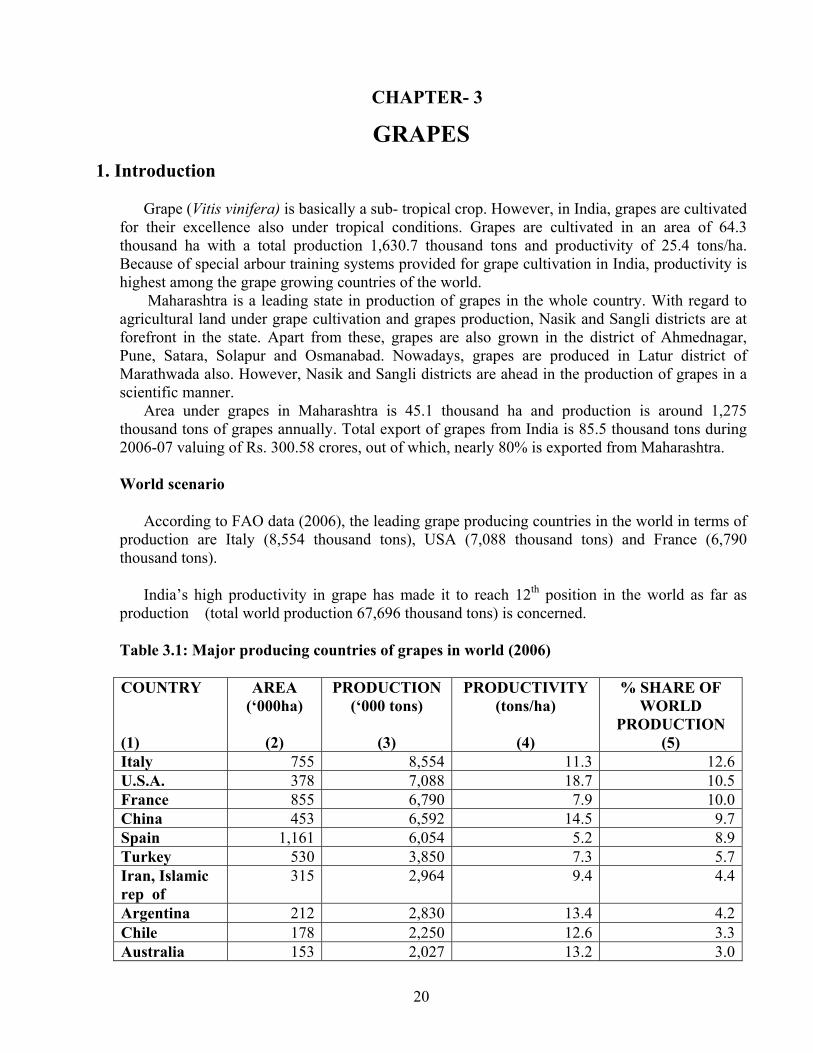
1. Introduction Grape (Vitis vinifera) is basically a sub- tropical crop. However, in India, grapes are cultivated
for their excellence also under tropical conditions. Grapes are cultivated in an area of 64.3 thousand ha with a total production 1,630.7 thousand tons and productivity of 25.4 tons/ha. Because of special arbour training systems provided for grape cultivation in India, productivity is highest among the grape growing countries of the world.
Maharashtra is a leading state in production of grapes in the whole country. With regard to agricultural land under grape cultivation and grapes production, Nasik and Sangli districts are at forefront in the state. Apart from these, grapes are also grown in the district of Ahmednagar, Pune, Satara, Solapur and Osmanabad. Nowadays, grapes are produced in Latur district of Marathwada also. However, Nasik and Sangli districts are ahead in the production of grapes in a scientific manner.
Area under grapes in Maharashtra is 45.1 thousand ha and production is around 1,275 thousand tons of grapes annually. Total export of grapes from India is 85.5 thousand tons during 2006-07 valuing of Rs. 300.58 crores, out of which, nearly 80% is exported from Maharashtra.
World scenario
According to FAO data (2006), the leading grape producing countries in the world in terms of production are Italy (8,554 thousand tons), USA (7,088 thousand tons) and France (6,790 thousand tons).
India’s high productivity in grape has made it to reach 12th position in the world as far as production (total world production 67,696 thousand tons) is concerned.
Table 3.1: Major producing countries of grapes in world (2006)
COUNTRY (1)
AREA (‘000ha)
(2)
PRODUCTION (‘000 tons)
(3)
PRODUCTIVITY (tons/ha)
(4)
% SHARE OF WORLD
PRODUCTION (5)
Italy 755 8,554 11.3 12.6U.S.A. 378 7,088 18.7 10.5France 855 6,790 7.9 10.0China 453 6,592 14.5 9.7Spain 1,161 6,054 5.2 8.9Turkey 530 3,850 7.3 5.7Iran, Islamic rep of
315 2,964 9.4 4.4
Argentina 212 2,830 13.4 4.2Chile 178 2,250 12.6 3.3Australia 153 2,027 13.2 3.0
21
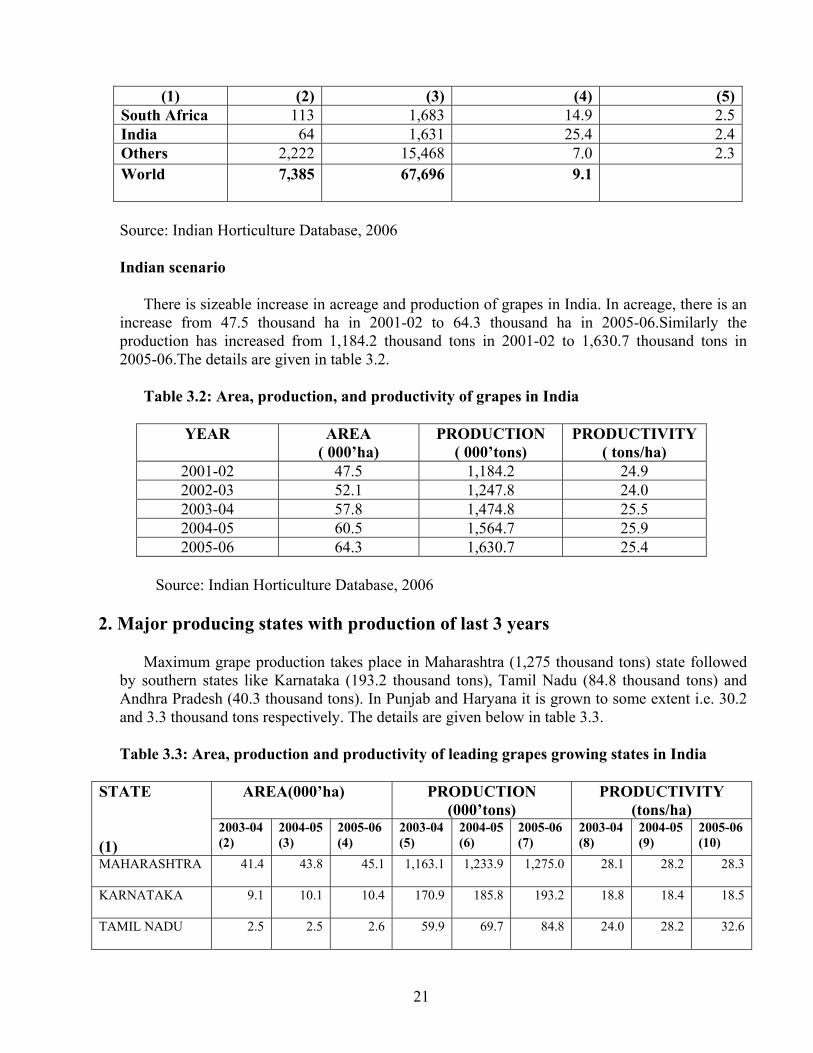
(1) (2) (3) (4) (5)South Africa 113 1,683 14.9 2.5India 64 1,631 25.4 2.4Others 2,222 15,468 7.0 2.3World 7,385
67,696 9.1
Source: Indian Horticulture Database, 2006
Indian scenario
There is sizeable increase in acreage and production of grapes in India. In acreage, there is an increase from 47.5 thousand ha in 2001-02 to 64.3 thousand ha in 2005-06.Similarly the production has increased from 1,184.2 thousand tons in 2001-02 to 1,630.7 thousand tons in 2005-06.The details are given in table 3.2.
Table 3.2: Area, production, and productivity of grapes in India
YEAR AREA ( 000’ha)
PRODUCTION ( 000’tons)
PRODUCTIVITY ( tons/ha)
2001-02 47.5 1,184.2 24.9 2002-03 52.1 1,247.8 24.0 2003-04 57.8 1,474.8 25.5 2004-05 60.5 1,564.7 25.9 2005-06 64.3 1,630.7 25.4
Source: Indian Horticulture Database, 2006
2. Major producing states with production of last 3 years
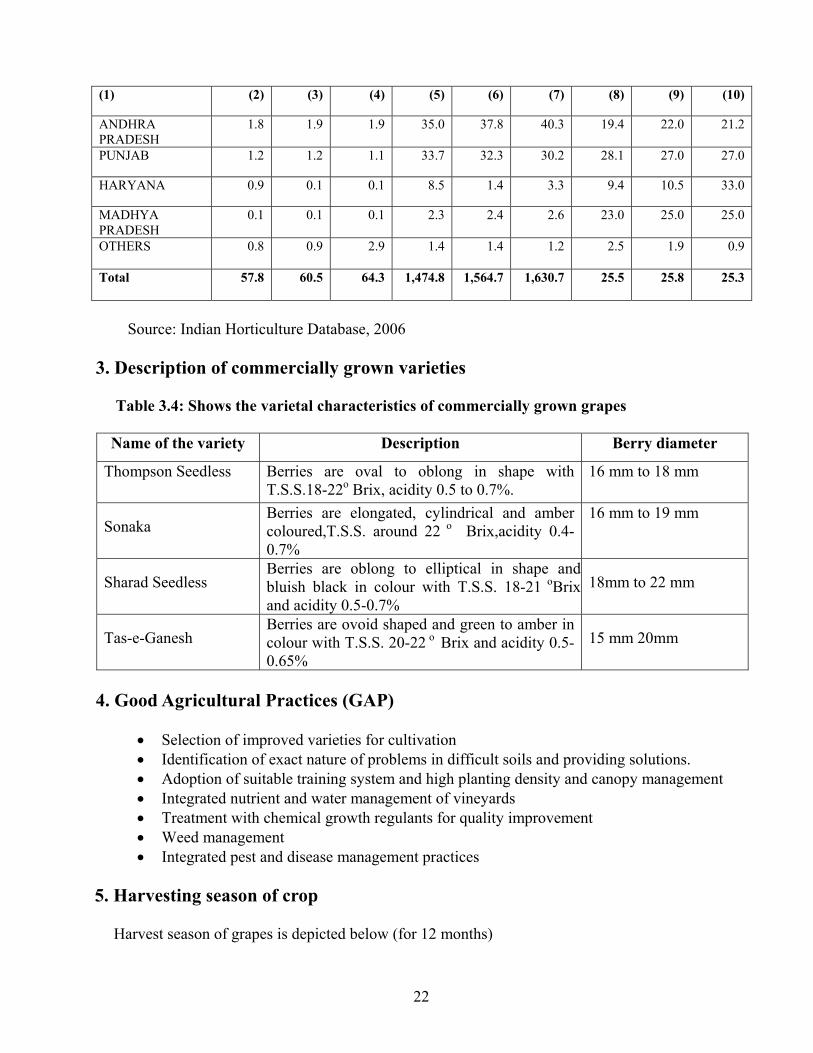
Maximum grape production takes place in Maharashtra (1,275 thousand tons) state followed by southern states like Karnataka (193.2 thousand tons), Tamil Nadu (84.8 thousand tons) and Andhra Pradesh (40.3 thousand tons). In Punjab and Haryana it is grown to some extent i.e. 30.2 and 3.3 thousand tons respectively. The details are given below in table 3.3.
Table 3.3: Area, production and productivity of leading grapes growing states in India
AREA(000’ha) PRODUCTION (000’tons)
PRODUCTIVITY (tons/ha)
STATE (1)
2003-04 (2)
2004-05 (3)
2005-06 (4)
2003-04 (5)
2004-05(6)
2005-06 (7)
2003-04 (8)
2004-05 (9)
2005-06 (10)
MAHARASHTRA 41.4
43.8 45.1 1,163.1 1,233.9 1,275.0 28.1 28.2 28.3
KARNATAKA 9.1
10.1 10.4 170.9 185.8 193.2 18.8 18.4 18.5
TAMIL NADU 2.5
2.5 2.6 59.9 69.7 84.8 24.0 28.2 32.6
22
(1) (2) (3) (4) (5) (6) (7) (8) (9) (10)
ANDHRA PRADESH
1.8 1.9 1.9 35.0 37.8 40.3 19.4 22.0 21.2
PUNJAB 1.2 1.2 1.1 33.7 32.3 30.2 28.1 27.0 27.0
HARYANA 0.9 0.1 0.1 8.5 1.4 3.3 9.4 10.5 33.0
MADHYA PRADESH
0.1 0.1 0.1 2.3 2.4 2.6 23.0 25.0 25.0
OTHERS 0.8
0.9 2.9 1.4 1.4 1.2 2.5 1.9 0.9
Total 57.8
60.5 64.3 1,474.8 1,564.7 1,630.7 25.5 25.8 25.3
Source: Indian Horticulture Database, 2006
3. Description of commercially grown varieties Table 3.4: Shows the varietal characteristics of commercially grown grapes
Name of the variety Description Berry diameter
Thompson Seedless Berries are oval to oblong in shape with T.S.S.18-22o Brix, acidity 0.5 to 0.7%.
16 mm to 18 mm
Sonaka Berries are elongated, cylindrical and amber coloured,T.S.S. around 22 o Brix,acidity 0.4-0.7%
16 mm to 19 mm
Sharad Seedless Berries are oblong to elliptical in shape and bluish black in colour with T.S.S. 18-21 oBrix and acidity 0.5-0.7%
18mm to 22 mm
Tas-e-Ganesh Berries are ovoid shaped and green to amber in colour with T.S.S. 20-22 o Brix and acidity 0.5-0.65%
15 mm 20mm
4. Good Agricultural Practices (GAP)
• Selection of improved varieties for cultivation • Identification of exact nature of problems in difficult soils and providing solutions. • Adoption of suitable training system and high planting density and canopy management • Integrated nutrient and water management of vineyards • Treatment with chemical growth regulants for quality improvement • Weed management • Integrated pest and disease management practices
5. Harvesting season of crop
Harvest season of grapes is depicted below (for 12 months)
23
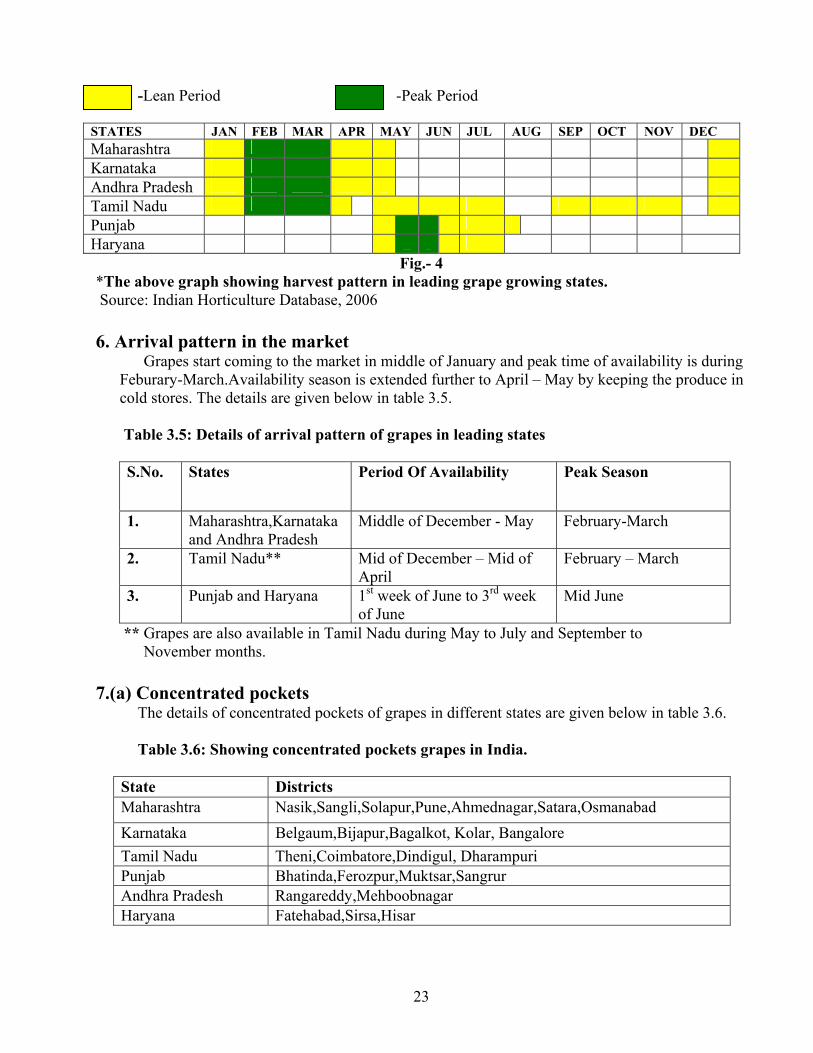
-Lean Period -Peak Period
STATES JAN FEB MAR APR MAY JUN JUL AUG SEP OCT NOV DEC Maharashtra Karnataka Andhra Pradesh Tamil Nadu Punjab Haryana
Fig.- 4 *The above graph showing harvest pattern in leading grape growing states. Source: Indian Horticulture Database, 2006 6. Arrival pattern in the market
Grapes start coming to the market in middle of January and peak time of availability is during Feburary-March.Availability season is extended further to April – May by keeping the produce in cold stores. The details are given below in table 3.5.
Table 3.5: Details of arrival pattern of grapes in leading states
S.No. States Period Of Availability Peak Season
1. Maharashtra,Karnataka and Andhra Pradesh
Middle of December - May February-March
2. Tamil Nadu** Mid of December – Mid of April
February – March
3. Punjab and Haryana 1st week of June to 3rd week of June
Mid June
** Grapes are also available in Tamil Nadu during May to July and September to November months. 7.(a) Concentrated pockets
The details of concentrated pockets of grapes in different states are given below in table 3.6. Table 3.6: Showing concentrated pockets grapes in India.
State Districts Maharashtra Nasik,Sangli,Solapur,Pune,Ahmednagar,Satara,Osmanabad Karnataka Belgaum,Bijapur,Bagalkot, Kolar, Bangalore Tamil Nadu Theni,Coimbatore,Dindigul, Dharampuri Punjab Bhatinda,Ferozpur,Muktsar,Sangrur Andhra Pradesh Rangareddy,Mehboobnagar Haryana Fatehabad,Sirsa,Hisar

24
7.(b) Catchment areas of market
Table 3.7: Showing the details of catchment areas of market of grapes in leading states
States Districts (Market)
Blocks
Solapur Karmala,Barsi,Madha,Mohol,Mangalwedha,Sangole,Malsiras,Pandharpur,Akalkot.
Nashik Kalvan,Peint,Igatpuri,Sinnar,Niphad,Yeola,Nandgaon, Satana,Furgana,Dindori,Melgaon,
Sangli Atpadi,Khanapur,Islampur,Shirala,Valva,Tasgaon,Kavathe, Mahankal,Jath, Miraj
Ahmednagar Srirampur,Sangamner,Akola,Rahusi,Nevasa,Parner,Pathardi, Srigonda,Karjat
Pune Junnar,Ambegaon,Ghod,Rajgurunagar,Wadgaonsirur,Mulshi, Welhe,Purandhar,Bhor,Baramati,Indapur,Daund,Saswad.
Maharashtra
Satara Mahabaleshwar,Khandala,Wai,Phaltan,Koregaon,Khata,Patan, Karad,Vadug.
Bijapur Indi,Sindgi,Basavna Bagevadi,Muddebihal,Tikota. Belgaum Athni,Arkali,Chikodi,Mukeri,Bailhongal,Ramdurg,Khauapur. Bagalkot Jamkhandi,Mudhol,Hungund,Badami. Kolar Bagepalli,Gauribidanur,Gudibanda,ChikBallapur,Mulbagal,
Malur,Bangarapet
Karnataka
Bangalore Amekal,Sonnenahalti,Kannur,Bagalur,Nagarur,Marangondahalli,Haralur,Mantapa,Solurur,Chandapur.
Rangareddy Marpali,Vikarabad,Tandur,Pargi,Ibranimpatan,Shahabad, Doma,Maisaram,Miryan,Nancherla.
Andhra Pradesh
Mehbubnagar
Kollur,Keshampat,Mughalgidda,Karnul,Wanparti,Atmakur,Gadwall,Alampur,Kolhapur,Achampet,Kondangol.
Theni Periyakulam, Andipatti, Uttammapalayam, Bodimayakkanur, Kamban, Megamali, Vadugapatti,
Coimbatore Muttuppalaiyam,Avinashi,Tiruppur,Palladam,Udumallaippettai, Pollachi,Valparai.
Tamil Nadu
Dindigul Palani,Kodaikkanal,Oddanchatran,Vedasandur,Naltam, Nilakkotai,Palaiyan
Bhatinda Rampura Phul,Talwani Sabo,Bhagra,Jalal,Nathana, Bandi,Jaisinghwala,Shergarh,Sangat,Malkana,Lahri,Teona.
Ferozpur Zira,Fazilla,Abohar,Jalalbad,Fatehgarh,Panjeke,Ladhuka, Lakhawall,Ramsara,Wahabwala.
Punjab
Muktsar Kanianwali,Malaut,Baruwali,Sotha,Doda,Bhadar,AbulKharana,Bhagu,Waring,Khera
Fatehabad Ratiya,Tohana,Badalgarh,Bhattu,Sampla,Pirthala,Samiyana,Kharihajan,Bhattukalan
Sirsa Fatehpur,Dabwali,Ellenabad,Banwala,SalamKhera,Nathohar,Mangla,Jamal,Gushalyana.
Haryana
Hisar Bithmara,Adampur,Narnaund,Hansi,Budak,Mangal, Umra,Sultanpur,Babal,Baria,Agroha,Kanoh,Khedar,Budak.
25
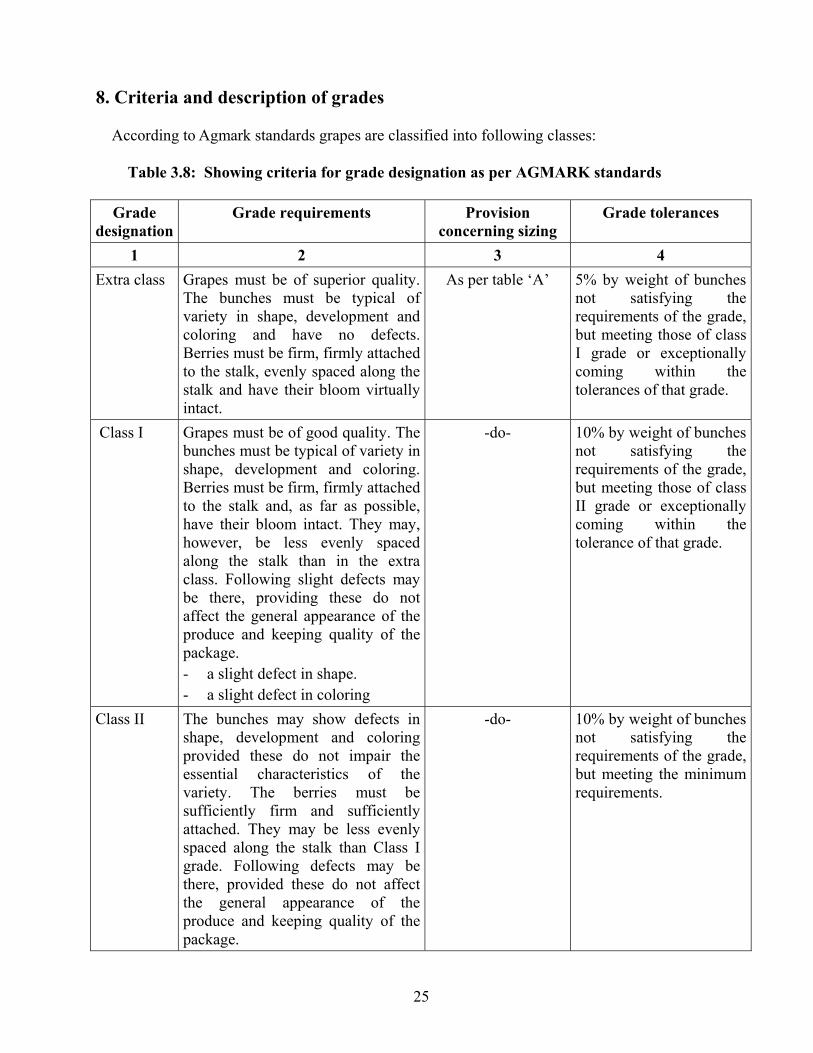
8. Criteria and description of grades According to Agmark standards grapes are classified into following classes:
Table 3.8: Showing criteria for grade designation as per AGMARK standards
Grade designation
Grade requirements Provision concerning sizing
Grade tolerances
1 2 3 4 Extra class Grapes must be of superior quality.
The bunches must be typical of variety in shape, development and coloring and have no defects. Berries must be firm, firmly attached to the stalk, evenly spaced along the stalk and have their bloom virtually intact.
As per table ‘A’ 5% by weight of bunches not satisfying the requirements of the grade, but meeting those of class I grade or exceptionally coming within the tolerances of that grade.
Class I Grapes must be of good quality. The bunches must be typical of variety in shape, development and coloring. Berries must be firm, firmly attached to the stalk and, as far as possible, have their bloom intact. They may, however, be less evenly spaced along the stalk than in the extra class. Following slight defects may be there, providing these do not affect the general appearance of the produce and keeping quality of the package. - a slight defect in shape. - a slight defect in coloring
-do- 10% by weight of bunches not satisfying the requirements of the grade, but meeting those of class II grade or exceptionally coming within the tolerance of that grade.
Class II The bunches may show defects in shape, development and coloring provided these do not impair the essential characteristics of the variety. The berries must be sufficiently firm and sufficiently attached. They may be less evenly spaced along the stalk than Class I grade. Following defects may be there, provided these do not affect the general appearance of the produce and keeping quality of the package.
-do- 10% by weight of bunches not satisfying the requirements of the grade, but meeting the minimum requirements.
26
- defects in shape - defects in coloring - slight sun scorch affecting the
skin only, - slight bruising, - slight skin defects
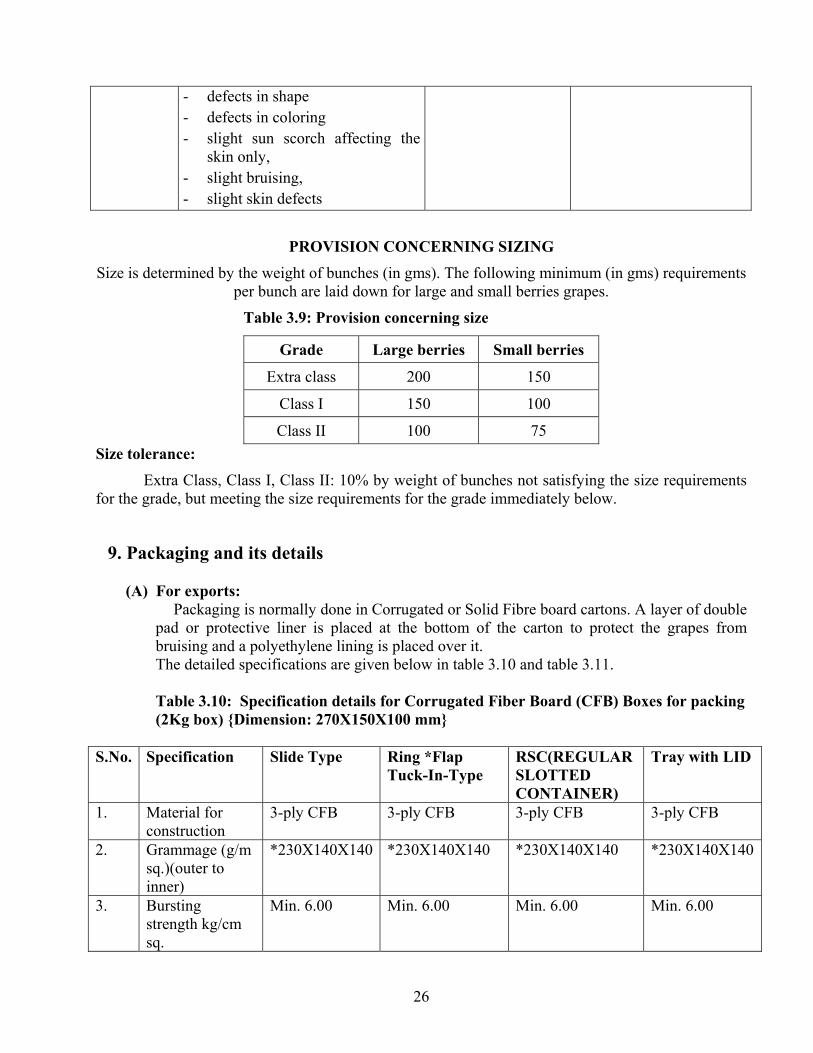
PROVISION CONCERNING SIZING
Size is determined by the weight of bunches (in gms). The following minimum (in gms) requirements per bunch are laid down for large and small berries grapes.
Table 3.9: Provision concerning size
Grade Large berries Small berries
Extra class 200 150
Class I 150 100
Class II 100 75 Size tolerance:
Extra Class, Class I, Class II: 10% by weight of bunches not satisfying the size requirements for the grade, but meeting the size requirements for the grade immediately below.
9. Packaging and its details
(A) For exports: Packaging is normally done in Corrugated or Solid Fibre board cartons. A layer of double pad or protective liner is placed at the bottom of the carton to protect the grapes from bruising and a polyethylene lining is placed over it. The detailed specifications are given below in table 3.10 and table 3.11.
Table 3.10: Specification details for Corrugated Fiber Board (CFB) Boxes for packing (2Kg box) {Dimension: 270X150X100 mm}
S.No. Specification Slide Type Ring *Flap Tuck-In-Type
RSC(REGULAR SLOTTED CONTAINER)
Tray with LID
1. Material for construction
3-ply CFB 3-ply CFB 3-ply CFB 3-ply CFB
2. Grammage (g/m sq.)(outer to inner)
*230X140X140 *230X140X140 *230X140X140 *230X140X140
3. Bursting strength kg/cm sq.
Min. 6.00 Min. 6.00 Min. 6.00 Min. 6.00
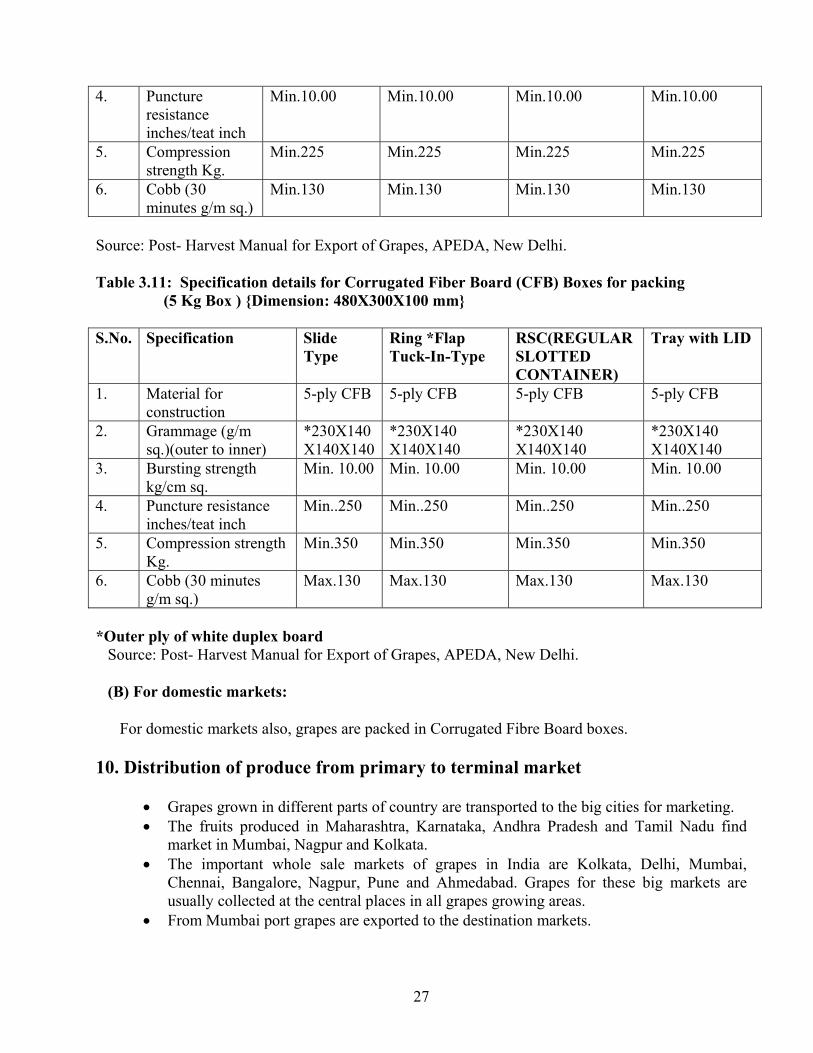
27
4. Puncture resistance inches/teat inch
Min.10.00 Min.10.00 Min.10.00 Min.10.00
5. Compression strength Kg.
Min.225 Min.225 Min.225 Min.225
6. Cobb (30 minutes g/m sq.)
Min.130 Min.130 Min.130 Min.130
Source: Post- Harvest Manual for Export of Grapes, APEDA, New Delhi.
Table 3.11: Specification details for Corrugated Fiber Board (CFB) Boxes for packing (5 Kg Box ) {Dimension: 480X300X100 mm} S.No. Specification Slide
Type Ring *Flap Tuck-In-Type
RSC(REGULAR SLOTTED CONTAINER)
Tray with LID
1. Material for construction
5-ply CFB 5-ply CFB 5-ply CFB 5-ply CFB
2. Grammage (g/m sq.)(outer to inner)
*230X140 X140X140
*230X140 X140X140
*230X140 X140X140
*230X140 X140X140
3. Bursting strength kg/cm sq.
Min. 10.00 Min. 10.00 Min. 10.00 Min. 10.00
4. Puncture resistance inches/teat inch
Min..250 Min..250 Min..250 Min..250
5. Compression strength Kg.
Min.350 Min.350 Min.350 Min.350
6. Cobb (30 minutes g/m sq.)
Max.130 Max.130 Max.130 Max.130
*Outer ply of white duplex board
Source: Post- Harvest Manual for Export of Grapes, APEDA, New Delhi.
(B) For domestic markets:
For domestic markets also, grapes are packed in Corrugated Fibre Board boxes.
10. Distribution of produce from primary to terminal market
• Grapes grown in different parts of country are transported to the big cities for marketing. • The fruits produced in Maharashtra, Karnataka, Andhra Pradesh and Tamil Nadu find
market in Mumbai, Nagpur and Kolkata. • The important whole sale markets of grapes in India are Kolkata, Delhi, Mumbai,
Chennai, Bangalore, Nagpur, Pune and Ahmedabad. Grapes for these big markets are usually collected at the central places in all grapes growing areas.
• From Mumbai port grapes are exported to the destination markets.
28
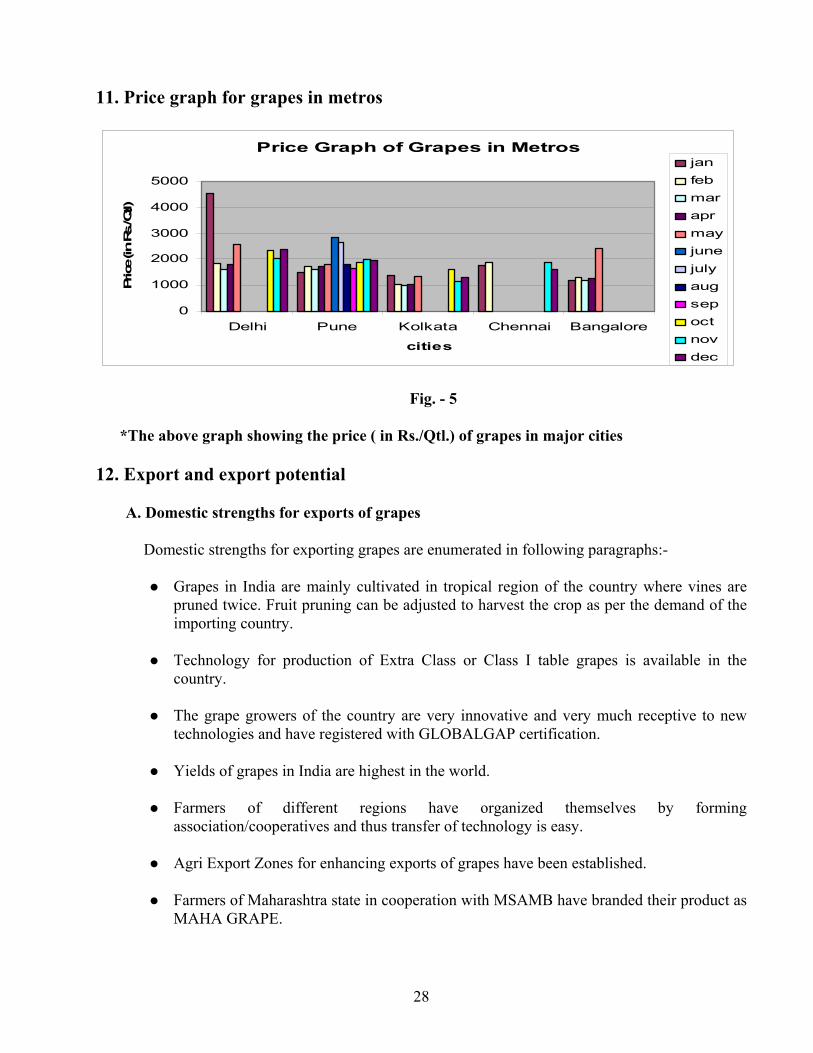
11. Price graph for grapes in metros
Price Graph of Grapes in Metros
0
1000
2000
3000
4000
5000
Delhi Pune Kolkata Chennai Bangalore
cities
Price (in
Rs./Q
tl)
janfebmaraprmayjunejulyaugsepoctnovdec
Fig. - 5
*The above graph showing the price ( in Rs./Qtl.) of grapes in major cities
12. Export and export potential
A. Domestic strengths for exports of grapes
Domestic strengths for exporting grapes are enumerated in following paragraphs:-
Grapes in India are mainly cultivated in tropical region of the country where vines are pruned twice. Fruit pruning can be adjusted to harvest the crop as per the demand of the importing country.
Technology for production of Extra Class or Class I table grapes is available in the country.
The grape growers of the country are very innovative and very much receptive to new technologies and have registered with GLOBALGAP certification.
Yields of grapes in India are highest in the world.
Farmers of different regions have organized themselves by forming association/cooperatives and thus transfer of technology is easy.
Agri Export Zones for enhancing exports of grapes have been established.
Farmers of Maharashtra state in cooperation with MSAMB have branded their product as MAHA GRAPE.
29
The grape cultivators have research support from NRC for grapes, Pune, IIHR, Bangalore and State Agricultural Universities.
Grape growers in cooperation with MSAMB and APEDA have set up modern packhouses for handling and packing of grapes for exports.
APEDA has already set up a residue analysis laboratory at Pune for grape growing area of Maharashtra in order to cater to phytosanitary requirements of importing countries.
Geographically India is at an advantageous position as compared to Chile, South Africa and Israel for exporting grapes to South East Asian countries like Hong Kong, Singapore etc.
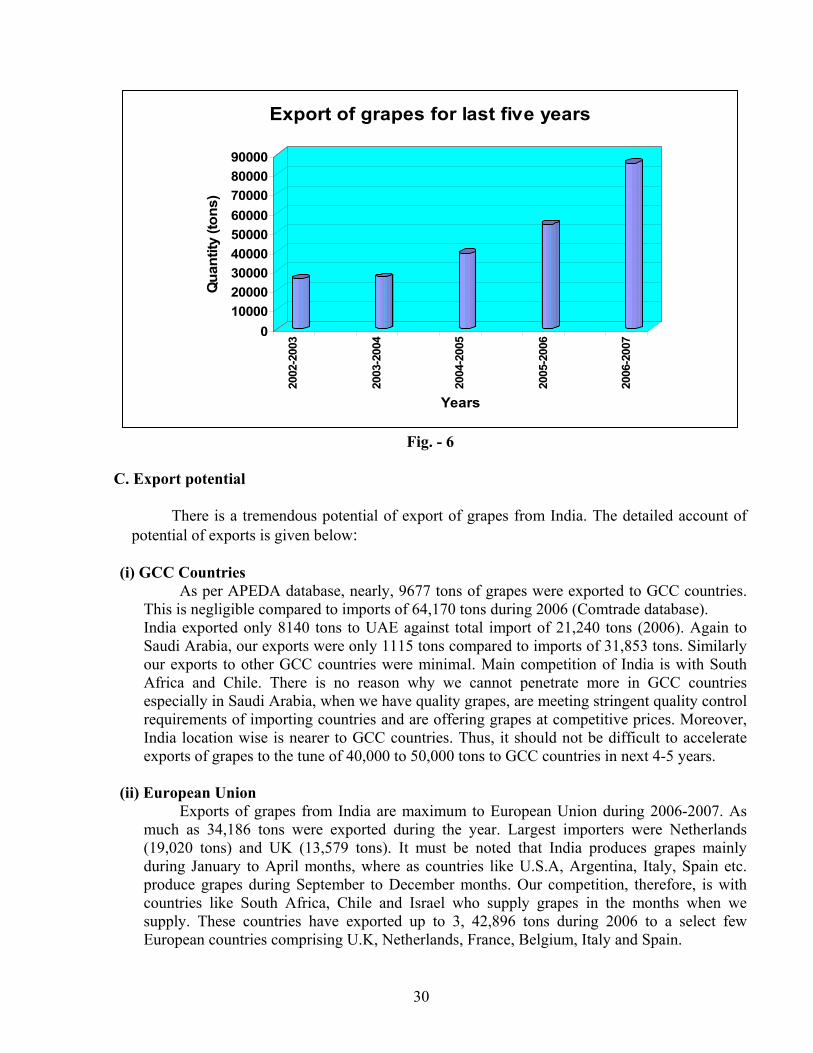
B. Exports
There is a phenomenal rise in export of grapes from India, as only 25,567 tons were exported during 2002-2003 which has increased to 85,562 tons in 2006-2007.(APEDA database). Increase has been observed mainly in the last 2-3 years, because of the fact that India has met the requirements of EU countries on minimization of pesticide residues (Table 3.12 & Fig. 6)
Table 3.12: Exports of grapes from India
Years Quantity (tons) Value (in Rs. Lakhs) 2002-2003 25567 10867.1 2003-2004 26469 10368.3 2004-2005 38898 12643.7 2005-2006 53908 21382.8 2006-2007 85562 30058.4
Source: APEDA Database, 2006-07
30
0100002000030000400005000060000700008000090000
Qua
ntity
(ton
s)
2002
-200
3
2003
-200
4
2004
-200
5
2005
-200
6
2006
-200
7
Years
Export of grapes for last five years
Fig. - 6
C. Export potential
There is a tremendous potential of export of grapes from India. The detailed account of potential of exports is given below:
(i) GCC Countries As per APEDA database, nearly, 9677 tons of grapes were exported to GCC countries.
This is negligible compared to imports of 64,170 tons during 2006 (Comtrade database). India exported only 8140 tons to UAE against total import of 21,240 tons (2006). Again to Saudi Arabia, our exports were only 1115 tons compared to imports of 31,853 tons. Similarly our exports to other GCC countries were minimal. Main competition of India is with South Africa and Chile. There is no reason why we cannot penetrate more in GCC countries especially in Saudi Arabia, when we have quality grapes, are meeting stringent quality control requirements of importing countries and are offering grapes at competitive prices. Moreover, India location wise is nearer to GCC countries. Thus, it should not be difficult to accelerate exports of grapes to the tune of 40,000 to 50,000 tons to GCC countries in next 4-5 years.
(ii) European Union
Exports of grapes from India are maximum to European Union during 2006-2007. As much as 34,186 tons were exported during the year. Largest importers were Netherlands (19,020 tons) and UK (13,579 tons). It must be noted that India produces grapes mainly during January to April months, where as countries like U.S.A, Argentina, Italy, Spain etc. produce grapes during September to December months. Our competition, therefore, is with countries like South Africa, Chile and Israel who supply grapes in the months when we supply. These countries have exported up to 3, 42,896 tons during 2006 to a select few European countries comprising U.K, Netherlands, France, Belgium, Italy and Spain.
31
Since India is meeting quality requirements including pesticide residues of all the importing countries in EU and supplying grapes at competitive prices, there is no reason why we cannot penetrate in the markets of Belgium, Germany, Spain and have larger share of imports in Netherlands and UK. Thus, it should not be difficult to meet the targets of export of 20 to 25 % of total imports of EU i.e. 3, 42,896 tons of grapes in this season in next 4-5 years.
Russian Federation imports as much as 3, 20,677 tons in addition to imports of Ukraine to the tune of 55,168 tons. Therefore, India must make concentrated efforts to accelerate export of grapes to these countries also.
(iii) ASEAN countries
ASEAN countries import grapes to the tune of 1,04,477 tons. The demand for grapes has increased by 50% from the year 2003. The main importers are Indonesia (26,366 tons), Philippines (14,748 tons), Singapore (12,166 tons) and Vietnam (11,025 tons). Main competitors with India for export of grapes to these countries are U.S.A, Australia, China and South Africa. Out of total quantity of 1,04,477 tons, approx 40,000-50,000 tons are supplied by U.S.A , 17,000 to 20,000 tons by Australia and 10,000- 11,000 tons by China and South Africa each. However, supplies from U.S.A and China are during September to December months and thus India’s competition is with South Africa, Chile and Australia. India can easily compete with these countries, as India location wise is closer to ASEAN countries compared to South Africa and Chile. Moreover, India is supplying grapes at competitive prices.
At present, India has exported only 196 tons to Malaysia, 93 tons to Singapore, 78 tons to Thailand, 34 tons to Indonesia and 13 tons Vietnam during 2006. These export volumes are negligible compared to the potential that exists. Moreover because of free trade agreements with Thailand and Singapore (likely to be signed very soon), exports of grapes are likely to accelerate, as even otherwise import duties of the order of 5-7% only are imposed by Malaysia, Philippines and Indonesia. Thus, in next 4-5 years time, target of export of 10,000-15,000 is not difficult to meet as India is producing quality grapes and is able to meet quality requirements. India must campaign aggressively and nurture these markets.
(iv) Hong Kong
Hong Kong is a trade hub and imported up to 91,517 tons and exported up to 46,868 tons during 2006. However, India exported only 156 tons during 2006.There is excellent potential and also possibility of realizing higher prices in Hong Kong market. India must make aggressive campaign and nurture the market.
(v) Pacific Rim countries and China
Pacific Rim countries comprising South Korea, Japan and Australia are also importing grapes to the extent of 17,921, 9949 and 4759 tons respectively. At present India is not exporting any quantity of grapes to these countries.
It is expected that with the signing of Free Trade Agreement with South Korea, export of grapes should initiate. Similarly with China, grape export should be explored as China has imported 46,021 tons of grapes during 2006. India and China are participants in Asia Pacific Trade Agreement.
32
D. Measures for enhancing competitiveness for exporting grapes
Following measures need to be adopted for enhancing competitiveness for exporting grapes.
Competition of India is with countries like Chile, South Africa and Israel, which produce quality grapes. Therefore, India must maintain superior quality free from pesticide residues etc. for keeping up momentum of exports.
There is huge demand of grapes in Hong Kong, Singapore, Malaysia etc., India needs to exploit this opportunity, by holding fruit shows, exhibitions and buyer- seller meets frequently.
India needs to enhance its competitiveness by making grapes available during Ramzan period in Middle East countries and in Malaysia, Indonesia etc, by altering pruning time for fruiting.
India can further enhance its competitiveness by economizing on logistics by exporting from eastern port to South East Asian countries and by intensifying production in Andhra Pradesh.
Similarly, grapes can be made available during Christmas period by changing pruning time for fruiting.
13. Storage
Temperature : 0 ± 0.5o C Relative Humidity : 93 ± 2 % Storage period : 3-8 weeks Freezing point : -1o C
14. Documents required for exports
a) Documents related to goods: -
a) Invoice b) Packing List c) Certificate of origin
b) Documents related to shipment: -
a) Mate Receipt b) Shipping Bill c) Bill of handing d) Airway Bill
c) Documents related to Payment: -
a) Letter of Credit (L/C) b) Bill of Exchange
33
d) Documents related to quality of goods: -
a) Phytosanitary Certificate b) GLOBALGAP Certification c) Health Certificate
e) Organic Certification: -
- Certificate indicating material produce is based on organic farming.
f) Documents related to Foreign Exchange Regulations: -
GR Form: Documents required by RBI which assures to RBI that the exporter will realize
the proceeds of goods within 180 days from the date of Shipment.
g) Other Document:
Bank Realization Certification (BRC): This is the advice given by Foreign Exchange Bank
after the realization of money from Importer.
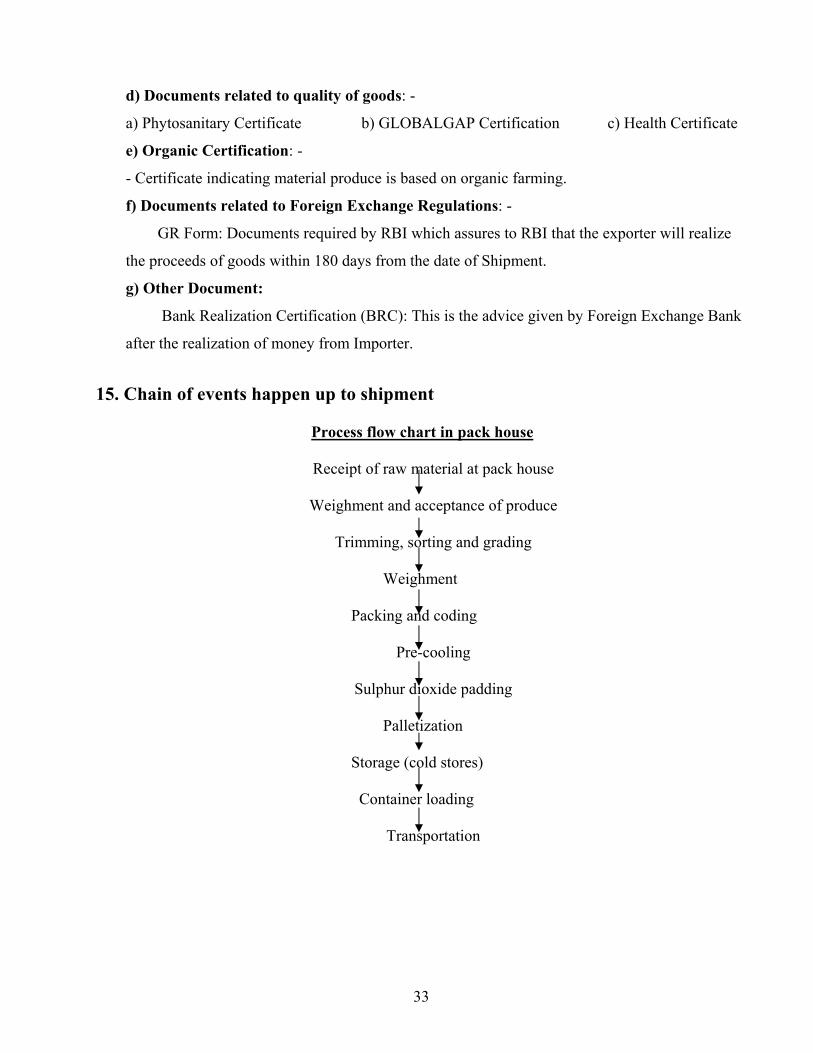
15. Chain of events happen up to shipment Process flow chart in pack house
Receipt of raw material at pack house
Weighment and acceptance of produce
Trimming, sorting and grading
Weighment
Packing and coding
Pre-cooling
Sulphur dioxide padding
Palletization
Storage (cold stores)
Container loading
Transportation
34
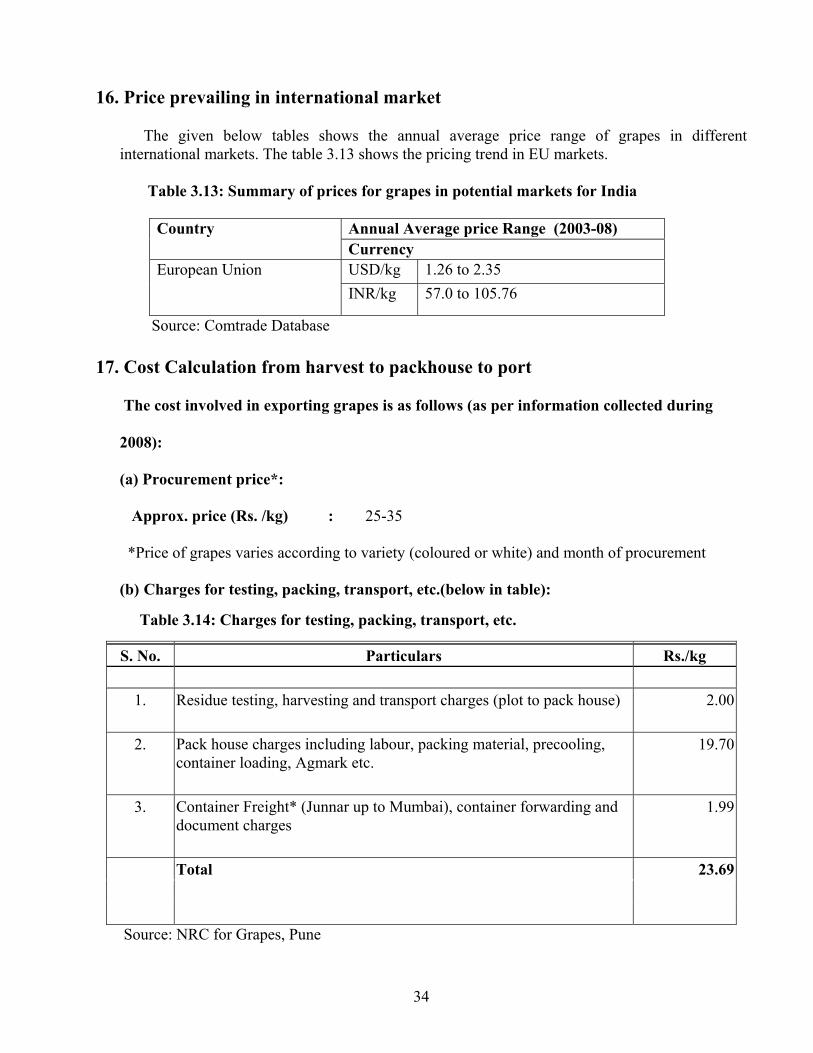
16. Price prevailing in international market
The given below tables shows the annual average price range of grapes in different international markets. The table 3.13 shows the pricing trend in EU markets.
Table 3.13: Summary of prices for grapes in potential markets for India
Annual Average price Range (2003-08) Country Currency USD/kg 1.26 to 2.35 European Union
INR/kg 57.0 to 105.76
Source: Comtrade Database 17. Cost Calculation from harvest to packhouse to port
The cost involved in exporting grapes is as follows (as per information collected during
2008):
(a) Procurement price*:
Approx. price (Rs. /kg) : 25-35 *Price of grapes varies according to variety (coloured or white) and month of procurement (b) Charges for testing, packing, transport, etc.(below in table): Table 3.14: Charges for testing, packing, transport, etc.
S. No. Particulars Rs./kg
1. Residue testing, harvesting and transport charges (plot to pack house) 2.00
2. Pack house charges including labour, packing material, precooling, container loading, Agmark etc.
19.70
3. Container Freight* (Junnar up to Mumbai), container forwarding and document charges
1.99
Total 23.69
Source: NRC for Grapes, Pune
35
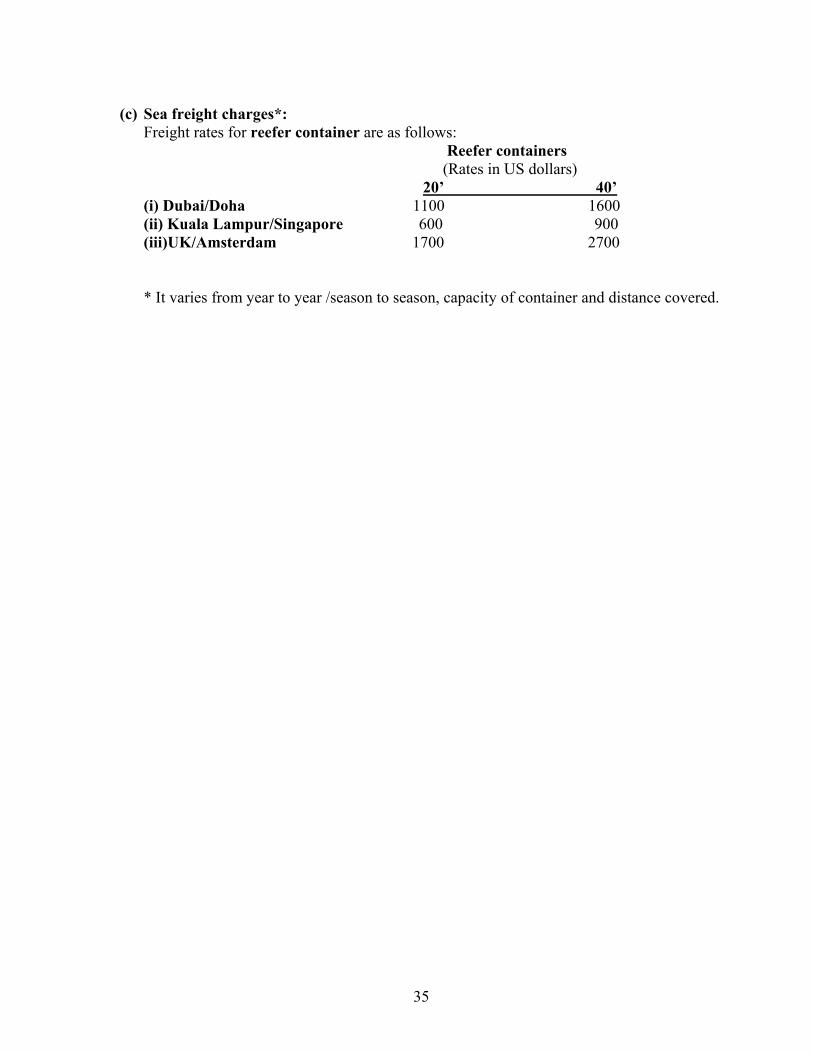
(c) Sea freight charges*:
Freight rates for reefer container are as follows: Reefer containers (Rates in US dollars) 20’ 40’
(i) Dubai/Doha 1100 1600 (ii) Kuala Lampur/Singapore 600 900 (iii)UK/Amsterdam 1700 2700
* It varies from year to year /season to season, capacity of container and distance covered.
36
CHAPTER - 4 POMEGRANATE
1. Introduction
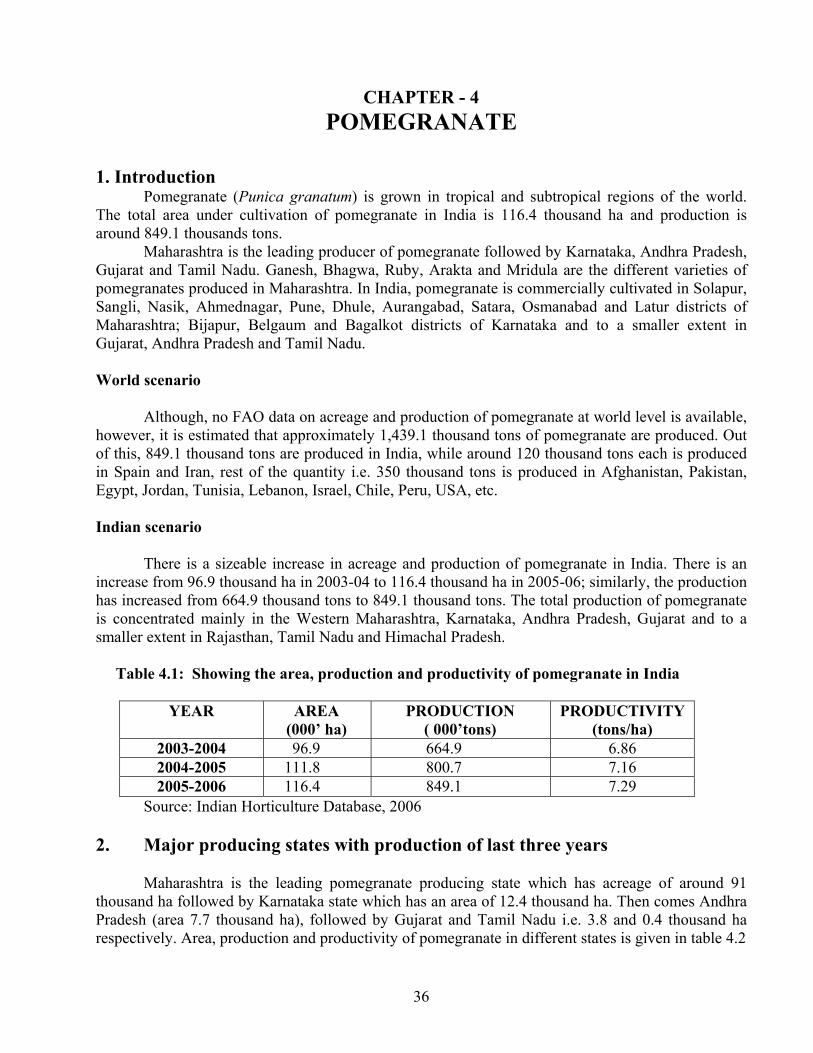
Pomegranate (Punica granatum) is grown in tropical and subtropical regions of the world. The total area under cultivation of pomegranate in India is 116.4 thousand ha and production is around 849.1 thousands tons.
Maharashtra is the leading producer of pomegranate followed by Karnataka, Andhra Pradesh, Gujarat and Tamil Nadu. Ganesh, Bhagwa, Ruby, Arakta and Mridula are the different varieties of pomegranates produced in Maharashtra. In India, pomegranate is commercially cultivated in Solapur, Sangli, Nasik, Ahmednagar, Pune, Dhule, Aurangabad, Satara, Osmanabad and Latur districts of Maharashtra; Bijapur, Belgaum and Bagalkot districts of Karnataka and to a smaller extent in Gujarat, Andhra Pradesh and Tamil Nadu. World scenario
Although, no FAO data on acreage and production of pomegranate at world level is available, however, it is estimated that approximately 1,439.1 thousand tons of pomegranate are produced. Out of this, 849.1 thousand tons are produced in India, while around 120 thousand tons each is produced in Spain and Iran, rest of the quantity i.e. 350 thousand tons is produced in Afghanistan, Pakistan, Egypt, Jordan, Tunisia, Lebanon, Israel, Chile, Peru, USA, etc.
Indian scenario
There is a sizeable increase in acreage and production of pomegranate in India. There is an increase from 96.9 thousand ha in 2003-04 to 116.4 thousand ha in 2005-06; similarly, the production has increased from 664.9 thousand tons to 849.1 thousand tons. The total production of pomegranate is concentrated mainly in the Western Maharashtra, Karnataka, Andhra Pradesh, Gujarat and to a smaller extent in Rajasthan, Tamil Nadu and Himachal Pradesh. Table 4.1: Showing the area, production and productivity of pomegranate in India
YEAR AREA (000’ ha)
PRODUCTION ( 000’tons)
PRODUCTIVITY (tons/ha)
2003-2004 96.9 664.9 6.86 2004-2005 111.8 800.7 7.16 2005-2006 116.4 849.1 7.29
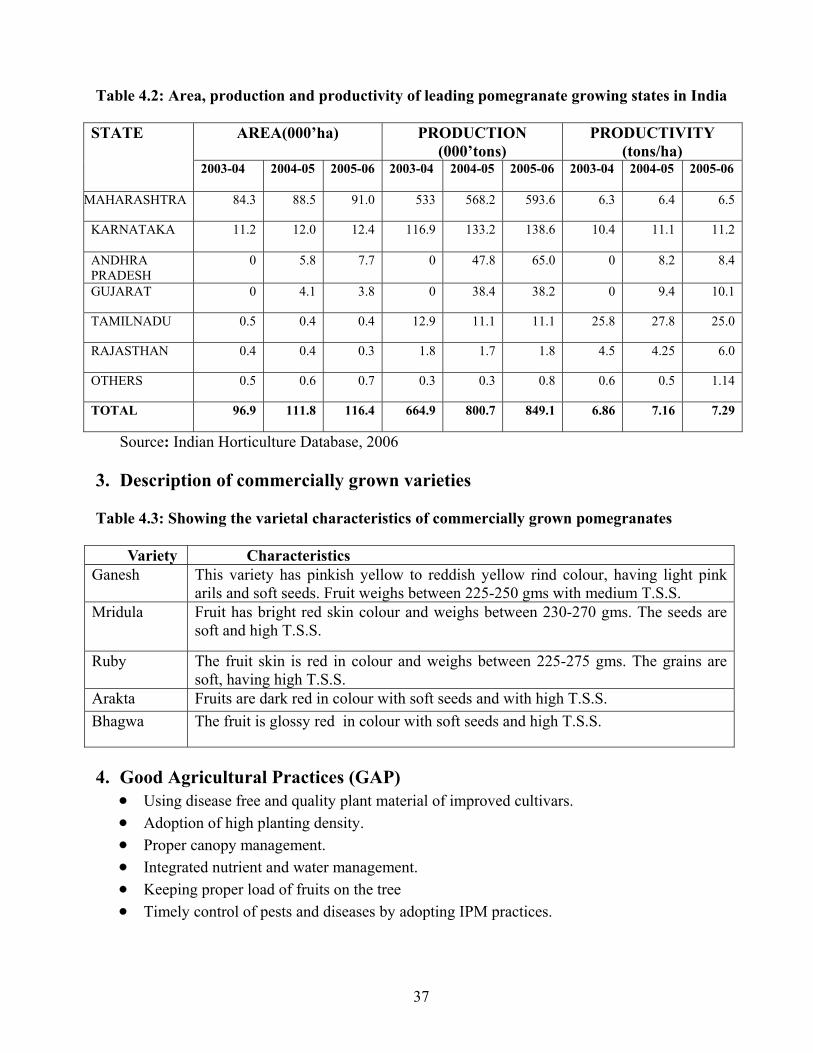
Source: Indian Horticulture Database, 2006 2. Major producing states with production of last three years Maharashtra is the leading pomegranate producing state which has acreage of around 91 thousand ha followed by Karnataka state which has an area of 12.4 thousand ha. Then comes Andhra Pradesh (area 7.7 thousand ha), followed by Gujarat and Tamil Nadu i.e. 3.8 and 0.4 thousand ha respectively. Area, production and productivity of pomegranate in different states is given in table 4.2
37
Table 4.2: Area, production and productivity of leading pomegranate growing states in India
AREA(000’ha) PRODUCTION (000’tons)
PRODUCTIVITY (tons/ha)
STATE
2003-04
2004-05 2005-06 2003-04 2004-05 2005-06 2003-04 2004-05 2005-06
MAHARASHTRA 84.3 88.5 91.0 533 568.2 593.6 6.3 6.4 6.5
KARNATAKA 11.2 12.0 12.4 116.9 133.2 138.6 10.4 11.1 11.2
ANDHRA PRADESH
0 5.8 7.7 0 47.8 65.0 0 8.2 8.4
GUJARAT 0 4.1 3.8 0 38.4 38.2 0 9.4 10.1
TAMILNADU 0.5 0.4 0.4 12.9 11.1 11.1 25.8 27.8 25.0
RAJASTHAN 0.4 0.4 0.3 1.8 1.7 1.8 4.5 4.25 6.0
OTHERS 0.5 0.6 0.7 0.3 0.3 0.8 0.6 0.5 1.14
TOTAL 96.9 111.8 116.4 664.9 800.7 849.1 6.86 7.16 7.29
Source: Indian Horticulture Database, 2006
3. Description of commercially grown varieties Table 4.3: Showing the varietal characteristics of commercially grown pomegranates Variety Characteristics Ganesh This variety has pinkish yellow to reddish yellow rind colour, having light pink
arils and soft seeds. Fruit weighs between 225-250 gms with medium T.S.S. Mridula Fruit has bright red skin colour and weighs between 230-270 gms. The seeds are
soft and high T.S.S.
Ruby The fruit skin is red in colour and weighs between 225-275 gms. The grains are soft, having high T.S.S.
Arakta Fruits are dark red in colour with soft seeds and with high T.S.S. Bhagwa The fruit is glossy red in colour with soft seeds and high T.S.S.
4. Good Agricultural Practices (GAP)
• Using disease free and quality plant material of improved cultivars. • Adoption of high planting density. • Proper canopy management. • Integrated nutrient and water management. • Keeping proper load of fruits on the tree • Timely control of pests and diseases by adopting IPM practices.
38
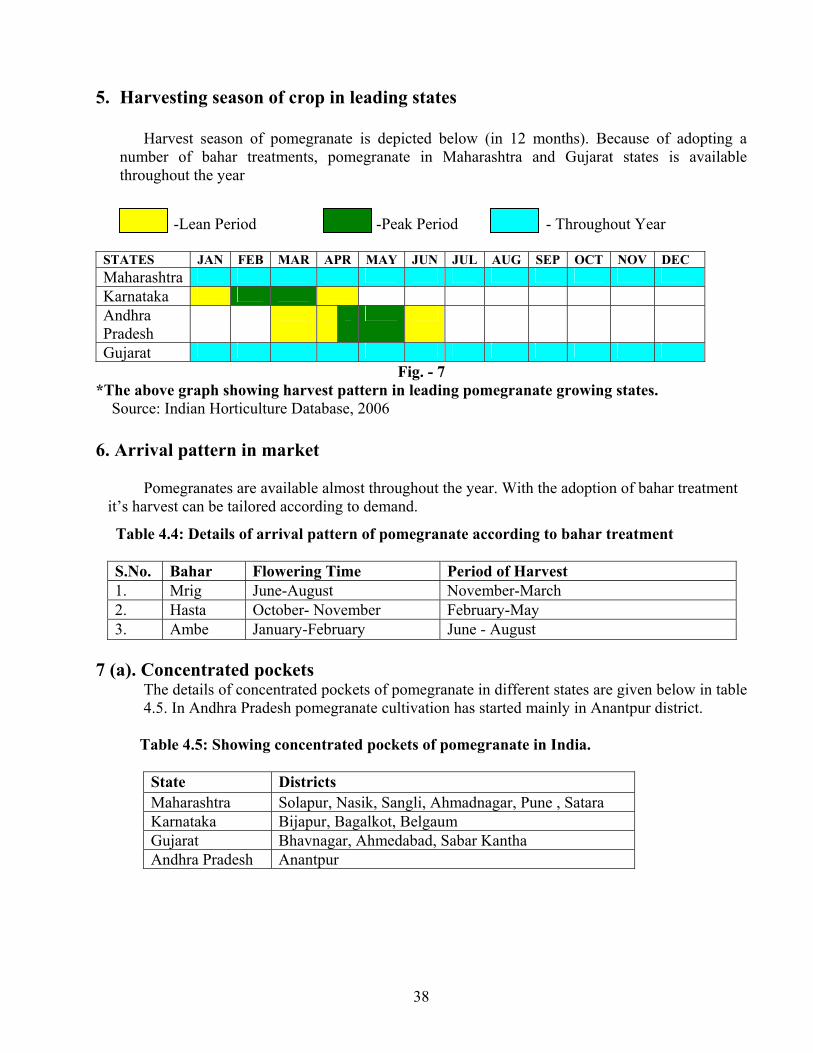
5. Harvesting season of crop in leading states
Harvest season of pomegranate is depicted below (in 12 months). Because of adopting a number of bahar treatments, pomegranate in Maharashtra and Gujarat states is available throughout the year
-Lean Period -Peak Period - Throughout Year
STATES JAN FEB MAR APR MAY JUN JUL AUG SEP OCT NOV DEC Maharashtra Karnataka Andhra Pradesh
Gujarat Fig. - 7
*The above graph showing harvest pattern in leading pomegranate growing states. Source: Indian Horticulture Database, 2006 6. Arrival pattern in market
Pomegranates are available almost throughout the year. With the adoption of bahar treatment it’s harvest can be tailored according to demand.
Table 4.4: Details of arrival pattern of pomegranate according to bahar treatment S.No. Bahar Flowering Time Period of Harvest 1. Mrig June-August November-March 2. Hasta October- November February-May 3. Ambe January-February June - August
7 (a). Concentrated pockets
The details of concentrated pockets of pomegranate in different states are given below in table 4.5. In Andhra Pradesh pomegranate cultivation has started mainly in Anantpur district.
Table 4.5: Showing concentrated pockets of pomegranate in India.
State Districts Maharashtra Solapur, Nasik, Sangli, Ahmadnagar, Pune , Satara Karnataka Bijapur, Bagalkot, Belgaum Gujarat Bhavnagar, Ahmedabad, Sabar Kantha Andhra Pradesh Anantpur
39
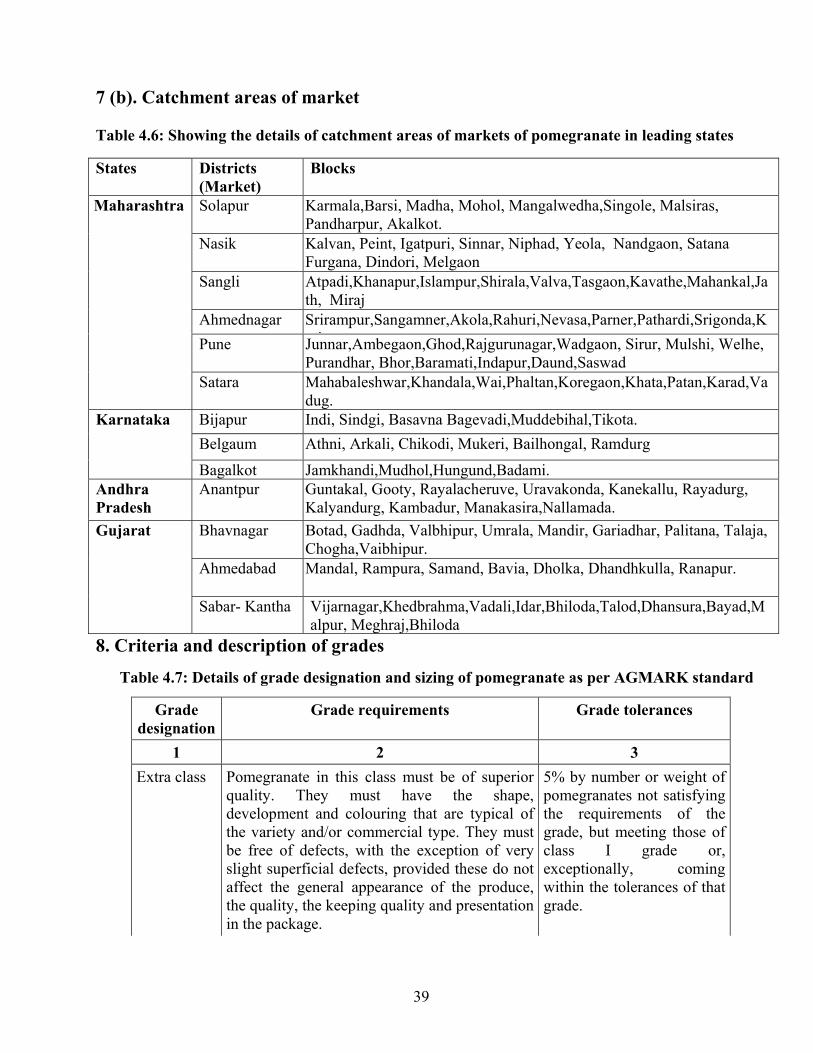
7 (b). Catchment areas of market Table 4.6: Showing the details of catchment areas of markets of pomegranate in leading states
8. Criteria and description of grades
Table 4.7: Details of grade designation and sizing of pomegranate as per AGMARK standard
Grade designation
Grade requirements Grade tolerances
1 2 3 Extra class Pomegranate in this class must be of superior
quality. They must have the shape, development and colouring that are typical of the variety and/or commercial type. They must be free of defects, with the exception of very slight superficial defects, provided these do not affect the general appearance of the produce, the quality, the keeping quality and presentation in the package.
5% by number or weight of pomegranates not satisfying the requirements of the grade, but meeting those of class I grade or, exceptionally, coming within the tolerances of that grade.
States Districts (Market)
Blocks
Solapur Karmala,Barsi, Madha, Mohol, Mangalwedha,Singole, Malsiras, Pandharpur, Akalkot.
Nasik Kalvan, Peint, Igatpuri, Sinnar, Niphad, Yeola, Nandgaon, Satana Furgana, Dindori, Melgaon
Sangli Atpadi,Khanapur,Islampur,Shirala,Valva,Tasgaon,Kavathe,Mahankal,Jath, Miraj
Ahmednagar Srirampur,Sangamner,Akola,Rahuri,Nevasa,Parner,Pathardi,Srigonda,Kj tPune Junnar,Ambegaon,Ghod,Rajgurunagar,Wadgaon, Sirur, Mulshi, Welhe,
Purandhar, Bhor,Baramati,Indapur,Daund,Saswad
Maharashtra
Satara Mahabaleshwar,Khandala,Wai,Phaltan,Koregaon,Khata,Patan,Karad,Vadug.
Bijapur Indi, Sindgi, Basavna Bagevadi,Muddebihal,Tikota. Belgaum Athni, Arkali, Chikodi, Mukeri, Bailhongal, Ramdurg
Karnataka
Bagalkot Jamkhandi,Mudhol,Hungund,Badami. Andhra Pradesh
Anantpur Guntakal, Gooty, Rayalacheruve, Uravakonda, Kanekallu, Rayadurg, Kalyandurg, Kambadur, Manakasira,Nallamada.
Bhavnagar Botad, Gadhda, Valbhipur, Umrala, Mandir, Gariadhar, Palitana, Talaja, Chogha,Vaibhipur.
Ahmedabad Mandal, Rampura, Samand, Bavia, Dholka, Dhandhkulla, Ranapur.
Gujarat
Sabar- Kantha Vijarnagar,Khedbrahma,Vadali,Idar,Bhiloda,Talod,Dhansura,Bayad,Malpur, Meghraj,Bhiloda
40
Class I Pomegranates in this class must be of good quality. They must be characteristics of the variety and/or commercial type. The following slight defects may be allowed, provided these do not affect the general appearance of the produce, the quality, the keeping quality and presentation in the package. - a slight defect in shape. - a slight defect in colouring; - slight skin defects(i.e. scratches,scars,scraps
and blemishes) not exceeding 5% of the total surface area.
10% by number or weight of pomegranates not satisfying the requirements of the class, but meeting those of class II or, exceptionally, coming within the tolerances of that grade.
Class II This class includes pomegranates which do not qualify for inclusion in higher classes, but satisfy the minimum requirements. Following defects may be there provided the pomegranates retain their essential characteristics as regard the quality, the keeping quality and presentation: - defects in shape; - defects in colouring - skin defects(i.e., scratches ,scars, scrapes
and blemishes), not exceeding 10% of the total surface area
10% by number or weight of pomegranates not satisfying the requirements of the grade, but meeting the minimum requirements.
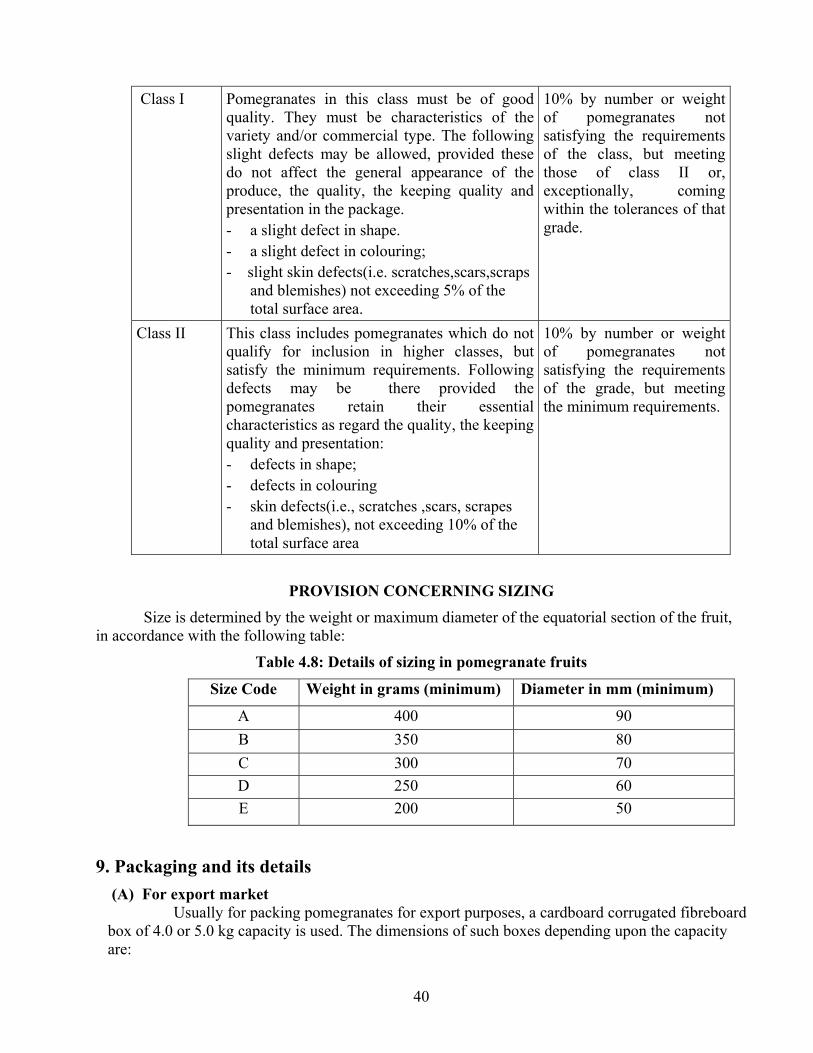
PROVISION CONCERNING SIZING
Size is determined by the weight or maximum diameter of the equatorial section of the fruit, in accordance with the following table:
Table 4.8: Details of sizing in pomegranate fruits
Size Code Weight in grams (minimum) Diameter in mm (minimum)
A 400 90 B 350 80 C 300 70 D 250 60 E 200 50
9. Packaging and its details
(A) For export market Usually for packing pomegranates for export purposes, a cardboard corrugated fibreboard box of 4.0 or 5.0 kg capacity is used. The dimensions of such boxes depending upon the capacity are:
41
i. For 4Kg box - 375 x 275 x 100 mm ii. For 5 Kg box- 480 x 300 x 100 mm The details specifications are given below in the table 4.9.
Table 4.9: Specification details for Corrugated Fiber Board (CFB) Boxes for packing pomegranates for exports
*Outer ply of white duplex board
Source: Post- Harvest Manual for Export of Pomegranates, APEDA, New Delhi.
(B) For domestic markets
For domestic markets also, the pomegranate is packed in Corrugated Fiber Board boxes, according to their weight.
10. Distribution of produce from primary to terminal market
Pomegranates grown in different parts of country are transported to the big cities for marketing. The fruits produced in Maharashtra, Karnataka, Andhra Pradesh and Tamil Nadu find market in
Mumbai, Nagpur and Kolkata. The important whole sale markets of pomegranate in India are Kolkata, Delhi, Mumbai, Chennai,
Bangalore, Nagpur, Pune and Ahmedabad. Pomegranates for these big markets are usually collected at the central places in all pomegranate growing areas.
From Mumbai and Kolkata ports the pomegranate is exported to the destination markets.
Specification Ring & Flap Tuck in type RSC (regular slotted container)
Slide type
1. Material of Construction
5 Ply CFB 3 Ply CFB 5 Ply CFB
2. Grammage gm/m2 (outer to inner)
*230X140X 140X140X140
*230X140X 140X140X140
*230X140X 140X140X140
3. Bursting strength kg/cm2
Min 10
Min 10
Min 10
4. Puncture resistance, inches/tear inch
Min 250
Min 250
Min 250
5. Compression strength, kgf
Min 350
Min 350
Min 350
6. Cobb (30 min g/m2) Max 130 Max 130 Max 130
42
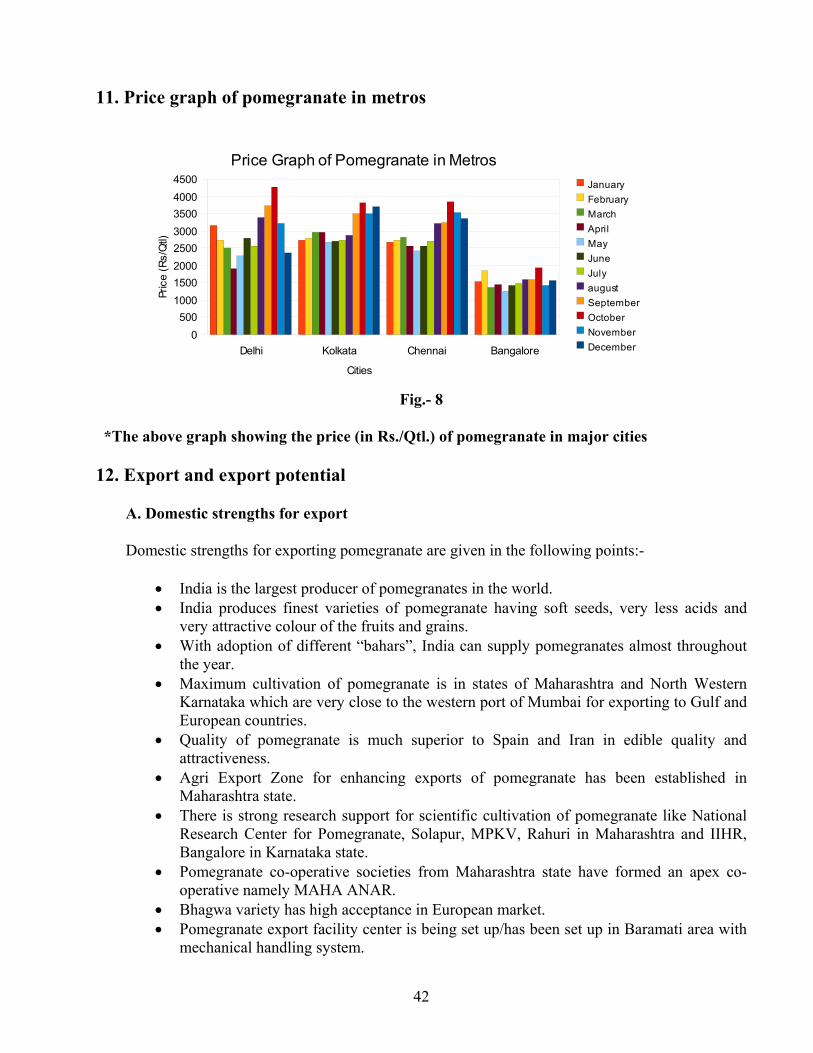
11. Price graph of pomegranate in metros
Fig.- 8
*The above graph showing the price (in Rs./Qtl.) of pomegranate in major cities
12. Export and export potential
A. Domestic strengths for export
Domestic strengths for exporting pomegranate are given in the following points:-
• India is the largest producer of pomegranates in the world. • India produces finest varieties of pomegranate having soft seeds, very less acids and
very attractive colour of the fruits and grains. • With adoption of different “bahars”, India can supply pomegranates almost throughout
the year. • Maximum cultivation of pomegranate is in states of Maharashtra and North Western
Karnataka which are very close to the western port of Mumbai for exporting to Gulf and European countries.
• Quality of pomegranate is much superior to Spain and Iran in edible quality and attractiveness.
• Agri Export Zone for enhancing exports of pomegranate has been established in Maharashtra state.
• There is strong research support for scientific cultivation of pomegranate like National Research Center for Pomegranate, Solapur, MPKV, Rahuri in Maharashtra and IIHR, Bangalore in Karnataka state.
• Pomegranate co-operative societies from Maharashtra state have formed an apex co-operative namely MAHA ANAR.
• Bhagwa variety has high acceptance in European market. • Pomegranate export facility center is being set up/has been set up in Baramati area with
mechanical handling system.
Delhi Kolkata Chennai Bangalore0
50010001500200025003000350040004500
Price Graph of Pomegranate in MetrosJanuaryFebruaryMarchAprilMayJuneJulyaugustSeptemberOctoberNovemberDecember
Cities
Pric
e (R
s/Q
tl)
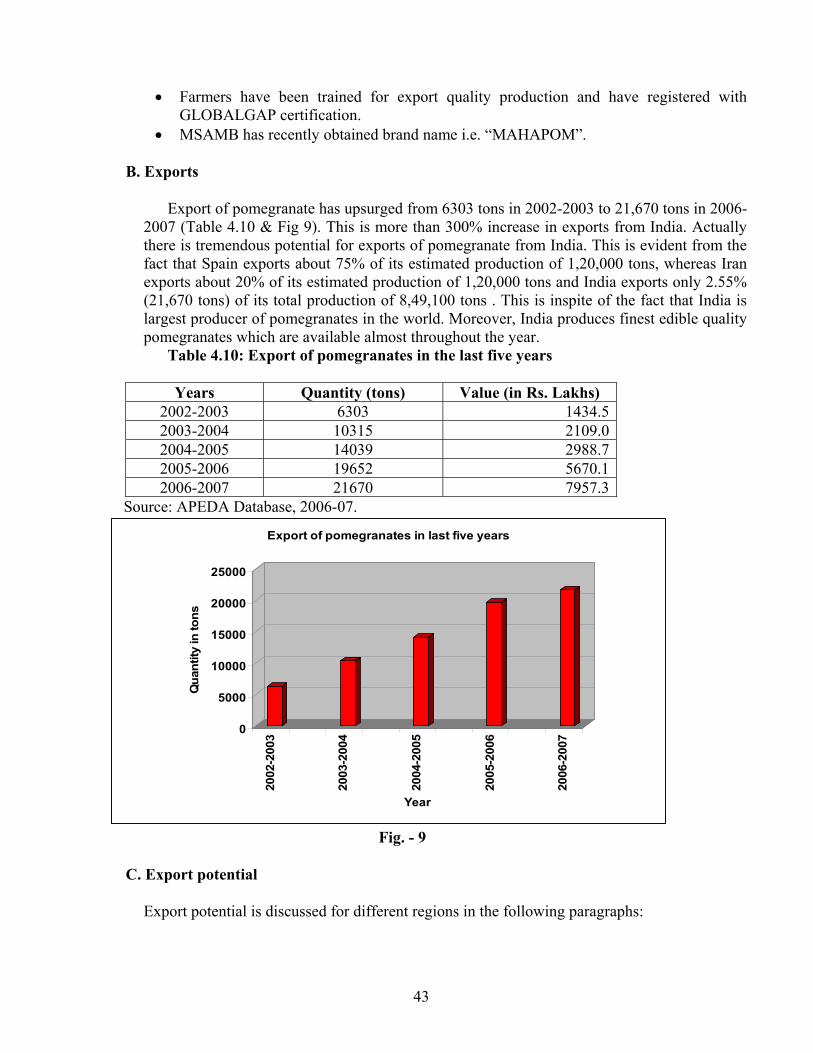
43
• Farmers have been trained for export quality production and have registered with GLOBALGAP certification.
• MSAMB has recently obtained brand name i.e. “MAHAPOM”.
B. Exports
Export of pomegranate has upsurged from 6303 tons in 2002-2003 to 21,670 tons in 2006-2007 (Table 4.10 & Fig 9). This is more than 300% increase in exports from India. Actually there is tremendous potential for exports of pomegranate from India. This is evident from the fact that Spain exports about 75% of its estimated production of 1,20,000 tons, whereas Iran exports about 20% of its estimated production of 1,20,000 tons and India exports only 2.55% (21,670 tons) of its total production of 8,49,100 tons . This is inspite of the fact that India is largest producer of pomegranates in the world. Moreover, India produces finest edible quality pomegranates which are available almost throughout the year.
Table 4.10: Export of pomegranates in the last five years Years Quantity (tons) Value (in Rs. Lakhs)
2002-2003 6303 1434.5 2003-2004 10315 2109.0 2004-2005 14039 2988.7 2005-2006 19652 5670.1 2006-2007 21670 7957.3
Source: APEDA Database, 2006-07.
0
5000
10000
15000
20000
25000
Qua
ntity
in to
ns
2002
-200
3
2003
-200
4
2004
-200
5
2005
-200
6
2006
-200
7
Year
Export of pomegranates in last five years
Fig. - 9
C. Export potential
Export potential is discussed for different regions in the following paragraphs:
44
(i) GCC Countries India exported only 11,924 tons of pomegranates to Gulf countries during 2006-2007.
Although, no data is available on exact quantity of imports from other countries like Spain and Iran, however, because of nearness, Iran and Lebanon are the main suppliers of pomegranates to Gulf countries. Supplies from Iran and Lebanon are from September to December months and start tapering from January month onwards.But in case of India, production of pomegranate is at peak from December to March months and continues up to April to June months with the help of Hast Bahar and Ambe Bahar crops. Thus, India can export pomegranate to Gulf Countries from January to June months without any competition from Iran and other countries. Even otherwise India is supplying pomegranates at competitive prices compared to Iran.
(ii) European Union
Exports from India to EU including Russia during 2006-2007 were 6342 tons as per APEDA database. There is 50% increase compared to exports of 4011 tons during 2005-2006. No data on imports of pomegranates from FAO or Comtrade database is available. In EU countries main supplier/exporter is Spain and supplies from this country prevail during September to December months and start tapering from January onwards.Like GCC countries, India with the help of Hast Bahar and Ambe Bahar crops can supply from January onwards up to July months and thus can dominate the market during these months without any competition from Spain, as only limited quantities are available from Chile, Peru etc.
(iii) ASEAN Countries
Exports of pomegranates is slowly increasing to ASEAN countries as there were exports of 125 tons to Malaysia, 89 tons to Singapore, 36 tons to Thailand and only 17 tons to Indonesia during 2006-07. There is no competition from any country; however aggressive campaign about its therapeutical properties needs to be made by holding fruit shows and nurturing the markets. Moreover Free Trade Agreements already signed with Thailand and to be signed soon with Singapore should further accelerate exports.
(iv) Pacific Rim countries and China
Exports to these countries are very negligible as only 40 tons were exported to Japan and 36 tons to China (2006-07). These countries need to be made aware about therapeutic qualities of this fruit by holding fruit shows etc. Moreover, Free Trade Agreement with South Korea (which is likely to be signed soon) and Asia Pacific Trade Agreement with China, is likely to further provide opportunities for export of pomegranates. If there is requirement of irradiation for eliminating fruit fly, this can also be done, as facilities for same have been created in India.
(v) U.S.A. and Canada
India exported 275 tons of pomegranates to Canada and 46 tons to U.S.A. during 2006.Exports of pomegranates to Canada should be further accelerated as there is tremendous scope for exports to this country.
45
D. Measures for enhancing competitiveness for export
Following measures if adopted are likely to enhance competitiveness of Indian pomegranates in foreign markets:
• Competition of India with regard to export of pomegranates is with Spain and Iran, which are nearer to European countries who import maximum quantity.Our efforts needs to be towards lowering production cost by increasing productivity.
• For exporting to South East Asian countries, and to economize on cost of transport, it is suggested that special production areas for export need to be developed in Anantpur area in Andhra Pradesh and drier areas of Tamil Nadu, so that exports can be done from eastern ports.
• Packhouse facilities need to be established in Karnataka and Andhra Pradesh pomegranate growing areas also.
• India has already embarked upon building up quality and branding its product in order to compete with Spain and Iran. The Brand needs to be popularized aggressively.
• Pomegranate supplies from Spain and Iran to Europe taper from January onwards and therefore, supplies from India need to be concentrated during February to July months with the help of Hast and Ambe bahar when there will be no competition from Spain.
• Efforts need to be made to popularize pomegranates in Canada, U.S.A., South American countries etc by holding fruit fairs, exhibitions etc, as there is good price realization also from these countries.
• Similarly, efforts need to be accelerated in popularizing pomegranates in Australia, Korea, Japan, etc.
13. Storage
Temperature : 5-7°C
Relative Humidity : 90-95%
Storage Period : 2-3 months
14. Documents required for exports
a) Documents related to goods
a) Invoice b) Packing List c) Certificate of origin
b) Documents related to shipment
a) Mate Receipt b) Shipping Bill c) Bill of handing d) Airway Bill
c) Documents related to Payment
a) Letter of Credit (L/C) b) Bill of Exchange
d) Documents related to quality of goods
a) Phytosanitary Certificate b) GLOBALGAP Certification c) Health
Certificate
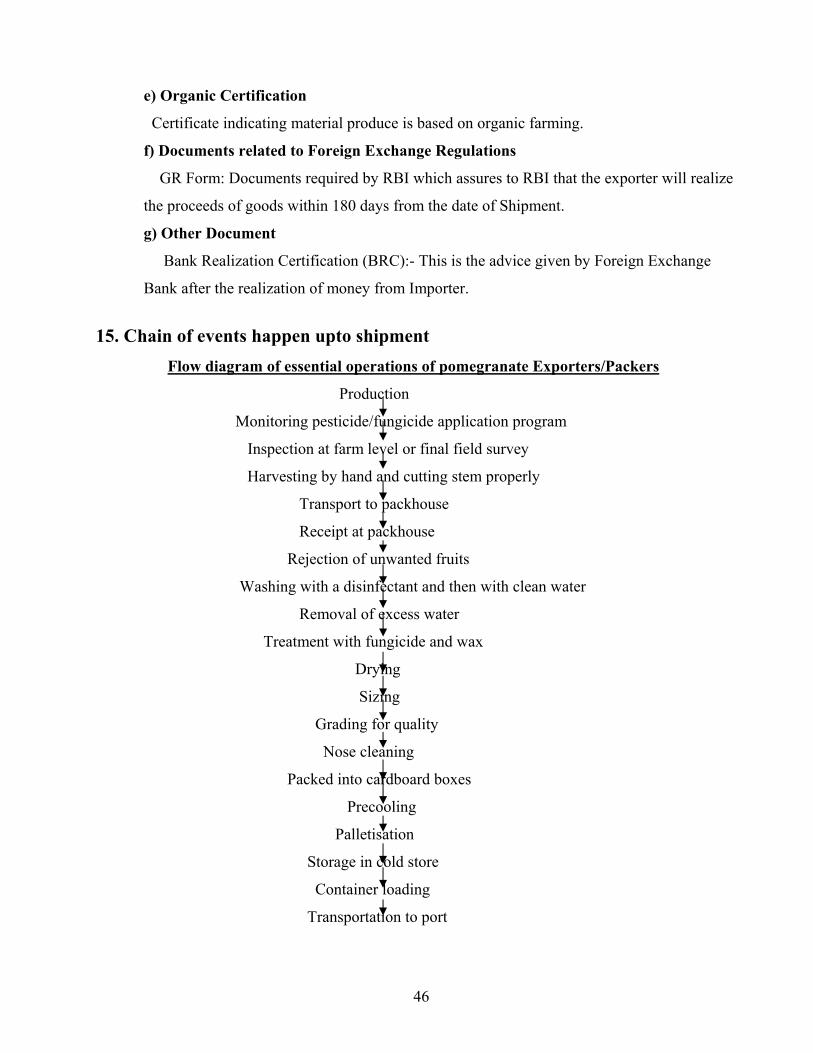
46
e) Organic Certification
Certificate indicating material produce is based on organic farming.
f) Documents related to Foreign Exchange Regulations
GR Form: Documents required by RBI which assures to RBI that the exporter will realize
the proceeds of goods within 180 days from the date of Shipment.
g) Other Document
Bank Realization Certification (BRC):- This is the advice given by Foreign Exchange
Bank after the realization of money from Importer.
15. Chain of events happen upto shipment Flow diagram of essential operations of pomegranate Exporters/Packers
Production
Monitoring pesticide/fungicide application program
Inspection at farm level or final field survey
Harvesting by hand and cutting stem properly
Transport to packhouse
Receipt at packhouse
Rejection of unwanted fruits
Washing with a disinfectant and then with clean water
Removal of excess water
Treatment with fungicide and wax
Drying
Sizing
Grading for quality
Nose cleaning
Packed into cardboard boxes
Precooling
Palletisation
Storage in cold store
Container loading
Transportation to port
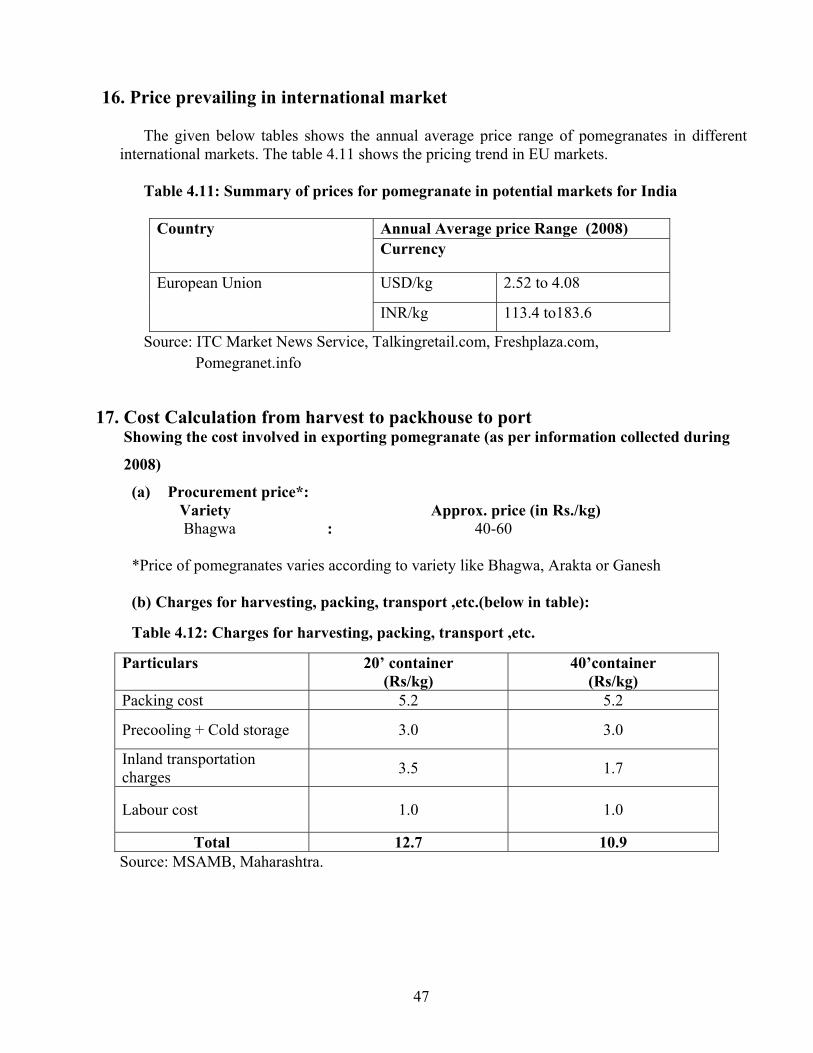
47
16. Price prevailing in international market
The given below tables shows the annual average price range of pomegranates in different international markets. The table 4.11 shows the pricing trend in EU markets.
Table 4.11: Summary of prices for pomegranate in potential markets for India
Annual Average price Range (2008) Country Currency
USD/kg 2.52 to 4.08 European Union
INR/kg 113.4 to183.6
Source: ITC Market News Service, Talkingretail.com, Freshplaza.com, Pomegranet.info
17. Cost Calculation from harvest to packhouse to port
Showing the cost involved in exporting pomegranate (as per information collected during
2008)
(a) Procurement price*: Variety Approx. price (in Rs./kg) Bhagwa : 40-60
*Price of pomegranates varies according to variety like Bhagwa, Arakta or Ganesh
(b) Charges for harvesting, packing, transport ,etc.(below in table): Table 4.12: Charges for harvesting, packing, transport ,etc.
Source: MSAMB, Maharashtra.
Particulars 20’ container (Rs/kg)
40’container (Rs/kg)
Packing cost 5.2 5.2
Precooling + Cold storage 3.0 3.0
Inland transportation charges 3.5 1.7
Labour cost 1.0 1.0
Total 12.7 10.9
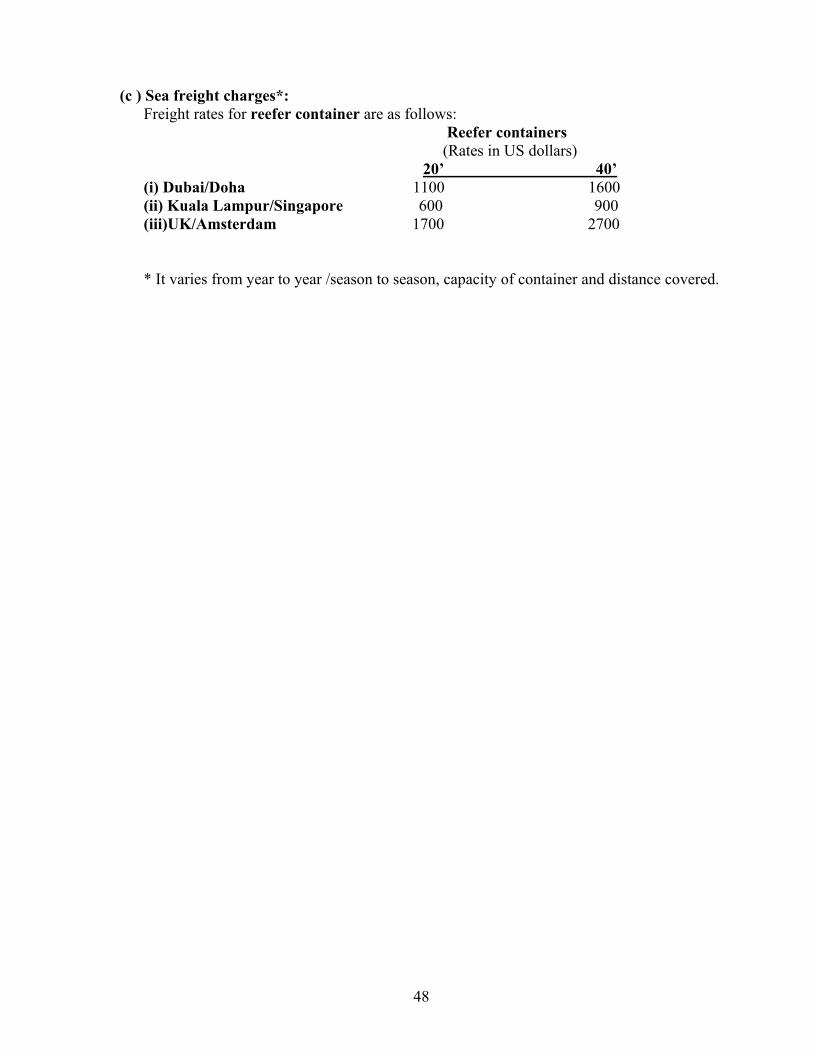
48
(c ) Sea freight charges*: Freight rates for reefer container are as follows:
Reefer containers (Rates in US dollars) 20’ 40’
(i) Dubai/Doha 1100 1600 (ii) Kuala Lampur/Singapore 600 900 (iii)UK/Amsterdam 1700 2700
* It varies from year to year /season to season, capacity of container and distance covered.
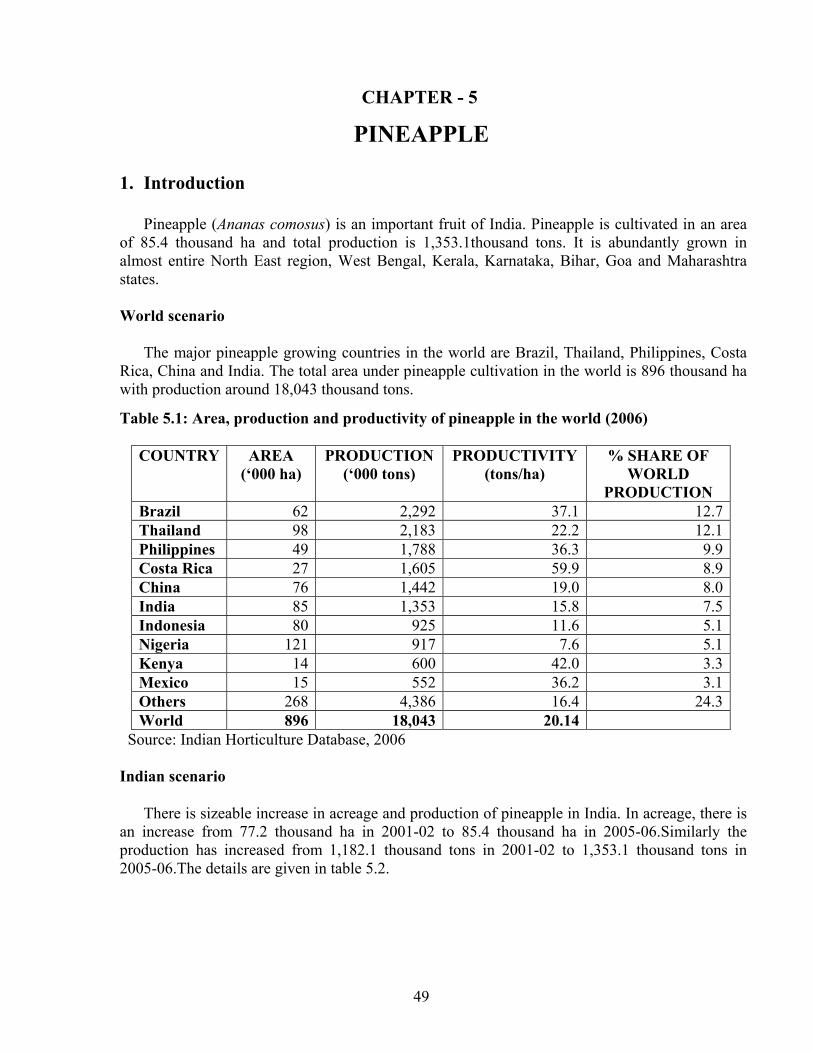
49
CHAPTER - 5
PINEAPPLE
1. Introduction Pineapple (Ananas comosus) is an important fruit of India. Pineapple is cultivated in an area of 85.4 thousand ha and total production is 1,353.1thousand tons. It is abundantly grown in almost entire North East region, West Bengal, Kerala, Karnataka, Bihar, Goa and Maharashtra states. World scenario The major pineapple growing countries in the world are Brazil, Thailand, Philippines, Costa Rica, China and India. The total area under pineapple cultivation in the world is 896 thousand ha with production around 18,043 thousand tons.
Table 5.1: Area, production and productivity of pineapple in the world (2006)
COUNTRY AREA (‘000 ha)
PRODUCTION (‘000 tons)
PRODUCTIVITY (tons/ha)
% SHARE OF WORLD
PRODUCTION Brazil 62 2,292 37.1 12.7Thailand 98 2,183 22.2 12.1Philippines 49 1,788 36.3 9.9Costa Rica 27 1,605 59.9 8.9China 76 1,442 19.0 8.0India 85 1,353 15.8 7.5Indonesia 80 925 11.6 5.1Nigeria 121 917 7.6 5.1Kenya 14 600 42.0 3.3Mexico 15 552 36.2 3.1Others 268 4,386 16.4 24.3World 896 18,043 20.14
Source: Indian Horticulture Database, 2006 Indian scenario
There is sizeable increase in acreage and production of pineapple in India. In acreage, there is an increase from 77.2 thousand ha in 2001-02 to 85.4 thousand ha in 2005-06.Similarly the production has increased from 1,182.1 thousand tons in 2001-02 to 1,353.1 thousand tons in 2005-06.The details are given in table 5.2.
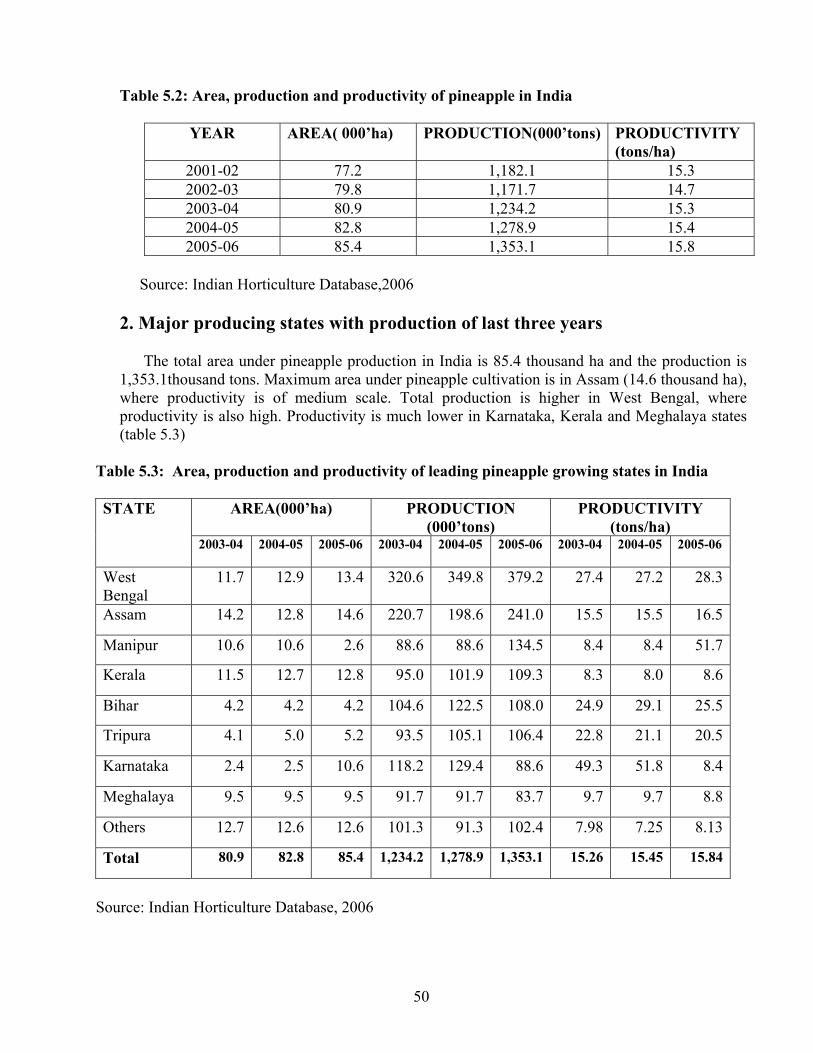
50
Table 5.2: Area, production and productivity of pineapple in India
YEAR AREA( 000’ha) PRODUCTION(000’tons) PRODUCTIVITY (tons/ha)
2001-02 77.2 1,182.1 15.3 2002-03 79.8 1,171.7 14.7 2003-04 80.9 1,234.2 15.3 2004-05 82.8 1,278.9 15.4 2005-06 85.4 1,353.1 15.8
Source: Indian Horticulture Database,2006
2. Major producing states with production of last three years
The total area under pineapple production in India is 85.4 thousand ha and the production is 1,353.1thousand tons. Maximum area under pineapple cultivation is in Assam (14.6 thousand ha), where productivity is of medium scale. Total production is higher in West Bengal, where productivity is also high. Productivity is much lower in Karnataka, Kerala and Meghalaya states (table 5.3)
Table 5.3: Area, production and productivity of leading pineapple growing states in India
AREA(000’ha) PRODUCTION (000’tons)
PRODUCTIVITY (tons/ha)
STATE
2003-04
2004-05 2005-06 2003-04 2004-05 2005-06 2003-04 2004-05 2005-06
West Bengal
11.7 12.9 13.4 320.6 349.8 379.2 27.4 27.2 28.3
Assam 14.2 12.8 14.6 220.7 198.6 241.0 15.5 15.5 16.5
Manipur 10.6 10.6 2.6 88.6 88.6 134.5 8.4 8.4 51.7
Kerala 11.5 12.7 12.8 95.0 101.9 109.3 8.3 8.0 8.6
Bihar 4.2 4.2 4.2 104.6 122.5 108.0 24.9 29.1 25.5
Tripura 4.1 5.0 5.2 93.5 105.1 106.4 22.8 21.1 20.5
Karnataka 2.4 2.5 10.6 118.2 129.4 88.6 49.3 51.8 8.4
Meghalaya 9.5 9.5 9.5 91.7 91.7 83.7 9.7 9.7 8.8
Others 12.7 12.6 12.6 101.3 91.3 102.4 7.98 7.25 8.13
Total 80.9 82.8 85.4 1,234.2 1,278.9 1,353.1 15.26 15.45 15.84
Source: Indian Horticulture Database, 2006
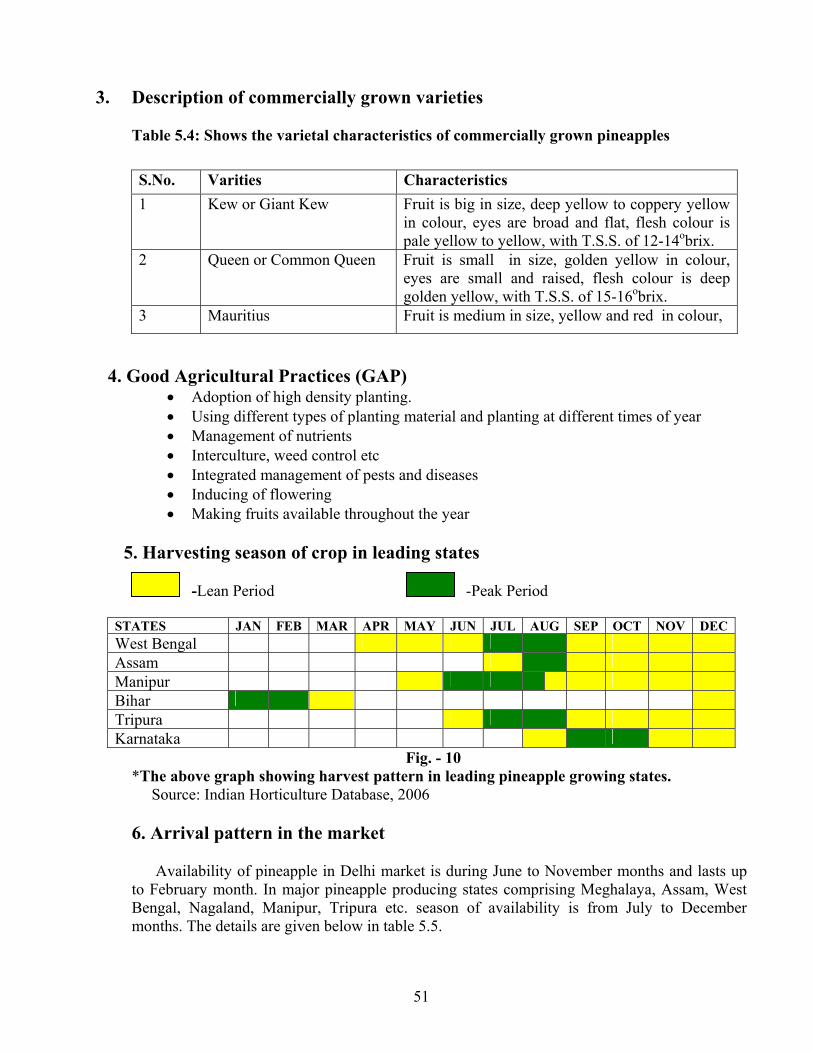
51
3. Description of commercially grown varieties Table 5.4: Shows the varietal characteristics of commercially grown pineapples
4. Good Agricultural Practices (GAP) • Adoption of high density planting. • Using different types of planting material and planting at different times of year • Management of nutrients • Interculture, weed control etc • Integrated management of pests and diseases • Inducing of flowering • Making fruits available throughout the year
5. Harvesting season of crop in leading states
-Lean Period -Peak Period
Fig. - 10 *The above graph showing harvest pattern in leading pineapple growing states. Source: Indian Horticulture Database, 2006
6. Arrival pattern in the market
Availability of pineapple in Delhi market is during June to November months and lasts up to February month. In major pineapple producing states comprising Meghalaya, Assam, West Bengal, Nagaland, Manipur, Tripura etc. season of availability is from July to December months. The details are given below in table 5.5.
S.No. Varities Characteristics 1 Kew or Giant Kew Fruit is big in size, deep yellow to coppery yellow
in colour, eyes are broad and flat, flesh colour is pale yellow to yellow, with T.S.S. of 12-14obrix.
2 Queen or Common Queen Fruit is small in size, golden yellow in colour, eyes are small and raised, flesh colour is deep golden yellow, with T.S.S. of 15-16obrix.
3 Mauritius Fruit is medium in size, yellow and red in colour,
STATES JAN FEB MAR APR MAY JUN JUL AUG SEP OCT NOV DEC West Bengal Assam Manipur Bihar Tripura Karnataka
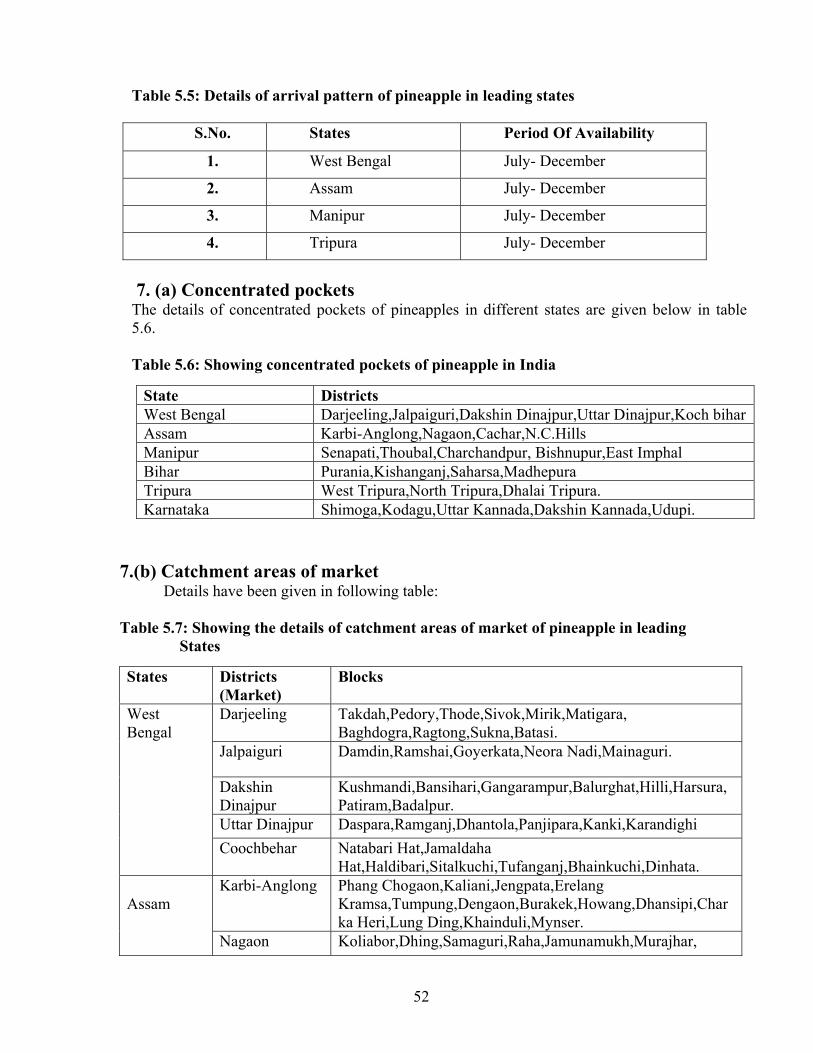
52
Table 5.5: Details of arrival pattern of pineapple in leading states
S.No. States Period Of Availability
1. West Bengal July- December
2. Assam July- December
3. Manipur July- December
4. Tripura July- December
7. (a) Concentrated pockets The details of concentrated pockets of pineapples in different states are given below in table 5.6.
Table 5.6: Showing concentrated pockets of pineapple in India
7.(b) Catchment areas of market Details have been given in following table: Table 5.7: Showing the details of catchment areas of market of pineapple in leading States
State Districts West Bengal Darjeeling,Jalpaiguri,Dakshin Dinajpur,Uttar Dinajpur,Koch bihar Assam Karbi-Anglong,Nagaon,Cachar,N.C.Hills Manipur Senapati,Thoubal,Charchandpur, Bishnupur,East Imphal Bihar Purania,Kishanganj,Saharsa,Madhepura Tripura West Tripura,North Tripura,Dhalai Tripura. Karnataka Shimoga,Kodagu,Uttar Kannada,Dakshin Kannada,Udupi.
States Districts (Market)
Blocks
Darjeeling Takdah,Pedory,Thode,Sivok,Mirik,Matigara, Baghdogra,Ragtong,Sukna,Batasi.
Jalpaiguri Damdin,Ramshai,Goyerkata,Neora Nadi,Mainaguri.
Dakshin Dinajpur
Kushmandi,Bansihari,Gangarampur,Balurghat,Hilli,Harsura,Patiram,Badalpur.
Uttar Dinajpur Daspara,Ramganj,Dhantola,Panjipara,Kanki,Karandighi
West Bengal
Coochbehar Natabari Hat,Jamaldaha Hat,Haldibari,Sitalkuchi,Tufanganj,Bhainkuchi,Dinhata.
Karbi-Anglong Phang Chogaon,Kaliani,Jengpata,Erelang Kramsa,Tumpung,Dengaon,Burakek,Howang,Dhansipi,Charka Heri,Lung Ding,Khainduli,Mynser.
Assam Nagaon Koliabor,Dhing,Samaguri,Raha,Jamunamukh,Murajhar,
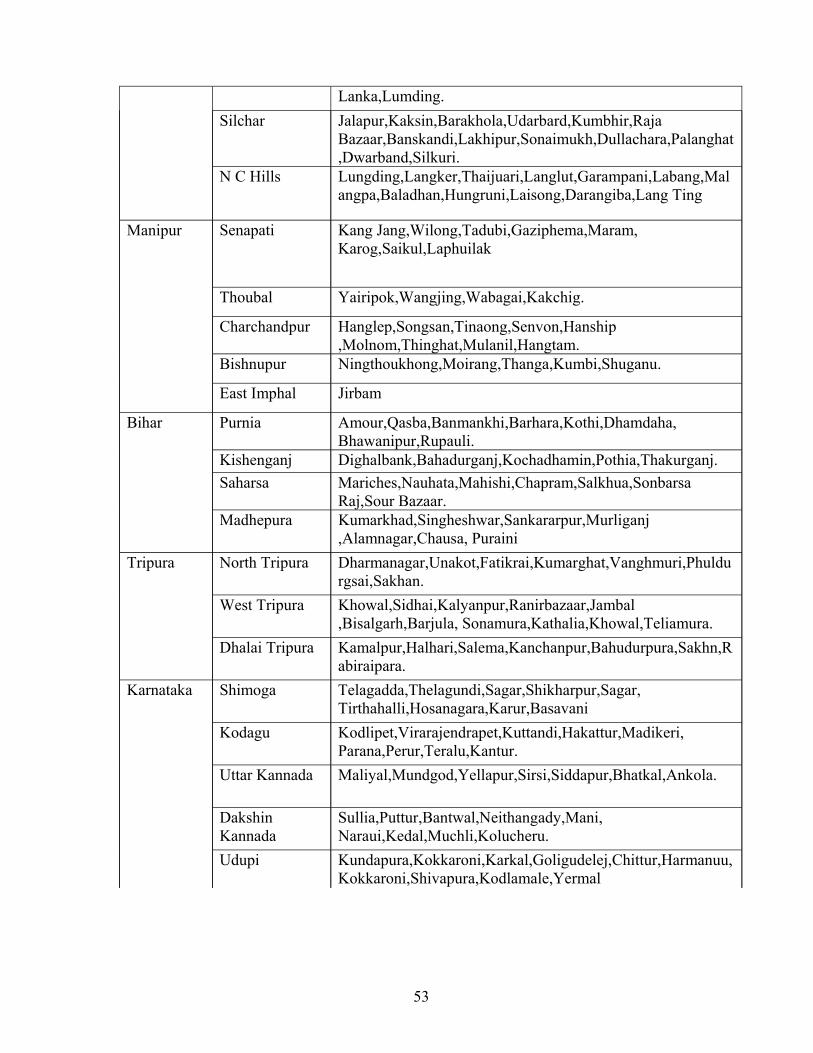
53
Lanka,Lumding. Silchar Jalapur,Kaksin,Barakhola,Udarbard,Kumbhir,Raja
Bazaar,Banskandi,Lakhipur,Sonaimukh,Dullachara,Palanghat,Dwarband,Silkuri.
N C Hills Lungding,Langker,Thaijuari,Langlut,Garampani,Labang,Malangpa,Baladhan,Hungruni,Laisong,Darangiba,Lang Ting
Senapati Kang Jang,Wilong,Tadubi,Gaziphema,Maram, Karog,Saikul,Laphuilak
Thoubal Yairipok,Wangjing,Wabagai,Kakchig.
Charchandpur Hanglep,Songsan,Tinaong,Senvon,Hanship ,Molnom,Thinghat,Mulanil,Hangtam.
Bishnupur Ningthoukhong,Moirang,Thanga,Kumbi,Shuganu.
Manipur
East Imphal Jirbam
Purnia Amour,Qasba,Banmankhi,Barhara,Kothi,Dhamdaha, Bhawanipur,Rupauli.
Kishenganj Dighalbank,Bahadurganj,Kochadhamin,Pothia,Thakurganj. Saharsa Mariches,Nauhata,Mahishi,Chapram,Salkhua,Sonbarsa
Raj,Sour Bazaar.
Bihar
Madhepura Kumarkhad,Singheshwar,Sankararpur,Murliganj ,Alamnagar,Chausa, Puraini
North Tripura Dharmanagar,Unakot,Fatikrai,Kumarghat,Vanghmuri,Phuldurgsai,Sakhan.
West Tripura Khowal,Sidhai,Kalyanpur,Ranirbazaar,Jambal ,Bisalgarh,Barjula, Sonamura,Kathalia,Khowal,Teliamura.
Tripura
Dhalai Tripura Kamalpur,Halhari,Salema,Kanchanpur,Bahudurpura,Sakhn,Rabiraipara.
Shimoga Telagadda,Thelagundi,Sagar,Shikharpur,Sagar, Tirthahalli,Hosanagara,Karur,Basavani
Kodagu Kodlipet,Virarajendrapet,Kuttandi,Hakattur,Madikeri, Parana,Perur,Teralu,Kantur.
Uttar Kannada Maliyal,Mundgod,Yellapur,Sirsi,Siddapur,Bhatkal,Ankola.
Dakshin Kannada
Sullia,Puttur,Bantwal,Neithangady,Mani, Naraui,Kedal,Muchli,Kolucheru.
Karnataka
Udupi Kundapura,Kokkaroni,Karkal,Goligudelej,Chittur,Harmanuu,Kokkaroni,Shivapura,Kodlamale,Yermal
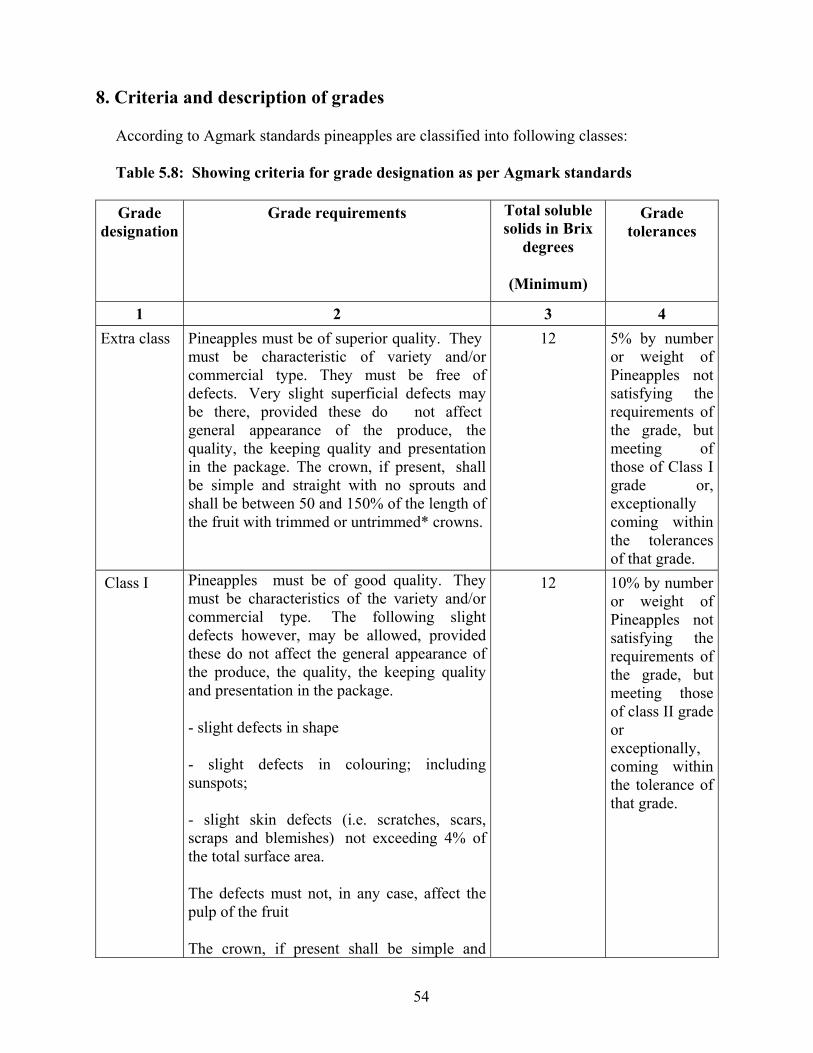
54
8. Criteria and description of grades
According to Agmark standards pineapples are classified into following classes:
Table 5.8: Showing criteria for grade designation as per Agmark standards
Grade designation
Grade requirements Total soluble solids in Brix
degrees
(Minimum)
Grade tolerances
1 2 3 4 Extra class Pineapples must be of superior quality. They
must be characteristic of variety and/or commercial type. They must be free of defects. Very slight superficial defects may be there, provided these do not affect general appearance of the produce, the quality, the keeping quality and presentation in the package. The crown, if present, shall be simple and straight with no sprouts and shall be between 50 and 150% of the length of the fruit with trimmed or untrimmed* crowns.
12 5% by number or weight of Pineapples not satisfying the requirements of the grade, but meeting of those of Class I grade or, exceptionally coming within the tolerances of that grade.
Class I Pineapples must be of good quality. They must be characteristics of the variety and/or commercial type. The following slight defects however, may be allowed, provided these do not affect the general appearance of the produce, the quality, the keeping quality and presentation in the package.
- slight defects in shape
- slight defects in colouring; including sunspots;
- slight skin defects (i.e. scratches, scars, scraps and blemishes) not exceeding 4% of the total surface area.
The defects must not, in any case, affect the pulp of the fruit
The crown, if present shall be simple and
12 10% by number or weight of Pineapples not satisfying the requirements of the grade, but meeting those of class II grade or exceptionally, coming within the tolerance of that grade.
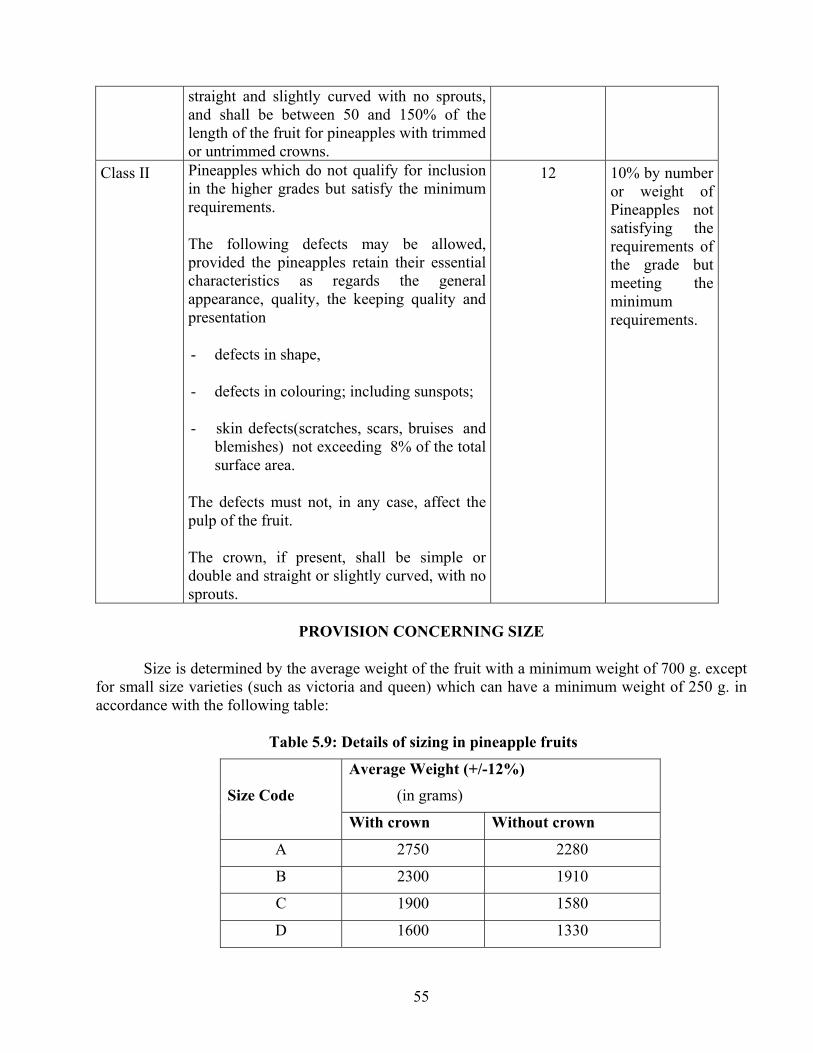
55
straight and slightly curved with no sprouts, and shall be between 50 and 150% of the length of the fruit for pineapples with trimmed or untrimmed crowns.
Class II Pineapples which do not qualify for inclusion in the higher grades but satisfy the minimum requirements.
The following defects may be allowed, provided the pineapples retain their essential characteristics as regards the general appearance, quality, the keeping quality and presentation
- defects in shape,
- defects in colouring; including sunspots;
- skin defects(scratches, scars, bruises and blemishes) not exceeding 8% of the total surface area.
The defects must not, in any case, affect the pulp of the fruit.
The crown, if present, shall be simple or double and straight or slightly curved, with no sprouts.
12 10% by number or weight of Pineapples not satisfying the requirements of the grade but meeting the minimum requirements.
PROVISION CONCERNING SIZE
Size is determined by the average weight of the fruit with a minimum weight of 700 g. except for small size varieties (such as victoria and queen) which can have a minimum weight of 250 g. in accordance with the following table:
Table 5.9: Details of sizing in pineapple fruits
Average Weight (+/-12%)
(in grams)
Size Code
With crown Without crown
A 2750 2280
B 2300 1910
C 1900 1580
D 1600 1330
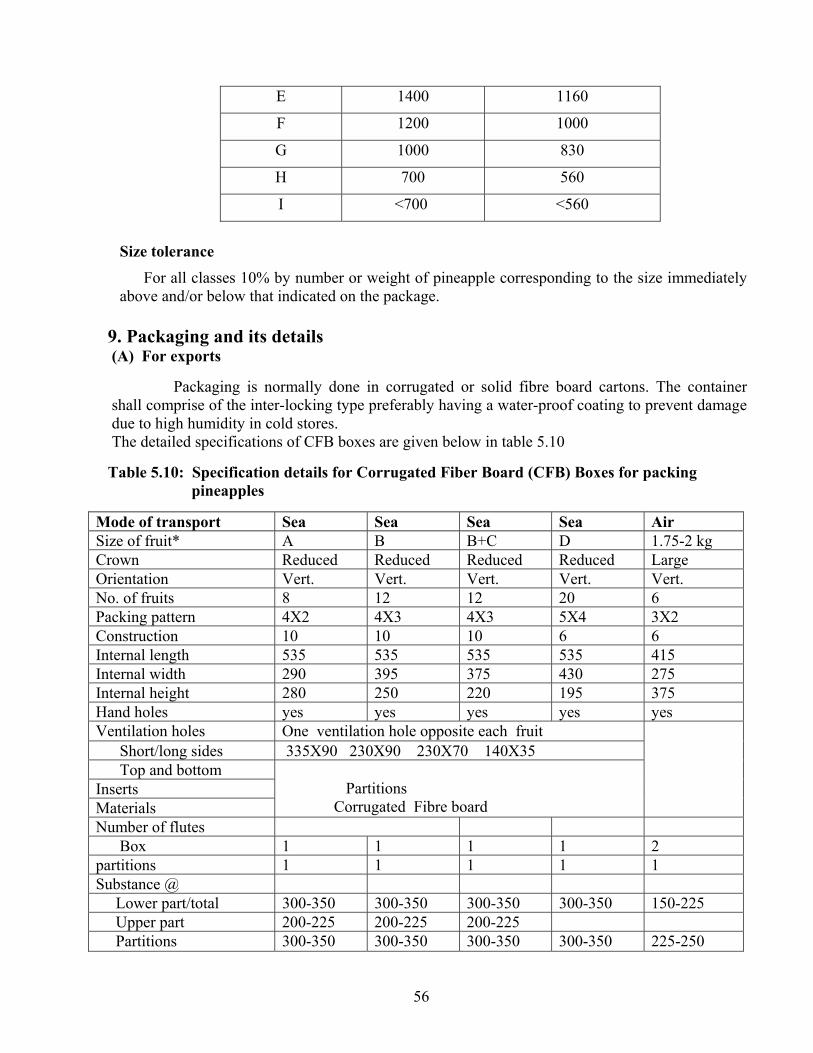
56
E 1400 1160
F 1200 1000
G 1000 830
H 700 560
I <700 <560
Size tolerance
For all classes 10% by number or weight of pineapple corresponding to the size immediately above and/or below that indicated on the package.
9. Packaging and its details (A) For exports Packaging is normally done in corrugated or solid fibre board cartons. The container shall comprise of the inter-locking type preferably having a water-proof coating to prevent damage due to high humidity in cold stores. The detailed specifications of CFB boxes are given below in table 5.10
Table 5.10: Specification details for Corrugated Fiber Board (CFB) Boxes for packing pineapples
Mode of transport Sea Sea Sea Sea Air Size of fruit* A B B+C D 1.75-2 kg Crown Reduced Reduced Reduced Reduced Large Orientation Vert. Vert. Vert. Vert. Vert. No. of fruits 8 12 12 20 6 Packing pattern 4X2 4X3 4X3 5X4 3X2 Construction 10 10 10 6 6 Internal length 535 535 535 535 415 Internal width 290 395 375 430 275 Internal height 280 250 220 195 375 Hand holes yes yes yes yes yes Ventilation holes One ventilation hole opposite each fruit Short/long sides 335X90 230X90 230X70 140X35 Top and bottom Inserts Materials
Partitions Corrugated Fibre board
Number of flutes Box 1 1 1 1 2 partitions 1 1 1 1 1 Substance @ Lower part/total 300-350 300-350 300-350 300-350 150-225 Upper part 200-225 200-225 200-225 Partitions 300-350 300-350 300-350 300-350 225-250
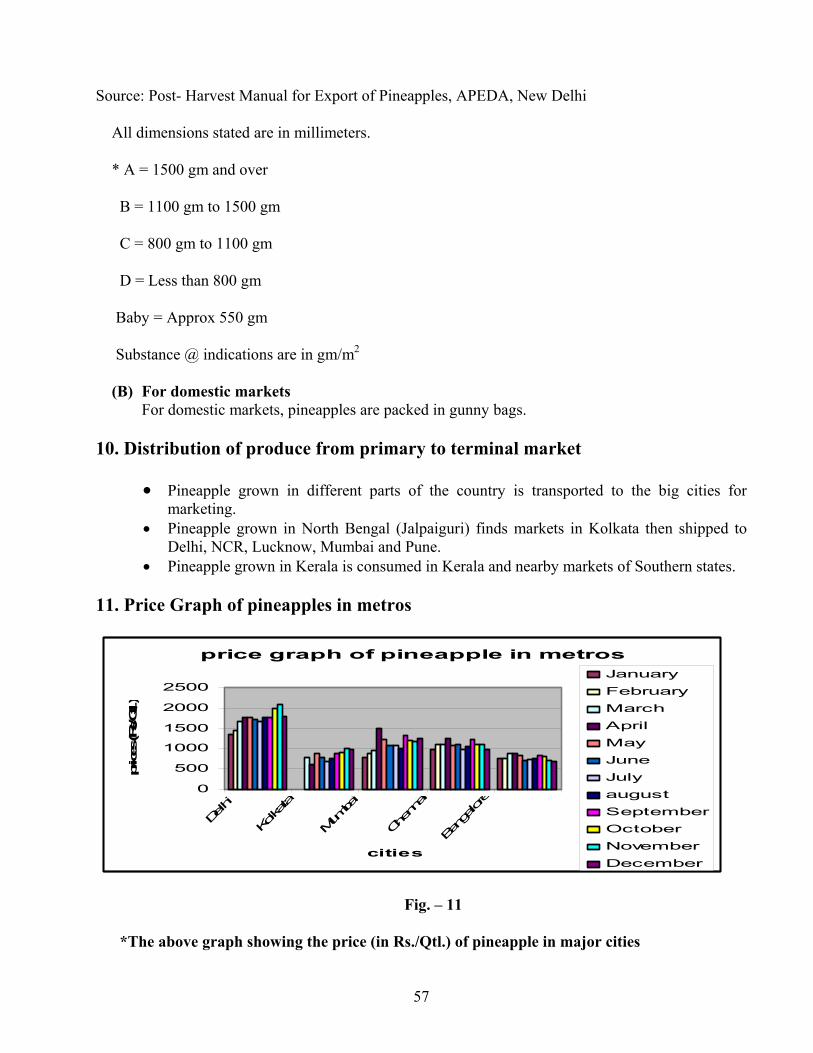
57
Source: Post- Harvest Manual for Export of Pineapples, APEDA, New Delhi
All dimensions stated are in millimeters.
* A = 1500 gm and over
B = 1100 gm to 1500 gm
C = 800 gm to 1100 gm
D = Less than 800 gm
Baby = Approx 550 gm
Substance @ indications are in gm/m2
(B) For domestic markets For domestic markets, pineapples are packed in gunny bags.
10. Distribution of produce from primary to terminal market
• Pineapple grown in different parts of the country is transported to the big cities for marketing.
• Pineapple grown in North Bengal (Jalpaiguri) finds markets in Kolkata then shipped to Delhi, NCR, Lucknow, Mumbai and Pune.
• Pineapple grown in Kerala is consumed in Kerala and nearby markets of Southern states.
11. Price Graph of pineapples in metros
price graph of pineapple in metros
0
500
1000
1500
2000
2500
Delhi
Kolka
ta
Mum
bai
Chennai
Bangalore
cities
prices (R
s/Qtl.)
JanuaryFebruaryMarchAprilMayJuneJulyaugustSeptemberOctoberNovemberDecember
Fig. – 11
*The above graph showing the price (in Rs./Qtl.) of pineapple in major cities
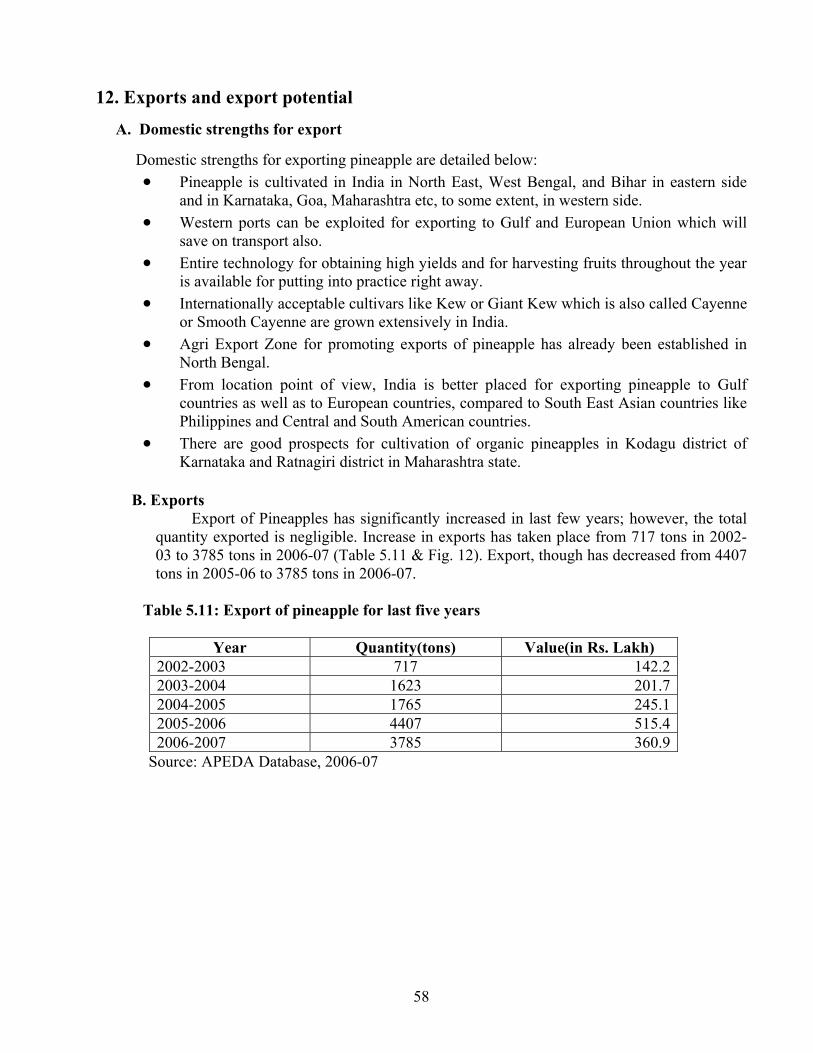
58
12. Exports and export potential
A. Domestic strengths for export Domestic strengths for exporting pineapple are detailed below:
• Pineapple is cultivated in India in North East, West Bengal, and Bihar in eastern side and in Karnataka, Goa, Maharashtra etc, to some extent, in western side.
• Western ports can be exploited for exporting to Gulf and European Union which will save on transport also.
• Entire technology for obtaining high yields and for harvesting fruits throughout the year is available for putting into practice right away.
• Internationally acceptable cultivars like Kew or Giant Kew which is also called Cayenne or Smooth Cayenne are grown extensively in India.
• Agri Export Zone for promoting exports of pineapple has already been established in North Bengal.
• From location point of view, India is better placed for exporting pineapple to Gulf countries as well as to European countries, compared to South East Asian countries like Philippines and Central and South American countries.
• There are good prospects for cultivation of organic pineapples in Kodagu district of Karnataka and Ratnagiri district in Maharashtra state.
B. Exports
Export of Pineapples has significantly increased in last few years; however, the total quantity exported is negligible. Increase in exports has taken place from 717 tons in 2002-03 to 3785 tons in 2006-07 (Table 5.11 & Fig. 12). Export, though has decreased from 4407 tons in 2005-06 to 3785 tons in 2006-07.
Table 5.11: Export of pineapple for last five years
Year Quantity(tons) Value(in Rs. Lakh) 2002-2003 717 142.22003-2004 1623 201.72004-2005 1765 245.12005-2006 4407 515.42006-2007 3785 360.9
Source: APEDA Database, 2006-07
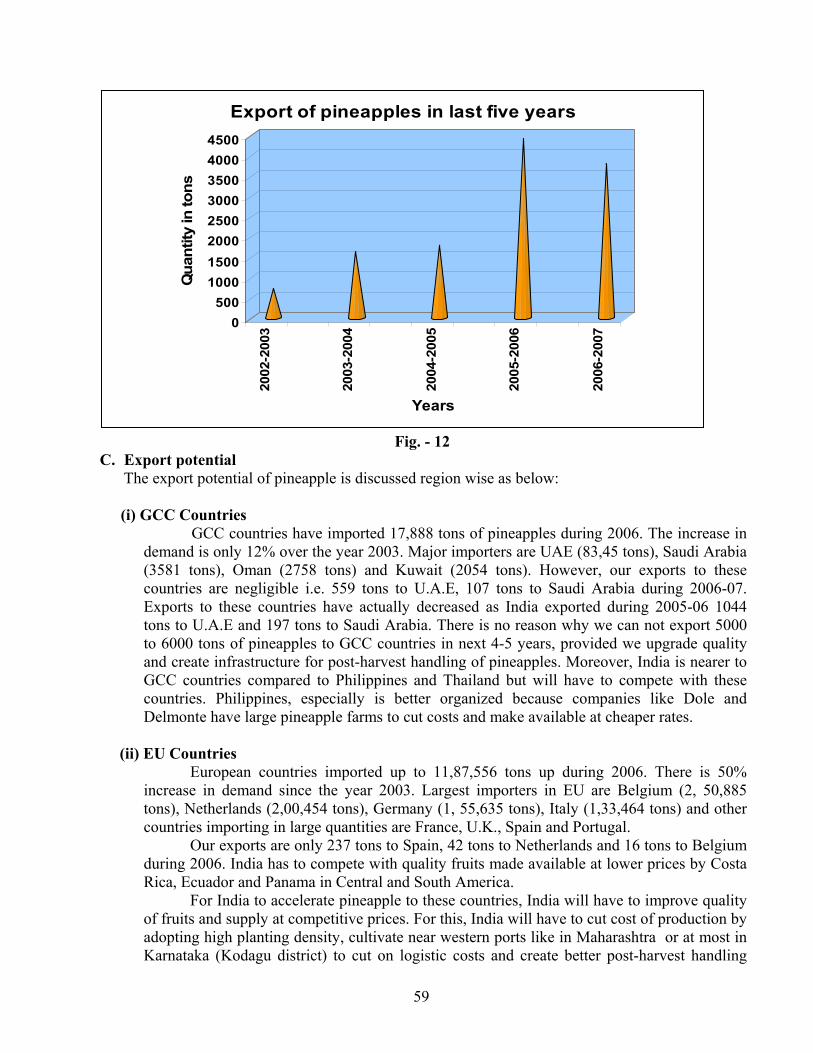
59
0500
10001500200025003000350040004500
Qua
ntity
in to
ns
2002
-200
3
2003
-200
4
2004
-200
5
2005
-200
6
2006
-200
7
Years
Export of pineapples in last five years
Fig. - 12
C. Export potential The export potential of pineapple is discussed region wise as below: (i) GCC Countries
GCC countries have imported 17,888 tons of pineapples during 2006. The increase in demand is only 12% over the year 2003. Major importers are UAE (83,45 tons), Saudi Arabia (3581 tons), Oman (2758 tons) and Kuwait (2054 tons). However, our exports to these countries are negligible i.e. 559 tons to U.A.E, 107 tons to Saudi Arabia during 2006-07. Exports to these countries have actually decreased as India exported during 2005-06 1044 tons to U.A.E and 197 tons to Saudi Arabia. There is no reason why we can not export 5000 to 6000 tons of pineapples to GCC countries in next 4-5 years, provided we upgrade quality and create infrastructure for post-harvest handling of pineapples. Moreover, India is nearer to GCC countries compared to Philippines and Thailand but will have to compete with these countries. Philippines, especially is better organized because companies like Dole and Delmonte have large pineapple farms to cut costs and make available at cheaper rates.
(ii) EU Countries
European countries imported up to 11,87,556 tons up during 2006. There is 50% increase in demand since the year 2003. Largest importers in EU are Belgium (2, 50,885 tons), Netherlands (2,00,454 tons), Germany (1, 55,635 tons), Italy (1,33,464 tons) and other countries importing in large quantities are France, U.K., Spain and Portugal.
Our exports are only 237 tons to Spain, 42 tons to Netherlands and 16 tons to Belgium during 2006. India has to compete with quality fruits made available at lower prices by Costa Rica, Ecuador and Panama in Central and South America.
For India to accelerate pineapple to these countries, India will have to improve quality of fruits and supply at competitive prices. For this, India will have to cut cost of production by adopting high planting density, cultivate near western ports like in Maharashtra or at most in Karnataka (Kodagu district) to cut on logistic costs and create better post-harvest handling
60
facilities, as pineapple is very sensitive after initiation of colour and requires cool chain facilities.
(iii) East European countries
There is excellent scope for exporting to Russia and other nearby countries like Poland and Portugal. Russia imported to the tune of 26,133 tons of pineapple, Portugal imported 42098 tons and Poland imported 6750 tons of pineapple during 2006. However, for exporting to even these countries, India will have to attend to points mentioned under European Union like cutting cost of production, improving quality and creating post-harvest handling facilities.
D. Measures for enhancing competitiveness for export
Following measures need to be adopted to enhance competitiveness for export of pineapple:
• To save on transport, advantage of western ports needs to be taken for exporting to Gulf and European countries. For this, cultivation of pineapple in Karnataka, Maharashtra and Goa needs to be intensified.
• At present, to meet the huge demands of European Union, South American and Central American countries supply pineapple. But their supplies taper from February onwards, India can exploit this situation in its favour by making available pineapple in February month onwards by planting different planting materials and regulating flowering.
• Pineapple is very sensitive fruit to atmospheric temperatures when harvested after inititiation of ripening. Therefore, in order to supply quality pineapple at par with South and Central American countries, packhouses and cool chain facilities need to be set up.
• For extending storage period, CA and MA storage technology needs to be perfected and adopted and with the availability of MA storage facilities, pineapple can be sent to EU countries.
13. Storage
Temperature : 7 to 10o C (Half ripe or fully ripe fruits)
: 10 to 13o C (Fully green fruits)
Relative Humidity : 85-95%
Storage period : 3-5 weeks (depending on cultivar and ripening stage)
Freezing point : -1o C
14. Documents required for exports
a) Documents related to goods
a) Invoice b) Packing List c) Certificate of origin
b) Documents related to shipment
a) Mate Receipt b) Shipping Bill c) Bill of handing d) Airway Bill
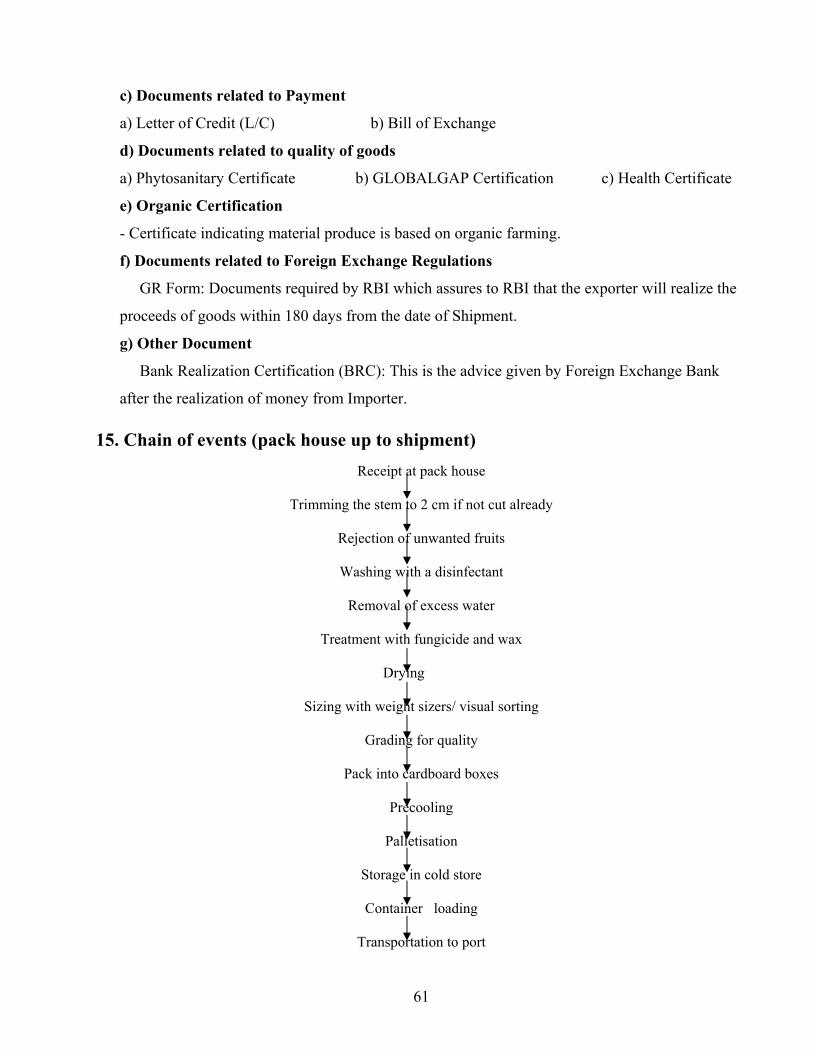
61
c) Documents related to Payment
a) Letter of Credit (L/C) b) Bill of Exchange
d) Documents related to quality of goods
a) Phytosanitary Certificate b) GLOBALGAP Certification c) Health Certificate
e) Organic Certification
- Certificate indicating material produce is based on organic farming.
f) Documents related to Foreign Exchange Regulations
GR Form: Documents required by RBI which assures to RBI that the exporter will realize the
proceeds of goods within 180 days from the date of Shipment.
g) Other Document
Bank Realization Certification (BRC): This is the advice given by Foreign Exchange Bank
after the realization of money from Importer.
15. Chain of events (pack house up to shipment)
Receipt at pack house
Trimming the stem to 2 cm if not cut already
Rejection of unwanted fruits
Washing with a disinfectant
Removal of excess water
Treatment with fungicide and wax
Drying
Sizing with weight sizers/ visual sorting
Grading for quality
Pack into cardboard boxes
Precooling
Palletisation
Storage in cold store
Container loading
Transportation to port
62
16. Price in international market
The given below table shows the annual average price range of pineapples in the markets of EU countries.
Table 5.12: Showing the annual average price range of pineapples in the markets of EU countries
Annual Average price Range (2003-08) Country Currency
USD/kg 0.69 to 0.99 European Union
INR/kg 31.39 to 44.81
Source: Comtrade Database
17. Cost Calculation from harvest to packhouse to port
Showing the cost involved in exporting pineapple(as per information collected during
2008)
(a) Procurement price*: Variety Approx. price (in Rs./kg)
Kew or Giant Kew : 6-8
*Price of pineapples varies according to variety like Kew or Giant Kew, Queen or Common Queen and month of procurement
(b) Charges for pre cooling, cold storage, packing, transport, etc.(below in table):
Table 5.13: Charges for pre cooling, cold storage, packing, transport, etc.
Source: Estimate of ITS Ltd
Particulars Rs/kg
Transportation to packhouse 1.0 Labour charges 1.0
Pre cooling and cold storage charge 3.0 Packing cost 8.0
Transport to Port (for 400-500 km) 3.0 Total 16.0
63
(c ) Sea freight charges*: Freight rates for reefer container are as follows:
Reefer containers (Rates in US dollars) 20’ 40’
(i) Dubai/Doha 1100 1600 (ii) Kuala Lampur/Singapore 600 900 (iii)UK/Amsterdam 1700 2700
* It varies from year to year /season to season, capacity of container and distance covered.
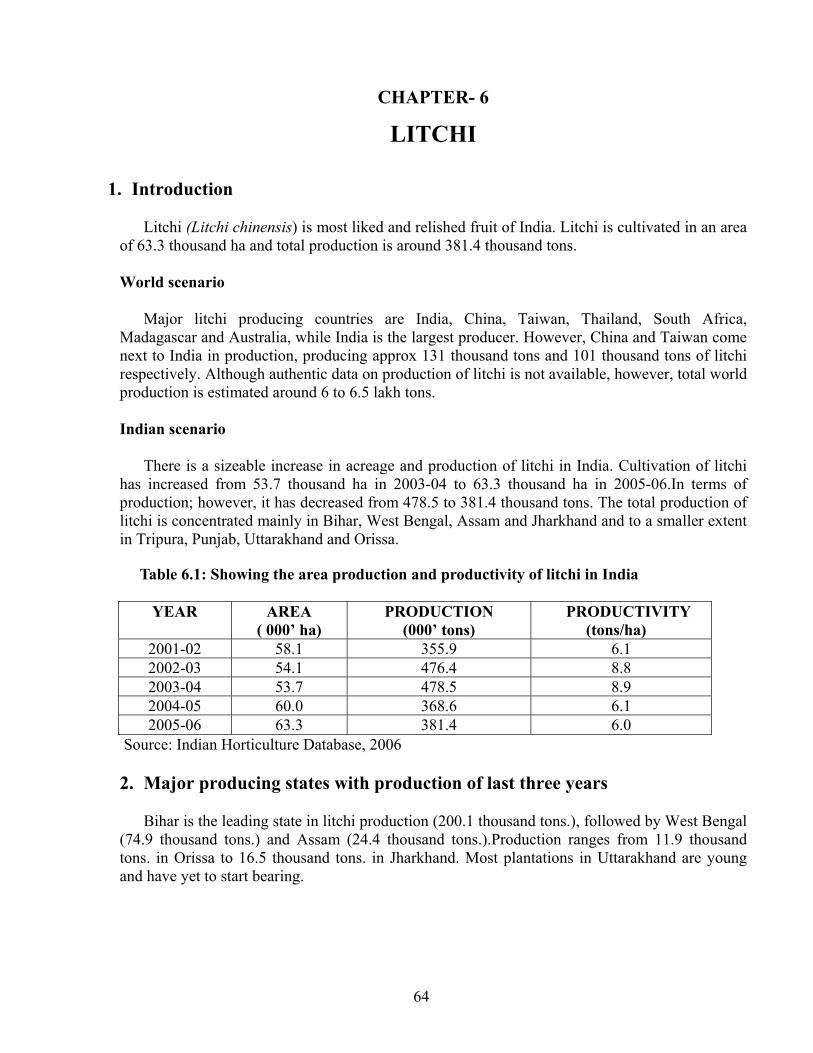
64
CHAPTER- 6
LITCHI
1. Introduction
Litchi (Litchi chinensis) is most liked and relished fruit of India. Litchi is cultivated in an area of 63.3 thousand ha and total production is around 381.4 thousand tons.
World scenario Major litchi producing countries are India, China, Taiwan, Thailand, South Africa, Madagascar and Australia, while India is the largest producer. However, China and Taiwan come next to India in production, producing approx 131 thousand tons and 101 thousand tons of litchi respectively. Although authentic data on production of litchi is not available, however, total world production is estimated around 6 to 6.5 lakh tons. Indian scenario
There is a sizeable increase in acreage and production of litchi in India. Cultivation of litchi has increased from 53.7 thousand ha in 2003-04 to 63.3 thousand ha in 2005-06.In terms of production; however, it has decreased from 478.5 to 381.4 thousand tons. The total production of litchi is concentrated mainly in Bihar, West Bengal, Assam and Jharkhand and to a smaller extent in Tripura, Punjab, Uttarakhand and Orissa.
Table 6.1: Showing the area production and productivity of litchi in India
YEAR AREA ( 000’ ha)
PRODUCTION (000’ tons)
PRODUCTIVITY (tons/ha)
2001-02 58.1 355.9 6.1 2002-03 54.1 476.4 8.8 2003-04 53.7 478.5 8.9 2004-05 60.0 368.6 6.1 2005-06 63.3 381.4 6.0
Source: Indian Horticulture Database, 2006
2. Major producing states with production of last three years
Bihar is the leading state in litchi production (200.1 thousand tons.), followed by West Bengal (74.9 thousand tons.) and Assam (24.4 thousand tons.).Production ranges from 11.9 thousand tons. in Orissa to 16.5 thousand tons. in Jharkhand. Most plantations in Uttarakhand are young and have yet to start bearing.
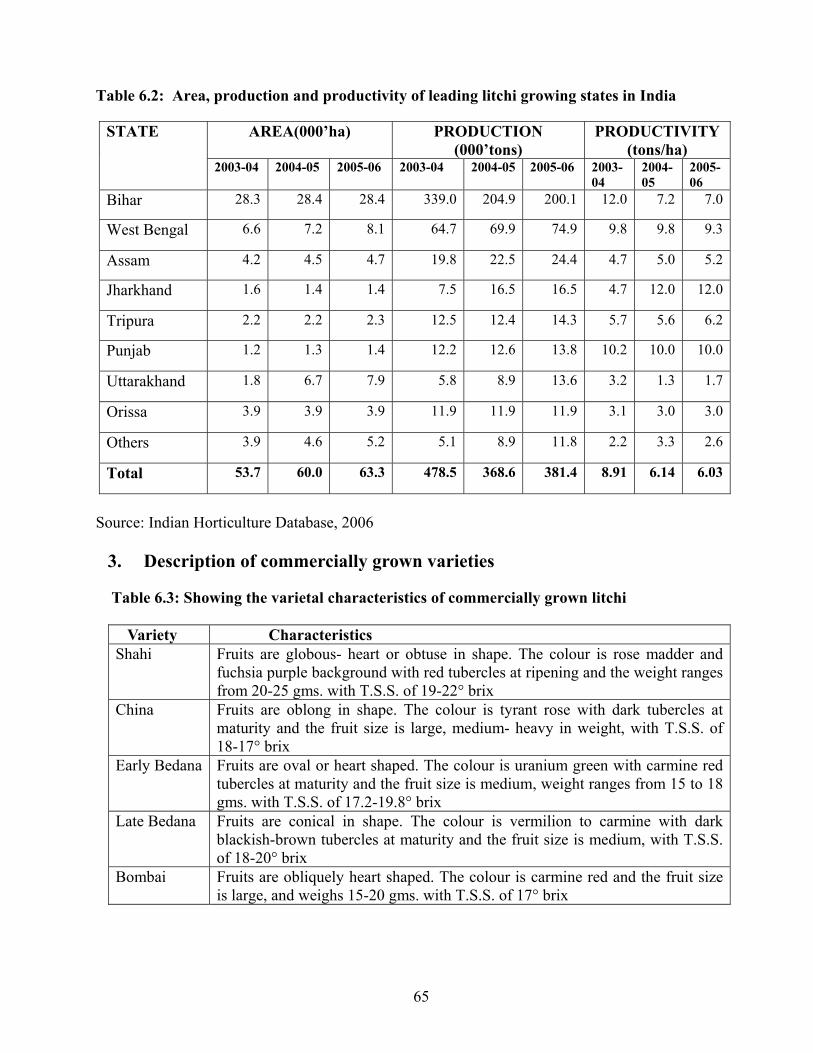
65
Table 6.2: Area, production and productivity of leading litchi growing states in India
AREA(000’ha) PRODUCTION (000’tons)
PRODUCTIVITY (tons/ha)
STATE
2003-04
2004-05 2005-06 2003-04 2004-05 2005-06 2003-04
2004-05
2005-06
Bihar 28.3 28.4 28.4 339.0 204.9 200.1 12.0 7.2 7.0
West Bengal 6.6 7.2 8.1 64.7 69.9 74.9 9.8 9.8 9.3
Assam 4.2 4.5 4.7 19.8 22.5 24.4 4.7 5.0 5.2
Jharkhand 1.6 1.4 1.4 7.5 16.5 16.5 4.7 12.0 12.0
Tripura 2.2 2.2 2.3 12.5 12.4 14.3 5.7 5.6 6.2
Punjab 1.2 1.3 1.4 12.2 12.6 13.8 10.2 10.0 10.0
Uttarakhand 1.8 6.7 7.9 5.8 8.9 13.6 3.2 1.3 1.7
Orissa 3.9 3.9 3.9 11.9 11.9 11.9 3.1 3.0 3.0
Others 3.9 4.6 5.2 5.1 8.9 11.8 2.2 3.3 2.6
Total 53.7 60.0 63.3 478.5 368.6 381.4 8.91 6.14 6.03
Source: Indian Horticulture Database, 2006
3. Description of commercially grown varieties
Table 6.3: Showing the varietal characteristics of commercially grown litchi
Variety Characteristics Shahi Fruits are globous- heart or obtuse in shape. The colour is rose madder and
fuchsia purple background with red tubercles at ripening and the weight ranges from 20-25 gms. with T.S.S. of 19-22° brix
China Fruits are oblong in shape. The colour is tyrant rose with dark tubercles at maturity and the fruit size is large, medium- heavy in weight, with T.S.S. of 18-17° brix
Early Bedana Fruits are oval or heart shaped. The colour is uranium green with carmine red tubercles at maturity and the fruit size is medium, weight ranges from 15 to 18 gms. with T.S.S. of 17.2-19.8° brix
Late Bedana Fruits are conical in shape. The colour is vermilion to carmine with dark blackish-brown tubercles at maturity and the fruit size is medium, with T.S.S. of 18-20° brix
Bombai Fruits are obliquely heart shaped. The colour is carmine red and the fruit size is large, and weighs 15-20 gms. with T.S.S. of 17° brix
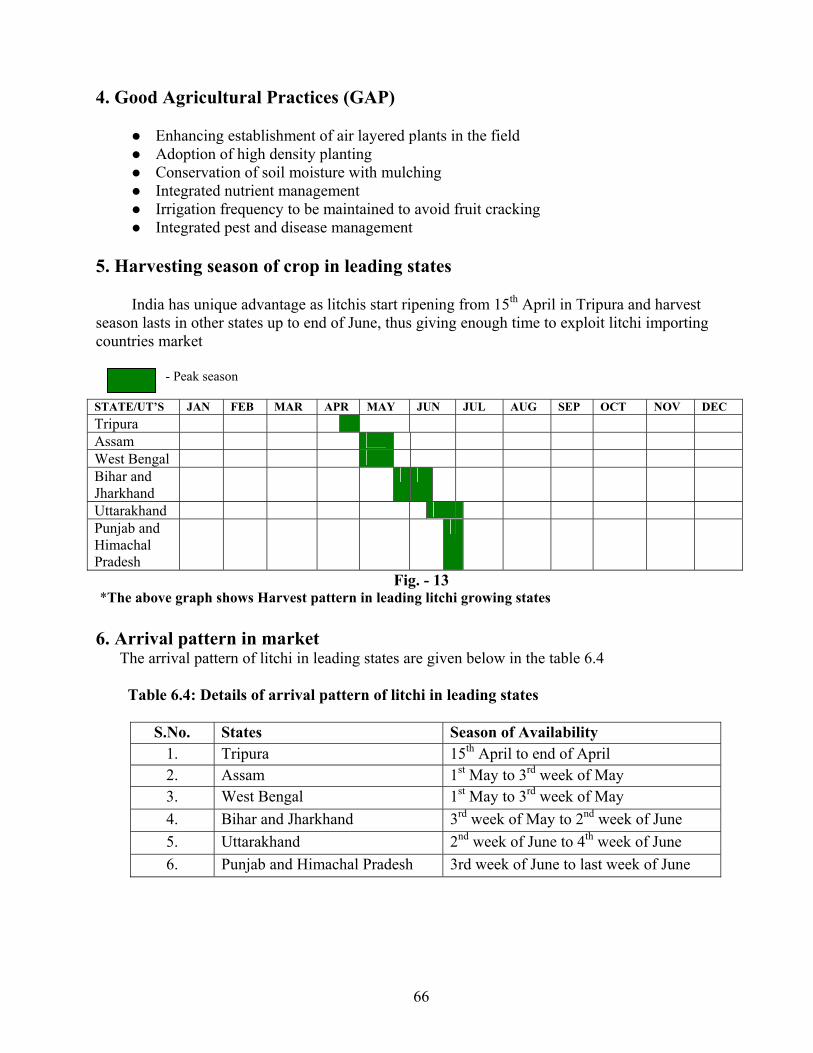
66
4. Good Agricultural Practices (GAP)
Enhancing establishment of air layered plants in the field Adoption of high density planting Conservation of soil moisture with mulching Integrated nutrient management Irrigation frequency to be maintained to avoid fruit cracking Integrated pest and disease management
5. Harvesting season of crop in leading states
India has unique advantage as litchis start ripening from 15th April in Tripura and harvest season lasts in other states up to end of June, thus giving enough time to exploit litchi importing countries market
- Peak season STATE/UT’S JAN FEB MAR APR MAY JUN JUL AUG SEP OCT NOV DEC Tripura Assam West Bengal Bihar and Jharkhand
Uttarakhand Punjab and Himachal Pradesh
Fig. - 13 *The above graph shows Harvest pattern in leading litchi growing states 6. Arrival pattern in market
The arrival pattern of litchi in leading states are given below in the table 6.4 Table 6.4: Details of arrival pattern of litchi in leading states
S.No. States Season of Availability 1. Tripura 15th April to end of April 2. Assam 1st May to 3rd week of May 3. West Bengal 1st May to 3rd week of May 4. Bihar and Jharkhand 3rd week of May to 2nd week of June 5. Uttarakhand 2nd week of June to 4th week of June 6. Punjab and Himachal Pradesh 3rd week of June to last week of June
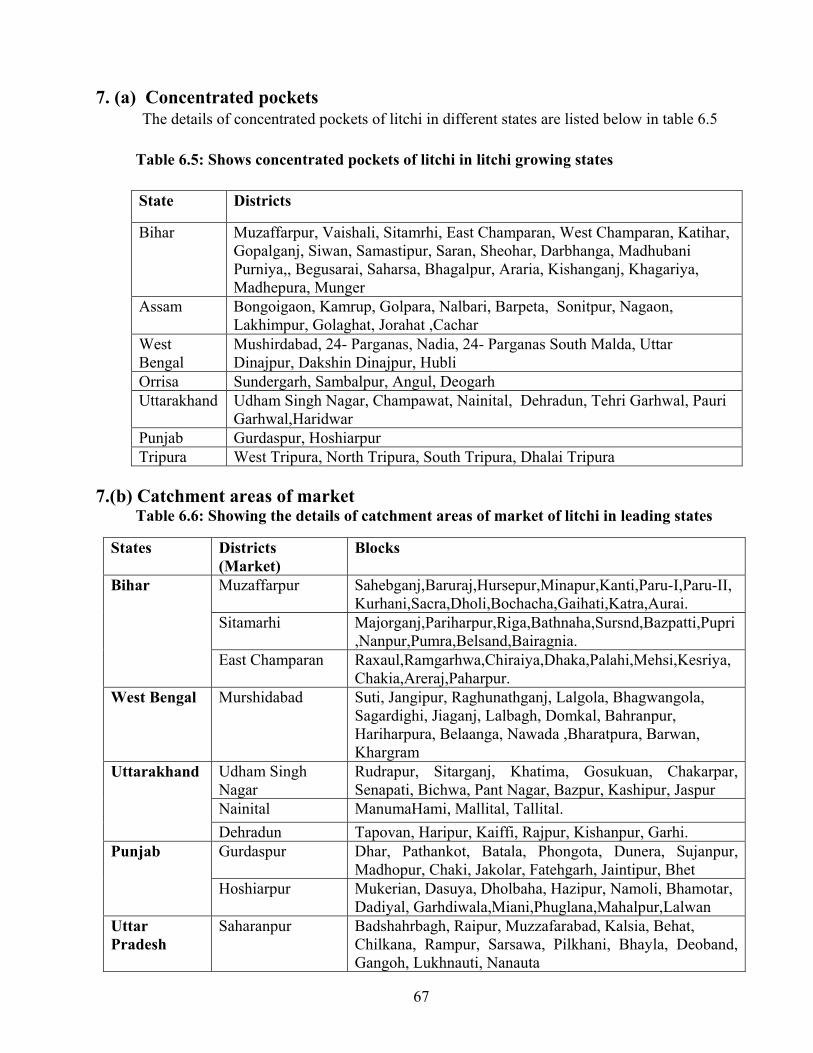
67
7. (a) Concentrated pockets The details of concentrated pockets of litchi in different states are listed below in table 6.5 Table 6.5: Shows concentrated pockets of litchi in litchi growing states
State Districts
Bihar Muzaffarpur, Vaishali, Sitamrhi, East Champaran, West Champaran, Katihar, Gopalganj, Siwan, Samastipur, Saran, Sheohar, Darbhanga, Madhubani Purniya,, Begusarai, Saharsa, Bhagalpur, Araria, Kishanganj, Khagariya, Madhepura, Munger
Assam Bongoigaon, Kamrup, Golpara, Nalbari, Barpeta, Sonitpur, Nagaon, Lakhimpur, Golaghat, Jorahat ,Cachar
West Bengal
Mushirdabad, 24- Parganas, Nadia, 24- Parganas South Malda, Uttar Dinajpur, Dakshin Dinajpur, Hubli
Orrisa Sundergarh, Sambalpur, Angul, Deogarh Uttarakhand Udham Singh Nagar, Champawat, Nainital, Dehradun, Tehri Garhwal, Pauri
Garhwal,Haridwar Punjab Gurdaspur, Hoshiarpur Tripura West Tripura, North Tripura, South Tripura, Dhalai Tripura
7.(b) Catchment areas of market Table 6.6: Showing the details of catchment areas of market of litchi in leading states
States Districts (Market)
Blocks
Muzaffarpur Sahebganj,Baruraj,Hursepur,Minapur,Kanti,Paru-I,Paru-II, Kurhani,Sacra,Dholi,Bochacha,Gaihati,Katra,Aurai.
Sitamarhi Majorganj,Pariharpur,Riga,Bathnaha,Sursnd,Bazpatti,Pupri,Nanpur,Pumra,Belsand,Bairagnia.
Bihar
East Champaran Raxaul,Ramgarhwa,Chiraiya,Dhaka,Palahi,Mehsi,Kesriya,Chakia,Areraj,Paharpur.
West Bengal Murshidabad Suti, Jangipur, Raghunathganj, Lalgola, Bhagwangola, Sagardighi, Jiaganj, Lalbagh, Domkal, Bahranpur, Hariharpura, Belaanga, Nawada ,Bharatpura, Barwan, Khargram
Udham Singh Nagar
Rudrapur, Sitarganj, Khatima, Gosukuan, Chakarpar, Senapati, Bichwa, Pant Nagar, Bazpur, Kashipur, Jaspur
Nainital ManumaHami, Mallital, Tallital.
Uttarakhand
Dehradun Tapovan, Haripur, Kaiffi, Rajpur, Kishanpur, Garhi. Gurdaspur Dhar, Pathankot, Batala, Phongota, Dunera, Sujanpur,
Madhopur, Chaki, Jakolar, Fatehgarh, Jaintipur, Bhet Punjab
Hoshiarpur Mukerian, Dasuya, Dholbaha, Hazipur, Namoli, Bhamotar, Dadiyal, Garhdiwala,Miani,Phuglana,Mahalpur,Lalwan
Uttar Pradesh
Saharanpur Badshahrbagh, Raipur, Muzzafarabad, Kalsia, Behat, Chilkana, Rampur, Sarsawa, Pilkhani, Bhayla, Deoband, Gangoh, Lukhnauti, Nanauta
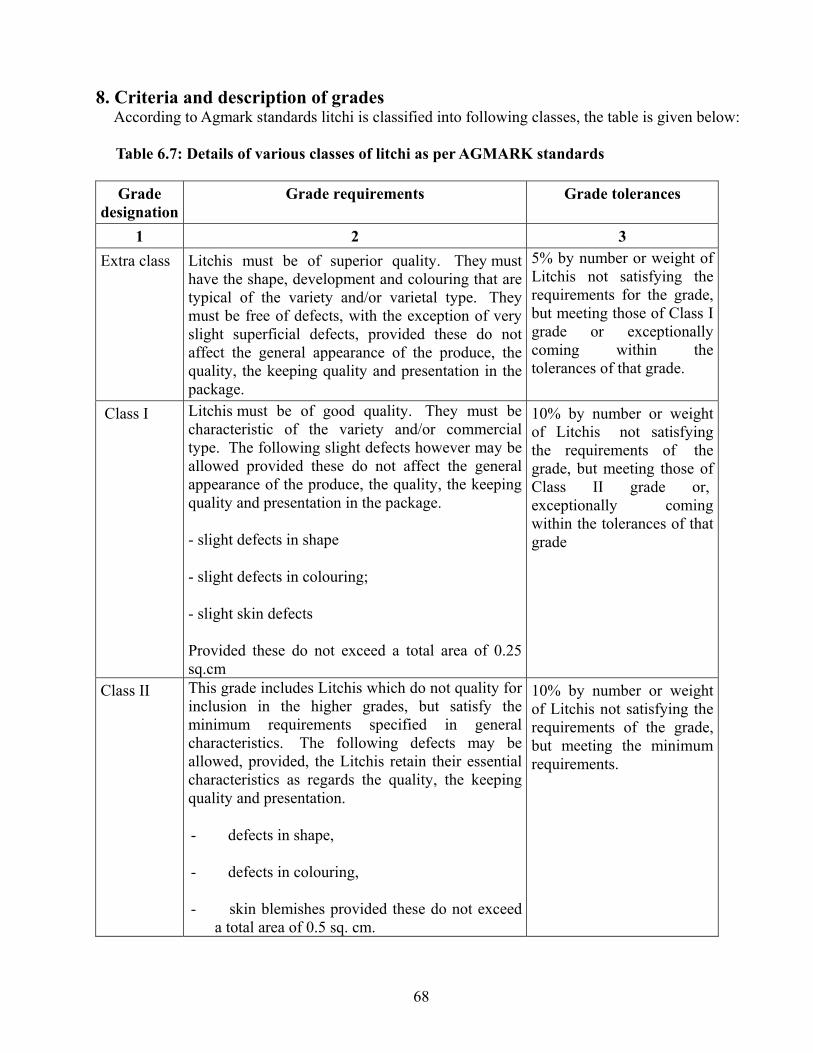
68
8. Criteria and description of grades According to Agmark standards litchi is classified into following classes, the table is given below:
Table 6.7: Details of various classes of litchi as per AGMARK standards
Grade designation
Grade requirements Grade tolerances
1 2 3 Extra class Litchis must be of superior quality. They must
have the shape, development and colouring that are typical of the variety and/or varietal type. They must be free of defects, with the exception of very slight superficial defects, provided these do not affect the general appearance of the produce, the quality, the keeping quality and presentation in the package.
5% by number or weight of Litchis not satisfying the requirements for the grade, but meeting those of Class I grade or exceptionally coming within the tolerances of that grade.
Class I Litchis must be of good quality. They must be characteristic of the variety and/or commercial type. The following slight defects however may be allowed provided these do not affect the general appearance of the produce, the quality, the keeping quality and presentation in the package.
- slight defects in shape
- slight defects in colouring;
- slight skin defects
Provided these do not exceed a total area of 0.25 sq.cm
10% by number or weight of Litchis not satisfying the requirements of the grade, but meeting those of Class II grade or, exceptionally coming within the tolerances of that grade
Class II This grade includes Litchis which do not quality for inclusion in the higher grades, but satisfy the minimum requirements specified in general characteristics. The following defects may be allowed, provided, the Litchis retain their essential characteristics as regards the quality, the keeping quality and presentation.
- defects in shape,
- defects in colouring,
- skin blemishes provided these do not exceed a total area of 0.5 sq. cm.
10% by number or weight of Litchis not satisfying the requirements of the grade, but meeting the minimum requirements.
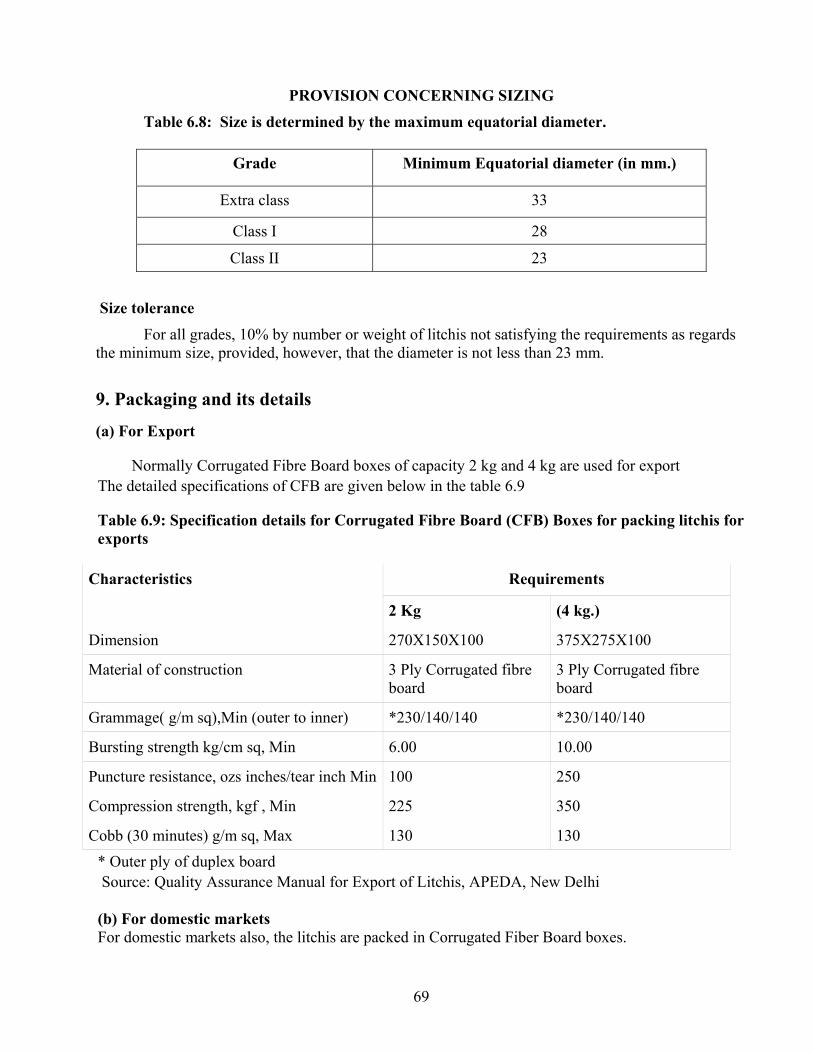
69
PROVISION CONCERNING SIZING
Table 6.8: Size is determined by the maximum equatorial diameter.
Grade Minimum Equatorial diameter (in mm.)
Extra class 33
Class I 28
Class II 23
Size tolerance
For all grades, 10% by number or weight of litchis not satisfying the requirements as regards the minimum size, provided, however, that the diameter is not less than 23 mm.
9. Packaging and its details (a) For Export
Normally Corrugated Fibre Board boxes of capacity 2 kg and 4 kg are used for export The detailed specifications of CFB are given below in the table 6.9
Table 6.9: Specification details for Corrugated Fibre Board (CFB) Boxes for packing litchis for exports
Requirements Characteristics
2 Kg (4 kg.)
Dimension 270X150X100 375X275X100
Material of construction 3 Ply Corrugated fibre board
3 Ply Corrugated fibre board
Grammage( g/m sq),Min (outer to inner) *230/140/140 *230/140/140
Bursting strength kg/cm sq, Min 6.00 10.00
Puncture resistance, ozs inches/tear inch Min 100 250
Compression strength, kgf , Min 225 350
Cobb (30 minutes) g/m sq, Max 130 130 * Outer ply of duplex board Source: Quality Assurance Manual for Export of Litchis, APEDA, New Delhi
(b) For domestic markets For domestic markets also, the litchis are packed in Corrugated Fiber Board boxes.
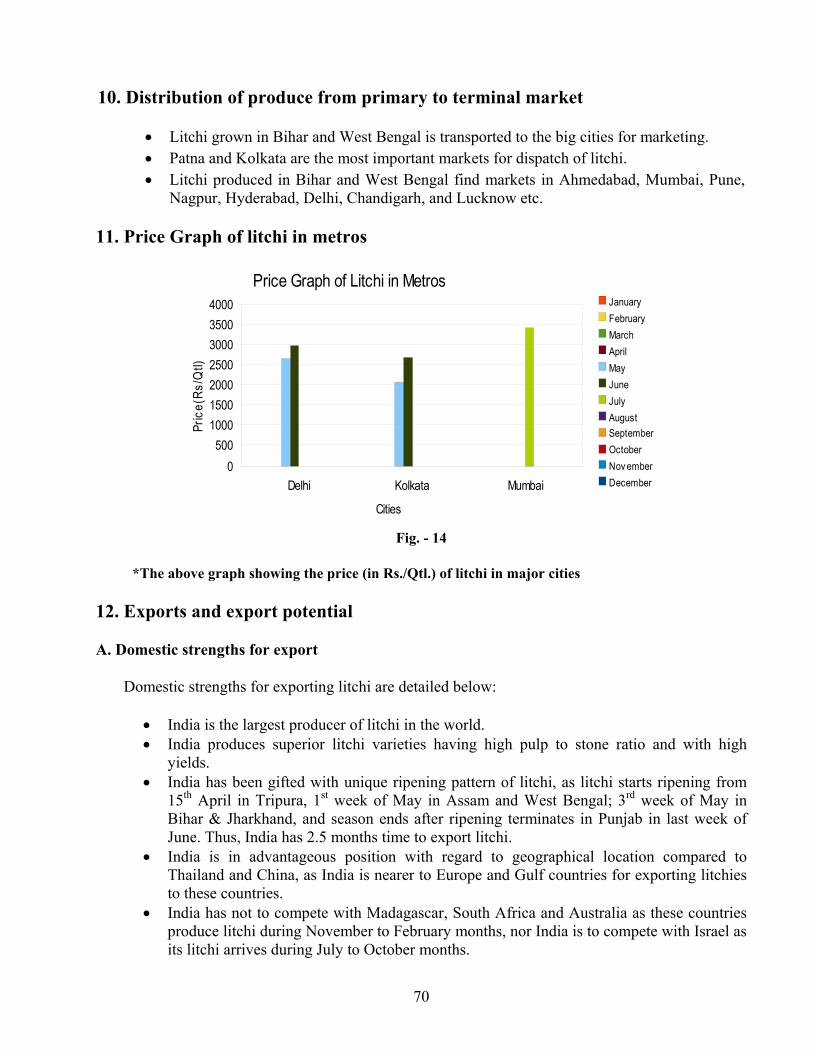
70
10. Distribution of produce from primary to terminal market
• Litchi grown in Bihar and West Bengal is transported to the big cities for marketing. • Patna and Kolkata are the most important markets for dispatch of litchi. • Litchi produced in Bihar and West Bengal find markets in Ahmedabad, Mumbai, Pune,
Nagpur, Hyderabad, Delhi, Chandigarh, and Lucknow etc.
11. Price Graph of litchi in metros
Fig. - 14
*The above graph showing the price (in Rs./Qtl.) of litchi in major cities
12. Exports and export potential
A. Domestic strengths for export
Domestic strengths for exporting litchi are detailed below:
• India is the largest producer of litchi in the world. • India produces superior litchi varieties having high pulp to stone ratio and with high
yields. • India has been gifted with unique ripening pattern of litchi, as litchi starts ripening from
15th April in Tripura, 1st week of May in Assam and West Bengal; 3rd week of May in Bihar & Jharkhand, and season ends after ripening terminates in Punjab in last week of June. Thus, India has 2.5 months time to export litchi.
• India is in advantageous position with regard to geographical location compared to Thailand and China, as India is nearer to Europe and Gulf countries for exporting litchies to these countries.
• India has not to compete with Madagascar, South Africa and Australia as these countries produce litchi during November to February months, nor India is to compete with Israel as its litchi arrives during July to October months.
Delhi Kolkata Mumbai0
5001000150020002500300035004000
Price Graph of Litchi in MetrosJanuaryFebruaryMarchAprilMayJuneJulyAugustSeptemberOctoberNov emberDecember
Cities
Pric
e(Rs
/Qtl)
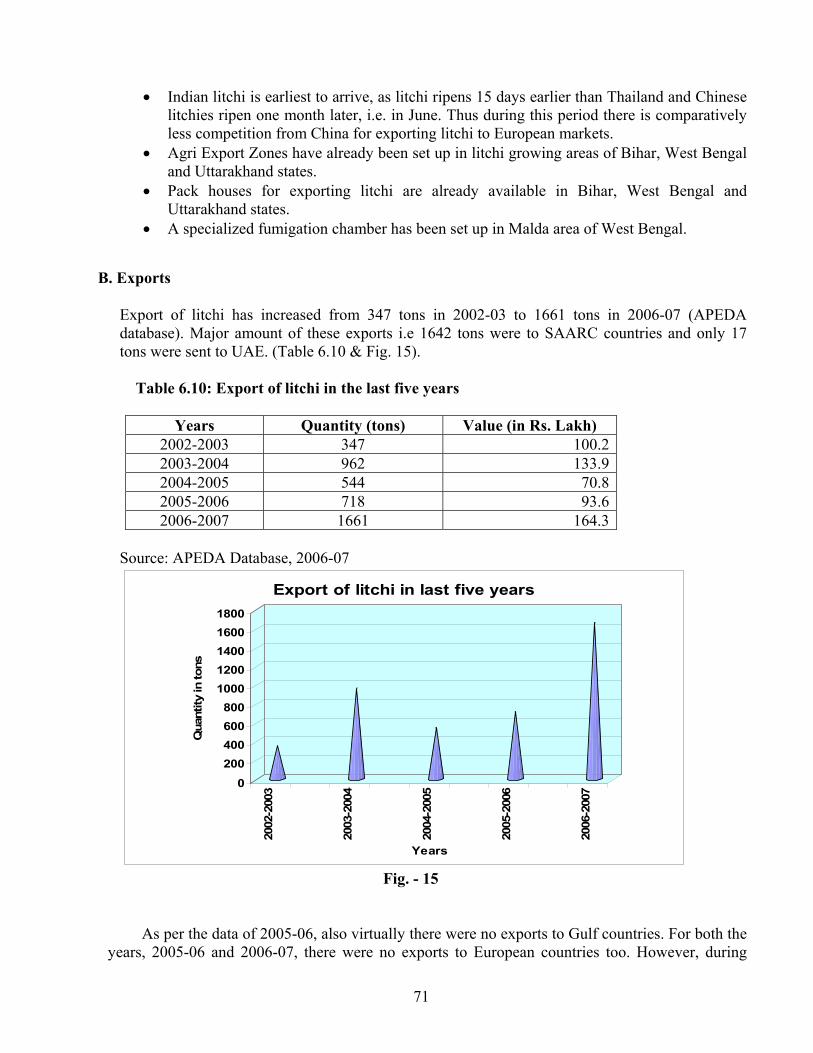
71
• Indian litchi is earliest to arrive, as litchi ripens 15 days earlier than Thailand and Chinese litchies ripen one month later, i.e. in June. Thus during this period there is comparatively less competition from China for exporting litchi to European markets.
• Agri Export Zones have already been set up in litchi growing areas of Bihar, West Bengal and Uttarakhand states.
• Pack houses for exporting litchi are already available in Bihar, West Bengal and Uttarakhand states.
• A specialized fumigation chamber has been set up in Malda area of West Bengal.
B. Exports
Export of litchi has increased from 347 tons in 2002-03 to 1661 tons in 2006-07 (APEDA database). Major amount of these exports i.e 1642 tons were to SAARC countries and only 17 tons were sent to UAE. (Table 6.10 & Fig. 15). Table 6.10: Export of litchi in the last five years
Years Quantity (tons) Value (in Rs. Lakh) 2002-2003 347 100.2 2003-2004 962 133.9 2004-2005 544 70.8 2005-2006 718 93.6 2006-2007 1661 164.3
Source: APEDA Database, 2006-07
0200400600800
10001200140016001800
Qua
ntity
in to
ns
2002
-200
3
2003
-200
4
2004
-200
5
2005
-200
6
2006
-200
7
Years
Export of litchi in last five years
Fig. - 15
As per the data of 2005-06, also virtually there were no exports to Gulf countries. For both the years, 2005-06 and 2006-07, there were no exports to European countries too. However, during
72
2003-04, 140 tons of litchi were exported to Belgium, 64 tons to UK and 34 tons to Netherlands. This shows that the exports to EU have declined inspite of the fact that the Indian litchi is available 2-3 weeks earlier than Thai litchi and 4-5 weeks earlier than Chinese litchi.
C. Export potential
The potential for export of litchi is discussed in the following paras: (i) GCC countries
Gulf countries imported litchi during 2006 up to 45,545 tons (Comtrade database). As per this database India exported litchi to GCC countries to the tune of 16,410 tons, however, APEDA database depicts no export of litchi during 2005-06 and 2006-07 to Gulf countries. Nevertheless, there is excellent potential for export of litchi to GCC countries, as India produces finest litchis. Litchis in India are available from 15th April (Tripura) onwards up to third week of June (Gurdaspur, Punjab). India is also supplying litchis to GCC countries at competitive prices compared to Thailand. Appropriate infrastructure is also available for post- harvest handling in a couple of states. India is also nearer to Gulf countries compared to Thailand and China. There is no reason why India can not export litchi to Gulf countries up to 4000 to 5000 tons in next 4-5 years.
(ii) EU countries
EU countries imported sizeable quantities of litchi during 2006. However, inspite of excellent potential for exports and even nearness of EU countries to India compared to Thailand and China, India has not been able to export any visible amount of litchi to EU except during 2003-04 when some amount of litchi was exported.The potential needs to be exploited by aggressive marketing and supplying better quality litchi having minimum pesticide residues etc.
D. Measures for enhancing competitiveness for exports Following measures are likely to enhance competitiveness of India in exporting litchi:
To exploit export of organic litchi in foreign markets, its cultivation in Tripura and Assam needs to be encouraged and to facilitate it, packhouses need to be established in a phased manner. Side by side markets for organic litchi need to be identified.
Litchi producing areas in Gurdaspur and Hoshiarpur districts of Punjab are near to Amritsar international airport. Export of litchi from this area can be enhanced by setting up of packhouse in the area.
Technology for CA and MA storage of litchi needs to be standardized perfected so that shelf life of litchi can be extended. Then, litchi to nearer areas like Gulf countries can be sent by reefer containers through MA cartons, if perfected.
Residue analysis laboratory need to be set up in at least Muzaffarpur,Bihar to begin with. 13. Storage Temperature : 2-3°C
Relative Humidity : 90-95%
Storage Period : 3-5 weeks
Sensitivity to refrigeration and ethylene.
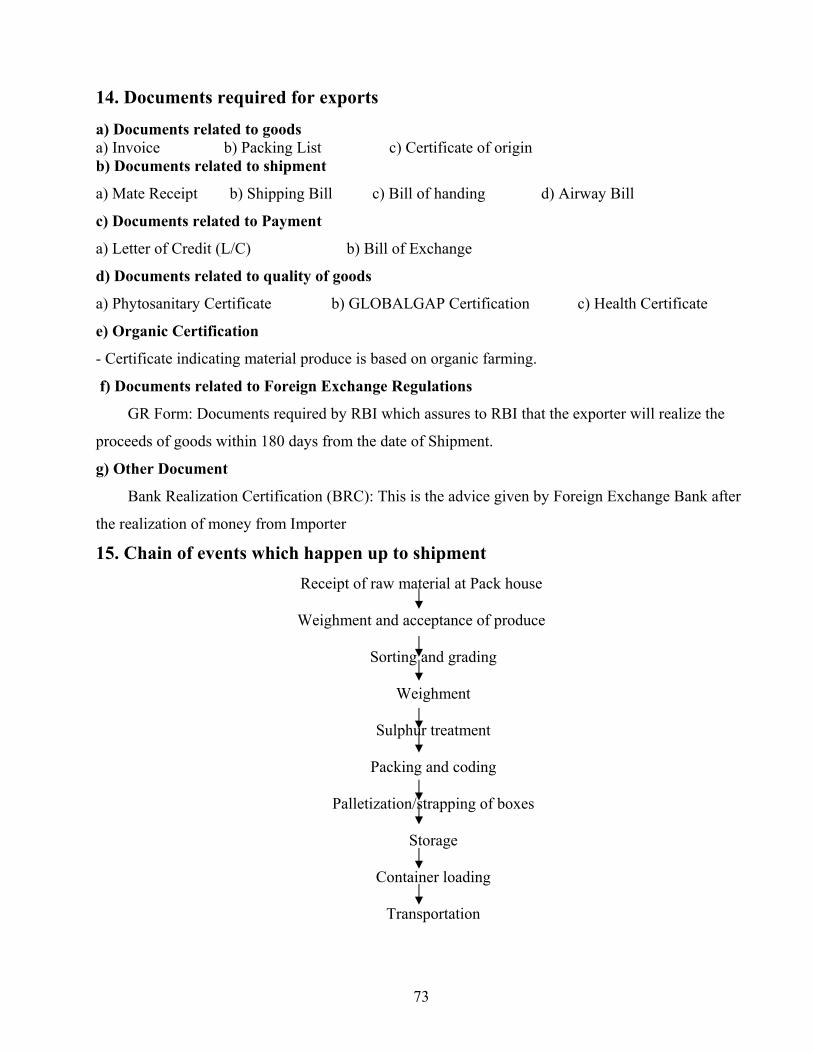
73
14. Documents required for exports a) Documents related to goods a) Invoice b) Packing List c) Certificate of origin b) Documents related to shipment
a) Mate Receipt b) Shipping Bill c) Bill of handing d) Airway Bill
c) Documents related to Payment
a) Letter of Credit (L/C) b) Bill of Exchange
d) Documents related to quality of goods
a) Phytosanitary Certificate b) GLOBALGAP Certification c) Health Certificate
e) Organic Certification
- Certificate indicating material produce is based on organic farming.
f) Documents related to Foreign Exchange Regulations
GR Form: Documents required by RBI which assures to RBI that the exporter will realize the
proceeds of goods within 180 days from the date of Shipment.
g) Other Document
Bank Realization Certification (BRC): This is the advice given by Foreign Exchange Bank after
the realization of money from Importer
15. Chain of events which happen up to shipment
Receipt of raw material at Pack house
Weighment and acceptance of produce
Sorting and grading
Weighment
Sulphur treatment
Packing and coding
Palletization/strapping of boxes
Storage
Container loading
Transportation
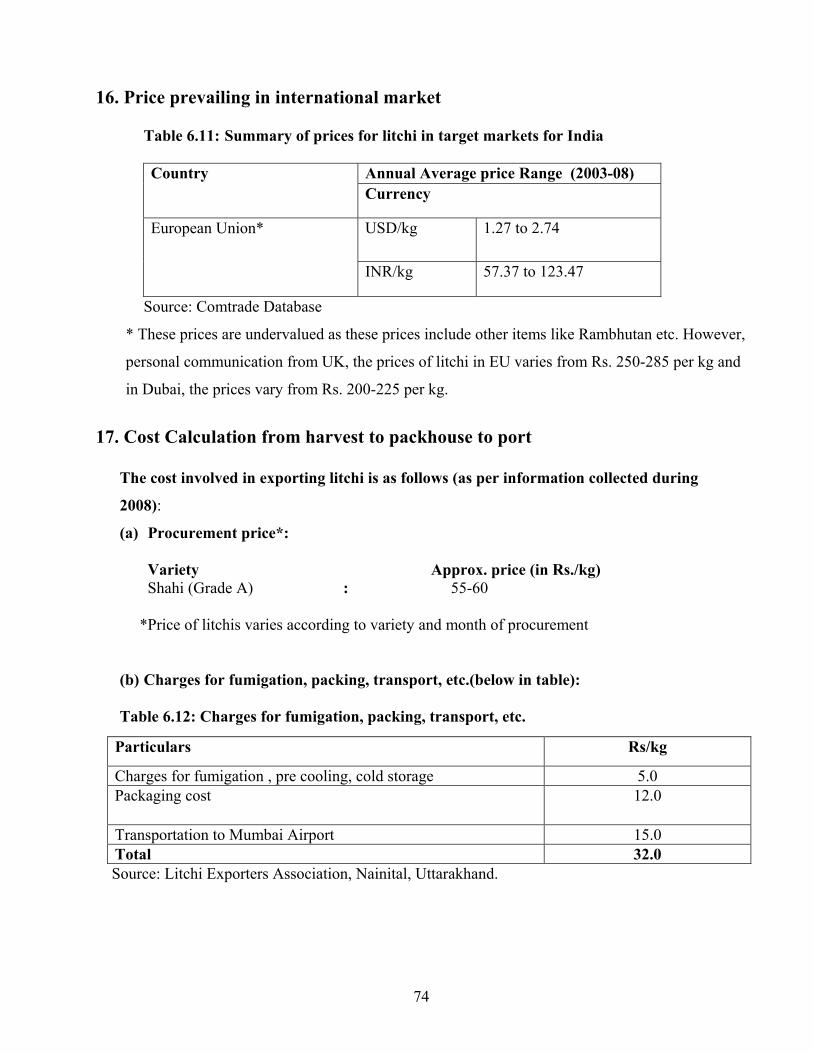
74
16. Price prevailing in international market
Table 6.11: Summary of prices for litchi in target markets for India
Annual Average price Range (2003-08) Country Currency
USD/kg 1.27 to 2.74 European Union*
INR/kg 57.37 to 123.47
Source: Comtrade Database
* These prices are undervalued as these prices include other items like Rambhutan etc. However,
personal communication from UK, the prices of litchi in EU varies from Rs. 250-285 per kg and
in Dubai, the prices vary from Rs. 200-225 per kg.
17. Cost Calculation from harvest to packhouse to port
The cost involved in exporting litchi is as follows (as per information collected during
2008):
(a) Procurement price*: Variety Approx. price (in Rs./kg)
Shahi (Grade A) : 55-60
*Price of litchis varies according to variety and month of procurement (b) Charges for fumigation, packing, transport, etc.(below in table): Table 6.12: Charges for fumigation, packing, transport, etc.
Source: Litchi Exporters Association, Nainital, Uttarakhand.
Particulars Rs/kg
Charges for fumigation , pre cooling, cold storage 5.0 Packaging cost 12.0
Transportation to Mumbai Airport 15.0 Total 32.0
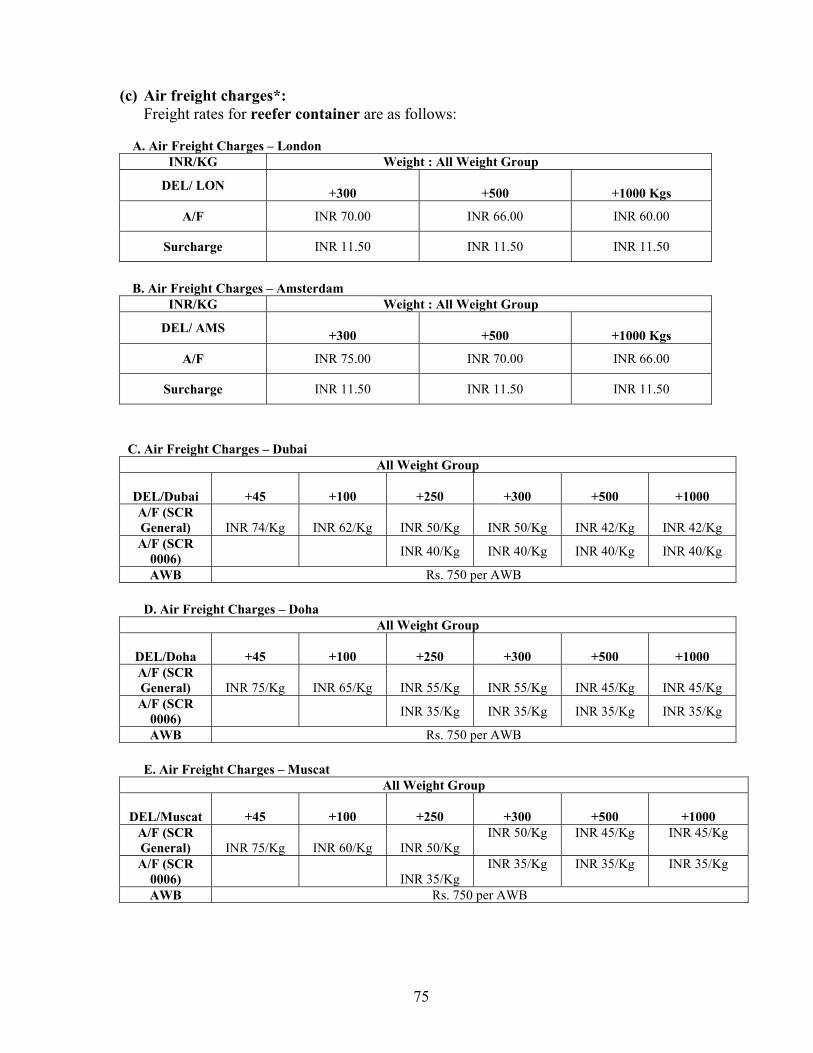
75
(c) Air freight charges*: Freight rates for reefer container are as follows:
A. Air Freight Charges – London
INR/KG Weight : All Weight Group
DEL/ LON +300 +500 +1000 Kgs
A/F INR 70.00 INR 66.00 INR 60.00
Surcharge INR 11.50 INR 11.50 INR 11.50
B. Air Freight Charges – Amsterdam
INR/KG Weight : All Weight Group
DEL/ AMS +300 +500 +1000 Kgs
A/F INR 75.00 INR 70.00 INR 66.00
Surcharge INR 11.50 INR 11.50 INR 11.50
C. Air Freight Charges – Dubai
All Weight Group
DEL/Dubai +45 +100 +250 +300 +500 +1000 A/F (SCR General) INR 74/Kg INR 62/Kg INR 50/Kg INR 50/Kg INR 42/Kg INR 42/Kg A/F (SCR
0006) INR 40/Kg INR 40/Kg INR 40/Kg INR 40/Kg
AWB Rs. 750 per AWB D. Air Freight Charges – Doha
All Weight Group
DEL/Doha +45 +100 +250 +300 +500 +1000 A/F (SCR General) INR 75/Kg INR 65/Kg INR 55/Kg INR 55/Kg INR 45/Kg INR 45/Kg A/F (SCR
0006) INR 35/Kg INR 35/Kg INR 35/Kg INR 35/Kg
AWB Rs. 750 per AWB E. Air Freight Charges – Muscat
All Weight Group
DEL/Muscat +45 +100 +250 +300 +500 +1000 A/F (SCR General) INR 75/Kg INR 60/Kg INR 50/Kg
INR 50/Kg INR 45/Kg INR 45/Kg
A/F (SCR 0006) INR 35/Kg
INR 35/Kg INR 35/Kg INR 35/Kg
AWB Rs. 750 per AWB
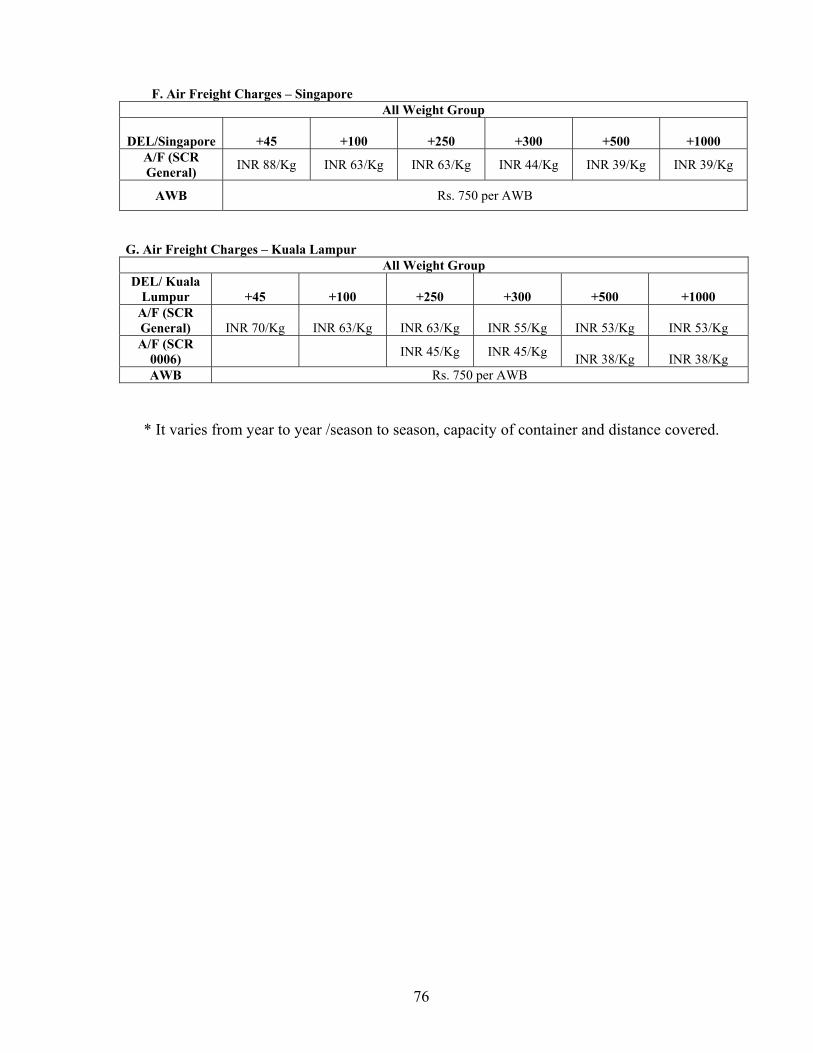
76
F. Air Freight Charges – Singapore All Weight Group
DEL/Singapore +45 +100 +250 +300 +500 +1000 A/F (SCR General) INR 88/Kg INR 63/Kg INR 63/Kg INR 44/Kg INR 39/Kg INR 39/Kg
AWB Rs. 750 per AWB
G. Air Freight Charges – Kuala Lampur All Weight Group
DEL/ Kuala Lumpur +45 +100 +250 +300 +500 +1000
A/F (SCR General) INR 70/Kg INR 63/Kg INR 63/Kg INR 55/Kg INR 53/Kg INR 53/Kg A/F (SCR
0006) INR 45/Kg INR 45/Kg INR 38/Kg INR 38/Kg AWB Rs. 750 per AWB
* It varies from year to year /season to season, capacity of container and distance covered.
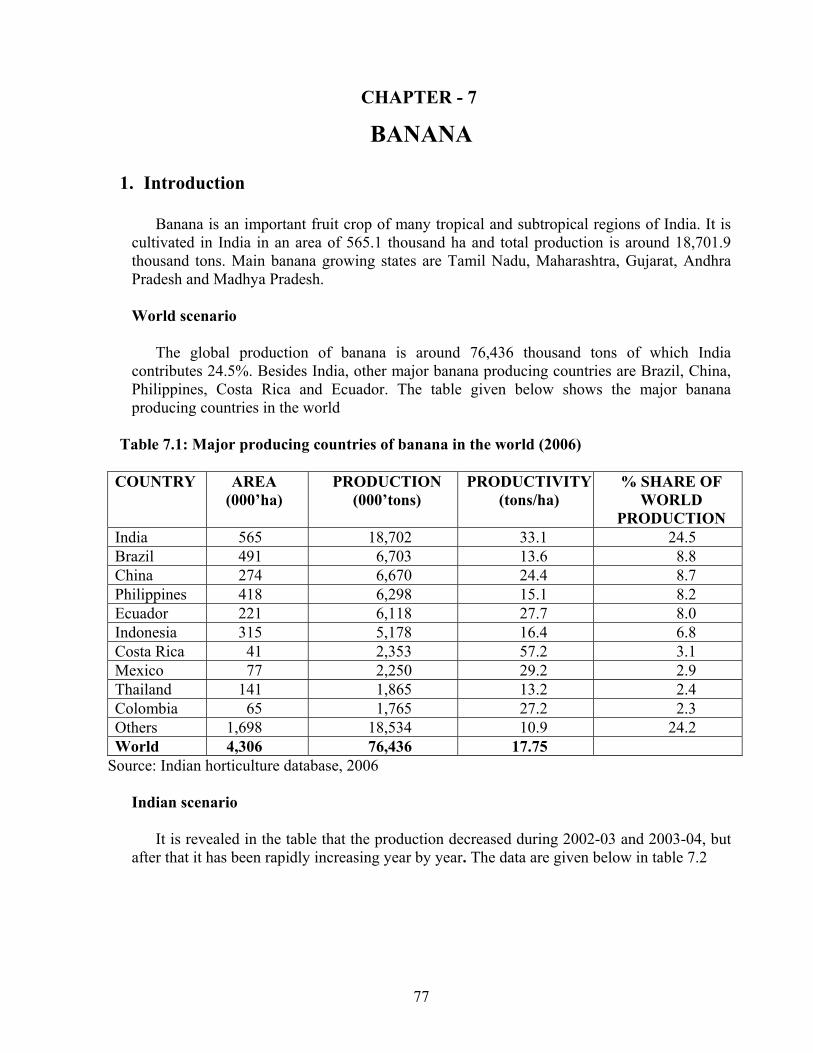
77
CHAPTER - 7
BANANA
1. Introduction
Banana is an important fruit crop of many tropical and subtropical regions of India. It is cultivated in India in an area of 565.1 thousand ha and total production is around 18,701.9 thousand tons. Main banana growing states are Tamil Nadu, Maharashtra, Gujarat, Andhra Pradesh and Madhya Pradesh.
World scenario
The global production of banana is around 76,436 thousand tons of which India contributes 24.5%. Besides India, other major banana producing countries are Brazil, China, Philippines, Costa Rica and Ecuador. The table given below shows the major banana producing countries in the world
Table 7.1: Major producing countries of banana in the world (2006)
COUNTRY AREA (000’ha)
PRODUCTION (000’tons)
PRODUCTIVITY (tons/ha)
% SHARE OF WORLD
PRODUCTION India 565 18,702 33.1 24.5 Brazil 491 6,703 13.6 8.8 China 274 6,670 24.4 8.7 Philippines 418 6,298 15.1 8.2 Ecuador 221 6,118 27.7 8.0 Indonesia 315 5,178 16.4 6.8 Costa Rica 41 2,353 57.2 3.1 Mexico 77 2,250 29.2 2.9 Thailand 141 1,865 13.2 2.4 Colombia 65 1,765 27.2 2.3 Others 1,698 18,534 10.9 24.2 World 4,306 76,436 17.75
Source: Indian horticulture database, 2006
Indian scenario
It is revealed in the table that the production decreased during 2002-03 and 2003-04, but after that it has been rapidly increasing year by year. The data are given below in table 7.2
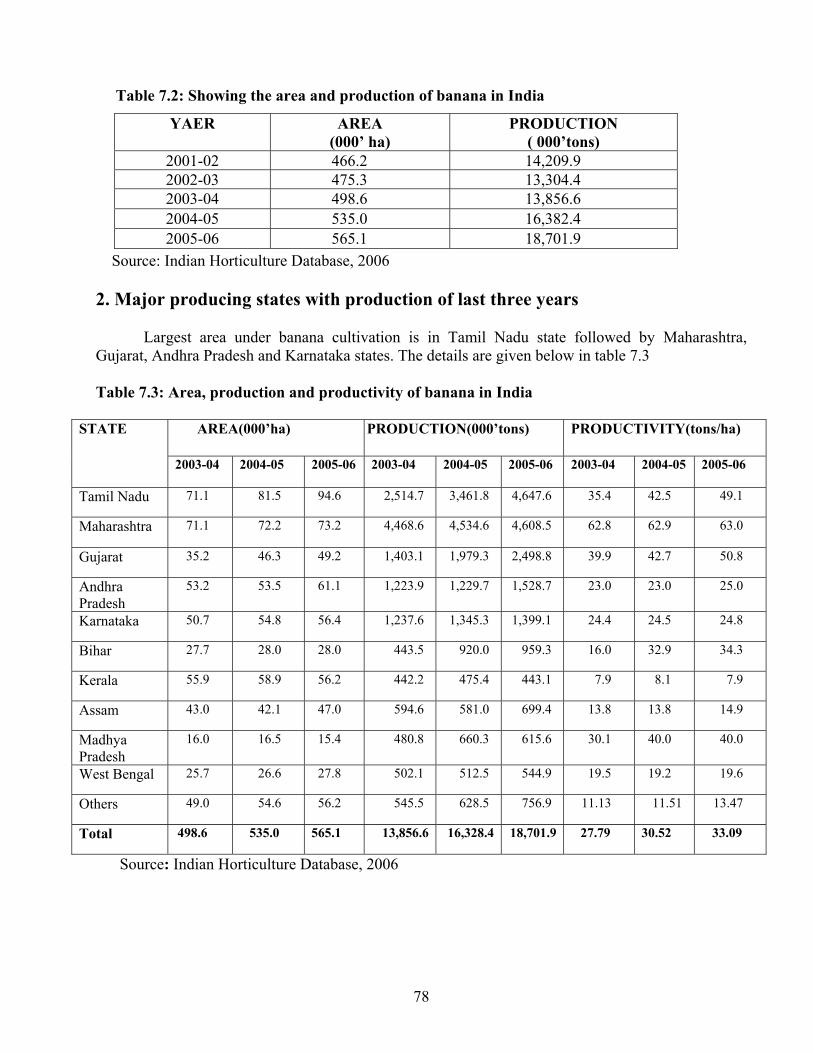
78
Table 7.2: Showing the area and production of banana in India
Source: Indian Horticulture Database, 2006 2. Major producing states with production of last three years
Largest area under banana cultivation is in Tamil Nadu state followed by Maharashtra, Gujarat, Andhra Pradesh and Karnataka states. The details are given below in table 7.3 Table 7.3: Area, production and productivity of banana in India
AREA(000’ha) PRODUCTION(000’tons) PRODUCTIVITY(tons/ha) STATE
2003-04
2004-05 2005-06 2003-04 2004-05 2005-06 2003-04 2004-05 2005-06
Tamil Nadu 71.1 81.5 94.6 2,514.7 3,461.8 4,647.6 35.4 42.5 49.1
Maharashtra 71.1 72.2 73.2 4,468.6 4,534.6 4,608.5 62.8 62.9 63.0
Gujarat 35.2 46.3 49.2 1,403.1 1,979.3 2,498.8 39.9 42.7 50.8
Andhra Pradesh
53.2 53.5 61.1 1,223.9 1,229.7 1,528.7 23.0 23.0 25.0
Karnataka 50.7 54.8 56.4 1,237.6 1,345.3 1,399.1 24.4 24.5 24.8
Bihar 27.7 28.0 28.0 443.5 920.0 959.3 16.0 32.9 34.3
Kerala 55.9 58.9 56.2 442.2 475.4 443.1 7.9 8.1 7.9
Assam 43.0 42.1 47.0 594.6 581.0 699.4 13.8 13.8 14.9
Madhya Pradesh
16.0 16.5 15.4 480.8 660.3 615.6 30.1 40.0 40.0
West Bengal 25.7 26.6 27.8 502.1 512.5 544.9 19.5 19.2 19.6
Others 49.0 54.6 56.2 545.5 628.5 756.9 11.13 11.51 13.47
Total 498.6 535.0 565.1 13,856.6 16,328.4 18,701.9 27.79 30.52 33.09
Source: Indian Horticulture Database, 2006
YAER AREA (000’ ha)
PRODUCTION ( 000’tons)
2001-02 466.2 14,209.9 2002-03 475.3 13,304.4 2003-04 498.6 13,856.6 2004-05 535.0 16,382.4 2005-06 565.1 18,701.9
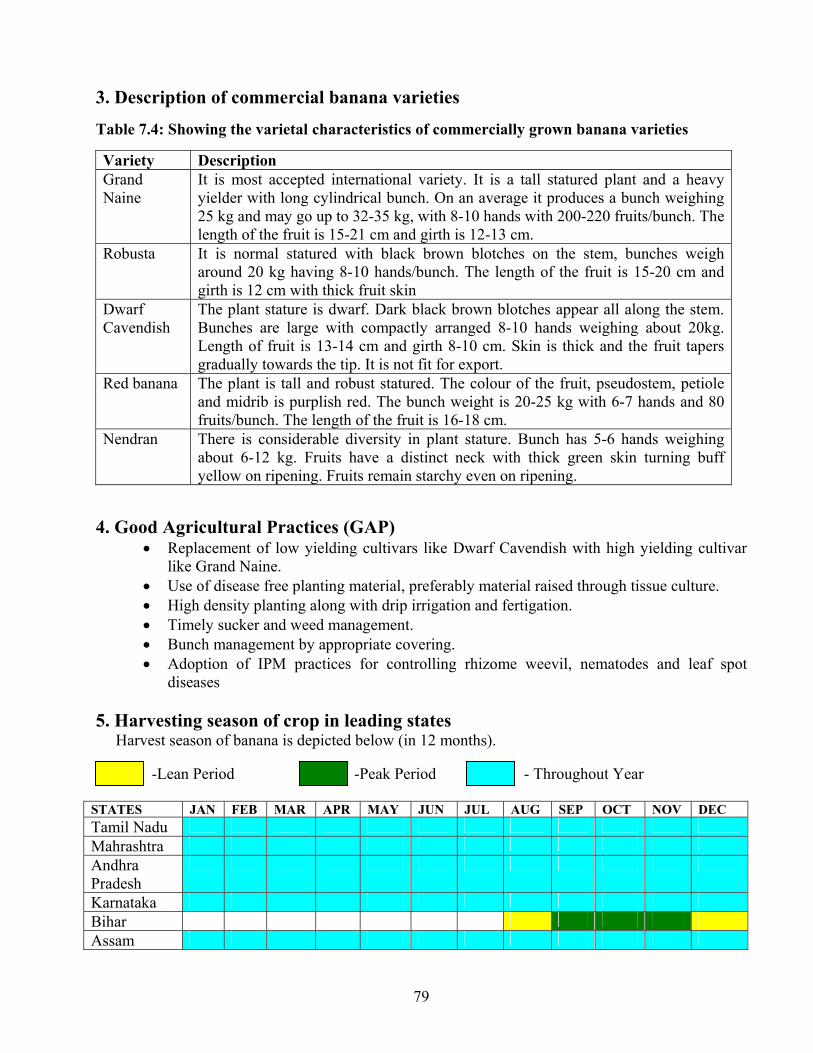
79
3. Description of commercial banana varieties
Table 7.4: Showing the varietal characteristics of commercially grown banana varieties
Variety Description Grand Naine
It is most accepted international variety. It is a tall statured plant and a heavy yielder with long cylindrical bunch. On an average it produces a bunch weighing 25 kg and may go up to 32-35 kg, with 8-10 hands with 200-220 fruits/bunch. The length of the fruit is 15-21 cm and girth is 12-13 cm.
Robusta It is normal statured with black brown blotches on the stem, bunches weigh around 20 kg having 8-10 hands/bunch. The length of the fruit is 15-20 cm and girth is 12 cm with thick fruit skin
Dwarf Cavendish
The plant stature is dwarf. Dark black brown blotches appear all along the stem. Bunches are large with compactly arranged 8-10 hands weighing about 20kg. Length of fruit is 13-14 cm and girth 8-10 cm. Skin is thick and the fruit tapers gradually towards the tip. It is not fit for export.
Red banana The plant is tall and robust statured. The colour of the fruit, pseudostem, petiole and midrib is purplish red. The bunch weight is 20-25 kg with 6-7 hands and 80 fruits/bunch. The length of the fruit is 16-18 cm.
Nendran There is considerable diversity in plant stature. Bunch has 5-6 hands weighing about 6-12 kg. Fruits have a distinct neck with thick green skin turning buff yellow on ripening. Fruits remain starchy even on ripening.
4. Good Agricultural Practices (GAP) • Replacement of low yielding cultivars like Dwarf Cavendish with high yielding cultivar
like Grand Naine. • Use of disease free planting material, preferably material raised through tissue culture. • High density planting along with drip irrigation and fertigation. • Timely sucker and weed management. • Bunch management by appropriate covering. • Adoption of IPM practices for controlling rhizome weevil, nematodes and leaf spot
diseases 5. Harvesting season of crop in leading states Harvest season of banana is depicted below (in 12 months).
-Lean Period -Peak Period - Throughout Year
STATES JAN FEB MAR APR MAY JUN JUL AUG SEP OCT NOV DEC Tamil Nadu Mahrashtra Andhra Pradesh
Karnataka Bihar Assam
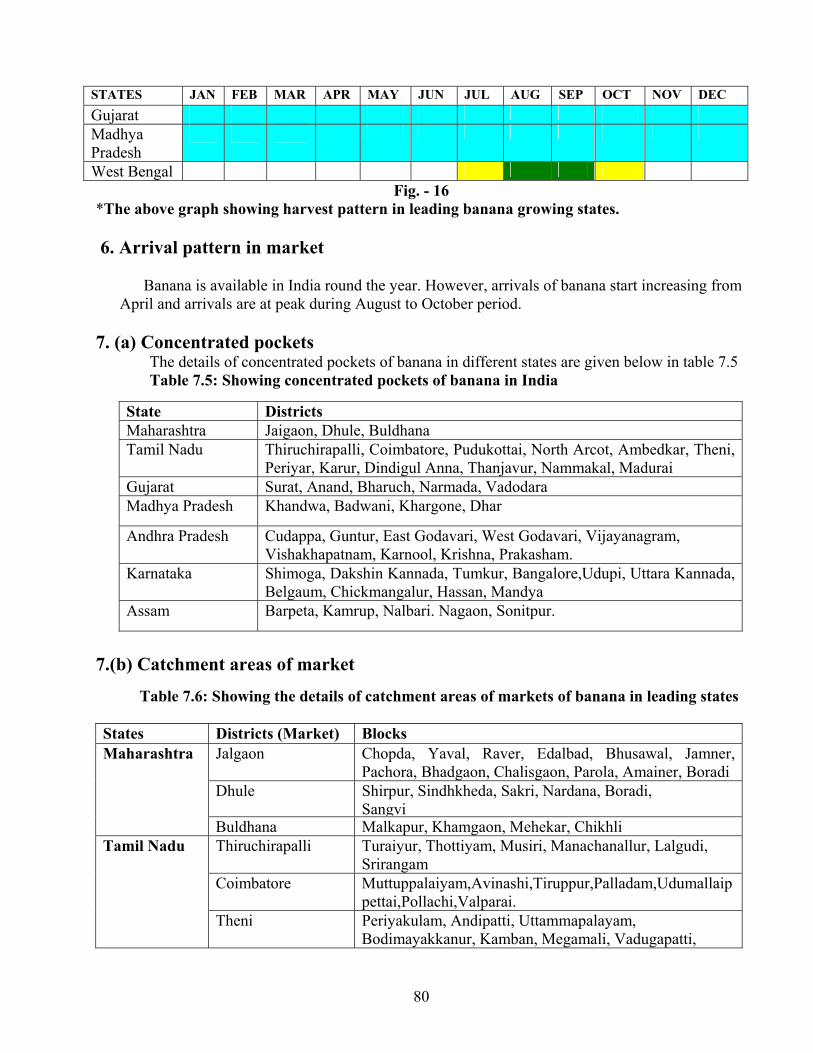
80
STATES JAN FEB MAR APR MAY JUN JUL AUG SEP OCT NOV DEC Gujarat Madhya Pradesh
West Bengal Fig. - 16
*The above graph showing harvest pattern in leading banana growing states. 6. Arrival pattern in market
Banana is available in India round the year. However, arrivals of banana start increasing from
April and arrivals are at peak during August to October period. 7. (a) Concentrated pockets
The details of concentrated pockets of banana in different states are given below in table 7.5 Table 7.5: Showing concentrated pockets of banana in India
State Districts Maharashtra Jaigaon, Dhule, Buldhana Tamil Nadu Thiruchirapalli, Coimbatore, Pudukottai, North Arcot, Ambedkar, Theni,
Periyar, Karur, Dindigul Anna, Thanjavur, Nammakal, Madurai Gujarat Surat, Anand, Bharuch, Narmada, Vadodara Madhya Pradesh Khandwa, Badwani, Khargone, Dhar
Andhra Pradesh Cudappa, Guntur, East Godavari, West Godavari, Vijayanagram, Vishakhapatnam, Karnool, Krishna, Prakasham.
Karnataka Shimoga, Dakshin Kannada, Tumkur, Bangalore,Udupi, Uttara Kannada, Belgaum, Chickmangalur, Hassan, Mandya
Assam Barpeta, Kamrup, Nalbari. Nagaon, Sonitpur.
7.(b) Catchment areas of market Table 7.6: Showing the details of catchment areas of markets of banana in leading states States Districts (Market) Blocks
Jalgaon Chopda, Yaval, Raver, Edalbad, Bhusawal, Jamner, Pachora, Bhadgaon, Chalisgaon, Parola, Amainer, Boradi
Dhule Shirpur, Sindhkheda, Sakri, Nardana, Boradi, Sangvi
Maharashtra
Buldhana Malkapur, Khamgaon, Mehekar, Chikhli Thiruchirapalli Turaiyur, Thottiyam, Musiri, Manachanallur, Lalgudi,
Srirangam Coimbatore Muttuppalaiyam,Avinashi,Tiruppur,Palladam,Udumallaip
pettai,Pollachi,Valparai.
Tamil Nadu
Theni Periyakulam, Andipatti, Uttammapalayam, Bodimayakkanur, Kamban, Megamali, Vadugapatti,
81
Khandwa Harsud, Pandhana, Nepanagar, Burhanpur Dhar Badnawar, Sardarpur, Gandhqwani, Manaawr, Kukshi,
Dharmapuri
Madhya Pradesh
Badwani Thikri, Rajpur, Newali, Pansemal, Sendwa Guntur Tangeda,Dachepalle,Piduguralla,Sattenapalie,Vinkoda,Po
nnuru,Bapatia,Narasaraopet,Purti,Prattipadu,Pallapatla. Vijayanagram Parvatipuram,Bobblli,Gajapatinagaram,Chipurupalla,Salu
Andhra Pradesh
Prakasham Erragondapalem, Markopur, Giddalur, Tarlupadu, Podile, Darsai, Baulipali, Chundi
Surat Mangrol,Umarwada,Mandvi,Vyara,Valod,Mahuva,Palsana,Kamrej,Olpad,Nizer,Vadoli,Unal.
Gujarat
Anand Sojitra,Sarsa,Sunav,Undel,Lunej,Ras,Kantha,Morai,Vadtal,Bochasan,Dhuwaean,Khambhat,Rohoni,Wadgam.
Uttar Kannad Maliyal,Mundgod,Yellapur,Sirsi,Siddapur,Bhatkal,AnkolKarnataka Udupi Kundapura,Kokkaroni,Karkal,Goligudelej,Chittur,Harma
nu,Kokkaroni,Shivapura,Kodlamale,Yermal
8. Criteria and description of grades
According to Agmark standards banana is classified into following classes:
Table 7.7: Showing grade designation of banana as per AGMARK standards
Grade designation
Grade requirements Grade tolerances
Extra class Bananas shall be of superior quality. They must be characteristics of the variety and/or commercial type. The fingers must be free of defects, with the exception of very slight superficial defects, provided these do not affect the general appearance of the produce, quality, the keeping quality and presentation in the package.
5% by number or weight of bananas not satisfying the requirements of the grade, but meeting those of for Class I grade or, exceptionally, coming within the tolerances for that class.
Class I Bananas shall be of good quality. They must be characteristics of the variety and/or commercial type. The following slight defects of the fingers, however, may be allowed, provided these do not affect the general appearance of the produce, quality, the keeping quality and presentation in the package.
- slight defects in shape and colour;
- slight defects due to rubbing and other superficial defects not exceeding 2 sq.cm. of the total surface area
10% number or weight of bananas not satisfying the requirements of the grade but meeting those of Class II or, exceptionally, coming within the tolerances of that grade.
82
The defects must not affect the flesh of the fruit. Class II This includes bananas which do not qualify for
inclusion in the higher classes, but satisfy the minimum requirements. The following defects may be there, provided the bananas retain their essential characteristics as regards the quality, the keeping quality and presentation.
- defects in shape and colour provided the product remains the normal characteristics of bananas;
- skin defects due to scrapping, scabs, rubbing, blemishes or other causes not exceeding 4 sq.cm. of the total surface area;
The defects must not affect the flesh of the fruit
10% by number or weight of bananas not satisfying the requirements of the grade, but meeting the minimum requirements.
Provisions concerning sizing
(i) For the purposes of sizing bananas, the length of the fingers is determined along the outside curve from the blossom end to the base of the pedicel where the edible pulp ends and the diameter is defined as the thickness of a transverse section between the lateral faces. The reference fruit for measurement of the length and grade is:
- for hands, the median finger on the outer row of the hand,
- for clusters, the finger next to the cut section of the hand, on the outer row of the cluster.
(ii) The minimum length should not be less than 14.0 cm and the minimum grade not less than 2.7 cm.
(iii) For all classes, 10% by number or weight of bananas not satisfying the sizing characteristics, up to a limit of 1 cm for the minimum length of 14 cm.
9. Packaging and its details
(a) For export
For packaging bananas, telescopic boxes of 5 ply strength and of the following dimensions need to be used- Telescopic card board fibre boxes and other materials-
• Top = 48.25cm X 31.75cm X 20.25cm -5 ply • Bottom= 47.50 X 31.25cm X 19.75cm -5ply • Gap plate= 3 ply • Foam sheet or foam pad= 20mm thick, 38cm X 25cm size with 10 mm holes
Weight of final packed box is approximately 13.0 Kg Source: Kay Bee Exports, Mumbai and Mahabanana, Jalgaon.
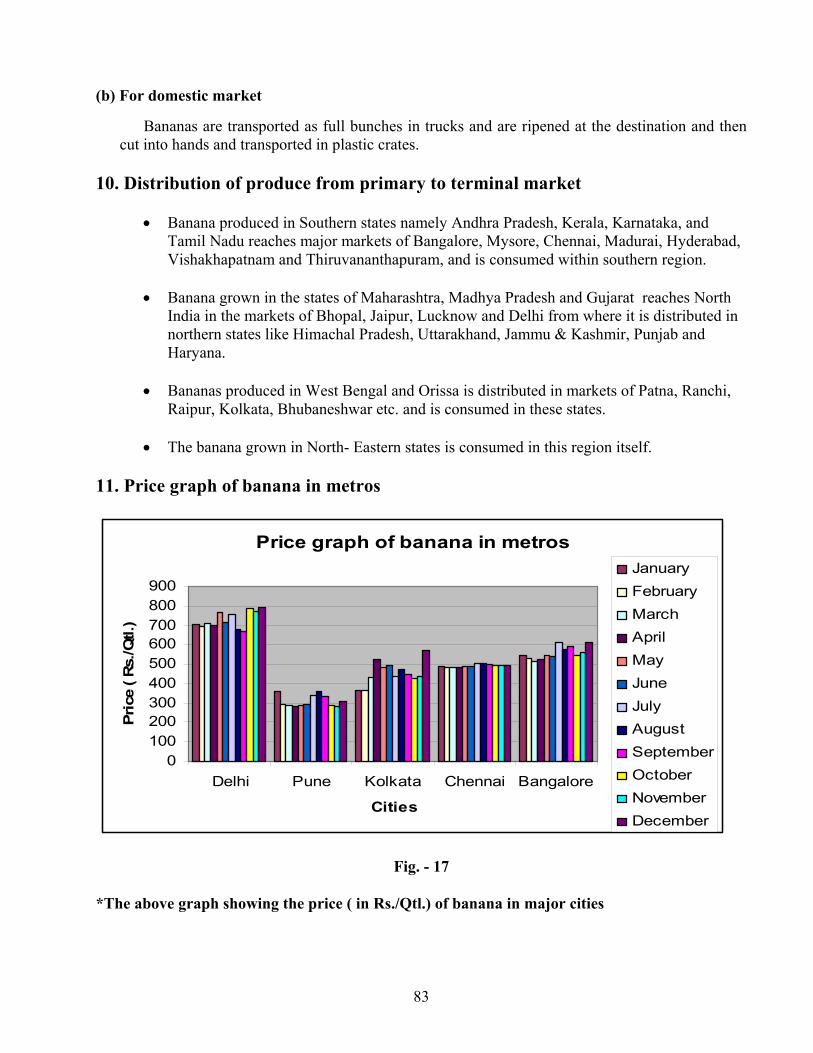
83
(b) For domestic market
Bananas are transported as full bunches in trucks and are ripened at the destination and then cut into hands and transported in plastic crates.
10. Distribution of produce from primary to terminal market
• Banana produced in Southern states namely Andhra Pradesh, Kerala, Karnataka, and Tamil Nadu reaches major markets of Bangalore, Mysore, Chennai, Madurai, Hyderabad, Vishakhapatnam and Thiruvananthapuram, and is consumed within southern region.
• Banana grown in the states of Maharashtra, Madhya Pradesh and Gujarat reaches North India in the markets of Bhopal, Jaipur, Lucknow and Delhi from where it is distributed in northern states like Himachal Pradesh, Uttarakhand, Jammu & Kashmir, Punjab and Haryana.
• Bananas produced in West Bengal and Orissa is distributed in markets of Patna, Ranchi, Raipur, Kolkata, Bhubaneshwar etc. and is consumed in these states.
• The banana grown in North- Eastern states is consumed in this region itself.
11. Price graph of banana in metros
Price graph of banana in metros
0100200300400500600700800900
Delhi Pune Kolkata Chennai Bangalore
Cities
Pric
e ( R
s./Q
tl.)
JanuaryFebruaryMarchAprilMayJuneJulyAugustSeptemberOctoberNovemberDecember
Fig. - 17
*The above graph showing the price ( in Rs./Qtl.) of banana in major cities
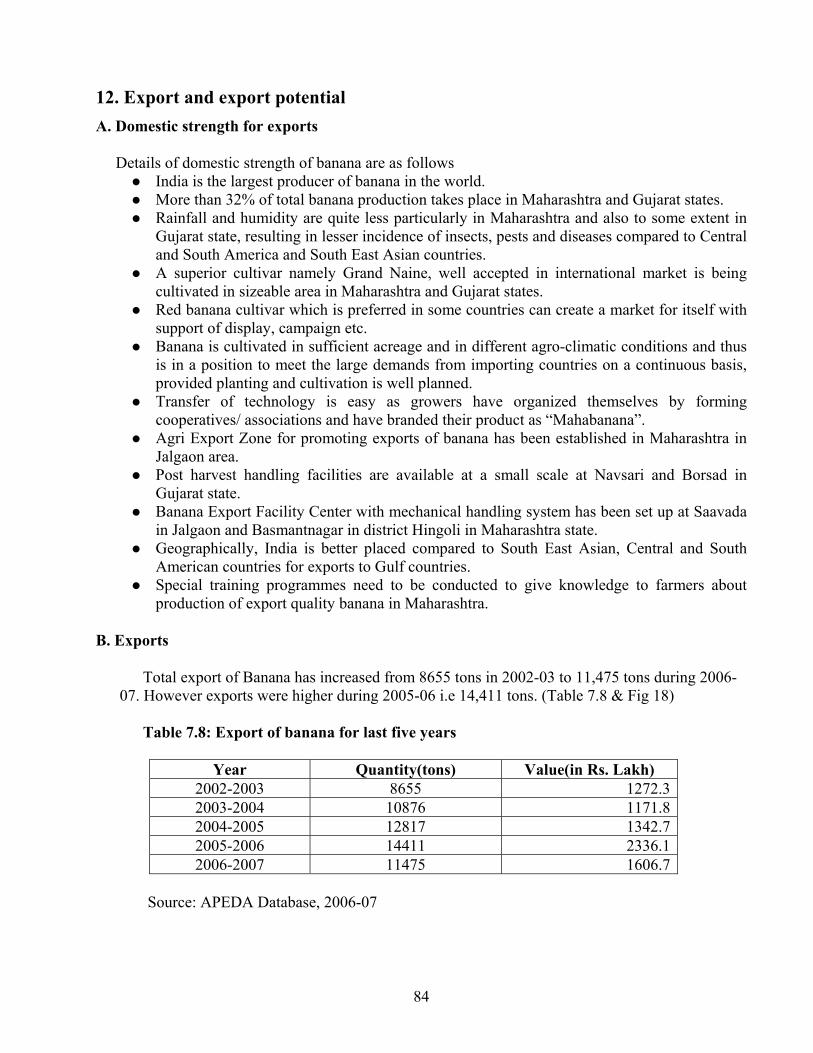
84
12. Export and export potential
A. Domestic strength for exports Details of domestic strength of banana are as follows
India is the largest producer of banana in the world. More than 32% of total banana production takes place in Maharashtra and Gujarat states. Rainfall and humidity are quite less particularly in Maharashtra and also to some extent in
Gujarat state, resulting in lesser incidence of insects, pests and diseases compared to Central and South America and South East Asian countries.
A superior cultivar namely Grand Naine, well accepted in international market is being cultivated in sizeable area in Maharashtra and Gujarat states.
Red banana cultivar which is preferred in some countries can create a market for itself with support of display, campaign etc.
Banana is cultivated in sufficient acreage and in different agro-climatic conditions and thus is in a position to meet the large demands from importing countries on a continuous basis, provided planting and cultivation is well planned.
Transfer of technology is easy as growers have organized themselves by forming cooperatives/ associations and have branded their product as “Mahabanana”.
Agri Export Zone for promoting exports of banana has been established in Maharashtra in Jalgaon area.
Post harvest handling facilities are available at a small scale at Navsari and Borsad in Gujarat state.
Banana Export Facility Center with mechanical handling system has been set up at Saavada in Jalgaon and Basmantnagar in district Hingoli in Maharashtra state.
Geographically, India is better placed compared to South East Asian, Central and South American countries for exports to Gulf countries.
Special training programmes need to be conducted to give knowledge to farmers about production of export quality banana in Maharashtra.
B. Exports
Total export of Banana has increased from 8655 tons in 2002-03 to 11,475 tons during 2006-07. However exports were higher during 2005-06 i.e 14,411 tons. (Table 7.8 & Fig 18)
Table 7.8: Export of banana for last five years
Year Quantity(tons) Value(in Rs. Lakh) 2002-2003 8655 1272.32003-2004 10876 1171.82004-2005 12817 1342.72005-2006 14411 2336.12006-2007 11475 1606.7
Source: APEDA Database, 2006-07
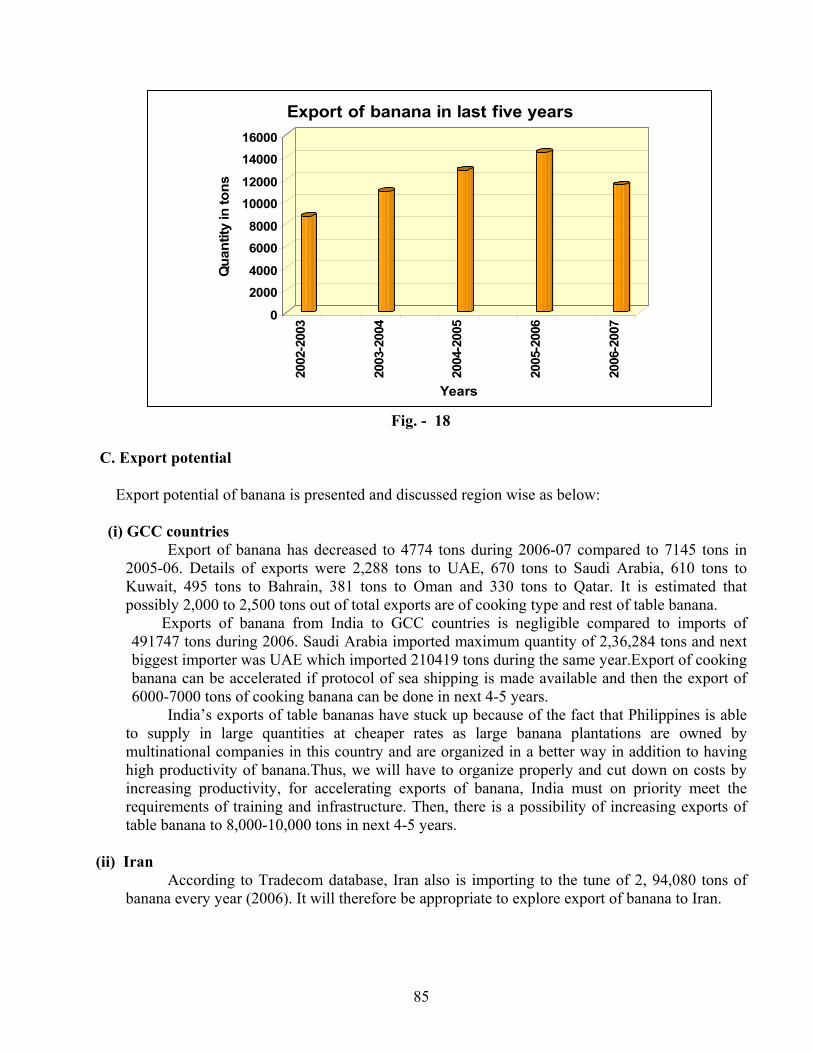
85
0
2000
4000
6000
8000
10000
12000
14000
16000
Qua
ntity
in to
ns
2002
-200
3
2003
-200
4
2004
-200
5
2005
-200
6
2006
-200
7
Years
Export of banana in last five years
Fig. - 18
C. Export potential
Export potential of banana is presented and discussed region wise as below:
(i) GCC countries Export of banana has decreased to 4774 tons during 2006-07 compared to 7145 tons in
2005-06. Details of exports were 2,288 tons to UAE, 670 tons to Saudi Arabia, 610 tons to Kuwait, 495 tons to Bahrain, 381 tons to Oman and 330 tons to Qatar. It is estimated that possibly 2,000 to 2,500 tons out of total exports are of cooking type and rest of table banana.
Exports of banana from India to GCC countries is negligible compared to imports of 491747 tons during 2006. Saudi Arabia imported maximum quantity of 2,36,284 tons and next biggest importer was UAE which imported 210419 tons during the same year.Export of cooking banana can be accelerated if protocol of sea shipping is made available and then the export of 6000-7000 tons of cooking banana can be done in next 4-5 years.
India’s exports of table bananas have stuck up because of the fact that Philippines is able to supply in large quantities at cheaper rates as large banana plantations are owned by multinational companies in this country and are organized in a better way in addition to having high productivity of banana.Thus, we will have to organize properly and cut down on costs by increasing productivity, for accelerating exports of banana, India must on priority meet the requirements of training and infrastructure. Then, there is a possibility of increasing exports of table banana to 8,000-10,000 tons in next 4-5 years.
(ii) Iran
According to Tradecom database, Iran also is importing to the tune of 2, 94,080 tons of banana every year (2006). It will therefore be appropriate to explore export of banana to Iran.
86
(iii) EU countries EU countries imported 7,149,513 tons of banana during 2006. Although India exported
200 tons of banana to EU including Ukraine and Russia, however, there is not much scope as large quantities of banana are exported by countries like Ecuador, Costa Rica and Colombia in Central and South America and Cameroon in Africa. Moreover, EU has special preferential agreement with African, Caribbean and Pacific countries. Other countries exporting to EU have to pay tariff duties and thus are not able to compete with them.
There is some scope of exporting banana to Russia and Ukraine provided we have some preferential arrangement with these countries. There is potential for export of 5-10 thousand tons of banana.
D. Measures for enhancing competitiveness for exports
Countries like Philippines in South East Asia and Ecuador and Costa Rica in Central America are better organized and have large sized banana plantations owned by International companies. Therefore, to enhance competitiveness, following measures need to be taken for making available quality banana of international standard:
Production technology on modern lines needs to be demonstrated to the growers on a massive scale.
Farmers need to be educated about export requirements and international quality standards. Protocol for post harvest handling of Grand Naine, Nendran and Red banana need to be
perfected/ standardized for shipping to Gulf countries by sea. Most modern packhouse facilities need to be created, to begin with in Jalgaon area in
Maharashtra and also in Gujarat. Banana holdings in India are very small and it is not possible to install cable ways for
transporting bunches from field to packhouses to avoid bruises. Under these circumstances, groups of farmers need to be encouraged to have system of make shift packhouses, to cut hands from bunches in the field itself and send these hands to central packhouse for further processing /treatment and packing.
It will be advisable to have some working arrangements for ripening of our banana arrivals in importing countries on a regular basis. In the long run, India need to have its own ripening facilities in one or two countries to begin with.
It is suggested that training to packhouse workers about post harvest handling technology and also about international quality standards must be imparted.
13. Storage
Temperature : 13.3-14.4°C
Relative Humidity : 90-95%
Storage period : 4-6 weeks
87
14. Documents required for exports
a) Documents related to goods
a) Invoice b) Packing List c) Certificate of origin
b) Documents related to shipment
a) Mate Receipt b) Shipping Bill c) Bill of handing d) Airway Bill
c) Documents related to Payment
a) Letter of Credit (L/C) b) Bill of Exchange
d) Documents related to quality of goods
a) Phytosanitary Certificate b) GLOBALGAP Certification c) Health Certificate
e) Organic Certification
- Certificate indicating material produce is based on organic farming.
f) Documents related to Foreign Exchange Regulations GR Form: Documents required by RBI which assures to RBI that the exporter will realize the proceeds of goods within 180 days from the date of Shipment. g) Other Document: Bank Realization Certification (BRC): This is the advice given by Foreign Exchange Bank after the realization of money from Importer
15. Chain of events (from packhouse upto shipment) Receipt at packhouse
Cleaning in chlorine water (tank no. I)
Rinsing in clean water, trimming of crowns, selection of hands and delatexing (tank no. II)
Delatexing continued (tank no. III)
Fungicide and Alum treatment (tank no. IV)
Spraying of hand crowns with fungicide
Grading
Labelling fruits with brand name
Packing and strapping
Marking and labeling the cardboard boxes
Cold store
Loading the container
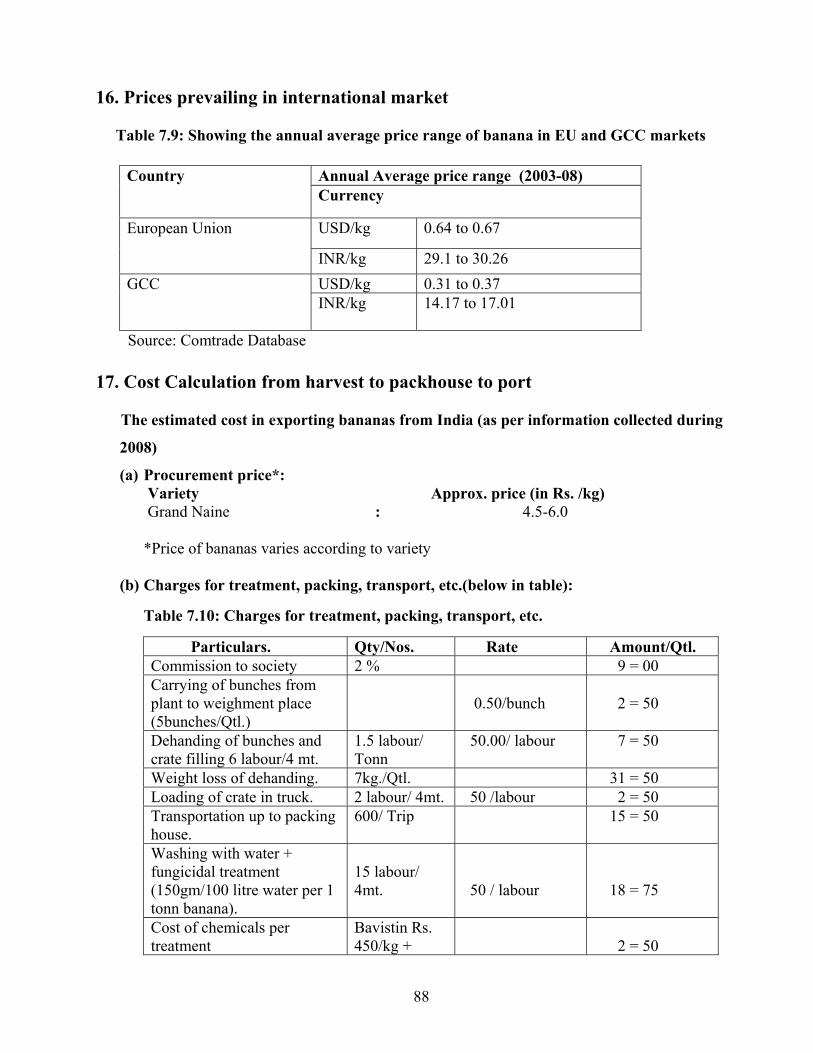
88
16. Prices prevailing in international market Table 7.9: Showing the annual average price range of banana in EU and GCC markets
Annual Average price range (2003-08) Country Currency
USD/kg 0.64 to 0.67 European Union
INR/kg 29.1 to 30.26 USD/kg 0.31 to 0.37 GCC INR/kg 14.17 to 17.01
Source: Comtrade Database 17. Cost Calculation from harvest to packhouse to port
The estimated cost in exporting bananas from India (as per information collected during
2008)
(a) Procurement price*: Variety Approx. price (in Rs. /kg)
Grand Naine : 4.5-6.0
*Price of bananas varies according to variety
(b) Charges for treatment, packing, transport, etc.(below in table): Table 7.10: Charges for treatment, packing, transport, etc.
Particulars. Qty/Nos. Rate Amount/Qtl. Commission to society 2 % 9 = 00 Carrying of bunches from plant to weighment place (5bunches/Qtl.)
0.50/bunch
2 = 50
Dehanding of bunches and crate filling 6 labour/4 mt.
1.5 labour/ Tonn
50.00/ labour 7 = 50
Weight loss of dehanding. 7kg./Qtl. 31 = 50 Loading of crate in truck. 2 labour/ 4mt. 50 /labour 2 = 50 Transportation up to packing house.
600/ Trip 15 = 50
Washing with water + fungicidal treatment (150gm/100 litre water per 1 tonn banana).
15 labour/ 4mt.
50 / labour
18 = 75
Cost of chemicals per treatment
Bavistin Rs. 450/kg +
2 = 50
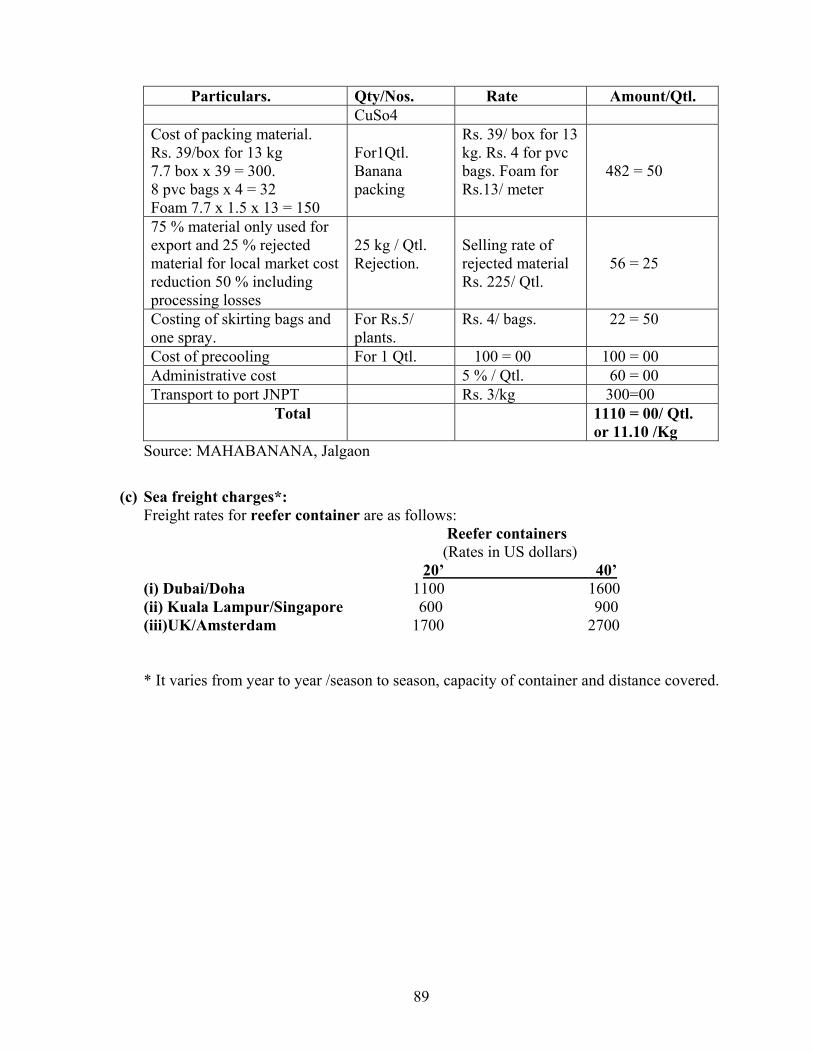
89
Particulars. Qty/Nos. Rate Amount/Qtl. CuSo4
Cost of packing material. Rs. 39/box for 13 kg 7.7 box x 39 = 300. 8 pvc bags x 4 = 32 Foam 7.7 x 1.5 x 13 = 150
For1Qtl. Banana packing
Rs. 39/ box for 13 kg. Rs. 4 for pvc bags. Foam for Rs.13/ meter
482 = 50
75 % material only used for export and 25 % rejected material for local market cost reduction 50 % including processing losses
25 kg / Qtl. Rejection.
Selling rate of rejected material Rs. 225/ Qtl.
56 = 25
Costing of skirting bags and one spray.
For Rs.5/ plants.
Rs. 4/ bags. 22 = 50
Cost of precooling For 1 Qtl. 100 = 00 100 = 00 Administrative cost 5 % / Qtl. 60 = 00 Transport to port JNPT Rs. 3/kg 300=00 Total 1110 = 00/ Qtl.
or 11.10 /Kg Source: MAHABANANA, Jalgaon
(c) Sea freight charges*: Freight rates for reefer container are as follows:
Reefer containers (Rates in US dollars) 20’ 40’
(i) Dubai/Doha 1100 1600 (ii) Kuala Lampur/Singapore 600 900 (iii)UK/Amsterdam 1700 2700
* It varies from year to year /season to season, capacity of container and distance covered.
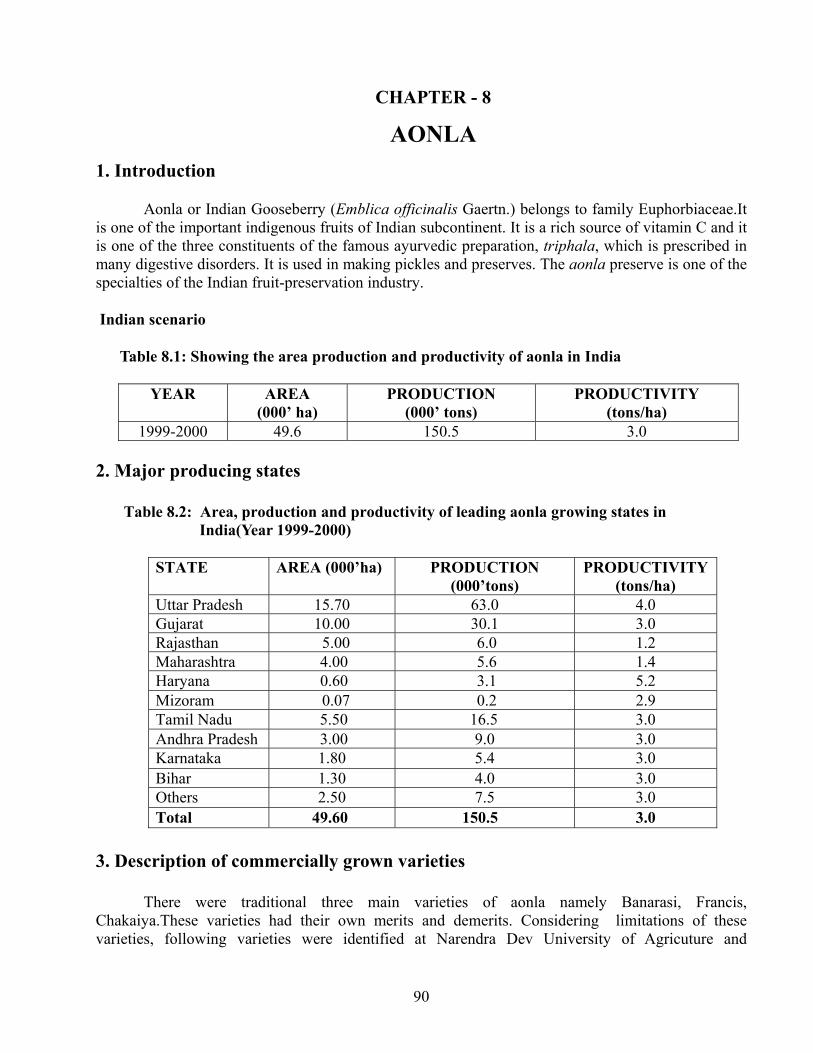
90
CHAPTER - 8
AONLA
1. Introduction
Aonla or Indian Gooseberry (Emblica officinalis Gaertn.) belongs to family Euphorbiaceae.It is one of the important indigenous fruits of Indian subcontinent. It is a rich source of vitamin C and it is one of the three constituents of the famous ayurvedic preparation, triphala, which is prescribed in many digestive disorders. It is used in making pickles and preserves. The aonla preserve is one of the specialties of the Indian fruit-preservation industry.
Indian scenario
Table 8.1: Showing the area production and productivity of aonla in India
YEAR AREA (000’ ha)
PRODUCTION (000’ tons)
PRODUCTIVITY (tons/ha)
1999-2000 49.6 150.5 3.0 2. Major producing states Table 8.2: Area, production and productivity of leading aonla growing states in India(Year 1999-2000)
STATE AREA (000’ha) PRODUCTION
(000’tons) PRODUCTIVITY
(tons/ha) Uttar Pradesh 15.70 63.0 4.0 Gujarat 10.00 30.1 3.0 Rajasthan 5.00 6.0 1.2 Maharashtra 4.00 5.6 1.4 Haryana 0.60 3.1 5.2 Mizoram 0.07 0.2 2.9 Tamil Nadu 5.50 16.5 3.0 Andhra Pradesh 3.00 9.0 3.0 Karnataka 1.80 5.4 3.0 Bihar 1.30 4.0 3.0 Others 2.50 7.5 3.0 Total 49.60 150.5 3.0
3. Description of commercially grown varieties
There were traditional three main varieties of aonla namely Banarasi, Francis, Chakaiya.These varieties had their own merits and demerits. Considering limitations of these varieties, following varieties were identified at Narendra Dev University of Agricuture and
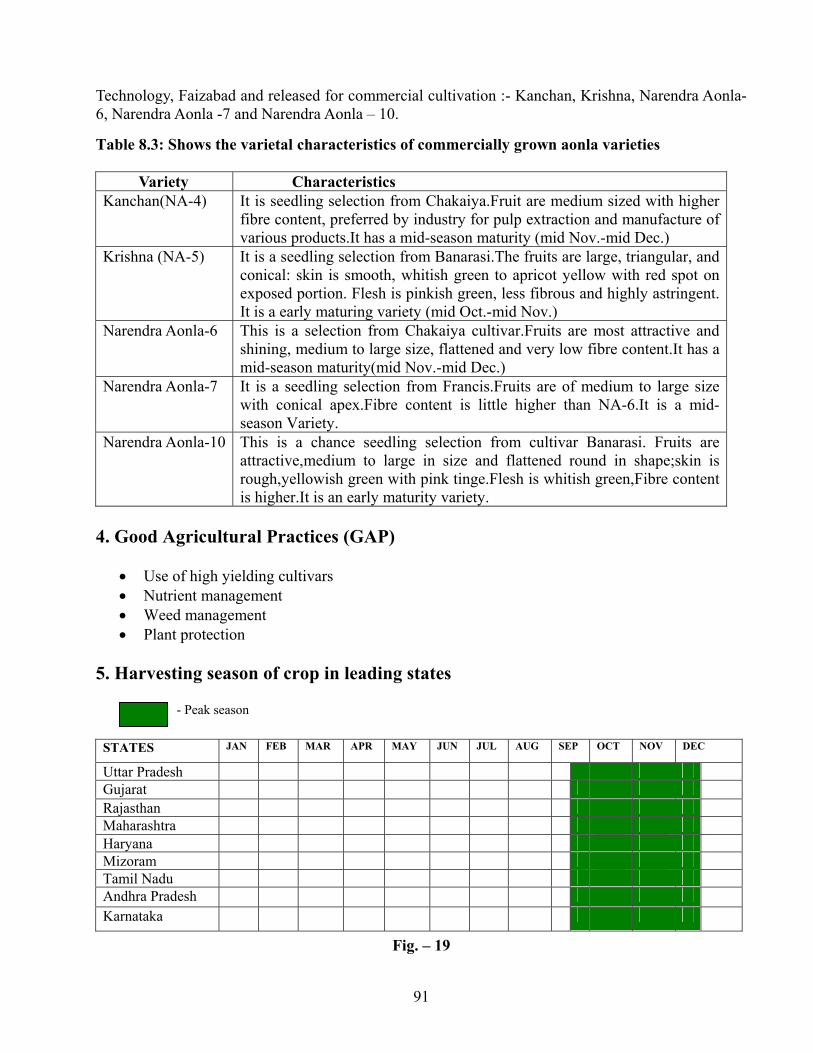
91
Technology, Faizabad and released for commercial cultivation :- Kanchan, Krishna, Narendra Aonla-6, Narendra Aonla -7 and Narendra Aonla – 10. Table 8.3: Shows the varietal characteristics of commercially grown aonla varieties Variety Characteristics Kanchan(NA-4) It is seedling selection from Chakaiya.Fruit are medium sized with higher
fibre content, preferred by industry for pulp extraction and manufacture of various products.It has a mid-season maturity (mid Nov.-mid Dec.)
Krishna (NA-5) It is a seedling selection from Banarasi.The fruits are large, triangular, and conical: skin is smooth, whitish green to apricot yellow with red spot on exposed portion. Flesh is pinkish green, less fibrous and highly astringent. It is a early maturing variety (mid Oct.-mid Nov.)
Narendra Aonla-6 This is a selection from Chakaiya cultivar.Fruits are most attractive and shining, medium to large size, flattened and very low fibre content.It has a mid-season maturity(mid Nov.-mid Dec.)
Narendra Aonla-7 It is a seedling selection from Francis.Fruits are of medium to large size with conical apex.Fibre content is little higher than NA-6.It is a mid-season Variety.
Narendra Aonla-10 This is a chance seedling selection from cultivar Banarasi. Fruits are attractive,medium to large in size and flattened round in shape;skin is rough,yellowish green with pink tinge.Flesh is whitish green,Fibre content is higher.It is an early maturity variety.
4. Good Agricultural Practices (GAP)
• Use of high yielding cultivars • Nutrient management • Weed management • Plant protection
5. Harvesting season of crop in leading states
- Peak season
Fig. – 19
STATES JAN FEB MAR APR MAY JUN JUL AUG SEP OCT NOV DEC
Uttar Pradesh Gujarat Rajasthan Maharashtra Haryana Mizoram Tamil Nadu Andhra Pradesh Karnataka
92
*The above graph shows harvest pattern in leading aonla growing states
6. Arrival pattern in the market Fruits of Aonla mostly available in the market middle of September to middle of December.
7 Concentrated pockets
Table 8.4: Shows concentrated pockets of aonla in aonla growing states State Districts
Uttar Pradesh Pratapgarh,Raebarielly,Varanasi,Banda,Jaunpur,Sultanpur,Kanpur,,Agra,Mathura,Etawah, Fatehpur,Jhansi.
Gujarat Surenhanagar,Bhavnagar,Jamnagar,Bhuj,Savarkantha. Rajasthan Jaipur,Alwar. Maharashtra Ahmednagar,Solapur,Satara,Nashik. Haryana Reware,Gurgaon. Tamil Nadu Dharmapuri Andhra Pradesh Anantpur. Karnataka Bijapur,Belgaum,Bagalkot
8. Exports and export potential A. Domestic strengths for exporting aonla
Domestic strengths for exporting aonla are given below:
• India is a largest producer of Aonla in the world. • Popularly known as Indian gooseberry, is the richest source of vitamin C. • It can be cultivated in waste land and salt affected lands • It is known for its medicinal values for scurvy, diabetes, cold, cough, etc. • A number of superior varieties have been bred of Aonla and their area under cultivation
has increased over the years. B. Export potential
• Although, exact figures of export of Aonla as a whole fruit in dried form or its flakes are not available, but it has great potential for exports as it is used in both pharmaceutical and cosmetics. Aonla is also used in tanning industry.
• Aggressive campaign about its useful properties can only initiate export of Aonla in fresh form. Export of dried flakes of Aonla can be accelerated with the help of bringing awareness in foreign countries about its therepeutical uses.
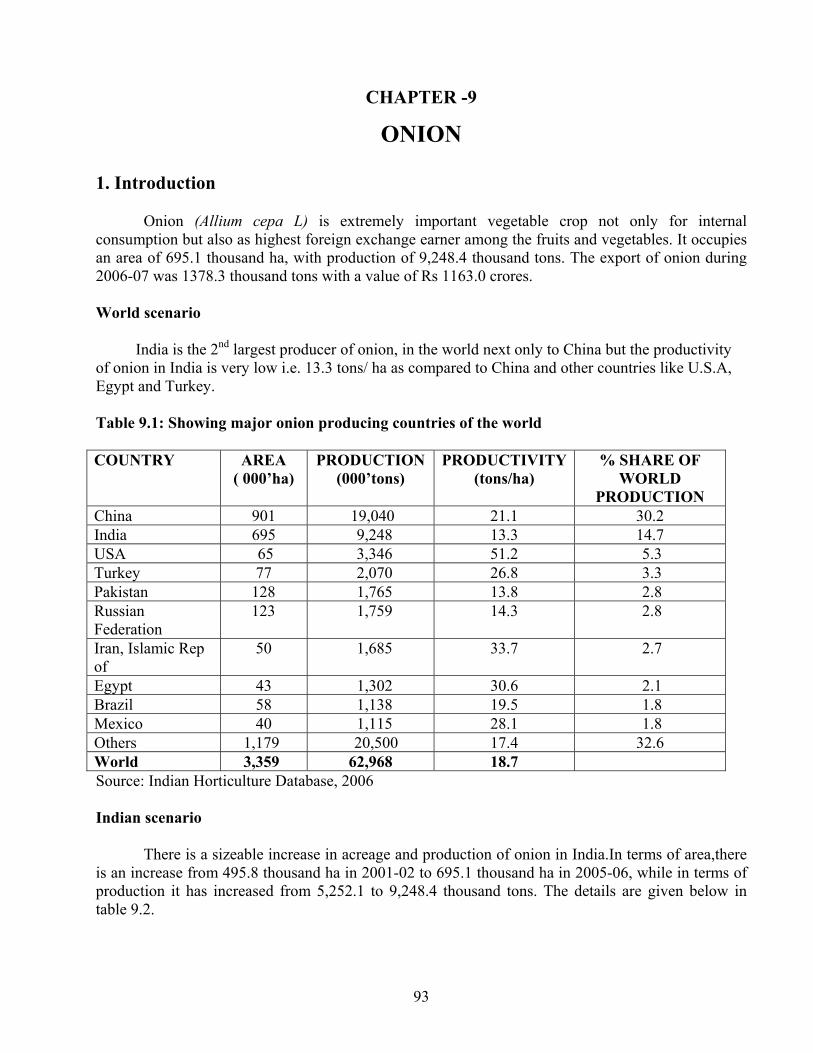
93
CHAPTER -9
ONION
1. Introduction
Onion (Allium cepa L) is extremely important vegetable crop not only for internal consumption but also as highest foreign exchange earner among the fruits and vegetables. It occupies an area of 695.1 thousand ha, with production of 9,248.4 thousand tons. The export of onion during 2006-07 was 1378.3 thousand tons with a value of Rs 1163.0 crores. World scenario India is the 2nd largest producer of onion, in the world next only to China but the productivity of onion in India is very low i.e. 13.3 tons/ ha as compared to China and other countries like U.S.A, Egypt and Turkey. Table 9.1: Showing major onion producing countries of the world COUNTRY AREA
( 000’ha) PRODUCTION
(000’tons) PRODUCTIVITY
(tons/ha) % SHARE OF
WORLD PRODUCTION
China 901 19,040 21.1 30.2 India 695 9,248 13.3 14.7 USA 65 3,346 51.2 5.3 Turkey 77 2,070 26.8 3.3 Pakistan 128 1,765 13.8 2.8 Russian Federation
123 1,759 14.3 2.8
Iran, Islamic Rep of
50 1,685 33.7 2.7
Egypt 43 1,302 30.6 2.1 Brazil 58 1,138 19.5 1.8 Mexico 40 1,115 28.1 1.8 Others 1,179 20,500 17.4 32.6 World 3,359 62,968 18.7 Source: Indian Horticulture Database, 2006 Indian scenario
There is a sizeable increase in acreage and production of onion in India.In terms of area,there is an increase from 495.8 thousand ha in 2001-02 to 695.1 thousand ha in 2005-06, while in terms of production it has increased from 5,252.1 to 9,248.4 thousand tons. The details are given below in table 9.2.
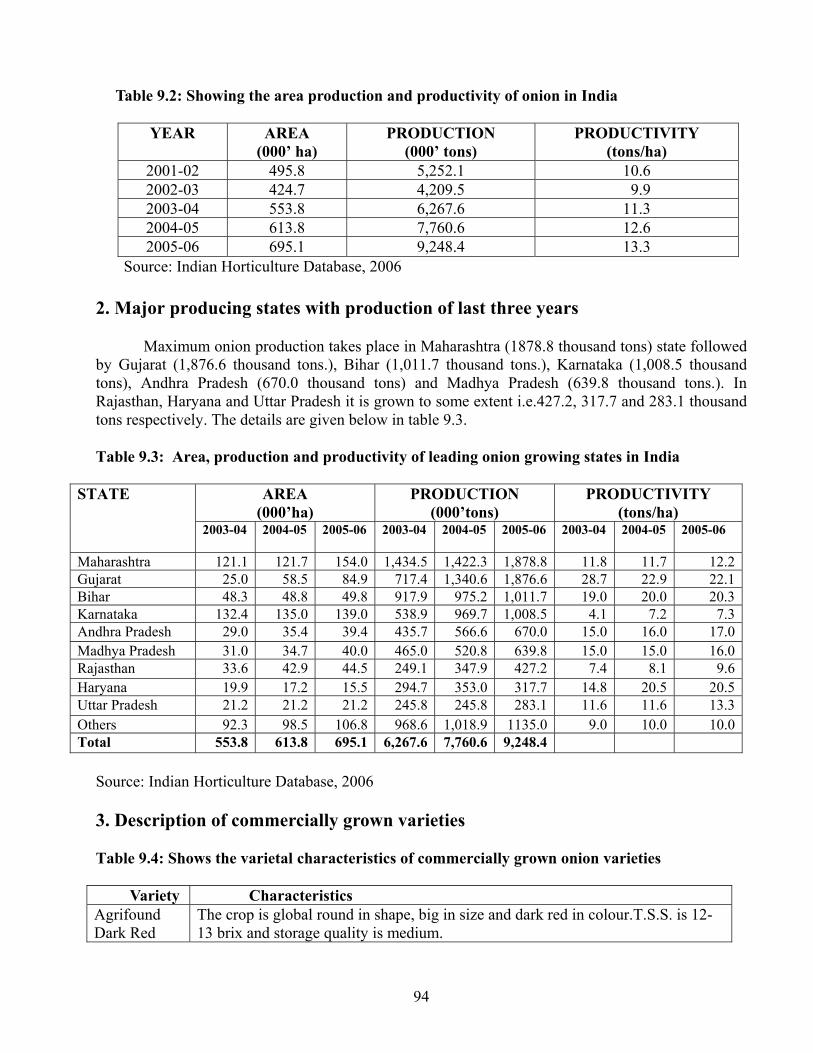
94
Table 9.2: Showing the area production and productivity of onion in India
YEAR AREA (000’ ha)
PRODUCTION (000’ tons)
PRODUCTIVITY (tons/ha)
2001-02 495.8 5,252.1 10.6 2002-03 424.7 4,209.5 9.9 2003-04 553.8 6,267.6 11.3 2004-05 613.8 7,760.6 12.6 2005-06 695.1 9,248.4 13.3
Source: Indian Horticulture Database, 2006 2. Major producing states with production of last three years
Maximum onion production takes place in Maharashtra (1878.8 thousand tons) state followed by Gujarat (1,876.6 thousand tons.), Bihar (1,011.7 thousand tons.), Karnataka (1,008.5 thousand tons), Andhra Pradesh (670.0 thousand tons) and Madhya Pradesh (639.8 thousand tons.). In Rajasthan, Haryana and Uttar Pradesh it is grown to some extent i.e.427.2, 317.7 and 283.1 thousand tons respectively. The details are given below in table 9.3.
Table 9.3: Area, production and productivity of leading onion growing states in India
AREA (000’ha)
PRODUCTION (000’tons)
PRODUCTIVITY (tons/ha)
STATE
2003-04
2004-05 2005-06 2003-04 2004-05 2005-06 2003-04 2004-05 2005-06
Maharashtra 121.1 121.7 154.0 1,434.5 1,422.3 1,878.8 11.8 11.7 12.2Gujarat 25.0 58.5 84.9 717.4 1,340.6 1,876.6 28.7 22.9 22.1Bihar 48.3 48.8 49.8 917.9 975.2 1,011.7 19.0 20.0 20.3Karnataka 132.4 135.0 139.0 538.9 969.7 1,008.5 4.1 7.2 7.3Andhra Pradesh 29.0 35.4 39.4 435.7 566.6 670.0 15.0 16.0 17.0Madhya Pradesh 31.0 34.7 40.0 465.0 520.8 639.8 15.0 15.0 16.0Rajasthan 33.6 42.9 44.5 249.1 347.9 427.2 7.4 8.1 9.6Haryana 19.9 17.2 15.5 294.7 353.0 317.7 14.8 20.5 20.5Uttar Pradesh 21.2 21.2 21.2 245.8 245.8 283.1 11.6 11.6 13.3Others 92.3 98.5 106.8 968.6 1,018.9 1135.0 9.0 10.0 10.0Total 553.8 613.8 695.1 6,267.6 7,760.6 9,248.4
Source: Indian Horticulture Database, 2006
3. Description of commercially grown varieties Table 9.4: Shows the varietal characteristics of commercially grown onion varieties Variety Characteristics Agrifound Dark Red
The crop is global round in shape, big in size and dark red in colour.T.S.S. is 12-13 brix and storage quality is medium.
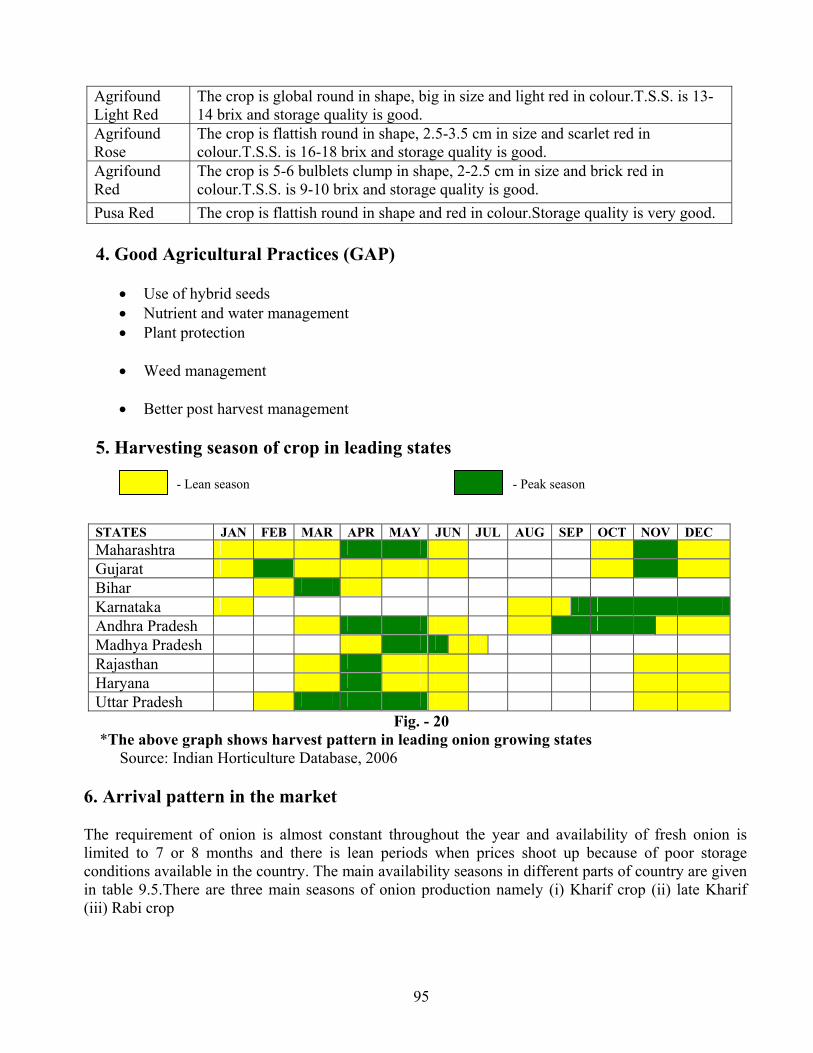
95
Agrifound Light Red
The crop is global round in shape, big in size and light red in colour.T.S.S. is 13-14 brix and storage quality is good.
Agrifound Rose
The crop is flattish round in shape, 2.5-3.5 cm in size and scarlet red in colour.T.S.S. is 16-18 brix and storage quality is good.
Agrifound Red
The crop is 5-6 bulblets clump in shape, 2-2.5 cm in size and brick red in colour.T.S.S. is 9-10 brix and storage quality is good.
Pusa Red The crop is flattish round in shape and red in colour.Storage quality is very good.
4. Good Agricultural Practices (GAP)
• Use of hybrid seeds • Nutrient and water management • Plant protection
• Weed management
• Better post harvest management
5. Harvesting season of crop in leading states
- Lean season - Peak season
Fig. - 20 *The above graph shows harvest pattern in leading onion growing states Source: Indian Horticulture Database, 2006
6. Arrival pattern in the market The requirement of onion is almost constant throughout the year and availability of fresh onion is limited to 7 or 8 months and there is lean periods when prices shoot up because of poor storage conditions available in the country. The main availability seasons in different parts of country are given in table 9.5.There are three main seasons of onion production namely (i) Kharif crop (ii) late Kharif (iii) Rabi crop
STATES JAN FEB MAR APR MAY JUN JUL AUG SEP OCT NOV DEC Maharashtra Gujarat Bihar Karnataka Andhra Pradesh Madhya Pradesh Rajasthan Haryana Uttar Pradesh
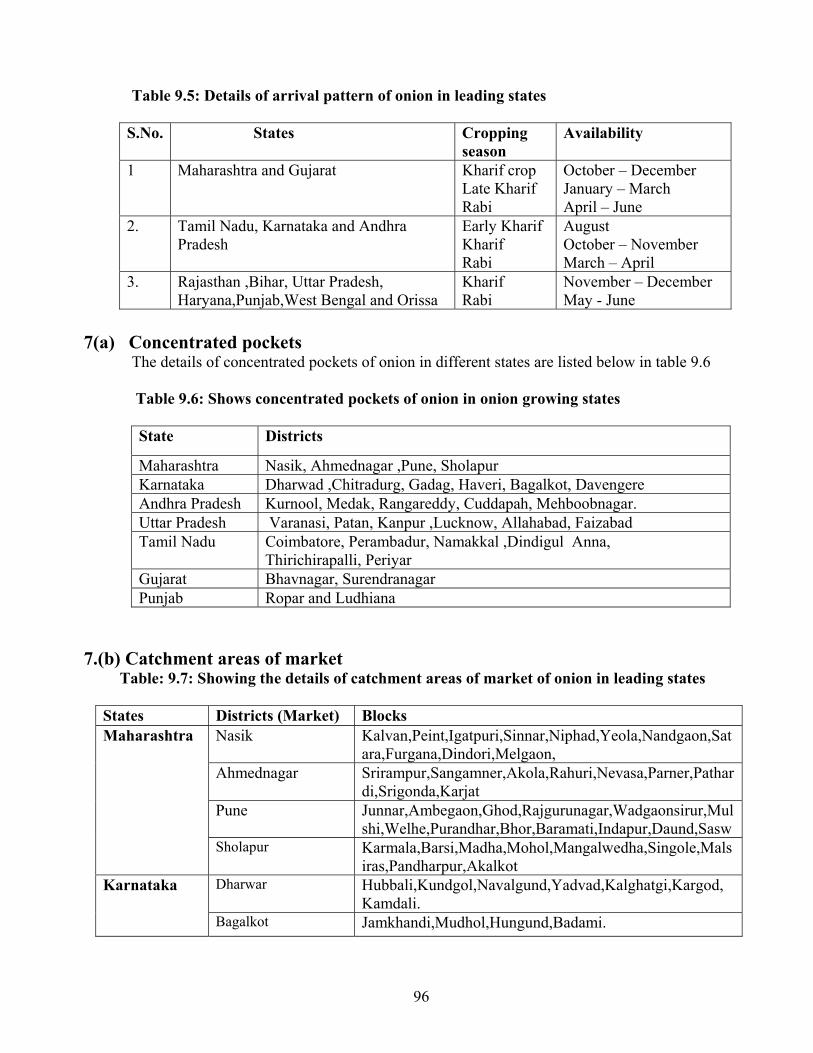
96
Table 9.5: Details of arrival pattern of onion in leading states
S.No. States Cropping season
Availability
1 Maharashtra and Gujarat Kharif crop Late Kharif Rabi
October – December January – March April – June
2. Tamil Nadu, Karnataka and Andhra Pradesh
Early Kharif Kharif Rabi
August October – November March – April
3. Rajasthan ,Bihar, Uttar Pradesh, Haryana,Punjab,West Bengal and Orissa
Kharif Rabi
November – December May - June
7(a) Concentrated pockets
The details of concentrated pockets of onion in different states are listed below in table 9.6 Table 9.6: Shows concentrated pockets of onion in onion growing states
State Districts
Maharashtra Nasik, Ahmednagar ,Pune, Sholapur Karnataka Dharwad ,Chitradurg, Gadag, Haveri, Bagalkot, Davengere Andhra Pradesh Kurnool, Medak, Rangareddy, Cuddapah, Mehboobnagar. Uttar Pradesh Varanasi, Patan, Kanpur ,Lucknow, Allahabad, Faizabad Tamil Nadu Coimbatore, Perambadur, Namakkal ,Dindigul Anna,
Thirichirapalli, Periyar Gujarat Bhavnagar, Surendranagar Punjab Ropar and Ludhiana
7.(b) Catchment areas of market Table: 9.7: Showing the details of catchment areas of market of onion in leading states
States Districts (Market) Blocks
Nasik Kalvan,Peint,Igatpuri,Sinnar,Niphad,Yeola,Nandgaon,Satara,Furgana,Dindori,Melgaon,
Ahmednagar Srirampur,Sangamner,Akola,Rahuri,Nevasa,Parner,Pathardi,Srigonda,Karjat
Pune Junnar,Ambegaon,Ghod,Rajgurunagar,Wadgaonsirur,Mulshi,Welhe,Purandhar,Bhor,Baramati,Indapur,Daund,Sasw
Maharashtra
Sholapur Karmala,Barsi,Madha,Mohol,Mangalwedha,Singole,Malsiras,Pandharpur,Akalkot
Dharwar Hubbali,Kundgol,Navalgund,Yadvad,Kalghatgi,Kargod,Kamdali.
Karnataka
Bagalkot Jamkhandi,Mudhol,Hungund,Badami.
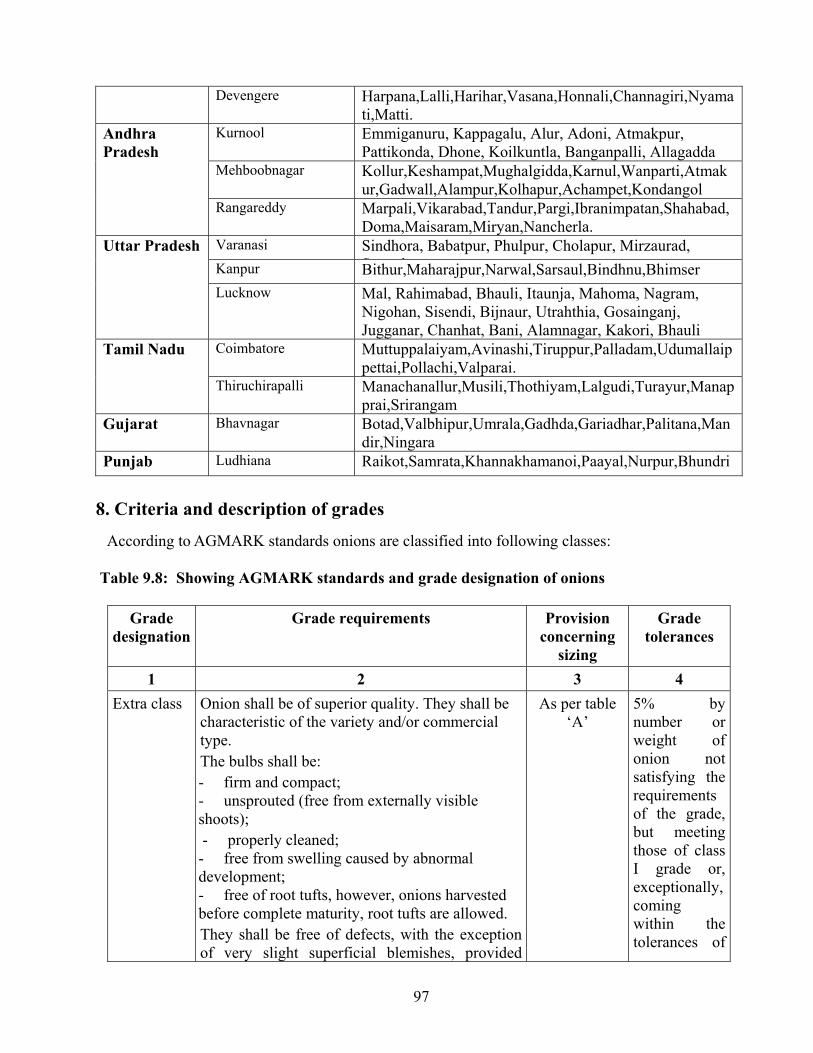
97
Devengere Harpana,Lalli,Harihar,Vasana,Honnali,Channagiri,Nyamati,Matti.
Kurnool Emmiganuru, Kappagalu, Alur, Adoni, Atmakpur, Pattikonda, Dhone, Koilkuntla, Banganpalli, Allagadda
Mehboobnagar Kollur,Keshampat,Mughalgidda,Karnul,Wanparti,Atmakur,Gadwall,Alampur,Kolhapur,Achampet,Kondangol
Andhra Pradesh
Rangareddy Marpali,Vikarabad,Tandur,Pargi,Ibranimpatan,Shahabad,Doma,Maisaram,Miryan,Nancherla.
Varanasi Sindhora, Babatpur, Phulpur, Cholapur, Mirzaurad, S hKanpur Bithur,Maharajpur,Narwal,Sarsaul,Bindhnu,Bhimser
Uttar Pradesh
Lucknow Mal, Rahimabad, Bhauli, Itaunja, Mahoma, Nagram, Nigohan, Sisendi, Bijnaur, Utrahthia, Gosainganj, Jugganar, Chanhat, Bani, Alamnagar, Kakori, Bhauli
Coimbatore Muttuppalaiyam,Avinashi,Tiruppur,Palladam,Udumallaippettai,Pollachi,Valparai.
Tamil Nadu
Thiruchirapalli Manachanallur,Musili,Thothiyam,Lalgudi,Turayur,Manapprai,Srirangam
Gujarat Bhavnagar Botad,Valbhipur,Umrala,Gadhda,Gariadhar,Palitana,Mandir,Ningara
Punjab Ludhiana Raikot,Samrata,Khannakhamanoi,Paayal,Nurpur,Bhundri
8. Criteria and description of grades According to AGMARK standards onions are classified into following classes:
Table 9.8: Showing AGMARK standards and grade designation of onions
Grade designation
Grade requirements Provision concerning
sizing
Grade tolerances
1 2 3 4 Extra class Onion shall be of superior quality. They shall be
characteristic of the variety and/or commercial type. The bulbs shall be: - firm and compact; - unsprouted (free from externally visible shoots); - properly cleaned; - free from swelling caused by abnormal development; - free of root tufts, however, onions harvested before complete maturity, root tufts are allowed. They shall be free of defects, with the exception of very slight superficial blemishes, provided
As per table ‘A’
5% by number or weight of onion not satisfying the requirements of the grade, but meeting those of class I grade or, exceptionally, coming within the tolerances of
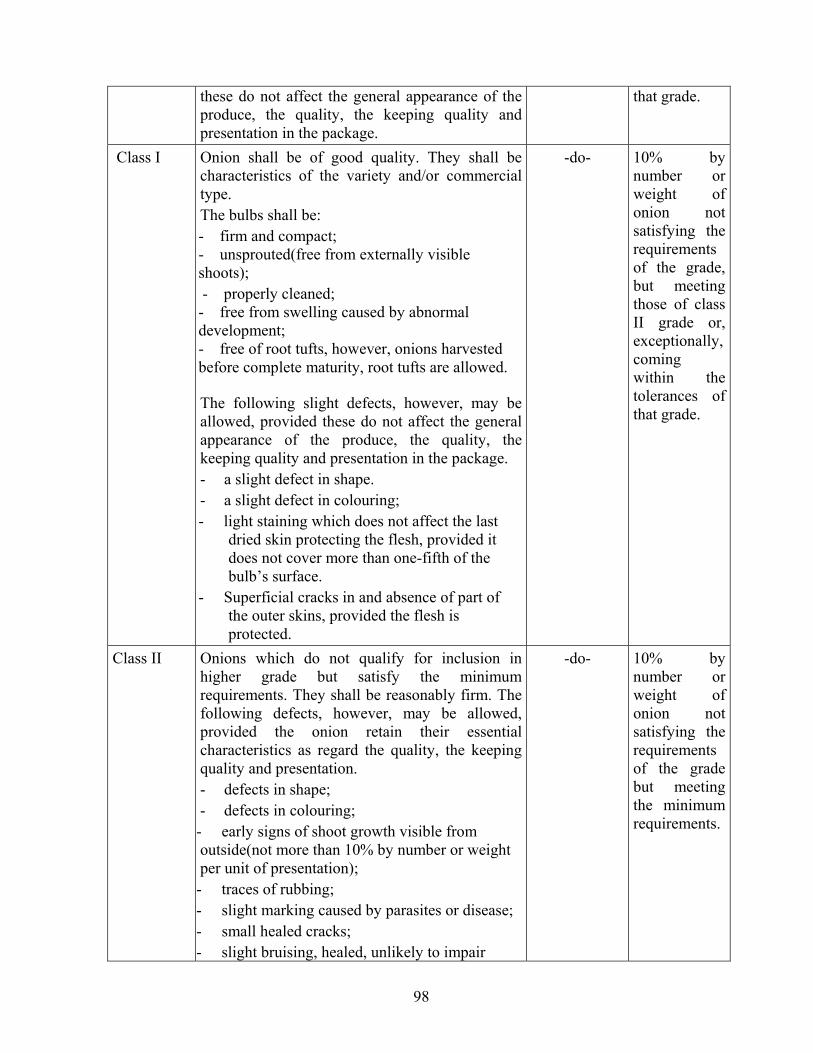
98
these do not affect the general appearance of the produce, the quality, the keeping quality and presentation in the package.
that grade.
Class I Onion shall be of good quality. They shall be characteristics of the variety and/or commercial type. The bulbs shall be: - firm and compact; - unsprouted(free from externally visible shoots); - properly cleaned; - free from swelling caused by abnormal development; - free of root tufts, however, onions harvested before complete maturity, root tufts are allowed.
The following slight defects, however, may be allowed, provided these do not affect the general appearance of the produce, the quality, the keeping quality and presentation in the package. - a slight defect in shape. - a slight defect in colouring; - light staining which does not affect the last
dried skin protecting the flesh, provided it does not cover more than one-fifth of the bulb’s surface.
- Superficial cracks in and absence of part of the outer skins, provided the flesh is protected.
-do- 10% by number or weight of onion not satisfying the requirements of the grade, but meeting those of class II grade or, exceptionally, coming within the tolerances of that grade.
Class II Onions which do not qualify for inclusion in higher grade but satisfy the minimum requirements. They shall be reasonably firm. The following defects, however, may be allowed, provided the onion retain their essential characteristics as regard the quality, the keeping quality and presentation. - defects in shape; - defects in colouring; - early signs of shoot growth visible from outside(not more than 10% by number or weight per unit of presentation); - traces of rubbing; - slight marking caused by parasites or disease; - small healed cracks; - slight bruising, healed, unlikely to impair
-do- 10% by number or weight of onion not satisfying the requirements of the grade but meeting the minimum requirements.
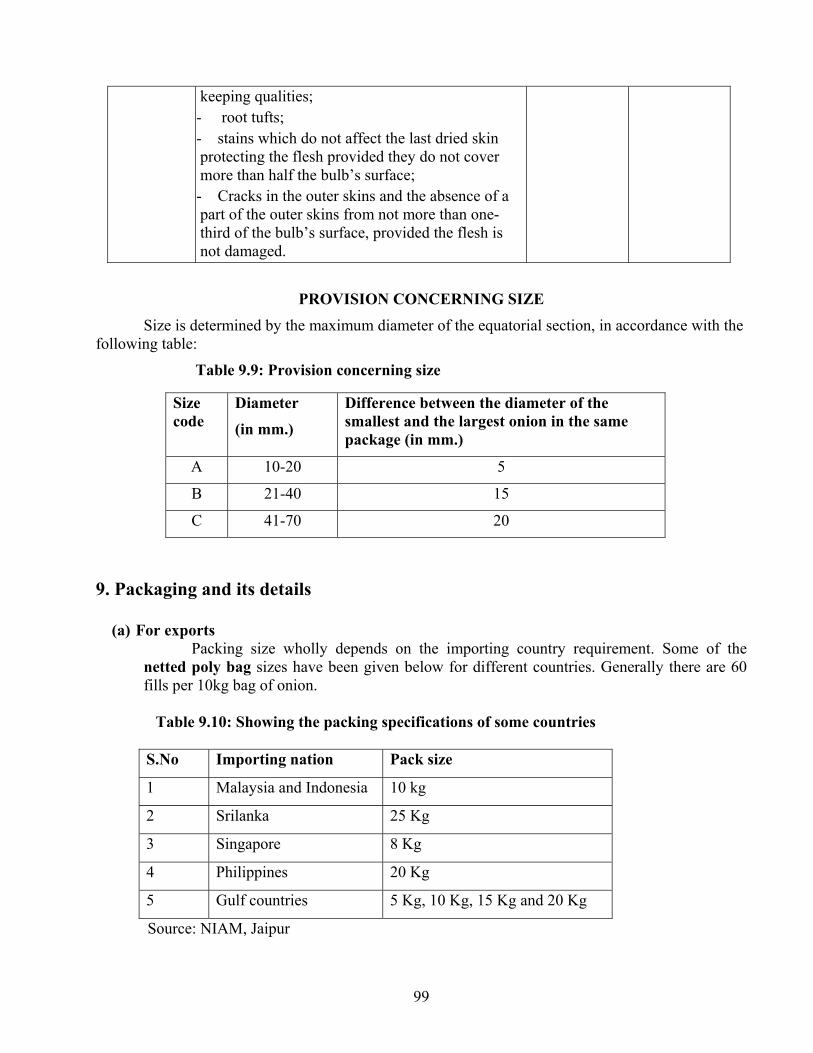
99
keeping qualities; - root tufts; - stains which do not affect the last dried skin protecting the flesh provided they do not cover more than half the bulb’s surface; - Cracks in the outer skins and the absence of a part of the outer skins from not more than one-third of the bulb’s surface, provided the flesh is not damaged.
PROVISION CONCERNING SIZE
Size is determined by the maximum diameter of the equatorial section, in accordance with the following table:
Table 9.9: Provision concerning size
9. Packaging and its details
(a) For exports Packing size wholly depends on the importing country requirement. Some of the
netted poly bag sizes have been given below for different countries. Generally there are 60 fills per 10kg bag of onion.
Table 9.10: Showing the packing specifications of some countries
S.No Importing nation Pack size
1 Malaysia and Indonesia 10 kg
2 Srilanka 25 Kg
3 Singapore 8 Kg
4 Philippines 20 Kg
5 Gulf countries 5 Kg, 10 Kg, 15 Kg and 20 Kg
Source: NIAM, Jaipur
Size code
Diameter
(in mm.)
Difference between the diameter of the smallest and the largest onion in the same package (in mm.)
A 10-20 5
B 21-40 15
C 41-70 20
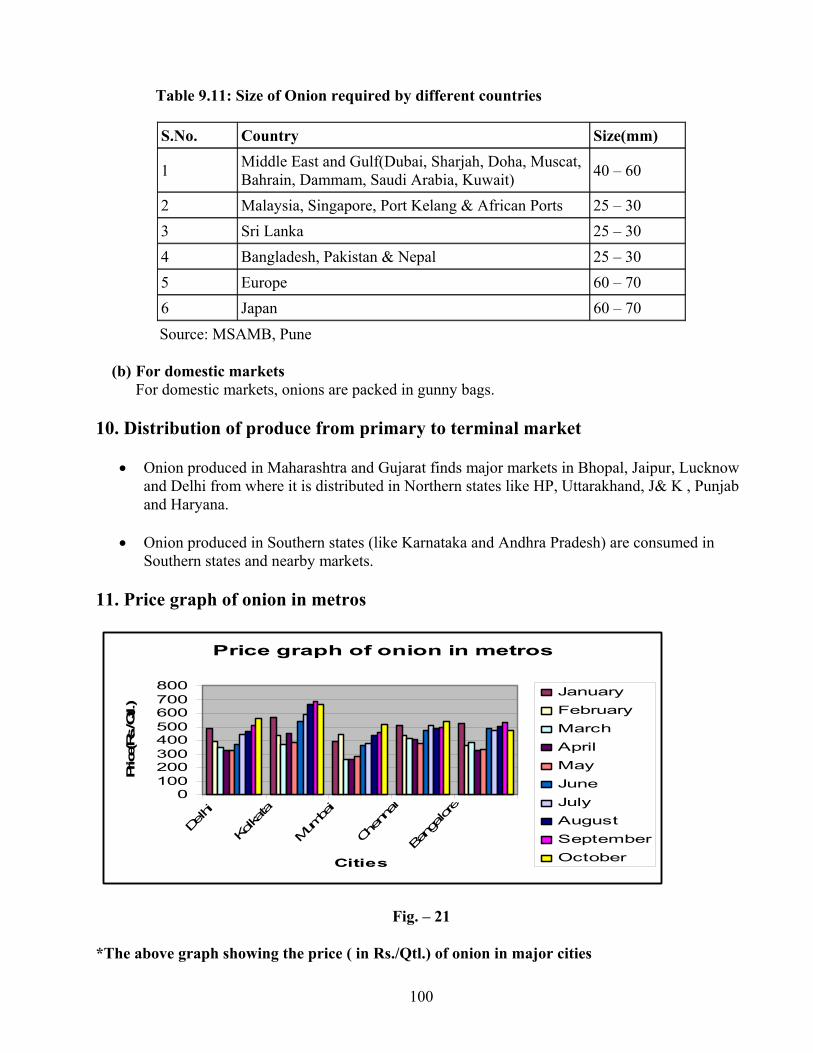
100
Table 9.11: Size of Onion required by different countries
Source: MSAMB, Pune
(b) For domestic markets For domestic markets, onions are packed in gunny bags.
10. Distribution of produce from primary to terminal market
• Onion produced in Maharashtra and Gujarat finds major markets in Bhopal, Jaipur, Lucknow and Delhi from where it is distributed in Northern states like HP, Uttarakhand, J& K , Punjab and Haryana.
• Onion produced in Southern states (like Karnataka and Andhra Pradesh) are consumed in Southern states and nearby markets.
11. Price graph of onion in metros
Price graph of onion in metros
0100200300400500600700800
Delhi
Kolka
ta
Mum
bai
Chenna
i
Bangalore
Cities
Price(Rs
./Qtl.)
JanuaryFebruaryMarchAprilMayJuneJulyAugustSeptemberOctober
Fig. – 21
*The above graph showing the price ( in Rs./Qtl.) of onion in major cities
S.No. Country Size(mm)
1 Middle East and Gulf(Dubai, Sharjah, Doha, Muscat, Bahrain, Dammam, Saudi Arabia, Kuwait) 40 – 60
2 Malaysia, Singapore, Port Kelang & African Ports 25 – 30 3 Sri Lanka 25 – 30 4 Bangladesh, Pakistan & Nepal 25 – 30 5 Europe 60 – 70 6 Japan 60 – 70
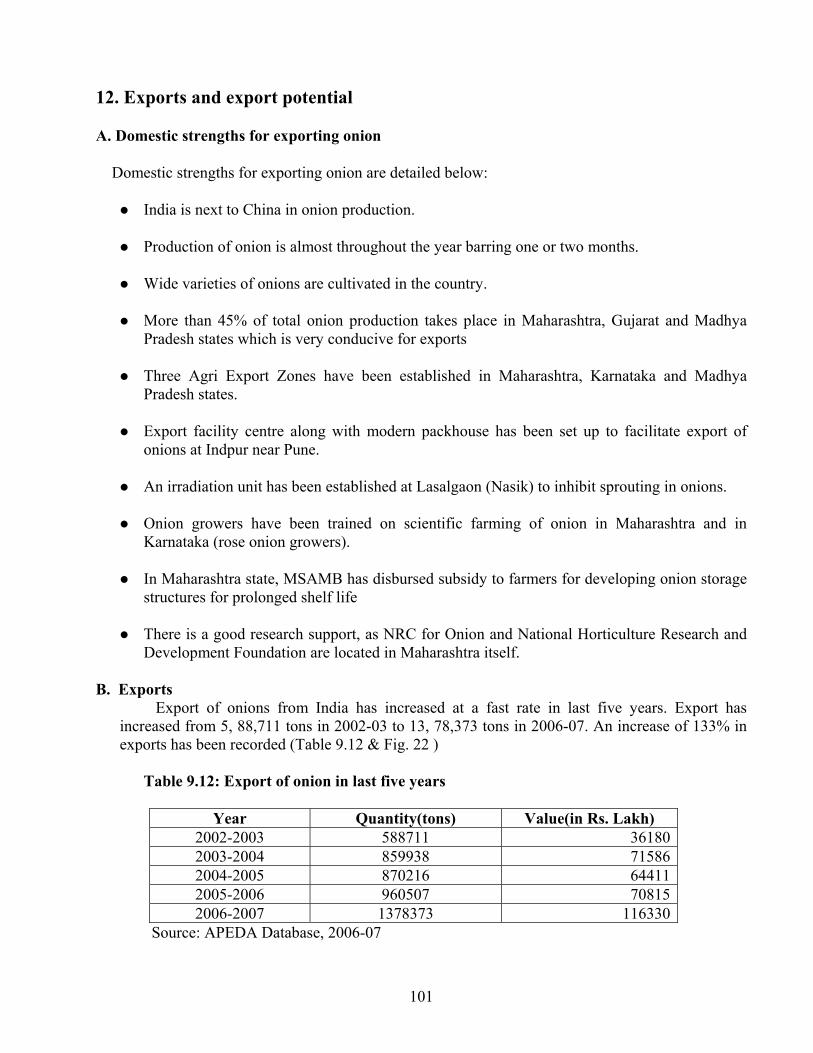
101
12. Exports and export potential
A. Domestic strengths for exporting onion
Domestic strengths for exporting onion are detailed below:
India is next to China in onion production.
Production of onion is almost throughout the year barring one or two months.
Wide varieties of onions are cultivated in the country.
More than 45% of total onion production takes place in Maharashtra, Gujarat and Madhya Pradesh states which is very conducive for exports
Three Agri Export Zones have been established in Maharashtra, Karnataka and Madhya Pradesh states.
Export facility centre along with modern packhouse has been set up to facilitate export of onions at Indpur near Pune.
An irradiation unit has been established at Lasalgaon (Nasik) to inhibit sprouting in onions.
Onion growers have been trained on scientific farming of onion in Maharashtra and in Karnataka (rose onion growers).
In Maharashtra state, MSAMB has disbursed subsidy to farmers for developing onion storage structures for prolonged shelf life
There is a good research support, as NRC for Onion and National Horticulture Research and Development Foundation are located in Maharashtra itself.
B. Exports Export of onions from India has increased at a fast rate in last five years. Export has
increased from 5, 88,711 tons in 2002-03 to 13, 78,373 tons in 2006-07. An increase of 133% in exports has been recorded (Table 9.12 & Fig. 22 ) Table 9.12: Export of onion in last five years
Year Quantity(tons) Value(in Rs. Lakh) 2002-2003 588711 361802003-2004 859938 715862004-2005 870216 644112005-2006 960507 708152006-2007 1378373 116330
Source: APEDA Database, 2006-07
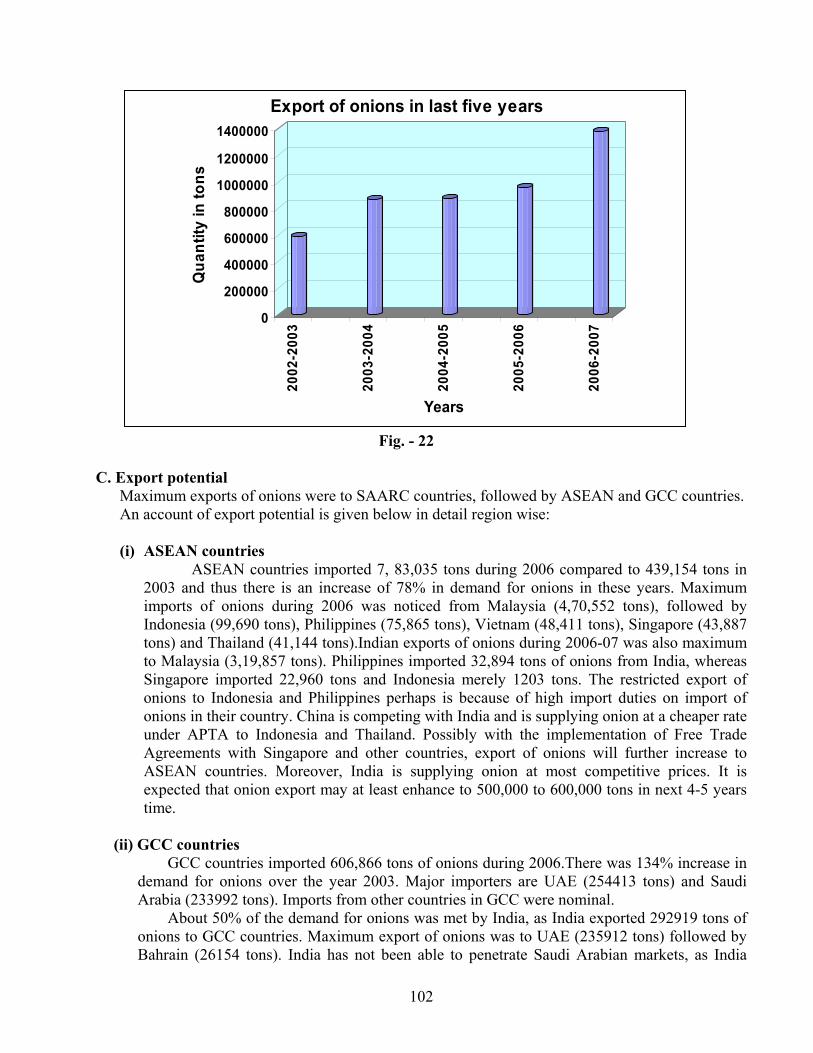
102
0
200000
400000
600000
800000
1000000
1200000
1400000
Qua
ntity
in to
ns
2002
-200
3
2003
-200
4
2004
-200
5
2005
-200
6
2006
-200
7
Years
Export of onions in last five years
Fig. - 22
C. Export potential
Maximum exports of onions were to SAARC countries, followed by ASEAN and GCC countries. An account of export potential is given below in detail region wise:
(i) ASEAN countries
ASEAN countries imported 7, 83,035 tons during 2006 compared to 439,154 tons in 2003 and thus there is an increase of 78% in demand for onions in these years. Maximum imports of onions during 2006 was noticed from Malaysia (4,70,552 tons), followed by Indonesia (99,690 tons), Philippines (75,865 tons), Vietnam (48,411 tons), Singapore (43,887 tons) and Thailand (41,144 tons).Indian exports of onions during 2006-07 was also maximum to Malaysia (3,19,857 tons). Philippines imported 32,894 tons of onions from India, whereas Singapore imported 22,960 tons and Indonesia merely 1203 tons. The restricted export of onions to Indonesia and Philippines perhaps is because of high import duties on import of onions in their country. China is competing with India and is supplying onion at a cheaper rate under APTA to Indonesia and Thailand. Possibly with the implementation of Free Trade Agreements with Singapore and other countries, export of onions will further increase to ASEAN countries. Moreover, India is supplying onion at most competitive prices. It is expected that onion export may at least enhance to 500,000 to 600,000 tons in next 4-5 years time.
(ii) GCC countries
GCC countries imported 606,866 tons of onions during 2006.There was 134% increase in demand for onions over the year 2003. Major importers are UAE (254413 tons) and Saudi Arabia (233992 tons). Imports from other countries in GCC were nominal.
About 50% of the demand for onions was met by India, as India exported 292919 tons of onions to GCC countries. Maximum export of onions was to UAE (235912 tons) followed by Bahrain (26154 tons). India has not been able to penetrate Saudi Arabian markets, as India
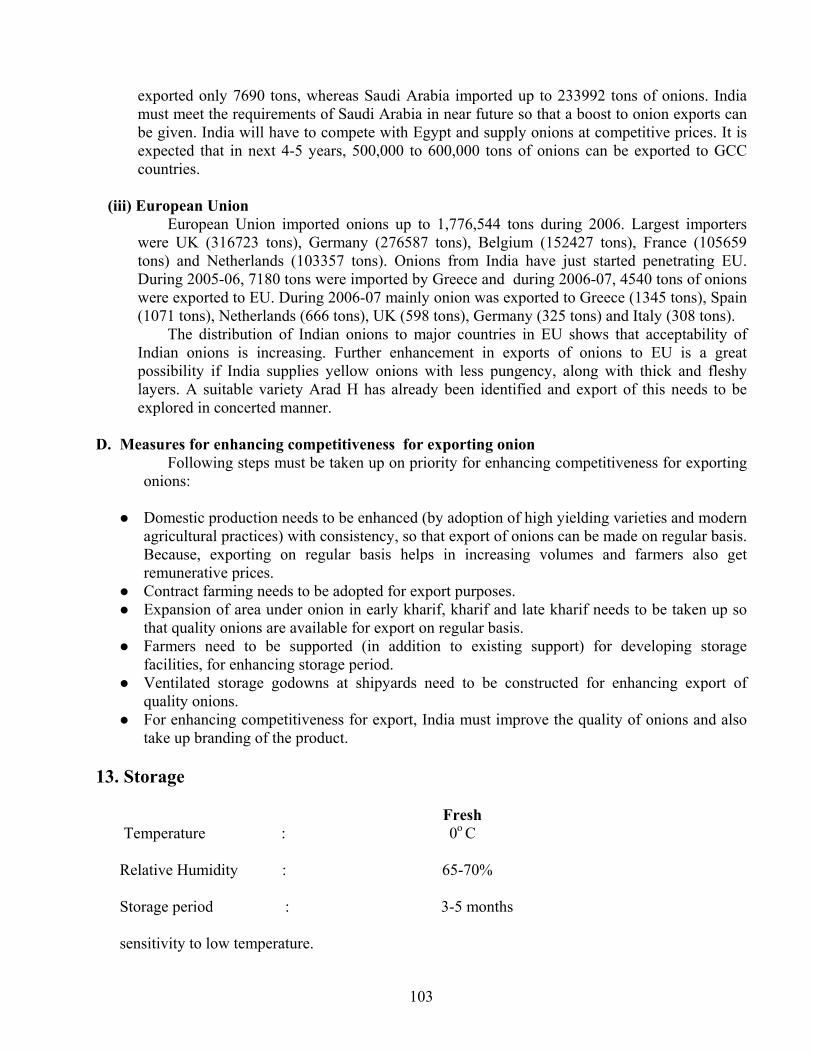
103
exported only 7690 tons, whereas Saudi Arabia imported up to 233992 tons of onions. India must meet the requirements of Saudi Arabia in near future so that a boost to onion exports can be given. India will have to compete with Egypt and supply onions at competitive prices. It is expected that in next 4-5 years, 500,000 to 600,000 tons of onions can be exported to GCC countries.
(iii) European Union
European Union imported onions up to 1,776,544 tons during 2006. Largest importers were UK (316723 tons), Germany (276587 tons), Belgium (152427 tons), France (105659 tons) and Netherlands (103357 tons). Onions from India have just started penetrating EU. During 2005-06, 7180 tons were imported by Greece and during 2006-07, 4540 tons of onions were exported to EU. During 2006-07 mainly onion was exported to Greece (1345 tons), Spain (1071 tons), Netherlands (666 tons), UK (598 tons), Germany (325 tons) and Italy (308 tons).
The distribution of Indian onions to major countries in EU shows that acceptability of Indian onions is increasing. Further enhancement in exports of onions to EU is a great possibility if India supplies yellow onions with less pungency, along with thick and fleshy layers. A suitable variety Arad H has already been identified and export of this needs to be explored in concerted manner.
D. Measures for enhancing competitiveness for exporting onion
Following steps must be taken up on priority for enhancing competitiveness for exporting onions:
Domestic production needs to be enhanced (by adoption of high yielding varieties and modern agricultural practices) with consistency, so that export of onions can be made on regular basis. Because, exporting on regular basis helps in increasing volumes and farmers also get remunerative prices.
Contract farming needs to be adopted for export purposes. Expansion of area under onion in early kharif, kharif and late kharif needs to be taken up so
that quality onions are available for export on regular basis. Farmers need to be supported (in addition to existing support) for developing storage
facilities, for enhancing storage period. Ventilated storage godowns at shipyards need to be constructed for enhancing export of
quality onions. For enhancing competitiveness for export, India must improve the quality of onions and also
take up branding of the product.
13. Storage
Fresh Temperature : 0o C Relative Humidity : 65-70% Storage period : 3-5 months
sensitivity to low temperature.
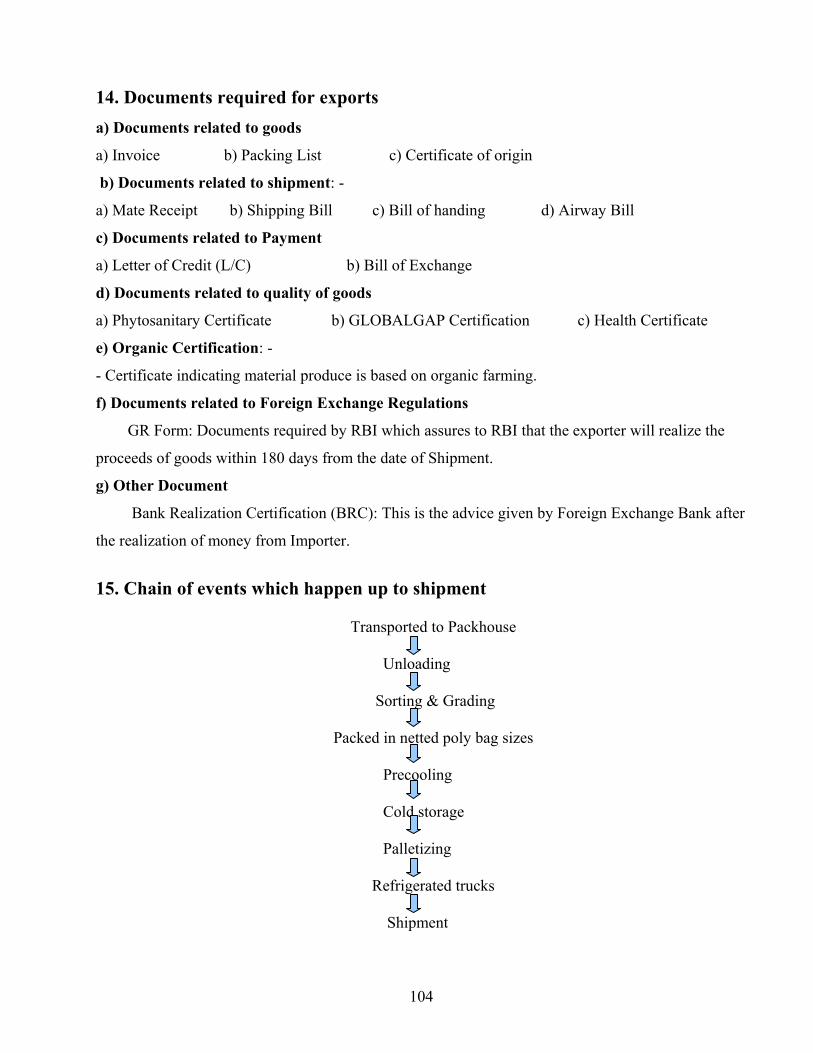
104
14. Documents required for exports
a) Documents related to goods
a) Invoice b) Packing List c) Certificate of origin
b) Documents related to shipment: -
a) Mate Receipt b) Shipping Bill c) Bill of handing d) Airway Bill
c) Documents related to Payment
a) Letter of Credit (L/C) b) Bill of Exchange
d) Documents related to quality of goods
a) Phytosanitary Certificate b) GLOBALGAP Certification c) Health Certificate
e) Organic Certification: -
- Certificate indicating material produce is based on organic farming.
f) Documents related to Foreign Exchange Regulations
GR Form: Documents required by RBI which assures to RBI that the exporter will realize the
proceeds of goods within 180 days from the date of Shipment.
g) Other Document
Bank Realization Certification (BRC): This is the advice given by Foreign Exchange Bank after
the realization of money from Importer.
15. Chain of events which happen up to shipment
Transported to Packhouse
Unloading
Sorting & Grading
Packed in netted poly bag sizes
Precooling
Cold storage
Palletizing
Refrigerated trucks
Shipment
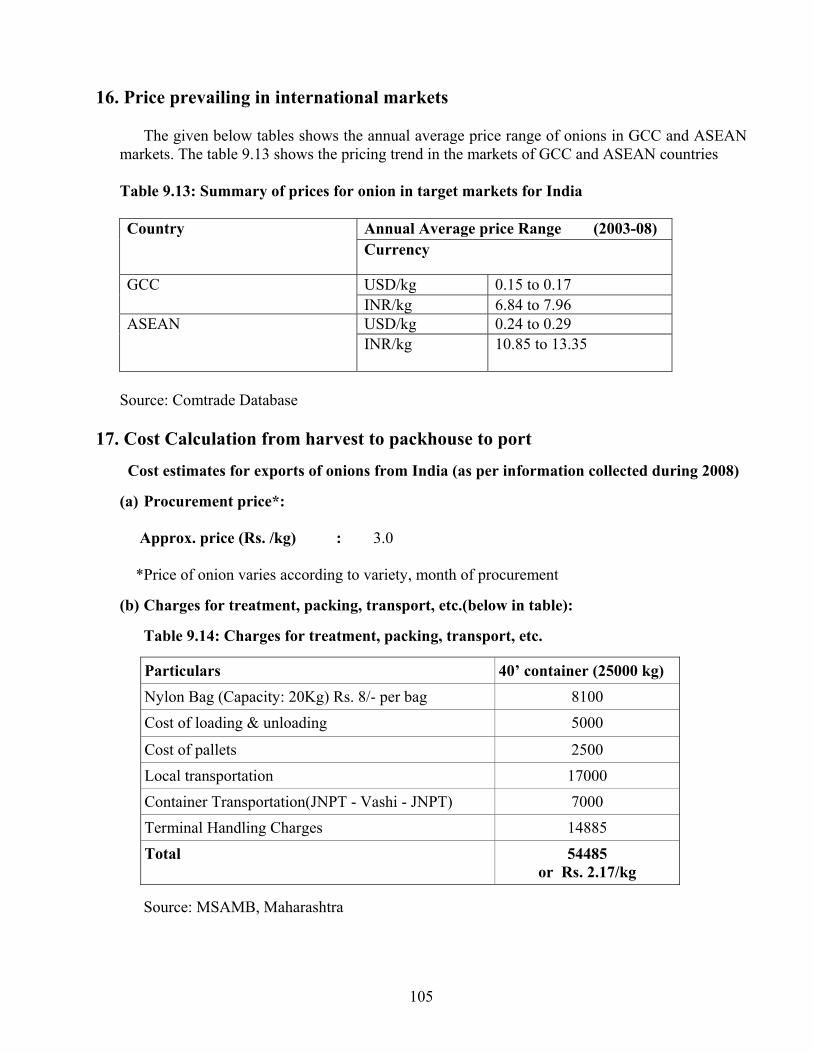
105
16. Price prevailing in international markets
The given below tables shows the annual average price range of onions in GCC and ASEAN markets. The table 9.13 shows the pricing trend in the markets of GCC and ASEAN countries
Table 9.13: Summary of prices for onion in target markets for India
Annual Average price Range (2003-08) Country Currency
USD/kg 0.15 to 0.17 GCC INR/kg 6.84 to 7.96 USD/kg 0.24 to 0.29 ASEAN INR/kg 10.85 to 13.35
Source: Comtrade Database
17. Cost Calculation from harvest to packhouse to port Cost estimates for exports of onions from India (as per information collected during 2008)
(a) Procurement price*: Approx. price (Rs. /kg) : 3.0 *Price of onion varies according to variety, month of procurement (b) Charges for treatment, packing, transport, etc.(below in table):
Table 9.14: Charges for treatment, packing, transport, etc.
Particulars 40’ container (25000 kg) Nylon Bag (Capacity: 20Kg) Rs. 8/- per bag 8100 Cost of loading & unloading 5000
Cost of pallets 2500 Local transportation 17000 Container Transportation(JNPT - Vashi - JNPT) 7000 Terminal Handling Charges 14885 Total 54485
or Rs. 2.17/kg
Source: MSAMB, Maharashtra
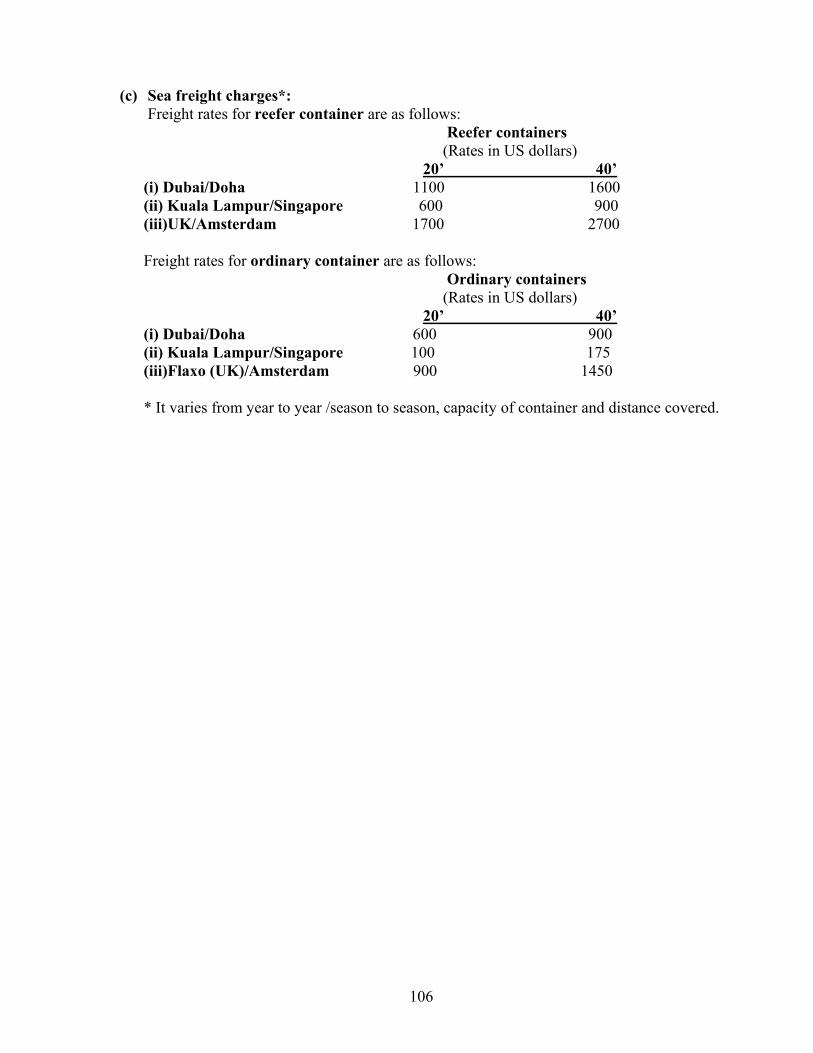
106
(c) Sea freight charges*: Freight rates for reefer container are as follows:
Reefer containers (Rates in US dollars) 20’ 40’
(i) Dubai/Doha 1100 1600 (ii) Kuala Lampur/Singapore 600 900 (iii)UK/Amsterdam 1700 2700 Freight rates for ordinary container are as follows:
Ordinary containers (Rates in US dollars) 20’ 40’
(i) Dubai/Doha 600 900 (ii) Kuala Lampur/Singapore 100 175 (iii)Flaxo (UK)/Amsterdam 900 1450
* It varies from year to year /season to season, capacity of container and distance covered.
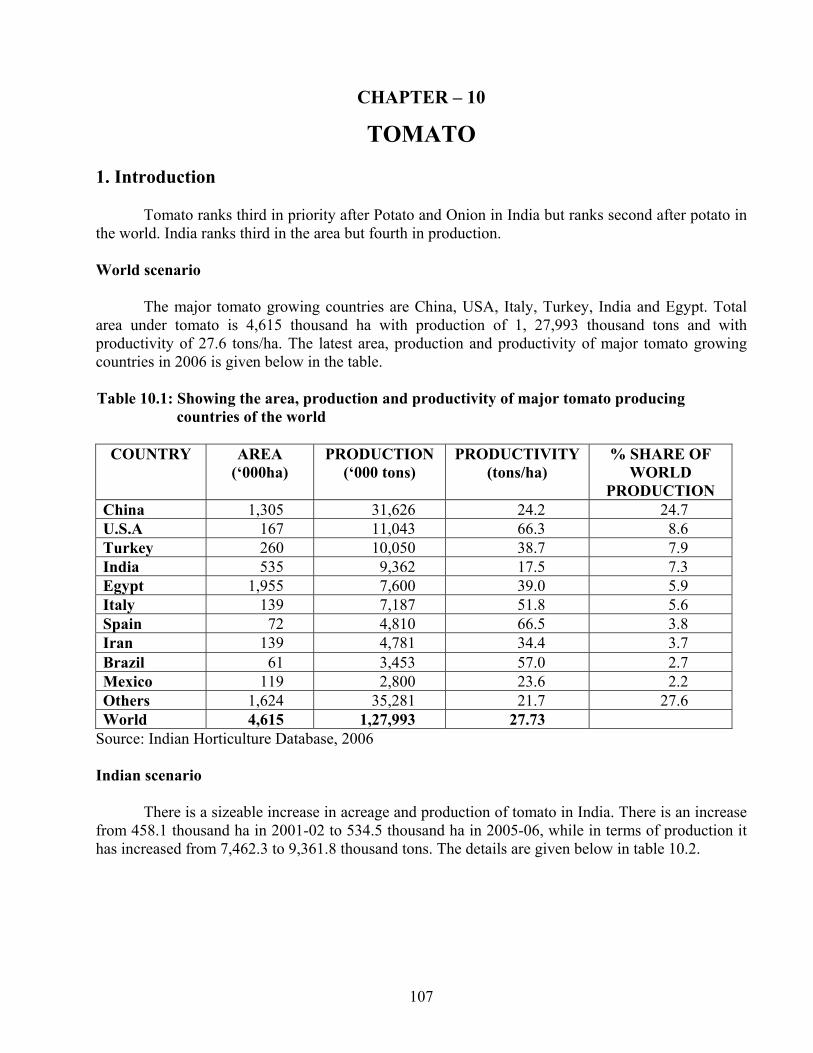
107
CHAPTER – 10
TOMATO
1. Introduction
Tomato ranks third in priority after Potato and Onion in India but ranks second after potato in the world. India ranks third in the area but fourth in production. World scenario
The major tomato growing countries are China, USA, Italy, Turkey, India and Egypt. Total area under tomato is 4,615 thousand ha with production of 1, 27,993 thousand tons and with productivity of 27.6 tons/ha. The latest area, production and productivity of major tomato growing countries in 2006 is given below in the table. Table 10.1: Showing the area, production and productivity of major tomato producing countries of the world
COUNTRY AREA (‘000ha)
PRODUCTION (‘000 tons)
PRODUCTIVITY (tons/ha)
% SHARE OF WORLD
PRODUCTION China 1,305 31,626 24.2 24.7 U.S.A 167 11,043 66.3 8.6 Turkey 260 10,050 38.7 7.9 India 535 9,362 17.5 7.3 Egypt 1,955 7,600 39.0 5.9 Italy 139 7,187 51.8 5.6 Spain 72 4,810 66.5 3.8 Iran 139 4,781 34.4 3.7 Brazil 61 3,453 57.0 2.7 Mexico 119 2,800 23.6 2.2 Others 1,624 35,281 21.7 27.6 World 4,615 1,27,993 27.73
Source: Indian Horticulture Database, 2006 Indian scenario
There is a sizeable increase in acreage and production of tomato in India. There is an increase from 458.1 thousand ha in 2001-02 to 534.5 thousand ha in 2005-06, while in terms of production it has increased from 7,462.3 to 9,361.8 thousand tons. The details are given below in table 10.2.
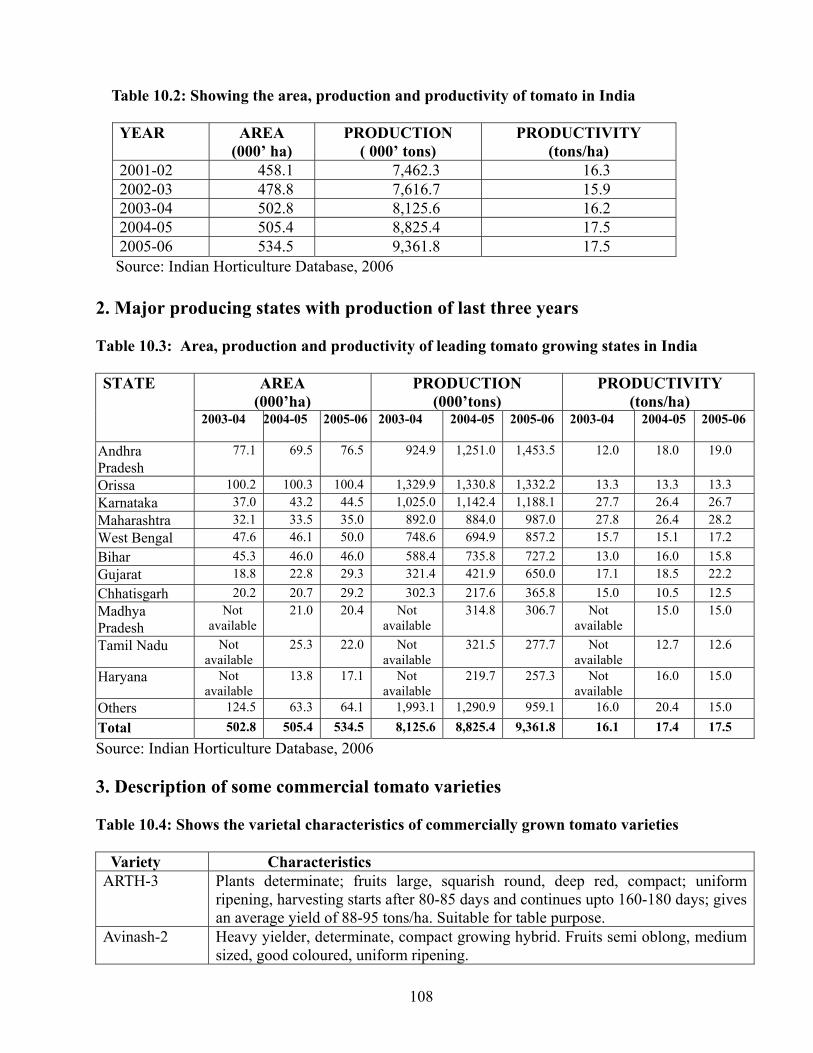
108
Table 10.2: Showing the area, production and productivity of tomato in India
YEAR AREA (000’ ha)
PRODUCTION ( 000’ tons)
PRODUCTIVITY (tons/ha)
2001-02 458.1 7,462.3 16.3 2002-03 478.8 7,616.7 15.9 2003-04 502.8 8,125.6 16.2 2004-05 505.4 8,825.4 17.5 2005-06 534.5 9,361.8 17.5
Source: Indian Horticulture Database, 2006 2. Major producing states with production of last three years Table 10.3: Area, production and productivity of leading tomato growing states in India
AREA (000’ha)
PRODUCTION (000’tons)
PRODUCTIVITY (tons/ha)
STATE
2003-04
2004-05 2005-06 2003-04 2004-05 2005-06 2003-04 2004-05 2005-06
Andhra Pradesh
77.1 69.5 76.5 924.9 1,251.0 1,453.5 12.0 18.0 19.0
Orissa 100.2 100.3 100.4 1,329.9 1,330.8 1,332.2 13.3 13.3 13.3 Karnataka 37.0 43.2 44.5 1,025.0 1,142.4 1,188.1 27.7 26.4 26.7 Maharashtra 32.1 33.5 35.0 892.0 884.0 987.0 27.8 26.4 28.2 West Bengal 47.6 46.1 50.0 748.6 694.9 857.2 15.7 15.1 17.2 Bihar 45.3 46.0 46.0 588.4 735.8 727.2 13.0 16.0 15.8 Gujarat 18.8 22.8 29.3 321.4 421.9 650.0 17.1 18.5 22.2 Chhatisgarh 20.2 20.7 29.2 302.3 217.6 365.8 15.0 10.5 12.5 Madhya Pradesh
Not available
21.0 20.4 Not available
314.8 306.7 Not available
15.0 15.0
Tamil Nadu Not available
25.3 22.0 Not available
321.5 277.7 Not available
12.7 12.6
Haryana Not available
13.8 17.1 Not available
219.7 257.3 Not available
16.0 15.0
Others 124.5 63.3 64.1 1,993.1 1,290.9 959.1 16.0 20.4 15.0 Total 502.8 505.4 534.5 8,125.6 8,825.4 9,361.8 16.1 17.4 17.5
Source: Indian Horticulture Database, 2006
3. Description of some commercial tomato varieties Table 10.4: Shows the varietal characteristics of commercially grown tomato varieties Variety Characteristics ARTH-3 Plants determinate; fruits large, squarish round, deep red, compact; uniform
ripening, harvesting starts after 80-85 days and continues upto 160-180 days; gives an average yield of 88-95 tons/ha. Suitable for table purpose.
Avinash-2 Heavy yielder, determinate, compact growing hybrid. Fruits semi oblong, medium sized, good coloured, uniform ripening.
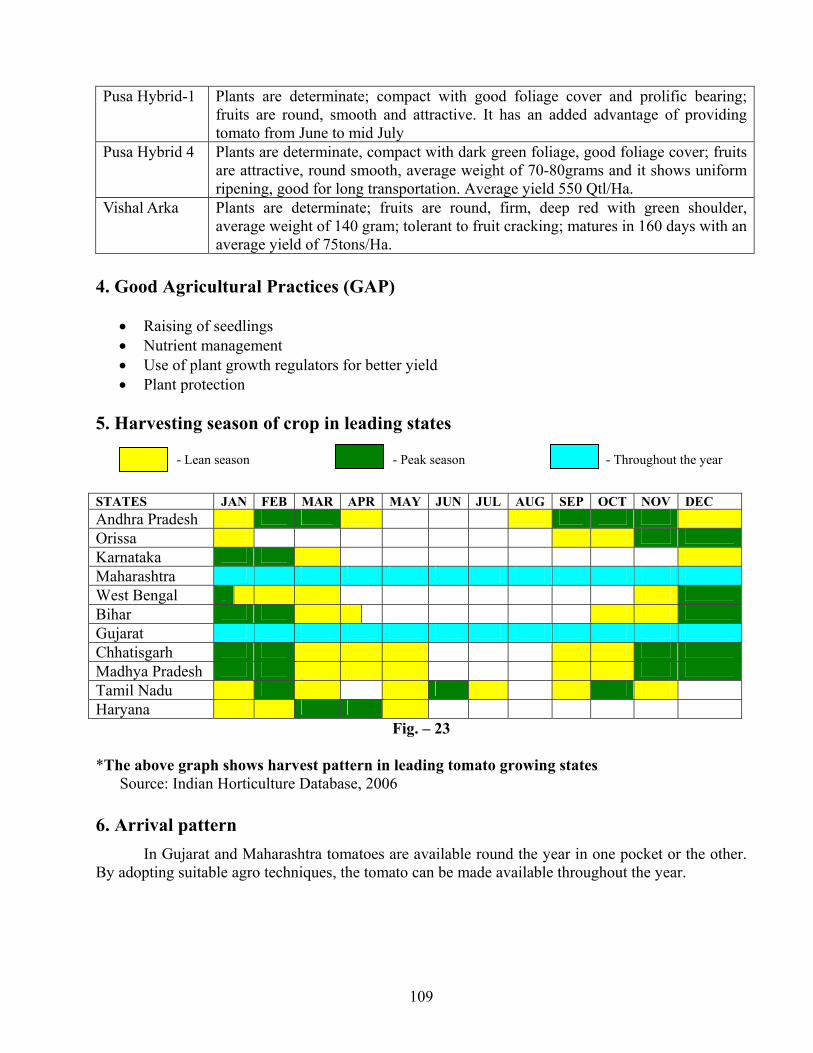
109
Pusa Hybrid-1 Plants are determinate; compact with good foliage cover and prolific bearing; fruits are round, smooth and attractive. It has an added advantage of providing tomato from June to mid July
Pusa Hybrid 4 Plants are determinate, compact with dark green foliage, good foliage cover; fruits are attractive, round smooth, average weight of 70-80grams and it shows uniform ripening, good for long transportation. Average yield 550 Qtl/Ha.
Vishal Arka Plants are determinate; fruits are round, firm, deep red with green shoulder, average weight of 140 gram; tolerant to fruit cracking; matures in 160 days with an average yield of 75tons/Ha.
4. Good Agricultural Practices (GAP)
• Raising of seedlings • Nutrient management • Use of plant growth regulators for better yield • Plant protection
5. Harvesting season of crop in leading states
- Lean season - Peak season - Throughout the year
Fig. – 23 *The above graph shows harvest pattern in leading tomato growing states Source: Indian Horticulture Database, 2006 6. Arrival pattern
In Gujarat and Maharashtra tomatoes are available round the year in one pocket or the other. By adopting suitable agro techniques, the tomato can be made available throughout the year.
STATES JAN FEB MAR APR MAY JUN JUL AUG SEP OCT NOV DEC Andhra Pradesh Orissa Karnataka Maharashtra West Bengal Bihar Gujarat Chhatisgarh Madhya Pradesh Tamil Nadu Haryana
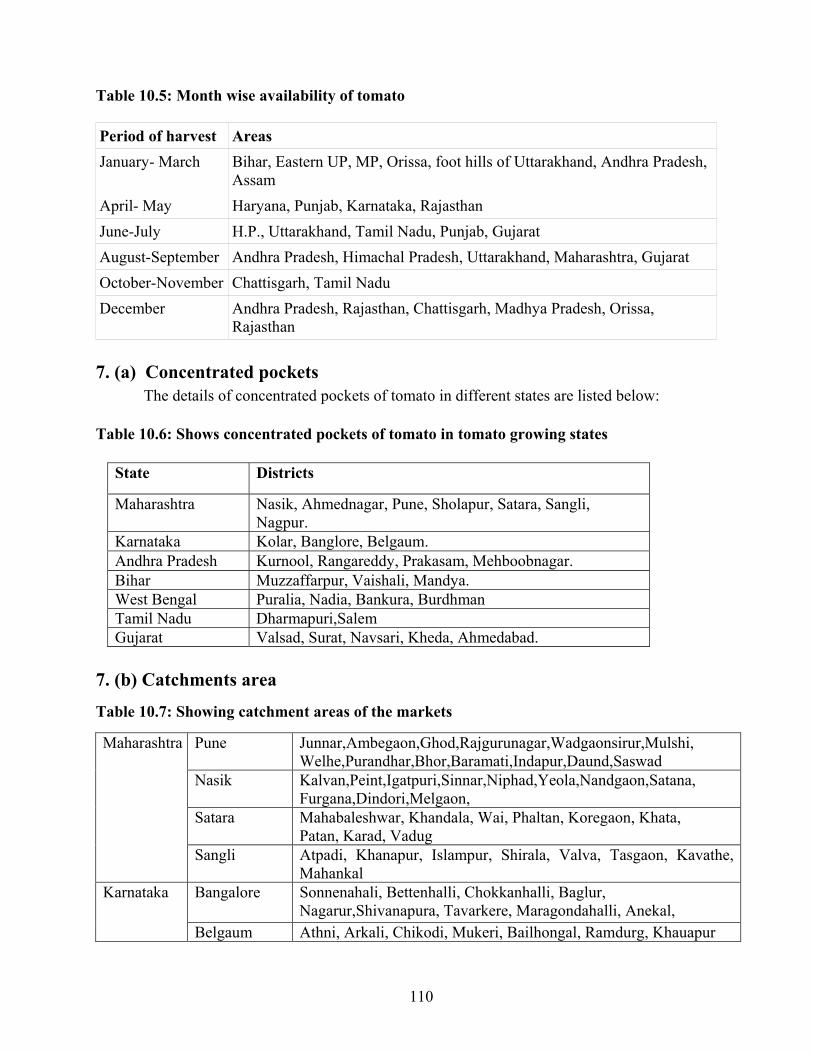
110
Table 10.5: Month wise availability of tomato Period of harvest Areas January- March Bihar, Eastern UP, MP, Orissa, foot hills of Uttarakhand, Andhra Pradesh,
Assam April- May Haryana, Punjab, Karnataka, Rajasthan June-July H.P., Uttarakhand, Tamil Nadu, Punjab, Gujarat August-September Andhra Pradesh, Himachal Pradesh, Uttarakhand, Maharashtra, Gujarat October-November Chattisgarh, Tamil Nadu December Andhra Pradesh, Rajasthan, Chattisgarh, Madhya Pradesh, Orissa,
Rajasthan 7. (a) Concentrated pockets The details of concentrated pockets of tomato in different states are listed below:
Table 10.6: Shows concentrated pockets of tomato in tomato growing states
State Districts
Maharashtra Nasik, Ahmednagar, Pune, Sholapur, Satara, Sangli, Nagpur.
Karnataka Kolar, Banglore, Belgaum. Andhra Pradesh Kurnool, Rangareddy, Prakasam, Mehboobnagar. Bihar Muzzaffarpur, Vaishali, Mandya. West Bengal Puralia, Nadia, Bankura, Burdhman Tamil Nadu Dharmapuri,Salem Gujarat Valsad, Surat, Navsari, Kheda, Ahmedabad.
7. (b) Catchments area Table 10.7: Showing catchment areas of the markets
Pune Junnar,Ambegaon,Ghod,Rajgurunagar,Wadgaonsirur,Mulshi, Welhe,Purandhar,Bhor,Baramati,Indapur,Daund,Saswad
Nasik Kalvan,Peint,Igatpuri,Sinnar,Niphad,Yeola,Nandgaon,Satana, Furgana,Dindori,Melgaon,
Satara Mahabaleshwar, Khandala, Wai, Phaltan, Koregaon, Khata, Patan, Karad, Vadug
Maharashtra
Sangli Atpadi, Khanapur, Islampur, Shirala, Valva, Tasgaon, Kavathe, Mahankal
Bangalore Sonnenahali, Bettenhalli, Chokkanhalli, Baglur, Nagarur,Shivanapura, Tavarkere, Maragondahalli, Anekal,
Karnataka
Belgaum Athni, Arkali, Chikodi, Mukeri, Bailhongal, Ramdurg, Khauapur
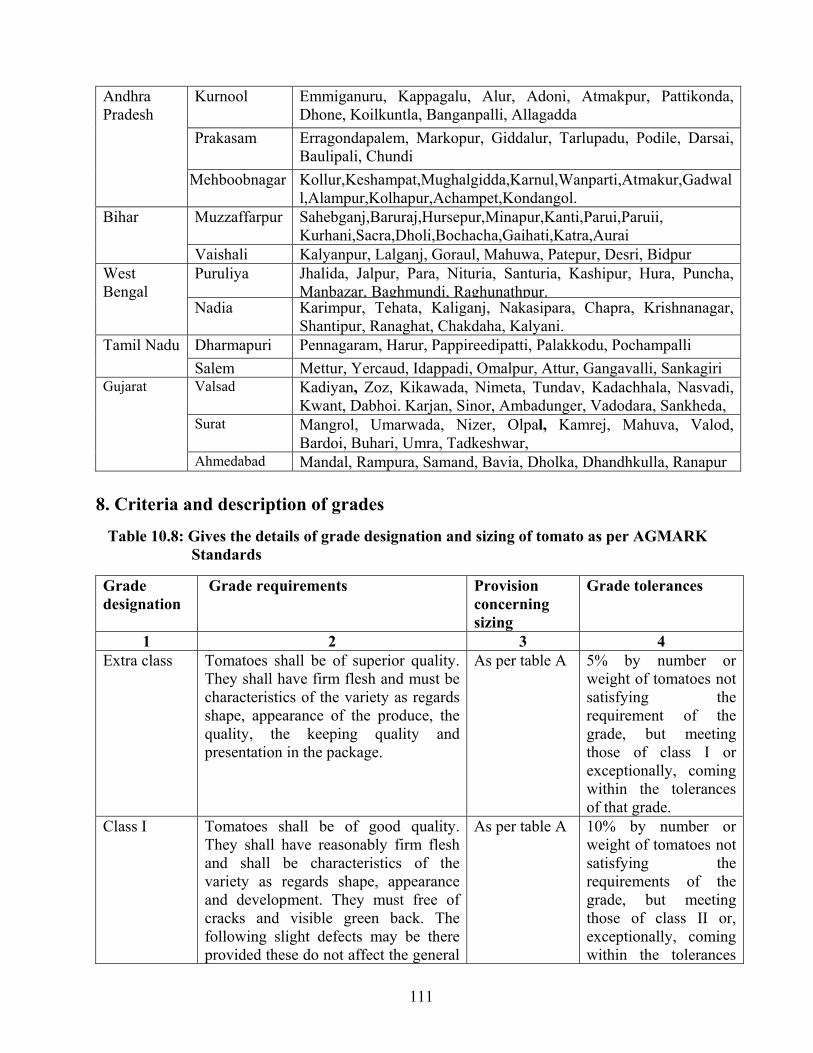
111
Kurnool Emmiganuru, Kappagalu, Alur, Adoni, Atmakpur, Pattikonda, Dhone, Koilkuntla, Banganpalli, Allagadda
Prakasam Erragondapalem, Markopur, Giddalur, Tarlupadu, Podile, Darsai, Baulipali, Chundi
Andhra Pradesh
Mehboobnagar Kollur,Keshampat,Mughalgidda,Karnul,Wanparti,Atmakur,Gadwall,Alampur,Kolhapur,Achampet,Kondangol.
Muzzaffarpur Sahebganj,Baruraj,Hursepur,Minapur,Kanti,Parui,Paruii, Kurhani,Sacra,Dholi,Bochacha,Gaihati,Katra,Aurai
Bihar
Vaishali Kalyanpur, Lalganj, Goraul, Mahuwa, Patepur, Desri, Bidpur Puruliya Jhalida, Jalpur, Para, Nituria, Santuria, Kashipur, Hura, Puncha,
Manbazar, Baghmundi, Raghunathpur.West Bengal
Nadia Karimpur, Tehata, Kaliganj, Nakasipara, Chapra, Krishnanagar, Shantipur, Ranaghat, Chakdaha, Kalyani.
Dharmapuri Pennagaram, Harur, Pappireedipatti, Palakkodu, Pochampalli Tamil Nadu Salem Mettur, Yercaud, Idappadi, Omalpur, Attur, Gangavalli, Sankagiri Valsad Kadiyan, Zoz, Kikawada, Nimeta, Tundav, Kadachhala, Nasvadi,
Kwant, Dabhoi. Karjan, Sinor, Ambadunger, Vadodara, Sankheda, Surat Mangrol, Umarwada, Nizer, Olpal, Kamrej, Mahuva, Valod,
Bardoi, Buhari, Umra, Tadkeshwar,
Gujarat
Ahmedabad Mandal, Rampura, Samand, Bavia, Dholka, Dhandhkulla, Ranapur 8. Criteria and description of grades Table 10.8: Gives the details of grade designation and sizing of tomato as per AGMARK Standards
Grade designation
Grade requirements Provision concerning sizing
Grade tolerances
1 2 3 4 Extra class Tomatoes shall be of superior quality.
They shall have firm flesh and must be characteristics of the variety as regards shape, appearance of the produce, the quality, the keeping quality and presentation in the package.
As per table A 5% by number or weight of tomatoes not satisfying the requirement of the grade, but meeting those of class I or exceptionally, coming within the tolerances of that grade.
Class I Tomatoes shall be of good quality. They shall have reasonably firm flesh and shall be characteristics of the variety as regards shape, appearance and development. They must free of cracks and visible green back. The following slight defects may be there provided these do not affect the general
As per table A 10% by number or weight of tomatoes not satisfying the requirements of the grade, but meeting those of class II or, exceptionally, coming within the tolerances
112
appearance of the produce, the quality, the keeping quality and the presentation in the package. -a slight defect in shape and development; -a slight defect in colouring; -slight skin defects; -very slight bruises; “ribbed” tomatoes may show: -no excessive protuberances; -small nonlignified umbilical scars -Suberization of the stigma upto 1 sq. cm -no more than 1 headed scar -umbilical lignified scars not greater than 1 sq.cm or linear scar no longer than 2/3rd of the greatest diameter of the fruit.
of that grade.
Class II Tomatoes shall be reasonably firm flesh and shall be characteristic of the variety( but may be slightly less firm than in class I) and must not show unhealed cracks. Following defects may be there provided the tomatoes retain their essential characteristics as regards the quality, the keeping quality and presentation. -defects in shape, development and colouring; - skin defects or bruises, provided the fruit is not seriously affected; - healed cracks not more than 3 cm in length. “ribbed” tomatoes may show: -more pronounced protuberances but without being misshapen; - one umbilicus; -umbilical lignified scars not greater than 2 sq. cm; - fine blossom scar in elongated form.
As per table A 10% by number or weight of tomatoes not satisfying the requirements of the grade, but meeting the minimum requirements. In case of trusses of tomatoes, 10%by number or weight of tomatoes detached from the stalk.
Provisions concerning size
Sizing is determined by the maximum diameter of the equatorial section in accordance with following table. The provision shall not apply to “cherry” tomatoes. The minimum size is set at 35 mm for “round” and “ribbed” tomatoes and 30 mm for “oblong” tomatoes:
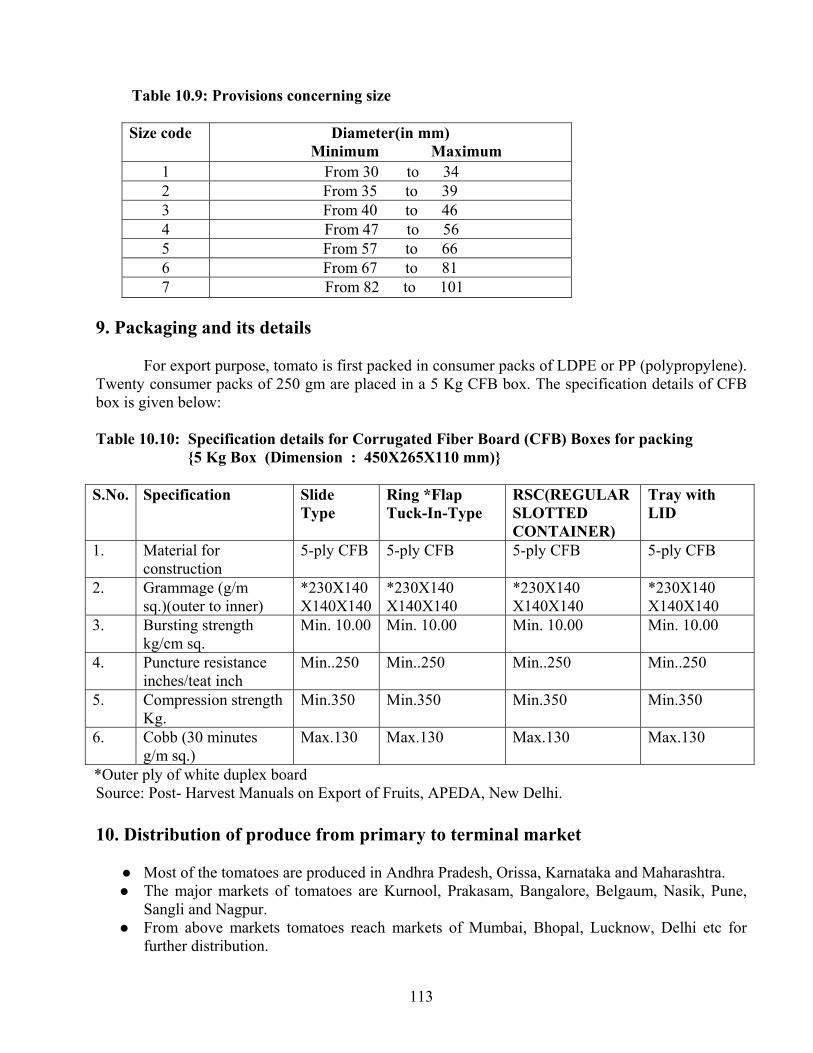
113
Table 10.9: Provisions concerning size
Size code Diameter(in mm) Minimum Maximum
1 From 30 to 34 2 From 35 to 39 3 From 40 to 46 4 From 47 to 56 5 From 57 to 66 6 From 67 to 81 7 From 82 to 101
9. Packaging and its details
For export purpose, tomato is first packed in consumer packs of LDPE or PP (polypropylene). Twenty consumer packs of 250 gm are placed in a 5 Kg CFB box. The specification details of CFB box is given below: Table 10.10: Specification details for Corrugated Fiber Board (CFB) Boxes for packing
{5 Kg Box (Dimension : 450X265X110 mm)}
S.No. Specification Slide Type
Ring *Flap Tuck-In-Type
RSC(REGULAR SLOTTED CONTAINER)
Tray with LID
1. Material for construction
5-ply CFB 5-ply CFB 5-ply CFB 5-ply CFB
2. Grammage (g/m sq.)(outer to inner)
*230X140 X140X140
*230X140 X140X140
*230X140 X140X140
*230X140 X140X140
3. Bursting strength kg/cm sq.
Min. 10.00 Min. 10.00 Min. 10.00 Min. 10.00
4. Puncture resistance inches/teat inch
Min..250 Min..250 Min..250 Min..250
5. Compression strength Kg.
Min.350 Min.350 Min.350 Min.350
6. Cobb (30 minutes g/m sq.)
Max.130 Max.130 Max.130 Max.130
*Outer ply of white duplex board Source: Post- Harvest Manuals on Export of Fruits, APEDA, New Delhi. 10. Distribution of produce from primary to terminal market
Most of the tomatoes are produced in Andhra Pradesh, Orissa, Karnataka and Maharashtra. The major markets of tomatoes are Kurnool, Prakasam, Bangalore, Belgaum, Nasik, Pune,
Sangli and Nagpur. From above markets tomatoes reach markets of Mumbai, Bhopal, Lucknow, Delhi etc for
further distribution.
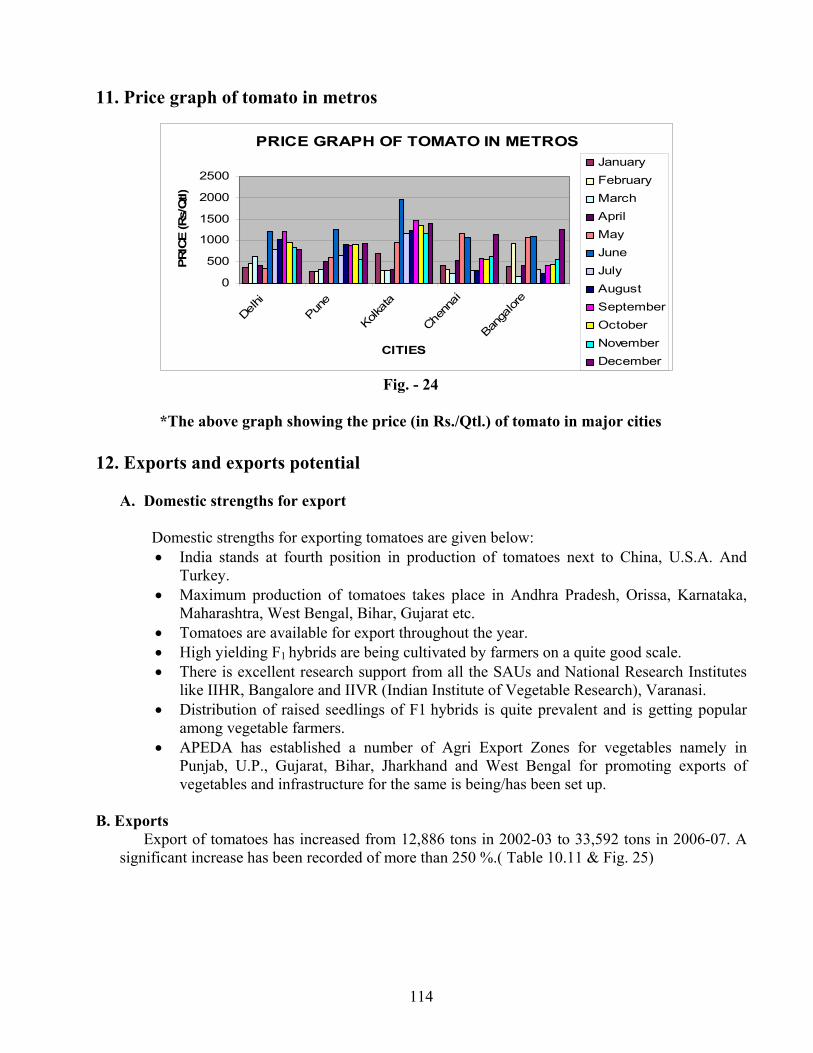
114
11. Price graph of tomato in metros
PRICE GRAPH OF TOMATO IN METROS
0
500
1000
1500
2000
2500
Delhi
Pune
Kolkata
Chenn
ai
Banga
lore
CITIES
PRIC
E (R
s/Q
tl)
JanuaryFebruaryMarchAprilMayJuneJulyAugustSeptemberOctoberNovemberDecember
Fig. - 24 *The above graph showing the price (in Rs./Qtl.) of tomato in major cities 12. Exports and exports potential
A. Domestic strengths for export Domestic strengths for exporting tomatoes are given below:
• India stands at fourth position in production of tomatoes next to China, U.S.A. And Turkey.
• Maximum production of tomatoes takes place in Andhra Pradesh, Orissa, Karnataka, Maharashtra, West Bengal, Bihar, Gujarat etc.
• Tomatoes are available for export throughout the year. • High yielding F1 hybrids are being cultivated by farmers on a quite good scale. • There is excellent research support from all the SAUs and National Research Institutes
like IIHR, Bangalore and IIVR (Indian Institute of Vegetable Research), Varanasi. • Distribution of raised seedlings of F1 hybrids is quite prevalent and is getting popular
among vegetable farmers. • APEDA has established a number of Agri Export Zones for vegetables namely in
Punjab, U.P., Gujarat, Bihar, Jharkhand and West Bengal for promoting exports of vegetables and infrastructure for the same is being/has been set up.
B. Exports
Export of tomatoes has increased from 12,886 tons in 2002-03 to 33,592 tons in 2006-07. A significant increase has been recorded of more than 250 %.( Table 10.11 & Fig. 25)
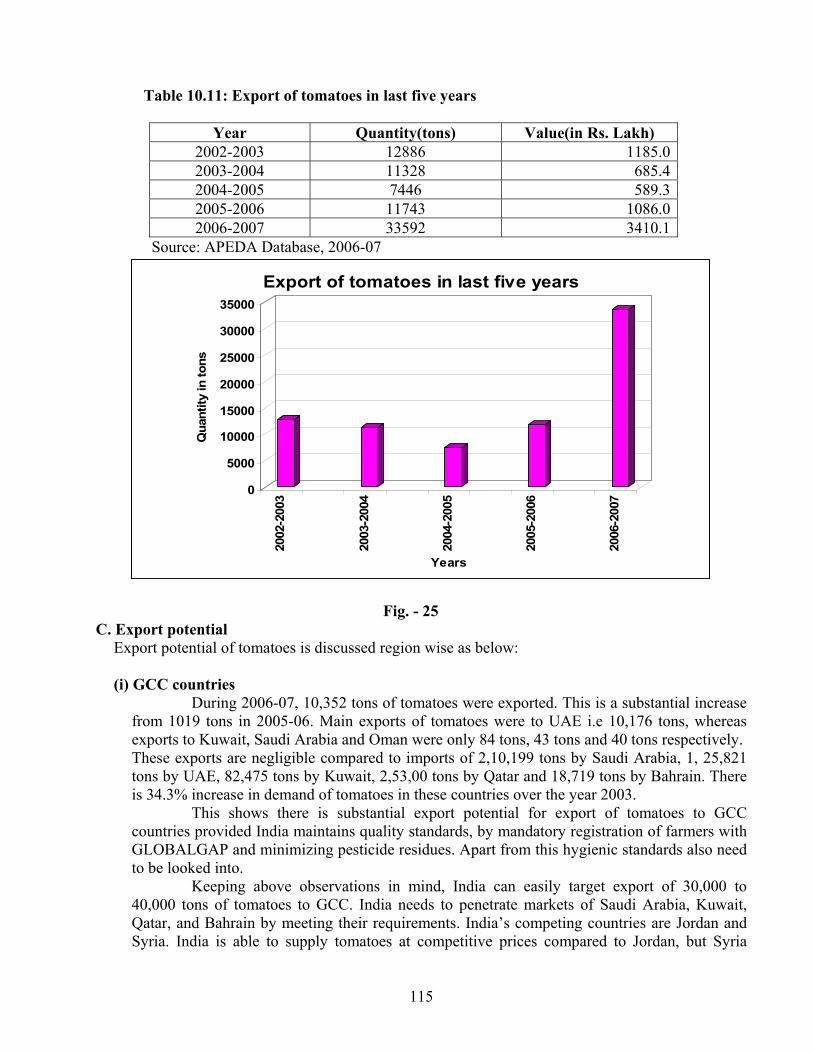
115
Table 10.11: Export of tomatoes in last five years
Year Quantity(tons) Value(in Rs. Lakh) 2002-2003 12886 1185.02003-2004 11328 685.42004-2005 7446 589.32005-2006 11743 1086.02006-2007 33592 3410.1
Source: APEDA Database, 2006-07
0
5000
10000
15000
20000
25000
30000
35000
Qua
ntity
in to
ns
2002
-200
3
2003
-200
4
2004
-200
5
2005
-200
6
2006
-200
7
Years
Export of tomatoes in last five years
Fig. - 25
C. Export potential Export potential of tomatoes is discussed region wise as below: (i) GCC countries
During 2006-07, 10,352 tons of tomatoes were exported. This is a substantial increase from 1019 tons in 2005-06. Main exports of tomatoes were to UAE i.e 10,176 tons, whereas exports to Kuwait, Saudi Arabia and Oman were only 84 tons, 43 tons and 40 tons respectively. These exports are negligible compared to imports of 2,10,199 tons by Saudi Arabia, 1, 25,821 tons by UAE, 82,475 tons by Kuwait, 2,53,00 tons by Qatar and 18,719 tons by Bahrain. There is 34.3% increase in demand of tomatoes in these countries over the year 2003.
This shows there is substantial export potential for export of tomatoes to GCC countries provided India maintains quality standards, by mandatory registration of farmers with GLOBALGAP and minimizing pesticide residues. Apart from this hygienic standards also need to be looked into.
Keeping above observations in mind, India can easily target export of 30,000 to 40,000 tons of tomatoes to GCC. India needs to penetrate markets of Saudi Arabia, Kuwait, Qatar, and Bahrain by meeting their requirements. India’s competing countries are Jordan and Syria. India is able to supply tomatoes at competitive prices compared to Jordan, but Syria
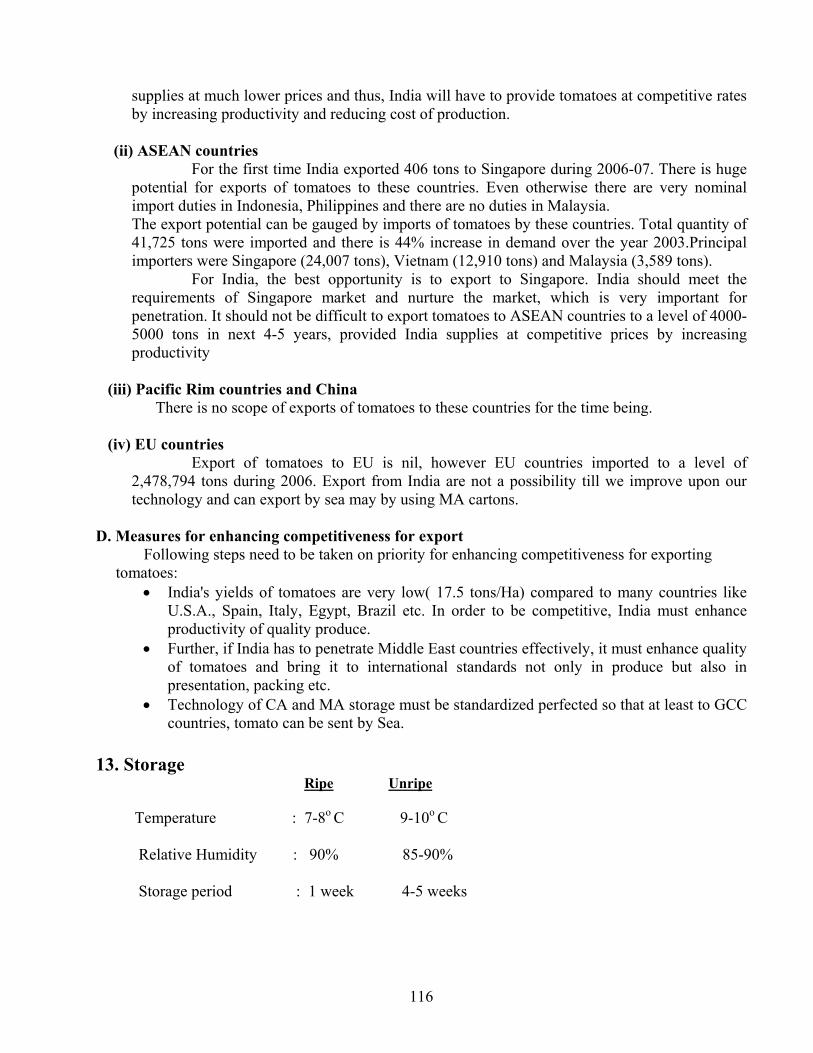
116
supplies at much lower prices and thus, India will have to provide tomatoes at competitive rates by increasing productivity and reducing cost of production.
(ii) ASEAN countries
For the first time India exported 406 tons to Singapore during 2006-07. There is huge potential for exports of tomatoes to these countries. Even otherwise there are very nominal import duties in Indonesia, Philippines and there are no duties in Malaysia. The export potential can be gauged by imports of tomatoes by these countries. Total quantity of 41,725 tons were imported and there is 44% increase in demand over the year 2003.Principal importers were Singapore (24,007 tons), Vietnam (12,910 tons) and Malaysia (3,589 tons).
For India, the best opportunity is to export to Singapore. India should meet the requirements of Singapore market and nurture the market, which is very important for penetration. It should not be difficult to export tomatoes to ASEAN countries to a level of 4000-5000 tons in next 4-5 years, provided India supplies at competitive prices by increasing productivity
(iii) Pacific Rim countries and China
There is no scope of exports of tomatoes to these countries for the time being. (iv) EU countries
Export of tomatoes to EU is nil, however EU countries imported to a level of 2,478,794 tons during 2006. Export from India are not a possibility till we improve upon our technology and can export by sea may by using MA cartons.
D. Measures for enhancing competitiveness for export Following steps need to be taken on priority for enhancing competitiveness for exporting tomatoes:
• India's yields of tomatoes are very low( 17.5 tons/Ha) compared to many countries like U.S.A., Spain, Italy, Egypt, Brazil etc. In order to be competitive, India must enhance productivity of quality produce.
• Further, if India has to penetrate Middle East countries effectively, it must enhance quality of tomatoes and bring it to international standards not only in produce but also in presentation, packing etc.
• Technology of CA and MA storage must be standardized perfected so that at least to GCC countries, tomato can be sent by Sea.
13. Storage Ripe Unripe Temperature : 7-8o C 9-10o C Relative Humidity : 90% 85-90% Storage period : 1 week 4-5 weeks
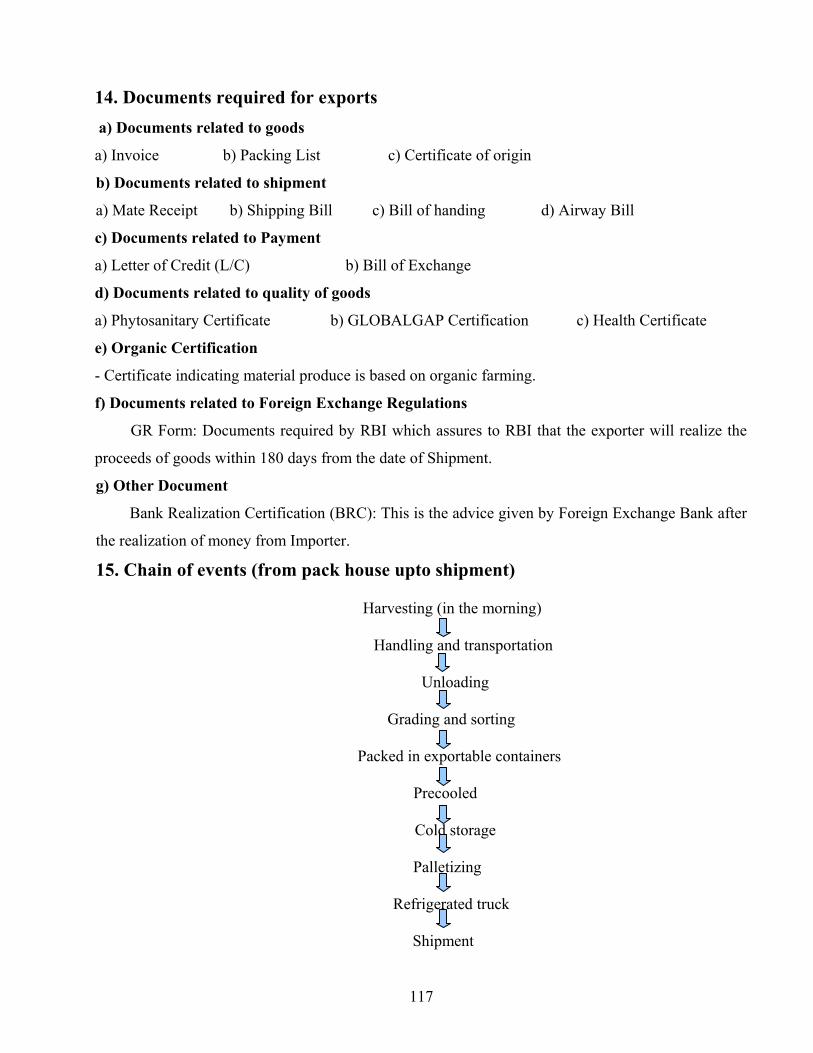
117
14. Documents required for exports
a) Documents related to goods
a) Invoice b) Packing List c) Certificate of origin
b) Documents related to shipment
a) Mate Receipt b) Shipping Bill c) Bill of handing d) Airway Bill
c) Documents related to Payment
a) Letter of Credit (L/C) b) Bill of Exchange
d) Documents related to quality of goods
a) Phytosanitary Certificate b) GLOBALGAP Certification c) Health Certificate
e) Organic Certification
- Certificate indicating material produce is based on organic farming.
f) Documents related to Foreign Exchange Regulations
GR Form: Documents required by RBI which assures to RBI that the exporter will realize the
proceeds of goods within 180 days from the date of Shipment.
g) Other Document
Bank Realization Certification (BRC): This is the advice given by Foreign Exchange Bank after
the realization of money from Importer.
15. Chain of events (from pack house upto shipment)
Harvesting (in the morning)
Handling and transportation
Unloading
Grading and sorting
Packed in exportable containers
Precooled
Cold storage
Palletizing
Refrigerated truck
Shipment
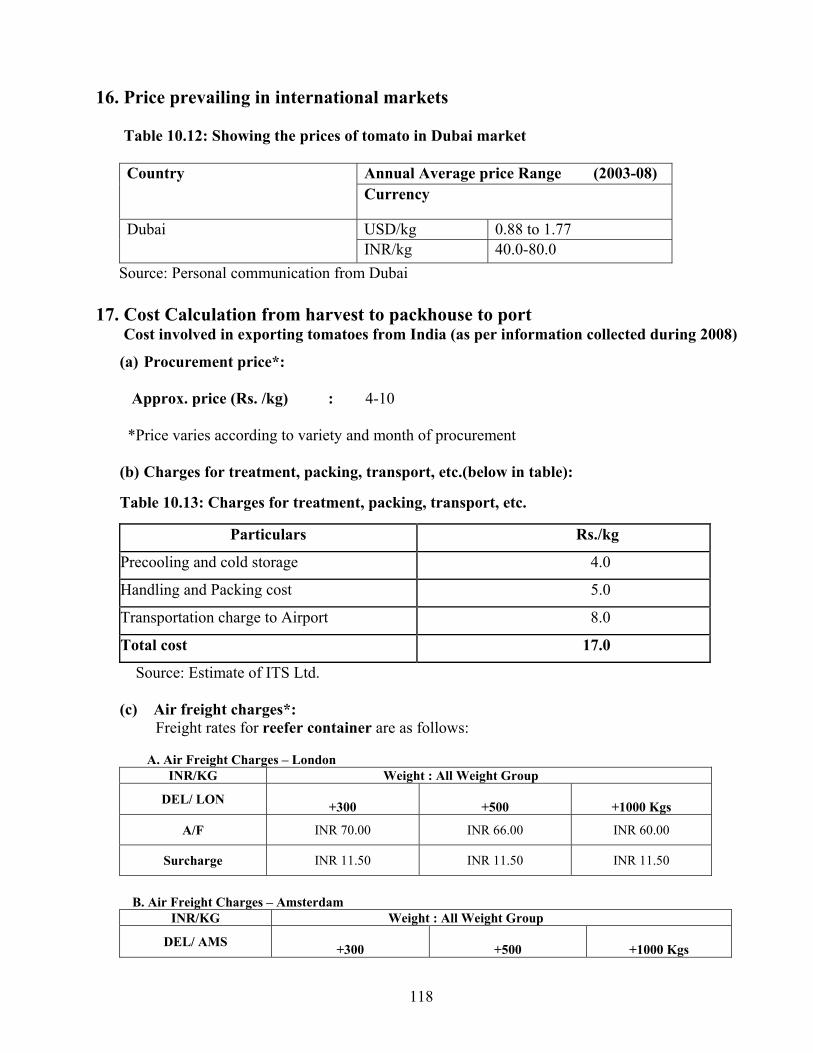
118
16. Price prevailing in international markets
Table 10.12: Showing the prices of tomato in Dubai market
Annual Average price Range (2003-08) Country Currency
USD/kg 0.88 to 1.77 Dubai INR/kg 40.0-80.0
Source: Personal communication from Dubai 17. Cost Calculation from harvest to packhouse to port Cost involved in exporting tomatoes from India (as per information collected during 2008)
(a) Procurement price*: Approx. price (Rs. /kg) : 4-10 *Price varies according to variety and month of procurement
(b) Charges for treatment, packing, transport, etc.(below in table): Table 10.13: Charges for treatment, packing, transport, etc.
Particulars Rs./kg
Precooling and cold storage 4.0
Handling and Packing cost 5.0
Transportation charge to Airport 8.0
Total cost 17.0
Source: Estimate of ITS Ltd.
(c) Air freight charges*: Freight rates for reefer container are as follows:
A. Air Freight Charges – London
INR/KG Weight : All Weight Group
DEL/ LON +300 +500 +1000 Kgs
A/F INR 70.00 INR 66.00 INR 60.00
Surcharge INR 11.50 INR 11.50 INR 11.50
B. Air Freight Charges – Amsterdam
INR/KG Weight : All Weight Group
DEL/ AMS +300 +500 +1000 Kgs
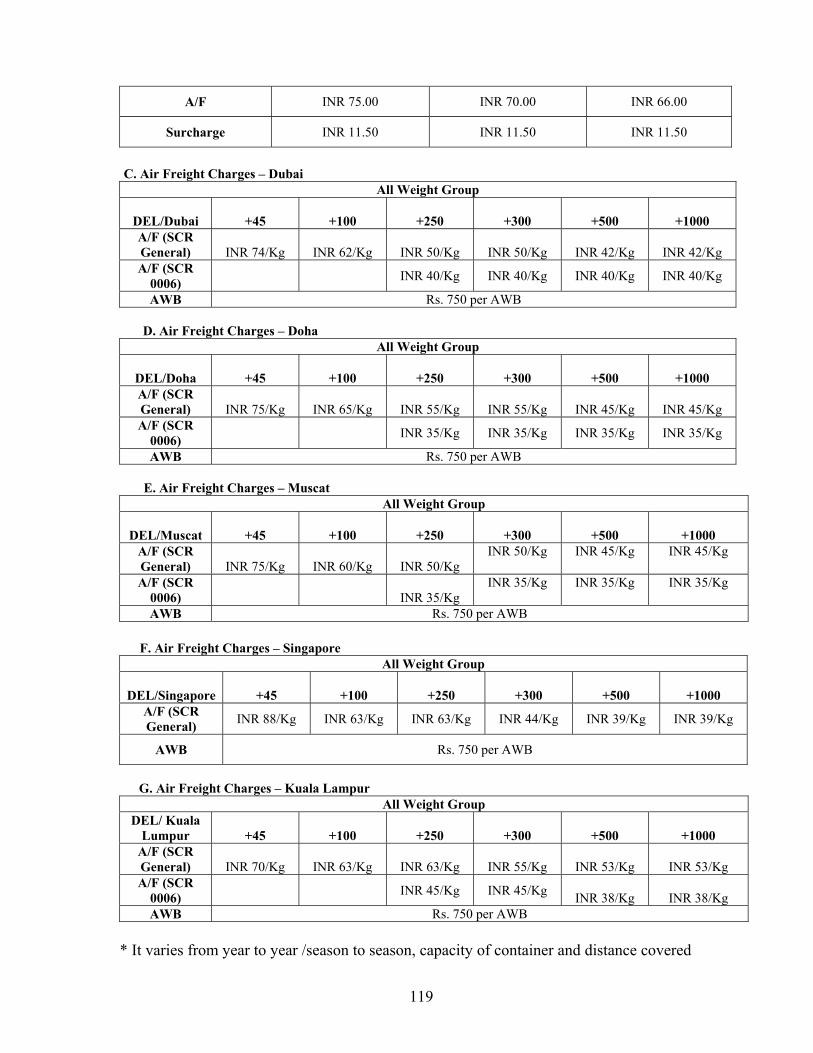
119
A/F INR 75.00 INR 70.00 INR 66.00
Surcharge INR 11.50 INR 11.50 INR 11.50
C. Air Freight Charges – Dubai
All Weight Group
DEL/Dubai +45 +100 +250 +300 +500 +1000 A/F (SCR General) INR 74/Kg INR 62/Kg INR 50/Kg INR 50/Kg INR 42/Kg INR 42/Kg A/F (SCR
0006) INR 40/Kg INR 40/Kg INR 40/Kg INR 40/Kg
AWB Rs. 750 per AWB D. Air Freight Charges – Doha
All Weight Group
DEL/Doha +45 +100 +250 +300 +500 +1000 A/F (SCR General) INR 75/Kg INR 65/Kg INR 55/Kg INR 55/Kg INR 45/Kg INR 45/Kg A/F (SCR
0006) INR 35/Kg INR 35/Kg INR 35/Kg INR 35/Kg
AWB Rs. 750 per AWB
E. Air Freight Charges – Muscat All Weight Group
DEL/Muscat +45 +100 +250 +300 +500 +1000 A/F (SCR General) INR 75/Kg INR 60/Kg INR 50/Kg
INR 50/Kg INR 45/Kg INR 45/Kg
A/F (SCR 0006) INR 35/Kg
INR 35/Kg INR 35/Kg INR 35/Kg
AWB Rs. 750 per AWB F. Air Freight Charges – Singapore
All Weight Group
DEL/Singapore +45 +100 +250 +300 +500 +1000 A/F (SCR General) INR 88/Kg INR 63/Kg INR 63/Kg INR 44/Kg INR 39/Kg INR 39/Kg
AWB Rs. 750 per AWB
G. Air Freight Charges – Kuala Lampur
All Weight Group DEL/ Kuala
Lumpur +45 +100 +250 +300 +500 +1000 A/F (SCR General) INR 70/Kg INR 63/Kg INR 63/Kg INR 55/Kg INR 53/Kg INR 53/Kg A/F (SCR
0006) INR 45/Kg INR 45/Kg INR 38/Kg INR 38/Kg AWB Rs. 750 per AWB
* It varies from year to year /season to season, capacity of container and distance covered
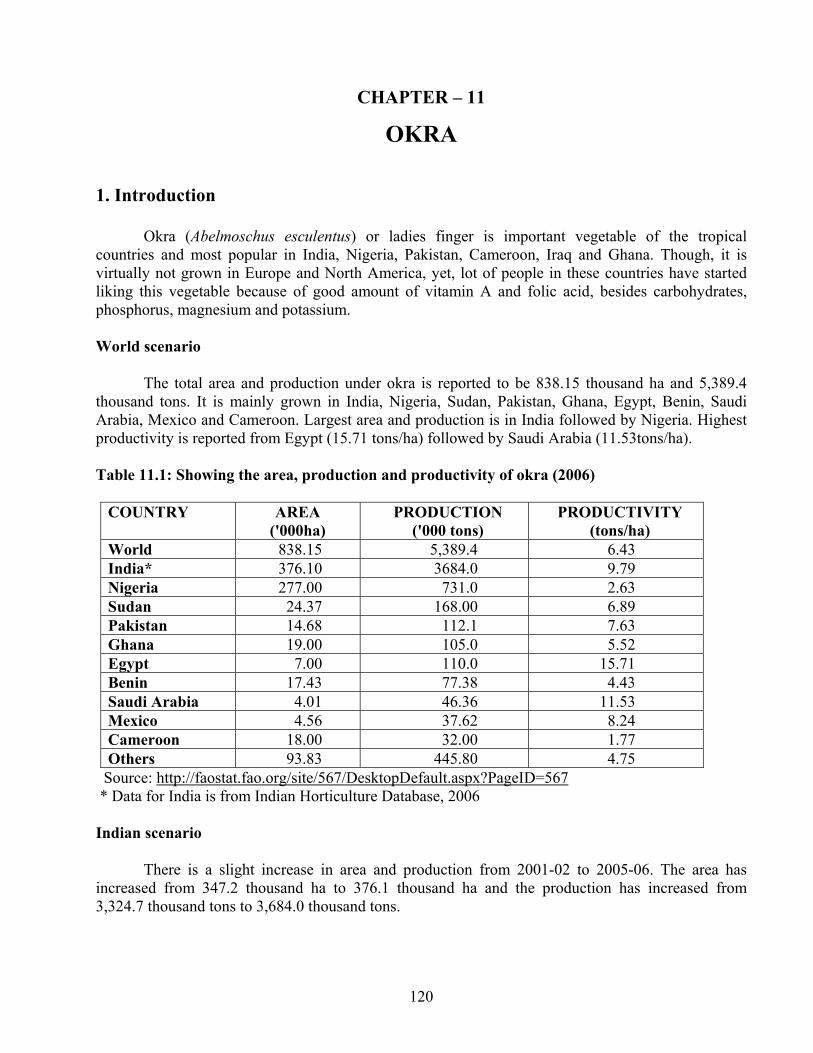
120
CHAPTER – 11
OKRA
1. Introduction
Okra (Abelmoschus esculentus) or ladies finger is important vegetable of the tropical countries and most popular in India, Nigeria, Pakistan, Cameroon, Iraq and Ghana. Though, it is virtually not grown in Europe and North America, yet, lot of people in these countries have started liking this vegetable because of good amount of vitamin A and folic acid, besides carbohydrates, phosphorus, magnesium and potassium. World scenario
The total area and production under okra is reported to be 838.15 thousand ha and 5,389.4 thousand tons. It is mainly grown in India, Nigeria, Sudan, Pakistan, Ghana, Egypt, Benin, Saudi Arabia, Mexico and Cameroon. Largest area and production is in India followed by Nigeria. Highest productivity is reported from Egypt (15.71 tons/ha) followed by Saudi Arabia (11.53tons/ha). Table 11.1: Showing the area, production and productivity of okra (2006)
COUNTRY AREA ('000ha)
PRODUCTION ('000 tons)
PRODUCTIVITY (tons/ha)
World 838.15 5,389.4 6.43 India* 376.10 3684.0 9.79 Nigeria 277.00 731.0 2.63 Sudan 24.37 168.00 6.89 Pakistan 14.68 112.1 7.63 Ghana 19.00 105.0 5.52 Egypt 7.00 110.0 15.71 Benin 17.43 77.38 4.43 Saudi Arabia 4.01 46.36 11.53 Mexico 4.56 37.62 8.24 Cameroon 18.00 32.00 1.77 Others 93.83 445.80 4.75
Source: http://faostat.fao.org/site/567/DesktopDefault.aspx?PageID=567 * Data for India is from Indian Horticulture Database, 2006 Indian scenario
There is a slight increase in area and production from 2001-02 to 2005-06. The area has increased from 347.2 thousand ha to 376.1 thousand ha and the production has increased from 3,324.7 thousand tons to 3,684.0 thousand tons.
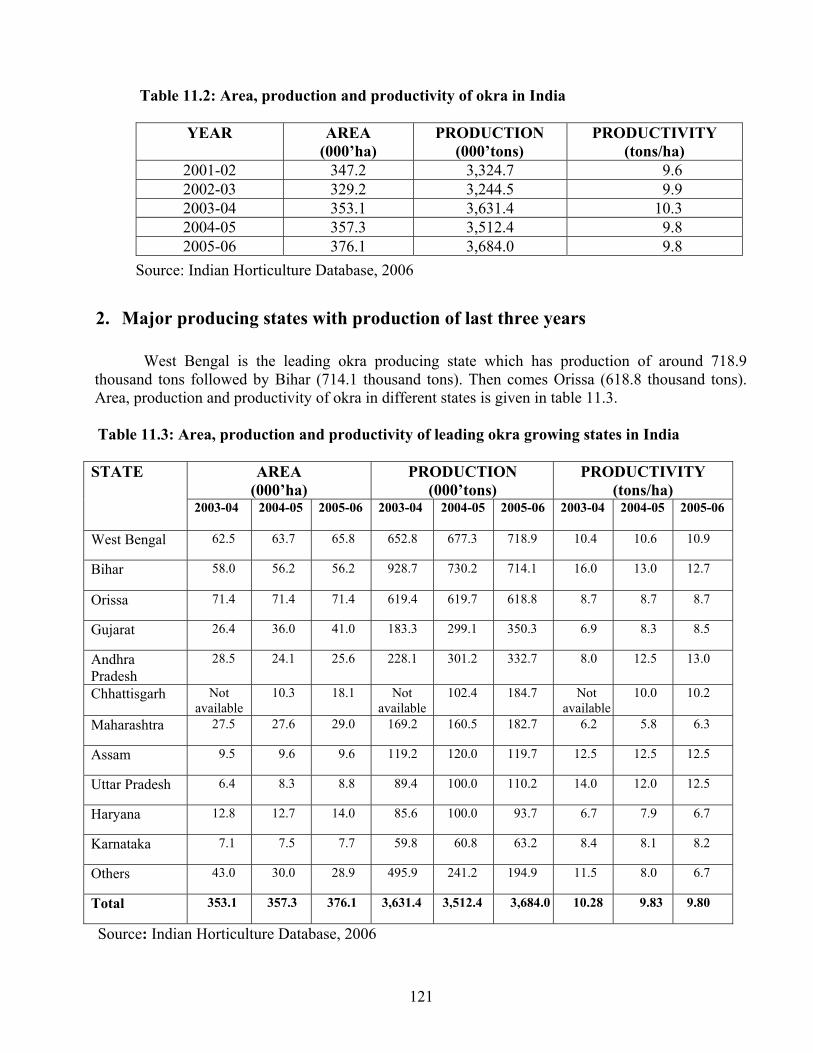
121
Table 11.2: Area, production and productivity of okra in India
YEAR AREA (000’ha)
PRODUCTION (000’tons)
PRODUCTIVITY (tons/ha)
2001-02 347.2 3,324.7 9.6 2002-03 329.2 3,244.5 9.9 2003-04 353.1 3,631.4 10.3 2004-05 357.3 3,512.4 9.8 2005-06 376.1 3,684.0 9.8
Source: Indian Horticulture Database, 2006 2. Major producing states with production of last three years
West Bengal is the leading okra producing state which has production of around 718.9 thousand tons followed by Bihar (714.1 thousand tons). Then comes Orissa (618.8 thousand tons). Area, production and productivity of okra in different states is given in table 11.3.
Table 11.3: Area, production and productivity of leading okra growing states in India
AREA (000’ha)
PRODUCTION (000’tons)
PRODUCTIVITY (tons/ha)
STATE
2003-04
2004-05 2005-06 2003-04 2004-05 2005-06 2003-04 2004-05 2005-06
West Bengal 62.5 63.7 65.8 652.8 677.3 718.9 10.4 10.6 10.9
Bihar 58.0 56.2 56.2 928.7 730.2 714.1 16.0 13.0 12.7
Orissa 71.4 71.4 71.4 619.4 619.7 618.8 8.7 8.7 8.7
Gujarat 26.4 36.0 41.0 183.3 299.1 350.3 6.9 8.3 8.5
Andhra Pradesh
28.5 24.1 25.6 228.1 301.2 332.7 8.0 12.5 13.0
Chhattisgarh Not available
10.3 18.1 Not available
102.4 184.7 Not available
10.0 10.2
Maharashtra 27.5 27.6 29.0 169.2 160.5 182.7 6.2 5.8 6.3
Assam 9.5 9.6 9.6 119.2 120.0 119.7 12.5 12.5 12.5
Uttar Pradesh 6.4 8.3 8.8 89.4 100.0 110.2 14.0 12.0 12.5
Haryana 12.8 12.7 14.0 85.6 100.0 93.7 6.7 7.9 6.7
Karnataka 7.1 7.5 7.7 59.8 60.8 63.2 8.4 8.1 8.2
Others 43.0 30.0 28.9 495.9 241.2 194.9 11.5 8.0 6.7
Total 353.1 357.3 376.1 3,631.4 3,512.4 3,684.0 10.28 9.83 9.80
Source: Indian Horticulture Database, 2006
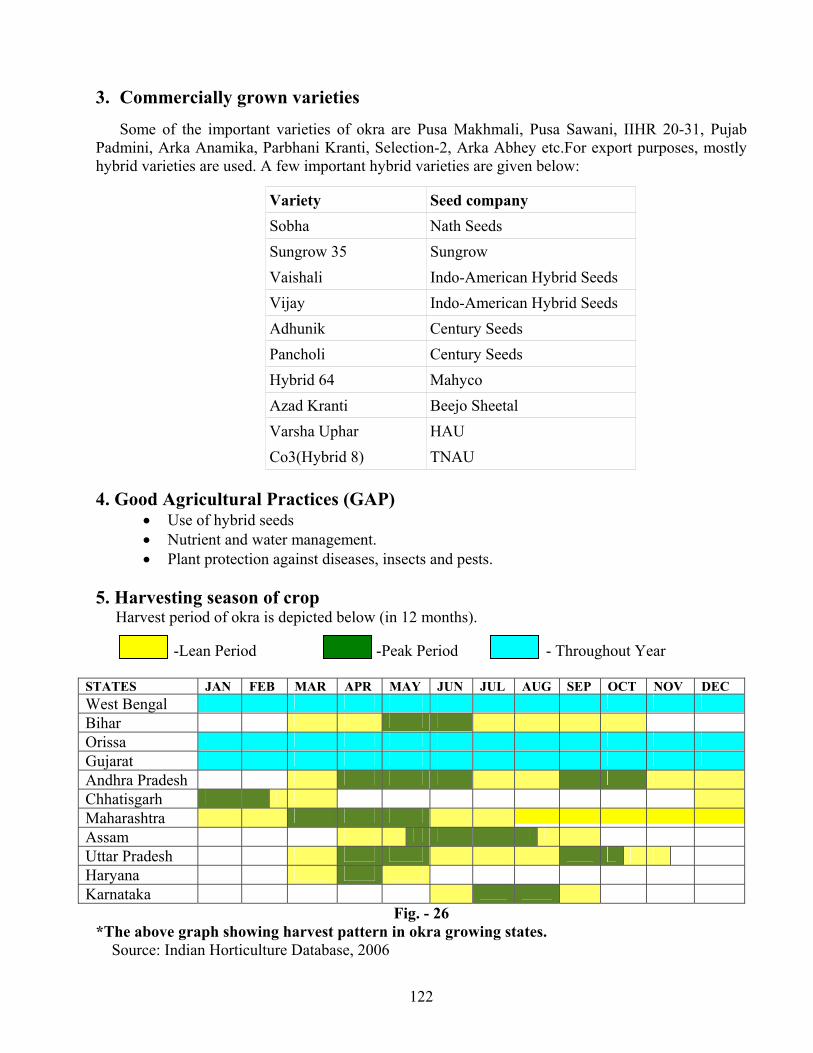
122
3. Commercially grown varieties
Some of the important varieties of okra are Pusa Makhmali, Pusa Sawani, IIHR 20-31, Pujab Padmini, Arka Anamika, Parbhani Kranti, Selection-2, Arka Abhey etc.For export purposes, mostly hybrid varieties are used. A few important hybrid varieties are given below:
Variety Seed company Sobha Nath Seeds Sungrow 35 Sungrow Vaishali Indo-American Hybrid Seeds Vijay Indo-American Hybrid Seeds Adhunik Century Seeds Pancholi Century Seeds Hybrid 64 Mahyco Azad Kranti Beejo Sheetal Varsha Uphar HAU Co3(Hybrid 8) TNAU
4. Good Agricultural Practices (GAP)
• Use of hybrid seeds • Nutrient and water management. • Plant protection against diseases, insects and pests.
5. Harvesting season of crop Harvest period of okra is depicted below (in 12 months).
-Lean Period -Peak Period - Throughout Year
STATES JAN FEB MAR APR MAY JUN JUL AUG SEP OCT NOV DEC West Bengal Bihar Orissa Gujarat Andhra Pradesh Chhatisgarh Maharashtra Assam Uttar Pradesh Haryana Karnataka
Fig. - 26 *The above graph showing harvest pattern in okra growing states. Source: Indian Horticulture Database, 2006
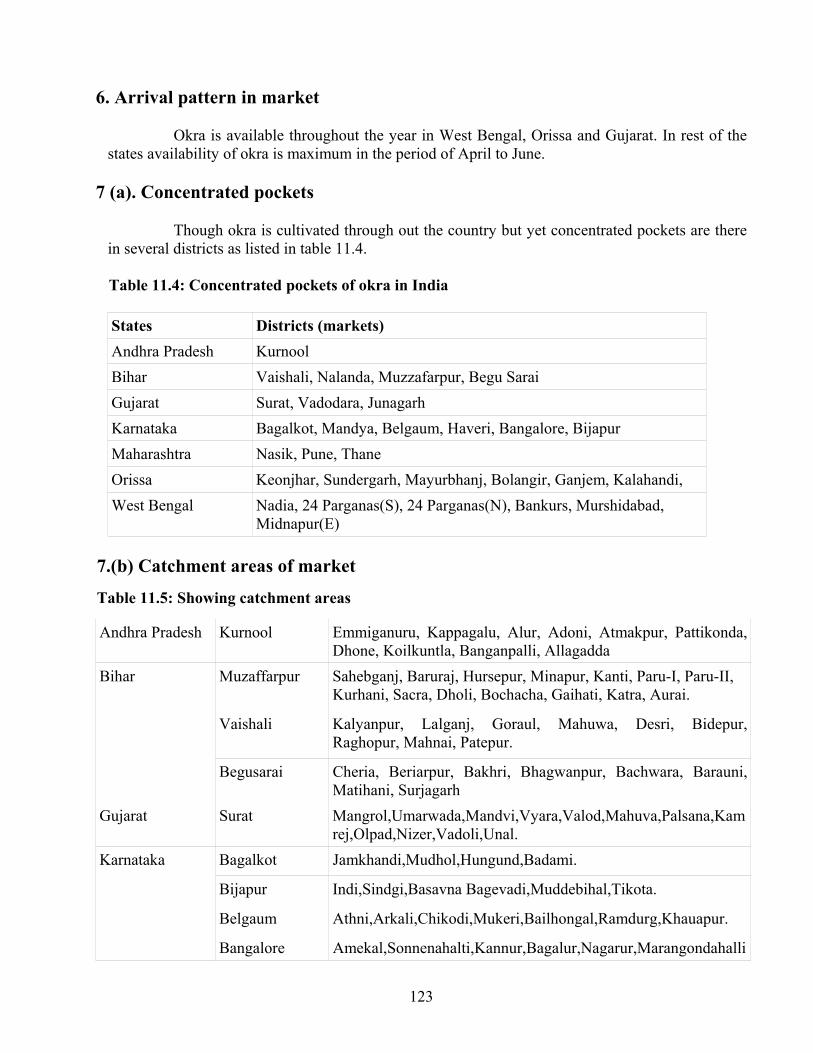
123
6. Arrival pattern in market Okra is available throughout the year in West Bengal, Orissa and Gujarat. In rest of the states availability of okra is maximum in the period of April to June.
7 (a). Concentrated pockets
Though okra is cultivated through out the country but yet concentrated pockets are there in several districts as listed in table 11.4.
Table 11.4: Concentrated pockets of okra in India
States Districts (markets) Andhra Pradesh Kurnool Bihar Vaishali, Nalanda, Muzzafarpur, Begu Sarai Gujarat Surat, Vadodara, Junagarh Karnataka Bagalkot, Mandya, Belgaum, Haveri, Bangalore, Bijapur Maharashtra Nasik, Pune, Thane Orissa Keonjhar, Sundergarh, Mayurbhanj, Bolangir, Ganjem, Kalahandi, West Bengal Nadia, 24 Parganas(S), 24 Parganas(N), Bankurs, Murshidabad,
Midnapur(E) 7.(b) Catchment areas of market Table 11.5: Showing catchment areas
Andhra Pradesh Kurnool Emmiganuru, Kappagalu, Alur, Adoni, Atmakpur, Pattikonda, Dhone, Koilkuntla, Banganpalli, Allagadda
Muzaffarpur Sahebganj, Baruraj, Hursepur, Minapur, Kanti, Paru-I, Paru-II, Kurhani, Sacra, Dholi, Bochacha, Gaihati, Katra, Aurai.
Vaishali Kalyanpur, Lalganj, Goraul, Mahuwa, Desri, Bidepur, Raghopur, Mahnai, Patepur.
Bihar
Begusarai Cheria, Beriarpur, Bakhri, Bhagwanpur, Bachwara, Barauni, Matihani, Surjagarh
Gujarat Surat Mangrol,Umarwada,Mandvi,Vyara,Valod,Mahuva,Palsana,Kamrej,Olpad,Nizer,Vadoli,Unal.
Bagalkot Jamkhandi,Mudhol,Hungund,Badami.
Bijapur Indi,Sindgi,Basavna Bagevadi,Muddebihal,Tikota.
Belgaum Athni,Arkali,Chikodi,Mukeri,Bailhongal,Ramdurg,Khauapur.
Karnataka
Bangalore Amekal,Sonnenahalti,Kannur,Bagalur,Nagarur,Marangondahalli
124
,Haralur,Mantapa,Solurur,Chandapur. Nasik Kalvan,Peint,Igatpuri,Sinnar,Niphad,Yeola,Nandgaon,Satara,
Furgana,Dindori,Melgaon, Maharashtra
Pune Junnar, Ambegaon, Ghod, Rajgurunagar, Wadgaonsirur, Mulshi, Welhe, Purandhar, Bhor, Baramati, Indapur, Daund, Saswad
Sundergarh Hemagiri, Banel, Panposh, Raj Gangpur,
Mayurbhanj Baripada, Rairangpur, Karanjia, Udala, Betnoti
Orissa
Kalahandi Dharamgarh, Bhawanipatna, Lanjigarh, Jayapatna Murshidabad Suti, Jangipur, Raghunathganj, Lalgola, Bbhagwangola,
Sagardighi, Jiaganj, Lalbagh, Domkal, Bahranpur, Hariharpura, Belaanga, Nawada ,Bharatpura, Barwan, Khargram
West Bengal
Nadia Karimpur, Tehata, Kaliganj, Nakasipara, Chapra, Krishnanagar, Shantipur, Ranaghat, Chakdaha, Kalyani.
8. Criteria and description of grades Codex standards for okra are not yet published, but okra to be exported should be 3-5 inches in length, green and tender. 9. Packaging and its details For export purposes, okra is packed in consumer packs of LDPE or PP (polypropylene). Twenty consumer packs of 250 gm are placed in 2X2X5 pattern in a 5 Kg CFB box. The specification details of the box are given below in table 11.6. Table 11.6: Specification details for Corrugated Fiber Board (CFB) Boxes for packing
{5 Kg Box (Dimension : 450X265X110 mm)}
S.No. Specification Slide Type
Ring *Flap Tuck-In-Type
RSC(regular slotted container)
Tray with LID
1. Material for construction
5-ply CFB 5-ply CFB 5-ply CFB 5-ply CFB
2. Grammage (g/m sq.)(outer to inner)
*230X140 X140X140
*230X140 X140X140
*230X140 X140X140
*230X140 X140X140
3. Bursting strength kg/cm sq.
Min. 10.00 Min. 10.00 Min. 10.00 Min. 10.00
4. Puncture resistance inches/teat inch
Min..250 Min..250 Min..250 Min..250
5. Compression strength Kg.
Min.350 Min.350 Min.350 Min.350
6. Cobb (30 minutes g/m sq.)
Max.130 Max.130 Max.130 Max.130
*Outer ply of white duplex board Source: Post –Harvest Manuals on Exports of Fruits, APEDA, New Delhi
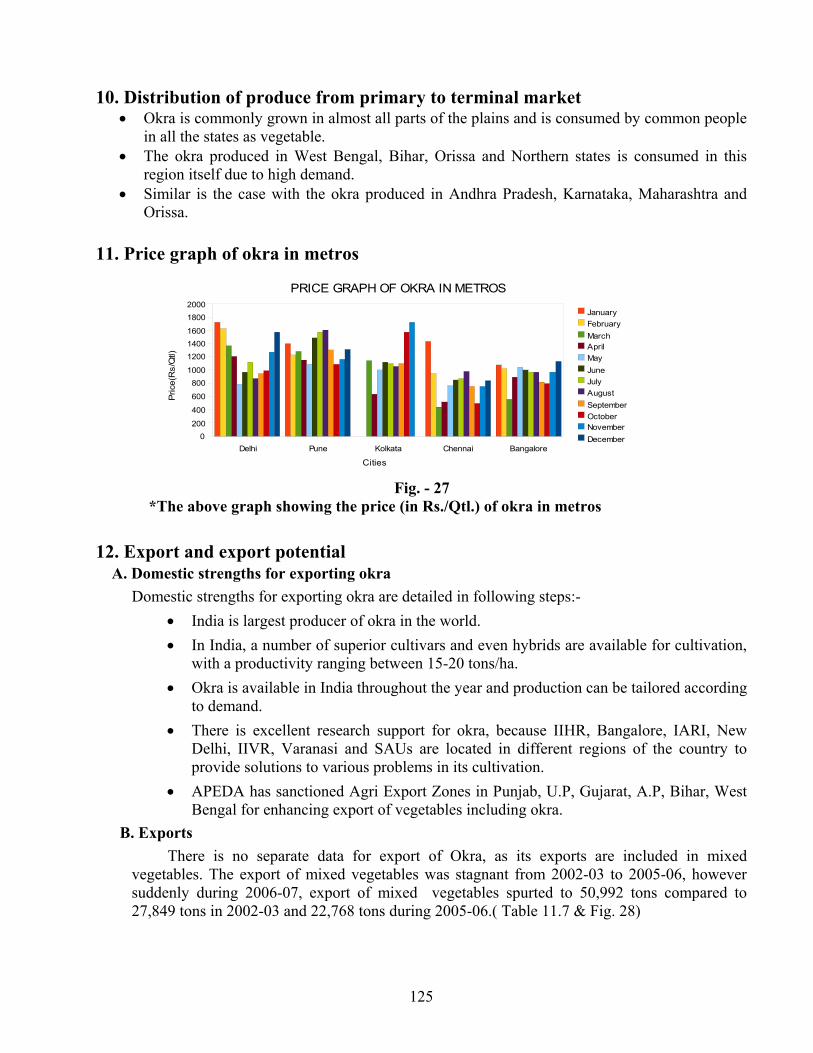
125
10. Distribution of produce from primary to terminal market • Okra is commonly grown in almost all parts of the plains and is consumed by common people
in all the states as vegetable. • The okra produced in West Bengal, Bihar, Orissa and Northern states is consumed in this
region itself due to high demand. • Similar is the case with the okra produced in Andhra Pradesh, Karnataka, Maharashtra and
Orissa. 11. Price graph of okra in metros
Fig. - 27 *The above graph showing the price (in Rs./Qtl.) of okra in metros 12. Export and export potential A. Domestic strengths for exporting okra Domestic strengths for exporting okra are detailed in following steps:-
• India is largest producer of okra in the world. • In India, a number of superior cultivars and even hybrids are available for cultivation,
with a productivity ranging between 15-20 tons/ha. • Okra is available in India throughout the year and production can be tailored according
to demand. • There is excellent research support for okra, because IIHR, Bangalore, IARI, New
Delhi, IIVR, Varanasi and SAUs are located in different regions of the country to provide solutions to various problems in its cultivation.
• APEDA has sanctioned Agri Export Zones in Punjab, U.P, Gujarat, A.P, Bihar, West Bengal for enhancing export of vegetables including okra.
B. Exports There is no separate data for export of Okra, as its exports are included in mixed
vegetables. The export of mixed vegetables was stagnant from 2002-03 to 2005-06, however suddenly during 2006-07, export of mixed vegetables spurted to 50,992 tons compared to 27,849 tons in 2002-03 and 22,768 tons during 2005-06.( Table 11.7 & Fig. 28)
Delhi Pune Kolkata Chennai Bangalore0
200
400
600
8001000
120014001600
18002000
PRICE GRAPH OF OKRA IN METROS
JanuaryFebruaryMarchAprilMayJuneJulyAugustSeptemberOctoberNovemberDecember
Cities
Pric
e(R
s/Q
tl)
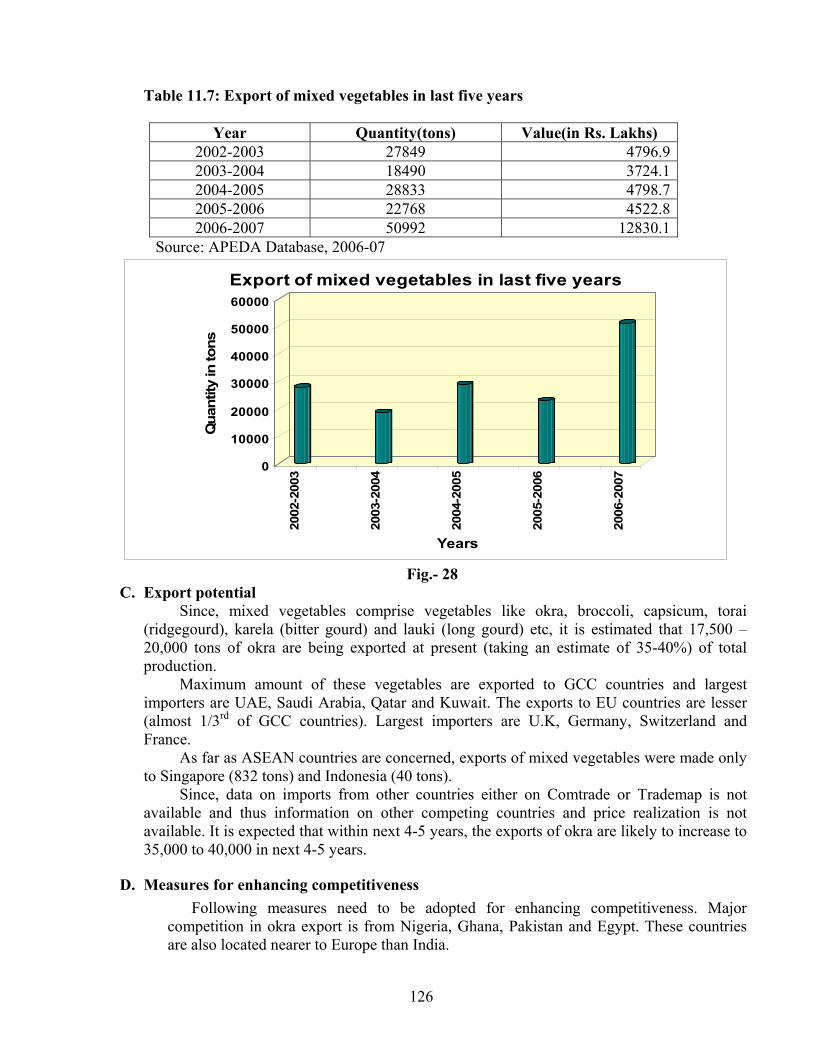
126
Table 11.7: Export of mixed vegetables in last five years
Year Quantity(tons) Value(in Rs. Lakhs) 2002-2003 27849 4796.92003-2004 18490 3724.12004-2005 28833 4798.72005-2006 22768 4522.82006-2007 50992 12830.1
Source: APEDA Database, 2006-07
0
10000
20000
30000
40000
50000
60000
Qua
ntity
in to
ns
2002
-200
3
2003
-200
4
2004
-200
5
2005
-200
6
2006
-200
7
Years
Export of mixed vegetables in last five years
Fig.- 28
C. Export potential Since, mixed vegetables comprise vegetables like okra, broccoli, capsicum, torai
(ridgegourd), karela (bitter gourd) and lauki (long gourd) etc, it is estimated that 17,500 – 20,000 tons of okra are being exported at present (taking an estimate of 35-40%) of total production.
Maximum amount of these vegetables are exported to GCC countries and largest importers are UAE, Saudi Arabia, Qatar and Kuwait. The exports to EU countries are lesser (almost 1/3rd of GCC countries). Largest importers are U.K, Germany, Switzerland and France.
As far as ASEAN countries are concerned, exports of mixed vegetables were made only to Singapore (832 tons) and Indonesia (40 tons).
Since, data on imports from other countries either on Comtrade or Trademap is not available and thus information on other competing countries and price realization is not available. It is expected that within next 4-5 years, the exports of okra are likely to increase to 35,000 to 40,000 in next 4-5 years.
D. Measures for enhancing competitiveness Following measures need to be adopted for enhancing competitiveness. Major competition in okra export is from Nigeria, Ghana, Pakistan and Egypt. These countries are also located nearer to Europe than India.
127
• India must increase the productivity and enhance the quality, so that India can make quality product available at a competitive price.
• Freshness and eye appeal must be enhanced in the product in order to be competitive.
• Packing should also be effective and attractive. • Farmers need to be trained on quality requirements of importing countries. • India must brand its product. • Markets need to be nurtured on a regular basis.
13. Storage Temperature : 7.5 -10°C
Relative Humidity : 90-95%
Storage period : 1-2 weeks
14. Documents required for exports a) Documents related to goods
a) Invoice b) Packing List c) Certificate of origin
b) Documents related to shipment
a) Mate Receipt b) Shipping Bill c) Bill of handing d) Airway Bill
c) Documents related to Payment
a) Letter of Credit (L/C) b) Bill of Exchange
d) Documents related to quality of goods
a) Phytosanitary Certificate b) GLOBALGAP Certification c) Health Certificate
e) Organic Certification
- Certificate indicating material produce is based on organic farming.
f) Documents related to Foreign Exchange Regulations
GR Form: Documents required by RBI which assures to RBI that the exporter will realize the
proceeds of goods within 180 days from the date of Shipment.
g) Other Document
Bank Realization Certification (BRC): This is the advice given by Foreign Exchange Bank after the realization of money from Importer
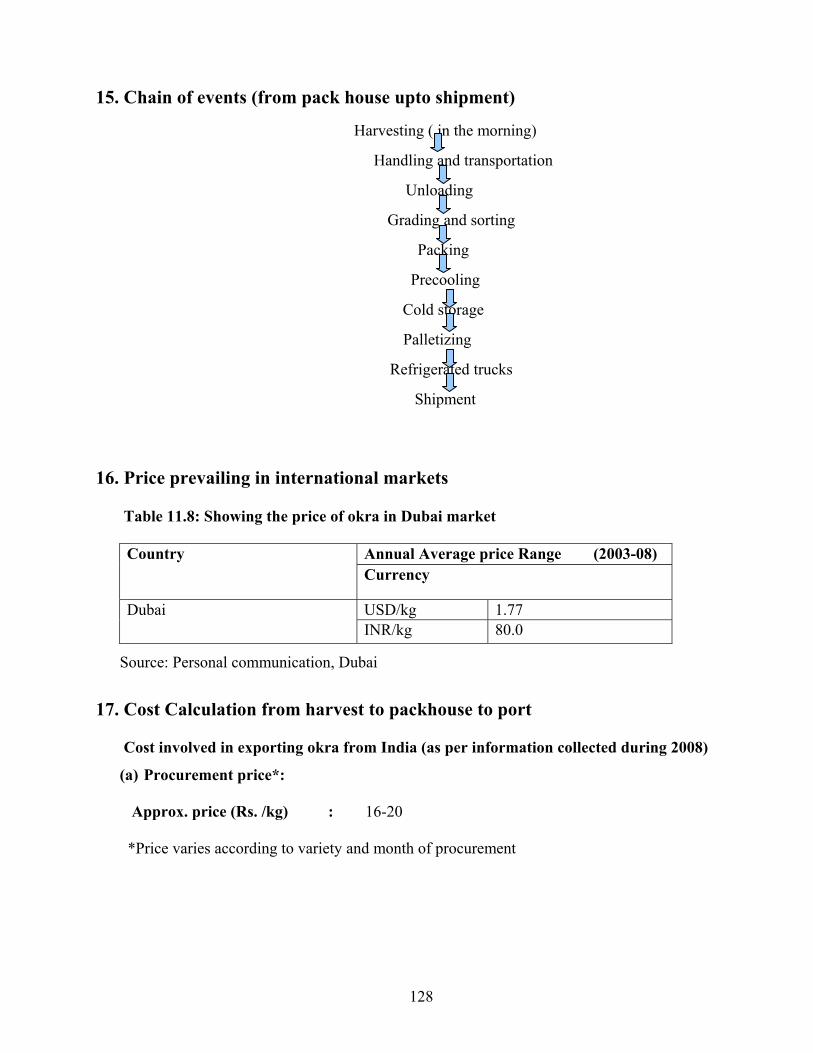
128
15. Chain of events (from pack house upto shipment)
Harvesting ( in the morning)
Handling and transportation
Unloading
Grading and sorting
Packing
Precooling
Cold storage
Palletizing
Refrigerated trucks
Shipment
16. Price prevailing in international markets
Table 11.8: Showing the price of okra in Dubai market
Annual Average price Range (2003-08) Country Currency
USD/kg 1.77 Dubai INR/kg 80.0
Source: Personal communication, Dubai
17. Cost Calculation from harvest to packhouse to port Cost involved in exporting okra from India (as per information collected during 2008)
(a) Procurement price*: Approx. price (Rs. /kg) : 16-20 *Price varies according to variety and month of procurement
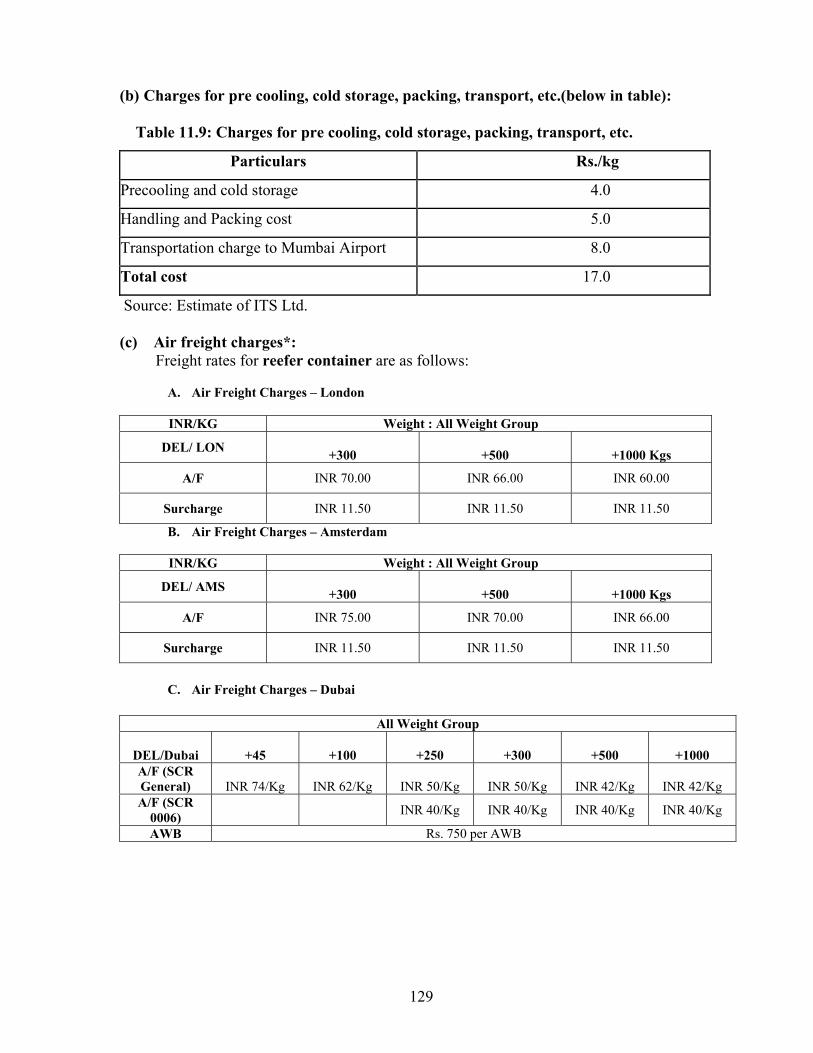
129
(b) Charges for pre cooling, cold storage, packing, transport, etc.(below in table):
Table 11.9: Charges for pre cooling, cold storage, packing, transport, etc.
Particulars Rs./kg
Precooling and cold storage 4.0
Handling and Packing cost 5.0
Transportation charge to Mumbai Airport 8.0
Total cost 17.0
Source: Estimate of ITS Ltd.
(c) Air freight charges*: Freight rates for reefer container are as follows:
A. Air Freight Charges – London
INR/KG Weight : All Weight Group
DEL/ LON +300 +500 +1000 Kgs
A/F INR 70.00 INR 66.00 INR 60.00
Surcharge INR 11.50 INR 11.50 INR 11.50
B. Air Freight Charges – Amsterdam
INR/KG Weight : All Weight Group
DEL/ AMS +300 +500 +1000 Kgs
A/F INR 75.00 INR 70.00 INR 66.00
Surcharge INR 11.50 INR 11.50 INR 11.50
C. Air Freight Charges – Dubai
All Weight Group
DEL/Dubai +45 +100 +250 +300 +500 +1000 A/F (SCR General) INR 74/Kg INR 62/Kg INR 50/Kg INR 50/Kg INR 42/Kg INR 42/Kg A/F (SCR
0006) INR 40/Kg INR 40/Kg INR 40/Kg INR 40/Kg
AWB Rs. 750 per AWB
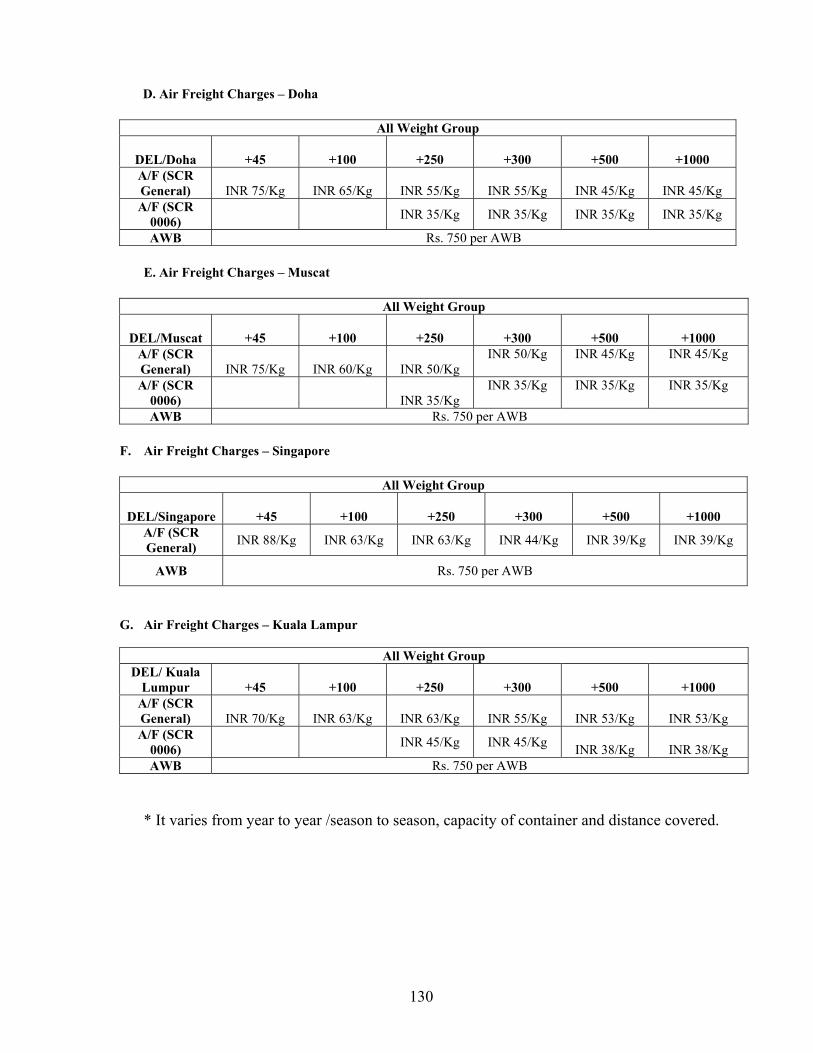
130
D. Air Freight Charges – Doha
All Weight Group
DEL/Doha +45 +100 +250 +300 +500 +1000 A/F (SCR General) INR 75/Kg INR 65/Kg INR 55/Kg INR 55/Kg INR 45/Kg INR 45/Kg A/F (SCR
0006) INR 35/Kg INR 35/Kg INR 35/Kg INR 35/Kg
AWB Rs. 750 per AWB E. Air Freight Charges – Muscat
All Weight Group
DEL/Muscat +45 +100 +250 +300 +500 +1000 A/F (SCR General) INR 75/Kg INR 60/Kg INR 50/Kg
INR 50/Kg INR 45/Kg INR 45/Kg
A/F (SCR 0006) INR 35/Kg
INR 35/Kg INR 35/Kg INR 35/Kg
AWB Rs. 750 per AWB
F. Air Freight Charges – Singapore
All Weight Group
DEL/Singapore +45 +100 +250 +300 +500 +1000 A/F (SCR General) INR 88/Kg INR 63/Kg INR 63/Kg INR 44/Kg INR 39/Kg INR 39/Kg
AWB Rs. 750 per AWB
G. Air Freight Charges – Kuala Lampur
All Weight Group DEL/ Kuala
Lumpur +45 +100 +250 +300 +500 +1000 A/F (SCR General) INR 70/Kg INR 63/Kg INR 63/Kg INR 55/Kg INR 53/Kg INR 53/Kg A/F (SCR
0006) INR 45/Kg INR 45/Kg INR 38/Kg INR 38/Kg AWB Rs. 750 per AWB
* It varies from year to year /season to season, capacity of container and distance covered.
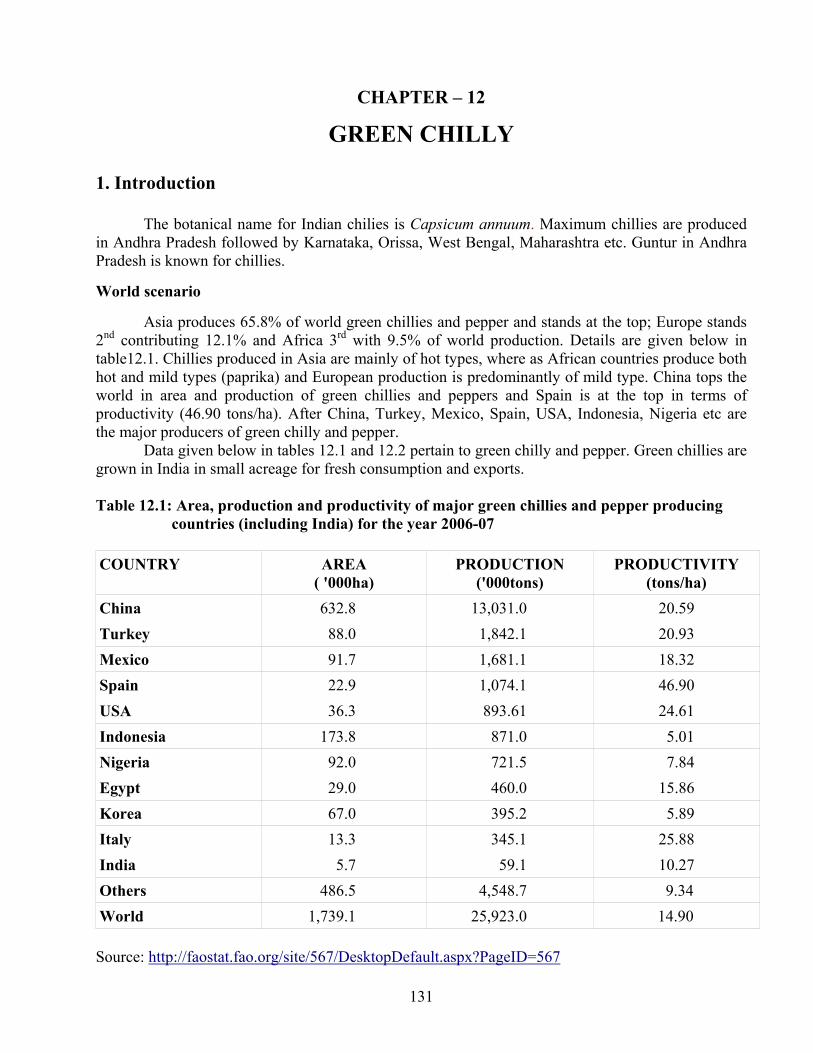
131
CHAPTER – 12
GREEN CHILLY
1. Introduction
The botanical name for Indian chilies is Capsicum annuum. Maximum chillies are produced in Andhra Pradesh followed by Karnataka, Orissa, West Bengal, Maharashtra etc. Guntur in Andhra Pradesh is known for chillies. World scenario
Asia produces 65.8% of world green chillies and pepper and stands at the top; Europe stands 2nd contributing 12.1% and Africa 3rd with 9.5% of world production. Details are given below in table12.1. Chillies produced in Asia are mainly of hot types, where as African countries produce both hot and mild types (paprika) and European production is predominantly of mild type. China tops the world in area and production of green chillies and peppers and Spain is at the top in terms of productivity (46.90 tons/ha). After China, Turkey, Mexico, Spain, USA, Indonesia, Nigeria etc are the major producers of green chilly and pepper.
Data given below in tables 12.1 and 12.2 pertain to green chilly and pepper. Green chillies are grown in India in small acreage for fresh consumption and exports. Table 12.1: Area, production and productivity of major green chillies and pepper producing countries (including India) for the year 2006-07 COUNTRY AREA
( '000ha) PRODUCTION
('000tons) PRODUCTIVITY
(tons/ha) China 632.8 13,031.0 20.59 Turkey 88.0 1,842.1 20.93 Mexico 91.7 1,681.1 18.32 Spain 22.9 1,074.1 46.90 USA 36.3 893.61 24.61 Indonesia 173.8 871.0 5.01 Nigeria 92.0 721.5 7.84 Egypt 29.0 460.0 15.86 Korea 67.0 395.2 5.89 Italy 13.3 345.1 25.88 India 5.7 59.1 10.27 Others 486.5 4,548.7 9.34 World 1,739.1 25,923.0 14.90 Source: http://faostat.fao.org/site/567/DesktopDefault.aspx?PageID=567
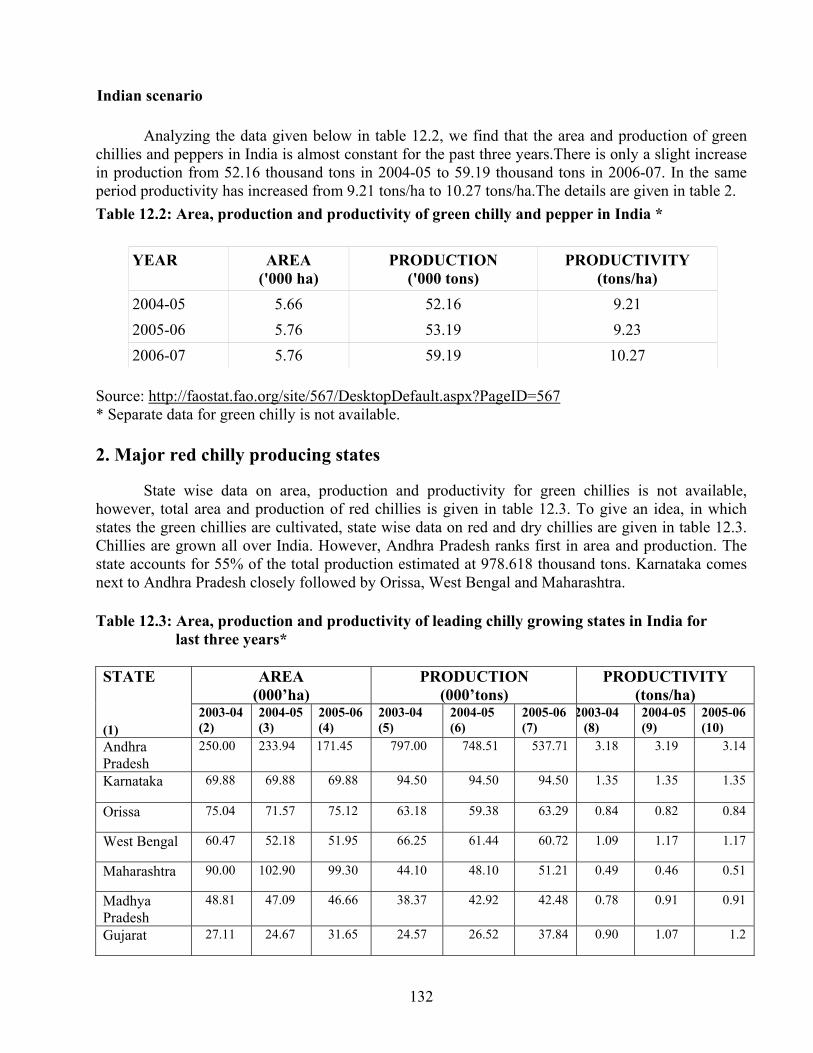
132
Indian scenario
Analyzing the data given below in table 12.2, we find that the area and production of green chillies and peppers in India is almost constant for the past three years.There is only a slight increase in production from 52.16 thousand tons in 2004-05 to 59.19 thousand tons in 2006-07. In the same period productivity has increased from 9.21 tons/ha to 10.27 tons/ha.The details are given in table 2. Table 12.2: Area, production and productivity of green chilly and pepper in India *
YEAR AREA ('000 ha)
PRODUCTION ('000 tons)
PRODUCTIVITY (tons/ha)
2004-05 5.66 52.16 9.21 2005-06 5.76 53.19 9.23 2006-07 5.76 59.19 10.27
Source: http://faostat.fao.org/site/567/DesktopDefault.aspx?PageID=567 * Separate data for green chilly is not available. 2. Major red chilly producing states
State wise data on area, production and productivity for green chillies is not available, however, total area and production of red chillies is given in table 12.3. To give an idea, in which states the green chillies are cultivated, state wise data on red and dry chillies are given in table 12.3. Chillies are grown all over India. However, Andhra Pradesh ranks first in area and production. The state accounts for 55% of the total production estimated at 978.618 thousand tons. Karnataka comes next to Andhra Pradesh closely followed by Orissa, West Bengal and Maharashtra. Table 12.3: Area, production and productivity of leading chilly growing states in India for last three years*
AREA (000’ha)
PRODUCTION (000’tons)
PRODUCTIVITY (tons/ha)
STATE (1)
2003-04 (2)
2004-05 (3)
2005-06 (4)
2003-04 (5)
2004-05 (6)
2005-06 (7)
2003-04 (8)
2004-05 (9)
2005-06 (10)
Andhra Pradesh
250.00 233.94 171.45 797.00 748.51 537.71 3.18 3.19 3.14
Karnataka 69.88 69.88 69.88 94.50 94.50 94.50 1.35 1.35 1.35
Orissa 75.04 71.57 75.12 63.18 59.38 63.29 0.84 0.82 0.84
West Bengal 60.47 52.18 51.95 66.25 61.44 60.72 1.09 1.17 1.17
Maharashtra 90.00 102.90 99.30 44.10 48.10 51.21 0.49 0.46 0.51
Madhya Pradesh
48.81 47.09 46.66 38.37 42.92 42.48 0.78 0.91 0.91
Gujarat 27.11 24.67 31.65 24.57 26.52 37.84 0.90 1.07 1.2
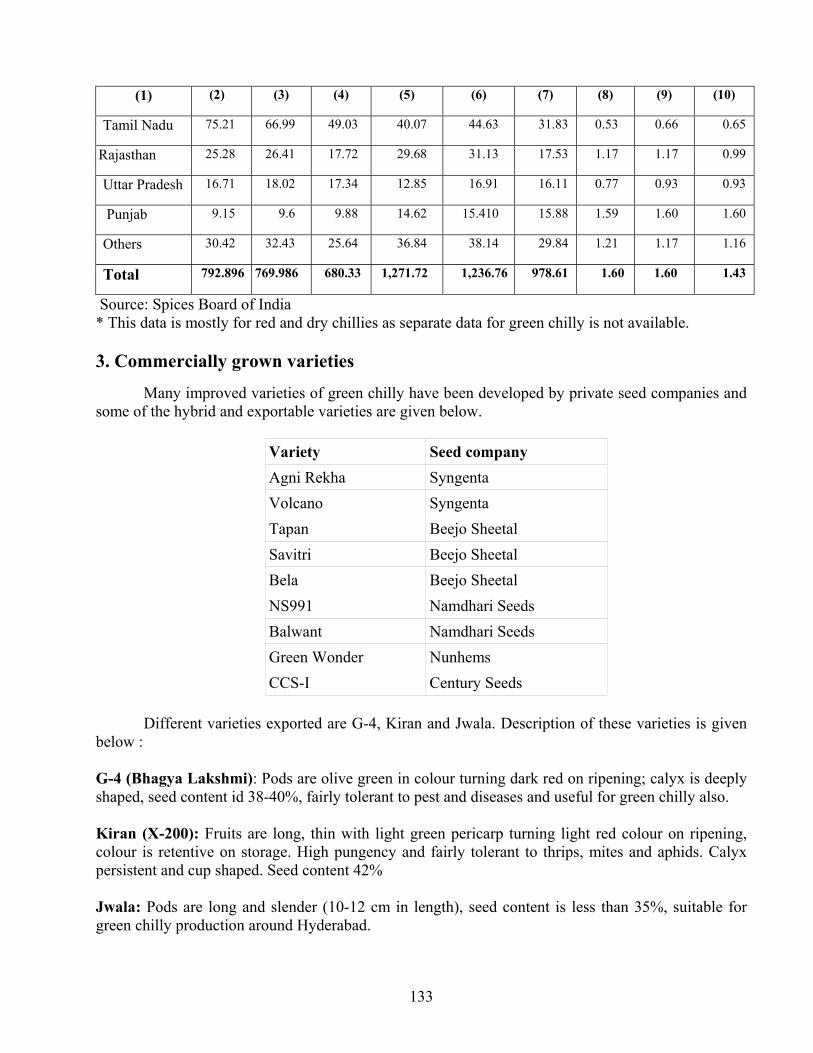
133
(1) (2) (3) (4) (5) (6) (7) (8) (9) (10)
Tamil Nadu 75.21 66.99 49.03 40.07 44.63 31.83 0.53 0.66 0.65
Rajasthan 25.28 26.41 17.72 29.68 31.13 17.53 1.17 1.17 0.99
Uttar Pradesh 16.71 18.02 17.34 12.85 16.91 16.11 0.77 0.93 0.93
Punjab 9.15 9.6 9.88 14.62 15.410 15.88 1.59 1.60 1.60
Others 30.42 32.43 25.64 36.84 38.14 29.84 1.21 1.17 1.16
Total 792.896 769.986 680.33 1,271.72 1,236.76 978.61 1.60 1.60 1.43
Source: Spices Board of India * This data is mostly for red and dry chillies as separate data for green chilly is not available. 3. Commercially grown varieties
Many improved varieties of green chilly have been developed by private seed companies and some of the hybrid and exportable varieties are given below.
Variety Seed company Agni Rekha Syngenta Volcano Syngenta Tapan Beejo Sheetal Savitri Beejo Sheetal Bela Beejo Sheetal NS991 Namdhari Seeds Balwant Namdhari Seeds Green Wonder Nunhems CCS-I Century Seeds
Different varieties exported are G-4, Kiran and Jwala. Description of these varieties is given
below : G-4 (Bhagya Lakshmi): Pods are olive green in colour turning dark red on ripening; calyx is deeply shaped, seed content id 38-40%, fairly tolerant to pest and diseases and useful for green chilly also. Kiran (X-200): Fruits are long, thin with light green pericarp turning light red colour on ripening, colour is retentive on storage. High pungency and fairly tolerant to thrips, mites and aphids. Calyx persistent and cup shaped. Seed content 42% Jwala: Pods are long and slender (10-12 cm in length), seed content is less than 35%, suitable for green chilly production around Hyderabad.
134
4. Good Agricultural Practices (GAP)
• Adoption of improved varieties. • Integrated nutrient and water management. • Integrated pest and disease management.
5. Harvesting season The crop is harvested throughout the year.
6. Arrival pattern Green chillies are available in the market throughout the year.
7. (a) Concentrated pockets
The details of the concentrated pockets of red and dry chilly in different states are given below in table 12.4. Green chilly is also cultivated additionally in these concentrated pockets.
Table 12.4: Showing concentrated pockets of chilly in India
States Concentrated pockets Assam Nalbari, Darrang, Dhubri, Nagaon, Sonitpur Meghalaya West Garo Hills, South Garo Hills, North Garo Hills Andhra Pradesh Cuddapah, Adilabad, Medak, Nizamabad, Guntur Gujarat Banskantha, Jamnagar, Junagarh, Rajkot Manipur Imphal, Churchandpur, Thoubal Nagaland Kohima, Dimapur, Phek, Wokha, Mokokchang, Mon Zuenhoboto Karnataka Belgaum, Dharwad, Gadag, Bijapur, Davangere, Raichur, Bangalore,
Haveri Tamil Nadu Coimbatore, Salem, Dindigul, Thruvallar, Thiruchapalli, Ramanthpuram,
Sivanagar, Karur, Namakkal, Dharampuri, Virudhnagar Maharashtra Nasik, Pune 7. (b) Catchment areas feeding the market
Table 12.5: Showing the details of catchment areas of markets of red and dry chilly in leading states.Green chilly is also cultivated in these catchment areas.
States Districts (market) Blocks Assam Nagaon Koliabor,Dhing,Samaguri,Raha,Jamunamukh,Murajhar,Lanka
,Lumding. Meghalaya West Garo Hills Phulbani,Rongamachokgiri,Rabbigiri,Kherapara,Rongohugui,
Selsella, Tura, Batasing,Dalu.

135
Andhra Pradesh
Guntur Tangeda,Dachepalle,Piduguralla,Sattenapalie,Vinkoda,Ponnuru,Bapatia, Narasaraopet,Purti,Prattipadu,Pallapatla.
Jamnagar
Jodia,Kalavad, Jamjodhpur, Bhavad, Kalyanpur, Dwarka, Khambalia,Dhrol.
Gujarat
Banskantha Tharad, Dhabhar, Devgani, Vodgam, Danta, Vav Thoubal Yairipok,Wangjing,Wabagai,Kakchig. Manipur
Charchandpur Hanglep,Songsan,Tinaong,Senvon,Hanship ,Molnom, Thinghat, Mulanil,Hangtam.
Nasik
Kalvan,Peint,Igatpuri,Sinnar,Niphad,Yeola,Nandgaon,Satara,Furgana, Dindori,Melgaon,
Maharashtra
Pune Junnar,Ambegaon,Ghod,Rajgurunagar,Wadgaonsirur,Mulshi,Welhe, Purandhar,Bhor,Baramati,Indapur,Daund,Saswad
Bijapur Indi,Sindgi,Basavna Bagevadi,Muddebihal,Tikota.
Belgaum Athni,Arkali,Chikodi,Mukeri,Bailhongal,Ramdurg,Khauapur.
Karnataka
Bangalore Amekal,Sonnenahalti,Kannur,Bagalur,Nagarur,Marangondahalli,Haralur,Mantapa,Solurur,Chandapur.
Thiruchirapalli Turaiyur, Thottiyam, Musiri, Manachanallur, Lalgudi, i
Coimbatore Muttuppalaiyam, Avinashi, Tiruppur, Palladam, Udumallaippettai, Pollachi, Valparai.
Tamil Nadu
Salem Mettur, Yercaud, Idappadi, Omalpur, Attur, Gangavalli, Sankagiri
8. Criteria and description of grades
Green chilly should be 3-4 inches in length and green. 9. Packaging and its details (a) For export Green chilly is packed in consumer packs of LDPE or PP (polypropylene). Twenty consumer packs of 250 gm capacity are placed in 2X2X5 pattern in a 5Kg CFB box for export purpose. The specification details of the boxes are given below in table 12.6. Table 12.6: Specification details for Corrugated Fiber Board (CFB) Boxes for packing
{5 Kg Box (Dimension: 450X265X110 mm)}
S.No. Specification Slide Type
Ring *Flap Tuck-In-Type
RSC (regular slotted container)
Tray with LID
1. Material for construction
5-ply CFB 5-ply CFB 5-ply CFB 5-ply CFB
2. Grammage (g/m sq.)(outer to inner)
*230X140 X140X140
*230X140 X140X140
*230X140 X140X140
*230X140 X140X140
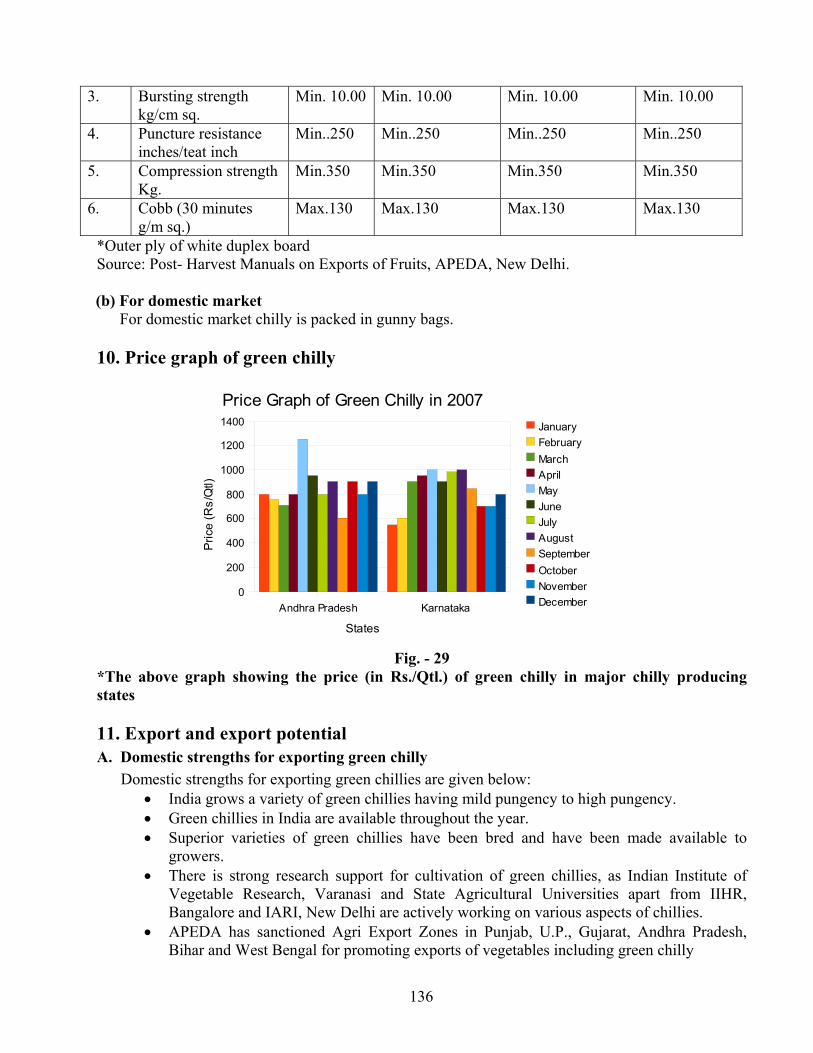
136
3. Bursting strength kg/cm sq.
Min. 10.00 Min. 10.00 Min. 10.00 Min. 10.00
4. Puncture resistance inches/teat inch
Min..250 Min..250 Min..250 Min..250
5. Compression strength Kg.
Min.350 Min.350 Min.350 Min.350
6. Cobb (30 minutes g/m sq.)
Max.130 Max.130 Max.130 Max.130
*Outer ply of white duplex board Source: Post- Harvest Manuals on Exports of Fruits, APEDA, New Delhi. (b) For domestic market For domestic market chilly is packed in gunny bags. 10. Price graph of green chilly
Fig. - 29 *The above graph showing the price (in Rs./Qtl.) of green chilly in major chilly producing states 11. Export and export potential A. Domestic strengths for exporting green chilly Domestic strengths for exporting green chillies are given below:
• India grows a variety of green chillies having mild pungency to high pungency. • Green chillies in India are available throughout the year. • Superior varieties of green chillies have been bred and have been made available to
growers. • There is strong research support for cultivation of green chillies, as Indian Institute of
Vegetable Research, Varanasi and State Agricultural Universities apart from IIHR, Bangalore and IARI, New Delhi are actively working on various aspects of chillies.
• APEDA has sanctioned Agri Export Zones in Punjab, U.P., Gujarat, Andhra Pradesh, Bihar and West Bengal for promoting exports of vegetables including green chilly
Andhra Pradesh Karnataka 0
200
400
600
800
1000
1200
1400
Price Graph of Green Chilly in 2007JanuaryFebruaryMarchAprilMayJuneJulyAugustSeptemberOctoberNovemberDecember
States
Pric
e (R
s/Q
tl)
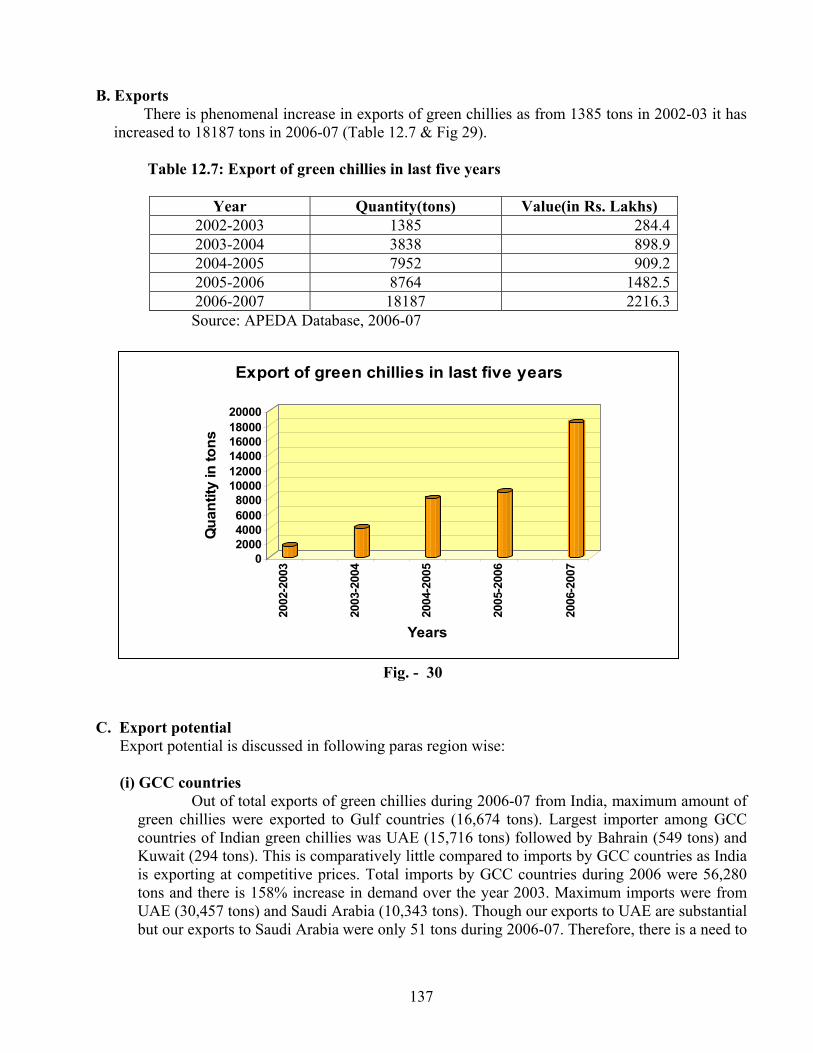
137
B. Exports There is phenomenal increase in exports of green chillies as from 1385 tons in 2002-03 it has increased to 18187 tons in 2006-07 (Table 12.7 & Fig 29). Table 12.7: Export of green chillies in last five years
Year Quantity(tons) Value(in Rs. Lakhs)
2002-2003 1385 284.42003-2004 3838 898.92004-2005 7952 909.22005-2006 8764 1482.52006-2007 18187 2216.3
Source: APEDA Database, 2006-07
02000400060008000
100001200014000160001800020000
Qua
ntity
in to
ns
2002
-200
3
2003
-200
4
2004
-200
5
2005
-200
6
2006
-200
7
Years
Export of green chillies in last five years
Fig. - 30
C. Export potential Export potential is discussed in following paras region wise:
(i) GCC countries
Out of total exports of green chillies during 2006-07 from India, maximum amount of green chillies were exported to Gulf countries (16,674 tons). Largest importer among GCC countries of Indian green chillies was UAE (15,716 tons) followed by Bahrain (549 tons) and Kuwait (294 tons). This is comparatively little compared to imports by GCC countries as India is exporting at competitive prices. Total imports by GCC countries during 2006 were 56,280 tons and there is 158% increase in demand over the year 2003. Maximum imports were from UAE (30,457 tons) and Saudi Arabia (10,343 tons). Though our exports to UAE are substantial but our exports to Saudi Arabia were only 51 tons during 2006-07. Therefore, there is a need to
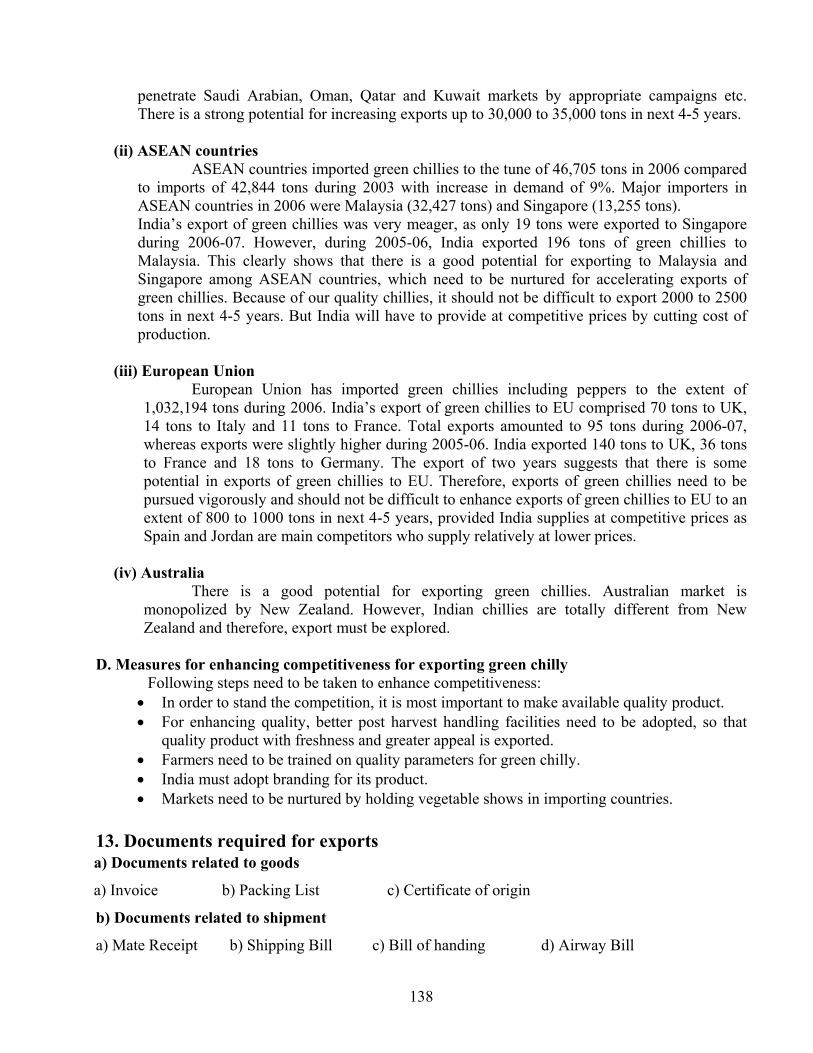
138
penetrate Saudi Arabian, Oman, Qatar and Kuwait markets by appropriate campaigns etc. There is a strong potential for increasing exports up to 30,000 to 35,000 tons in next 4-5 years.
(ii) ASEAN countries
ASEAN countries imported green chillies to the tune of 46,705 tons in 2006 compared to imports of 42,844 tons during 2003 with increase in demand of 9%. Major importers in ASEAN countries in 2006 were Malaysia (32,427 tons) and Singapore (13,255 tons). India’s export of green chillies was very meager, as only 19 tons were exported to Singapore during 2006-07. However, during 2005-06, India exported 196 tons of green chillies to Malaysia. This clearly shows that there is a good potential for exporting to Malaysia and Singapore among ASEAN countries, which need to be nurtured for accelerating exports of green chillies. Because of our quality chillies, it should not be difficult to export 2000 to 2500 tons in next 4-5 years. But India will have to provide at competitive prices by cutting cost of production.
(iii) European Union
European Union has imported green chillies including peppers to the extent of 1,032,194 tons during 2006. India’s export of green chillies to EU comprised 70 tons to UK, 14 tons to Italy and 11 tons to France. Total exports amounted to 95 tons during 2006-07, whereas exports were slightly higher during 2005-06. India exported 140 tons to UK, 36 tons to France and 18 tons to Germany. The export of two years suggests that there is some potential in exports of green chillies to EU. Therefore, exports of green chillies need to be pursued vigorously and should not be difficult to enhance exports of green chillies to EU to an extent of 800 to 1000 tons in next 4-5 years, provided India supplies at competitive prices as Spain and Jordan are main competitors who supply relatively at lower prices.
(iv) Australia
There is a good potential for exporting green chillies. Australian market is monopolized by New Zealand. However, Indian chillies are totally different from New Zealand and therefore, export must be explored.
D. Measures for enhancing competitiveness for exporting green chilly Following steps need to be taken to enhance competitiveness:
• In order to stand the competition, it is most important to make available quality product. • For enhancing quality, better post harvest handling facilities need to be adopted, so that
quality product with freshness and greater appeal is exported. • Farmers need to be trained on quality parameters for green chilly. • India must adopt branding for its product. • Markets need to be nurtured by holding vegetable shows in importing countries.
13. Documents required for exports a) Documents related to goods
a) Invoice b) Packing List c) Certificate of origin
b) Documents related to shipment
a) Mate Receipt b) Shipping Bill c) Bill of handing d) Airway Bill
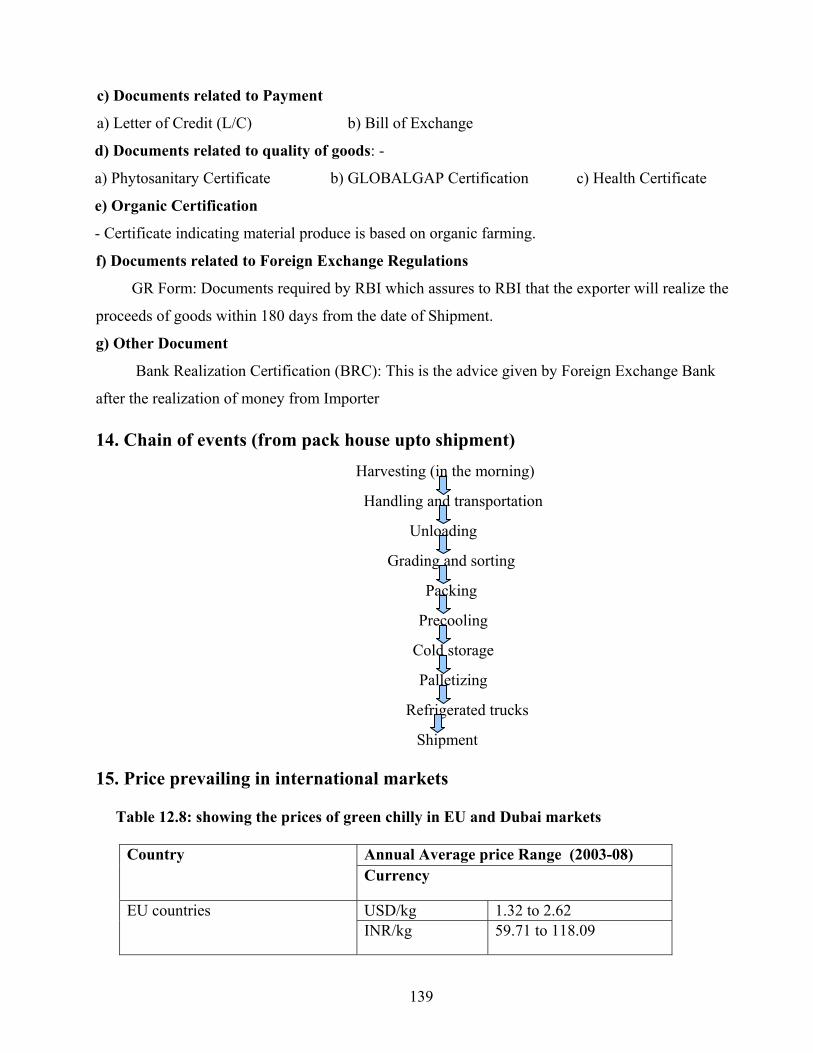
139
c) Documents related to Payment
a) Letter of Credit (L/C) b) Bill of Exchange
d) Documents related to quality of goods: -
a) Phytosanitary Certificate b) GLOBALGAP Certification c) Health Certificate
e) Organic Certification
- Certificate indicating material produce is based on organic farming.
f) Documents related to Foreign Exchange Regulations
GR Form: Documents required by RBI which assures to RBI that the exporter will realize the
proceeds of goods within 180 days from the date of Shipment.
g) Other Document
Bank Realization Certification (BRC): This is the advice given by Foreign Exchange Bank
after the realization of money from Importer
14. Chain of events (from pack house upto shipment) Harvesting (in the morning)
Handling and transportation
Unloading
Grading and sorting
Packing
Precooling
Cold storage
Palletizing
Refrigerated trucks
Shipment
15. Price prevailing in international markets
Table 12.8: showing the prices of green chilly in EU and Dubai markets
Annual Average price Range (2003-08) Country Currency
USD/kg 1.32 to 2.62 EU countries INR/kg 59.71 to 118.09
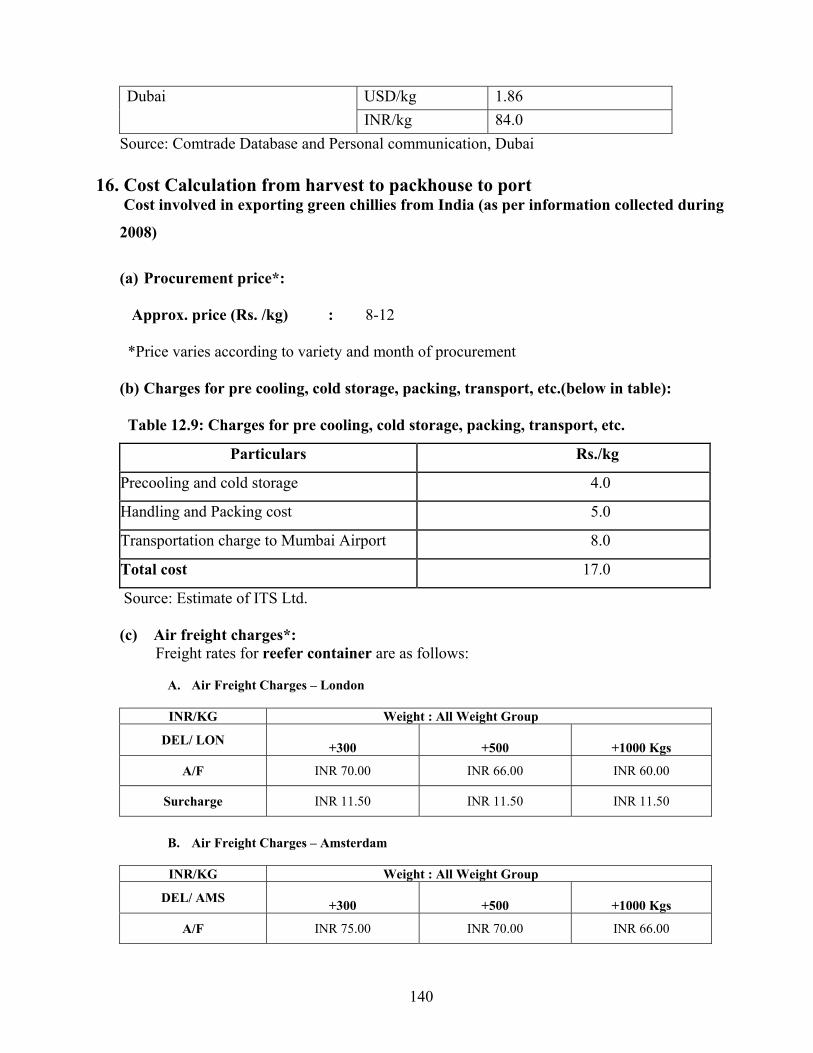
140
USD/kg 1.86 Dubai INR/kg 84.0
Source: Comtrade Database and Personal communication, Dubai 16. Cost Calculation from harvest to packhouse to port
Cost involved in exporting green chillies from India (as per information collected during
2008)
(a) Procurement price*: Approx. price (Rs. /kg) : 8-12 *Price varies according to variety and month of procurement (b) Charges for pre cooling, cold storage, packing, transport, etc.(below in table):
Table 12.9: Charges for pre cooling, cold storage, packing, transport, etc.
Particulars Rs./kg
Precooling and cold storage 4.0
Handling and Packing cost 5.0
Transportation charge to Mumbai Airport 8.0
Total cost 17.0
Source: Estimate of ITS Ltd.
(c) Air freight charges*: Freight rates for reefer container are as follows:
A. Air Freight Charges – London INR/KG Weight : All Weight Group
DEL/ LON +300 +500 +1000 Kgs
A/F INR 70.00 INR 66.00 INR 60.00
Surcharge INR 11.50 INR 11.50 INR 11.50
B. Air Freight Charges – Amsterdam INR/KG Weight : All Weight Group
DEL/ AMS +300 +500 +1000 Kgs
A/F INR 75.00 INR 70.00 INR 66.00
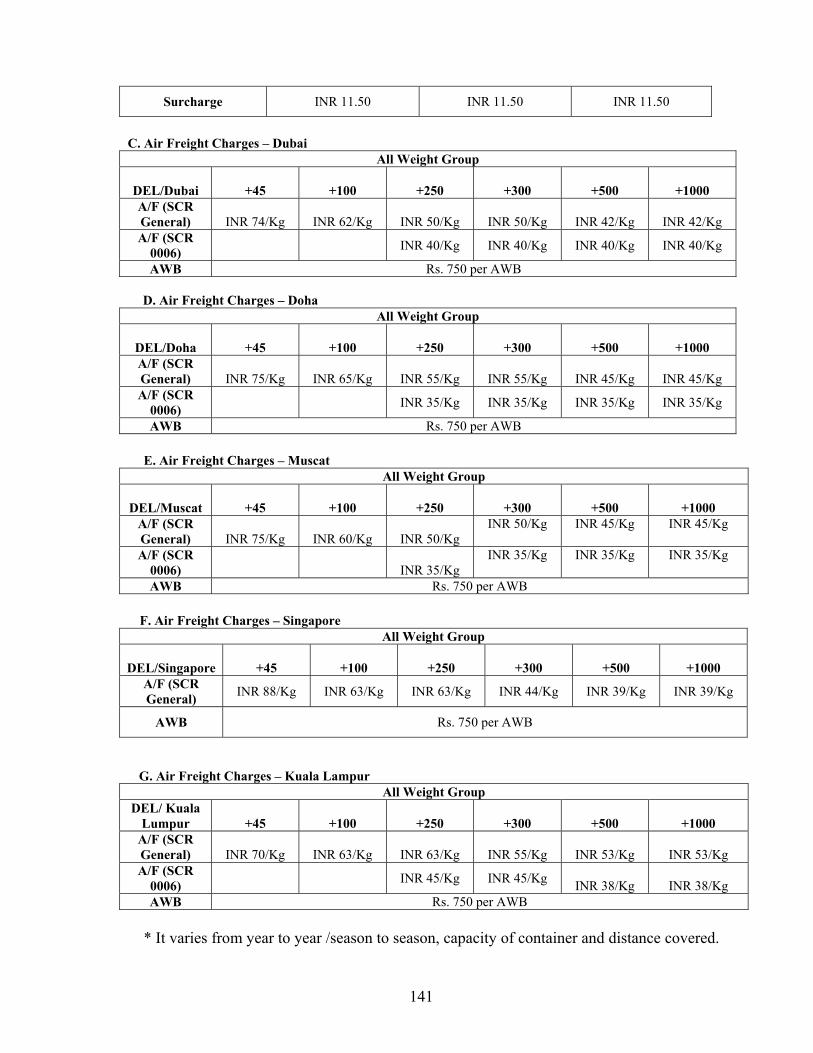
141
Surcharge INR 11.50 INR 11.50 INR 11.50
C. Air Freight Charges – Dubai
All Weight Group
DEL/Dubai +45 +100 +250 +300 +500 +1000 A/F (SCR General) INR 74/Kg INR 62/Kg INR 50/Kg INR 50/Kg INR 42/Kg INR 42/Kg A/F (SCR
0006) INR 40/Kg INR 40/Kg INR 40/Kg INR 40/Kg
AWB Rs. 750 per AWB D. Air Freight Charges – Doha
All Weight Group
DEL/Doha +45 +100 +250 +300 +500 +1000 A/F (SCR General) INR 75/Kg INR 65/Kg INR 55/Kg INR 55/Kg INR 45/Kg INR 45/Kg A/F (SCR
0006) INR 35/Kg INR 35/Kg INR 35/Kg INR 35/Kg
AWB Rs. 750 per AWB E. Air Freight Charges – Muscat
All Weight Group
DEL/Muscat +45 +100 +250 +300 +500 +1000 A/F (SCR General) INR 75/Kg INR 60/Kg INR 50/Kg
INR 50/Kg INR 45/Kg INR 45/Kg
A/F (SCR 0006) INR 35/Kg
INR 35/Kg INR 35/Kg INR 35/Kg
AWB Rs. 750 per AWB F. Air Freight Charges – Singapore
All Weight Group
DEL/Singapore +45 +100 +250 +300 +500 +1000 A/F (SCR General) INR 88/Kg INR 63/Kg INR 63/Kg INR 44/Kg INR 39/Kg INR 39/Kg
AWB Rs. 750 per AWB
G. Air Freight Charges – Kuala Lampur All Weight Group
DEL/ Kuala Lumpur +45 +100 +250 +300 +500 +1000
A/F (SCR General) INR 70/Kg INR 63/Kg INR 63/Kg INR 55/Kg INR 53/Kg INR 53/Kg A/F (SCR
0006) INR 45/Kg INR 45/Kg INR 38/Kg INR 38/Kg AWB Rs. 750 per AWB
* It varies from year to year /season to season, capacity of container and distance covered.
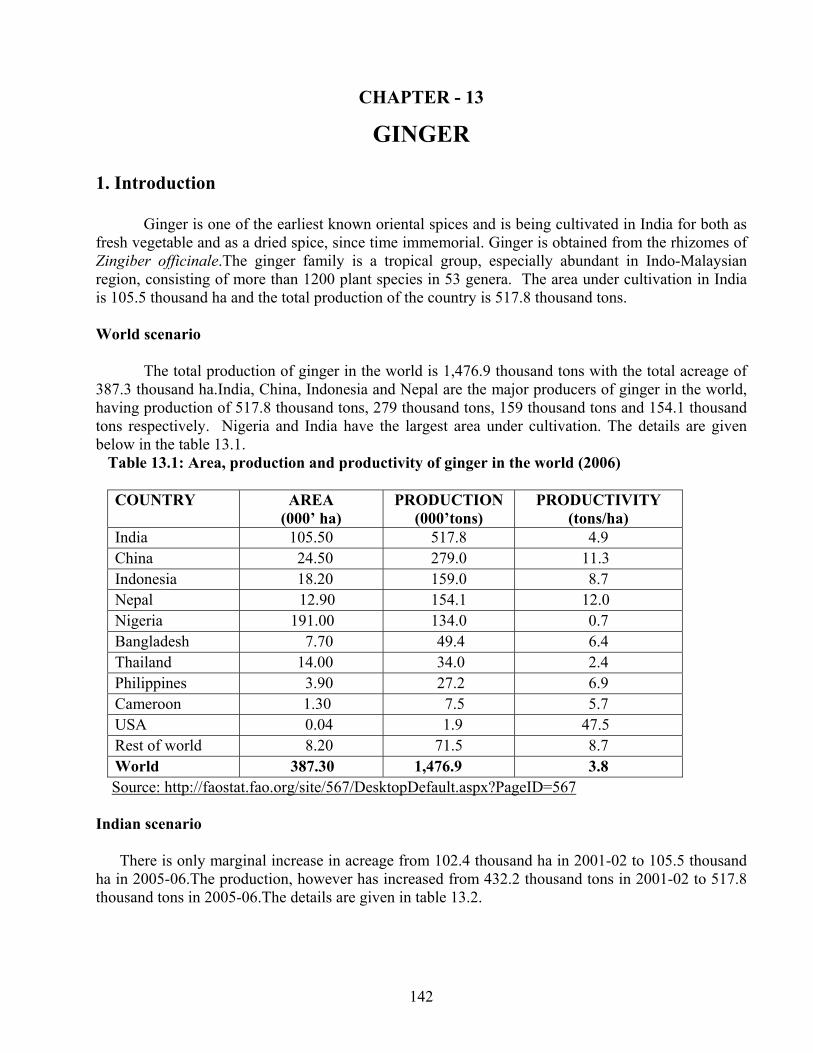
142
CHAPTER - 13
GINGER
1. Introduction
Ginger is one of the earliest known oriental spices and is being cultivated in India for both as fresh vegetable and as a dried spice, since time immemorial. Ginger is obtained from the rhizomes of Zingiber officinale.The ginger family is a tropical group, especially abundant in Indo-Malaysian region, consisting of more than 1200 plant species in 53 genera. The area under cultivation in India is 105.5 thousand ha and the total production of the country is 517.8 thousand tons.
World scenario
The total production of ginger in the world is 1,476.9 thousand tons with the total acreage of 387.3 thousand ha.India, China, Indonesia and Nepal are the major producers of ginger in the world, having production of 517.8 thousand tons, 279 thousand tons, 159 thousand tons and 154.1 thousand tons respectively. Nigeria and India have the largest area under cultivation. The details are given below in the table 13.1. Table 13.1: Area, production and productivity of ginger in the world (2006)
COUNTRY AREA (000’ ha)
PRODUCTION (000’tons)
PRODUCTIVITY (tons/ha)
India 105.50 517.8 4.9 China 24.50 279.0 11.3 Indonesia 18.20 159.0 8.7 Nepal 12.90 154.1 12.0 Nigeria 191.00 134.0 0.7 Bangladesh 7.70 49.4 6.4 Thailand 14.00 34.0 2.4 Philippines 3.90 27.2 6.9 Cameroon 1.30 7.5 5.7 USA 0.04 1.9 47.5 Rest of world 8.20 71.5 8.7 World 387.30 1,476.9 3.8
Source: http://faostat.fao.org/site/567/DesktopDefault.aspx?PageID=567 Indian scenario There is only marginal increase in acreage from 102.4 thousand ha in 2001-02 to 105.5 thousand ha in 2005-06.The production, however has increased from 432.2 thousand tons in 2001-02 to 517.8 thousand tons in 2005-06.The details are given in table 13.2.
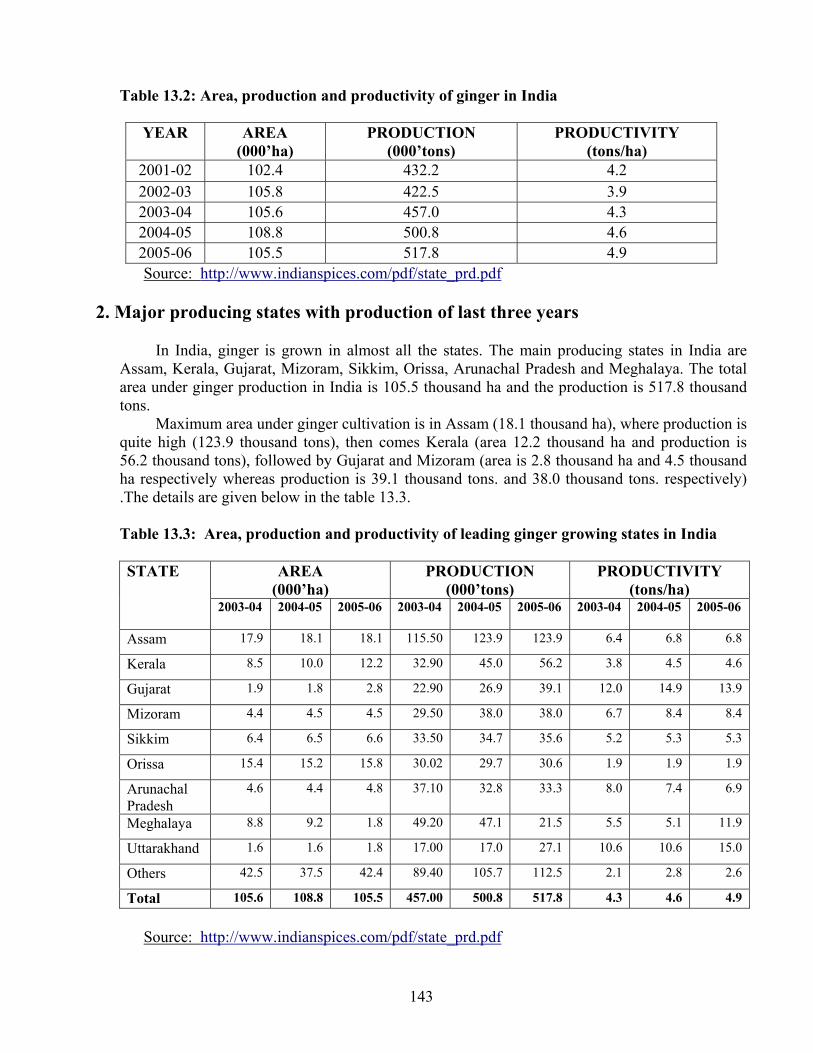
143
Table 13.2: Area, production and productivity of ginger in India
Source: http://www.indianspices.com/pdf/state_prd.pdf
2. Major producing states with production of last three years
In India, ginger is grown in almost all the states. The main producing states in India are Assam, Kerala, Gujarat, Mizoram, Sikkim, Orissa, Arunachal Pradesh and Meghalaya. The total area under ginger production in India is 105.5 thousand ha and the production is 517.8 thousand tons.
Maximum area under ginger cultivation is in Assam (18.1 thousand ha), where production is quite high (123.9 thousand tons), then comes Kerala (area 12.2 thousand ha and production is 56.2 thousand tons), followed by Gujarat and Mizoram (area is 2.8 thousand ha and 4.5 thousand ha respectively whereas production is 39.1 thousand tons. and 38.0 thousand tons. respectively) .The details are given below in the table 13.3. Table 13.3: Area, production and productivity of leading ginger growing states in India
AREA
(000’ha) PRODUCTION
(000’tons) PRODUCTIVITY
(tons/ha) STATE
2003-04
2004-05 2005-06 2003-04 2004-05 2005-06 2003-04 2004-05 2005-06
Assam 17.9 18.1 18.1 115.50 123.9 123.9 6.4 6.8 6.8
Kerala 8.5 10.0 12.2 32.90 45.0 56.2 3.8 4.5 4.6
Gujarat 1.9 1.8 2.8 22.90 26.9 39.1 12.0 14.9 13.9
Mizoram 4.4 4.5 4.5 29.50 38.0 38.0 6.7 8.4 8.4
Sikkim 6.4 6.5 6.6 33.50 34.7 35.6 5.2 5.3 5.3
Orissa 15.4 15.2 15.8 30.02 29.7 30.6 1.9 1.9 1.9
Arunachal Pradesh
4.6 4.4 4.8 37.10 32.8 33.3 8.0 7.4 6.9
Meghalaya 8.8 9.2 1.8 49.20 47.1 21.5 5.5 5.1 11.9
Uttarakhand 1.6 1.6 1.8 17.00 17.0 27.1 10.6 10.6 15.0
Others 42.5 37.5 42.4 89.40 105.7 112.5 2.1 2.8 2.6
Total 105.6 108.8 105.5 457.00 500.8 517.8 4.3 4.6 4.9
Source: http://www.indianspices.com/pdf/state_prd.pdf
YEAR AREA (000’ha)
PRODUCTION (000’tons)
PRODUCTIVITY (tons/ha)
2001-02 102.4 432.2 4.2 2002-03 105.8 422.5 3.9 2003-04 105.6 457.0 4.3 2004-05 108.8 500.8 4.6 2005-06 105.5 517.8 4.9
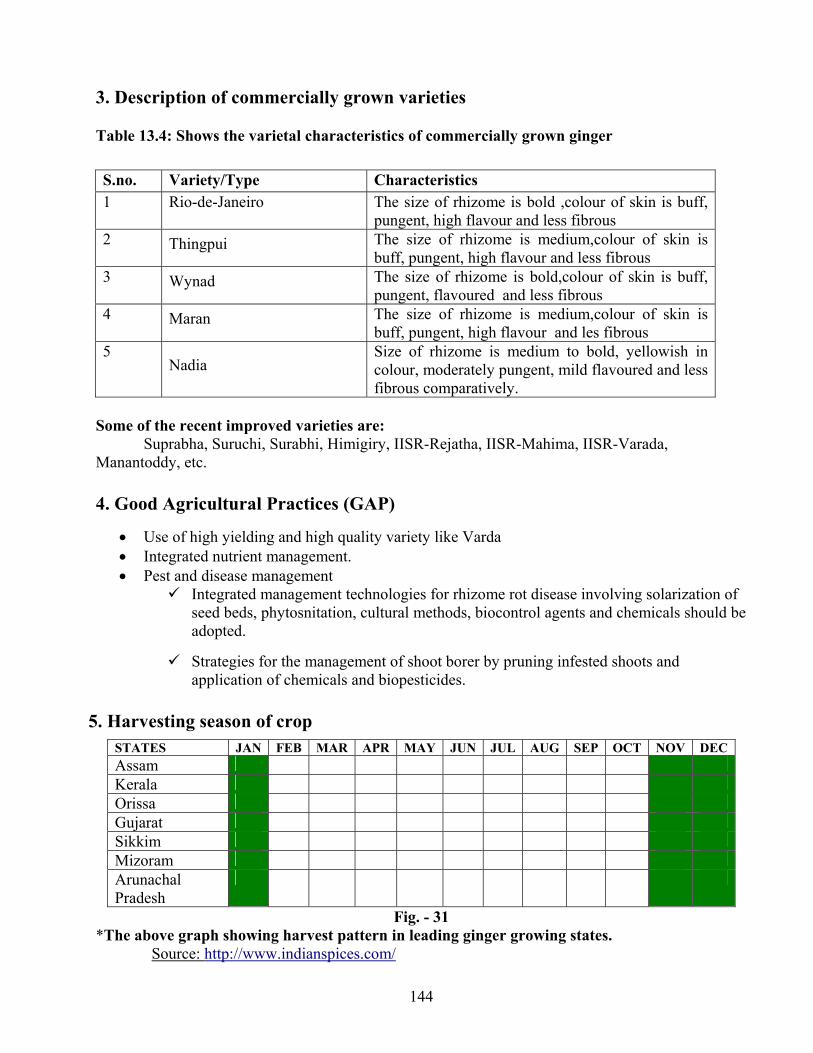
144
3. Description of commercially grown varieties
Table 13.4: Shows the varietal characteristics of commercially grown ginger
Some of the recent improved varieties are:
Suprabha, Suruchi, Surabhi, Himigiry, IISR-Rejatha, IISR-Mahima, IISR-Varada, Manantoddy, etc. 4. Good Agricultural Practices (GAP)
• Use of high yielding and high quality variety like Varda • Integrated nutrient management. • Pest and disease management
Integrated management technologies for rhizome rot disease involving solarization of seed beds, phytosnitation, cultural methods, biocontrol agents and chemicals should be adopted.
Strategies for the management of shoot borer by pruning infested shoots and
application of chemicals and biopesticides.
5. Harvesting season of crop
Fig. - 31 *The above graph showing harvest pattern in leading ginger growing states. Source: http://www.indianspices.com/
S.no. Variety/Type Characteristics 1 Rio-de-Janeiro The size of rhizome is bold ,colour of skin is buff,
pungent, high flavour and less fibrous 2 Thingpui The size of rhizome is medium,colour of skin is
buff, pungent, high flavour and less fibrous 3 Wynad The size of rhizome is bold,colour of skin is buff,
pungent, flavoured and less fibrous 4 Maran The size of rhizome is medium,colour of skin is
buff, pungent, high flavour and les fibrous 5
Nadia Size of rhizome is medium to bold, yellowish in colour, moderately pungent, mild flavoured and less fibrous comparatively.
STATES JAN FEB MAR APR MAY JUN JUL AUG SEP OCT NOV DEC Assam Kerala Orissa Gujarat Sikkim Mizoram Arunachal Pradesh
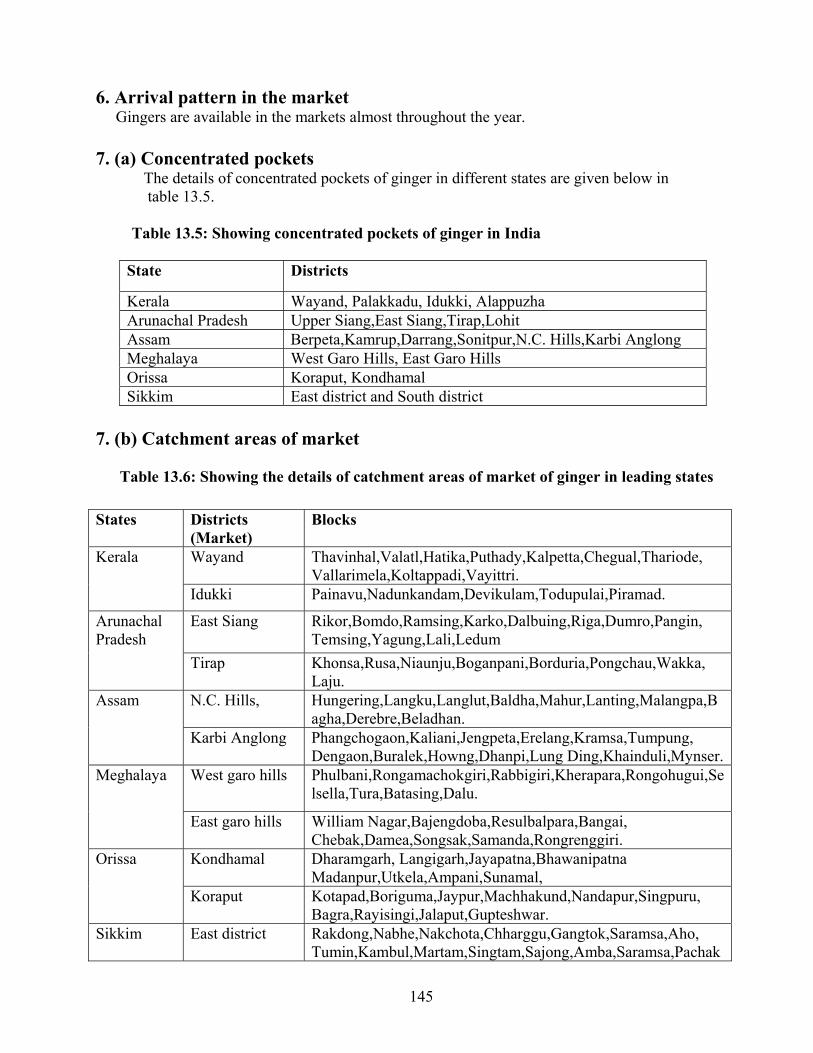
145
6. Arrival pattern in the market Gingers are available in the markets almost throughout the year. 7. (a) Concentrated pockets The details of concentrated pockets of ginger in different states are given below in table 13.5.
Table 13.5: Showing concentrated pockets of ginger in India
State Districts
Kerala Wayand, Palakkadu, Idukki, Alappuzha Arunachal Pradesh Upper Siang,East Siang,Tirap,Lohit Assam Berpeta,Kamrup,Darrang,Sonitpur,N.C. Hills,Karbi Anglong Meghalaya West Garo Hills, East Garo Hills Orissa Koraput, Kondhamal Sikkim East district and South district
7. (b) Catchment areas of market
Table 13.6: Showing the details of catchment areas of market of ginger in leading states
States Districts (Market)
Blocks
Wayand Thavinhal,Valatl,Hatika,Puthady,Kalpetta,Chegual,Thariode, Vallarimela,Koltappadi,Vayittri.
Kerala
Idukki Painavu,Nadunkandam,Devikulam,Todupulai,Piramad.
East Siang Rikor,Bomdo,Ramsing,Karko,Dalbuing,Riga,Dumro,Pangin, Temsing,Yagung,Lali,Ledum
Arunachal Pradesh
Tirap Khonsa,Rusa,Niaunju,Boganpani,Borduria,Pongchau,Wakka, Laju.
N.C. Hills, Hungering,Langku,Langlut,Baldha,Mahur,Lanting,Malangpa,Bagha,Derebre,Beladhan.
Assam
Karbi Anglong Phangchogaon,Kaliani,Jengpeta,Erelang,Kramsa,Tumpung, Dengaon,Buralek,Howng,Dhanpi,Lung Ding,Khainduli,Mynser.
West garo hills Phulbani,Rongamachokgiri,Rabbigiri,Kherapara,Rongohugui,Selsella,Tura,Batasing,Dalu.
Meghalaya
East garo hills William Nagar,Bajengdoba,Resulbalpara,Bangai, Chebak,Damea,Songsak,Samanda,Rongrenggiri.
Kondhamal Dharamgarh, Langigarh,Jayapatna,Bhawanipatna Madanpur,Utkela,Ampani,Sunamal,
Orissa
Koraput Kotapad,Boriguma,Jaypur,Machhakund,Nandapur,Singpuru, Bagra,Rayisingi,Jalaput,Gupteshwar.
Sikkim East district Rakdong,Nabhe,Nakchota,Chharggu,Gangtok,Saramsa,Aho, Tumin,Kambul,Martam,Singtam,Sajong,Amba,Saramsa,Pachak
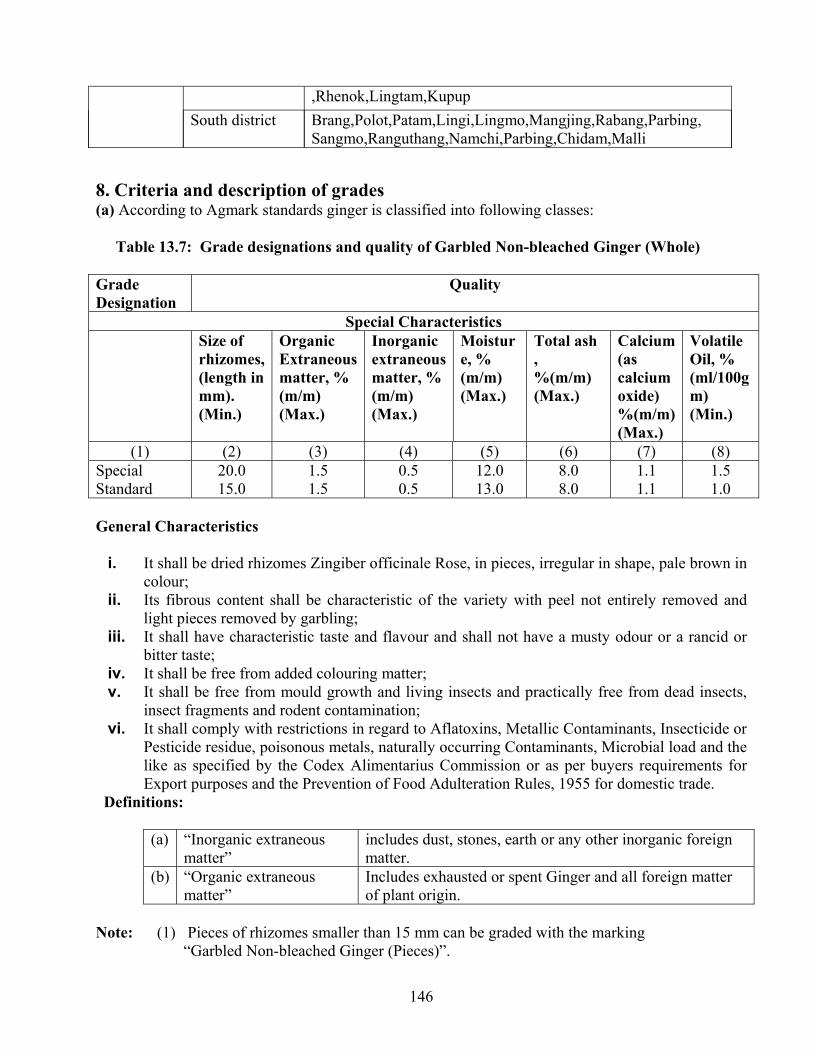
146
8. Criteria and description of grades (a) According to Agmark standards ginger is classified into following classes:
Table 13.7: Grade designations and quality of Garbled Non-bleached Ginger (Whole)
Grade Designation
Quality
Special Characteristics Size of
rhizomes, (length in mm). (Min.)
Organic Extraneous matter, % (m/m) (Max.)
Inorganic extraneous matter, % (m/m) (Max.)
Moisture, % (m/m) (Max.)
Total ash , %(m/m) (Max.)
Calcium (as calcium oxide) %(m/m) (Max.)
Volatile Oil, % (ml/100gm) (Min.)
(1) (2) (3) (4) (5) (6) (7) (8) Special Standard
20.0 15.0
1.5 1.5
0.5 0.5
12.0 13.0
8.0 8.0
1.1 1.1
1.5 1.0
General Characteristics
i. It shall be dried rhizomes Zingiber officinale Rose, in pieces, irregular in shape, pale brown in colour;
ii. Its fibrous content shall be characteristic of the variety with peel not entirely removed and light pieces removed by garbling;
iii. It shall have characteristic taste and flavour and shall not have a musty odour or a rancid or bitter taste;
iv. It shall be free from added colouring matter; v. It shall be free from mould growth and living insects and practically free from dead insects,
insect fragments and rodent contamination; vi. It shall comply with restrictions in regard to Aflatoxins, Metallic Contaminants, Insecticide or
Pesticide residue, poisonous metals, naturally occurring Contaminants, Microbial load and the like as specified by the Codex Alimentarius Commission or as per buyers requirements for Export purposes and the Prevention of Food Adulteration Rules, 1955 for domestic trade.
Definitions:
(a) “Inorganic extraneous matter”
includes dust, stones, earth or any other inorganic foreign matter.
(b) “Organic extraneous matter”
Includes exhausted or spent Ginger and all foreign matter of plant origin.
Note: (1) Pieces of rhizomes smaller than 15 mm can be graded with the marking “Garbled Non-bleached Ginger (Pieces)”.
,Rhenok,Lingtam,Kupup South district Brang,Polot,Patam,Lingi,Lingmo,Mangjing,Rabang,Parbing,
Sangmo,Ranguthang,Namchi,Parbing,Chidam,Malli
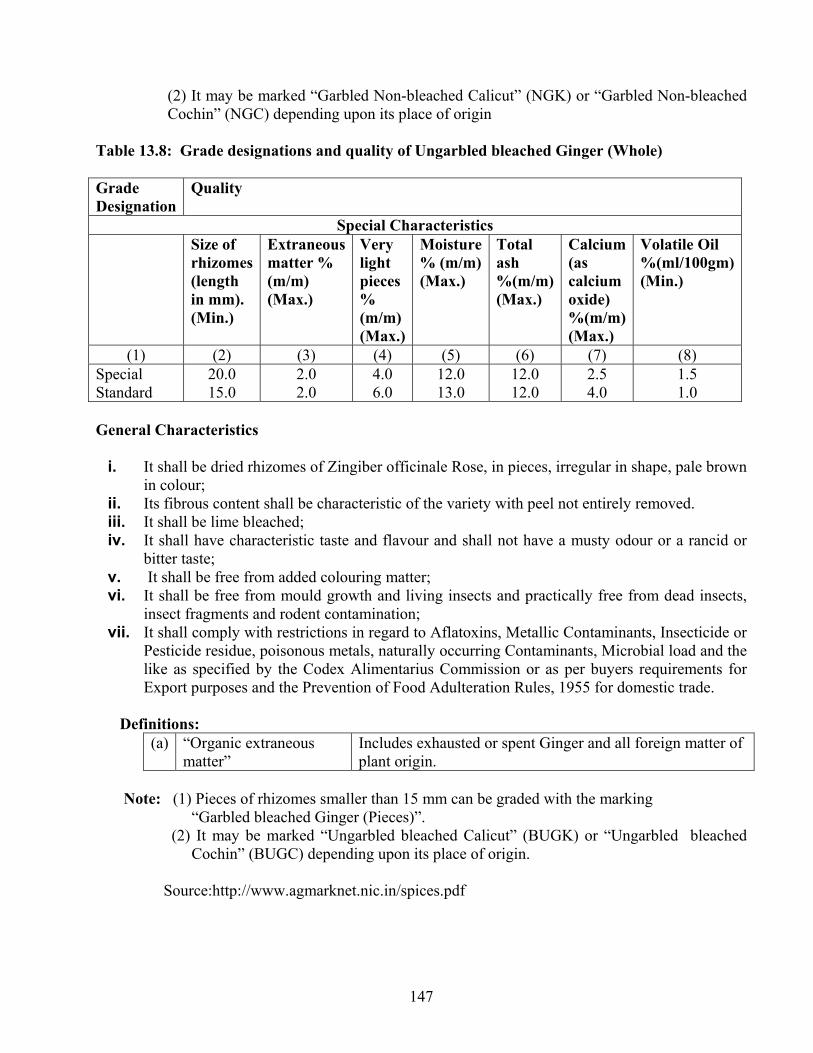
147
(2) It may be marked “Garbled Non-bleached Calicut” (NGK) or “Garbled Non-bleached Cochin” (NGC) depending upon its place of origin
Table 13.8: Grade designations and quality of Ungarbled bleached Ginger (Whole) Grade Designation
Quality
Special Characteristics Size of
rhizomes (length in mm). (Min.)
Extraneous matter % (m/m) (Max.)
Very light pieces % (m/m) (Max.)
Moisture % (m/m) (Max.)
Total ash %(m/m) (Max.)
Calcium (as calcium oxide) %(m/m) (Max.)
Volatile Oil %(ml/100gm) (Min.)
(1) (2) (3) (4) (5) (6) (7) (8) Special Standard
20.0 15.0
2.0 2.0
4.0 6.0
12.0 13.0
12.0 12.0
2.5 4.0
1.5 1.0
General Characteristics
i. It shall be dried rhizomes of Zingiber officinale Rose, in pieces, irregular in shape, pale brown in colour;
ii. Its fibrous content shall be characteristic of the variety with peel not entirely removed. iii. It shall be lime bleached; iv. It shall have characteristic taste and flavour and shall not have a musty odour or a rancid or
bitter taste; v. It shall be free from added colouring matter; vi. It shall be free from mould growth and living insects and practically free from dead insects,
insect fragments and rodent contamination; vii. It shall comply with restrictions in regard to Aflatoxins, Metallic Contaminants, Insecticide or
Pesticide residue, poisonous metals, naturally occurring Contaminants, Microbial load and the like as specified by the Codex Alimentarius Commission or as per buyers requirements for Export purposes and the Prevention of Food Adulteration Rules, 1955 for domestic trade.
Definitions:
(a) “Organic extraneous matter”
Includes exhausted or spent Ginger and all foreign matter of plant origin.
Note: (1) Pieces of rhizomes smaller than 15 mm can be graded with the marking “Garbled bleached Ginger (Pieces)”. (2) It may be marked “Ungarbled bleached Calicut” (BUGK) or “Ungarbled bleached
Cochin” (BUGC) depending upon its place of origin. Source:http://www.agmarknet.nic.in/spices.pdf
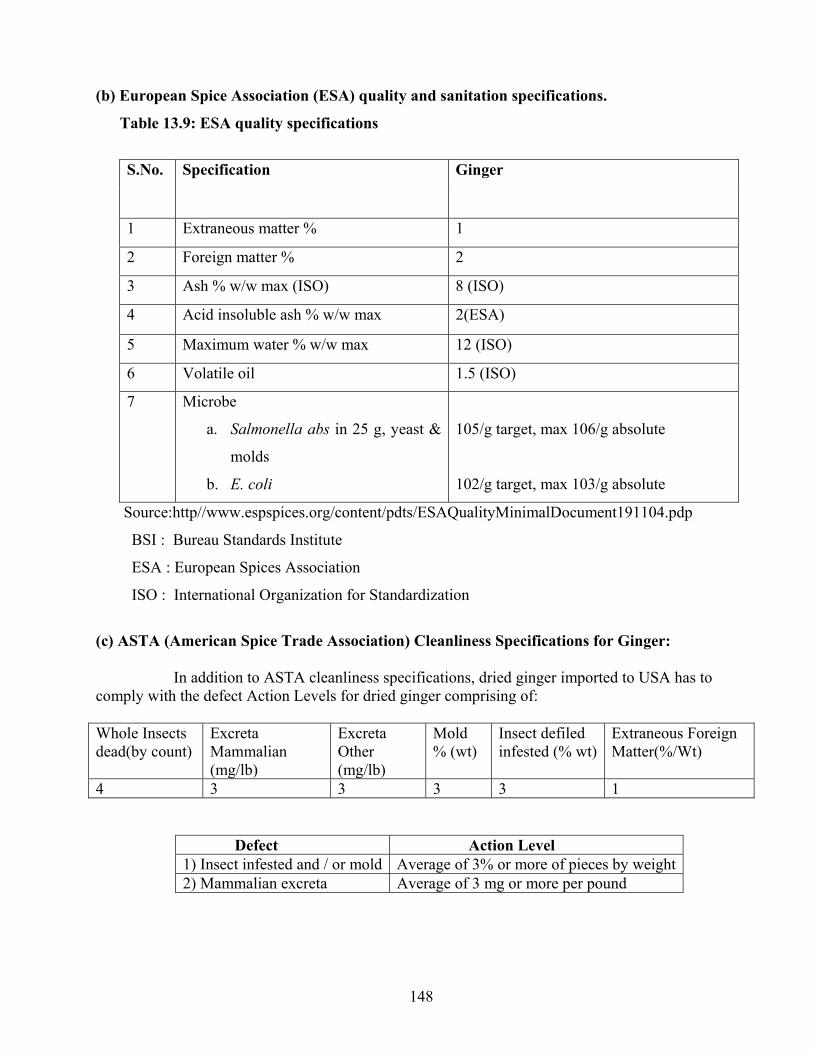
148
(b) European Spice Association (ESA) quality and sanitation specifications.
Table 13.9: ESA quality specifications
S.No. Specification Ginger
1 Extraneous matter % 1
2 Foreign matter % 2
3 Ash % w/w max (ISO) 8 (ISO)
4 Acid insoluble ash % w/w max 2(ESA)
5 Maximum water % w/w max 12 (ISO)
6 Volatile oil 1.5 (ISO)
7 Microbe
a. Salmonella abs in 25 g, yeast &
molds
b. E. coli
105/g target, max 106/g absolute
102/g target, max 103/g absolute
Source:http//www.espspices.org/content/pdts/ESAQualityMinimalDocument191104.pdp
BSI : Bureau Standards Institute
ESA : European Spices Association
ISO : International Organization for Standardization
(c) ASTA (American Spice Trade Association) Cleanliness Specifications for Ginger: In addition to ASTA cleanliness specifications, dried ginger imported to USA has to comply with the defect Action Levels for dried ginger comprising of: Whole Insects dead(by count)
Excreta Mammalian (mg/lb)
Excreta Other (mg/lb)
Mold % (wt)
Insect defiled infested (% wt)
Extraneous Foreign Matter(%/Wt)
4 3 3 3 3 1
Defect Action Level 1) Insect infested and / or mold Average of 3% or more of pieces by weight2) Mammalian excreta Average of 3 mg or more per pound
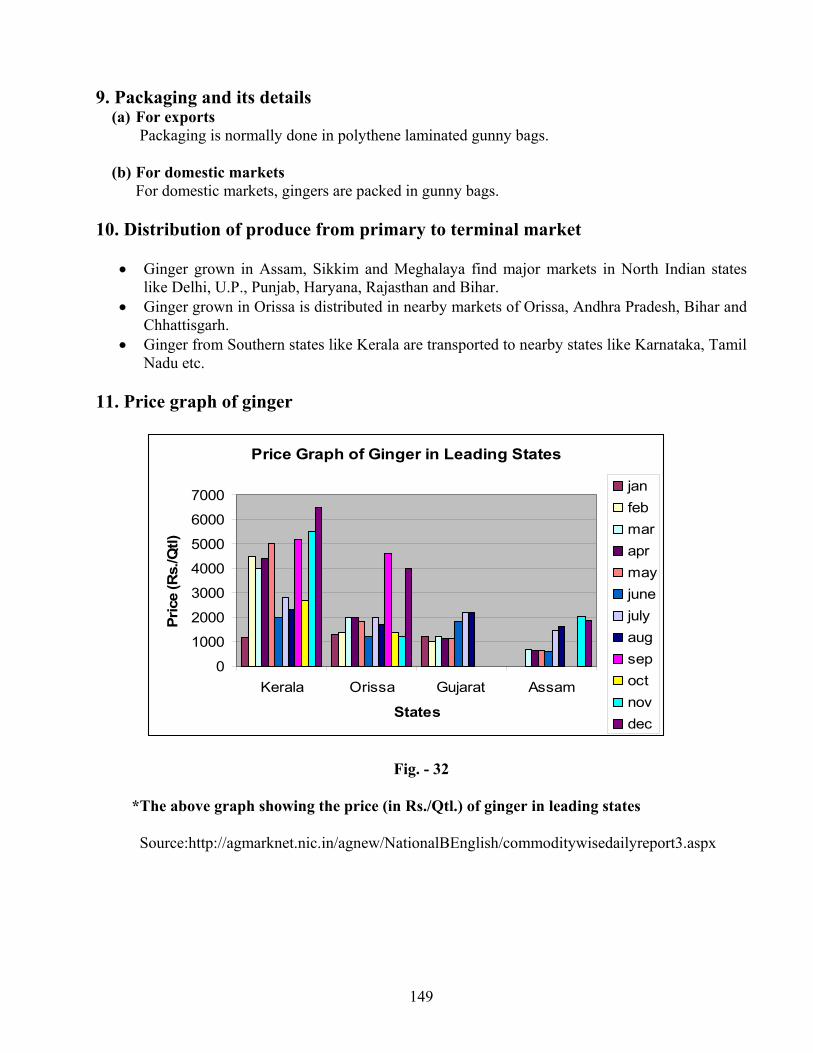
149
9. Packaging and its details (a) For exports
Packaging is normally done in polythene laminated gunny bags.
(b) For domestic markets For domestic markets, gingers are packed in gunny bags.
10. Distribution of produce from primary to terminal market
• Ginger grown in Assam, Sikkim and Meghalaya find major markets in North Indian states like Delhi, U.P., Punjab, Haryana, Rajasthan and Bihar.
• Ginger grown in Orissa is distributed in nearby markets of Orissa, Andhra Pradesh, Bihar and Chhattisgarh.
• Ginger from Southern states like Kerala are transported to nearby states like Karnataka, Tamil Nadu etc.
11. Price graph of ginger
Price Graph of Ginger in Leading States
0
1000
2000
3000
4000
5000
6000
7000
Kerala Orissa Gujarat Assam
States
Pric
e (R
s./Q
tl)
janfebmaraprmayjunejulyaugsepoctnovdec
Fig. - 32
*The above graph showing the price (in Rs./Qtl.) of ginger in leading states
Source:http://agmarknet.nic.in/agnew/NationalBEnglish/commoditywisedailyreport3.aspx
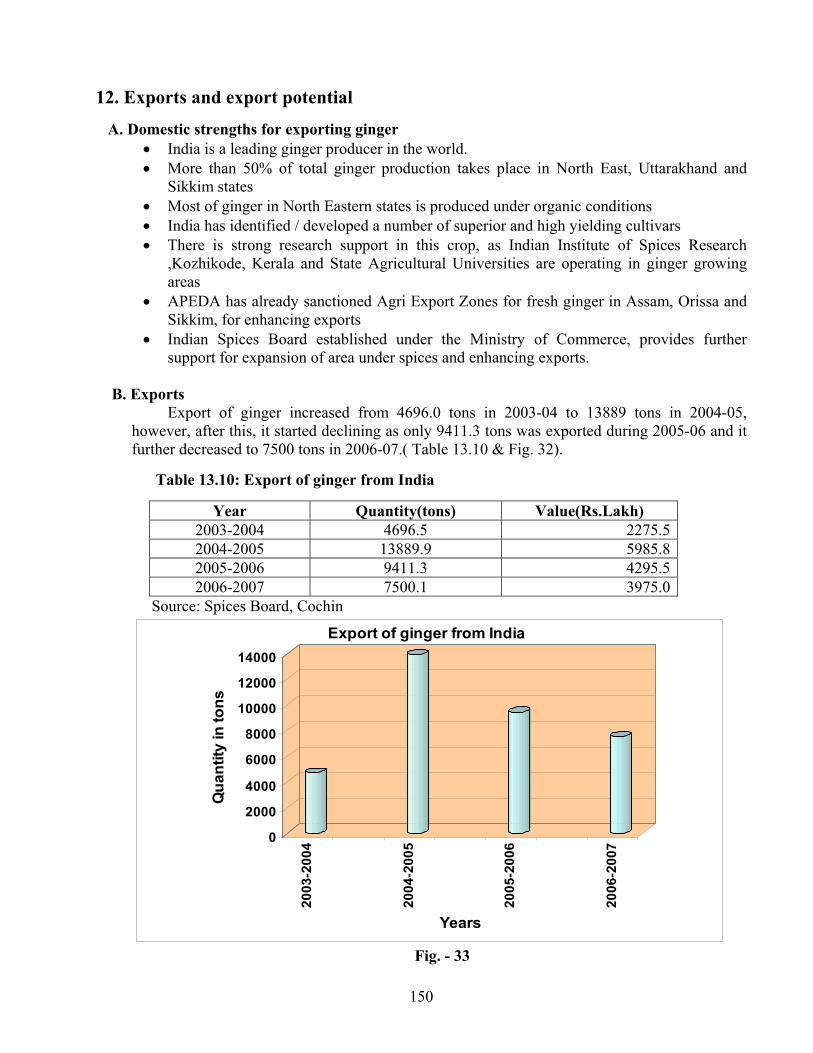
150
12. Exports and export potential A. Domestic strengths for exporting ginger
• India is a leading ginger producer in the world. • More than 50% of total ginger production takes place in North East, Uttarakhand and
Sikkim states • Most of ginger in North Eastern states is produced under organic conditions • India has identified / developed a number of superior and high yielding cultivars • There is strong research support in this crop, as Indian Institute of Spices Research
,Kozhikode, Kerala and State Agricultural Universities are operating in ginger growing areas
• APEDA has already sanctioned Agri Export Zones for fresh ginger in Assam, Orissa and Sikkim, for enhancing exports
• Indian Spices Board established under the Ministry of Commerce, provides further support for expansion of area under spices and enhancing exports.
B. Exports
Export of ginger increased from 4696.0 tons in 2003-04 to 13889 tons in 2004-05, however, after this, it started declining as only 9411.3 tons was exported during 2005-06 and it further decreased to 7500 tons in 2006-07.( Table 13.10 & Fig. 32).
Table 13.10: Export of ginger from India
Year Quantity(tons) Value(Rs.Lakh) 2003-2004 4696.5 2275.52004-2005 13889.9 5985.82005-2006 9411.3 4295.52006-2007 7500.1 3975.0
Source: Spices Board, Cochin
0
2000
4000
6000
8000
10000
12000
14000
Qua
ntity
in to
ns
2003
-200
4
2004
-200
5
2005
-200
6
2006
-200
7
Years
Export of ginger from India
Fig. - 33
151
C. Export potential Export potential of ginger is discussed region wise as mentioned below: (i) GCC countries
India exported 1109 tons to GCC during 2006-07, when Saudi Arabia imported 930 tons and UAE imported 179 tons of ginger from India. However, Comtrade database shows that GCC countries imported as much as 38630 tons during 2006.The GCC market has been dominated by ginger from China, Ethiopia and Nigeria. China supplies ginger at cheaper rates and even Ethiopia and Nigeria are able to provide cheaper ginger compared to India. India though largest producer of ginger in world but productivity is very low. If India has to compete in world markets, it must increase productivity and lower cost of production by cultivating high yielding cultivars and better agricultural practices.
(ii) Middle East countries
Apart from GCC countries, India has exported during 2006-07, ginger to a number of Middle East countries comprising Yemen Arab Republic (480 tons), Morocco (281 tons) and Israel (139 tons). This suggests that there is a potential of exporting ginger to these countries which should be further explored with concerted efforts.
(iii) European Union
European Union imported ginger up to 43,056 tons during 2006.Few largest importers are UK (15,962 tons), Netherlands (13,204 tons), Germany (4364 tons) and France (2666 tons). Whereas major export of ginger to European Union is done by China (36%) and Thailand (13%). Exports to some extent is also done by Nigeria and Brazil. These are very countries who are India’s competitors and supply ginger to EU at much cheaper prices. India’s exports are negligible as is shown by APEDA database,. India has exported in total 1384 tons during 2006-07. Maximum exports were to UK (554 tons) followed by Spain (393 tons), Germany (145 tons), Netherlands (174 tons), Belgium (70 tons) and Norway (48 tons). As stated under GCC countries, only alternative for India is to lower the cost of production by increasing productivity and offer ginger at competitive prices in foreign markets.
(iv) Pacific Rim countries
India exported some quantities of ginger to Australia (131 tons) and to Japan (73 tons) during 2006-07.
Australia imported 869 tons of ginger in 2006, the imports of Australia decreased to 663 tons during 2007.Again our main competition is with China and Fiji Islands who supply ginger at cheaper rates than India. India must explore it further and nurture the markets. As far as Japan is concerned, maximum imports of ginger all over the world amounting to 58,465 tons are done by Japan, but India exported only 73 tons to Japan. India must explore Japanese market.
(v) U.S.A and Canada
Both USA and Canada imported 32553 tons and 8360 tons of ginger respectively during 2006. India exported 444 tons of ginger to USA and 112 tons to Canada. This shows that there is a potential for exporting to these countries and must be further expanded leading to larger exports.
152
D. Measures for enhancing competitiveness for exporting ginger Following measures, if adopted, can help in enhancing competitiveness for exporting ginger:
• India’s main competition in ginger is with China, Indonesia and Thailand. China is able to provide much bigger finger size at cheaper prices in International market. Therefore, India needs to percolate its superior and high yielding cultivars like IISR Varada etc. through micro tubers with the help of tissue culture in states like Assam, Mizoram, Meghalaya, Sikkim and Orissa, in order to bring sizeable area under superior cultivars.
• With increased productivity, India can cut down the prices and will be able to provide better finger size at competitive prices.
• In International market, there is a demand of clean and bigger finger sized ginger, thus India must establish post- harvest handling facilities for cleaning, grading, post- harvest treatment and appropriate packing of ginger.
13. Storage Fresh ginger
Temperature : 7.5 - 10°C
Relative Humidity : 75%
Storage Period : 16 - 24 weeks
Dried ginger
Dried ginger is stored at ambient temperature
14. Documents required for exports
a) Documents related to goods
a) Invoice b) Packing List c) Certificate of origin
b) Documents related to shipment
a) Mate Receipt b) Shipping Bill c) Bill of handing d) Airway Bill
c) Documents related to Payment
a) Letter of Credit (L/C) b) Bill of Exchange
d) Documents related to quality of goods
a) Phytosanitary Certificate b) GLOBALGAP Certification c) Health Certificate
e) Organic Certification
- Certificate indicating material produce is based on organic farming.
f) Documents related to Foreign Exchange Regulations
GR Form: Documents required by RBI which assures to RBI that the exporter will realize
the proceeds of goods within 180 days from the date of Shipment.
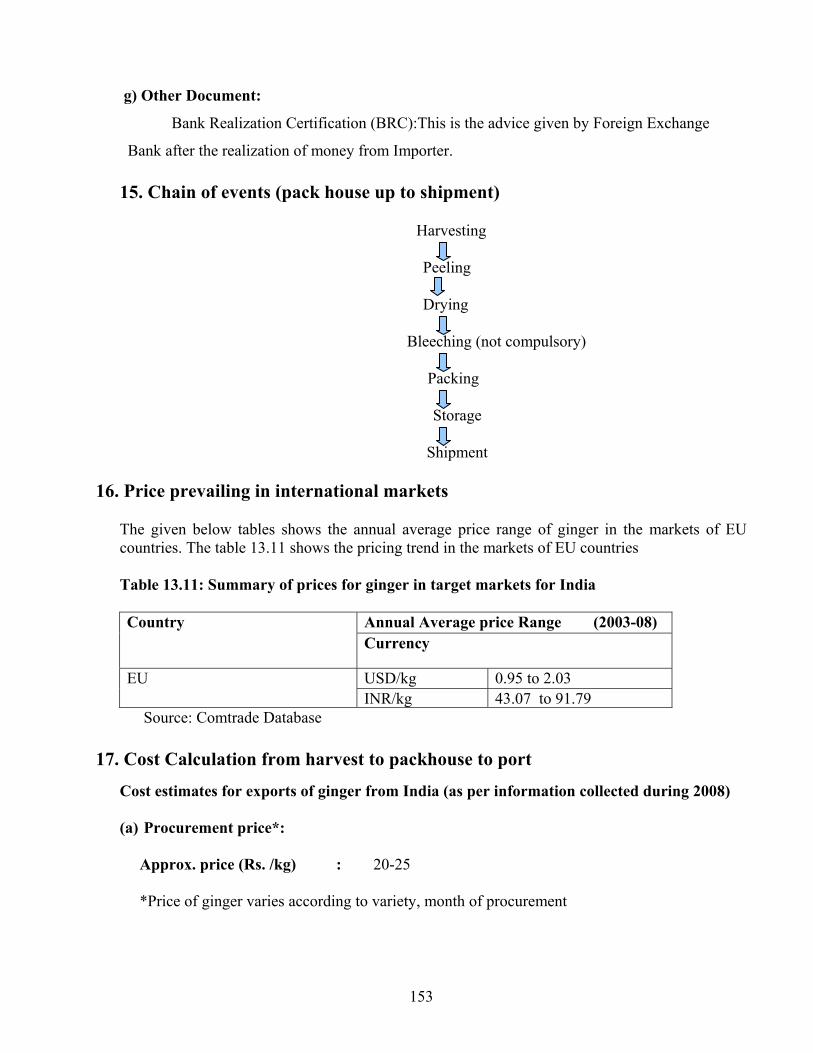
153
g) Other Document:
Bank Realization Certification (BRC):This is the advice given by Foreign Exchange
Bank after the realization of money from Importer.
15. Chain of events (pack house up to shipment)
Harvesting
Peeling
Drying
Bleeching (not compulsory)
Packing
Storage
Shipment
16. Price prevailing in international markets
The given below tables shows the annual average price range of ginger in the markets of EU countries. The table 13.11 shows the pricing trend in the markets of EU countries
Table 13.11: Summary of prices for ginger in target markets for India
Annual Average price Range (2003-08) Country Currency
USD/kg 0.95 to 2.03 EU INR/kg 43.07 to 91.79
Source: Comtrade Database 17. Cost Calculation from harvest to packhouse to port
Cost estimates for exports of ginger from India (as per information collected during 2008)
(a) Procurement price*: Approx. price (Rs. /kg) : 20-25 *Price of ginger varies according to variety, month of procurement
154
(b) Charges for sorting/grading, processing/grinding, packing, transport etc. (below in table):
Table 13.12: Charges for sorting/grading, processing/grinding, packing, transport, etc.
Particulars (Cost per kg) 20’ container (12500 kg)
Sorting / Grading 3.0
Processing 3.5
Packing (includes cost of packing material) 4.0
Loading truck/container 2.0
Transport to port includes C & F 2.0
Total 14.5
Source: Spices Board, Cochin
(c) Sea freight charges*: Freight rates for reefer container are as follows:
Reefer containers (Rates in US dollars) 20’ 40’
(i) Dubai/Doha 1100 1600 (ii) Kuala Lampur/Singapore 600 900 (iii)UK/Amsterdam 1700 2700 Freight rates for ordinary container are as follows:
Ordinary containers (Rates in US dollars) 20’ 40’
(i) Dubai/Doha 600 900 (ii) Kuala Lampur/Singapore 100 175 (iii)Flaxo (UK)/Amsterdam 900 1450 * It varies from year to year /season to season, capacity of container and distance covered.
155
CHAPTER – 14
TURMERIC
1. Introduction
Turmeric (Curcuma longa) is native to Asia and India. The tuberous rhizomes or underground stems of turmeric have been used from antiquity as condiments, a dye and as an aromatic stimulant in several medicines. Turmeric is very important spice in India, which produces nearly entire whole world’s crop and consumes 80% of it. India is by far the largest producer and exporter of turmeric in the world. Turmeric occupies about 6% of the total area under spices and condiments in India.
World scenario
Turmeric is also cultivated in China, Myanmar, Nigeria and Bangladesh. However, authentic figures about area and production are not available. Major area is in India which constitutes 82% followed by China (8%), Myanmar (4%), Nigeria (3%) and Bangladesh (3%) Indian scenario There is an increase from 162.9 thousand ha in 2001-02 to177.5 thousand ha in 2005-06. Similarly, the production has increased from 552.3 thousand tons in 2001-02 to 846.7 thousand tons in 2005-06.The details are given in table 14.1.
Table 14.1: Area, production and productivity of turmeric in India
Source: http://www.indianspices.com/pdf/state_prd.pdf
2. Major producing states with production of last three years
The main turmeric producing states in India are Andhra Pradesh, Tamil Nadu, Orissa, Karnataka, West Bengal, Gujarat and Kerala. Maximum area under turmeric cultivation is in Andhra Pradesh (69.9 thousand ha), where production is very high ie.518.5 thousand tons. Then comes Tamil Nadu (area 25.9 thousand ha and production is 143.3 thousand tons), followed by Orissa and West Bengal (area is 24.0 thousand ha and 11.8 thousand ha respectively whereas production is 57
YEAR AREA ( 000’ha)
PRODUCTION (000’tons)
PRODUCTIVITY (tons/ha)
2001-02 162.9 552.3 3.3 2002-03 149.8 526.4 3.5 2003-04 150.7 567.2 3.7 2004-05 158.4 718.1 4.5 2005-06 177.5 846.7 4.7
156
thousand tons. and 25 thousand tons. respectively) Productivity of turmeric like ginger is highest in Gujarat. The details are given below in the table 14.2 Table 14.2: Area, production and productivity of leading turmeric growing states in India
AREA (000’ha)
PRODUCTION (000’tons)
PRODUCTIVITY (tons/ha)
STATE
2003-04
2004-05 2005-06 2003-04 2004-05 2005-06 2003-04 2004-05 2005-06
Andhra Pradesh
58.4 60.3 69.9 320.6 417.8 518.5 5.4 6.9 7.4
Tamil Nadu 16.1 21.6 25.9 67.2 118.4 143.3 4.1 5.4 5.5
Orissa 23.7 23.5 24.0 56.4 55.9 57.0 2.3 2.3 2.3
West Bengal 12.6 12.4 11.8 24.5 24.4 25.0 1.9 1.9 2.1
Karnataka 5.4 5.4 5.4 26.3 26.3 26.3 4.8 4.8 4.8
Gujarat 0.95 1.02 1.4 11.1 14.1 16.5 11.6 13.8 11.7
Kerala 2.7 2.8 3.3 5.6 6.2 8.2 2.0 2.2 2.4
Sikkim 0.51 0.52 0.67 1.7 1.74 3.6 3.3 3.3 5.3
Others 30.3 30.9 35.2 53.8 53.4 48.3 1.7 1.7 1.3
Total 150.7 158.4 177.5 567.2 718.1 846.7 3.7 4.5 4.7
Source: http://www.indianspices.com/pdf/state_prd.pdf
3. Commercially grown varieties
There are about 30 turmeric varieties grown in India. Among them Alleppey and Madras (Perianadan) are of great commercial importance. Some of the improved varieties are: CO-11983, BSR-11986, Krishna, Roma, Suroma, Ranga, Rasmi, Megha Turmeric-1, Suguna, Sudarshana, Suranjana, Duggirala, Kodur, Suvarna, Varna, IISR Prabha, IISR Pratibha, Rajendra Sonia etc. Description of some of the varieties is given below: Table 14.3: Some of the commercial and improved varieties Variety Characteristics
Alleppey Highly coloured variety.It is grown in Kerala and is marketed as Alleppey turmeric. Duggirala A long duration type (9 months), major variety of Andhra Pradesh. Rhizomes are
bright yellow in colour.Grown mostly in Guntur district. Yield of raw material 25 tons./ha.
Armoor Mostly grown in Nizamabad district of Andhra Pradesh. Medium duration type. Yield of raw material 25-30 tons/ha.
Suvarna This is a high yielding type released by IISR, Calicut. It has yield potential of 43 tons/ha.It has also high curcumin content of 8.7%
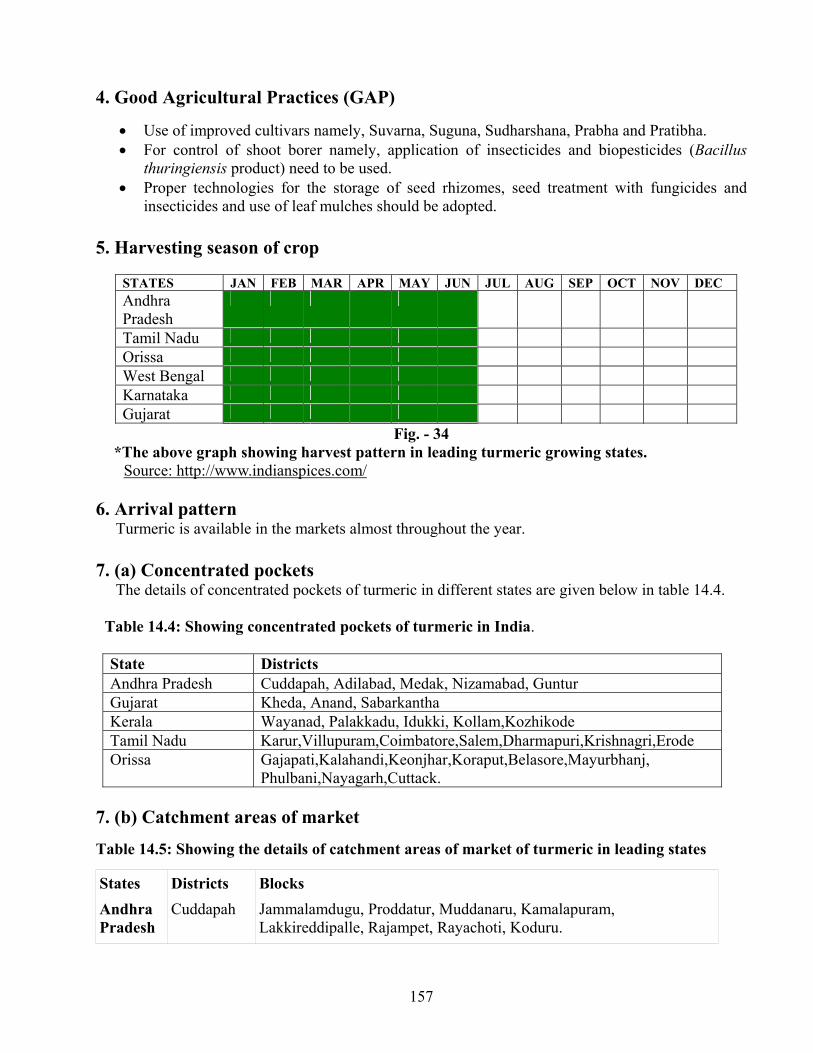
157
4. Good Agricultural Practices (GAP)
• Use of improved cultivars namely, Suvarna, Suguna, Sudharshana, Prabha and Pratibha. • For control of shoot borer namely, application of insecticides and biopesticides (Bacillus
thuringiensis product) need to be used. • Proper technologies for the storage of seed rhizomes, seed treatment with fungicides and
insecticides and use of leaf mulches should be adopted. 5. Harvesting season of crop
Fig. - 34 *The above graph showing harvest pattern in leading turmeric growing states. Source: http://www.indianspices.com/ 6. Arrival pattern Turmeric is available in the markets almost throughout the year. 7. (a) Concentrated pockets The details of concentrated pockets of turmeric in different states are given below in table 14.4. Table 14.4: Showing concentrated pockets of turmeric in India.
State Districts Andhra Pradesh Cuddapah, Adilabad, Medak, Nizamabad, Guntur Gujarat Kheda, Anand, Sabarkantha Kerala Wayanad, Palakkadu, Idukki, Kollam,Kozhikode Tamil Nadu Karur,Villupuram,Coimbatore,Salem,Dharmapuri,Krishnagri,Erode Orissa Gajapati,Kalahandi,Keonjhar,Koraput,Belasore,Mayurbhanj,
Phulbani,Nayagarh,Cuttack. 7. (b) Catchment areas of market Table 14.5: Showing the details of catchment areas of market of turmeric in leading states
States Districts Blocks Andhra Pradesh
Cuddapah Jammalamdugu, Proddatur, Muddanaru, Kamalapuram, Lakkireddipalle, Rajampet, Rayachoti, Koduru.
STATES JAN FEB MAR APR MAY JUN JUL AUG SEP OCT NOV DEC Andhra Pradesh
Tamil Nadu Orissa West Bengal Karnataka Gujarat
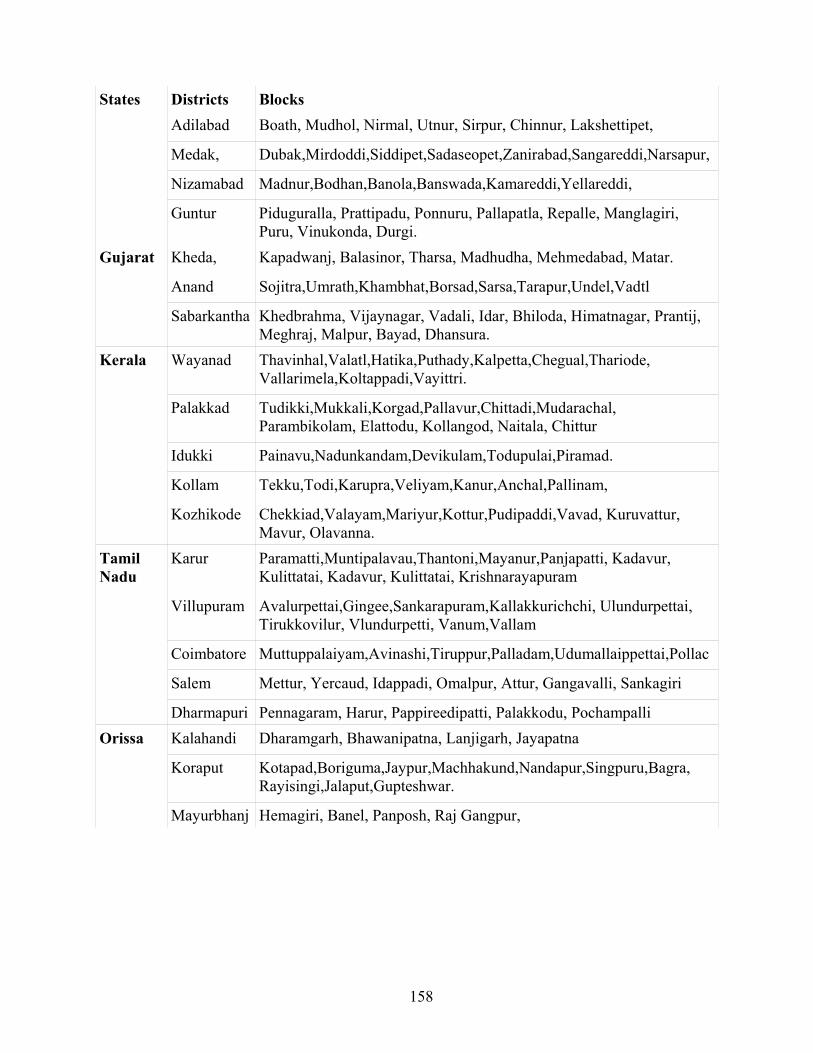
158
States Districts Blocks Adilabad Boath, Mudhol, Nirmal, Utnur, Sirpur, Chinnur, Lakshettipet,
if b dMedak, Dubak,Mirdoddi,Siddipet,Sadaseopet,Zanirabad,Sangareddi,Narsapur,
Nizamabad Madnur,Bodhan,Banola,Banswada,Kamareddi,Yellareddi, d
Guntur Piduguralla, Prattipadu, Ponnuru, Pallapatla, Repalle, Manglagiri, Puru, Vinukonda, Durgi.
Kheda, Kapadwanj, Balasinor, Tharsa, Madhudha, Mehmedabad, Matar.
Anand Sojitra,Umrath,Khambhat,Borsad,Sarsa,Tarapur,Undel,Vadtl
Gujarat
Sabarkantha Khedbrahma, Vijaynagar, Vadali, Idar, Bhiloda, Himatnagar, Prantij, Meghraj, Malpur, Bayad, Dhansura.
Wayanad Thavinhal,Valatl,Hatika,Puthady,Kalpetta,Chegual,Thariode, Vallarimela,Koltappadi,Vayittri.
Palakkad Tudikki,Mukkali,Korgad,Pallavur,Chittadi,Mudarachal, Parambikolam, Elattodu, Kollangod, Naitala, Chittur
Idukki Painavu,Nadunkandam,Devikulam,Todupulai,Piramad.
Kollam Tekku,Todi,Karupra,Veliyam,Kanur,Anchal,Pallinam, li i k
Kerala
Kozhikode Chekkiad,Valayam,Mariyur,Kottur,Pudipaddi,Vavad, Kuruvattur, Mavur, Olavanna.
Karur Paramatti,Muntipalavau,Thantoni,Mayanur,Panjapatti, Kadavur, Kulittatai, Kadavur, Kulittatai, Krishnarayapuram
Villupuram Avalurpettai,Gingee,Sankarapuram,Kallakkurichchi, Ulundurpettai, Tirukkovilur, Vlundurpetti, Vanum,Vallam
Coimbatore Muttuppalaiyam,Avinashi,Tiruppur,Palladam,Udumallaippettai,Pollachi l i
Salem Mettur, Yercaud, Idappadi, Omalpur, Attur, Gangavalli, Sankagiri
Tamil Nadu
Dharmapuri Pennagaram, Harur, Pappireedipatti, Palakkodu, Pochampalli Kalahandi Dharamgarh, Bhawanipatna, Lanjigarh, Jayapatna
Koraput Kotapad,Boriguma,Jaypur,Machhakund,Nandapur,Singpuru,Bagra, Rayisingi,Jalaput,Gupteshwar.
Orissa
Mayurbhanj Hemagiri, Banel, Panposh, Raj Gangpur,
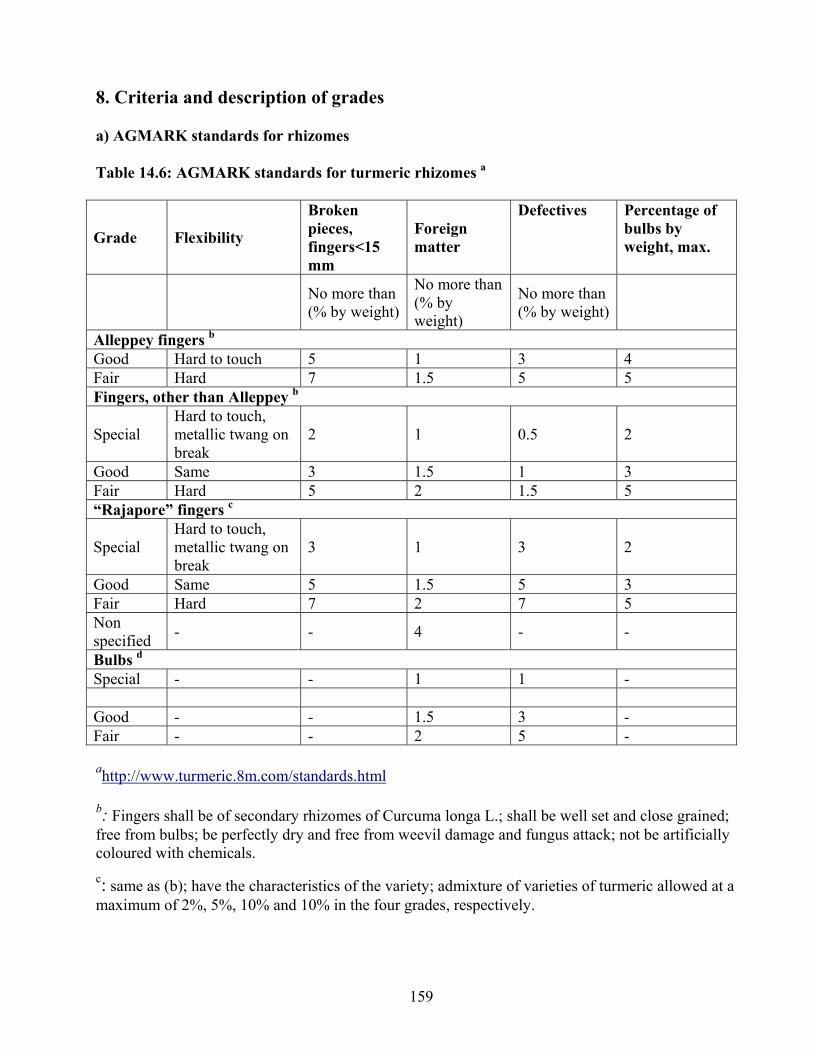
159
8. Criteria and description of grades
a) AGMARK standards for rhizomes
Table 14.6: AGMARK standards for turmeric rhizomes a
Grade Flexibility
Broken pieces, fingers<15 mm
Foreign matter
Defectives Percentage of bulbs by weight, max.
No more than (% by weight)
No more than (% by weight)
No more than (% by weight)
Alleppey fingers b
Good Hard to touch 5 1 3 4 Fair Hard 7 1.5 5 5 Fingers, other than Alleppey b
Special Hard to touch, metallic twang on break
2 1 0.5 2
Good Same 3 1.5 1 3 Fair Hard 5 2 1.5 5 “Rajapore” fingers c
Special Hard to touch, metallic twang on break
3 1 3 2
Good Same 5 1.5 5 3 Fair Hard 7 2 7 5 Non specified - - 4 - -
Bulbs d
Special - - 1 1 - Good - - 1.5 3 - Fair - - 2 5 - ahttp://www.turmeric.8m.com/standards.html b: Fingers shall be of secondary rhizomes of Curcuma longa L.; shall be well set and close grained; free from bulbs; be perfectly dry and free from weevil damage and fungus attack; not be artificially coloured with chemicals. c: same as (b); have the characteristics of the variety; admixture of varieties of turmeric allowed at a maximum of 2%, 5%, 10% and 10% in the four grades, respectively.
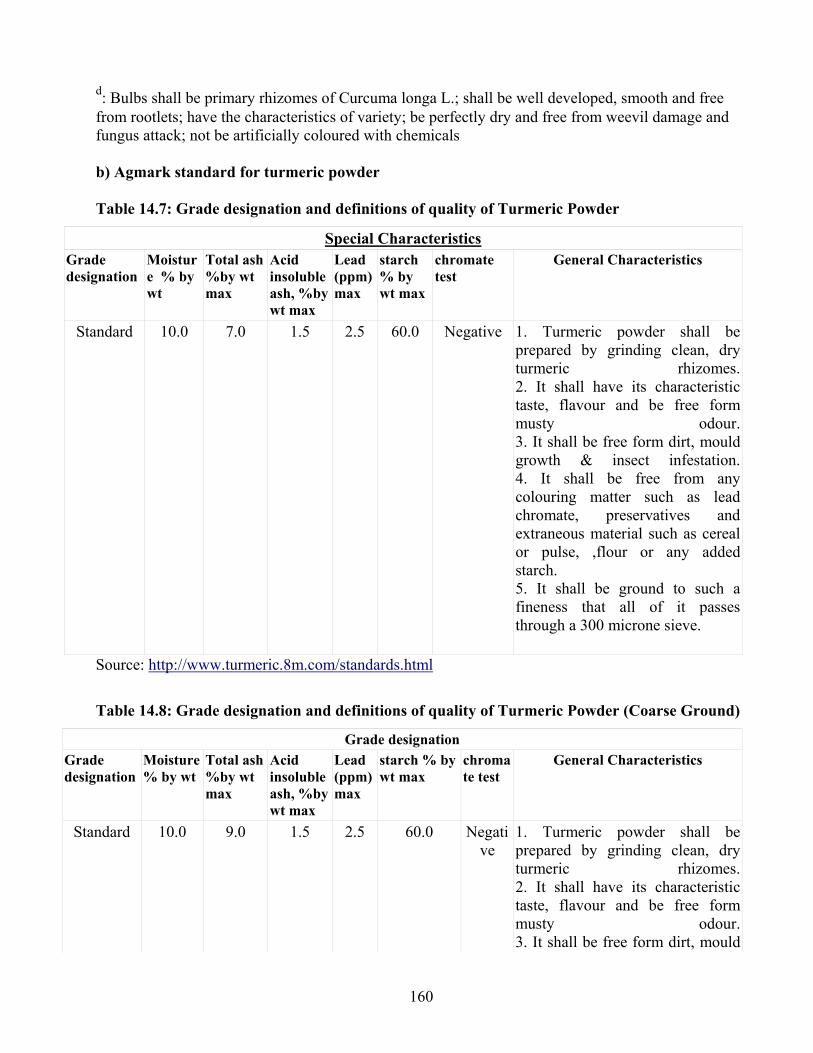
160
d: Bulbs shall be primary rhizomes of Curcuma longa L.; shall be well developed, smooth and free from rootlets; have the characteristics of variety; be perfectly dry and free from weevil damage and fungus attack; not be artificially coloured with chemicals b) Agmark standard for turmeric powder Table 14.7: Grade designation and definitions of quality of Turmeric Powder
Special Characteristics Grade designation
Moisture % by wt
Total ash %by wt max
Acid insoluble ash, %by wt max
Lead (ppm) max
starch % by wt max
chromate test
General Characteristics
Standard 10.0 7.0 1.5 2.5 60.0 Negative 1. Turmeric powder shall be prepared by grinding clean, dry turmeric rhizomes.2. It shall have its characteristic taste, flavour and be free form musty odour.3. It shall be free form dirt, mould growth & insect infestation.4. It shall be free from any colouring matter such as lead chromate, preservatives and extraneous material such as cereal or pulse, ,flour or any added starch. 5. It shall be ground to such a fineness that all of it passes through a 300 microne sieve.
Source: http://www.turmeric.8m.com/standards.html
Table 14.8: Grade designation and definitions of quality of Turmeric Powder (Coarse Ground)
Grade designation Grade designation
Moisture % by wt
Total ash %by wt max
Acid insoluble ash, %by wt max
Lead (ppm) max
starch % by wt max
chromate test
General Characteristics
Standard 10.0 9.0 1.5 2.5 60.0 Negative
1. Turmeric powder shall be prepared by grinding clean, dry turmeric rhizomes.2. It shall have its characteristic taste, flavour and be free form musty odour.3. It shall be free form dirt, mould
161
growth & insect infestation.4. It shall be free from any colouring matter such as lead chromate, preservatives and extraneous material such as cereal or pulse, flour or any added starch.5. It shall be ground to such fineness that all of it passes through a 500 micron sieve.
Source: http://www.turmeric.8m.com/standards.html c) European Spice Association (ESA) quality and sanitation specifications Table 14.9: ESA quality specifications
Turmeric S.No. Specification
Whole Ground
1 Extraneous matter % 1 1
2 Foreign matter % 2 2
3 Ash % w/w max (ISO) 8 (BSI) 9(ISO)
4 Acid insoluble ash % w/w max 2(BSI) 2.5 (ESA)
5 Maximum water % w/w max 12(BSI) 10 (ISO)
6 Volatile oil 2.5(BSI) 1.5 (ESA)
7 Microbe
c. Salmonella abs in 25 g, yeast &
molds
d. E. coli
105/g target, max 106/g absolute
102/g target, max 103/g absolute
Source:http//www.espspices.org/content/pdts/ESAQualityMinimalDocument191104.pdp
BSI : Bureau Standards Institute
ESA : European Spices Association
ISO : International Organization for Standardization
d) ASTA (American Spice Trade Association) Cleanliness Specifications for Turmeric: Turmeric exported to USA should conform to the cleanliness specification stipulated by the American Spice Trade Association (ASTA)
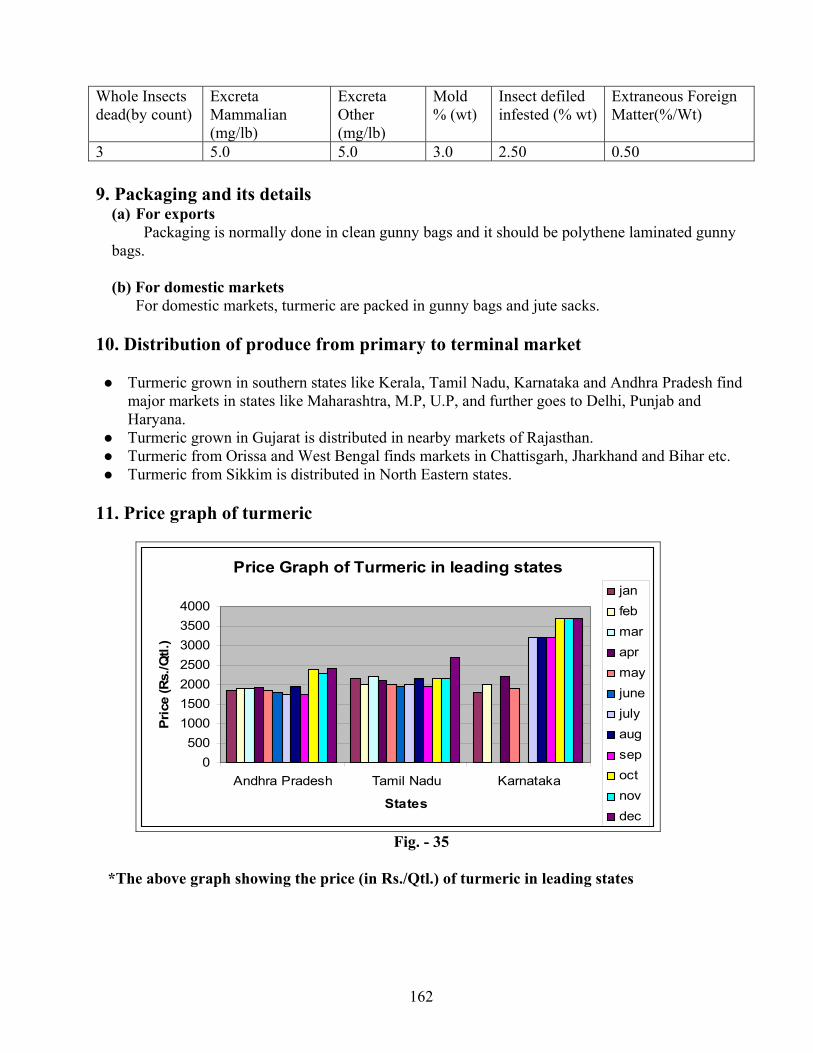
162
Whole Insects dead(by count)
Excreta Mammalian (mg/lb)
Excreta Other (mg/lb)
Mold % (wt)
Insect defiled infested (% wt)
Extraneous Foreign Matter(%/Wt)
3 5.0 5.0 3.0 2.50 0.50 9. Packaging and its details
(a) For exports Packaging is normally done in clean gunny bags and it should be polythene laminated gunny bags. (b) For domestic markets For domestic markets, turmeric are packed in gunny bags and jute sacks.
10. Distribution of produce from primary to terminal market
Turmeric grown in southern states like Kerala, Tamil Nadu, Karnataka and Andhra Pradesh find major markets in states like Maharashtra, M.P, U.P, and further goes to Delhi, Punjab and Haryana.
Turmeric grown in Gujarat is distributed in nearby markets of Rajasthan. Turmeric from Orissa and West Bengal finds markets in Chattisgarh, Jharkhand and Bihar etc. Turmeric from Sikkim is distributed in North Eastern states.
11. Price graph of turmeric
Price Graph of Turmeric in leading states
0500
1000150020002500300035004000
Andhra Pradesh Tamil Nadu Karnataka
States
Pric
e (R
s./Q
tl.)
janfebmaraprmayjunejulyaugsepoctnovdec
Fig. - 35
*The above graph showing the price (in Rs./Qtl.) of turmeric in leading states
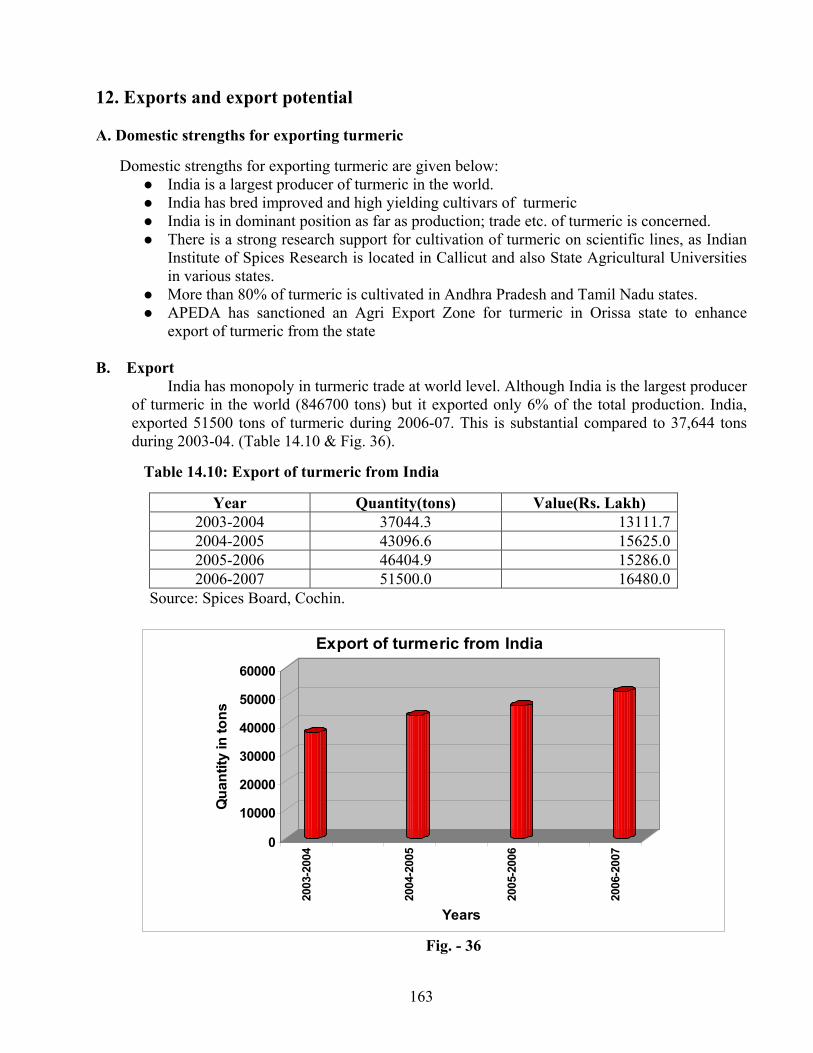
163
12. Exports and export potential
A. Domestic strengths for exporting turmeric Domestic strengths for exporting turmeric are given below:
India is a largest producer of turmeric in the world. India has bred improved and high yielding cultivars of turmeric India is in dominant position as far as production; trade etc. of turmeric is concerned. There is a strong research support for cultivation of turmeric on scientific lines, as Indian
Institute of Spices Research is located in Callicut and also State Agricultural Universities in various states.
More than 80% of turmeric is cultivated in Andhra Pradesh and Tamil Nadu states. APEDA has sanctioned an Agri Export Zone for turmeric in Orissa state to enhance
export of turmeric from the state B. Export
India has monopoly in turmeric trade at world level. Although India is the largest producer of turmeric in the world (846700 tons) but it exported only 6% of the total production. India, exported 51500 tons of turmeric during 2006-07. This is substantial compared to 37,644 tons during 2003-04. (Table 14.10 & Fig. 36).
Table 14.10: Export of turmeric from India
Year Quantity(tons) Value(Rs. Lakh) 2003-2004 37044.3 13111.72004-2005 43096.6 15625.02005-2006 46404.9 15286.02006-2007 51500.0 16480.0
Source: Spices Board, Cochin.
0
10000
20000
30000
40000
50000
60000
Qua
ntity
in to
ns
2003
-200
4
2004
-200
5
2005
-200
6
2006
-200
7
Years
Export of turmeric from India
Fig. - 36
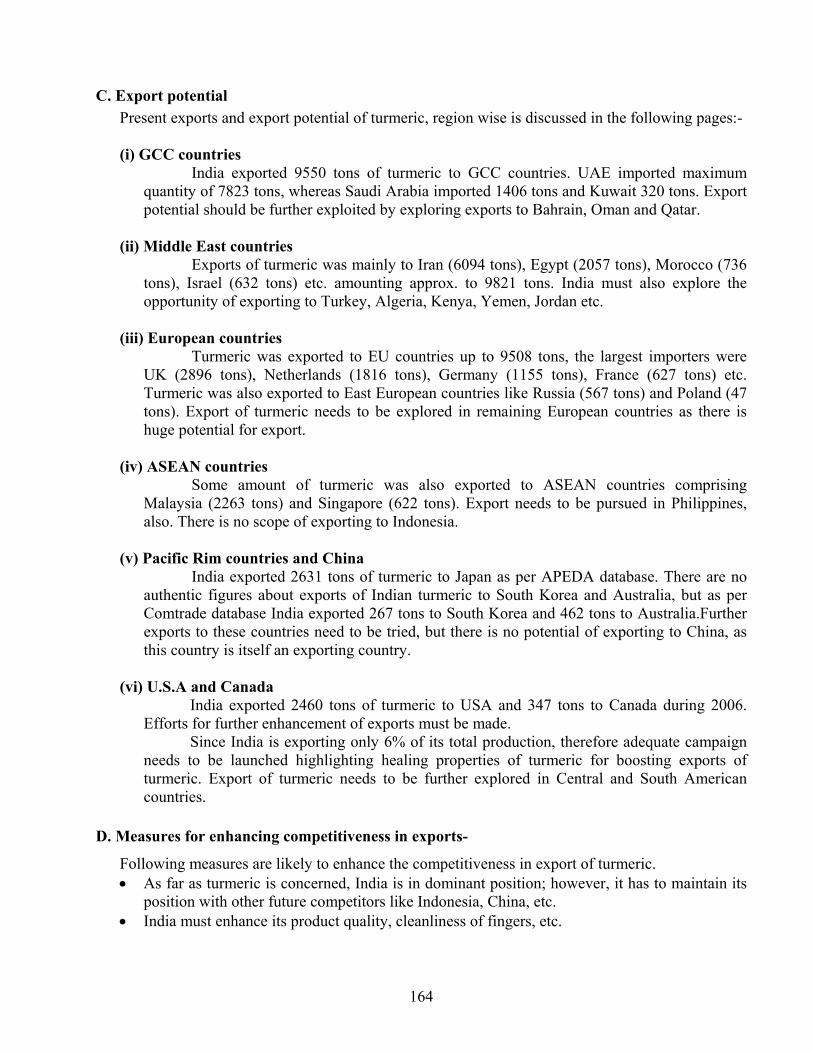
164
C. Export potential Present exports and export potential of turmeric, region wise is discussed in the following pages:- (i) GCC countries
India exported 9550 tons of turmeric to GCC countries. UAE imported maximum quantity of 7823 tons, whereas Saudi Arabia imported 1406 tons and Kuwait 320 tons. Export potential should be further exploited by exploring exports to Bahrain, Oman and Qatar.
(ii) Middle East countries
Exports of turmeric was mainly to Iran (6094 tons), Egypt (2057 tons), Morocco (736 tons), Israel (632 tons) etc. amounting approx. to 9821 tons. India must also explore the opportunity of exporting to Turkey, Algeria, Kenya, Yemen, Jordan etc.
(iii) European countries
Turmeric was exported to EU countries up to 9508 tons, the largest importers were UK (2896 tons), Netherlands (1816 tons), Germany (1155 tons), France (627 tons) etc. Turmeric was also exported to East European countries like Russia (567 tons) and Poland (47 tons). Export of turmeric needs to be explored in remaining European countries as there is huge potential for export.
(iv) ASEAN countries
Some amount of turmeric was also exported to ASEAN countries comprising Malaysia (2263 tons) and Singapore (622 tons). Export needs to be pursued in Philippines, also. There is no scope of exporting to Indonesia.
(v) Pacific Rim countries and China
India exported 2631 tons of turmeric to Japan as per APEDA database. There are no authentic figures about exports of Indian turmeric to South Korea and Australia, but as per Comtrade database India exported 267 tons to South Korea and 462 tons to Australia.Further exports to these countries need to be tried, but there is no potential of exporting to China, as this country is itself an exporting country.
(vi) U.S.A and Canada
India exported 2460 tons of turmeric to USA and 347 tons to Canada during 2006. Efforts for further enhancement of exports must be made.
Since India is exporting only 6% of its total production, therefore adequate campaign needs to be launched highlighting healing properties of turmeric for boosting exports of turmeric. Export of turmeric needs to be further explored in Central and South American countries.
D. Measures for enhancing competitiveness in exports-
Following measures are likely to enhance the competitiveness in export of turmeric. • As far as turmeric is concerned, India is in dominant position; however, it has to maintain its
position with other future competitors like Indonesia, China, etc. • India must enhance its product quality, cleanliness of fingers, etc.
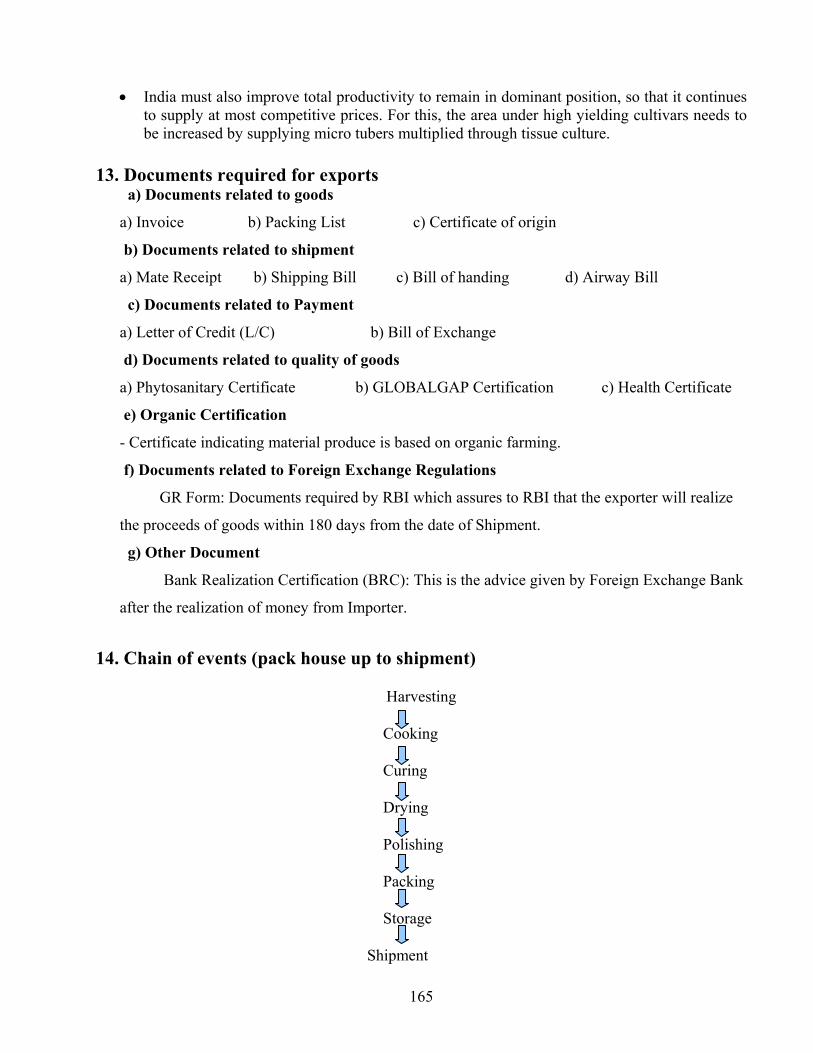
165
• India must also improve total productivity to remain in dominant position, so that it continues to supply at most competitive prices. For this, the area under high yielding cultivars needs to be increased by supplying micro tubers multiplied through tissue culture.
13. Documents required for exports
a) Documents related to goods
a) Invoice b) Packing List c) Certificate of origin
b) Documents related to shipment
a) Mate Receipt b) Shipping Bill c) Bill of handing d) Airway Bill
c) Documents related to Payment
a) Letter of Credit (L/C) b) Bill of Exchange
d) Documents related to quality of goods
a) Phytosanitary Certificate b) GLOBALGAP Certification c) Health Certificate
e) Organic Certification
- Certificate indicating material produce is based on organic farming.
f) Documents related to Foreign Exchange Regulations
GR Form: Documents required by RBI which assures to RBI that the exporter will realize
the proceeds of goods within 180 days from the date of Shipment.
g) Other Document
Bank Realization Certification (BRC): This is the advice given by Foreign Exchange Bank
after the realization of money from Importer.
14. Chain of events (pack house up to shipment)
Harvesting
Cooking
Curing
Drying
Polishing
Packing
Storage
Shipment
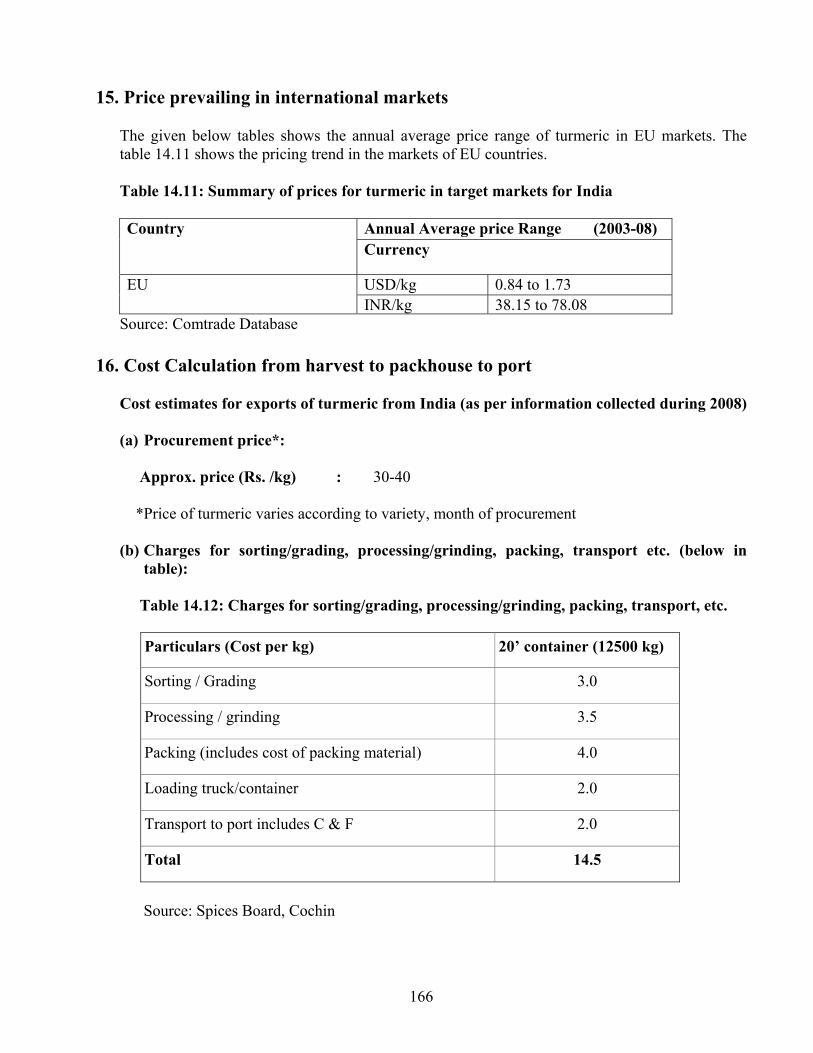
166
15. Price prevailing in international markets
The given below tables shows the annual average price range of turmeric in EU markets. The table 14.11 shows the pricing trend in the markets of EU countries.
Table 14.11: Summary of prices for turmeric in target markets for India
Annual Average price Range (2003-08) Country Currency
USD/kg 0.84 to 1.73 EU INR/kg 38.15 to 78.08
Source: Comtrade Database 16. Cost Calculation from harvest to packhouse to port
Cost estimates for exports of turmeric from India (as per information collected during 2008)
(a) Procurement price*: Approx. price (Rs. /kg) : 30-40 *Price of turmeric varies according to variety, month of procurement
(b) Charges for sorting/grading, processing/grinding, packing, transport etc. (below in
table):
Table 14.12: Charges for sorting/grading, processing/grinding, packing, transport, etc.
Particulars (Cost per kg) 20’ container (12500 kg)
Sorting / Grading 3.0
Processing / grinding 3.5
Packing (includes cost of packing material) 4.0
Loading truck/container 2.0
Transport to port includes C & F 2.0
Total 14.5
Source: Spices Board, Cochin
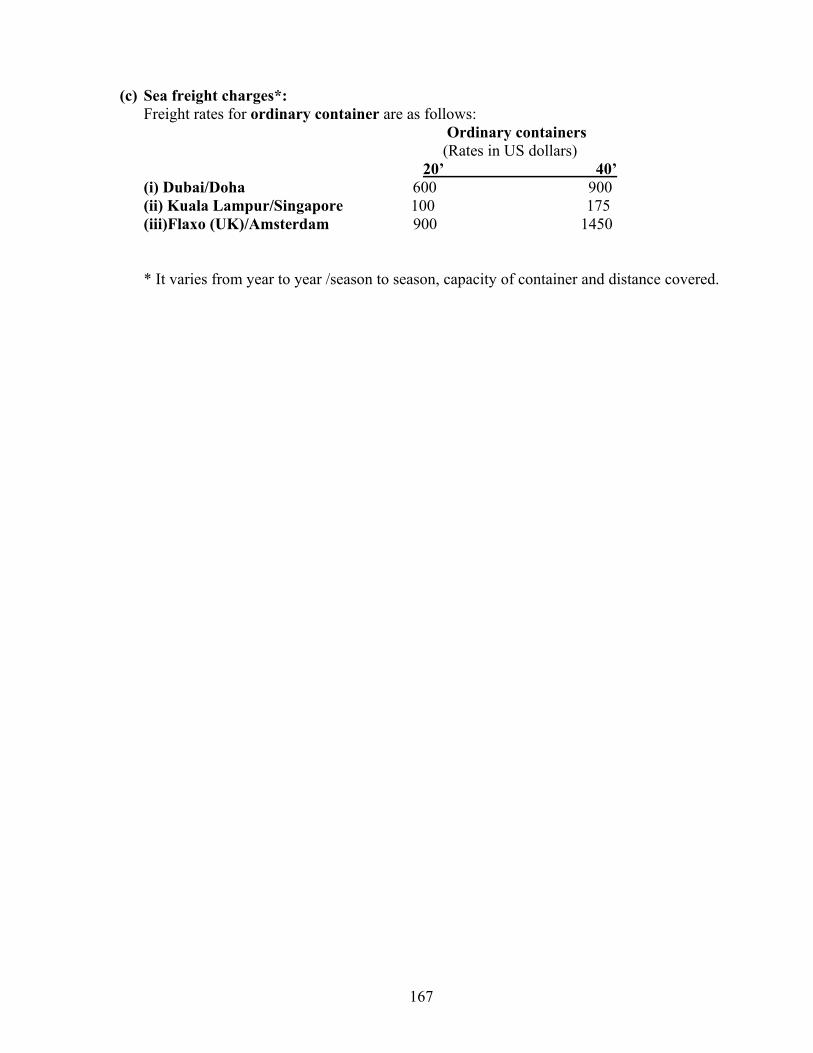
167
(c) Sea freight charges*: Freight rates for ordinary container are as follows:
Ordinary containers (Rates in US dollars) 20’ 40’
(i) Dubai/Doha 600 900 (ii) Kuala Lampur/Singapore 100 175 (iii)Flaxo (UK)/Amsterdam 900 1450 * It varies from year to year /season to season, capacity of container and distance covered.
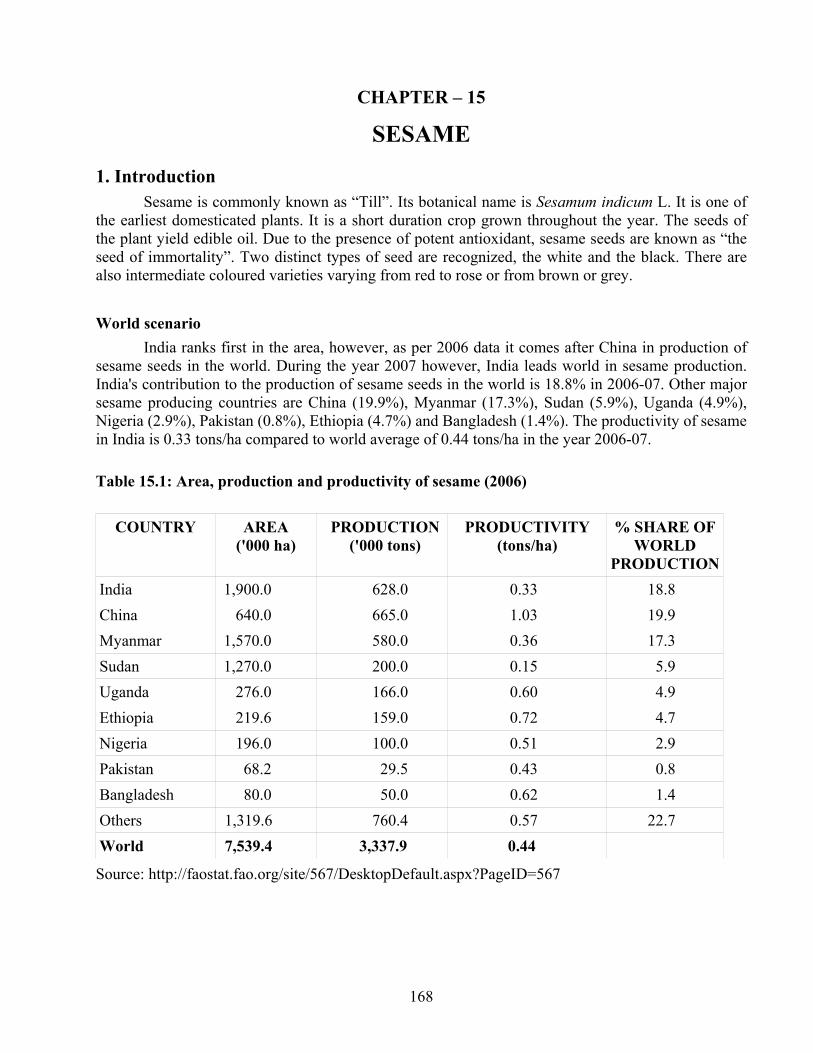
168
CHAPTER – 15
SESAME
1. Introduction Sesame is commonly known as “Till”. Its botanical name is Sesamum indicum L. It is one of
the earliest domesticated plants. It is a short duration crop grown throughout the year. The seeds of the plant yield edible oil. Due to the presence of potent antioxidant, sesame seeds are known as “the seed of immortality”. Two distinct types of seed are recognized, the white and the black. There are also intermediate coloured varieties varying from red to rose or from brown or grey. World scenario
India ranks first in the area, however, as per 2006 data it comes after China in production of sesame seeds in the world. During the year 2007 however, India leads world in sesame production. India's contribution to the production of sesame seeds in the world is 18.8% in 2006-07. Other major sesame producing countries are China (19.9%), Myanmar (17.3%), Sudan (5.9%), Uganda (4.9%), Nigeria (2.9%), Pakistan (0.8%), Ethiopia (4.7%) and Bangladesh (1.4%). The productivity of sesame in India is 0.33 tons/ha compared to world average of 0.44 tons/ha in the year 2006-07.
Table 15.1: Area, production and productivity of sesame (2006)
COUNTRY AREA ('000 ha)
PRODUCTION('000 tons)
PRODUCTIVITY (tons/ha)
% SHARE OF WORLD
PRODUCTIONIndia 1,900.0 628.0 0.33 18.8 China 640.0 665.0 1.03 19.9 Myanmar 1,570.0 580.0 0.36 17.3 Sudan 1,270.0 200.0 0.15 5.9 Uganda 276.0 166.0 0.60 4.9 Ethiopia 219.6 159.0 0.72 4.7 Nigeria 196.0 100.0 0.51 2.9 Pakistan 68.2 29.5 0.43 0.8 Bangladesh 80.0 50.0 0.62 1.4 Others 1,319.6 760.4 0.57 22.7 World 7,539.4 3,337.9 0.44
Source: http://faostat.fao.org/site/567/DesktopDefault.aspx?PageID=567
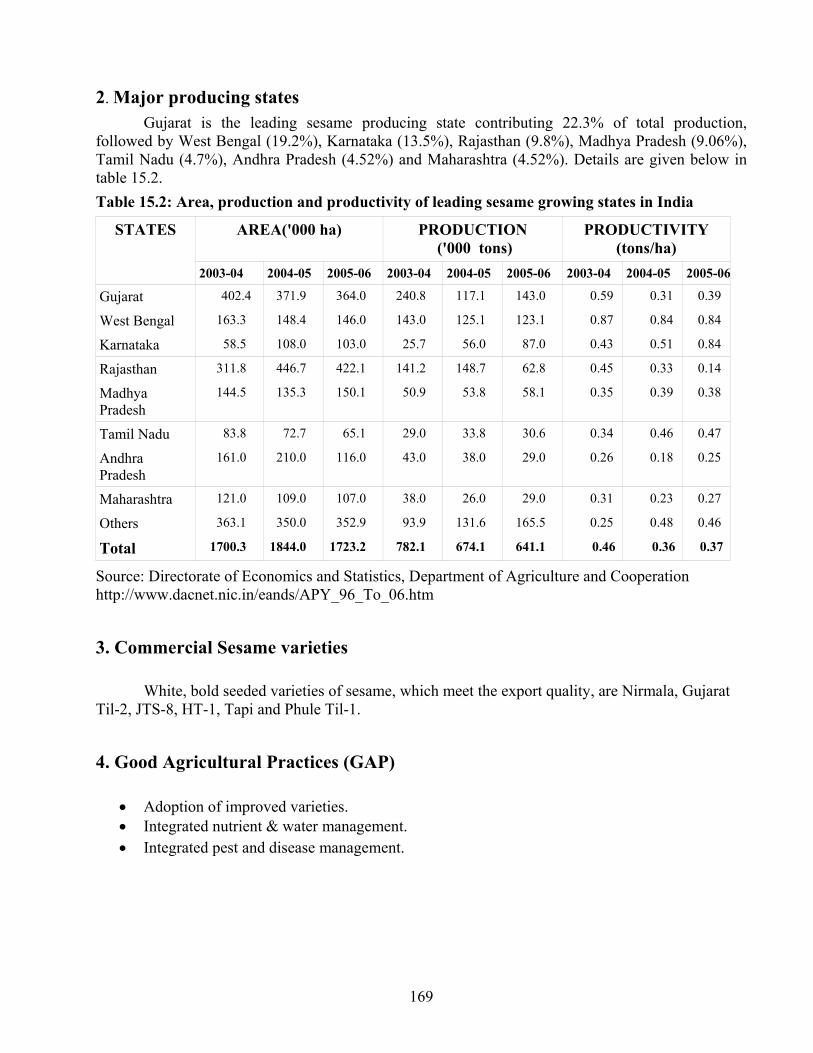
169
2. Major producing states Gujarat is the leading sesame producing state contributing 22.3% of total production,
followed by West Bengal (19.2%), Karnataka (13.5%), Rajasthan (9.8%), Madhya Pradesh (9.06%), Tamil Nadu (4.7%), Andhra Pradesh (4.52%) and Maharashtra (4.52%). Details are given below in table 15.2. Table 15.2: Area, production and productivity of leading sesame growing states in India
AREA('000 ha) PRODUCTION ('000 tons)
PRODUCTIVITY (tons/ha)
STATES
2003-04 2004-05 2005-06 2003-04 2004-05 2005-06 2003-04 2004-05 2005-06
Gujarat 402.4 371.9 364.0 240.8 117.1 143.0 0.59 0.31 0.39
West Bengal 163.3 148.4 146.0 143.0 125.1 123.1 0.87 0.84 0.84
Karnataka 58.5 108.0 103.0 25.7 56.0 87.0 0.43 0.51 0.84
Rajasthan 311.8 446.7 422.1 141.2 148.7 62.8 0.45 0.33 0.14
Madhya Pradesh
144.5 135.3 150.1 50.9 53.8 58.1 0.35 0.39 0.38
Tamil Nadu 83.8 72.7 65.1 29.0 33.8 30.6 0.34 0.46 0.47
Andhra Pradesh
161.0 210.0 116.0 43.0 38.0 29.0 0.26 0.18 0.25
Maharashtra 121.0 109.0 107.0 38.0 26.0 29.0 0.31 0.23 0.27
Others 363.1 350.0 352.9 93.9 131.6 165.5 0.25 0.48 0.46
Total 1700.3 1844.0 1723.2 782.1 674.1 641.1 0.46 0.36 0.37
Source: Directorate of Economics and Statistics, Department of Agriculture and Cooperation http://www.dacnet.nic.in/eands/APY_96_To_06.htm
3. Commercial Sesame varieties
White, bold seeded varieties of sesame, which meet the export quality, are Nirmala, Gujarat Til-2, JTS-8, HT-1, Tapi and Phule Til-1.
4. Good Agricultural Practices (GAP)
• Adoption of improved varieties. • Integrated nutrient & water management. • Integrated pest and disease management.
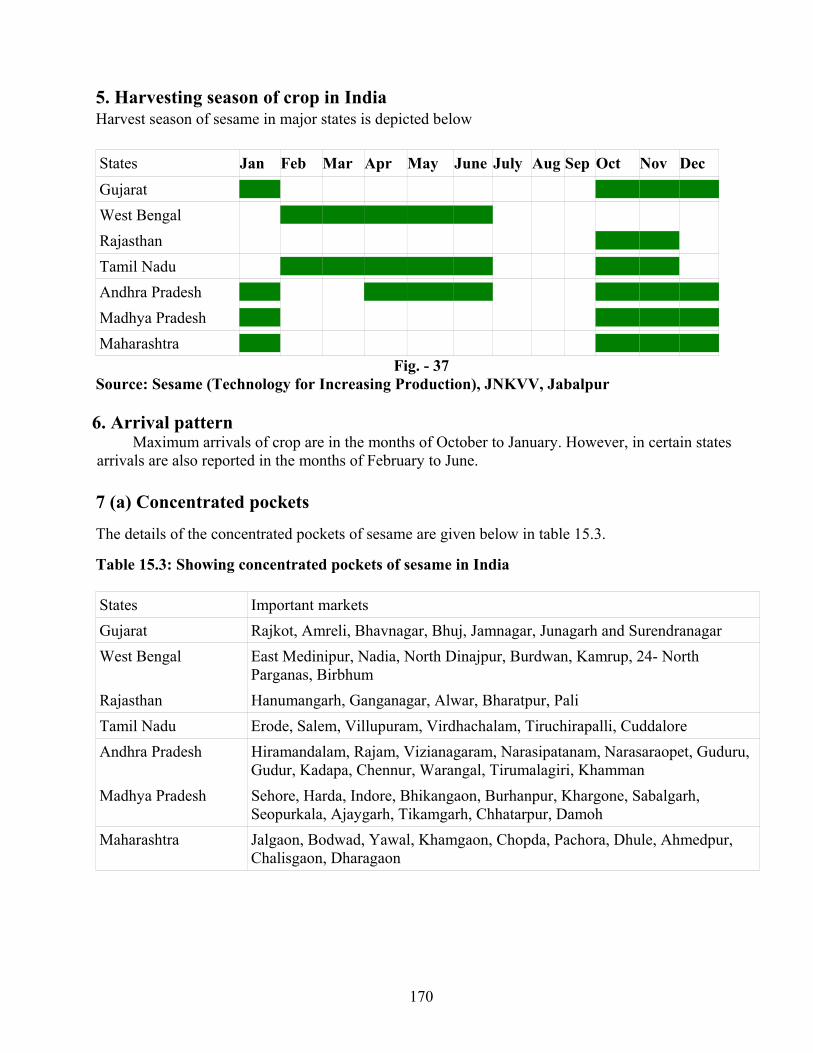
170
5. Harvesting season of crop in India Harvest season of sesame in major states is depicted below States Jan Feb Mar Apr May June July Aug Sep Oct Nov Dec
Gujarat West Bengal Rajasthan Tamil Nadu Andhra Pradesh Madhya Pradesh Maharashtra
Fig. - 37 Source: Sesame (Technology for Increasing Production), JNKVV, Jabalpur 6. Arrival pattern Maximum arrivals of crop are in the months of October to January. However, in certain states arrivals are also reported in the months of February to June.
7 (a) Concentrated pockets The details of the concentrated pockets of sesame are given below in table 15.3. Table 15.3: Showing concentrated pockets of sesame in India States Important markets Gujarat Rajkot, Amreli, Bhavnagar, Bhuj, Jamnagar, Junagarh and Surendranagar West Bengal East Medinipur, Nadia, North Dinajpur, Burdwan, Kamrup, 24- North
Parganas, Birbhum Rajasthan Hanumangarh, Ganganagar, Alwar, Bharatpur, Pali Tamil Nadu Erode, Salem, Villupuram, Virdhachalam, Tiruchirapalli, Cuddalore Andhra Pradesh Hiramandalam, Rajam, Vizianagaram, Narasipatanam, Narasaraopet, Guduru,
Gudur, Kadapa, Chennur, Warangal, Tirumalagiri, Khamman Madhya Pradesh Sehore, Harda, Indore, Bhikangaon, Burhanpur, Khargone, Sabalgarh,
Seopurkala, Ajaygarh, Tikamgarh, Chhatarpur, Damoh Maharashtra Jalgaon, Bodwad, Yawal, Khamgaon, Chopda, Pachora, Dhule, Ahmedpur,
Chalisgaon, Dharagaon
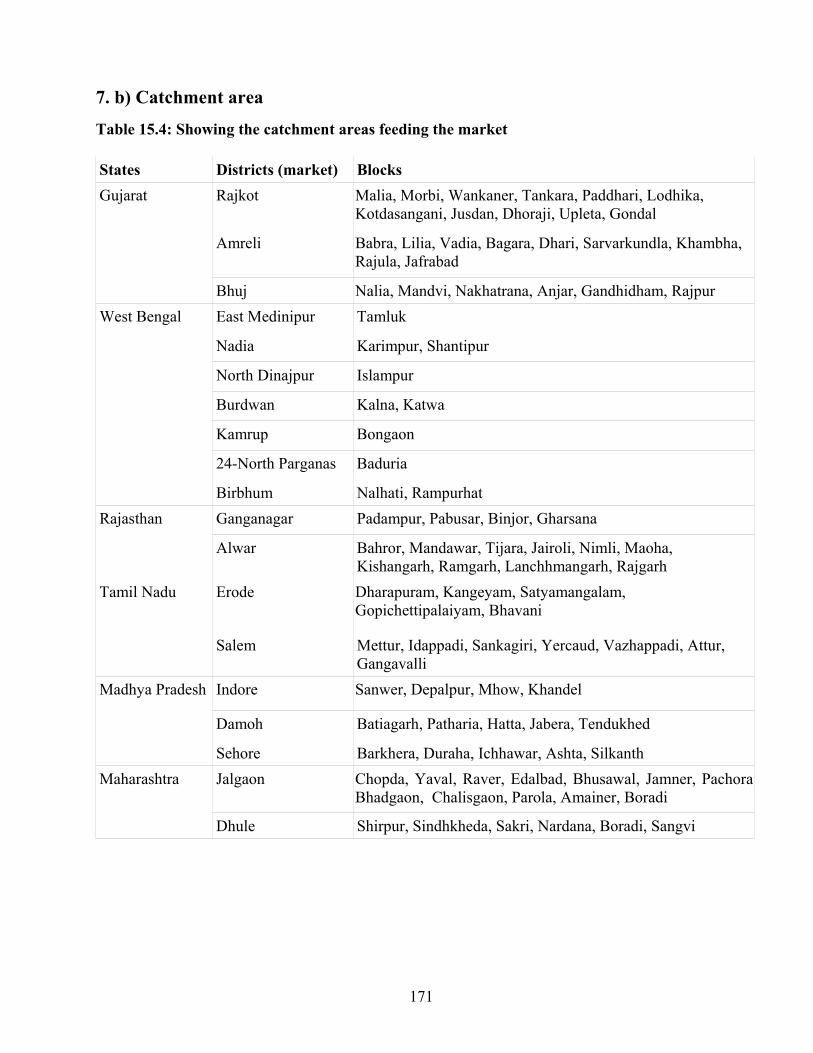
171
7. b) Catchment area Table 15.4: Showing the catchment areas feeding the market States Districts (market) Blocks
Rajkot Malia, Morbi, Wankaner, Tankara, Paddhari, Lodhika, Kotdasangani, Jusdan, Dhoraji, Upleta, Gondal
Amreli Babra, Lilia, Vadia, Bagara, Dhari, Sarvarkundla, Khambha, Rajula, Jafrabad
Gujarat
Bhuj Nalia, Mandvi, Nakhatrana, Anjar, Gandhidham, Rajpur East Medinipur Tamluk
Nadia Karimpur, Shantipur
North Dinajpur Islampur
Burdwan Kalna, Katwa
Kamrup Bongaon
24-North Parganas Baduria
West Bengal
Birbhum Nalhati, Rampurhat Ganganagar Padampur, Pabusar, Binjor, Gharsana Rajasthan
Alwar Bahror, Mandawar, Tijara, Jairoli, Nimli, Maoha, Kishangarh, Ramgarh, Lanchhmangarh, Rajgarh
Erode Dharapuram, Kangeyam, Satyamangalam, Gopichettipalaiyam, Bhavani
Tamil Nadu
Salem Mettur, Idappadi, Sankagiri, Yercaud, Vazhappadi, Attur, Gangavalli
Indore Sanwer, Depalpur, Mhow, Khandel
Damoh Batiagarh, Patharia, Hatta, Jabera, Tendukhed
Madhya Pradesh
Sehore Barkhera, Duraha, Ichhawar, Ashta, Silkanth Jalgaon Chopda, Yaval, Raver, Edalbad, Bhusawal, Jamner, Pachora,
Bhadgaon, Chalisgaon, Parola, Amainer, Boradi Maharashtra
Dhule Shirpur, Sindhkheda, Sakri, Nardana, Boradi, Sangvi
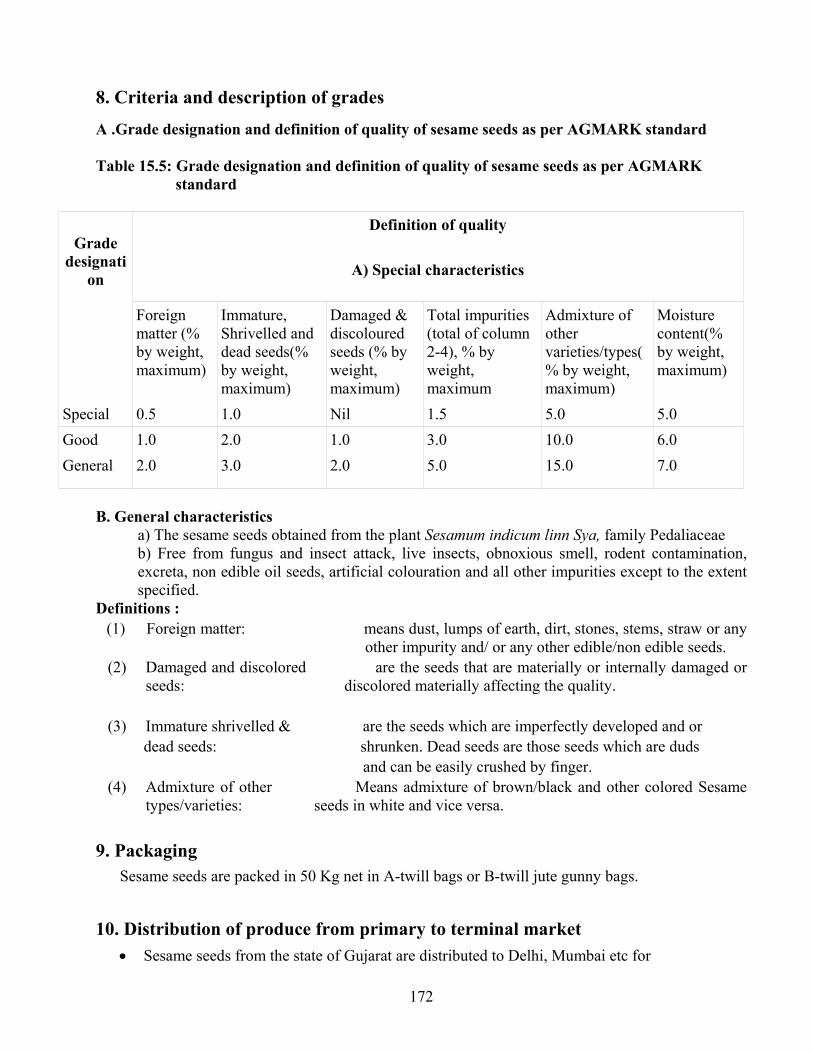
172
8. Criteria and description of grades A .Grade designation and definition of quality of sesame seeds as per AGMARK standard Table 15.5: Grade designation and definition of quality of sesame seeds as per AGMARK standard
Definition of quality
A) Special characteristics
Grade
designation
Foreign matter (% by weight, maximum)
Immature, Shrivelled and dead seeds(% by weight, maximum)
Damaged & discoloured seeds (% by weight, maximum)
Total impurities (total of column 2-4), % by weight, maximum
Admixture of other varieties/types(% by weight, maximum)
Moisture content(% by weight, maximum)
Special 0.5 1.0 Nil 1.5 5.0 5.0 Good 1.0 2.0 1.0 3.0 10.0 6.0 General 2.0 3.0 2.0 5.0 15.0 7.0
B. General characteristics
a) The sesame seeds obtained from the plant Sesamum indicum linn Sya, family Pedaliaceae b) Free from fungus and insect attack, live insects, obnoxious smell, rodent contamination, excreta, non edible oil seeds, artificial colouration and all other impurities except to the extent specified.
Definitions : (1) Foreign matter: means dust, lumps of earth, dirt, stones, stems, straw or any
other impurity and/ or any other edible/non edible seeds. (2) Damaged and discolored are the seeds that are materially or internally damaged or
seeds: discolored materially affecting the quality.
(3) Immature shrivelled & are the seeds which are imperfectly developed and or dead seeds: shrunken. Dead seeds are those seeds which are duds and can be easily crushed by finger. (4) Admixture of other Means admixture of brown/black and other colored Sesame
types/varieties: seeds in white and vice versa. 9. Packaging Sesame seeds are packed in 50 Kg net in A-twill bags or B-twill jute gunny bags.
10. Distribution of produce from primary to terminal market
• Sesame seeds from the state of Gujarat are distributed to Delhi, Mumbai etc for
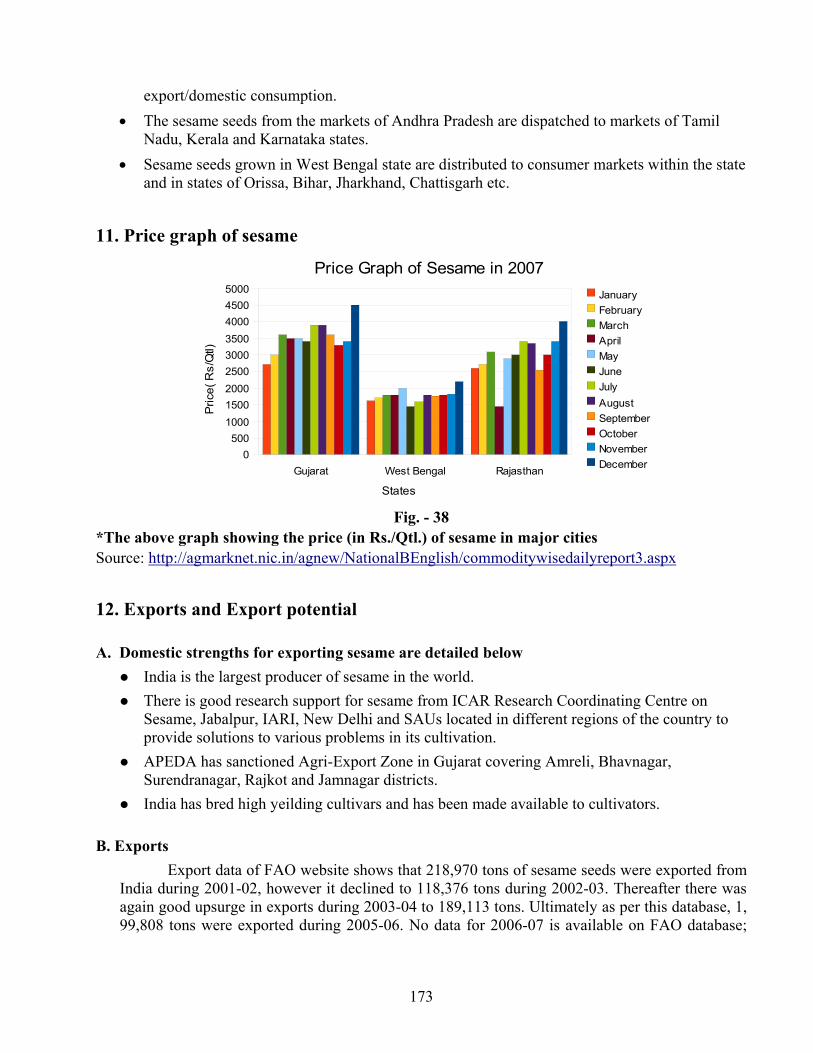
173
export/domestic consumption. • The sesame seeds from the markets of Andhra Pradesh are dispatched to markets of Tamil
Nadu, Kerala and Karnataka states. • Sesame seeds grown in West Bengal state are distributed to consumer markets within the state
and in states of Orissa, Bihar, Jharkhand, Chattisgarh etc.
11. Price graph of sesame
Fig. - 38 *The above graph showing the price (in Rs./Qtl.) of sesame in major cities Source: http://agmarknet.nic.in/agnew/NationalBEnglish/commoditywisedailyreport3.aspx
12. Exports and Export potential
A. Domestic strengths for exporting sesame are detailed below India is the largest producer of sesame in the world. There is good research support for sesame from ICAR Research Coordinating Centre on
Sesame, Jabalpur, IARI, New Delhi and SAUs located in different regions of the country to provide solutions to various problems in its cultivation.
APEDA has sanctioned Agri-Export Zone in Gujarat covering Amreli, Bhavnagar, Surendranagar, Rajkot and Jamnagar districts.
India has bred high yeilding cultivars and has been made available to cultivators.
B. Exports Export data of FAO website shows that 218,970 tons of sesame seeds were exported from
India during 2001-02, however it declined to 118,376 tons during 2002-03. Thereafter there was again good upsurge in exports during 2003-04 to 189,113 tons. Ultimately as per this database, 1, 99,808 tons were exported during 2005-06. No data for 2006-07 is available on FAO database;
Gujarat West Bengal Rajasthan0
500100015002000250030003500400045005000
Price Graph of Sesame in 2007JanuaryFebruaryMarchAprilMayJuneJulyAugustSeptemberOctoberNovemberDecember
States
Pric
e( R
s/Q
tl)
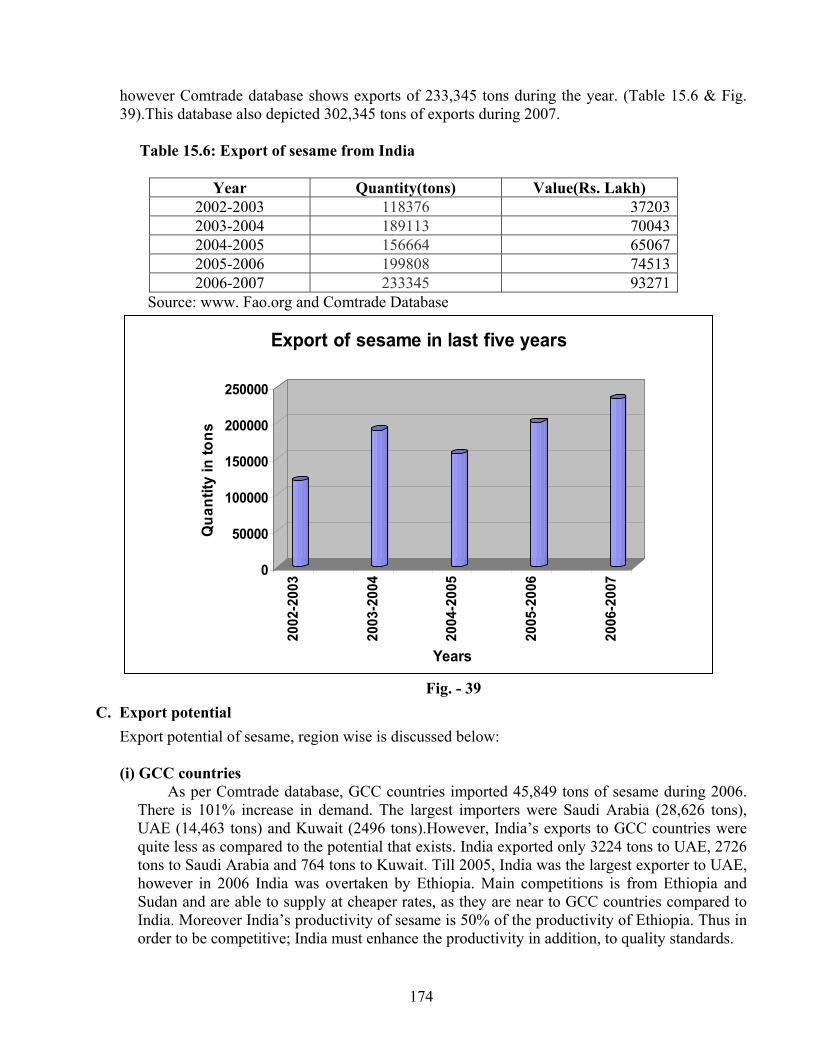
174
however Comtrade database shows exports of 233,345 tons during the year. (Table 15.6 & Fig. 39).This database also depicted 302,345 tons of exports during 2007. Table 15.6: Export of sesame from India
Year Quantity(tons) Value(Rs. Lakh)
2002-2003 118376 372032003-2004 189113 700432004-2005 156664 650672005-2006 199808 745132006-2007 233345 93271
Source: www. Fao.org and Comtrade Database
0
50000
100000
150000
200000
250000
Qua
ntity
in to
ns
2002
-200
3
2003
-200
4
2004
-200
5
2005
-200
6
2006
-200
7
Years
Export of sesame in last five years
Fig. - 39
C. Export potential Export potential of sesame, region wise is discussed below:
(i) GCC countries
As per Comtrade database, GCC countries imported 45,849 tons of sesame during 2006. There is 101% increase in demand. The largest importers were Saudi Arabia (28,626 tons), UAE (14,463 tons) and Kuwait (2496 tons).However, India’s exports to GCC countries were quite less as compared to the potential that exists. India exported only 3224 tons to UAE, 2726 tons to Saudi Arabia and 764 tons to Kuwait. Till 2005, India was the largest exporter to UAE, however in 2006 India was overtaken by Ethiopia. Main competitions is from Ethiopia and Sudan and are able to supply at cheaper rates, as they are near to GCC countries compared to India. Moreover India’s productivity of sesame is 50% of the productivity of Ethiopia. Thus in order to be competitive; India must enhance the productivity in addition, to quality standards.
175
(ii) Middle East countries India is exporting to the tune of 10,467 tons to Turkey, 1665 tons to Cyprus, 1069 tons to
Jordan and 153 tons to Morocco. India should nurture these markets to further enhance exports. India must also explore export to Egypt as they imported 48,294 tons of sesame seeds during 2006.
(iii) European Union
European Union imported sesame seeds of 1, 21,053 tons during 2006. The quantum of imports decreased from 2003 level at 1%.
India’s exports to EU were maximum, as 48% of the requirements were met by India and other exporters are Guatemala, Sudan, and Paraguay etc. supplying only limited quantity. Largest importers of sesame from India during the year 2006 were Germany (14,288 tons), Netherlands (11,993 tons), Greece (9748 tons), Poland (6231 tons), Italy (4671 tons), UK (3343 tons) and France (2016 tons).India must keep up the momentum and to maintain position as largest supplier/ exporter to EU must improve upon quality and cut on cost of production to be more competitive.
(iv) ASEAN countries
ASEAN countries imported sesame seeds up to 22,510 tons during 2006.There is a 21.6% increase in demand. India is meeting 60% demand of ASEAN countries. Main importers of Indian sesame are Malaysia (7195 tons), Indonesia (3258 tons), Singapore (1876 tons) and Philippines (921 tons).Major competition with India in ASEAN region is from Myanmar, but India is able to make available sesame in these markets at competitive prices and can be much more competitive if India can cut down on cost of production by increasing productivity in a significant manner.
(v) Pacific Rim countries and China
Export potential in these countries is as follows: (a) South Korea
South Korea imported 85,567 tons of sesame seeds during 2006. Out of this total import, 38,686 tons were exported by India and 33,081 tons by China. India supplied at much competitive price over China and thus there is a scope of increasing share in imports. India must improve upon quality and reduction in costs.
(b) Australia
Australia imported 6604 tons of sesame during 2006, out of which India supplied 4836 tons and rest by Mexico, Guatemala and China. However India supplied sesame like in South Korea at much competitive and cheaper price compared to other countries mentioned above.
(c) China
China imported 2, 63,587 tons of sesame during 2006.Major exporters to China were Ethiopia (1, 34,989 tons), Sudan (67,426 tons), and Tanzania (12,570 tons). India exported only 13,487 tons during this year. India exported sesame at much competitive rates over Ethiopia and Sudan.Next year in 2007 China imported 1, 94,461 tons of sesame. This year Ethiopia’s share decreased and supplied only 75,563 tons, whereas India’s share increased to 37,214 tons compared to 13487 tons in 2006.
176
Since India is nearer to China compared to Ethiopia and Sudan and therefore India must make a sincere effort to have more share in imports of China. This needs to be done on priority by cutting cost of cultivation and improving quality, as China is largest importer in the world because of massive demand of sesame in China.
(d) Japan
Japan is second largest importer of sesame next to China in the world and imported 1, 59,110 tons during the year 2006. India did not export sesame to Japan at all. However, requirements of sesame were met by Nigeria (45,388 tons), Paraguay (21,986 tons), Tanzania (17,579 tons), China (9497 tons), Bolivia (10,439 tons) and Gautemala (7369 tons). India must explore exports to Japanese market, as India is closer to Japan compared to Gautemala, Paraguay, Nigeria, Tanzania etc and can offer much better competitive price over Paraguay, China, Gautemala and Bolivia.
(vi) North America
USA alone imported 43,316 tons of sesame during 2006. Canada also imported sizeable quantities of sesame although exact figures are not known.India exported during the year (2006), 18,436 tons of sesame seeds to U.S.A and 4265 tons to Canada. Although India supplies 42% of demand of U.S.A, however still effort needs to be made to have higher share in imports of U.S.A.
D. Measures for enhancing competitiveness Competitiveness for export of sesame seed can be enhanced by taking following measures.
• Competitiveness can be enhanced by meeting the quality standards of importing countries regarding pesticide residues, foreign matter, moisture level etc.
• Productivity of sesame in India is 1/3rd of the productivity of China and also lower than countries like Bangladesh and African countries like Uganda, Ethiopia, Nigeria etc. thus only way to enhance India's competitiveness is to increase the productivity per hectare, so that India can make sesame available at competitive prices.
• India is playing a dominant role in International trade of sesame and therefore it will be advisable to develop brand name for Indian sesame. It will help in enhancing competitiveness.
13. Storage Sesame seeds should be stored in clean and dry, moisture proof area free from insects, pests and rodents. 14. Documents required for exports a) Documents related to goods
a) Invoice b) Packing List c) Certificate of origin
b) Documents related to shipment
a) Mate Receipt b) Shipping Bill c) Bill of handing d) Airway Bill
177
c) Documents related to Payment
a) Letter of Credit (L/C) b) Bill of Exchange
d) Documents related to quality of goods
a) Phytosanitary Certificate b) GLOBALGAP Certification c) Health Certificate
e) Organic Certification
- Certificate indicating material produce is based on organic farming.
f) Documents related to Foreign Exchange Regulations
GR Form: Documents required by RBI which assures to RBI that the exporter will realize the
proceeds of goods within 180 days from the date of Shipment.
g) Other Document
Bank Realization Certification (BRC):This is the advice given by Foreign Exchange Bank after
the realization of money from Importer.
15. Chain of events Harvesting
Curing and threshing
Winnowing
Cleaning
Sieving
Drying
Transportation
16. Price prevailing in international markets
The given below tables shows the annual average price range of sesame seeds in the market of EU countries. The table 15.7 shows the pricing trend in the market of EU countries
Table 15.7: Summary of prices for sesame seeds in target market for India
Annual Average price Range (2003-08) Country Currency
USD/kg 0.99 to 2.95 EU INR/kg 44.9 to 132.98
Source: Comtrade Database
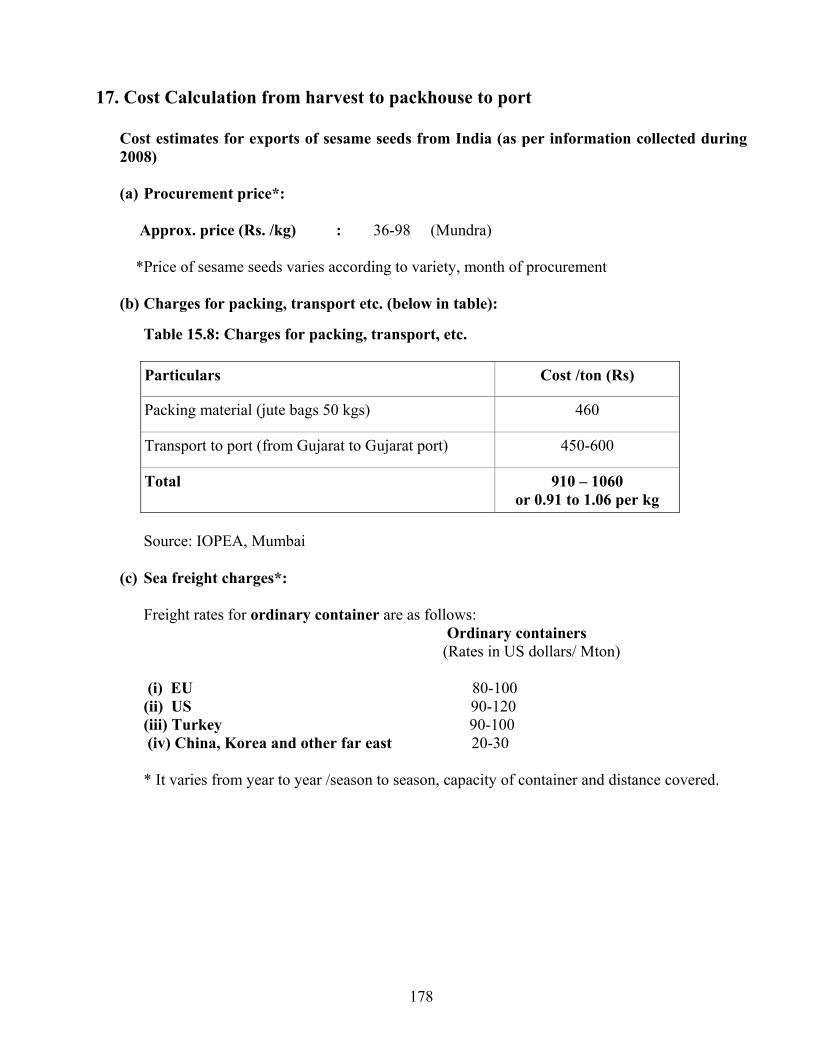
178
17. Cost Calculation from harvest to packhouse to port
Cost estimates for exports of sesame seeds from India (as per information collected during 2008)
(a) Procurement price*: Approx. price (Rs. /kg) : 36-98 (Mundra) *Price of sesame seeds varies according to variety, month of procurement (b) Charges for packing, transport etc. (below in table): Table 15.8: Charges for packing, transport, etc.
Particulars Cost /ton (Rs)
Packing material (jute bags 50 kgs) 460
Transport to port (from Gujarat to Gujarat port) 450-600
Total 910 – 1060 or 0.91 to 1.06 per kg
Source: IOPEA, Mumbai
(c) Sea freight charges*:
Freight rates for ordinary container are as follows: Ordinary containers (Rates in US dollars/ Mton)
(i) EU 80-100 (ii) US 90-120 (iii) Turkey 90-100 (iv) China, Korea and other far east 20-30 * It varies from year to year /season to season, capacity of container and distance covered.
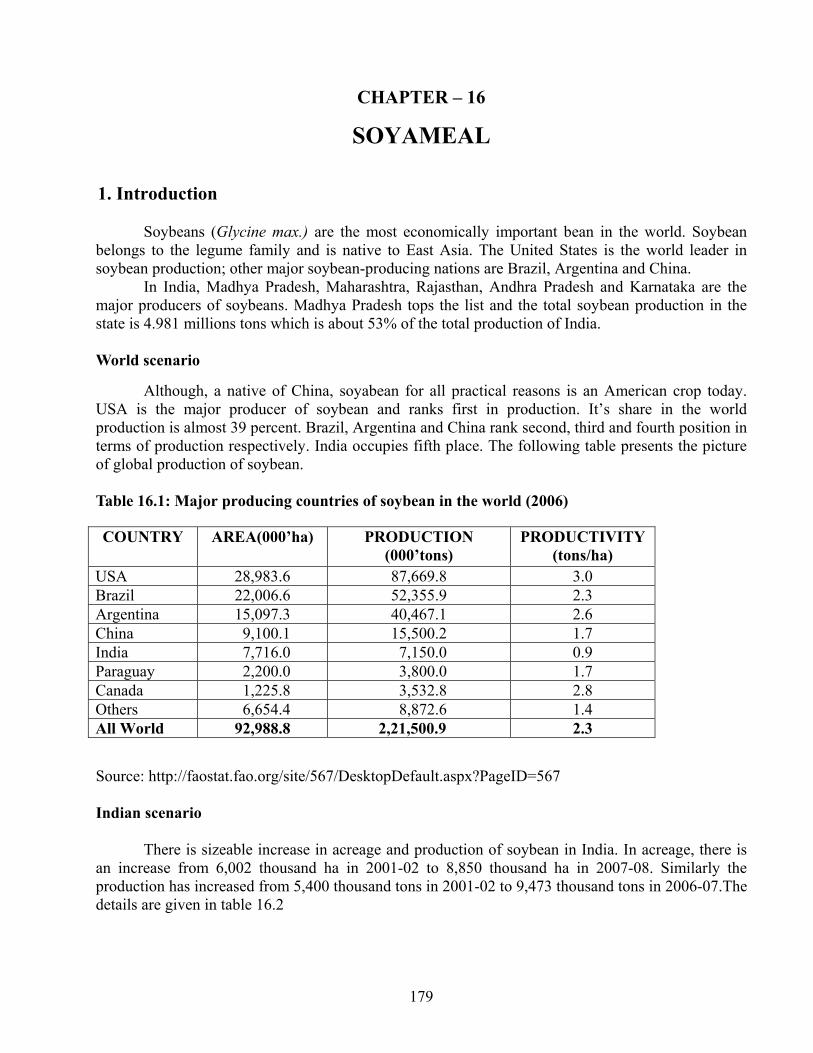
179
CHAPTER – 16
SOYAMEAL
1. Introduction
Soybeans (Glycine max.) are the most economically important bean in the world. Soybean belongs to the legume family and is native to East Asia. The United States is the world leader in soybean production; other major soybean-producing nations are Brazil, Argentina and China.
In India, Madhya Pradesh, Maharashtra, Rajasthan, Andhra Pradesh and Karnataka are the major producers of soybeans. Madhya Pradesh tops the list and the total soybean production in the state is 4.981 millions tons which is about 53% of the total production of India. World scenario
Although, a native of China, soyabean for all practical reasons is an American crop today. USA is the major producer of soybean and ranks first in production. It’s share in the world production is almost 39 percent. Brazil, Argentina and China rank second, third and fourth position in terms of production respectively. India occupies fifth place. The following table presents the picture of global production of soybean. Table 16.1: Major producing countries of soybean in the world (2006)
Source: http://faostat.fao.org/site/567/DesktopDefault.aspx?PageID=567 Indian scenario
There is sizeable increase in acreage and production of soybean in India. In acreage, there is an increase from 6,002 thousand ha in 2001-02 to 8,850 thousand ha in 2007-08. Similarly the production has increased from 5,400 thousand tons in 2001-02 to 9,473 thousand tons in 2006-07.The details are given in table 16.2
COUNTRY AREA(000’ha) PRODUCTION (000’tons)
PRODUCTIVITY (tons/ha)
USA 28,983.6 87,669.8 3.0 Brazil 22,006.6 52,355.9 2.3 Argentina 15,097.3 40,467.1 2.6 China 9,100.1 15,500.2 1.7 India 7,716.0 7,150.0 0.9 Paraguay 2,200.0 3,800.0 1.7 Canada 1,225.8 3,532.8 2.8 Others 6,654.4 8,872.6 1.4 All World 92,988.8 2,21,500.9 2.3
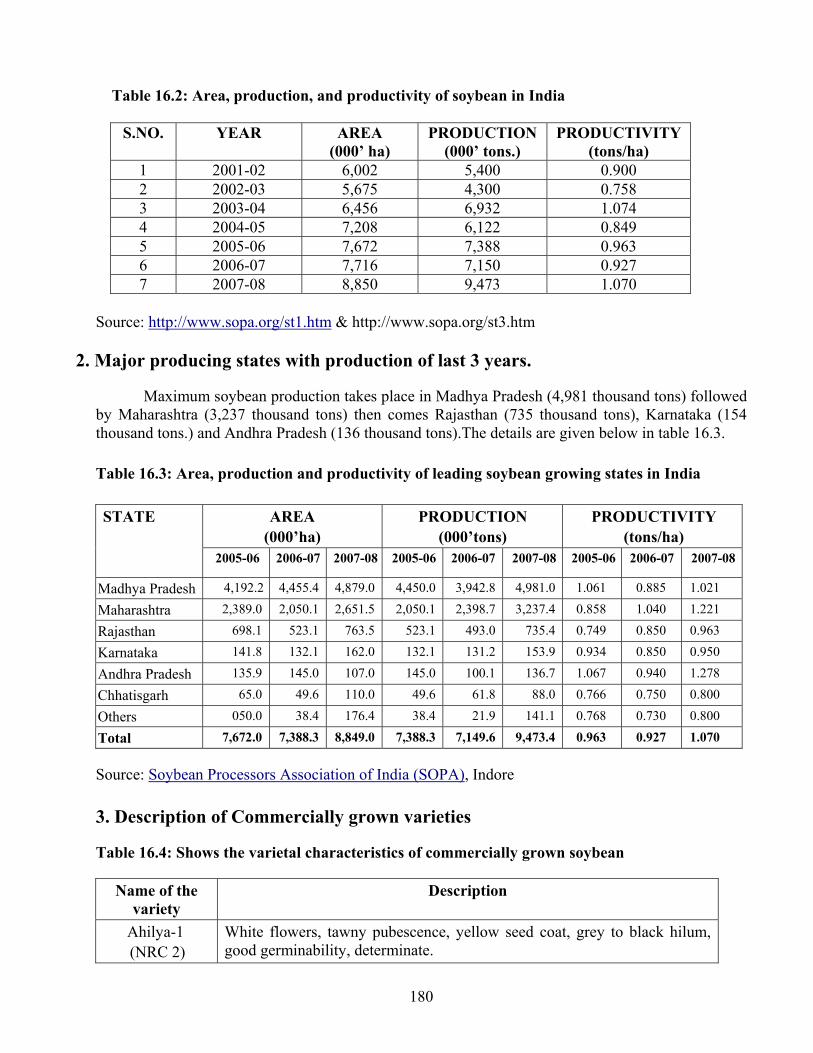
180
Table 16.2: Area, production, and productivity of soybean in India
S.NO. YEAR AREA (000’ ha)
PRODUCTION (000’ tons.)
PRODUCTIVITY (tons/ha)
1 2001-02 6,002 5,400 0.900 2 2002-03 5,675 4,300 0.758 3 2003-04 6,456 6,932 1.074 4 2004-05 7,208 6,122 0.849 5 2005-06 7,672 7,388 0.963 6 2006-07 7,716 7,150 0.927 7 2007-08 8,850 9,473 1.070
Source: http://www.sopa.org/st1.htm & http://www.sopa.org/st3.htm
2. Major producing states with production of last 3 years.
Maximum soybean production takes place in Madhya Pradesh (4,981 thousand tons) followed by Maharashtra (3,237 thousand tons) then comes Rajasthan (735 thousand tons), Karnataka (154 thousand tons.) and Andhra Pradesh (136 thousand tons).The details are given below in table 16.3. Table 16.3: Area, production and productivity of leading soybean growing states in India
AREA (000’ha)
PRODUCTION (000’tons)
PRODUCTIVITY (tons/ha)
STATE
2005-06 2006-07 2007-08 2005-06 2006-07 2007-08 2005-06 2006-07 2007-08
Madhya Pradesh 4,192.2 4,455.4 4,879.0 4,450.0 3,942.8 4,981.0 1.061 0.885 1.021
Maharashtra 2,389.0 2,050.1 2,651.5 2,050.1 2,398.7 3,237.4 0.858 1.040 1.221
Rajasthan 698.1 523.1 763.5 523.1 493.0 735.4 0.749 0.850 0.963
Karnataka 141.8 132.1 162.0 132.1 131.2 153.9 0.934 0.850 0.950
Andhra Pradesh 135.9 145.0 107.0 145.0 100.1 136.7 1.067 0.940 1.278
Chhatisgarh 65.0 49.6 110.0 49.6 61.8 88.0 0.766 0.750 0.800
Others 050.0 38.4 176.4 38.4 21.9 141.1 0.768 0.730 0.800
Total 7,672.0 7,388.3 8,849.0 7,388.3 7,149.6 9,473.4 0.963 0.927 1.070
Source: Soybean Processors Association of India (SOPA), Indore 3. Description of Commercially grown varieties
Table 16.4: Shows the varietal characteristics of commercially grown soybean
Name of the variety
Description
Ahilya-1 (NRC 2)
White flowers, tawny pubescence, yellow seed coat, grey to black hilum, good germinability, determinate.
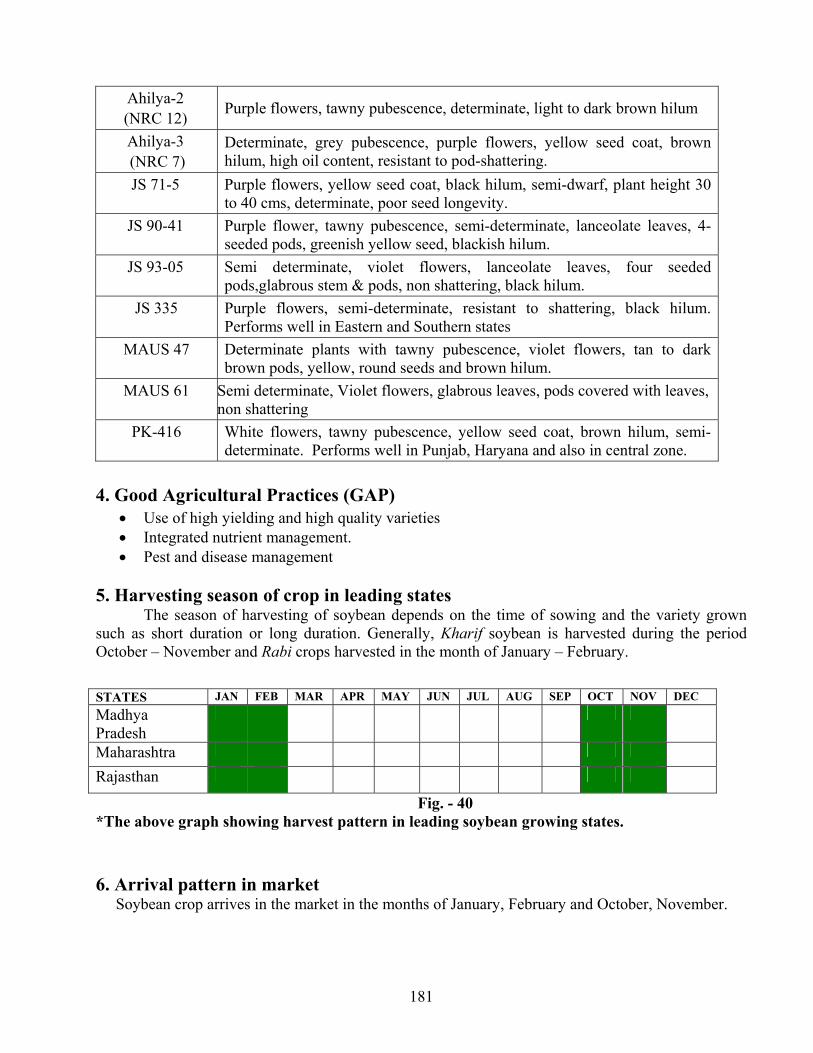
181
Ahilya-2 (NRC 12) Purple flowers, tawny pubescence, determinate, light to dark brown hilum
Ahilya-3 (NRC 7)
Determinate, grey pubescence, purple flowers, yellow seed coat, brown hilum, high oil content, resistant to pod-shattering.
JS 71-5 Purple flowers, yellow seed coat, black hilum, semi-dwarf, plant height 30 to 40 cms, determinate, poor seed longevity.
JS 90-41 Purple flower, tawny pubescence, semi-determinate, lanceolate leaves, 4-seeded pods, greenish yellow seed, blackish hilum.
JS 93-05 Semi determinate, violet flowers, lanceolate leaves, four seeded pods,glabrous stem & pods, non shattering, black hilum.
JS 335 Purple flowers, semi-determinate, resistant to shattering, black hilum. Performs well in Eastern and Southern states
MAUS 47 Determinate plants with tawny pubescence, violet flowers, tan to dark brown pods, yellow, round seeds and brown hilum.
MAUS 61 Semi determinate, Violet flowers, glabrous leaves, pods covered with leaves, non shattering
PK-416 White flowers, tawny pubescence, yellow seed coat, brown hilum, semi-determinate. Performs well in Punjab, Haryana and also in central zone.
4. Good Agricultural Practices (GAP)
• Use of high yielding and high quality varieties • Integrated nutrient management. • Pest and disease management
5. Harvesting season of crop in leading states The season of harvesting of soybean depends on the time of sowing and the variety grown
such as short duration or long duration. Generally, Kharif soybean is harvested during the period October – November and Rabi crops harvested in the month of January – February.
Fig. - 40 *The above graph showing harvest pattern in leading soybean growing states. 6. Arrival pattern in market
Soybean crop arrives in the market in the months of January, February and October, November.
STATES JAN FEB MAR APR MAY JUN JUL AUG SEP OCT NOV DEC
Madhya Pradesh
Maharashtra
Rajasthan
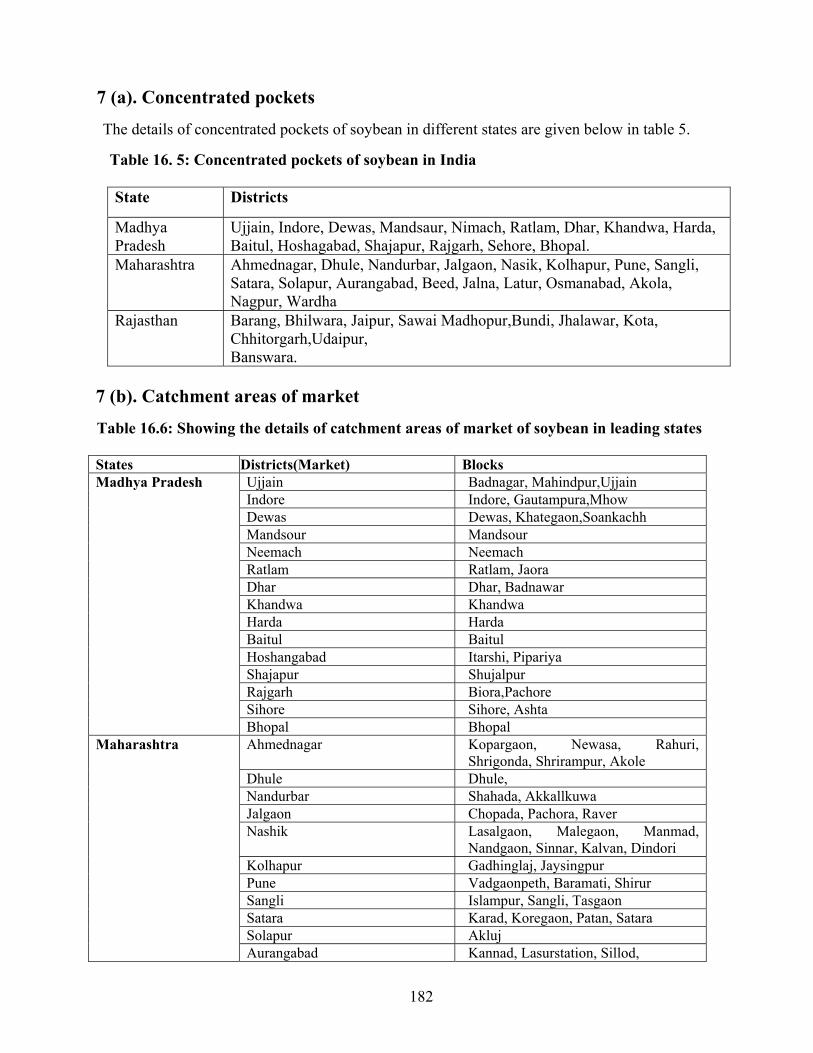
182
7 (a). Concentrated pockets The details of concentrated pockets of soybean in different states are given below in table 5.
Table 16. 5: Concentrated pockets of soybean in India
State Districts
Madhya Pradesh
Ujjain, Indore, Dewas, Mandsaur, Nimach, Ratlam, Dhar, Khandwa, Harda, Baitul, Hoshagabad, Shajapur, Rajgarh, Sehore, Bhopal.
Maharashtra Ahmednagar, Dhule, Nandurbar, Jalgaon, Nasik, Kolhapur, Pune, Sangli, Satara, Solapur, Aurangabad, Beed, Jalna, Latur, Osmanabad, Akola, Nagpur, Wardha
Rajasthan Barang, Bhilwara, Jaipur, Sawai Madhopur,Bundi, Jhalawar, Kota, Chhitorgarh,Udaipur, Banswara.
7 (b). Catchment areas of market Table 16.6: Showing the details of catchment areas of market of soybean in leading states States Districts(Market) Blocks
Ujjain Badnagar, Mahindpur,Ujjain Indore Indore, Gautampura,Mhow Dewas Dewas, Khategaon,Soankachh Mandsour Mandsour Neemach Neemach Ratlam Ratlam, Jaora Dhar Dhar, Badnawar Khandwa Khandwa Harda Harda Baitul Baitul Hoshangabad Itarshi, Pipariya Shajapur Shujalpur Rajgarh Biora,Pachore Sihore Sihore, Ashta
Madhya Pradesh
Bhopal Bhopal Ahmednagar Kopargaon, Newasa, Rahuri,
Shrigonda, Shrirampur, Akole Dhule Dhule, Nandurbar Shahada, Akkallkuwa Jalgaon Chopada, Pachora, Raver Nashik Lasalgaon, Malegaon, Manmad,
Nandgaon, Sinnar, Kalvan, Dindori Kolhapur Gadhinglaj, Jaysingpur Pune Vadgaonpeth, Baramati, Shirur Sangli Islampur, Sangli, Tasgaon Satara Karad, Koregaon, Patan, Satara Solapur Akluj
Maharashtra
Aurangabad Kannad, Lasurstation, Sillod,
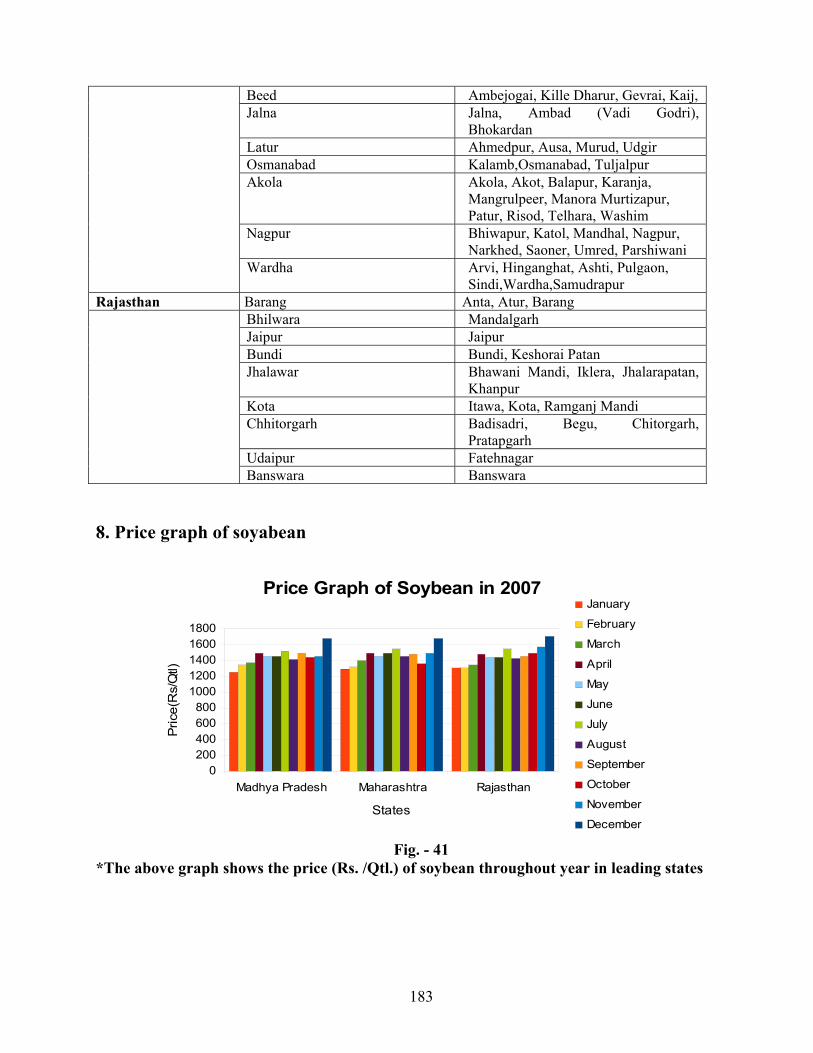
183
Beed Ambejogai, Kille Dharur, Gevrai, Kaij, Jalna Jalna, Ambad (Vadi Godri),
Bhokardan Latur Ahmedpur, Ausa, Murud, Udgir Osmanabad Kalamb,Osmanabad, Tuljalpur Akola Akola, Akot, Balapur, Karanja,
Mangrulpeer, Manora Murtizapur, Patur, Risod, Telhara, Washim
Nagpur Bhiwapur, Katol, Mandhal, Nagpur, Narkhed, Saoner, Umred, Parshiwani
Wardha Arvi, Hinganghat, Ashti, Pulgaon, Sindi,Wardha,Samudrapur
Rajasthan Barang Anta, Atur, Barang Bhilwara Mandalgarh Jaipur Jaipur Bundi Bundi, Keshorai Patan Jhalawar Bhawani Mandi, Iklera, Jhalarapatan,
Khanpur Kota Itawa, Kota, Ramganj Mandi Chhitorgarh Badisadri, Begu, Chitorgarh,
Pratapgarh Udaipur Fatehnagar
Banswara Banswara 8. Price graph of soyabean
Price Graph of Soybean in 2007
0200400600800
10001200140016001800
Madhya Pradesh Maharashtra Rajasthan
States
Pric
e(R
s/Q
tl)
January
February
March
April
May
June
July
August
September
October
November
December
Fig. - 41 *The above graph shows the price (Rs. /Qtl.) of soybean throughout year in leading states
184
9. Soyameal : Soyameal is available after crushing soyabean which is used as an animal feed. The availability of soyameal at present is 5280 thousand tons (2006-07). It increased to 6,385 thousand tons during 2007-08 (table 16.7). Extraction units are mostly located in Madhya Pradesh and Maharashtra states. Table 16.7: Production of soyameal in India
Source: Soybean Processors Association of India (SOPA), Indore 10. Criteria and description of grades of soyameal Indian soybean meal specifications & scale of allowances as per SOPA model contract as on 21st April, 2008
Protein - Min. 48%
Oil - Max. 1.50%
Fibre - Max. 6%
Moisture - Max. 11%
Sand/Silica - Max. 2%
Urease Activity 0.30 Unit Max (Mg/N.G/Min) at 30 degree Centigrade by EEC method
Free from lumps & foreign material other than Soya.
11. Packaging and its details
Packing and stitching of soyameal as per SOPA model contract as on 21st April, 2008 Packaging of soyameal should be done 1. In new single jute/bags of uniform weight where variation in weight in bags should not be more than +/- 2% as per contract. (For e.g. if it is 50 kgs bags then variation should be upto 49 kgs to 51 kgs only). The bags should be strong enough for multiple handling. The bags should either be double machine stitched or hand stitched with double twine cross stitched (i.e. 8 x 2 cross stitches). The mouth of the bag should be rolled up properly.
S.no. Year Production (000’ tons) 1 2004-05 4015 2 2005-06 4782 3 2006-07 5280 4 2007-08 6385
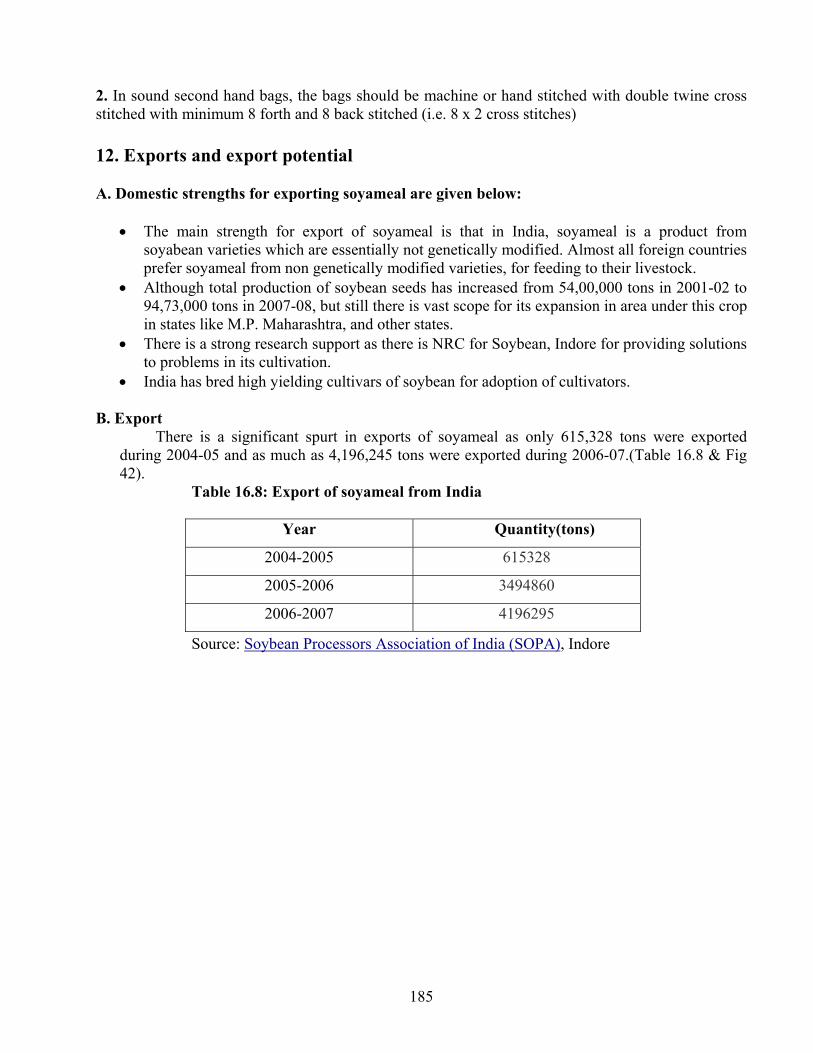
185
2. In sound second hand bags, the bags should be machine or hand stitched with double twine cross stitched with minimum 8 forth and 8 back stitched (i.e. 8 x 2 cross stitches) 12. Exports and export potential A. Domestic strengths for exporting soyameal are given below:
• The main strength for export of soyameal is that in India, soyameal is a product from soyabean varieties which are essentially not genetically modified. Almost all foreign countries prefer soyameal from non genetically modified varieties, for feeding to their livestock.
• Although total production of soybean seeds has increased from 54,00,000 tons in 2001-02 to 94,73,000 tons in 2007-08, but still there is vast scope for its expansion in area under this crop in states like M.P. Maharashtra, and other states.
• There is a strong research support as there is NRC for Soybean, Indore for providing solutions to problems in its cultivation.
• India has bred high yielding cultivars of soybean for adoption of cultivators. B. Export
There is a significant spurt in exports of soyameal as only 615,328 tons were exported during 2004-05 and as much as 4,196,245 tons were exported during 2006-07.(Table 16.8 & Fig 42). Table 16.8: Export of soyameal from India
Year Quantity(tons)
2004-2005 615328
2005-2006 3494860
2006-2007 4196295
Source: Soybean Processors Association of India (SOPA), Indore
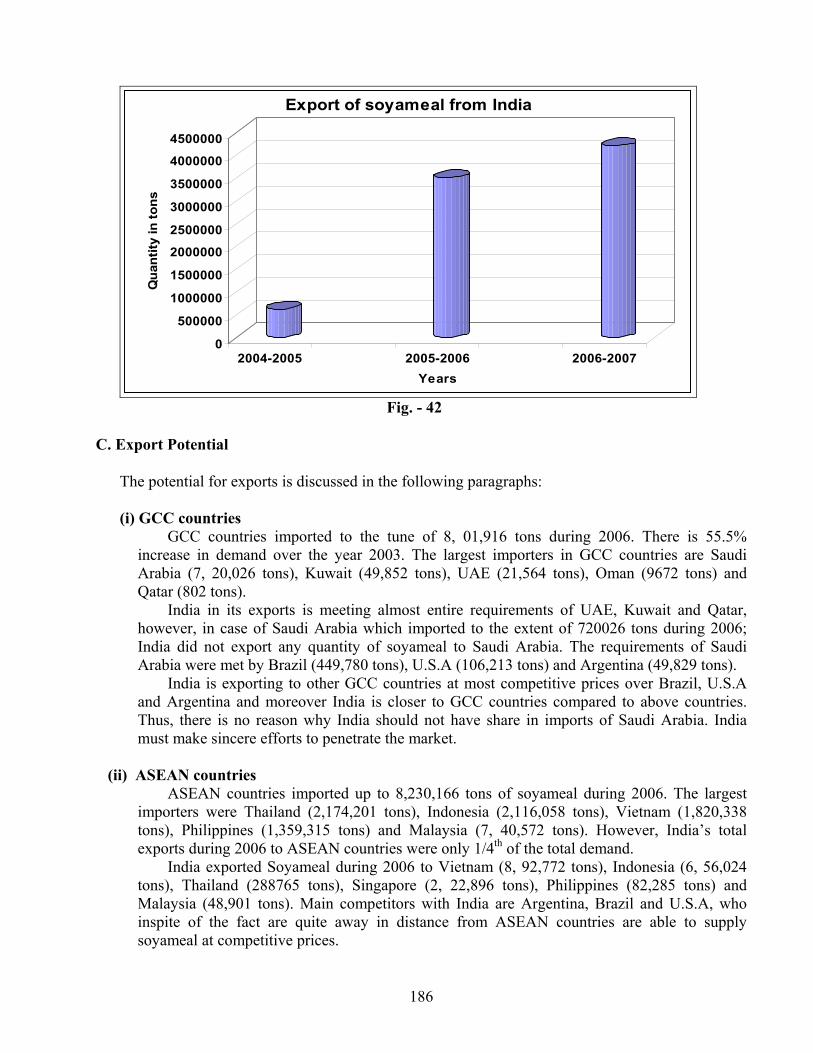
186
0
500000
1000000
1500000
2000000
2500000
3000000
3500000
4000000
4500000Q
uant
ity in
tons
2004-2005 2005-2006 2006-2007Years
Export of soyameal from India
Fig. - 42
C. Export Potential
The potential for exports is discussed in the following paragraphs: (i) GCC countries
GCC countries imported to the tune of 8, 01,916 tons during 2006. There is 55.5% increase in demand over the year 2003. The largest importers in GCC countries are Saudi Arabia (7, 20,026 tons), Kuwait (49,852 tons), UAE (21,564 tons), Oman (9672 tons) and Qatar (802 tons).
India in its exports is meeting almost entire requirements of UAE, Kuwait and Qatar, however, in case of Saudi Arabia which imported to the extent of 720026 tons during 2006; India did not export any quantity of soyameal to Saudi Arabia. The requirements of Saudi Arabia were met by Brazil (449,780 tons), U.S.A (106,213 tons) and Argentina (49,829 tons).
India is exporting to other GCC countries at most competitive prices over Brazil, U.S.A and Argentina and moreover India is closer to GCC countries compared to above countries. Thus, there is no reason why India should not have share in imports of Saudi Arabia. India must make sincere efforts to penetrate the market.
(ii) ASEAN countries
ASEAN countries imported up to 8,230,166 tons of soyameal during 2006. The largest importers were Thailand (2,174,201 tons), Indonesia (2,116,058 tons), Vietnam (1,820,338 tons), Philippines (1,359,315 tons) and Malaysia (7, 40,572 tons). However, India’s total exports during 2006 to ASEAN countries were only 1/4th of the total demand.
India exported Soyameal during 2006 to Vietnam (8, 92,772 tons), Indonesia (6, 56,024 tons), Thailand (288765 tons), Singapore (2, 22,896 tons), Philippines (82,285 tons) and Malaysia (48,901 tons). Main competitors with India are Argentina, Brazil and U.S.A, who inspite of the fact are quite away in distance from ASEAN countries are able to supply soyameal at competitive prices.
187
Thus, India must increase productivity of soyabean, so that it can lower the cost of production and offer soyameal to ASEAN countries at much lower prices and increase share in exports.
(iii) Pacific Rim countries and China
Pacific Rim countries comprising North Korea, Japan and China imported soyameal during 2006, 1,709,150 tons, 1,647,492 tons and 6,74,177 tons respectively, whereas India exported 5,35,810 tons to Japan, 6,82,104 tons to North Korea, 3,15,028 tons to China and 89,388 tons to Taiwan.
Main competition of India is with Argentina, Brazil and to some extent with U.S.A. India is much closer to these countries and must make sincere efforts to have larger share in imports of these countries by offering at lower prices by increasing productivity and reducing cost of production.
D. Enhancing competitiveness for export of soyameal
Following measures will enhance competitiveness for export of soyameal from India:
• Our main competitors for export of soyameal are Argentina, Brazil and U.S.A. Their yield of soyabean crop is 2.5 to 3 times higher than India. In order to be competitive, India must enhance productivity of soybean, so that soyameal is made available to importing countries at competitive prices.
• India must strictly enforce quality standards acceptable to European countries. This is essential for penetration in European markets in a significant way.
• India must brand its product in order to be competitive in International markets.
13. Documents required for exports a) Documents related to goods
a) Invoice b) Packing List c) Certificate of origin
b) Documents related to shipment
a) Mate Receipt b) Shipping Bill c) Bill of handing d) Airway Bill
c) Documents related to Payment
a) Letter of Credit (L/C) b) Bill of Exchange
d) Documents related to quality of goods
a) Phytosanitary Certificate b) GLOBALGAP Certification c) Health Certificate
e) Organic Certification
- Certificate indicating material produce is based on organic farming.
f) Documents related to Foreign Exchange Regulations
GR Form: Documents required by RBI which assures to RBI that the exporter will realize
the proceeds of goods within 180 days from the date of Shipment.
188
g) Other Document
Bank Realization Certification (BRC): This is the advice given by Foreign Exchange
Bank after the realization of money from Importer.
14. Prices prevailing in international markets
The given below tables shows the annual average price range of soyameal in the markets of ASEAN and GCC countries. The table 16.9 shows the pricing trend in the markets of ASEAN and GCC countries
Table 16.9: Summary of prices for soyameal in target markets for India
Annual Average price Range (2003-08) Country Currency
USD/kg 0.25 to 0.26 ASEAN* INR/kg 11.65 to 11.76 USD/kg 0.25 GCC* INR/kg 11.29
Source: Comtrade Database
* Prices shown are low, because these are average prices during 2003-08. However, during 2008 prices of Soyameal have shot up to Rs. 12-15 per kg.
15. Cost Calculation from harvest to packhouse to port
Cost estimates for exports of soyameal from India (as per information collected during 2008)
(a) Procurement price*: Approx. price (Rs. /kg) : 8-10 *Price of soyameal varies according to month of procurement (b) Charges for packing, brokerage, insurance, transport, etc. (below in table): Table 16.10: Charges for packing, brokerage, insurance, transport, etc.
Particulars Cost /ton (Rs.)
Packing material (jute bags 50 kgs) 460
Brokerage 10-12
189
Insurance 15
2 % of shortage 35
Interest and truck loading 80-85
Transport to port (from Indore to Kandla port) 750-800
Total 1350 – 1407 or 1.35 to 1.40 per kg
Source: SOPA, Indore
(c) Sea freight charges*: Freight rates for ordinary container are as follows:
Ordinary containers (Rates in US dollars) 20’ 40’
(i) Dubai/Doha 600 900 (ii) Kuala Lampur/Singapore 100 175 (iii)Flaxo (UK)/Amsterdam 900 1450
* It varies from year to year /season to season, capacity of container and distance covered.
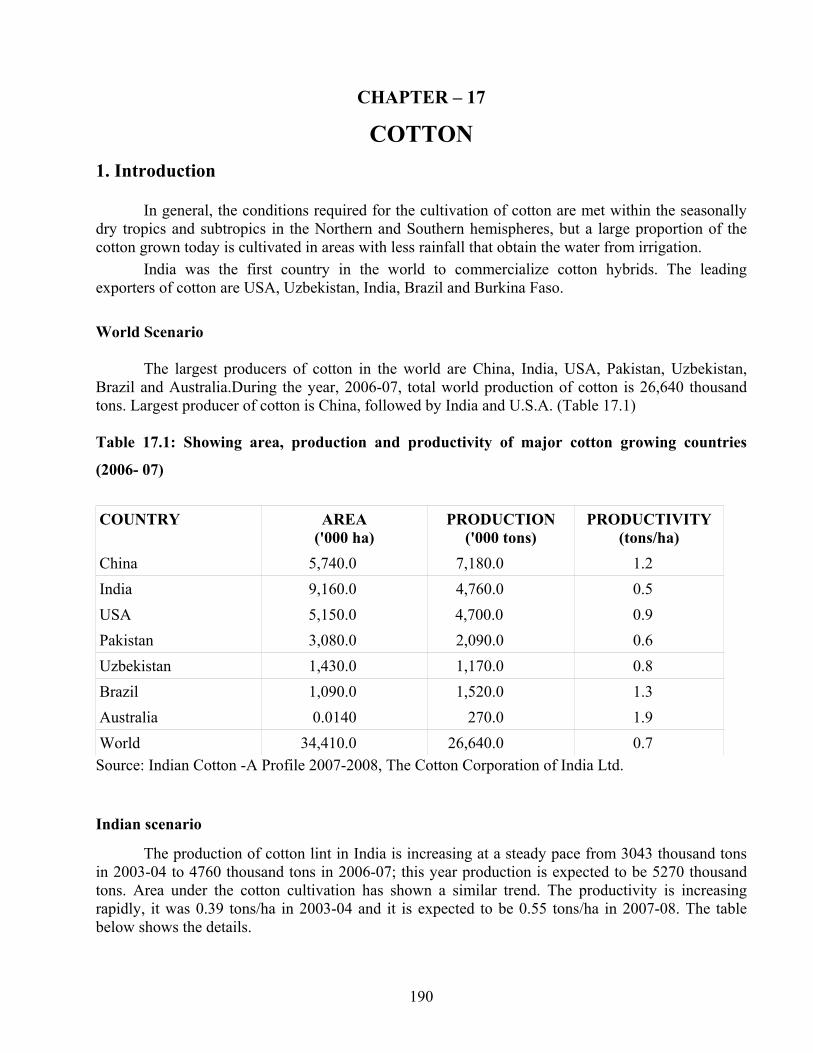
190
CHAPTER – 17
COTTON
1. Introduction
In general, the conditions required for the cultivation of cotton are met within the seasonally dry tropics and subtropics in the Northern and Southern hemispheres, but a large proportion of the cotton grown today is cultivated in areas with less rainfall that obtain the water from irrigation.
India was the first country in the world to commercialize cotton hybrids. The leading exporters of cotton are USA, Uzbekistan, India, Brazil and Burkina Faso. World Scenario
The largest producers of cotton in the world are China, India, USA, Pakistan, Uzbekistan, Brazil and Australia.During the year, 2006-07, total world production of cotton is 26,640 thousand tons. Largest producer of cotton is China, followed by India and U.S.A. (Table 17.1)
Table 17.1: Showing area, production and productivity of major cotton growing countries
(2006- 07)
COUNTRY AREA ('000 ha)
PRODUCTION ('000 tons)
PRODUCTIVITY (tons/ha)
China 5,740.0 7,180.0 1.2 India 9,160.0 4,760.0 0.5 USA 5,150.0 4,700.0 0.9 Pakistan 3,080.0 2,090.0 0.6 Uzbekistan 1,430.0 1,170.0 0.8 Brazil 1,090.0 1,520.0 1.3 Australia 0.0140 270.0 1.9 World 34,410.0 26,640.0 0.7 Source: Indian Cotton -A Profile 2007-2008, The Cotton Corporation of India Ltd.
Indian scenario
The production of cotton lint in India is increasing at a steady pace from 3043 thousand tons in 2003-04 to 4760 thousand tons in 2006-07; this year production is expected to be 5270 thousand tons. Area under the cotton cultivation has shown a similar trend. The productivity is increasing rapidly, it was 0.39 tons/ha in 2003-04 and it is expected to be 0.55 tons/ha in 2007-08. The table below shows the details.
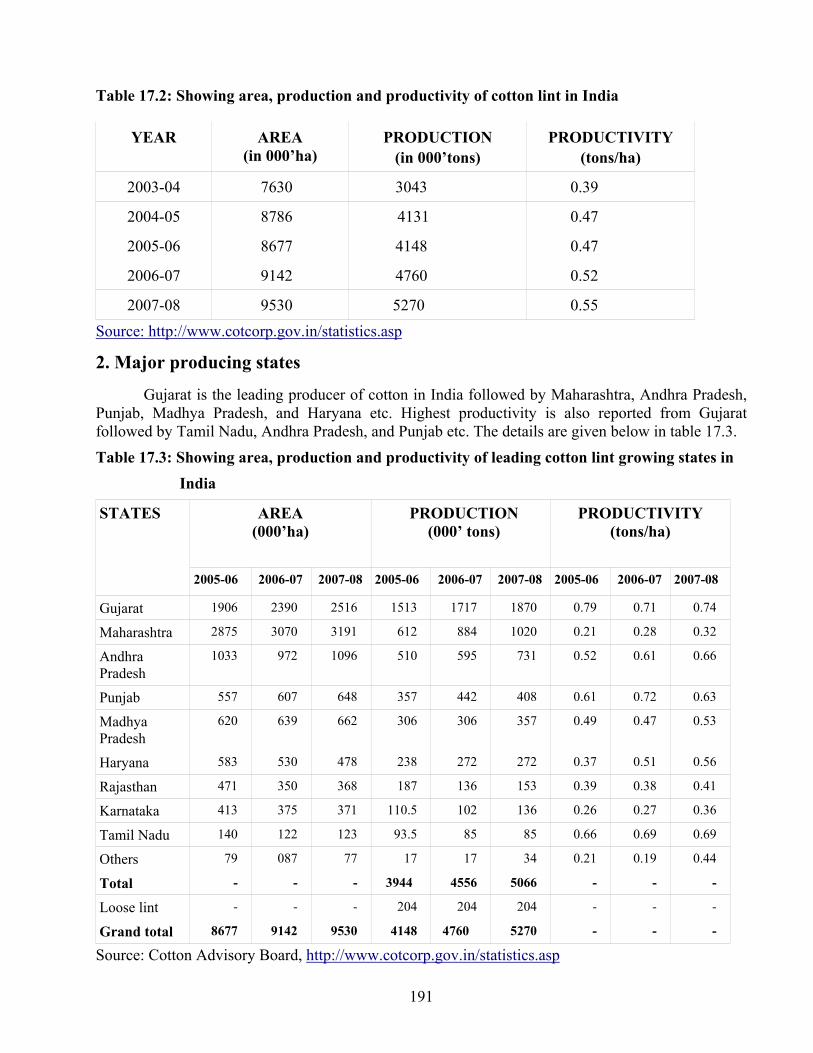
191
Table 17.2: Showing area, production and productivity of cotton lint in India
YEAR AREA (in 000’ha)
PRODUCTION (in 000’tons)
PRODUCTIVITY (tons/ha)
2003-04 7630 3043 0.39
2004-05 8786 4131 0.47
2005-06 8677 4148 0.47
2006-07 9142 4760 0.52
2007-08 9530 5270 0.55 Source: http://www.cotcorp.gov.in/statistics.asp
2. Major producing states
Gujarat is the leading producer of cotton in India followed by Maharashtra, Andhra Pradesh, Punjab, Madhya Pradesh, and Haryana etc. Highest productivity is also reported from Gujarat followed by Tamil Nadu, Andhra Pradesh, and Punjab etc. The details are given below in table 17.3. Table 17.3: Showing area, production and productivity of leading cotton lint growing states in India
AREA (000’ha)
PRODUCTION (000’ tons)
PRODUCTIVITY (tons/ha)
STATES 2005-06 2006-07 2007-08 2005-06 2006-07 2007-08 2005-06 2006-07 2007-08
Gujarat 1906 2390 2516 1513 1717 1870 0.79 0.71 0.74
Maharashtra 2875 3070 3191 612 884 1020 0.21 0.28 0.32
Andhra Pradesh
1033 972 1096 510 595 731 0.52 0.61 0.66
Punjab 557 607 648 357 442 408 0.61 0.72 0.63
Madhya Pradesh
620 639 662 306 306 357 0.49 0.47 0.53
Haryana 583 530 478 238 272 272 0.37 0.51 0.56
Rajasthan 471 350 368 187 136 153 0.39 0.38 0.41
Karnataka 413 375 371 110.5 102 136 0.26 0.27 0.36
Tamil Nadu 140 122 123 93.5 85 85 0.66 0.69 0.69
Others 79 087 77 17 17 34 0.21 0.19 0.44
Total - - - 3944 4556 5066 - - -
Loose lint - - - 204 204 204 - - -
Grand total 8677 9142 9530 4148 4760 5270 - - -
Source: Cotton Advisory Board, http://www.cotcorp.gov.in/statistics.asp
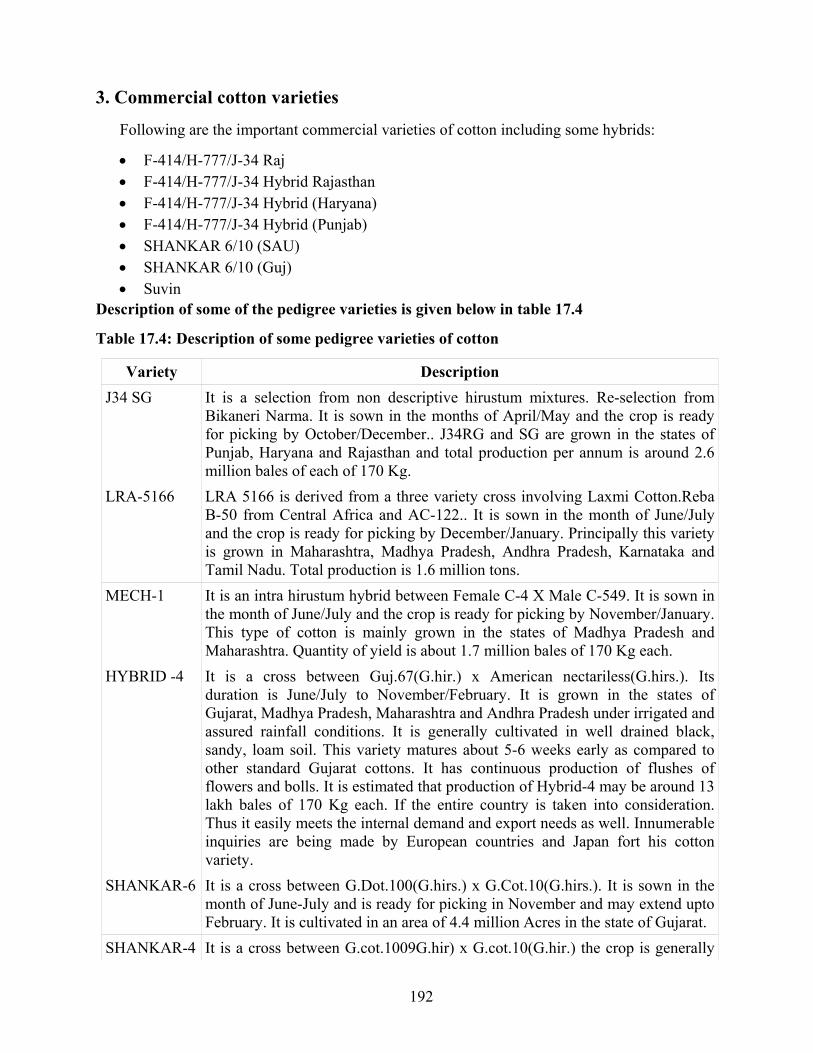
192
3. Commercial cotton varieties
Following are the important commercial varieties of cotton including some hybrids:
• F-414/H-777/J-34 Raj • F-414/H-777/J-34 Hybrid Rajasthan • F-414/H-777/J-34 Hybrid (Haryana) • F-414/H-777/J-34 Hybrid (Punjab) • SHANKAR 6/10 (SAU) • SHANKAR 6/10 (Guj) • Suvin
Description of some of the pedigree varieties is given below in table 17.4
Table 17.4: Description of some pedigree varieties of cotton
Variety Description J34 SG It is a selection from non descriptive hirustum mixtures. Re-selection from
Bikaneri Narma. It is sown in the months of April/May and the crop is ready for picking by October/December.. J34RG and SG are grown in the states of Punjab, Haryana and Rajasthan and total production per annum is around 2.6 million bales of each of 170 Kg.
LRA-5166 LRA 5166 is derived from a three variety cross involving Laxmi Cotton.Reba B-50 from Central Africa and AC-122.. It is sown in the month of June/July and the crop is ready for picking by December/January. Principally this variety is grown in Maharashtra, Madhya Pradesh, Andhra Pradesh, Karnataka and Tamil Nadu. Total production is 1.6 million tons.
MECH-1 It is an intra hirustum hybrid between Female C-4 X Male C-549. It is sown in the month of June/July and the crop is ready for picking by November/January. This type of cotton is mainly grown in the states of Madhya Pradesh and Maharashtra. Quantity of yield is about 1.7 million bales of 170 Kg each.
HYBRID -4 It is a cross between Guj.67(G.hir.) x American nectariless(G.hirs.). Its duration is June/July to November/February. It is grown in the states of Gujarat, Madhya Pradesh, Maharashtra and Andhra Pradesh under irrigated and assured rainfall conditions. It is generally cultivated in well drained black, sandy, loam soil. This variety matures about 5-6 weeks early as compared to other standard Gujarat cottons. It has continuous production of flushes of flowers and bolls. It is estimated that production of Hybrid-4 may be around 13 lakh bales of 170 Kg each. If the entire country is taken into consideration. Thus it easily meets the internal demand and export needs as well. Innumerable inquiries are being made by European countries and Japan fort his cotton variety.
SHANKAR-6 It is a cross between G.Dot.100(G.hirs.) x G.Cot.10(G.hirs.). It is sown in the month of June-July and is ready for picking in November and may extend upto February. It is cultivated in an area of 4.4 million Acres in the state of Gujarat.
SHANKAR-4 It is a cross between G.cot.1009G.hir) x G.cot.10(G.hir.) the crop is generally
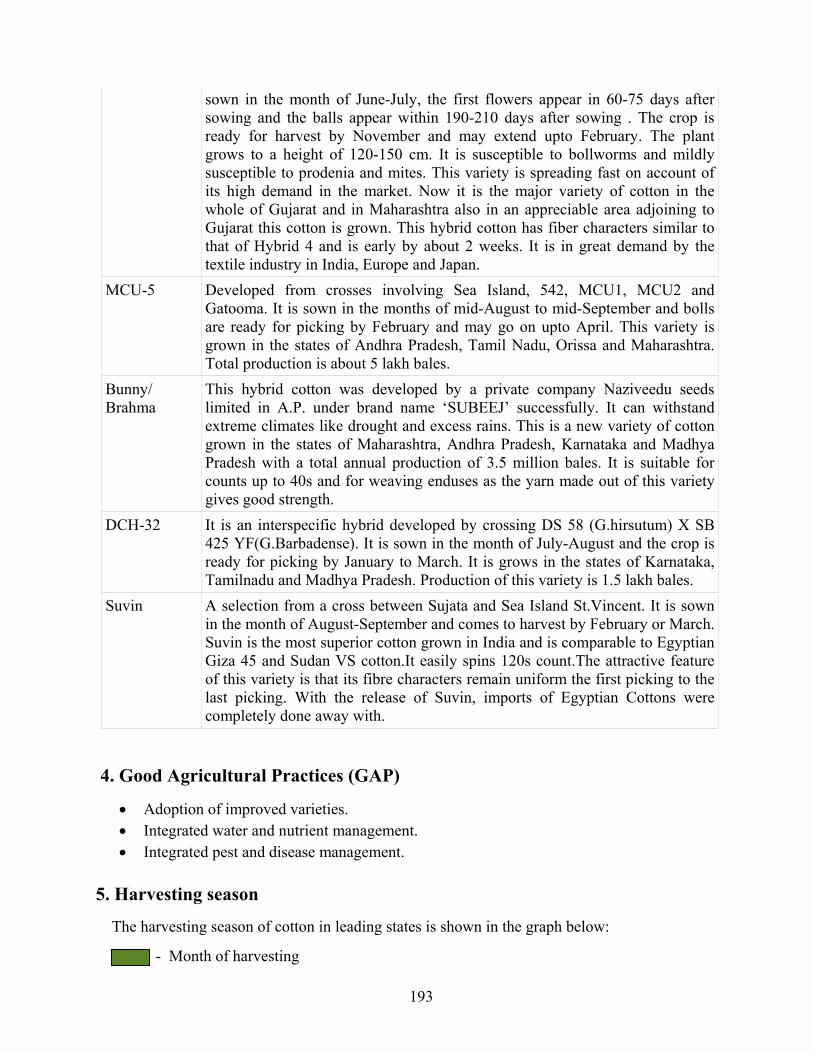
193
sown in the month of June-July, the first flowers appear in 60-75 days after sowing and the balls appear within 190-210 days after sowing . The crop is ready for harvest by November and may extend upto February. The plant grows to a height of 120-150 cm. It is susceptible to bollworms and mildly susceptible to prodenia and mites. This variety is spreading fast on account of its high demand in the market. Now it is the major variety of cotton in the whole of Gujarat and in Maharashtra also in an appreciable area adjoining to Gujarat this cotton is grown. This hybrid cotton has fiber characters similar to that of Hybrid 4 and is early by about 2 weeks. It is in great demand by the textile industry in India, Europe and Japan.
MCU-5 Developed from crosses involving Sea Island, 542, MCU1, MCU2 and Gatooma. It is sown in the months of mid-August to mid-September and bolls are ready for picking by February and may go on upto April. This variety is grown in the states of Andhra Pradesh, Tamil Nadu, Orissa and Maharashtra. Total production is about 5 lakh bales.
Bunny/ Brahma
This hybrid cotton was developed by a private company Naziveedu seeds limited in A.P. under brand name ‘SUBEEJ’ successfully. It can withstand extreme climates like drought and excess rains. This is a new variety of cotton grown in the states of Maharashtra, Andhra Pradesh, Karnataka and Madhya Pradesh with a total annual production of 3.5 million bales. It is suitable for counts up to 40s and for weaving enduses as the yarn made out of this variety gives good strength.
DCH-32 It is an interspecific hybrid developed by crossing DS 58 (G.hirsutum) X SB 425 YF(G.Barbadense). It is sown in the month of July-August and the crop is ready for picking by January to March. It is grows in the states of Karnataka, Tamilnadu and Madhya Pradesh. Production of this variety is 1.5 lakh bales.
Suvin A selection from a cross between Sujata and Sea Island St.Vincent. It is sown in the month of August-September and comes to harvest by February or March. Suvin is the most superior cotton grown in India and is comparable to Egyptian Giza 45 and Sudan VS cotton.It easily spins 120s count.The attractive feature of this variety is that its fibre characters remain uniform the first picking to the last picking. With the release of Suvin, imports of Egyptian Cottons were completely done away with.
4. Good Agricultural Practices (GAP)
• Adoption of improved varieties. • Integrated water and nutrient management. • Integrated pest and disease management.
5. Harvesting season
The harvesting season of cotton in leading states is shown in the graph below:
- Month of harvesting
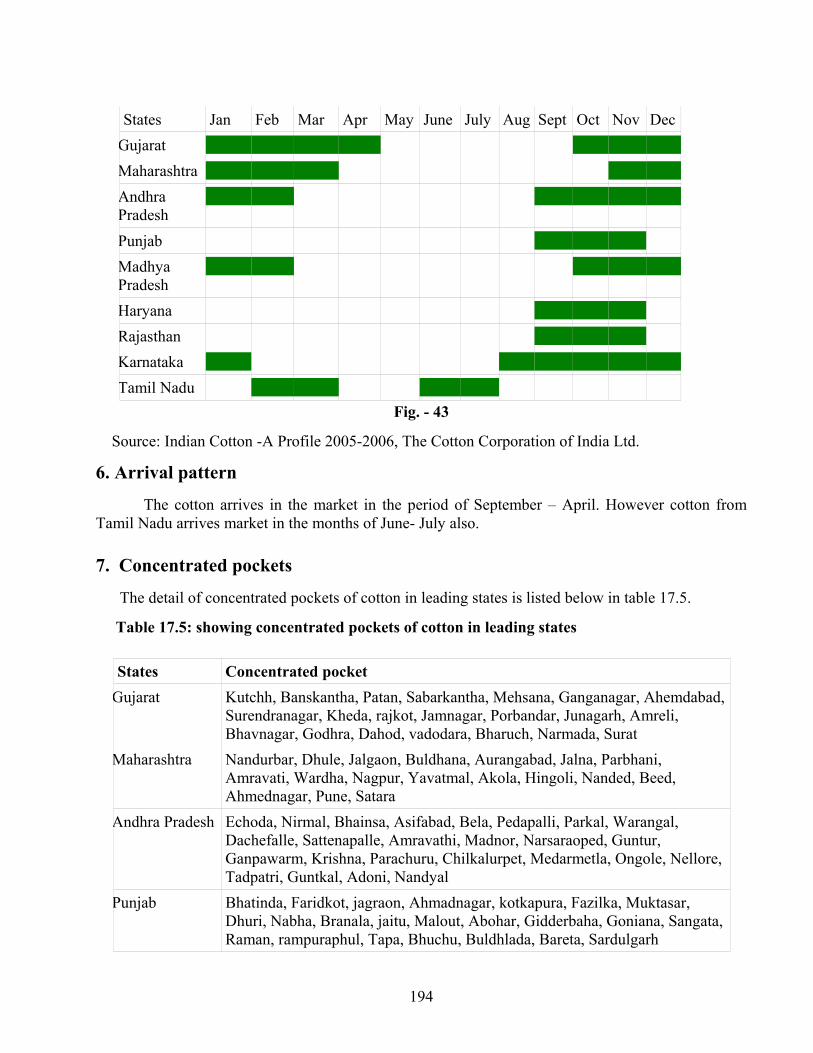
194
States Jan Feb Mar Apr May June July Aug Sept Oct Nov DecGujarat Maharashtra Andhra Pradesh Punjab Madhya Pradesh Haryana Rajasthan Karnataka Tamil Nadu
Fig. - 43
Source: Indian Cotton -A Profile 2005-2006, The Cotton Corporation of India Ltd.
6. Arrival pattern
The cotton arrives in the market in the period of September – April. However cotton from Tamil Nadu arrives market in the months of June- July also.
7. Concentrated pockets
The detail of concentrated pockets of cotton in leading states is listed below in table 17.5.
Table 17.5: showing concentrated pockets of cotton in leading states
States Concentrated pocket Gujarat Kutchh, Banskantha, Patan, Sabarkantha, Mehsana, Ganganagar, Ahemdabad,
Surendranagar, Kheda, rajkot, Jamnagar, Porbandar, Junagarh, Amreli, Bhavnagar, Godhra, Dahod, vadodara, Bharuch, Narmada, Surat
Maharashtra Nandurbar, Dhule, Jalgaon, Buldhana, Aurangabad, Jalna, Parbhani, Amravati, Wardha, Nagpur, Yavatmal, Akola, Hingoli, Nanded, Beed, Ahmednagar, Pune, Satara
Andhra Pradesh Echoda, Nirmal, Bhainsa, Asifabad, Bela, Pedapalli, Parkal, Warangal, Dachefalle, Sattenapalle, Amravathi, Madnor, Narsaraoped, Guntur, Ganpawarm, Krishna, Parachuru, Chilkalurpet, Medarmetla, Ongole, Nellore, Tadpatri, Guntkal, Adoni, Nandyal
Punjab Bhatinda, Faridkot, jagraon, Ahmadnagar, kotkapura, Fazilka, Muktasar, Dhuri, Nabha, Branala, jaitu, Malout, Abohar, Gidderbaha, Goniana, Sangata, Raman, rampuraphul, Tapa, Bhuchu, Buldhlada, Bareta, Sardulgarh
195
Madhya Pradesh Ratlam, Badnwar, Manavar, Kukshi, Dhar, Anjad, Dhamnod, barwah, Bhikangaon, Khargone, sendhwa, Sanawad, Khandwa, Burhanpur, Tukaithad, Khategaon, Harda, Sirsali, Khirkiya, Sausar, Pandurna
Haryana Danwali, Kalanwali, Sirsa, Ratia, Fatehabad, Adampur, Hissar, Bhuna, Hansi, Bhiwani, Tohana, Ukalana, Kaithal, Narwana, Jind, Sonipat, Rohtak, Jhajjar, Rewari, Monindergarh,
Rajasthan Kesrisinghpur, Sri Karanpur, Gajsinghpur, Rahsinghnagar, Anoopgarh, Gharsana, Rawla, Khajuwala, Sri Ganganagar, Sadulshar, Sangaria, Hanumangarh, rawatsar, Bhadra, Khertal, Naugaon, Merta, Beawar, Bijaynagar, Kekri, Bhilwara, Asind, Banswara
Karnataka Bijapur, Bagalkot, raichur, belgaum, Dharwad, NAval Gund, Gadag, Bellery, Haveri, Chitradurga, Shimoga, Arsikere, Mysore
Tamil Nadu Villupuram, Panruti, Attur, Thanjaur, salem, Erode, Perundurai, Kangayam, Dharapuram, Tirupur, Coimbatore, Udalmpet, Dindigul, Madurai, Sattur, Kovilpatti, Triunelveli
8. Criteria and description of grades Agmark standards of cotton lint, is given below: Table 17.6: Grade designation and definition of quality of cotton lint
Definition of quality Grade designation
Special characteristics General characteristics
Agmark certified pedigreed (Red label)
Shall be the product derived from kapas (cotton seed) variety approved for Agmarking, grown on a Government farm or by a registered seed grower licensed by the appropriate Government Department or by any other agency to be recognized by the Agricultural Marketing Adviser to the Government of India for the purpose and which had been derived from pure seed supplied by a Government department or by any other agency to be resigned by the agricultural marketing adviser to the government of India for the purpose and crop of which shall have been inspected and recognized wherever necessary and duly certified by the appropriate Government Department or by any other agency to be recognized by the Agricultural Marketing Adviser to the Government of India, for the purpose as being at least 98% pure: and b) Shall have been ginned and pressed under direct supervision of the appropriate Government Department or by any other agency to be recognized by the
a) shall consist of lint ( in full pressed bales) obtained by machine ginning of the kapas:- b) shall be clean and reasonably free from leaf, seed, stain or other imperfections; c) shall be dry and free from a trace added moisture.
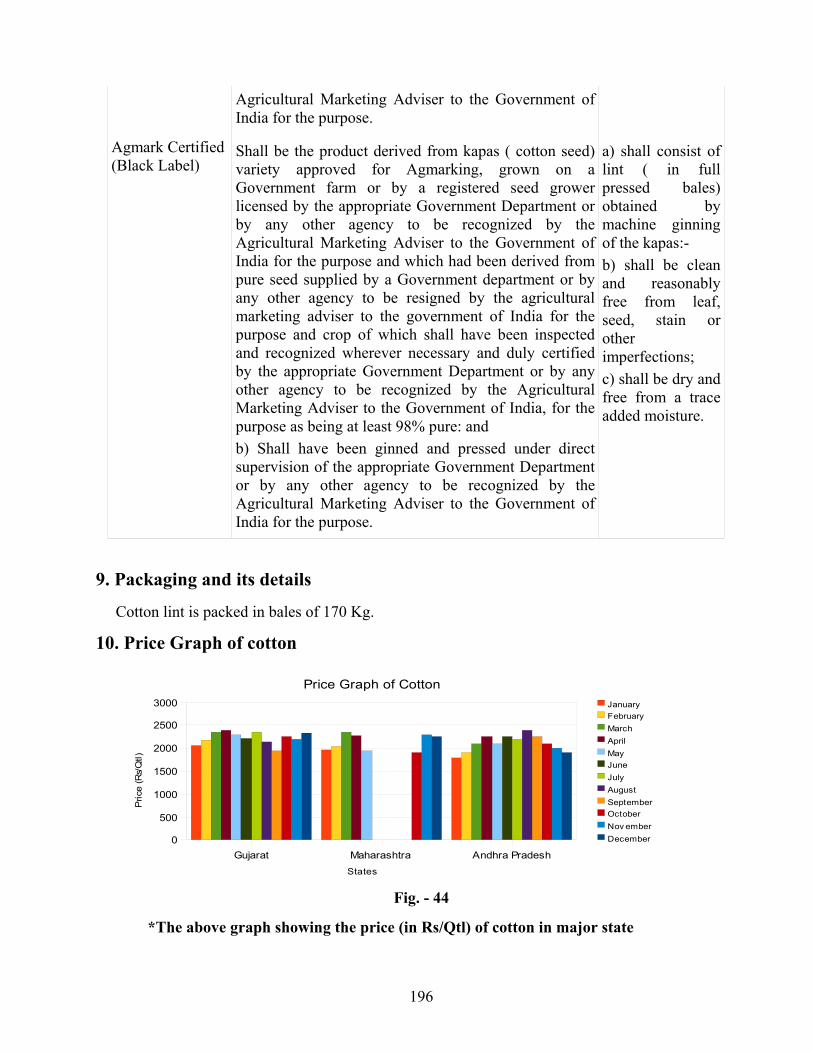
196
Agricultural Marketing Adviser to the Government of India for the purpose.
Agmark Certified (Black Label)
Shall be the product derived from kapas ( cotton seed) variety approved for Agmarking, grown on a Government farm or by a registered seed grower licensed by the appropriate Government Department or by any other agency to be recognized by the Agricultural Marketing Adviser to the Government of India for the purpose and which had been derived from pure seed supplied by a Government department or by any other agency to be resigned by the agricultural marketing adviser to the government of India for the purpose and crop of which shall have been inspected and recognized wherever necessary and duly certified by the appropriate Government Department or by any other agency to be recognized by the Agricultural Marketing Adviser to the Government of India, for the purpose as being at least 98% pure: and b) Shall have been ginned and pressed under direct supervision of the appropriate Government Department or by any other agency to be recognized by the Agricultural Marketing Adviser to the Government of India for the purpose.
a) shall consist of lint ( in full pressed bales) obtained by machine ginning of the kapas:- b) shall be clean and reasonably free from leaf, seed, stain or other imperfections; c) shall be dry and free from a trace added moisture.
9. Packaging and its details
Cotton lint is packed in bales of 170 Kg.
10. Price Graph of cotton
Fig. - 44
*The above graph showing the price (in Rs/Qtl) of cotton in major state
Gujarat Maharashtra Andhra Pradesh0
500
1000
1500
2000
2500
3000
Price Graph of CottonJanuaryFebruaryMarchAprilMayJuneJulyAugustSeptemberOctoberNov emberDecember
States
Pric
e (R
s/Q
tl)
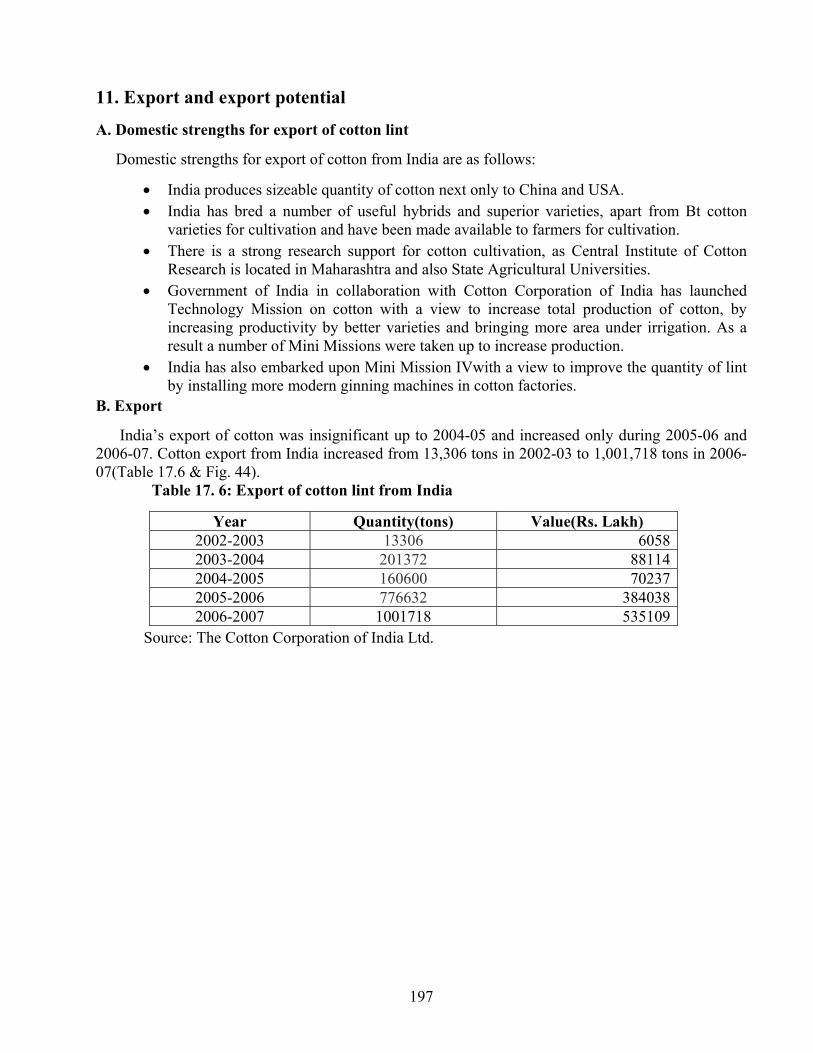
197
11. Export and export potential
A. Domestic strengths for export of cotton lint
Domestic strengths for export of cotton from India are as follows:
• India produces sizeable quantity of cotton next only to China and USA. • India has bred a number of useful hybrids and superior varieties, apart from Bt cotton
varieties for cultivation and have been made available to farmers for cultivation. • There is a strong research support for cotton cultivation, as Central Institute of Cotton
Research is located in Maharashtra and also State Agricultural Universities. • Government of India in collaboration with Cotton Corporation of India has launched
Technology Mission on cotton with a view to increase total production of cotton, by increasing productivity by better varieties and bringing more area under irrigation. As a result a number of Mini Missions were taken up to increase production.
• India has also embarked upon Mini Mission IVwith a view to improve the quantity of lint by installing more modern ginning machines in cotton factories.
B. Export
India’s export of cotton was insignificant up to 2004-05 and increased only during 2005-06 and 2006-07. Cotton export from India increased from 13,306 tons in 2002-03 to 1,001,718 tons in 2006-07(Table 17.6 & Fig. 44).
Table 17. 6: Export of cotton lint from India
Year Quantity(tons) Value(Rs. Lakh) 2002-2003 13306 60582003-2004 201372 881142004-2005 160600 702372005-2006 776632 3840382006-2007 1001718 535109
Source: The Cotton Corporation of India Ltd.
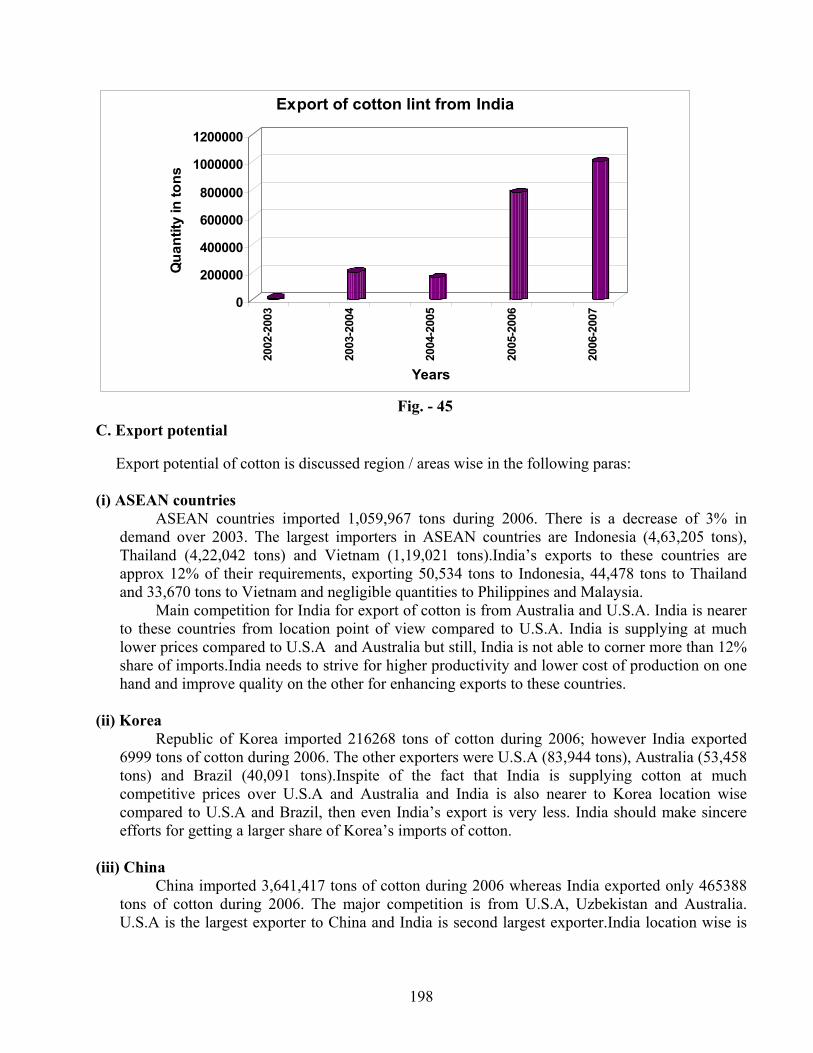
198
0
200000
400000
600000
800000
1000000
1200000
Qua
ntity
in to
ns
2002
-200
3
2003
-200
4
2004
-200
5
2005
-200
6
2006
-200
7
Years
Export of cotton lint from India
Fig. - 45
C. Export potential
Export potential of cotton is discussed region / areas wise in the following paras: (i) ASEAN countries
ASEAN countries imported 1,059,967 tons during 2006. There is a decrease of 3% in demand over 2003. The largest importers in ASEAN countries are Indonesia (4,63,205 tons), Thailand (4,22,042 tons) and Vietnam (1,19,021 tons).India’s exports to these countries are approx 12% of their requirements, exporting 50,534 tons to Indonesia, 44,478 tons to Thailand and 33,670 tons to Vietnam and negligible quantities to Philippines and Malaysia.
Main competition for India for export of cotton is from Australia and U.S.A. India is nearer to these countries from location point of view compared to U.S.A. India is supplying at much lower prices compared to U.S.A and Australia but still, India is not able to corner more than 12% share of imports.India needs to strive for higher productivity and lower cost of production on one hand and improve quality on the other for enhancing exports to these countries.
(ii) Korea
Republic of Korea imported 216268 tons of cotton during 2006; however India exported 6999 tons of cotton during 2006. The other exporters were U.S.A (83,944 tons), Australia (53,458 tons) and Brazil (40,091 tons).Inspite of the fact that India is supplying cotton at much competitive prices over U.S.A and Australia and India is also nearer to Korea location wise compared to U.S.A and Brazil, then even India’s export is very less. India should make sincere efforts for getting a larger share of Korea’s imports of cotton.
(iii) China
China imported 3,641,417 tons of cotton during 2006 whereas India exported only 465388 tons of cotton during 2006. The major competition is from U.S.A, Uzbekistan and Australia. U.S.A is the largest exporter to China and India is second largest exporter.India location wise is
199
closer to China and should have larger share in imports of China by becoming more competitive and offering better quality cotton.
(iv) Japan
Japan imported cotton to the tune of 1, 35,574 tons during 2006. However, India did not export any quantity of cotton to Japan. It will be appropriate to explore the exports of Indian cotton to Japan.
(v) Turkey
Turkey imported total quantity of 7, 37,734 tons of raw cotton during 2006 and India exported only 89,932 tons of raw cotton. India should try to penetrate this market in an effective manner as there is good potential for export.
D. Measures for enhancing competitiveness
Following measures need to be taken for enhancing competitiveness of India for exporting cotton lint:
• Yield of cotton in India are quite low compared to USA (2.0 tons/ha), Brazil (2.3tons/ha) and Australia (4.4 tons/ha). India falls way below to the level of 1.2 tons/ha. Thus if India is to compete successfully in cotton exports, it must increase the productivity by increasing area under superior and productive varieties and irrigation. Government of India has successfully launched Technology Mission on cotton to achieve above objectives, but more intensified efforts need to be taken up.
• Improving quality of cotton lint Few years back, Indian cotton was considered as very inferior. However, after initiating certain steps to improve the quality under Mini Mission IV, the exports to different countries have greatly surged up, it will therefore, be very important to further improve the quality by covering more states and districts under modern ginning factories. For this, intensive monitoring of quality will have to be done.
12. Documents required for export
a) Documents related to goods
a) Invoice b) Packing List c) Certificate of origin
b) Documents related to shipment
a) Mate Receipt b) Shipping Bill c) Bill of handing d) Airway Bill
c) Documents related to Payment
a) Letter of Credit (L/C) b) Bill of Exchange
d) Documents related to quality of goods
a) Phytosanitary Certificate b) GLOBALGAP Certification c) Health Certificate
200
e) Organic Certification
- Certificate indicating material produce is based on organic farming.
f) Documents related to Foreign Exchange Regulations
GR Form: Documents required by RBI which assures to RBI that the exporter will realize the
proceeds of goods within 180 days from the date of Shipment.
g) Other Document
Bank Realization Certification (BRC): This is the advice given by Foreign Exchange Bank
after the realization of money from Importer.
13. Price prevailing in international market
The given below tables shows the annual average price range of cotton in the markets of ASEAN
countries. The table 17.7 shows the pricing trend in the markets of ASEAN countries
Table 17.7: Summary of prices for cotton in target markets for India
Annual Average price Range (2003-08) Country Currency
USD/kg 1.34 to 1.55 ASEAN INR/kg 60.41 to 69.91
Source: Comrade Database
14. Cost Calculation from harvest to packhouse to port
Cost estimates for exports of cotton from India (as per information collected during 2008)
(a) Procurement price*: Approx. price (Rs. /kg) : 66.57 to 71.62 *Price of cotton varies according to variety, month of procurement
(b) Charges for packing, transport etc.(below in table):
Table 17.8: Charges for packing, transport, etc.
Particulars Rs./kg
Handling, packing and transport to port 3.08 to 5.05
Source: The Cotton Corporation of India Ltd.

201
(c) Sea freight charges*: Freight rates for ordinary container are as follows:
Ordinary containers (Rates in US dollars) 20’ 40’
(i) Dubai/Doha 600 900 (ii) Kuala Lampur/Singapore 100 175 (iii)Flaxo (UK)/Amsterdam 900 1450
* It varies from year to year /season to season, capacity of container and distance covered

202