Embed Size (px)
Citation preview
Changing Landscape of UX Research Big Data & Big Ideas T.S.Balaji
June 2015
Agenda Changing Landscape of UX Research
02
Who we are?
Philosophy
FoundaFon
Programs
Big Data
Modeling
Closing
We solve customer problems by utilizing
research & analytics, in a customer centered design
process to deliver experiences that meet or
exceed customer expectations.
04
Hi UX @ Cox
We are a group of User Experience Strategists, Researchers, Data ScienFsts, Visual Designers & Prototypers that come
together on a regular basis to solve customer and business problems. We are passionate about understanding customer
behaviors and creaFng experiences that are delighSul in a way that makes recommenders out of our customers. We use
different techniques to understand our customers behaviors through research and analyFcs to inform design to drive
innovaFve soluFons. These soluFons then allow us to drive adopFon, increased usage, lowering cost and/or increasing
sales depending on the experience domain.
UX
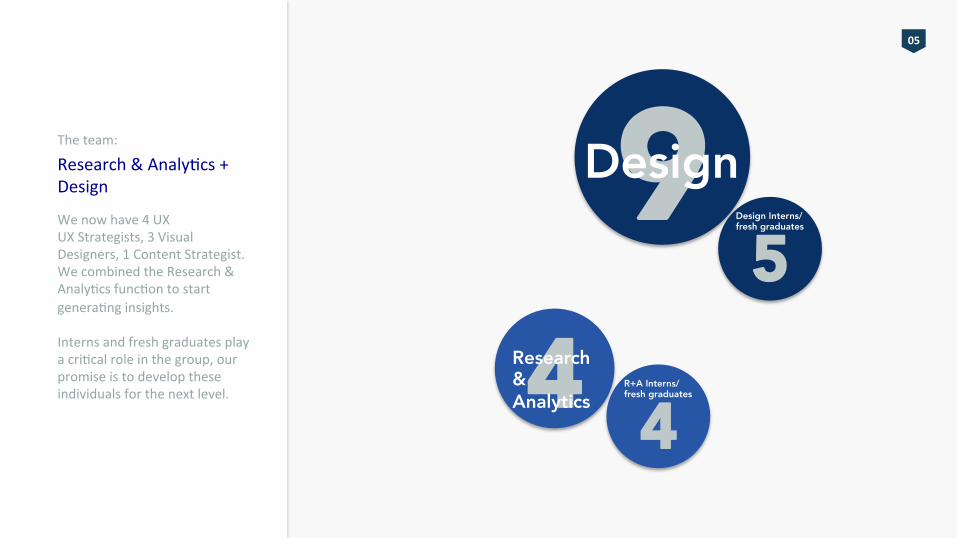
The team:
Research & AnalyFcs + Design 9
4Research & Analytics
DesignWe now have 4 UX UX Strategists, 3 Visual Designers, 1 Content Strategist. We combined the Research & AnalyFcs funcFon to start generaFng insights. Interns and fresh graduates play a criFcal role in the group, our promise is to develop these individuals for the next level.
5Design Interns/fresh graduates
4R+A Interns/fresh graduates
05
Schools represented in our group 06
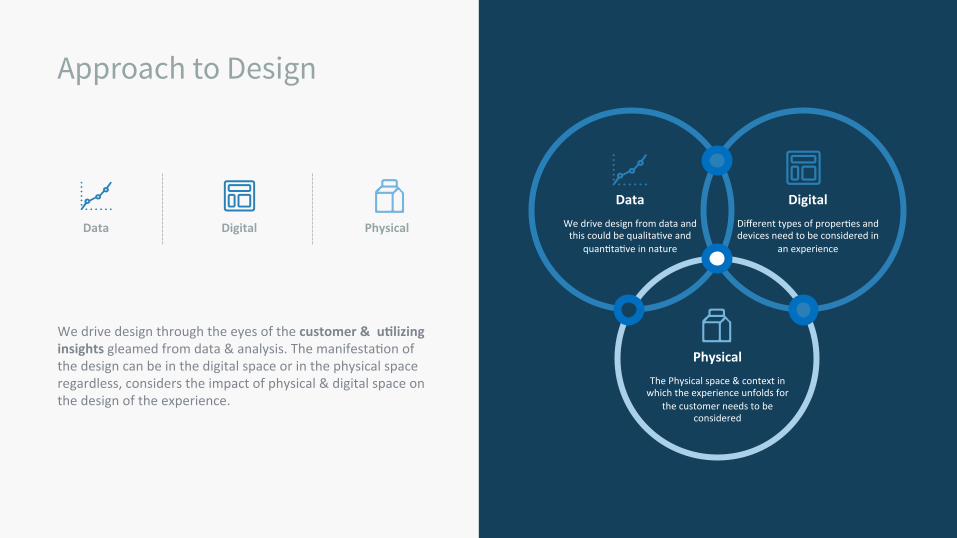
We drive design from data and this could be qualitaFve and
quanFtaFve in nature
Data
The Physical space & context in which the experience unfolds for
the customer needs to be considered
Physical
Different types of properFes and devices need to be considered in
an experience
Digital
Approach to Design
We drive design through the eyes of the customer & u:lizing insights gleamed from data & analysis. The manifestaFon of the design can be in the digital space or in the physical space regardless, considers the impact of physical & digital space on the design of the experience.
Data Digital Physical
08
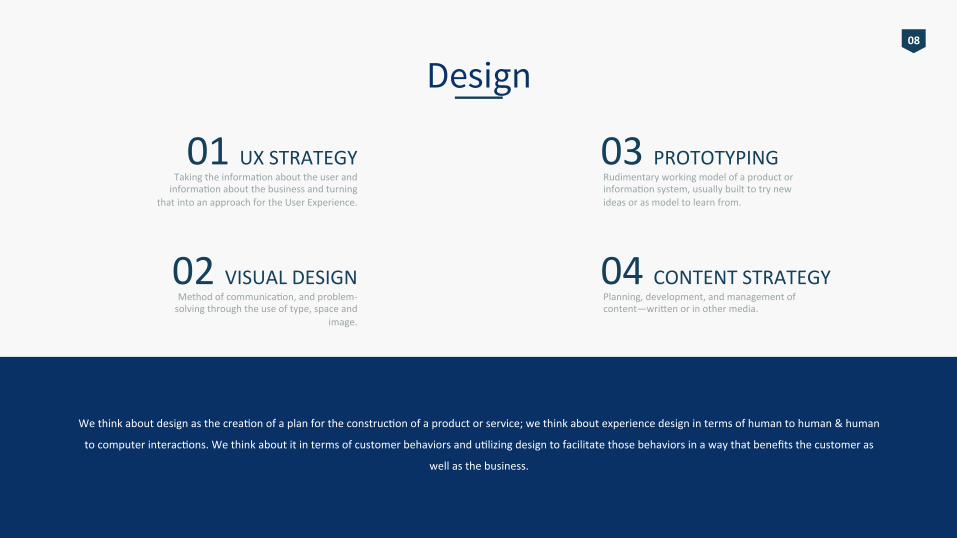
Design
We think about design as the creaFon of a plan for the construcFon of a product or service; we think about experience design in terms of human to human & human
to computer interacFons. We think about it in terms of customer behaviors and uFlizing design to facilitate those behaviors in a way that benefits the customer as
well as the business.
03 PROTOTYPING Rudimentary working model of a product or informaFon system, usually built to try new ideas or as model to learn from.
04 CONTENT STRATEGY Planning, development, and management of content—wrifen or in other media.
01 UX STRATEGY Taking the informaFon about the user and informaFon about the business and turning
that into an approach for the User Experience.
02 VISUAL DESIGN Method of communicaFon, and problem-‐solving through the use of type, space and
image.
09
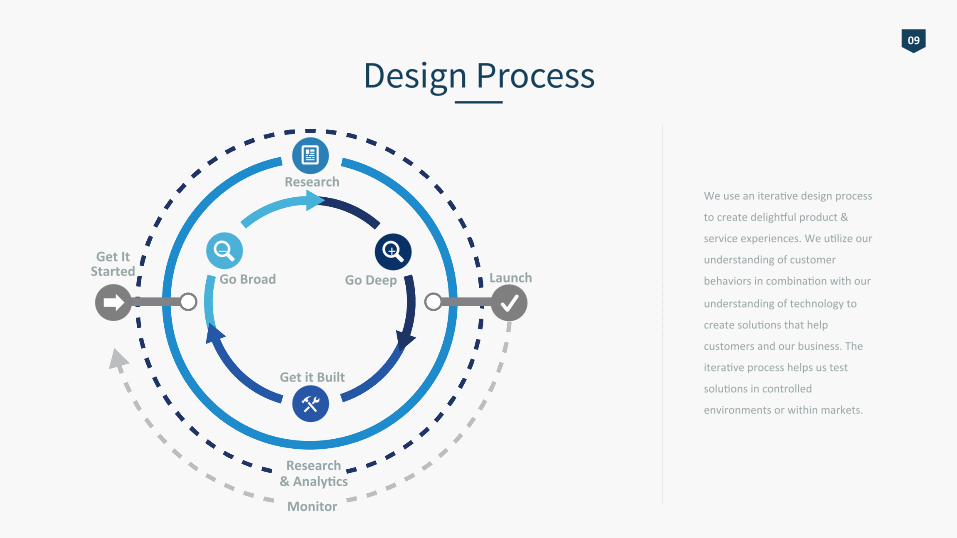
Design Process
We use an iteraFve design process
to create delighSul product &
service experiences. We uFlize our
understanding of customer
behaviors in combinaFon with our
understanding of technology to
create soluFons that help
customers and our business. The
iteraFve process helps us test
soluFons in controlled
environments or within markets.
Research
Get it Built
Launch Go Deep
+
Go Broad
_ Get It Started
Research & Analy:cs
Monitor
10
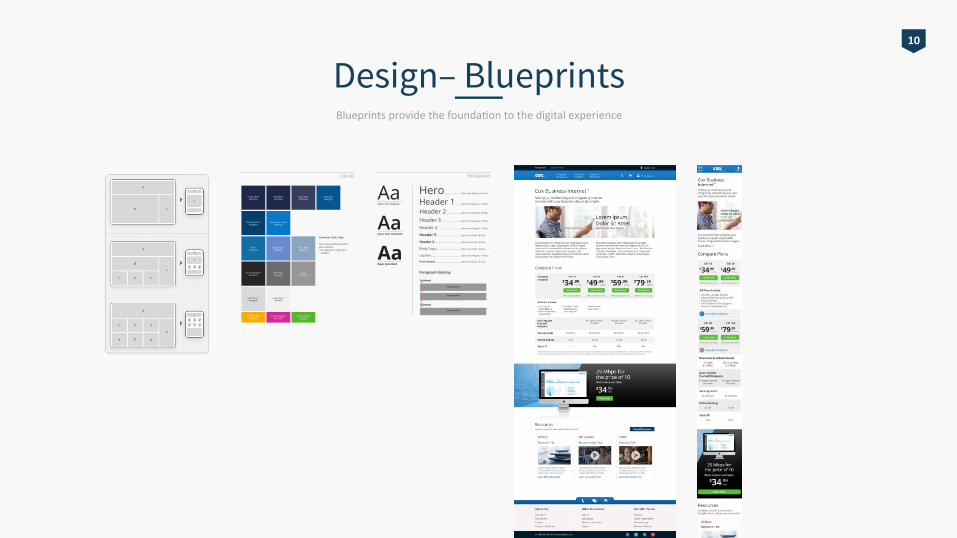
Design– Blueprints Blueprints provide the foundaFon to the digital experience
3
Deep Blue#20274d
Topper Blue#00192a
Navy Blue#383d5d
Dark Blue#045690
Common Color Uses
Text: Charcoal Black #252525Links: #0679caLine separators: Light Gray 1
#dadadc
COLORS
Blue#146ea6
Light Blue 1#678ace
Gray Blue#8aa6c1
Charcoal Black#252525
Dark Gray#6c6c6d
Gray#979798
Light Gray 1#dadadc
Light Gray 2#f4f4f4
Accent Orange#f8af00
Accent Magenta#d12a98
Accent Green#55b829
Primary Action#03406a
Secondary Action#0679ca
7
Hero ........................ Open Sans Regular, 53/57px
Header 1 ........ Open Sans Regular, 40/44px
Header 2 ..................... Open Sans Regular, 30/34px
Header 3 ............................. Open Sans Regular, 24/28px
Header 4 ................................... Open Sans Regular, 20/24px
Header 5 .................................... Open Sans Bold, 18/22px
Header 6 ....................................... Open Sans Bold, 16/20px
Paragraph Spacing
Body Copy ..................................... Open Sans Bold, 16/20px
Legalese ............................................ Open Sans Regular, 14/18px
Price Details ...................................... Open Sans Bold, 12/16px
AaOpen Sans Regular
AaOpen Sans Semibold
AaOpen Sans Bold
TYPOGRAPHY
Subhead
Subhead
Paragraph Text
Paragraph Text
Paragraph Text
20px
20px
20px
30px
11
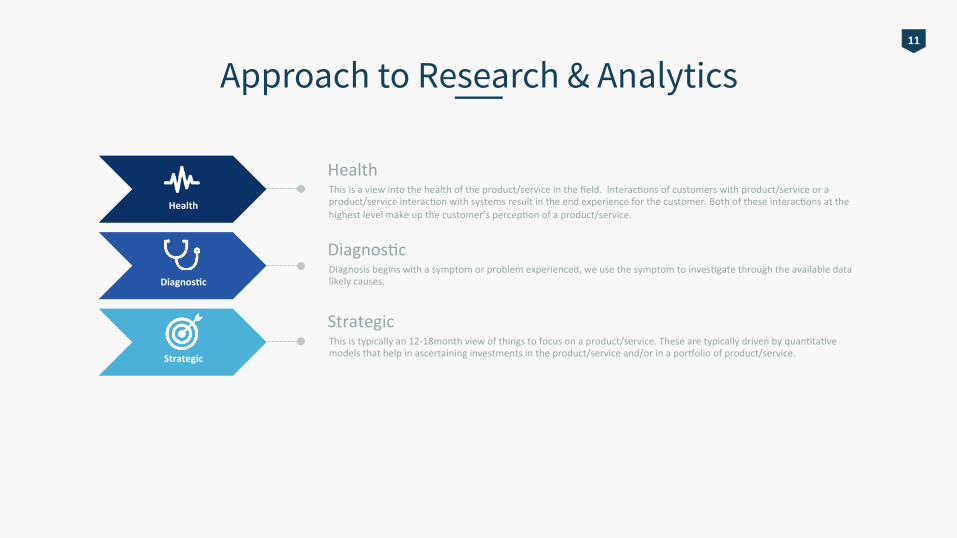
Approach to Research & Analytics
Health This is a view into the health of the product/service in the field. InteracFons of customers with product/service or a product/service interacFon with systems result in the end experience for the customer. Both of these interacFons at the highest level make up the customer’s percepFon of a product/service.
DiagnosFc Diagnosis begins with a symptom or problem experienced, we use the symptom to invesFgate through the available data likely causes.
Strategic This is typically an 12-‐18month view of things to focus on a product/service. These are typically driven by quanFtaFve models that help in ascertaining investments in the product/service and/or in a porSolio of product/service.
Health
Diagnos:c
Strategic

12
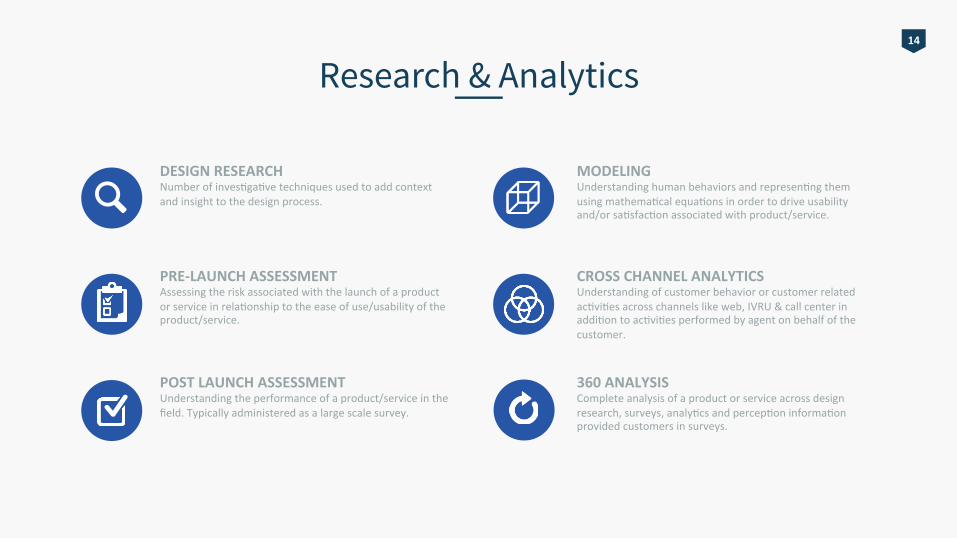
Research & Analytics
DESIGN RESEARCH Number of invesFgaFve techniques used to add context and insight to the design process.
PRE-‐LAUNCH ASSESSMENT Assessing the risk associated with the launch of a product or service in relaFonship to the ease of use/usability of the product/service.
POST LAUNCH ASSESSMENT Understanding the performance of a product/service in the field. Typically administered as a large scale survey.
MODELING Understanding human behaviors and represenFng them using mathemaFcal equaFons in order to drive usability and/or saFsfacFon associated with product/service.
CROSS CHANNEL ANALYTICS Understanding of customer behavior or customer related acFviFes across channels like web, IVRU & call center in addiFon to acFviFes performed by agent on behalf of the customer.
360 ANALYSIS Complete analysis of a product or service across design research, surveys, analyFcs and percepFon informaFon provided customers in surveys.
13
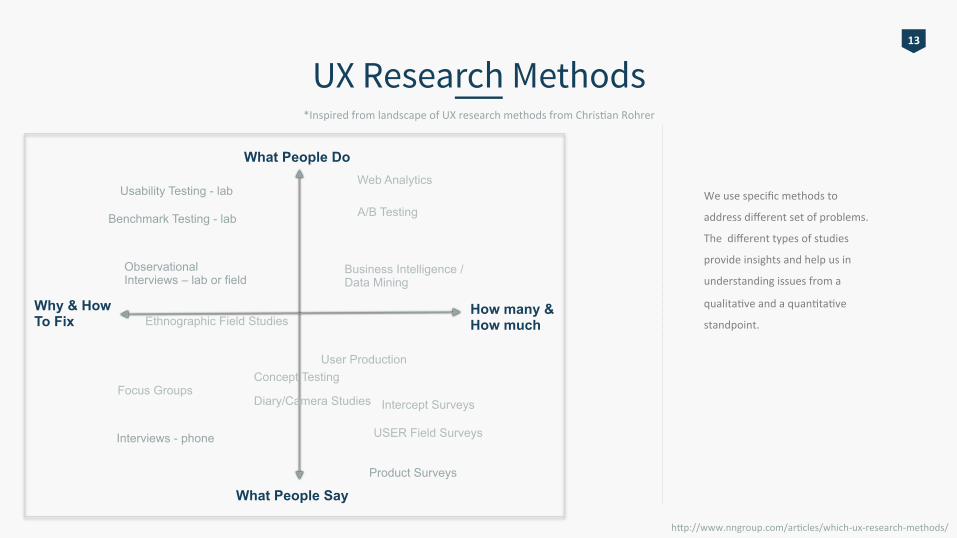
UX Research Methods *Inspired from landscape of UX research methods from ChrisFan Rohrer
What People Do
What People Say
Why & How To Fix
Usability Testing - lab
Benchmark Testing - lab
User Production
Focus Groups
Interviews - phone
Intercept Surveys
Observational Interviews – lab or field
Product Surveys
Web Analytics
Business Intelligence / Data Mining
A/B Testing
How many & How much
USER Field Surveys
hfp://www.nngroup.com/arFcles/which-‐ux-‐research-‐methods/
Concept Testing
Diary/Camera Studies
Ethnographic Field Studies
We use specific methods to
address different set of problems.
The different types of studies
provide insights and help us in
understanding issues from a
qualitaFve and a quanFtaFve
standpoint.
14
Research & Analytics
DESIGN RESEARCH Number of invesFgaFve techniques used to add context and insight to the design process.
PRE-‐LAUNCH ASSESSMENT Assessing the risk associated with the launch of a product or service in relaFonship to the ease of use/usability of the product/service.
POST LAUNCH ASSESSMENT Understanding the performance of a product/service in the field. Typically administered as a large scale survey.
MODELING Understanding human behaviors and represenFng them using mathemaFcal equaFons in order to drive usability and/or saFsfacFon associated with product/service.
CROSS CHANNEL ANALYTICS Understanding of customer behavior or customer related acFviFes across channels like web, IVRU & call center in addiFon to acFviFes performed by agent on behalf of the customer.
360 ANALYSIS Complete analysis of a product or service across design research, surveys, analyFcs and percepFon informaFon provided customers in surveys.
15
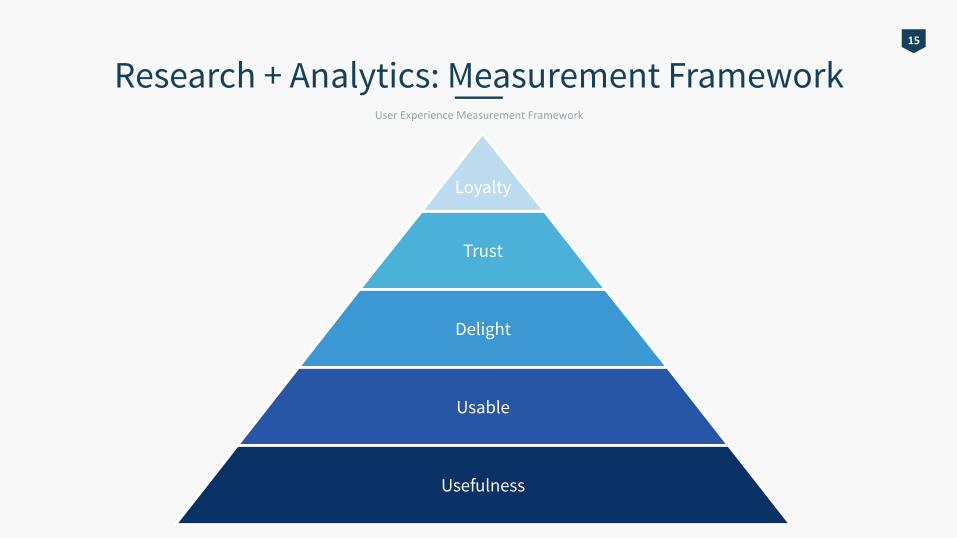
Research + Analytics: Measurement Framework User Experience Measurement Framework
Loyalty
Trust
Delight
Usable
Usefulness
16
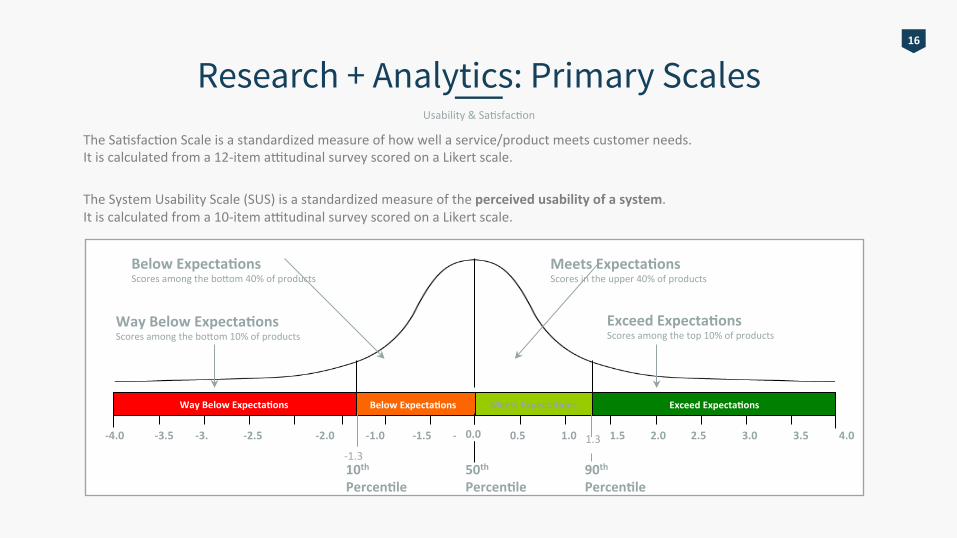
Research + Analytics: Primary Scales Usability & SaFsfacFon
The SaFsfacFon Scale is a standardized measure of how well a service/product meets customer needs. It is calculated from a 12-‐item amtudinal survey scored on a Likert scale. The System Usability Scale (SUS) is a standardized measure of the perceived usability of a system. It is calculated from a 10-‐item amtudinal survey scored on a Likert scale.
Exceed Expecta:ons Scores among the top 10% of products
Below Expecta:ons Scores among the bofom 40% of products
Meets Expecta:ons Scores in the upper 40% of products
Way Below Expecta:ons Scores among the bofom 10% of products
10th 50th 90th Percen:le Percen:le Percen:le
-‐4.0 -‐3.5 -‐3. -‐2.5 -‐2.0 -‐1. -‐1.0 -‐1.5 -‐0.5 0.5 1.0 1.5 2.0 2.5 3.0 3.5 4.0
Meets Expecta:ons Way Below Expecta:ons Below Expecta:ons Exceed Expecta:ons
-‐1.3 1.3
0.0
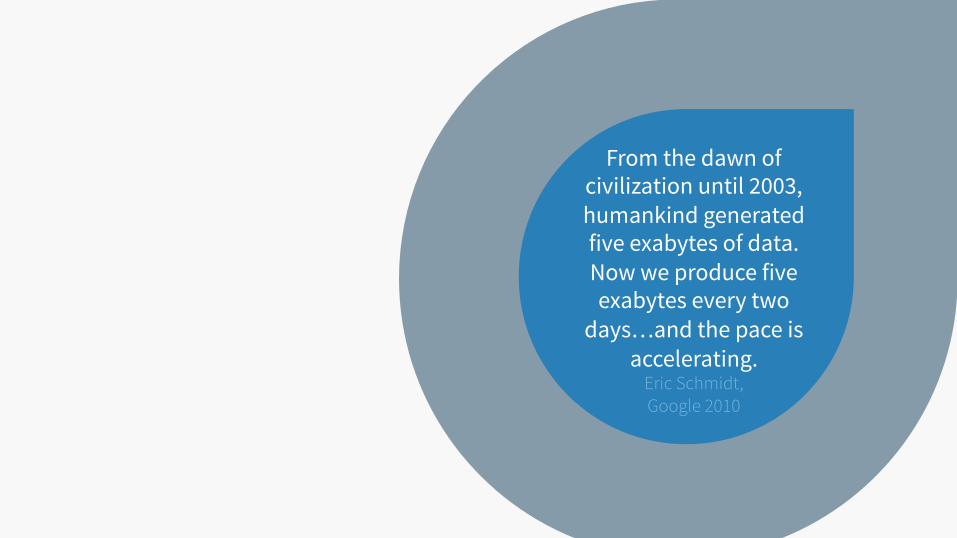
From the dawn of civilization until 2003, humankind generated five exabytes of data. Now we produce five exabytes every two
days…and the pace is accelerating.
Eric Schmidt, Google 2010
18
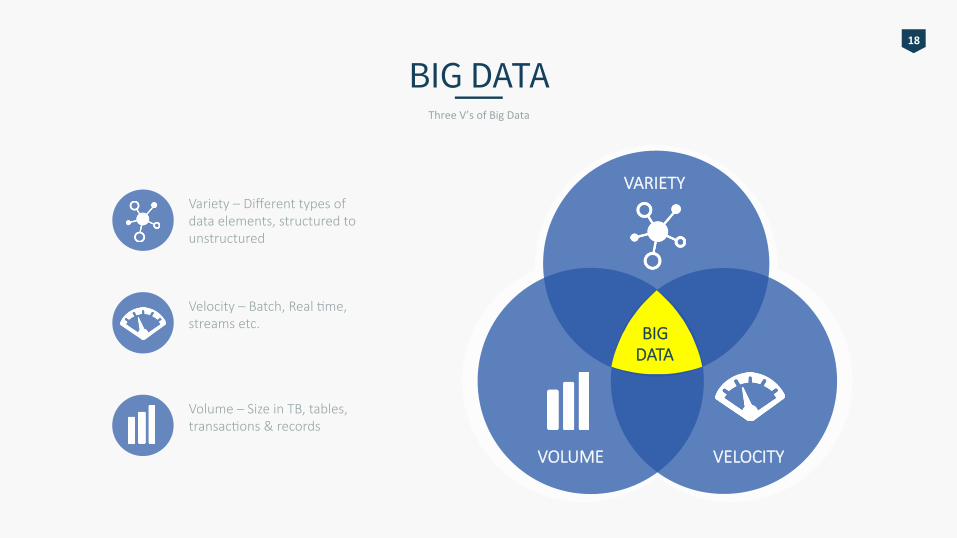
BIG DATA Three V’s of Big Data
Variety – Different types of data elements, structured to unstructured
Velocity – Batch, Real ;me, streams etc.
Volume – Size in TB, tables, transac;ons & records
VARIETY
VELOCITY VOLUME
BIG DATA
19
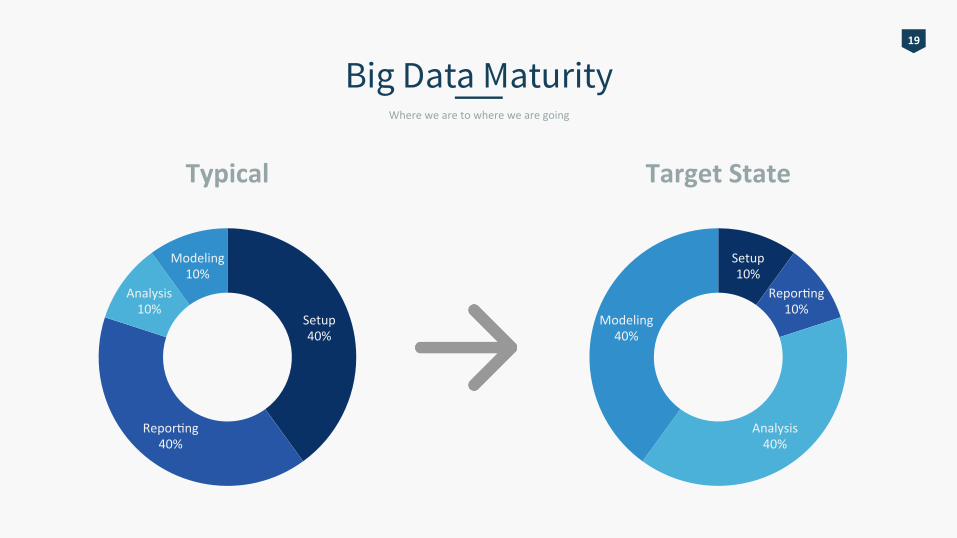
Big Data Maturity Where we are to where we are going
Setup 40%
ReporFng 40%
Analysis 10%
Modeling 10%
Typical
Setup 10%
ReporFng 10%
Analysis 40%
Modeling 40%
Target State
20
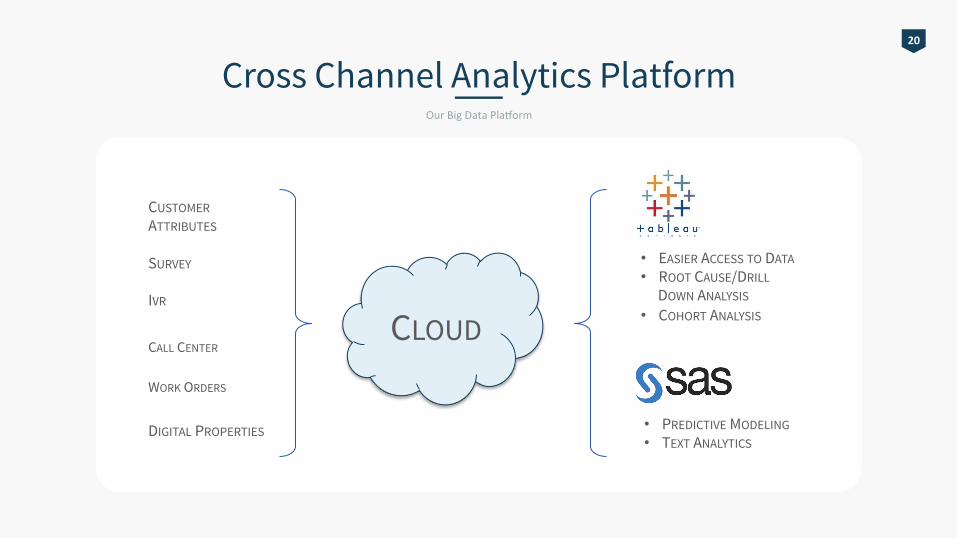
Cross Channel Analytics Platform Our Big Data PlaSorm
CUSTOMER ATTRIBUTES
IVR
CALL CENTER
DIGITAL PROPERTIES
• EASIER ACCESS TO DATA • ROOT CAUSE/DRILL
DOWN ANALYSIS • COHORT ANALYSIS
• PREDICTIVE MODELING • TEXT ANALYTICS
CLOUD
SURVEY
WORK ORDERS
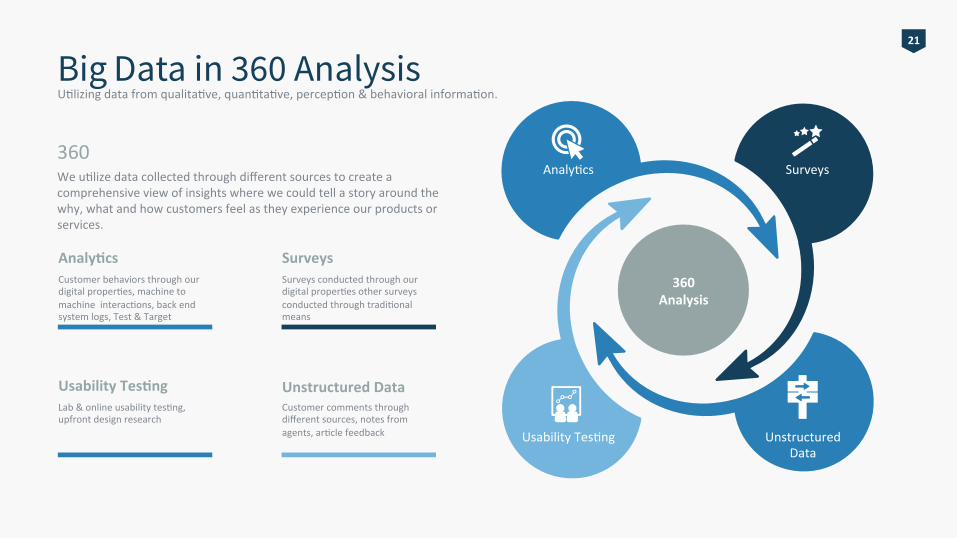
Big Data in 360 Analysis UFlizing data from qualitaFve, quanFtaFve, percepFon & behavioral informaFon.
AnalyFcs Surveys
Usability TesFng Unstructured Data
360 Analysis
Customer behaviors through our digital properFes, machine to machine interacFons, back end system logs, Test & Target
Analy:cs Surveys conducted through our digital properFes other surveys conducted through tradiFonal means
Surveys
Lab & online usability tesFng, upfront design research
Usability Tes:ng Customer comments through different sources, notes from agents, arFcle feedback
Unstructured Data
We uFlize data collected through different sources to create a comprehensive view of insights where we could tell a story around the why, what and how customers feel as they experience our products or services.
360
21
22
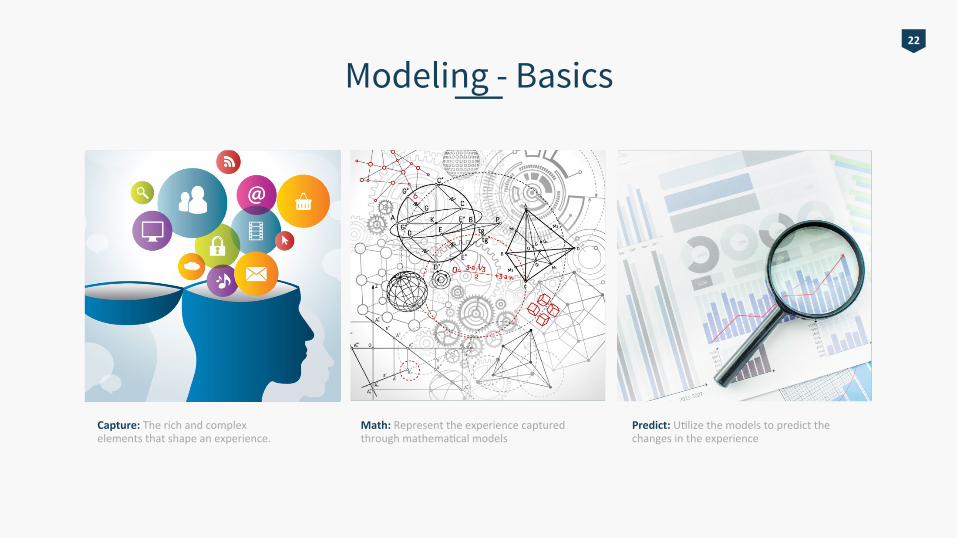
Modeling - Basics
Capture: The rich and complex elements that shape an experience.
Math: Represent the experience captured through mathemaFcal models
Predict: UFlize the models to predict the changes in the experience
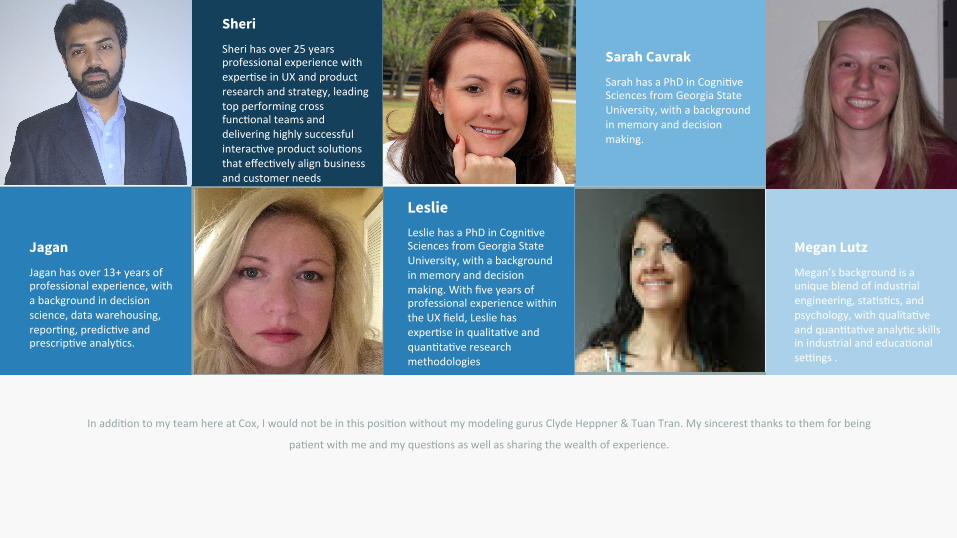
In addiFon to my team here at Cox, I would not be in this posiFon without my modeling gurus Clyde Heppner & Tuan Tran. My sincerest thanks to them for being
paFent with me and my quesFons as well as sharing the wealth of experience.
Sarah has a PhD in CogniFve Sciences from Georgia State University, with a background in memory and decision making.
Sarah Cavrak
Megan’s background is a unique blend of industrial engineering, staFsFcs, and psychology, with qualitaFve and quanFtaFve analyFc skills in industrial and educaFonal semngs .
Megan Lutz
Sheri has over 25 years professional experience with experFse in UX and product research and strategy, leading top performing cross funcFonal teams and delivering highly successful interacFve product soluFons that effecFvely align business and customer needs
Sheri
Leslie has a PhD in CogniFve Sciences from Georgia State University, with a background in memory and decision making. With five years of professional experience within the UX field, Leslie has experFse in qualitaFve and quanFtaFve research methodologies
Leslie
Jagan has over 13+ years of professional experience, with a background in decision science, data warehousing, reporFng, predicFve and prescripFve analyFcs.
Jagan
Feel free to say hi! We are friendly and social
6305 B, Peachtree Dunwoody Rd. Atlanta, GA 30338 404-‐234-‐0444
![Presented By - Aryan CollegeBALAJI BALAJ1i BALAJI NAMKEE,v BALAJI NAM KEEN Kna BAL BALAJI sNAFERS BALAJii BALAJI AN AFERS BALAJI 0ÈERs BALAJI BALAJI only BALAJI Ctlinese ej/ffJ1]JžfJ](https://img.pdfslide.net/doc/110x75/5eaecb507cb6087a2d0ae9dc/presented-by-aryan-college-balaji-balaj1i-balaji-namkeev-balaji-nam-keen-kna.jpg)