Embed Size (px)
Citation preview
Innovative Diffusion Driven Desalination Process
James F. Klausner, Mohamed Darwish, and Renwei Mei University of Florida
Department of Mechanical and Aerospace Engineering Gainesville, Florida 32611
Abstract
An innovative diffusion driven desalination (DDD) process is presented, and its
performance based on thermodynamic considerations is thoroughly explored. The
desalination is driven by water vapor saturating dry air flowing through a diffusion tower.
Liquid water is condensed out of the air/vapor mixture in a direct contact condenser. The
desalination process is suitable for operation at low temperatures and may be driven by
waste heat with low thermodynamic availability. It is demonstrated that the DDD
process can yield a fresh water production efficiency of 8% with an energy consumption
of 0.05 kWh per kilogram of fresh water production based on a feed water temperature of
only 60° C. An example is discussed in which the DDD process utilizes waste heat from
a 100 MW steam power plant to produce 18 million gallons of fresh water per day. The
energy consumption for the DDD process is comparable to that for conventional flash
evaporation and reverse osmosis processes.
1.0 Introduction
The continuous rise in the world population and the expansion of industrial
facilities around the globe has placed a growing demand on the fresh water supply from
natural resources (rivers, fresh water lakes, underground aquifers, and brackish wells).
These resources have been steadily on the decline since the early 1950’s. Therefore the
need for new fresh water resources to balance the growing consumption rate has been a
serious concern facing governments and world organizations for the past 50 years. The
fact that 96% of the earth’s surface is covered with saline water has been a substantial
catalyst for developing water desalination technologies. Today there are more than 7500
desalination plants in operation worldwide, and about two thirds of those are operating in
the Middle East. Saudi Arabia operates the largest desalination plant, with a capacity of
128 MGD. The United States accounts for about 12% of the world’s desalination
capacity, with the majority of production in Florida and the Caribbean [1].
Desalination involves any process in which dissolved minerals are removed from
saline or brackish water. Technologies developed for desalination applications include
distillation, reverse osmosis, electro-dialysis, and vacuum freezing. Distillation and
reverse osmosis are the most commercially prominent. Distillation technologies include
Multiple Effect Distillation (MED) and Multi-Stage Flashing (MSF), both of which
operate by evaporating saline water at atmospheric or reduced pressure and condensing
the vapor to produce fresh potable water. Reverse Osmosis (RO) operates on a filtering
principle. High pressure pumps force the saline water through nanofilter membranes
allowing fresh water to pass while filtering out the dissolved minerals. Although
distillation and reverse osmosis technologies currently provide the most cost effective
means for desalination, their drawback is that they are very energy intensive, and whether
or not they remain cost effective strongly depends on energy prices and energy supply.
A desalination technology that has drawn interest over the past two decades is
referred to as Humidification Dehumidification (HDH). This processes operates on the
principle of mass diffusion and utilizes dry air to evaporate saline water, thus
humidifying the air. Fresh water is produced by condensing out the water vapor, which
James F. Klausner 2
results in dehumidification of the air. A significant advantage of this type of technology
is that it provides a means for low pressure, low temperature desalination and can
potentially be very energy efficient. Bourouni et al., Al-Hallaj et al., and Assouad et al.
[2-4] respectively reported the operation of HDH units in Tunisia, Jordan, and Egypt.
Another type of desalination technology that makes use water evaporating into an air
stream is the Carrier-Gas Process (CGP) reported by Larson et al. [5]. An economic
analysis was provided to suggest that such a technology has potential economic
advantages compared with conventional MED, MSF, and RO technologies.
This work describes a new Diffusion Driven Desalination (DDD) process that
demonstrates competitive thermal efficiency advantages with conventional desalination
technologies at large production rates. The DDD process is in some ways similar to the
HDH and CGP processes in that the mass diffusion of water molecules into dry air is the
driving mechanism to evaporate saline water. In addition, the DDD process makes use of
the naturally occurring thermal energy storage in large bodies of water, where
desalination is most likely to be applicable. Because the desalination is accomplished at
relatively low temperatures, inexpensive materials may be used for constructing a
processing facility, and waste heat may be utilized to drive the desalination process. A
complete thermodynamic analysis of the DDD process has been explored and it is
demonstrated that the process has substantial potential for cost reduction when compared
with conventional desalination technologies. Its potential benefit to the electric utility
industry is discussed.
James F. Klausner 3
2.0 The Diffusion Driven Desalination Process
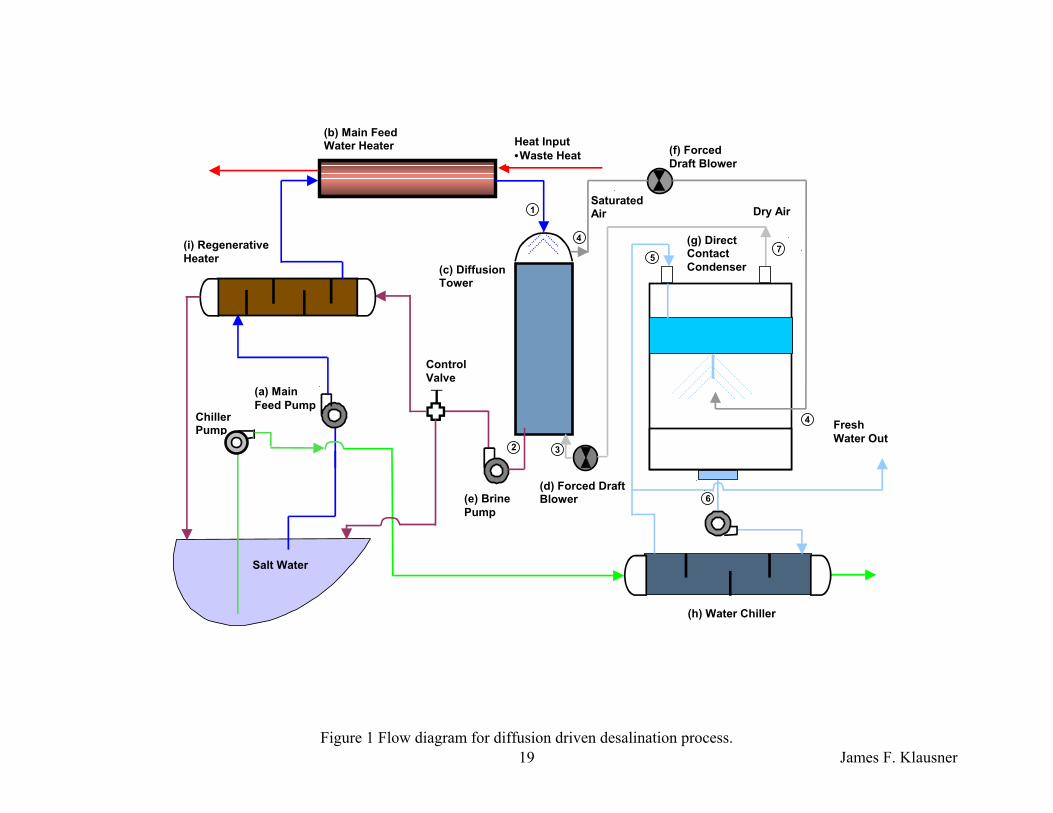
A simplified schematic diagram of the DDD process and system are shown in
Figure 1. The process is described here. A main feed pump (a) draws water from a large
body of seawater. The suction for the pump draws water near the surface in order to take
advantage of the fact that large bodies of water absorb solar radiation, and due to thermal
stratification, the warmer water is in the vicinity of the surface, while cooler water resides
at larger depths beneath the surface. The surface water is pumped through the main feed
water heater (b). The amount of heat required depends on the main feed water mass flow
rate and desired production rate. The output temperature from the heater is relatively
low, and therefore the required heat input can be provided by a variety of sources,
depending on the available resources. It is envisioned that heat can be provided from low
pressure condensing steam in the main condenser of a steam driven power plant, waste
heat from a combustion engine, solar heating, or from a direct fossil fuel fired furnace.
After the feed water is heated in the main heater, it is sprayed into the top of the diffusion
tower (c). The diffusion tower is the most important piece of equipment in the process,
and the degree to which an operational DDD process follows theoretically predicted
trends depends on an appropriately designed diffusion tower. On the bottom of the
diffusion tower, low humidity air is pumped in using a forced draft blower (d). The water
falls concurrently to the airflow through the diffusion tower by the action of gravity. The
diffusion tower is packed with very high surface area packing material, as would be
found in an air-stripping tower. As water flows through the diffusion tower, a thin film
of water forms over the packing material and contacts the air flowing upward through the
tower. As dictated by Fick’s law and the conservation of mass, momentum, and energy,
James F. Klausner 4
liquid water will evaporate and diffuse into the air, while air will diffuse into the water,
due to concentration gradients. The diffusion tower should be designed such that the
air/vapor mixture leaving the diffusion tower should be fully saturated. The purpose of
heating the water prior to entering the diffusion tower is that the rate of diffusion and the
exit humidity ratio increase with increasing temperature, thus yielding greater production.
The water not evaporated in the diffusion tower, will be collected at the bottom and
removed with a brine pump (e). The brine will either be discharged or sent through a
regenerative heater (i). When the brine temperature exceeds 30° C, it will be sent to the
regenerative heater, otherwise it will be discharged. With appropriate maintenance it is
not expected that scaling of the diffusion tower will pose a significant problem since the
brine will wash away residual minerals left behind by the evaporated water.
The air entering the diffusion tower will be dried in the direct contact condenser
(g). The saturated air/vapor mixture leaving the diffusion tower is drawn into the direct
contact condenser with a forced draft blower (f), where the water vapor is condensed into
fresh liquid water that is collected in the sump of the condenser. Another very important
component of the DDD process is the condenser. The difficulty that arises is that film
condensation heat transfer is tremendously degraded in the presence of non-condensable
gas. The same difficulty was faced in the design and development of condensers for
OTEC (Ocean Thermal Energy Conversion) applications. In order to overcome this
problem Bharathan et al. [6] describe the use of direct-contact heat exchangers. In their
excellent report, they have developed models for simulating the heat transfer and have
validated the models with careful experimentation. Bharathan et al. [7] have also been
awarded a U.S. Patent for a high efficiency direct contact heat exchanger. For the present
James F. Klausner 5
application involving desalination, the warm fresh water discharging the direct contact
heat exchanger will be chilled in a conventional shell-and-tube heat exchanger (h) using
saline cooling water. The cooling water is drawn from a large depth to take advantage of
the thermal stratification in large bodies of water. A portion of the chilled fresh water
will be directed back to the direct contact heat exchanger to condense the water vapor
from the air/vapor mixture discharging from the diffusion tower. The rest of the fresh
water is make-up water. The direct contact condenser approach is best suited for the
DDD process.
3.0 Analysis and Results
In order to explore the performance and parametric bounds of the Diffusion
Driven Desalination process, a thermodynamic cycle analysis has been performed. In
performing the analysis the following assumptions have been made,
1. The process operates at steady-state conditions,
2. There are no energy losses to the environment from the heat and mass transfer
equipment,
3. Air and water vapor may be treated as a perfect gas,
4. Changes in kinetic and potential energy are relatively small,
5. The pumping power is neglected in the energy balance (estimating the required
pumping power would require significant details regarding the construction of the
diffusion tower and heat transfer equipment; these are beyond the scope of the
current analysis).
James F. Klausner 6
In the analysis, the temperature of the feed water drawn into the main feed pump is fixed
at 27° C. It is assumed that a large supply of cool water will be available at a sink
temperature, T , of 15° C. The condensate in the direct contact condenser will be chilled
and a portion of it re-circulated. To avoid providing specifics on the heat transfer
equipment, it is assumed that the heat transfer effectiveness in the chiller and condenser
is unity, in which case T =T =T =15° C. The temperature of the feed water leaving the
main heater is the high temperature in the system, T =T , and is a primary controlling
variable for the process. Different performance curves will be shown for a variable
T /T .
L
L 5 7
H 1
H L
The air/vapor mixture leaving the diffusion tower is assumed to be fully saturated
(relative humidity of unity), and due to heat transfer limitations, its maximum
temperature will be taken to be that of the feed water entering the diffusion tower
(T4=T1).
The main purpose of this analysis is to explore the performance bounds of the
DDD process. However, specification of the system operating variables is not arbitrary.
Namely there are two constraints that must be satisfied,
1. The brine temperature leaving the diffusion tower must not freeze (T2>0° C), and
2. The net entropy generation in the diffusion tower must be positive.
These constraints govern the parametric bounds for the diffusion tower operation. While
the first constraint is initially obvious, the second constraint is simply a restatement of the
second law of thermodynamics for the present adiabatic system (diffusion tower). The
control volume formulation of the second law of thermodynamics for an open system is
expressed as,
James F. Klausner 7
dAAQ
TAdvsVsd
tDtDs
AAV
&rr∫∫∫ ≥⋅+
∂∂= 1ρρ , (1)
where V denotes the control volume, A is the control surface, and s is the entropy per unit
mass. Assuming steady state processing of fresh water, the adiabatic diffusion tower
assumption leads to,
0≥⋅== ∫ AdvsDtDss
A
rr& ρ , (2)
and
3331144422 vvaallvvaall smsmsmsmsmsms −−−++=& (3)
where m denotes the mass flow rate and the subscripts l, a, and v respectively refer to the
liquid, air, and vapor phases. The numerical subscripts denote that the property is
evaluated at the state corresponding to the position in the process as shown schematically
in Figure 1. Conservation of mass dictates that,
)( 3412 ωω −−=a
l
a
l
mm
mm . (4)
The rate of entropy generation in the diffusion tower per rate of air flow, which must be
positive, is obtained from rearranging Eq. (3) and combining with Eq. (4) as,
11
33443
4
3
4234
1 lnln)( la
lvv
a
aapal
a
l
as
mm
ssPP
RTT
Csmm
ms −−+
−
+
−−= ωωωω
& , (5)
where ω is the humidity ratio, Cp is the specific heat, R is the engineering gas constant,
and Pa is the partial pressure of air.
The control volume formulation of energy conservation applied to the adiabatic
diffusion tower leads to,
04442233311 =−−−++ vvaallvvaall hmhmhmhmhmhm (6)
James F. Klausner 8
where h denotes the enthalpy. The enthalpy of the brine exiting the diffusion tower is
obtained from Eqs. (6) and (4) as,
)(
)()(
341
44333411
22ωω
ωω
−−
−+−−=
a
l
vvpala
l
l
mm
hhTTChmm
Th , (7)
and the brine temperature (T2) is evaluated from the enthalpy. The ratio of the feed water
to air flow through the diffusion tower, a
l
mm 1 , is another controlling variable in the
analysis. For all computations the feed water flow rate will be fixed at 1 kg/s while the
air flow rate will be varied.
The humidity ratio entering the diffusion tower, ω3, is determined by recognizing
that it is the same as the humidity ratio exiting the condenser, where T7 is 15 °C. Prior to
entering the diffusion tower, the air/vapor mixture is convectively heated by the ambient
as it is pumped back to the diffusion tower. This may be achieved by placing fins on the
return line to the diffusion tower. Taking the ambient temperature to be 25 °C, it follows
that T3=25 °C and ω3=ω7.
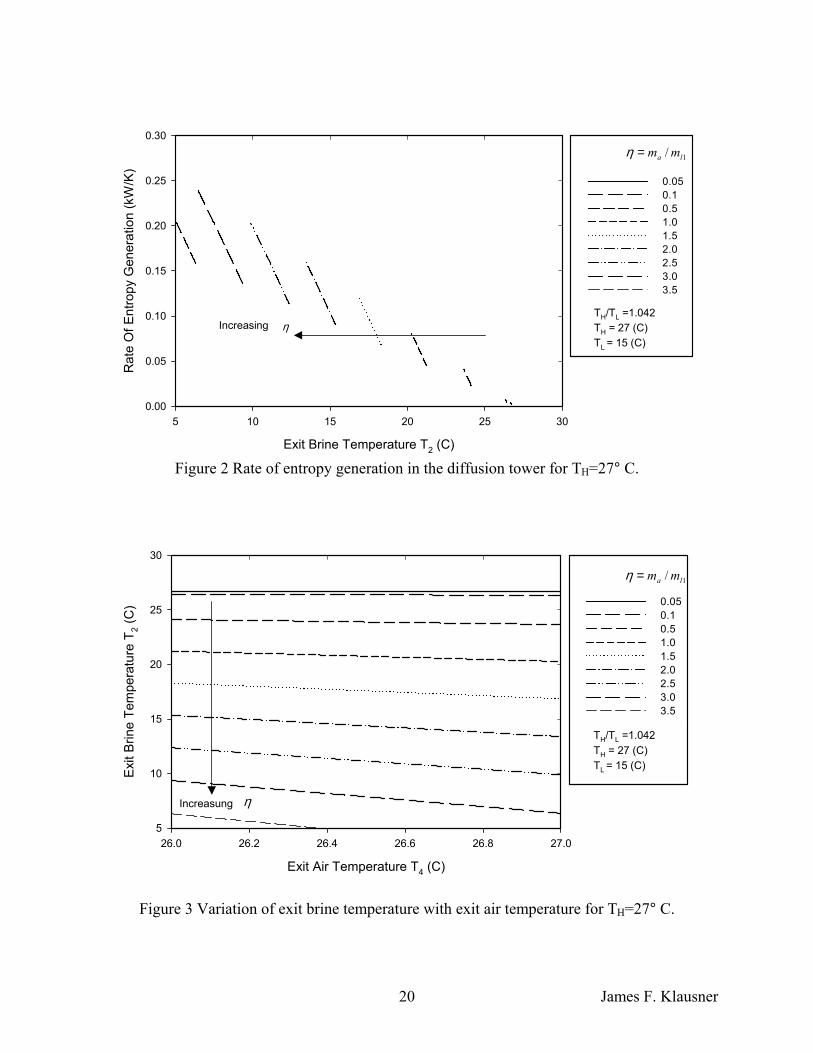
The first case considered is where there is no heating in the main heater. The
desalination process is entirely driven by the difference in temperature of the feed water
drawn at shallow depths and the cooling water drawn at more substantial depth. In this
case, TH/TL=1.04. Figure 2 shows the rate of entropy generation within the diffusion
tower and the brine temperature exiting the diffusion tower for a locus of possible
operating conditions. Here it is observed that the second law of thermodynamics is
satisfied for the entire parametric range considered. At the highest air to feed water flow
ratio, more fresh water production is possible, but there is a lower limit beyond which the
James F. Klausner 9
exit brine will freeze. Figure 3 shows the brine temperature (T2) exiting the diffusion
tower as a function of the exit air temperature from the diffusion tower (T4) for the same
locus of operating conditions as in Figure 2. It is advantageous to have a high air
temperature leaving the diffusion tower so that the humidity ratio and fresh water
production rate are as high as possible. For this case the exit air temperature is primarily
constrained by the inlet feed water temperature (T1). Due to heat transfer considerations
it would be impractical to design the diffusion tower such that T4 exceeds T1. Thus in
this analysis, the exiting air temperature from the diffusion tower does not exceed the
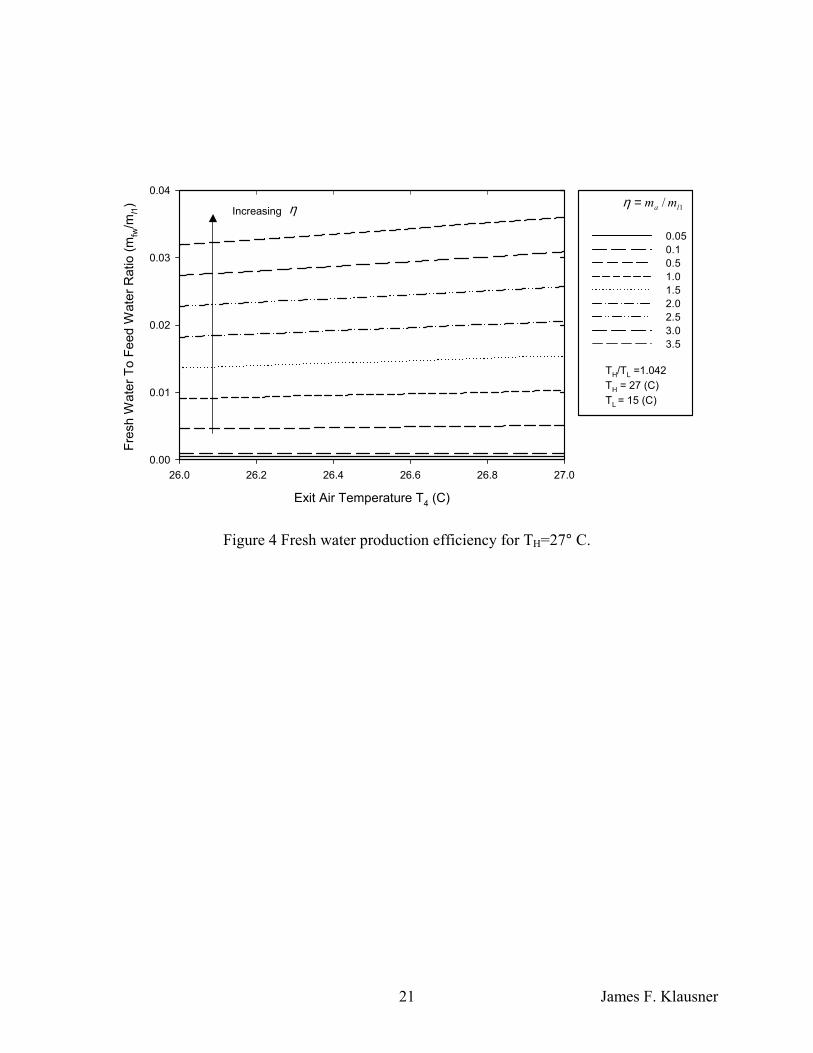
inlet feed water temperature. Figure 4 shows the ratio of fresh water production rate to
the inlet feed water rate as a function of the exit air temperature for different air to feed
water flow ratios. Clearly, the production rate increases with increasing exit air
temperature and increasing air to feed water flow ratios. However, both these parameters
are constrained, and for the case of no heating of the feed water (TH/TL=1.04), the
maximum fresh water production efficiency (mfw/ml1) is approximately 0.035.
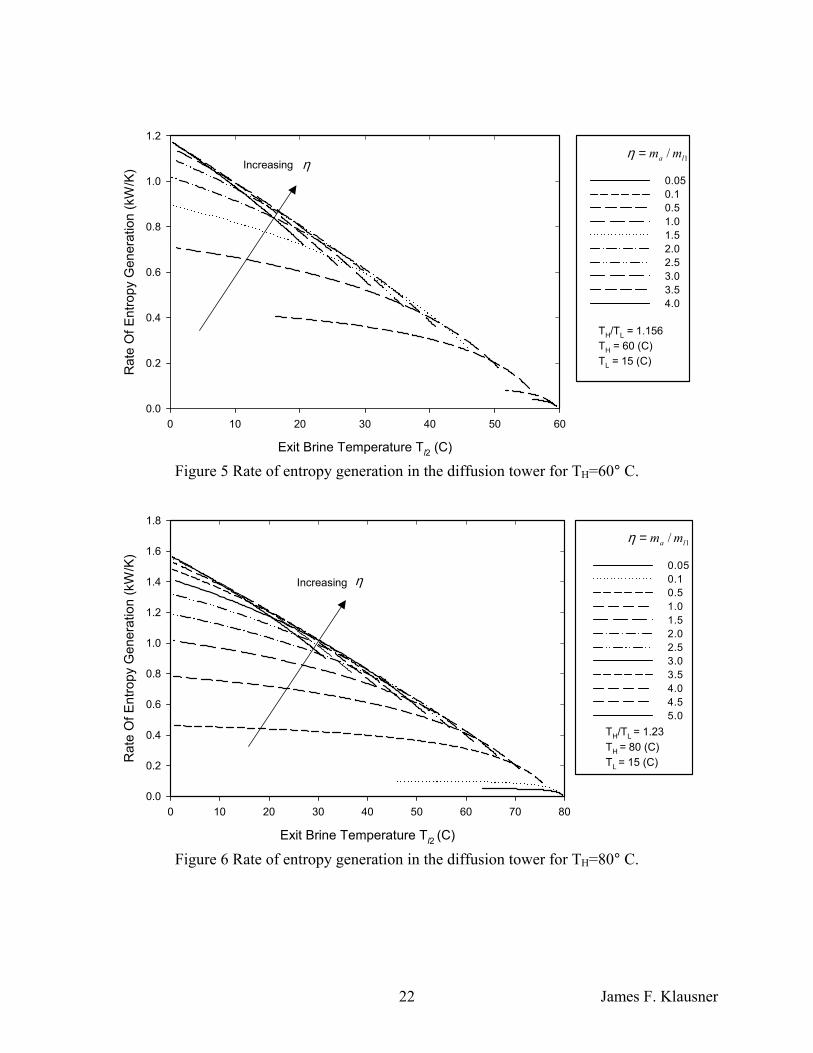
The next cases considered are where the diffusion tower inlet water temperatures
are 60° C and 80° C which correspond to TH/TL=1.156 and 1.23, respectively. Figures 5
and 6 show the rate of entropy generation in the diffusion tower for TH/TL=1.156 and
1.23, respectively. Again the second law of thermodynamics is satisfied for the entire
parametric range considered. The entropy generation tends to be lower for lower air to
feed water flow ratios and higher exit brine temperatures. At higher air to feed water
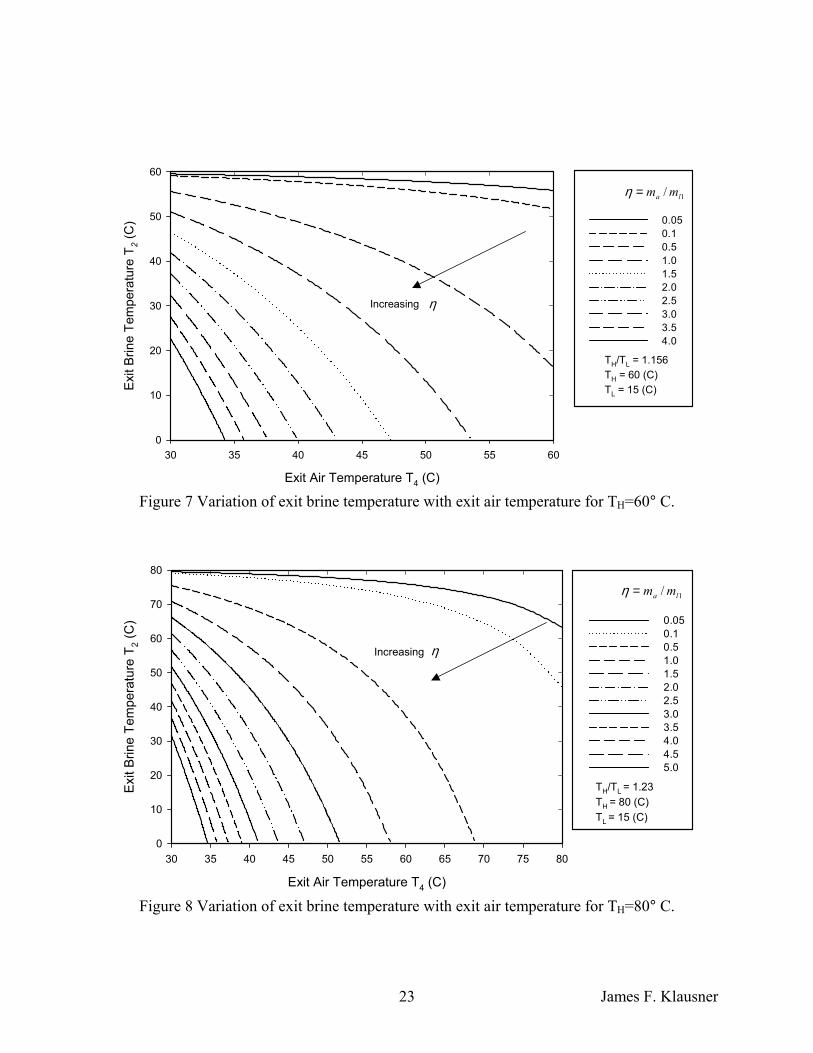
flow ratios, the constraint is that the brine does not freeze. Figure 7 shows the range of
possible exit brine temperatures and exit air temperatures for different air to feed water
flow ratios when the diffusion tower inlet water temperature is 60° C (TH/TL=1.156).
James F. Klausner 10
Figure 8 shows the range of temperatures when the diffusion tower inlet water
temperature is 80° C ((TH/TL=1.23). The maximum fresh water production will occur
with as high an exit air temperature as possible. In order to satisfy an energy balance on
the diffusion tower, the exit brine temperature decreases with increasing exit air
temperature. In contrast to the case with no heating, the exit air temperature is primarily
constrained by the fact that the brine cannot freeze, especially at higher air to feed water
flow ratios. At very low air to feed water flow ratios and TL=60° and 80° C, the exit air
temperature is constrained by the inlet water temperature.
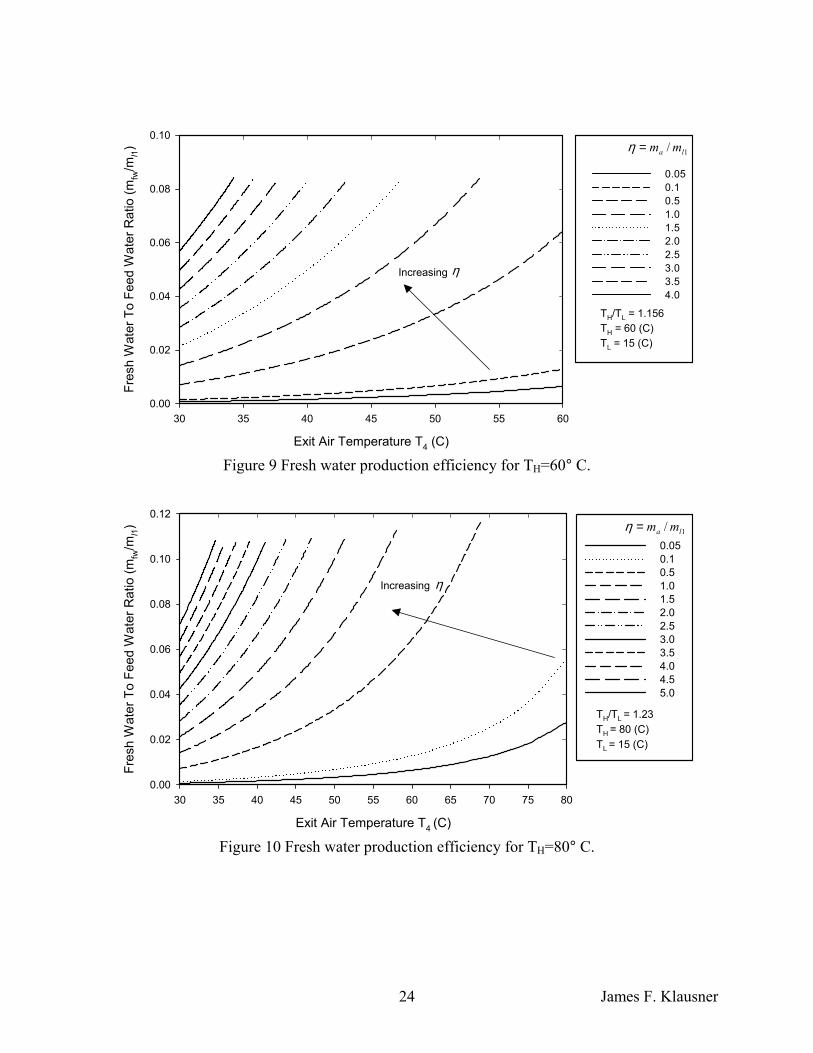
For respective diffusion tower inlet water temperatures of 60° C and 80° C,
Figures 9 and 10 show the ratio of fresh water production to the inlet feed water flow rate
as a function of the exit air temperature for different air to feed water flow ratios. It is
observed that the fresh water production efficiency increases with increasing exit air
temperature and increasing air to feed water flow ratio. The maximum fresh water
production efficiency for T =60° C is approximately 0.08, while that for T =80° C is
approximately 0.11. Therefore, one advantage of increasing the diffusion tower inlet
water temperature is that the fresh water production efficiency increases.
1 1
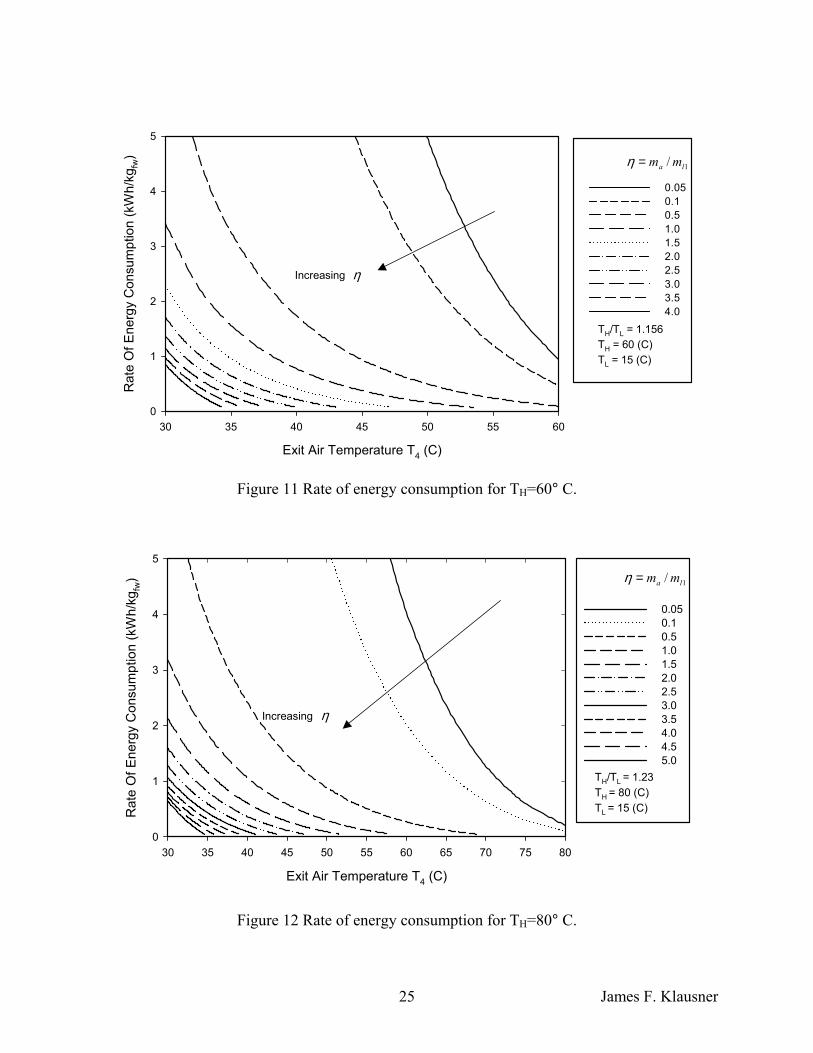
For respective diffusion tower inlet water temperatures of 60° C and 80° C,
Figures 11 and 12 show the energy consumed per unit of fresh water production as a
function of exit air temperature for different air to feed water flow ratios over the entire
parameter space considered. Although, details of the low energy consumption regime are
difficult to discern, it is interesting to observe that increasing both the exit temperature
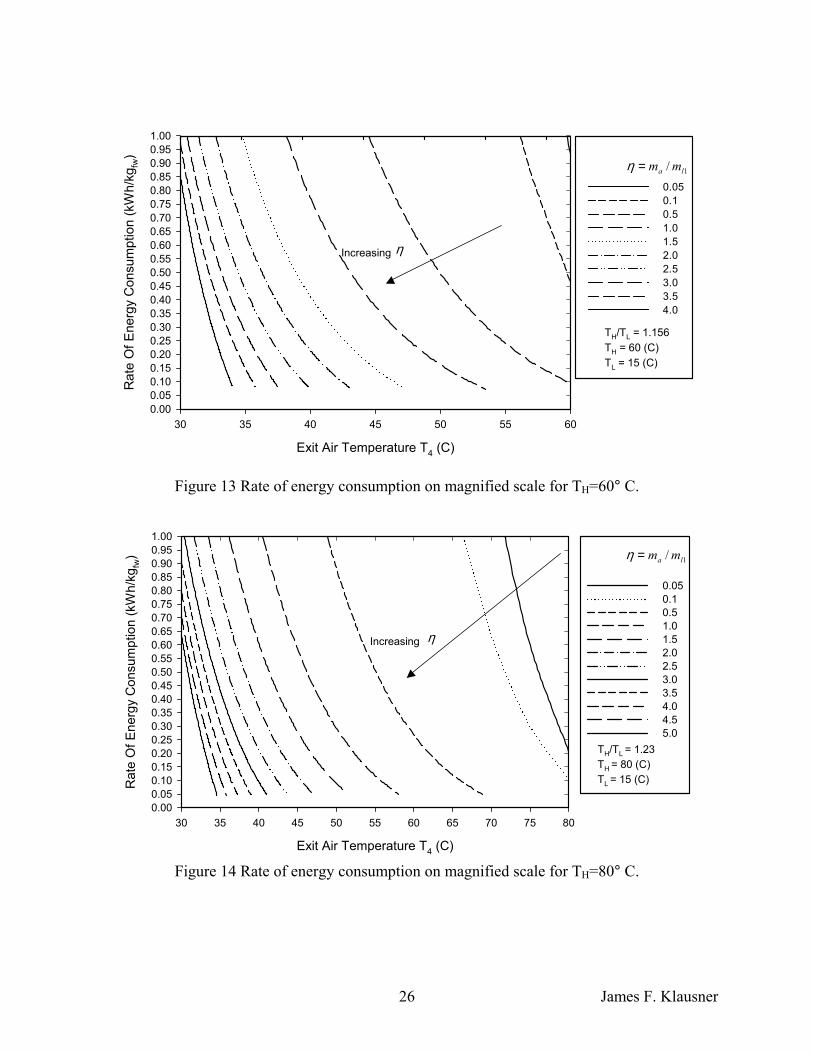
and the air flow results in a reduced rate of energy consumption. In order to explore the
lower energy consumption regime Figures 13 and 14 have been prepared for diffusion
James F. Klausner 11
tower inlet water temperatures of 60° C and 80° C, respectively. For T =60° C the lower
limit on energy consumed per unit of fresh water production is about 0.06 kWh/kg
while that for T =80° C is approximately 0.05 kWh/kg . In this analysis the energy
consumption due to pumping is neglected, and the current results suggest that the energy
consumption is lower with higher air to feed water flow ratios. However, with higher air
flow, the pumping power required will increase as well. Therefore, it is expected that in
actual practice there is some minimum energy consumption associated with a specific air
to feed water flow ratio that is less than the maximum flow. The inclusion of the
pumping power in the overall analysis is the subject of a future investigation.
1
fw
1 fw
It is also of interest to compare the fresh water production and energy
consumption between the cases of T1=60° and 80° C. There is only marginal
improvement in the fresh water production and energy consumption when increasing TH
from 60 to 80 ° C. This demonstrates that the DDD process is best suited for applications
where the waste heat driving the process has low thermodynamic availability, as will be
described in the next section.
4.0 Applications
The energy consumption for the DDD process is comparable to that for flash
distillation and reverse osmosis. The major advantage of the DDD process is that it can
operate at low temperatures so that it requires an energy input with low thermodynamic
availability. This is important because the process can be driven by waste heat that
would otherwise not be suitable for doing useful work or driving some other distillation
process (such as flash distillation). A very interesting application for the DDD process is
James F. Klausner 12
to operate in conjunction with an existing process that produces large amounts of waste
heat and is located in the vicinity of an ocean or sea. One such potential benefactor of the
DDD process is the electric utility industry. Conventional steam driven power plants
dump a considerable amount of energy to the environment via cooling water that is used
to condense low pressure steam within the main condenser. Typically this cooling water
is either discharged back to its original source or it is sent to a cooling tower, where the
thermal energy is discharged to the atmosphere. Instead of dumping the thermal energy
to the environment, the DDD process provides a means for putting the discarded thermal
energy to work to produce fresh water. Of course this application is limited to power
producing facilities sited along the coastline. However, this should not be a significant
limitation. Bullard and Klausner [8] studied the geographical distribution of fossil fired
power plants built in the United States from 1970 to 1984. In their study they found that
the two most significant attributes for siting a new fossil fired plant in a given
geographical region are 1) proximity to a large body of water and 2) proximity to a large
population base. The demographic make-up of the United States as well as other
industrialized nations is such that major population centers reside along the coastline.
Thus, the DDD process appears to be well suited for the power generation infrastructure
in the United States.
As an example, consider that a 100 MW steam driven power plant operating with
2” Hg vacuum in the main condenser would have approximately 140 MW of energy at
93° C available from low pressure condensing steam [9]. If retrofitted with a DDD plant,
there is potential to produce as much as 18 million gallons of fresh water over a 24 hour
period, assuming the DDD process energy consumption to be 0.05 kWh/kgfw. The low
James F. Klausner 13
temperature operation of the DDD process is economically advantageous in that
inexpensive materials may be used to construct a facility. Since the energy required to
drive the DDD process would be free to an electrical utility, it is anticipated that the
capital investment required to fabricate a DDD plant could be readily recovered by
selling fresh water to local industry and municipalities.
Another point worth mentioning is that although there exists some optimum air to
feed water flow ratio that will minimize the energy consumption, this may not be the
most economical operating condition when the DDD process is driven by waste heat.
The reason is that a higher air flow rate requires more pumping power, which must be
supplied to forced draft fans via electricity. Since electricity is a valuable commodity it
may be more economical to operate with a higher exit air temperature and a lower air to
feed water flow ratio (lower electricity consumption) since the thermal energy driving the
DDD process is waste heat that would otherwise be discarded. An economic analysis,
which is not considered here, is required to identify the optimum operating conditions
based on cost considerations.
5.0 Conclusions
An innovative diffusion driven desalination process has been presented that has
the main advantage that it may be driven by waste heat with very low thermodynamic
availability. Good performance of the process is realized with an inlet feed water
temperature as low as 60° C. The desalination process may also be driven without any
heating in applications where there is a temperature gradient between the surface water,
which will be drawn in as feed, and the cooling water found at lower depths. It is
James F. Klausner 14
envisioned that an excellent application is to place a diffusion driven desalination plant
on site at a steam driven electric generating plant, and the waste heat from condensing
low pressure steam may be used to drive the desalination process. The potential for
producing large quantities of inexpensive fresh water greatly favors further exploration of
integrating the DDD process with a steam driven electric generating facility.
References
[1] Seawater Desalination in California, 1999, a report by the California Coastal
Commission.
[2] Bourouni, K., M. Chaibi, M.T., and Tadrist, L., 2001, “Water desalination by
humidification and dehumidification of air: State of the art,” Desalination, Vol. 137,
Issues 1-3, pp. 167-176.
[3] Al-Hallaj, S., Farid, M.M., and Tamimi, A.R., 1998, “Solar desalination with a
humidification-dehumidification cycle: performance of the unit,” Desalination, Vol. 120,
Issue 3, pp. 273-280.
[4] Assouad, Y., and Lavan, Z., 1988, “Solar desalination with latent heat recovery,”
Journal of Solar Energy Engineering, Vol. 110, Issue 1, pp. 14-16.
[5] Larson, R.L., Albers, W., Beckman, J., and Freeman, S., 1989, “The carrier-gas
process – a new desalination and concentration technology, Desalination, Vol. 73, pp.
119-137.
[6] Bharathan, D., Parsons, B.K., and Althof, J.A., 1988, “Direct-Contact Condensers for
Open-Cycle OTEC Applications,” National Renewable Energy Laboratory Report
SERI/TP-252-3108 for DOE Contract No. DE-AC02-83CH10093.
James F. Klausner 15
[7] Bharathan, D., Parent, A., and Hassani, A. V., 1999, “Method and Apparatus for
High-Efficiency Direct Contact Condensation,” U.S. Patent 5,925,291.
[8] Bullard, C.W. and Klausner, J.F., 1987, “Empirical Analysis of Power Plant Siting,”
Energy Systems and Policy, Vol. 11, pp. 103-120.
[9] El-Wakil, M.M., 1984, Power Plant Technology, McGraw-Hill, New York, p. 228.
James F. Klausner 16
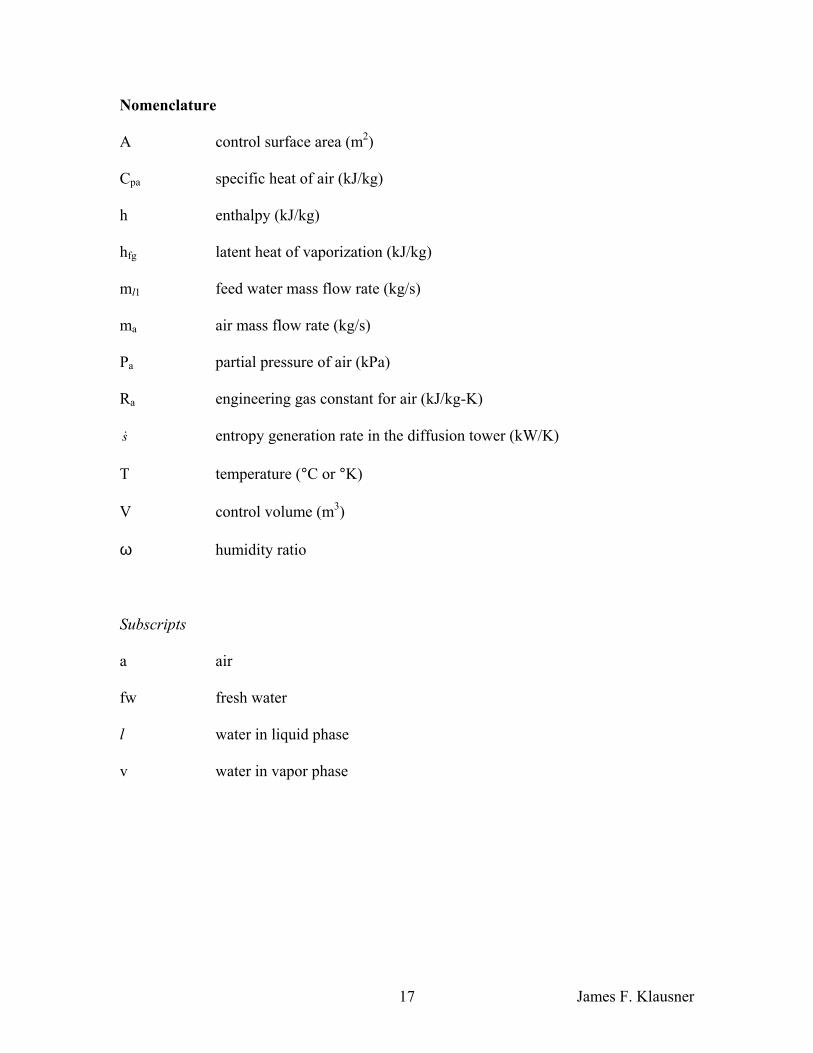
Nomenclature
A control surface area (m2)
Cpa specific heat of air (kJ/kg)
h enthalpy (kJ/kg)
hfg latent heat of vaporization (kJ/kg)
ml1 feed water mass flow rate (kg/s)
ma air mass flow rate (kg/s)
Pa partial pressure of air (kPa)
Ra engineering gas constant for air (kJ/kg-K)
s& entropy generation rate in the diffusion tower (kW/K)
T temperature (°C or °K)
V control volume (m3)
ω humidity ratio
Subscripts
a air
fw fresh water
l water in liquid phase
v water in vapor phase
James F. Klausner 17
List of Figures Figure 1 Flow diagram for diffusion driven desalination process. Figure 2 Rate of entropy generation in the diffusion tower for TH=27° C.
Figure 3 Variation of exit brine temperature with exit air temperature for TH=27° C. Figure 4 Fresh water production efficiency for T =27° C. H Figure 5 Rate of entropy generation in the diffusion tower for TH=60° C. Figure 6 Rate of entropy generation in the diffusion tower for TH=80° C. Figure 7 Variation of exit brine temperature with exit air temperature for TH=60° C. Figure 8 Variation of exit brine temperature with exit air temperature for TH=80° C. Figure 9 Fresh water production efficiency for TH=60° C. Figure 10 Fresh water production efficiency for TH=80° C. Figure 11 Rate of energy consumption for TH=60° C. Figure 12 Rate of energy consumption for TH=80° C. Figure 13 Rate of energy consumption on magnified scale for TH=60° C. Figure 14 Rate of energy consumption on magnified scale for TH=80° C.
James F. Klausner 18
(i) Regenerative Heater
(a) Main Feed Pump
(b) Main Feed Water Heater
(c) Diffusion Tower
(g) Direct Contact Condenser
(e) Brine Pump
(d) Forced Draft Blower
Salt Water
Heat Input•Waste Heat (f) Forced
Draft Blower
(h) Water Chiller
Saturated Air Dry Air
Chiller Pump
Control Valve
1
2
4
3
75
6
4 FreshWater Out
19Figure 1 Flow diagram for diffusion driven desalination process.
James F. Klausner
Exit Brine Temperature T2 (C)
5 10 15 20 25 30
Rat
e O
f Ent
ropy
Gen
erat
ion
(kW
/K)
0.00
0.05
0.10
0.15
0.20
0.25
0.30
Increasing η
0.050.10.51.01.52.02.53.03.5
1/ la mm=η
TH/TL =1.042 TH = 27 (C)TL = 15 (C)
Figure 2 Rate of entropy generation in the diffusion tower for TH=27° C.
Exit Air Temperature T4 (C)
26.0 26.2 26.4 26.6 26.8 27.0
Exit
Brin
e Te
mpe
ratu
re T
2 (C
)
5
10
15
20
25
30
TH/TL =1.042 TH = 27 (C)TL = 15 (C)
1/ la mm=η
0.050.10.51.01.52.02.53.03.5
Increasung η
Figure 3 Variation of exit brine temperature with exit air temperature for TH=27° C.
James F. Klausner 20
Exit Air Temperature T4 (C)
26.0 26.2 26.4 26.6 26.8 27.0
Fres
h W
ater
To
Feed
Wat
er R
atio
(mfw
/ml 1)
0.00
0.01
0.02
0.03
0.04
0.050.10.51.01.52.02.53.03.5
1/ la mm=η
TH/TL =1.042 TH = 27 (C)TL = 15 (C)
ηIncreasing
Figure 4 Fresh water production efficiency for TH=27° C.
James F. Klausner 21
Exit Brine Temperature Tl2 (C)
0 10 20 30 40 50 60
Rat
e O
f Ent
ropy
Gen
erat
ion
(kW
/K)
0.0
0.2
0.4
0.6
0.8
1.0
1.2
TH/TL = 1.156TH = 60 (C)TL = 15 (C)
0.050.10.51.01.52.02.53.03.54.0
1/ la mm=ηηIncreasing
Figure 5 Rate of entropy generation in the diffusion tower for TH=60° C.
Exit Brine Temperature Tl2 (C)
0 10 20 30 40 50 60 70 80
Rat
e O
f Ent
ropy
Gen
erat
ion
(kW
/K)
0.0
0.2
0.4
0.6
0.8
1.0
1.2
1.4
1.6
1.8
0.050.10.51.01.52.02.53.03.54.04.55.0
TH/TL = 1.23TH = 80 (C)TL = 15 (C)
Increasing
1/ la mm=η
η
Figure 6 Rate of entropy generation in the diffusion tower for TH=80° C.
James F. Klausner 22
Exit Air Temperature T4 (C)
30 35 40 45 50 55 60
Exit
Brin
e Te
mpe
ratu
re T2 (
C)
0
10
20
30
40
50
60
0.050.10.51.01.52.02.53.03.54.0
1/ la mm=η
Increasing η
TH/TL = 1.156TH = 60 (C)TL = 15 (C)
Figure 7 Variation of exit brine temperature with exit air temperature for T =60° C. H
Exit Air Temperature T4 (C)
30 35 40 45 50 55 60 65 70 75 80
Exit
Brin
e Te
mpe
ratu
re T
2 (C
)
0
10
20
30
40
50
60
70
80
0.050.10.51.01.52.02.53.03.54.04.55.0
η
TH/TL = 1.23TH = 80 (C)TL = 15 (C)
1/ la mm=η
Increasing
Figure 8 Variation of exit brine temperature with exit air temperature for TH=80° C.
James F. Klausner 23
Exit Air Temperature T4 (C)
30 35 40 45 50 55 60
Fres
h W
ater
To
Feed
Wat
er R
atio
(mfw
/ml 1)
0.00
0.02
0.04
0.06
0.08
0.10
0.050.10.51.01.52.02.53.03.54.0
TH/TL = 1.156TH = 60 (C)TL = 15 (C)
1/ la mm=η
Increasing η
Figure 9 Fresh water production efficiency for TH=60° C.
Exit Air Temperature T4 (C)
30 35 40 45 50 55 60 65 70 75 80
Fres
h W
ater
To
Feed
Wat
er R
atio
(mfw
/ml 1)
0.00
0.02
0.04
0.06
0.08
0.10
0.12
0.050.10.51.01.52.02.53.03.54.04.55.0
ηIncreasing
TH/TL = 1.23TH = 80 (C)TL = 15 (C)
1/ la mm=η
Figure 10 Fresh water production efficiency for TH=80° C.
James F. Klausner 24
Exit Air Temperature T4 (C)
30 35 40 45 50 55 60
Rat
e O
f Ene
rgy
Con
sum
ptio
n (k
Wh/
kgfw
)
0
1
2
3
4
5
0.050.10.51.01.52.02.53.03.54.0
1/ la mm=η
ηIncreasing
TH/TL = 1.156TH = 60 (C)TL = 15 (C)
Figure 11 Rate of energy consumption for TH=60° C.
Exit Air Temperature T4 (C)
30 35 40 45 50 55 60 65 70 75 80
Rat
e O
f Ene
rgy
Con
sum
ptio
n (k
Wh/
kgfw
)
0
1
2
3
4
5
0.050.10.51.01.52.02.53.03.54.04.55.0
1/ la mm=η
TH/TL = 1.23TH = 80 (C)TL = 15 (C)
Increasing η
Figure 12 Rate of energy consumption for TH=80° C.
James F. Klausner 25
Exit Air Temperature T4 (C)
30 35 40 45 50 55 60
Rat
e O
f Ene
rgy
Con
sum
ptio
n (k
Wh/
kgfw
)
0.000.050.100.150.200.250.300.350.400.450.500.550.600.650.700.750.800.850.900.951.00
0.050.10.51.01.52.02.53.03.54.0
1/ la mm=η
ηIncreasing
TH/TL = 1.156TH = 60 (C)TL = 15 (C)
Figure 13 Rate of energy consumption on magnified scale for TH=60° C.
Exit Air Temperature T4 (C)
30 35 40 45 50 55 60 65 70 75 80
Rat
e O
f Ene
rgy
Con
sum
ptio
n (k
Wh/
kgfw
)
0.000.050.100.150.200.250.300.350.400.450.500.550.600.650.700.750.800.850.900.951.00
0.050.10.51.01.52.02.53.03.54.04.55.0
1/ la mm=η
TH/TL = 1.23TH = 80 (C)TL = 15 (C)
Increasing η
Figure 14 Rate of energy consumption on magnified scale for TH=80° C.
James F. Klausner 26