Embed Size (px)
Citation preview
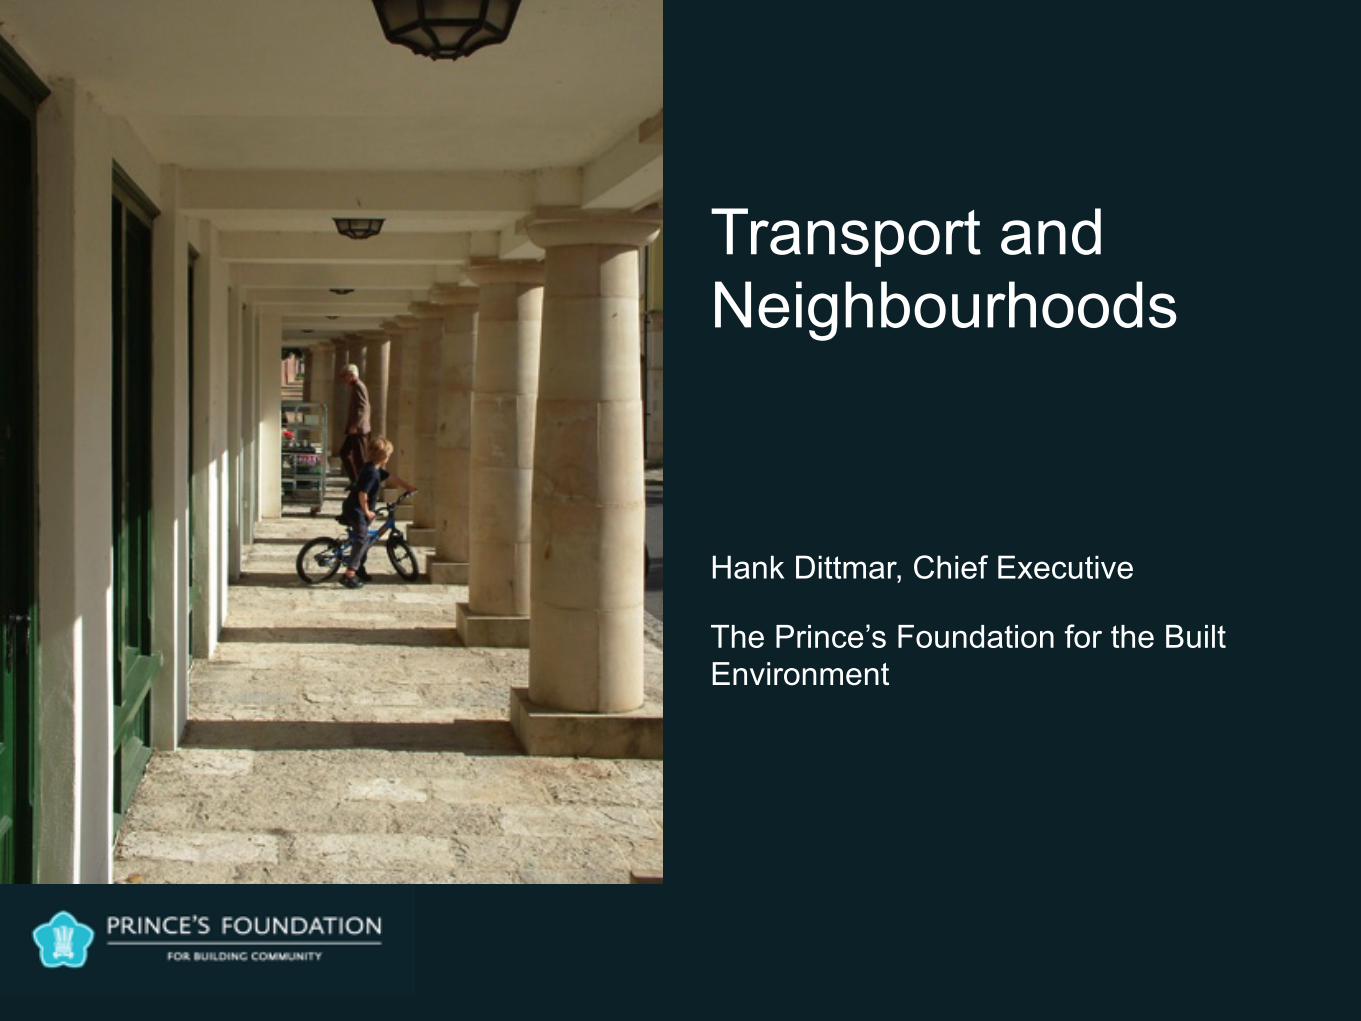
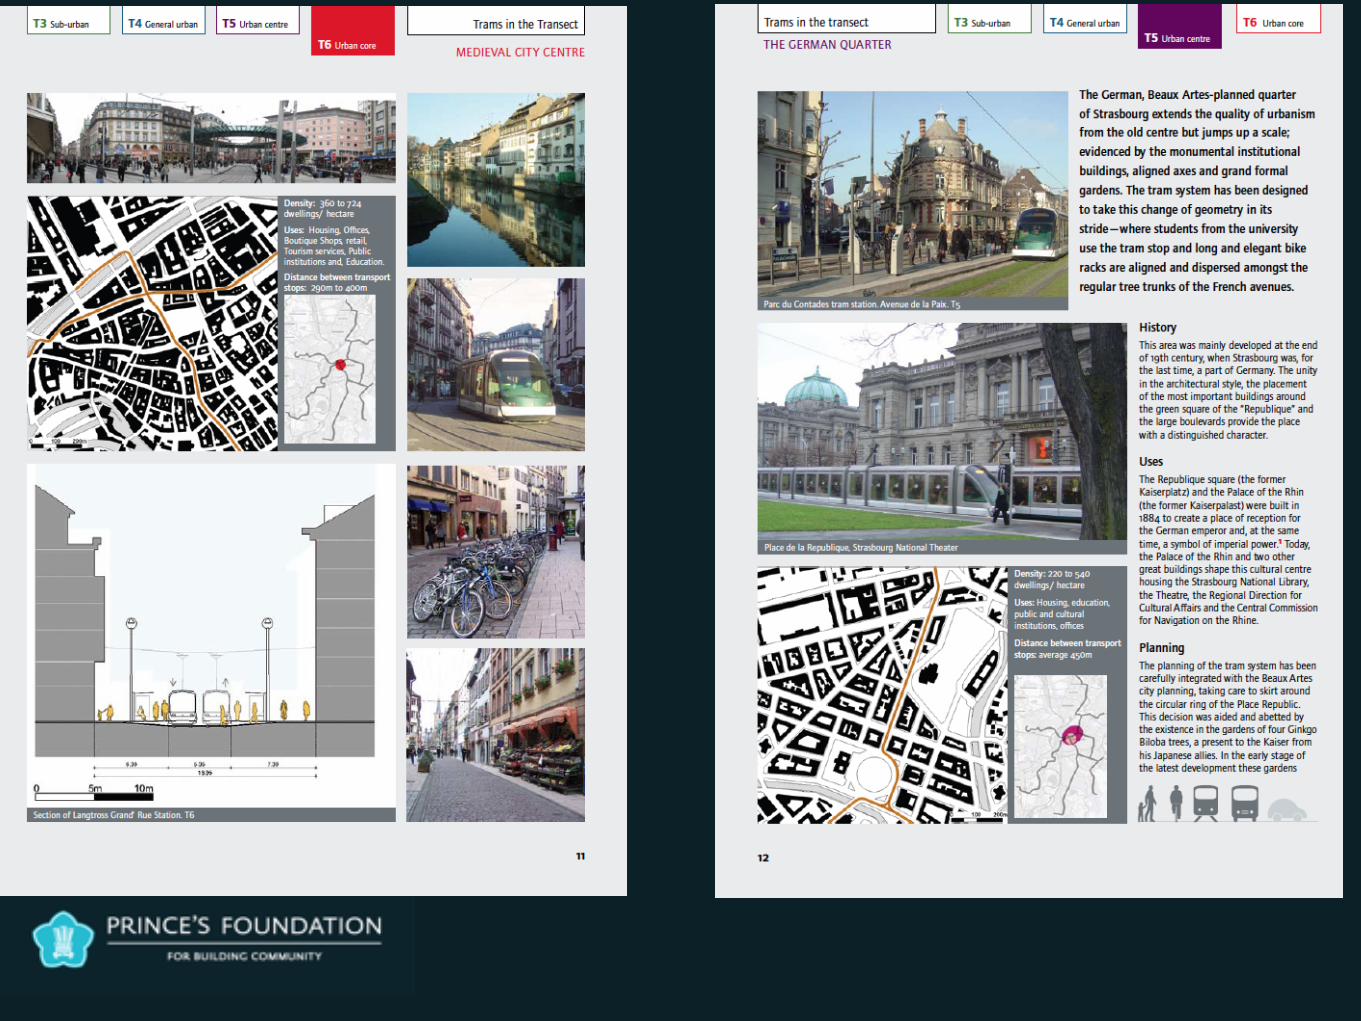
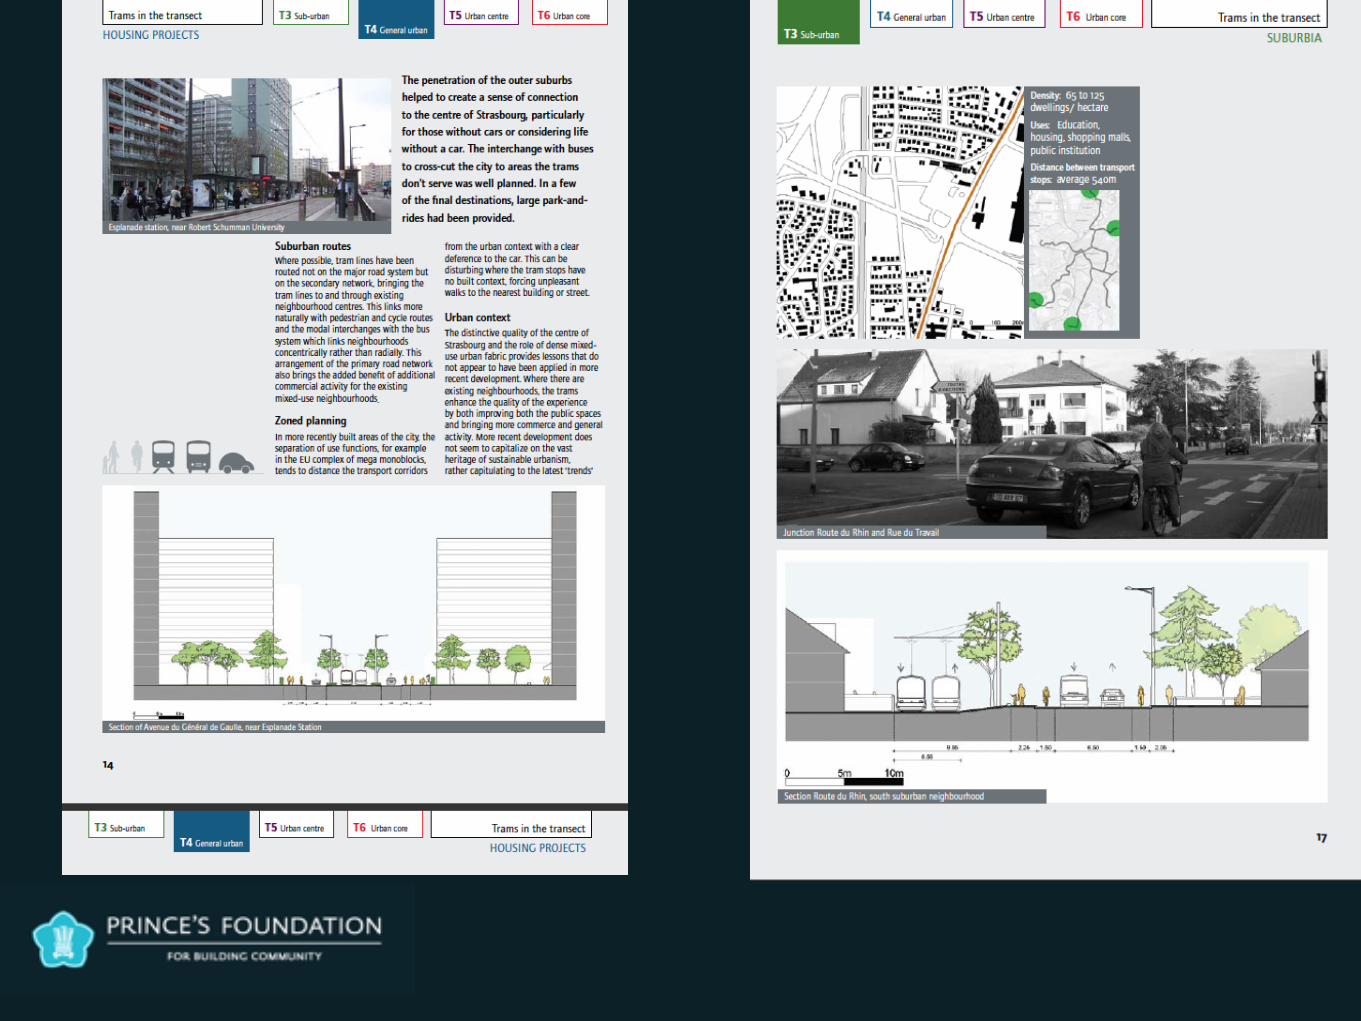
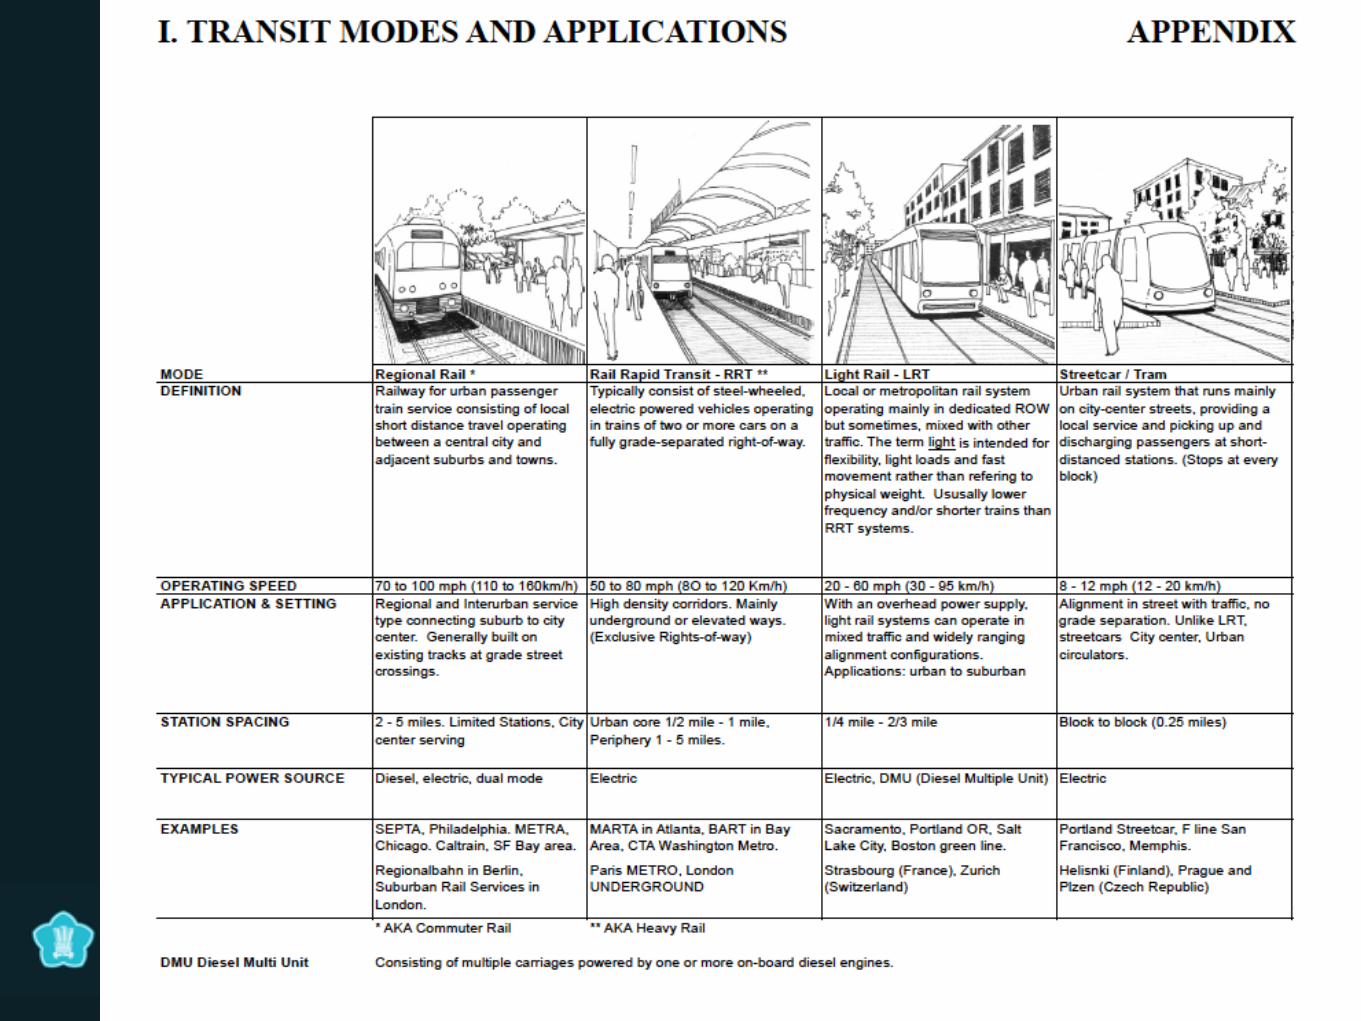
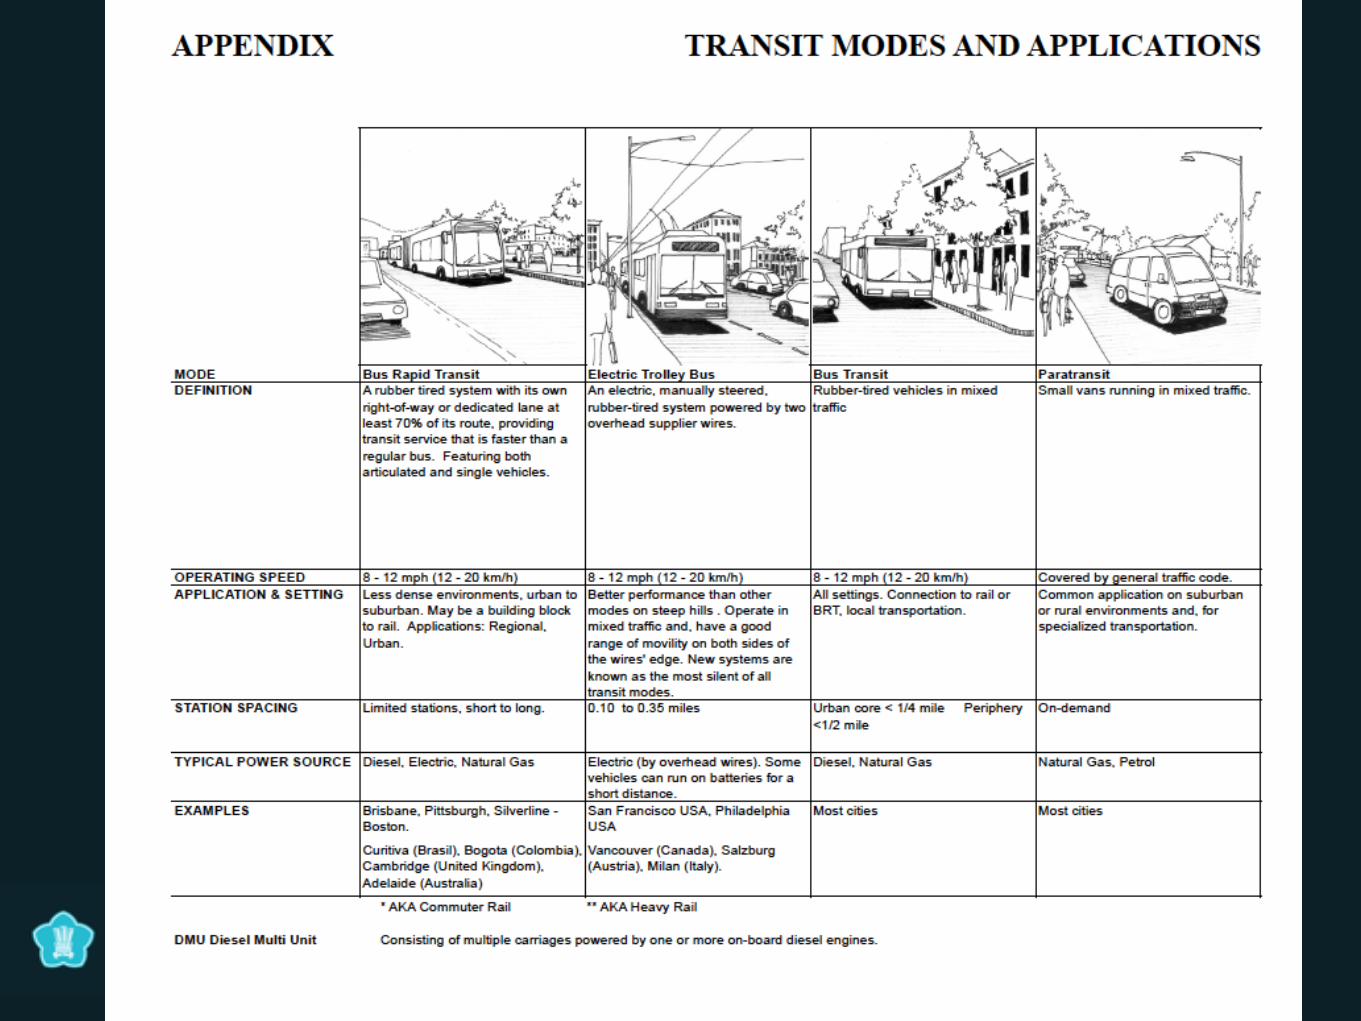
Transport and Neighbourhoods
Hank Dittmar, Chief Executive
The Prince’s Foundation for the Built Environment
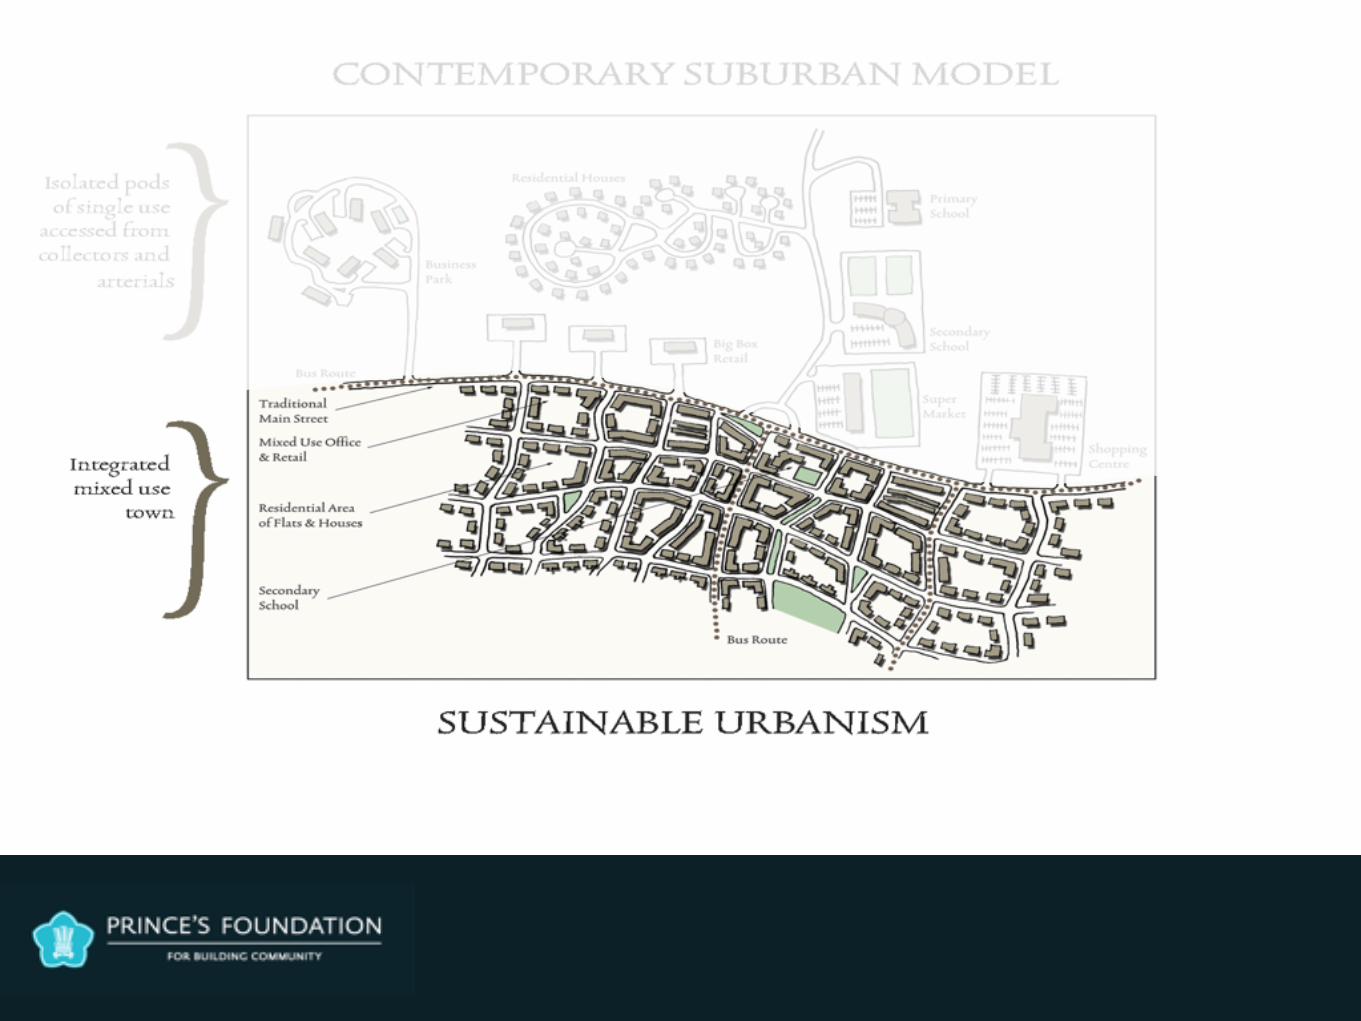
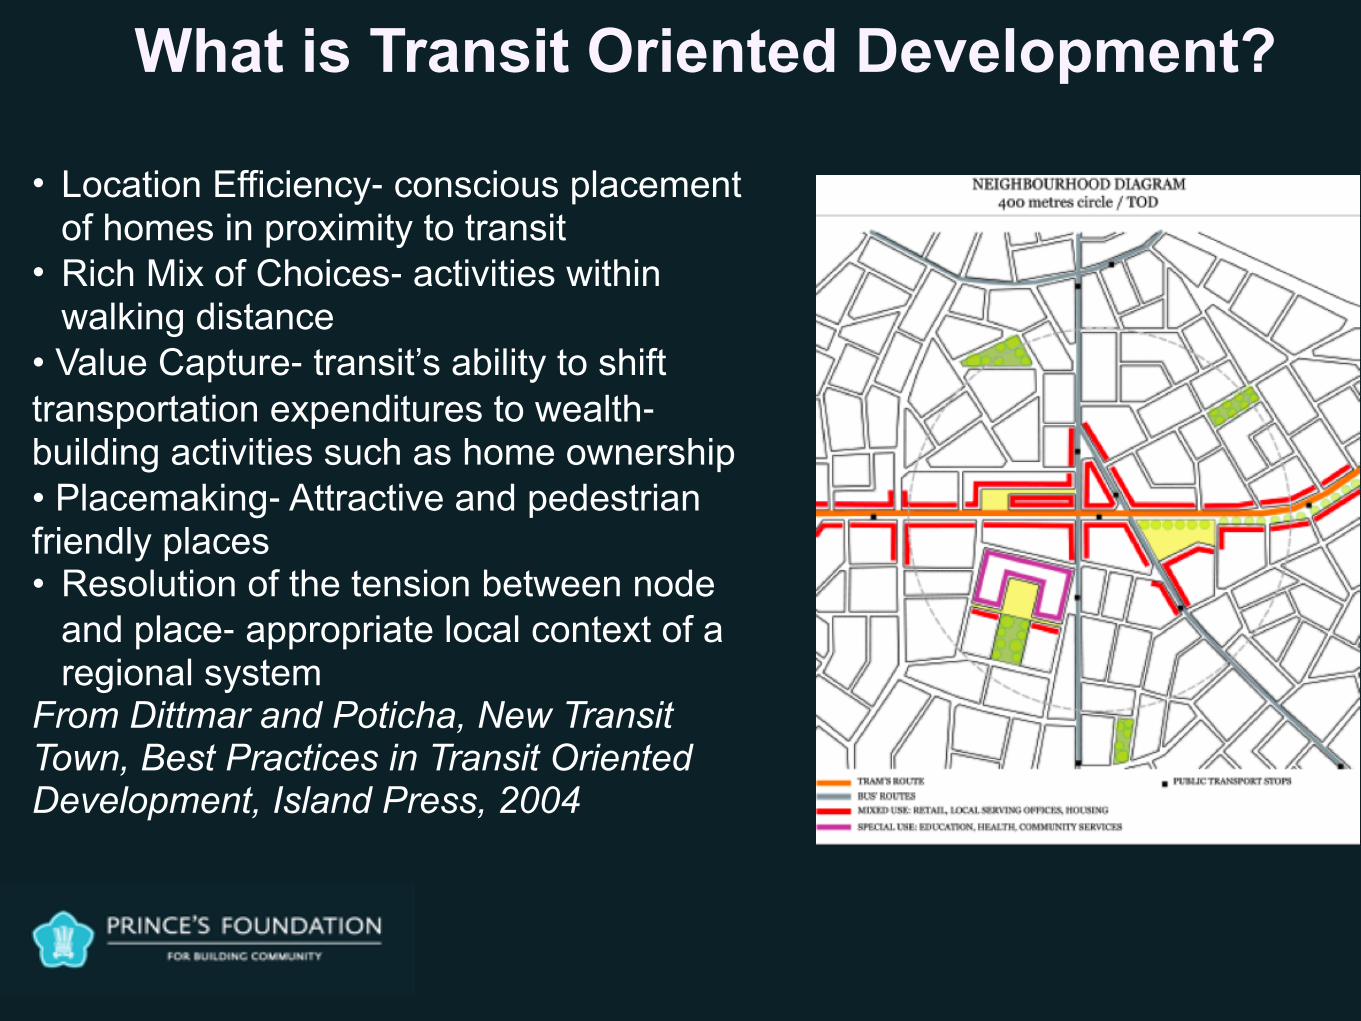
What is Transit Oriented Development?
• Location Efficiency‐ conscious placement of homes in proximity to transit
• Rich Mix of Choices‐ activities within walking distance
• Value Capture‐ transit’s ability to shift transportation expenditures to wealth‐building activities such as home ownership • Placemaking‐ Attractive and pedestrian friendly places • Resolution of the tension between node
and place‐ appropriate local context of a regional system
From Dittmar and Poticha, New Transit Town, Best Practices in Transit Oriented Development, Island Press, 2004
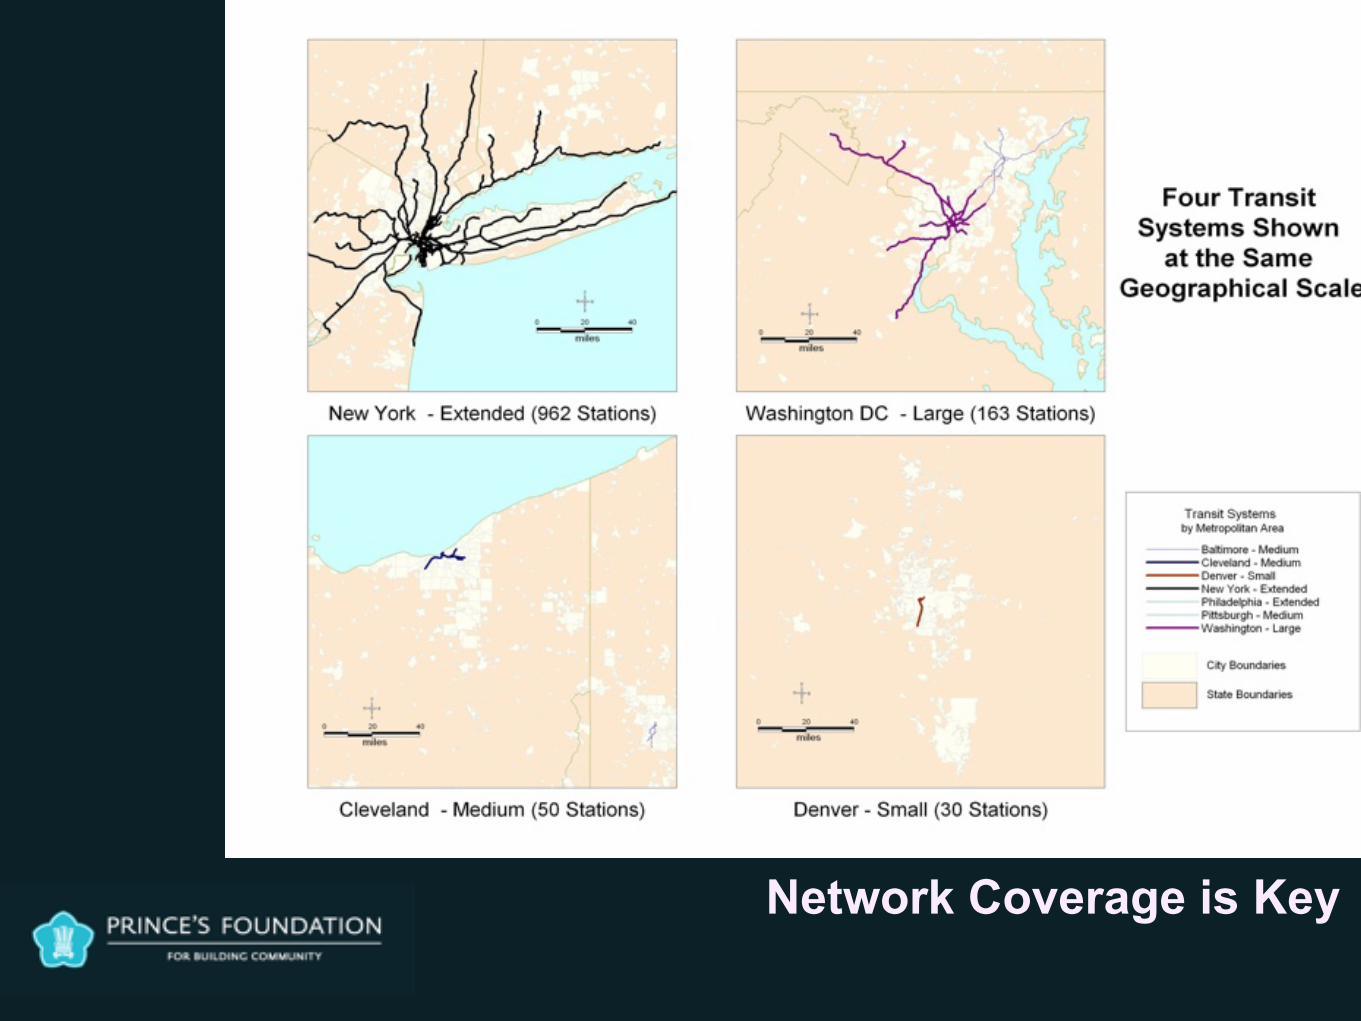
Network Coverage is Key
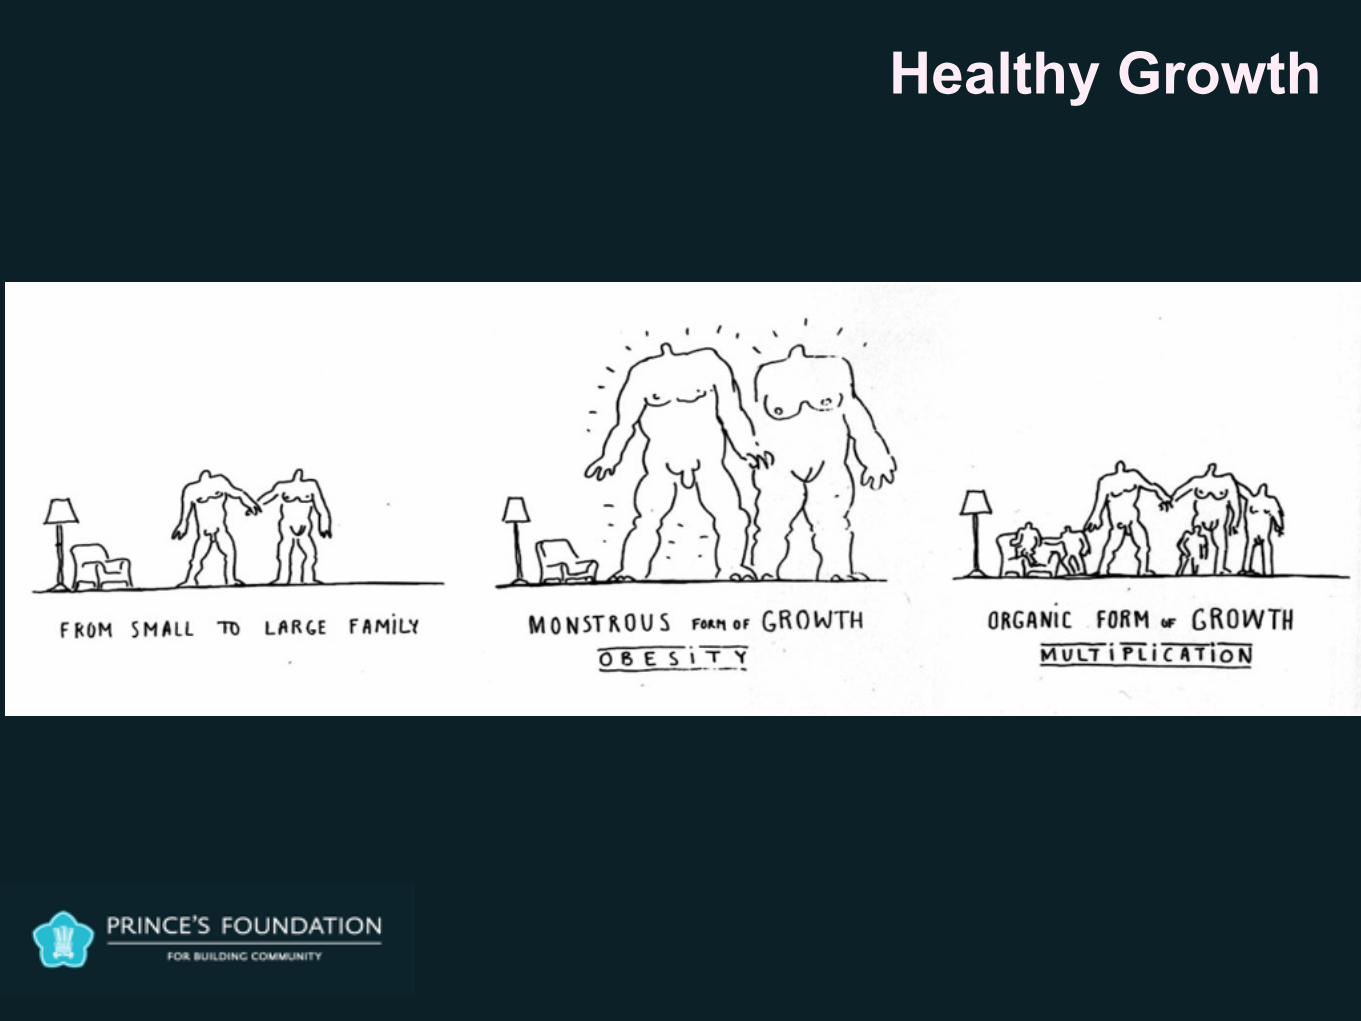
Healthy Growth
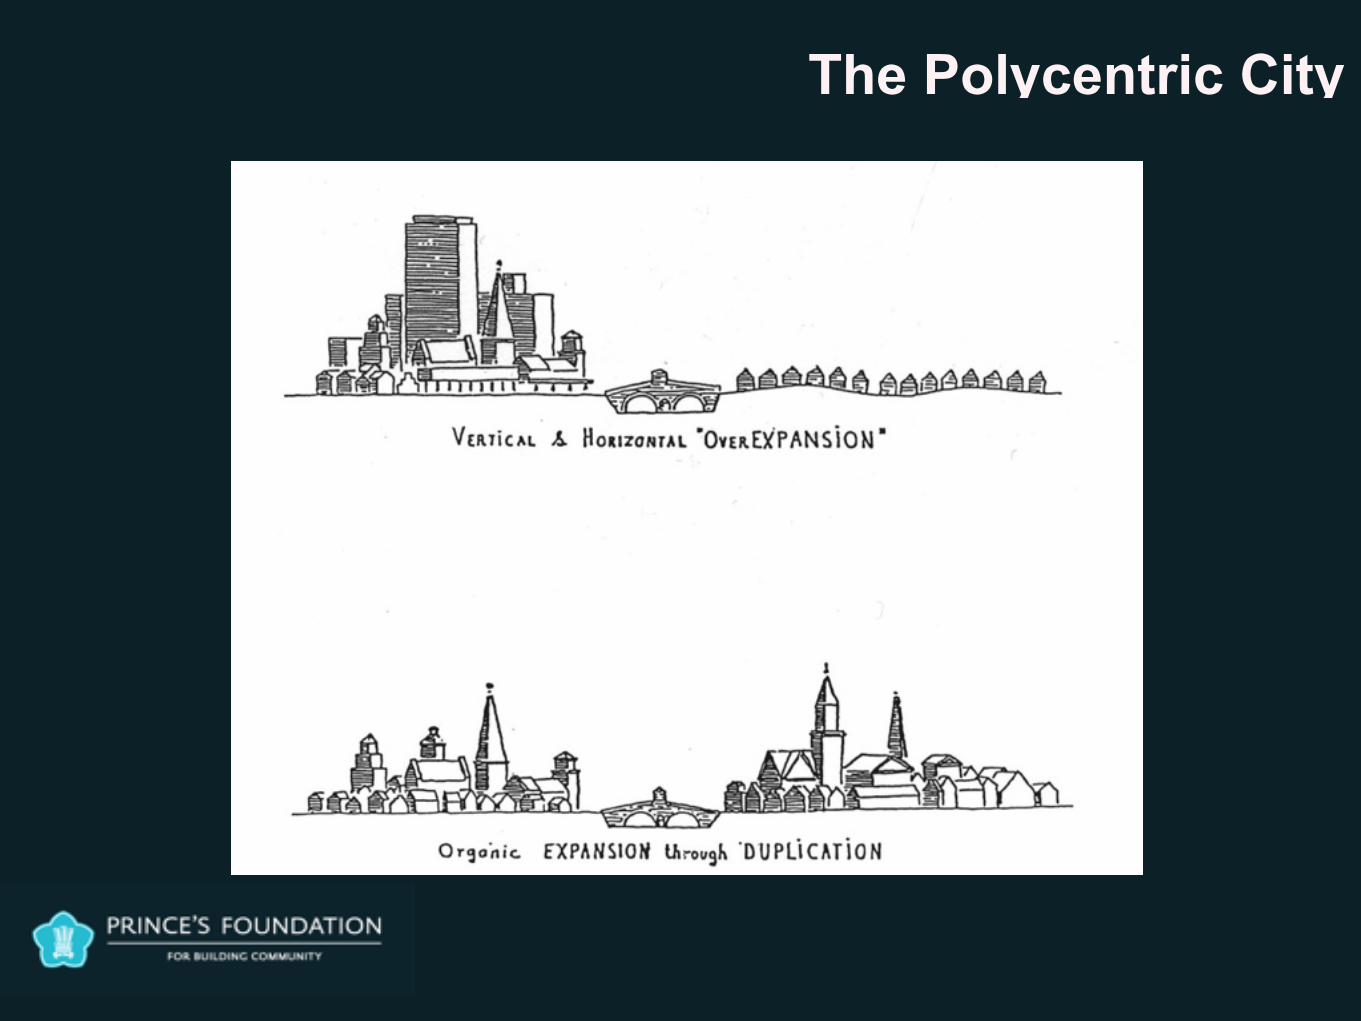
The Polycentric City
Location Efficiency
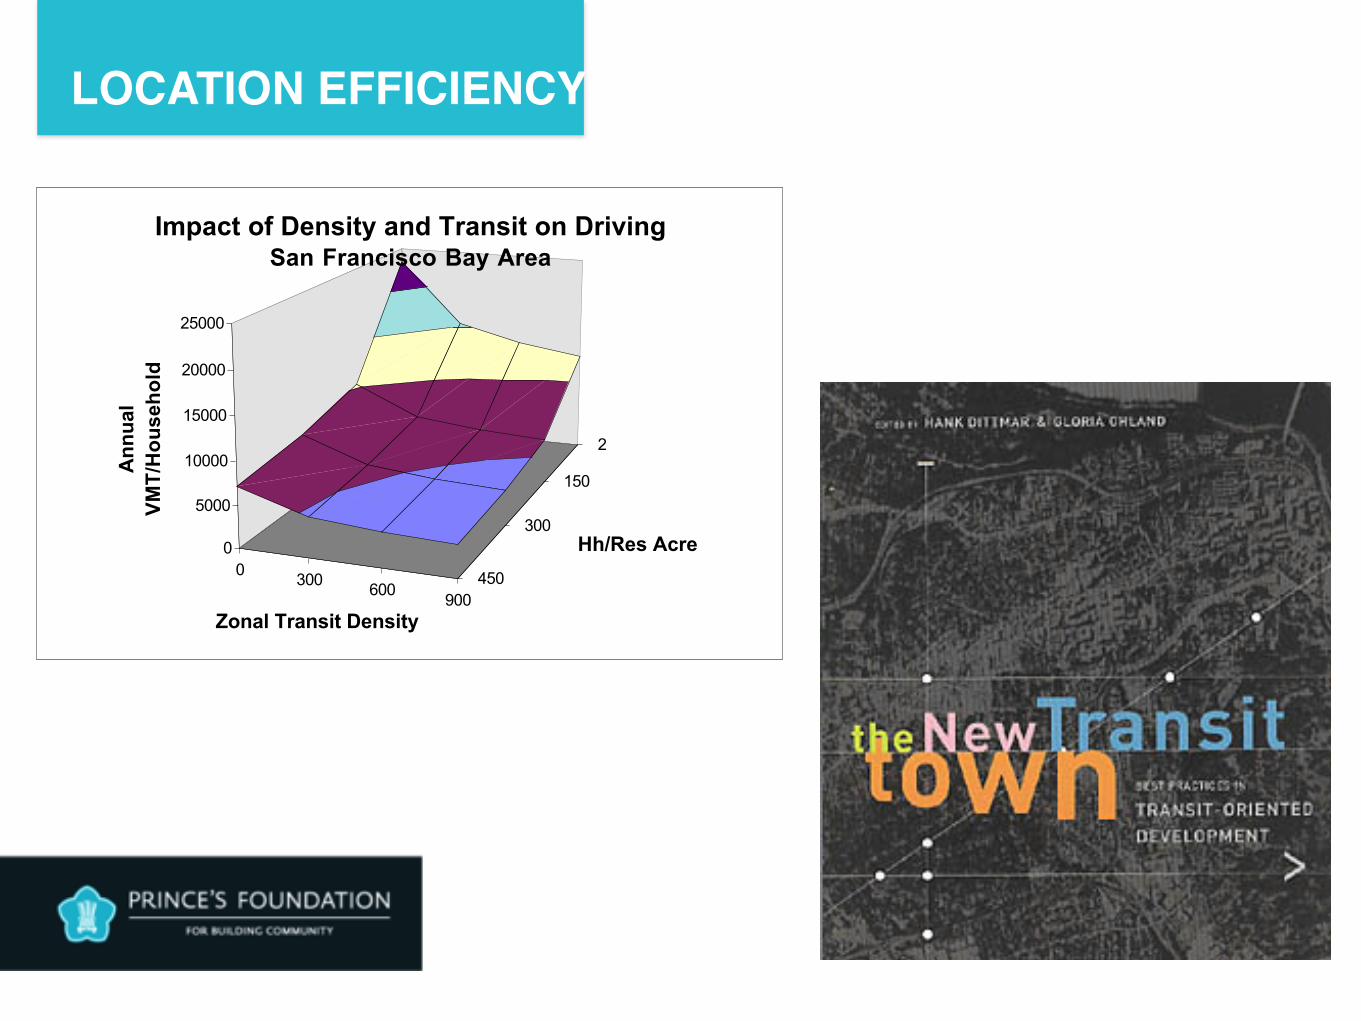
LOCATION EFFICIENCY
0 300 600 900450
300
150
2
0
5000
10000
15000
20000
25000
Ann
ual
VMT/
Hou
seho
ld
Zonal Transit Density
Hh/Res Acre
Impact of Density and Transit on DrivingSan Francisco Bay Area
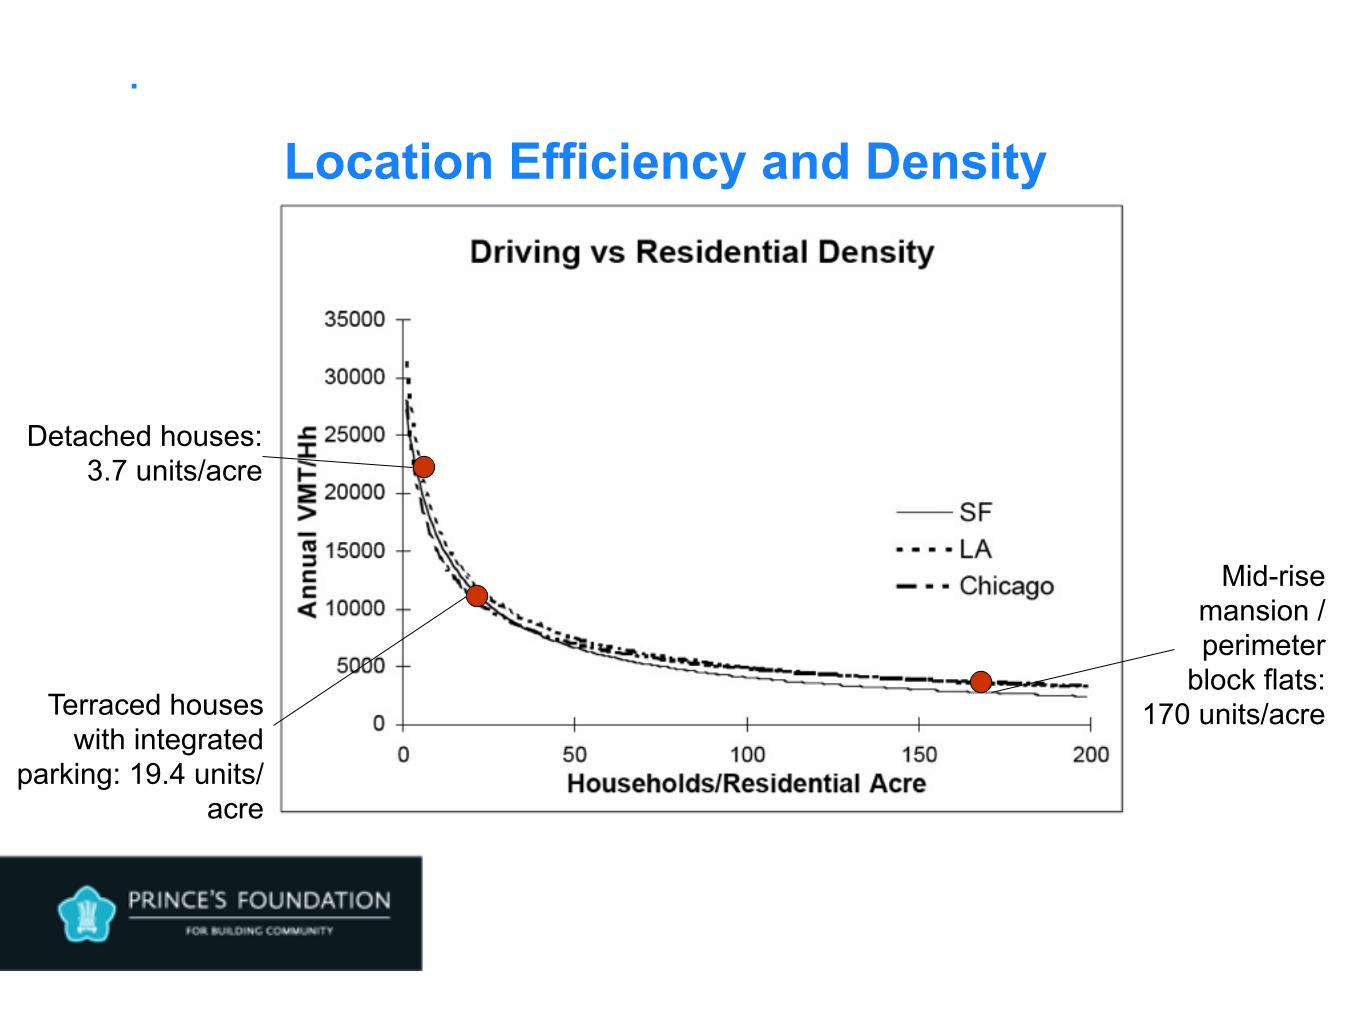
Detached houses: 3.7 units/acre
Terraced houses with integrated
parking: 19.4 units/acre
Mid-rise mansion / perimeter
block flats: 170 units/acre
Location Efficiency and Density
.
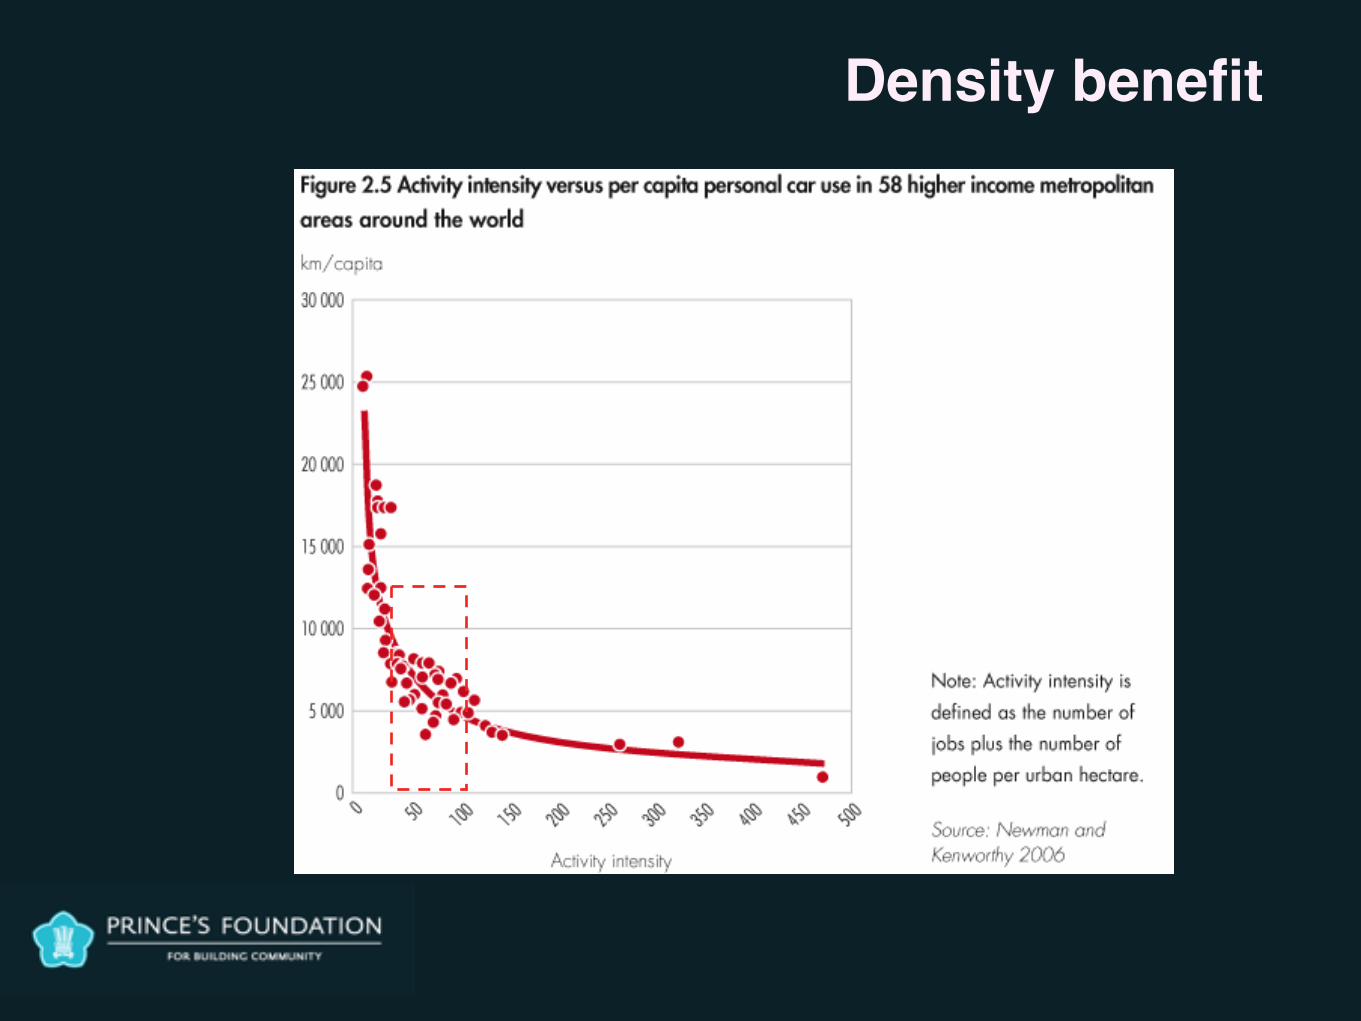
Density benefit
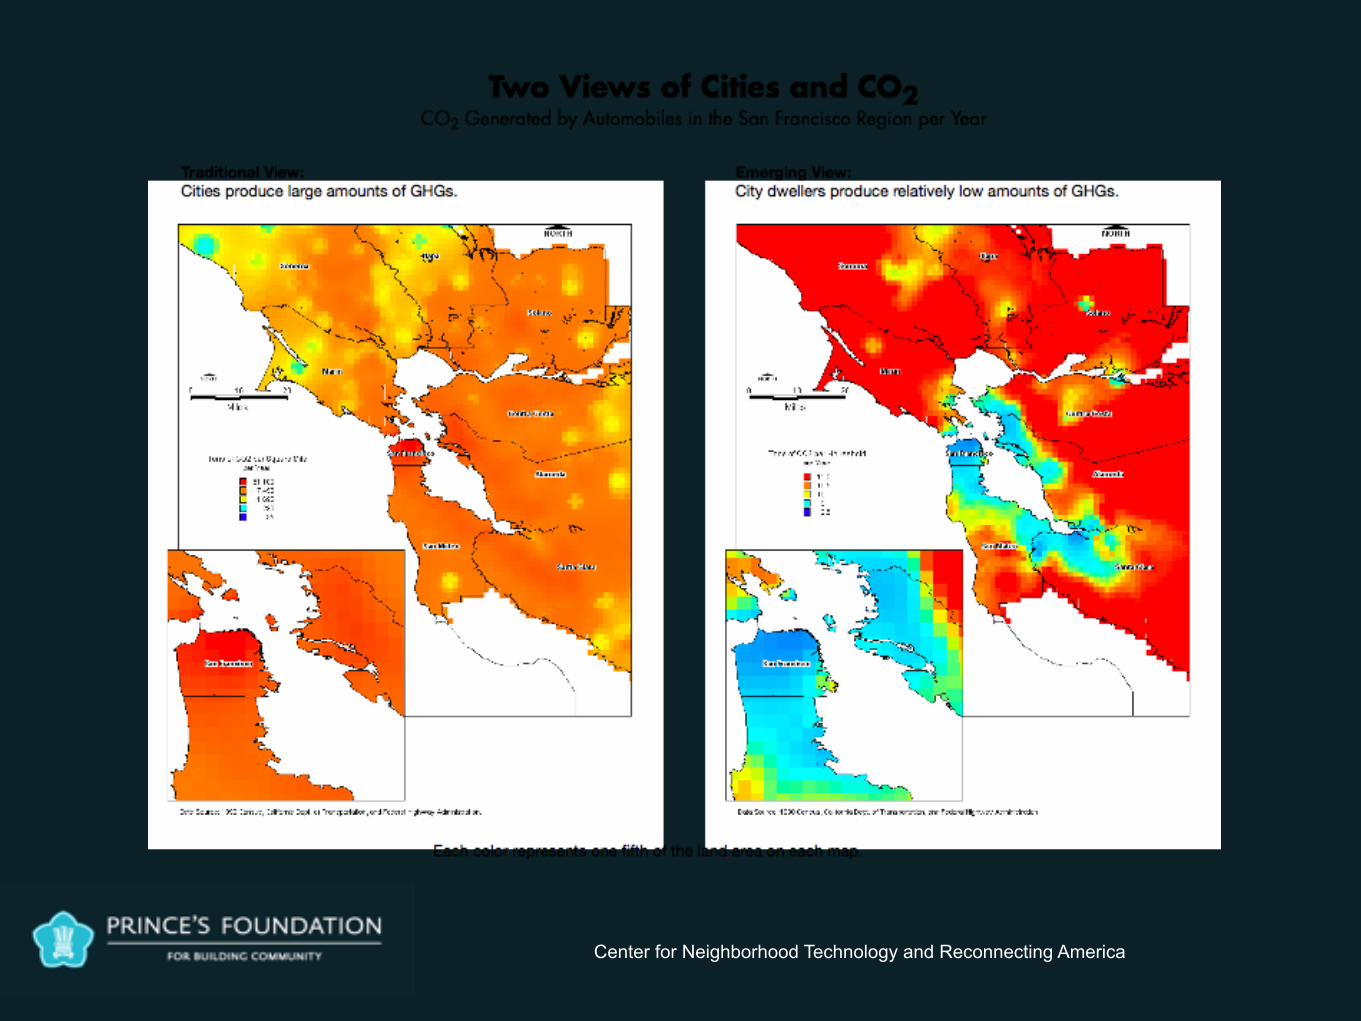
Center for Neighborhood Technology and Reconnecting America
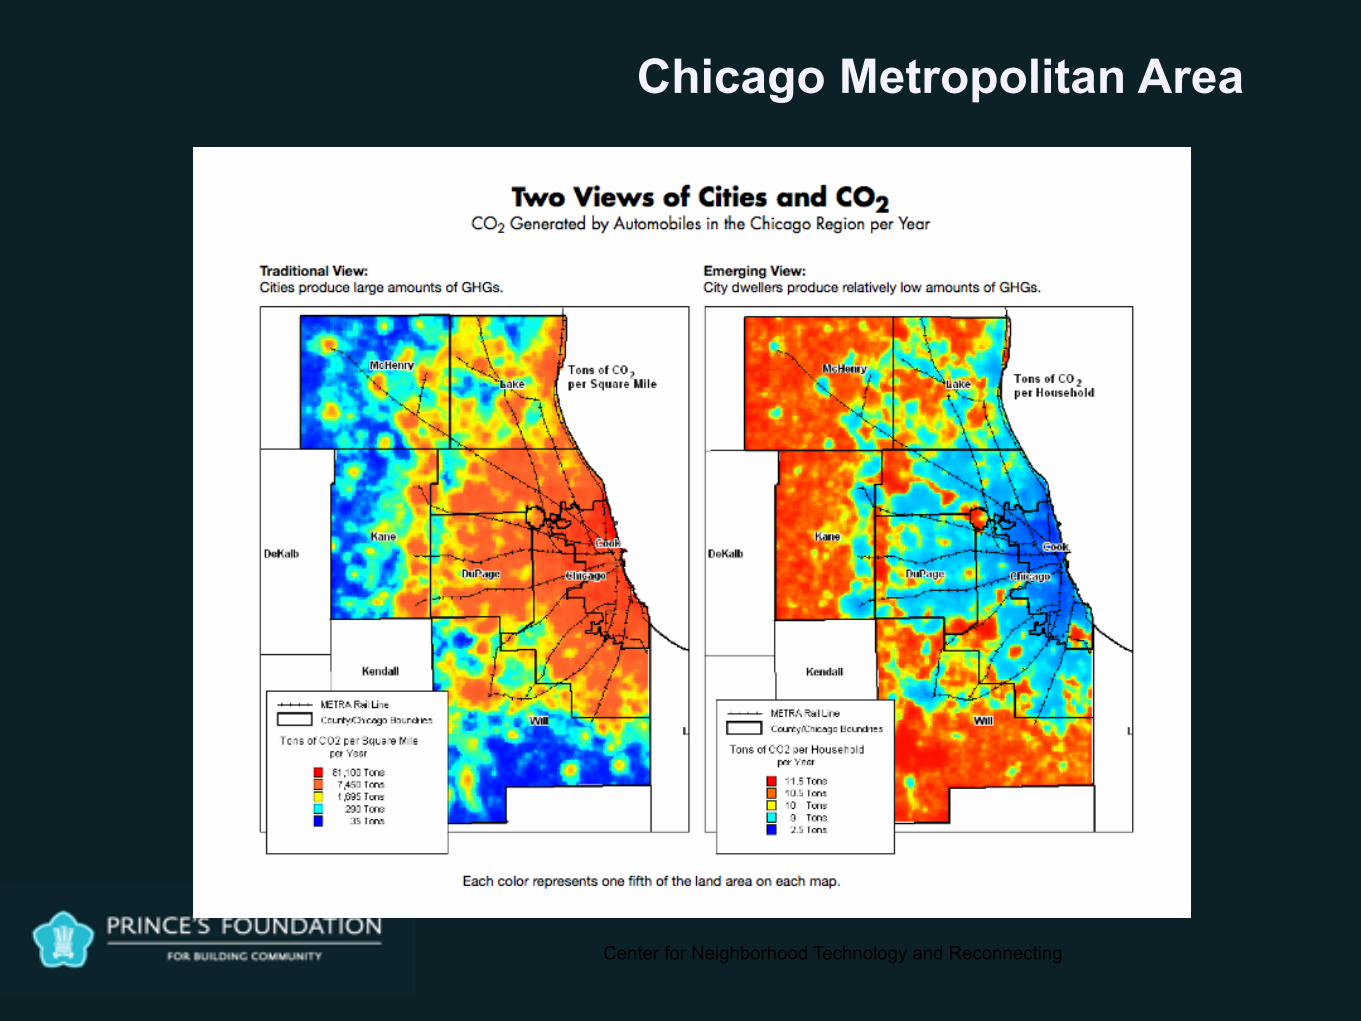
Chicago Metropolitan Area
Center for Neighborhood Technology and Reconnecting
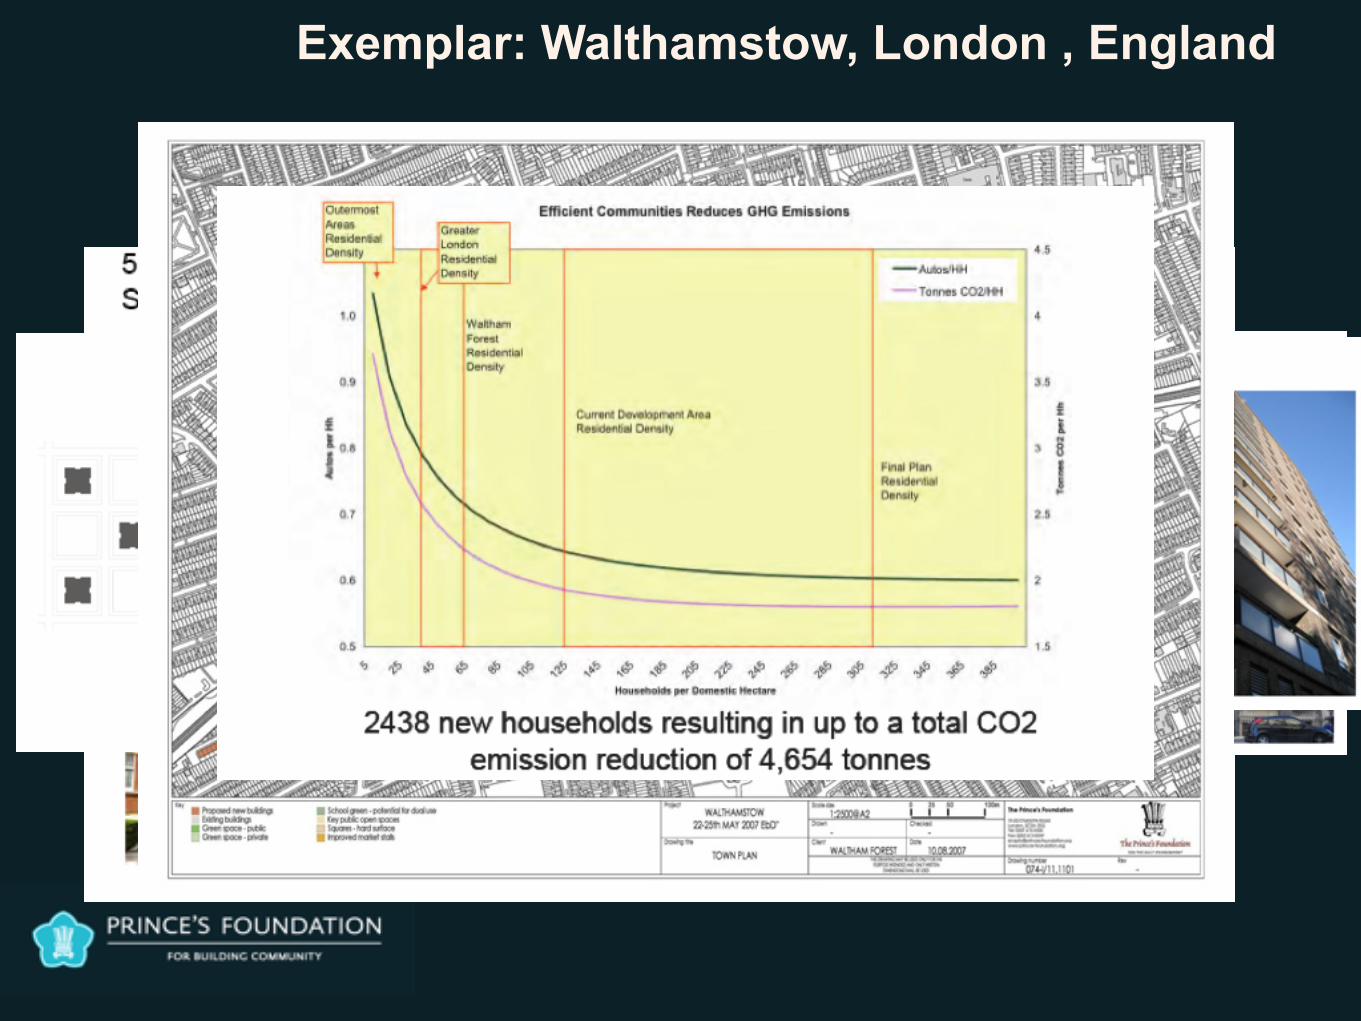
Exemplar: Walthamstow, London , England
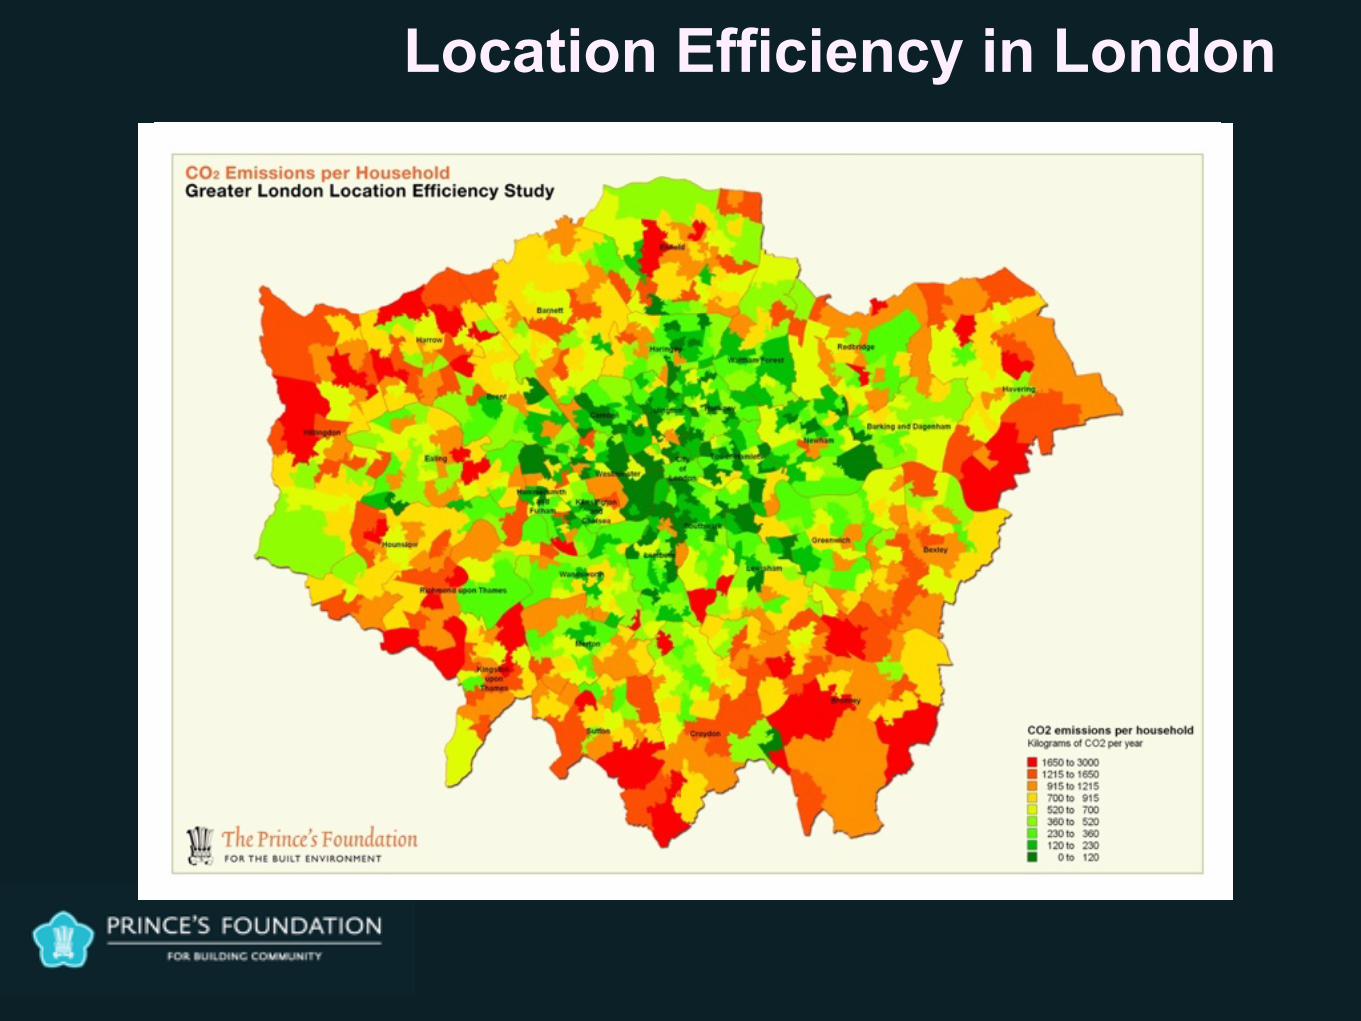
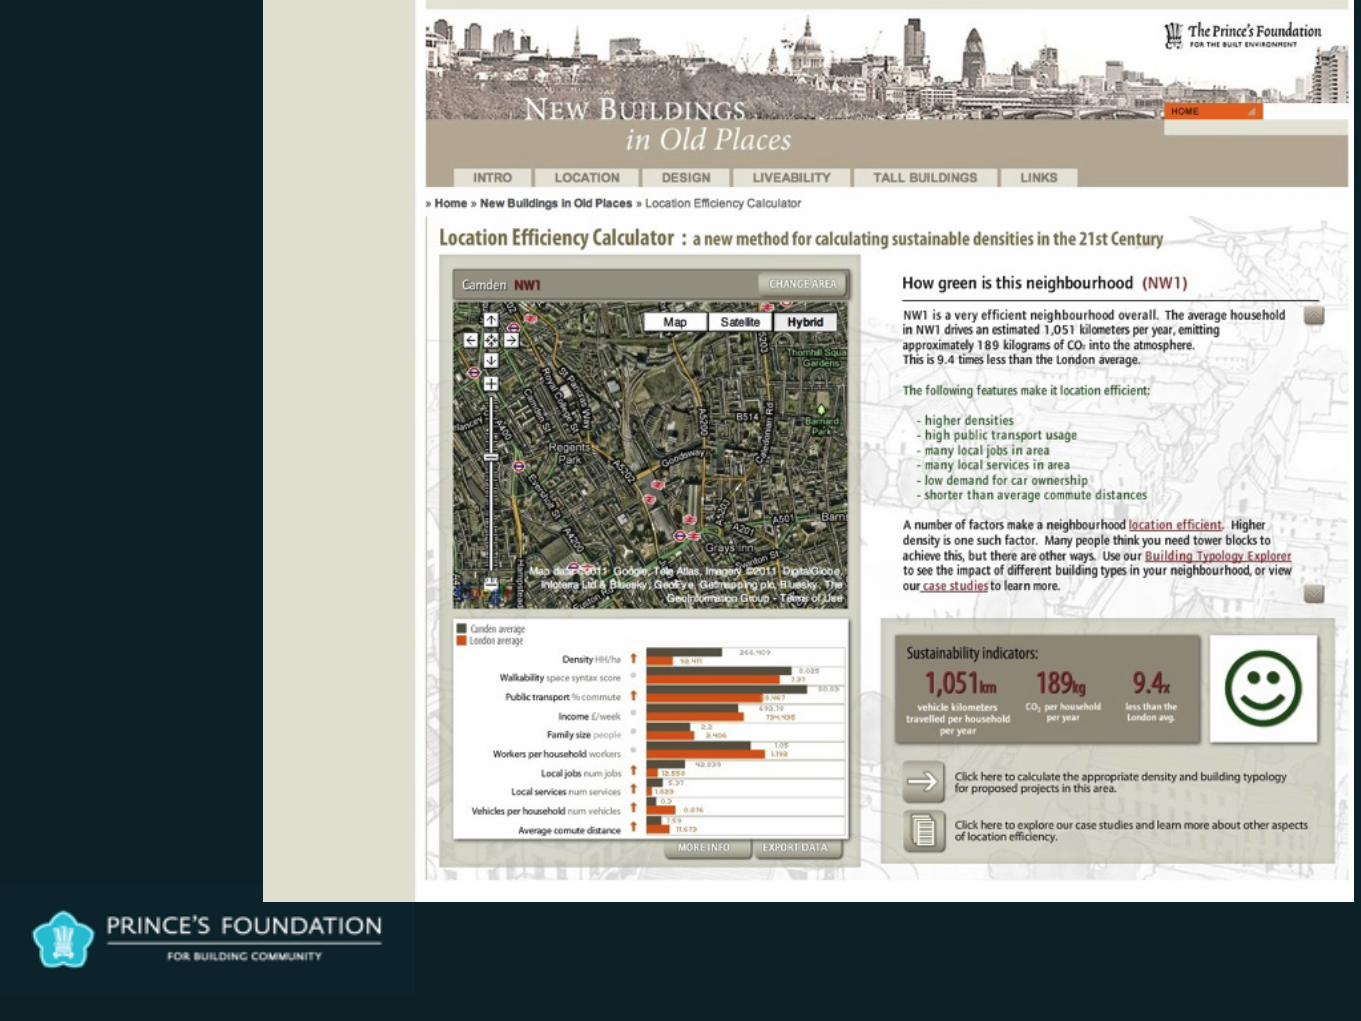
Location Efficiency in London
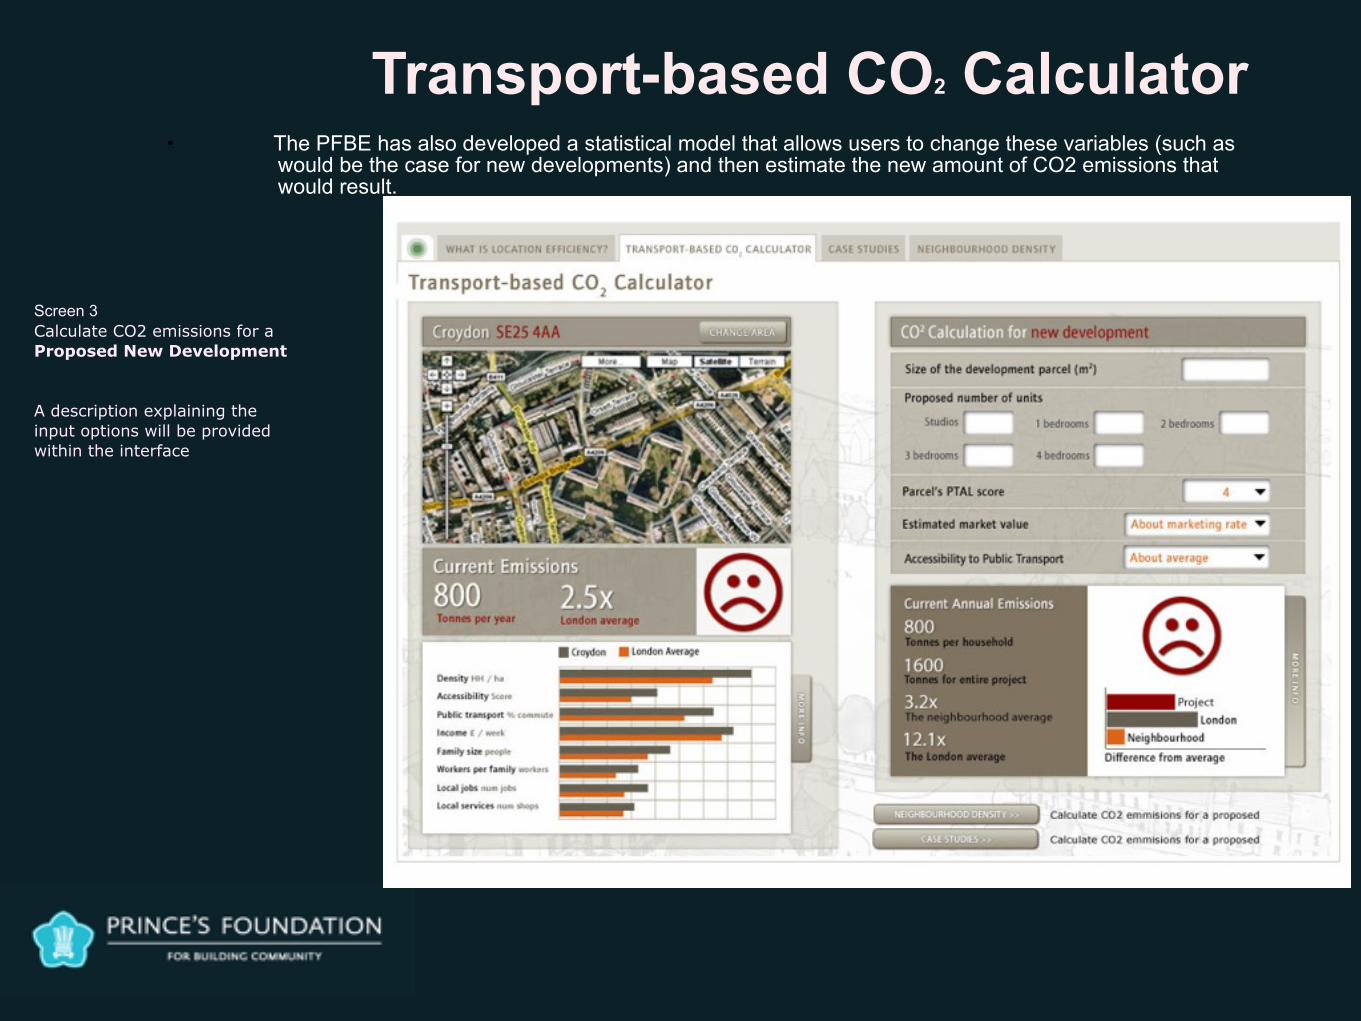
Transport-based CO2 Calculator• The PFBE has also developed a statistical model that allows users to change these variables (such as
would be the case for new developments) and then estimate the new amount of CO2 emissions that would result.
Screen 3 Calculate CO2 emissions for a Proposed New Development A description explaining the input options will be provided within the interface
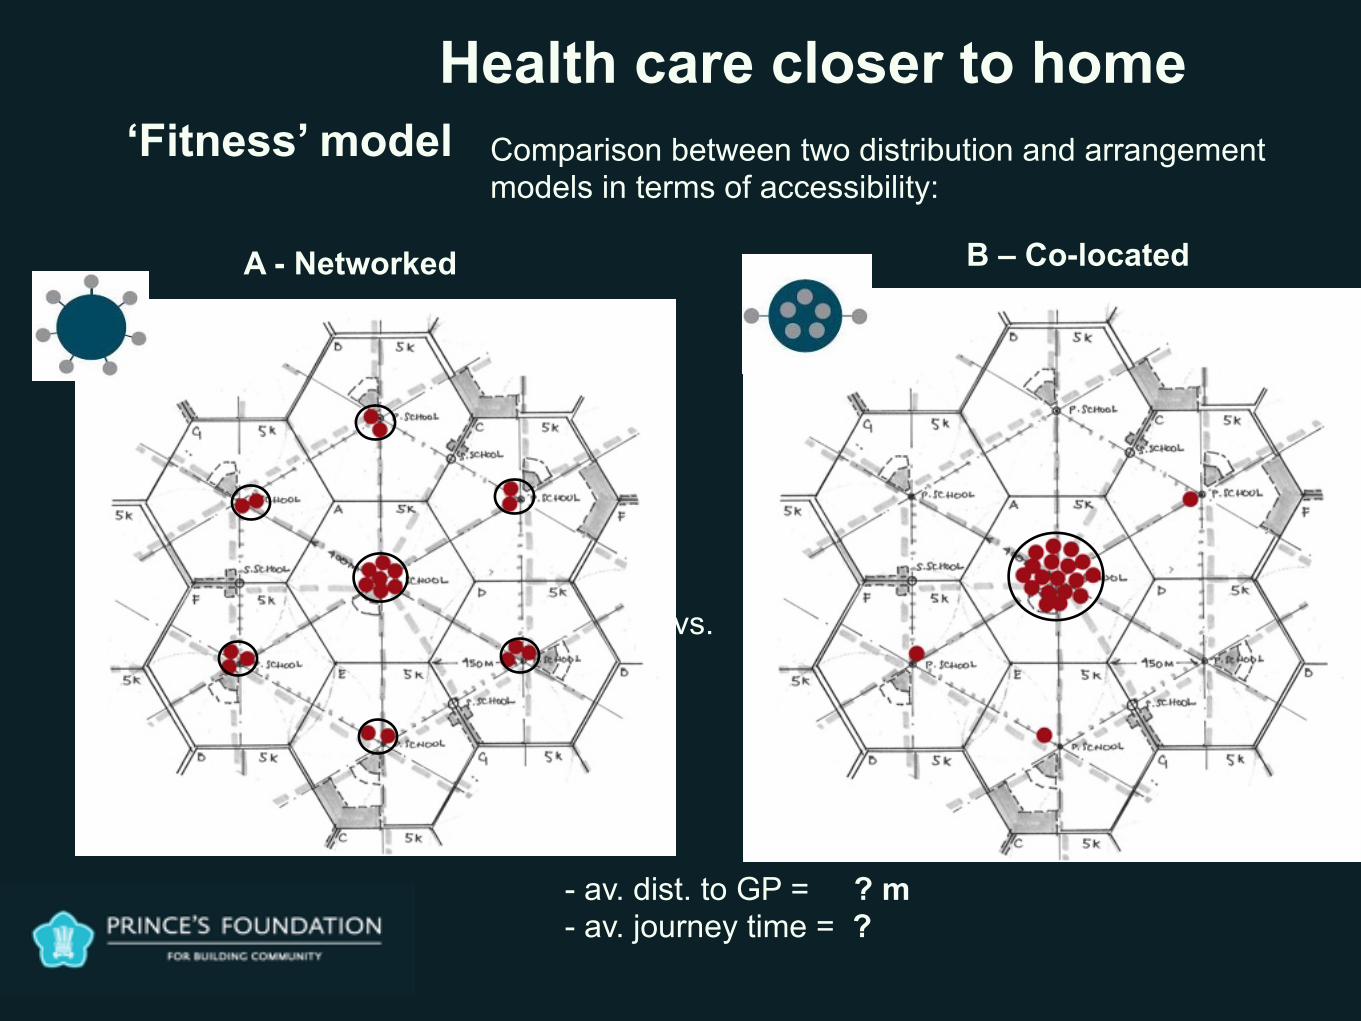
‘Fitness’ modelHealth care closer to home
A - Networked B – Co-located
vs.
Comparison between two distribution and arrangement models in terms of accessibility:
- av. dist. to GP = ? m - av. journey time = ?
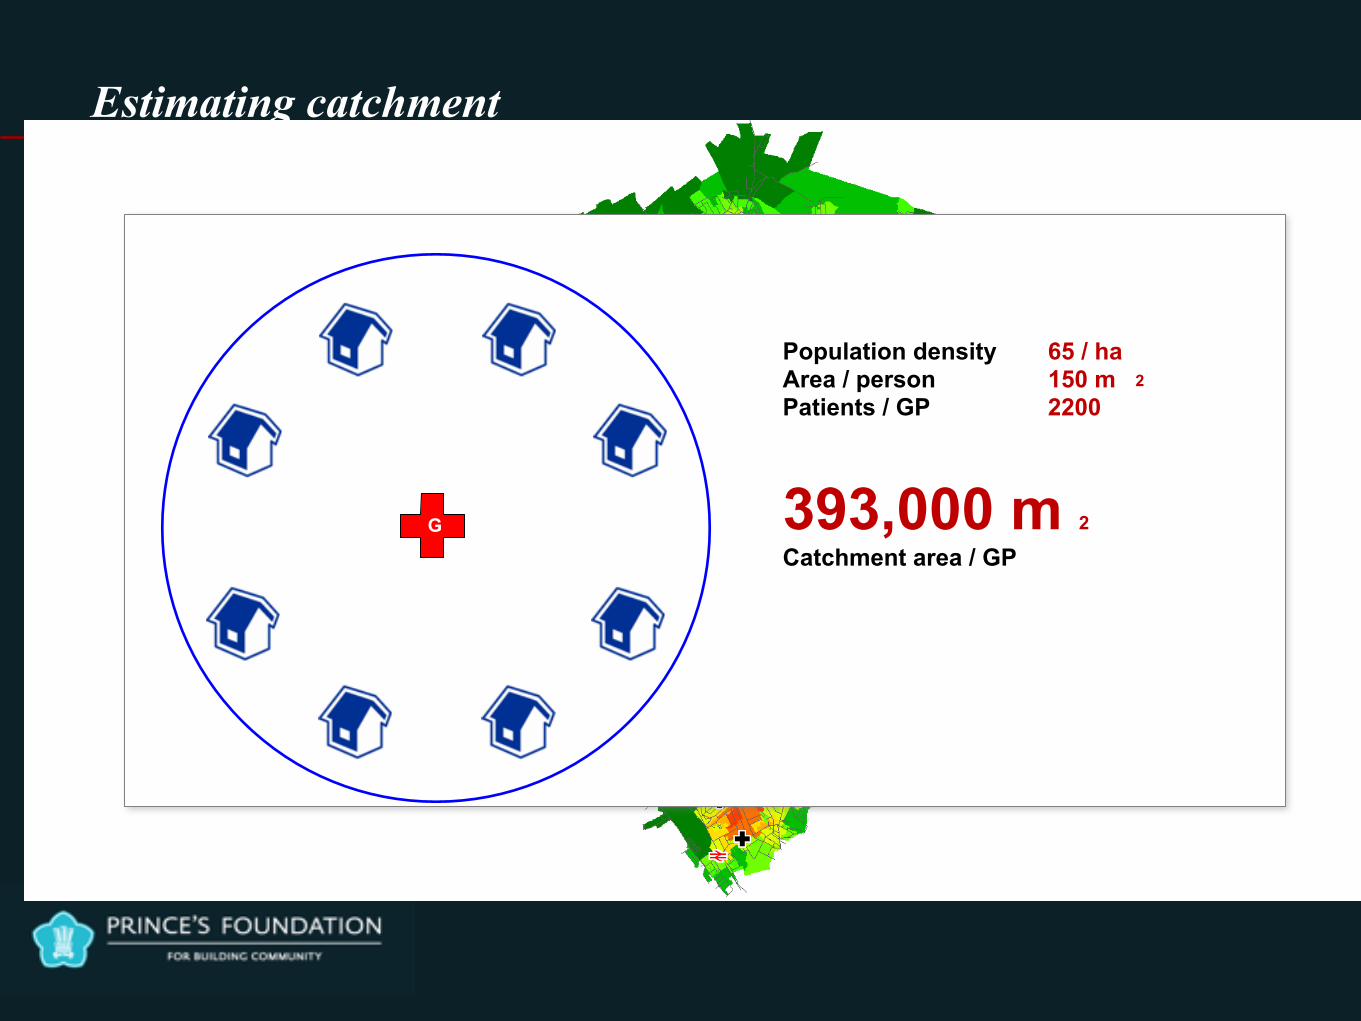
Estimating catchment
G
Population density 65 / ha Area / person 150 m Patients / GP 2200 393,000 m Catchment area / GP
2
2
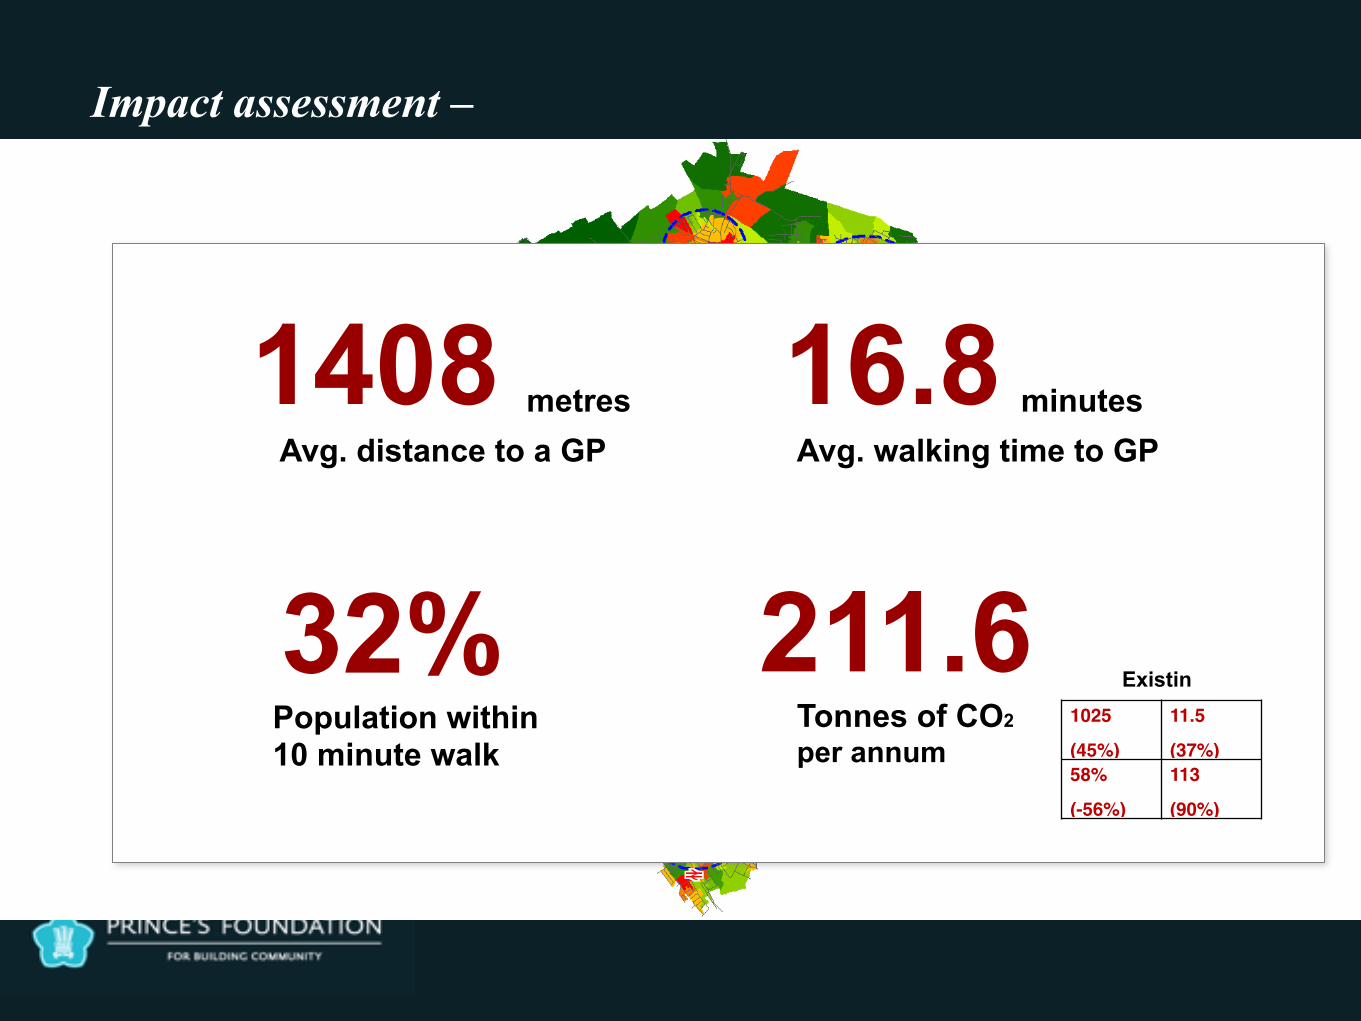
Avg. walking time to GP
16.8 minutesAvg. distance to a GP
1408 metres
Population within 10 minute walk
32%Tonnes of CO2
per annum
211.61025
(45%)
11.5
(37%)58%
(-56%)
113
(90%)
Existin
Impact assessment –
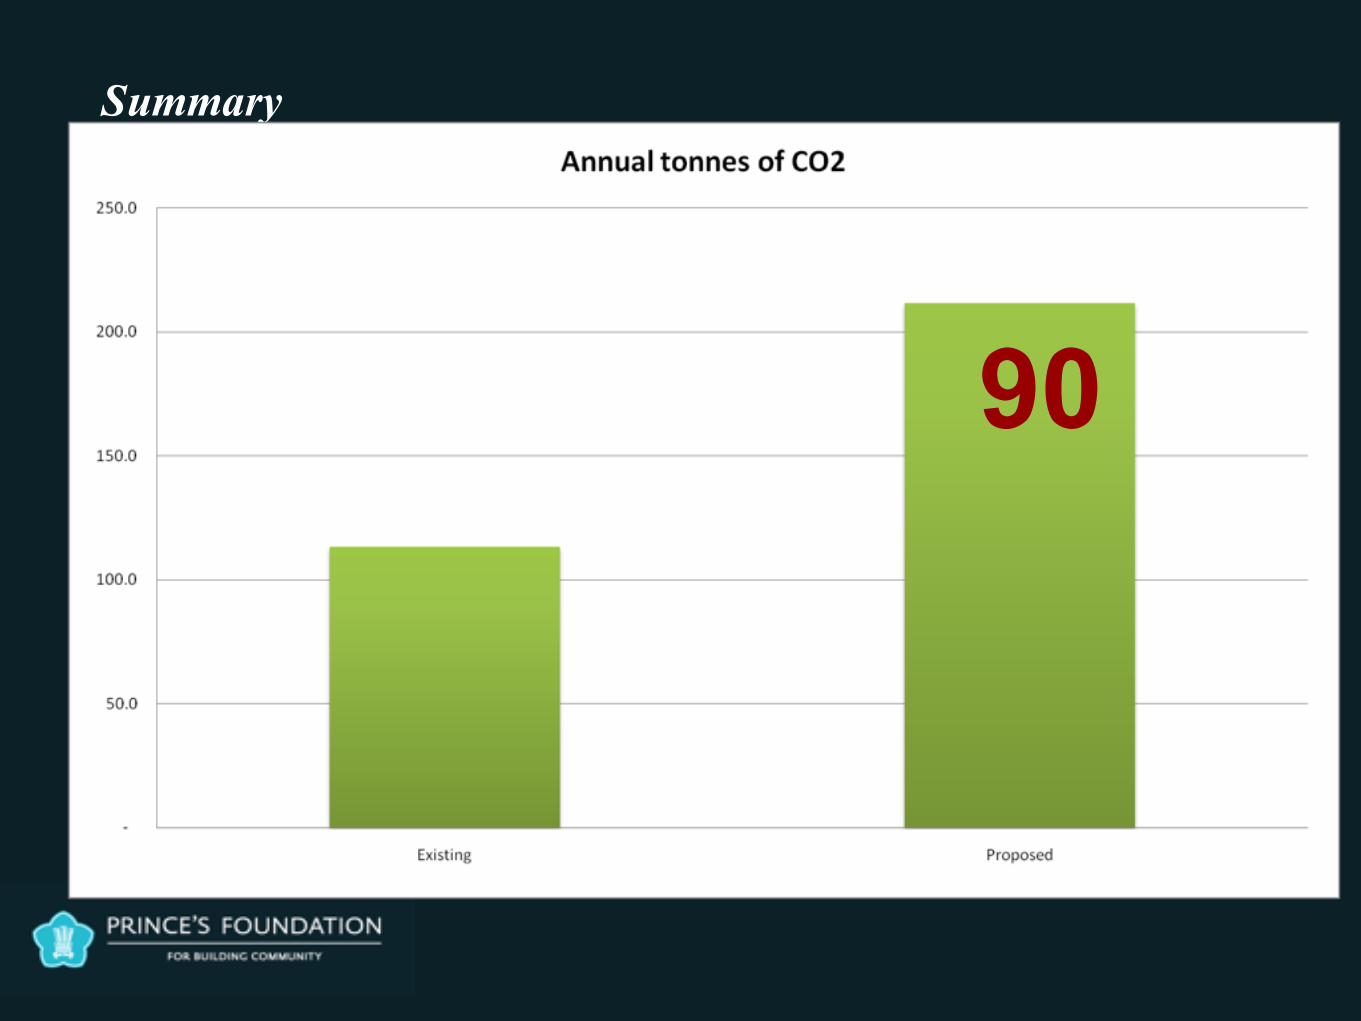
Summary
90
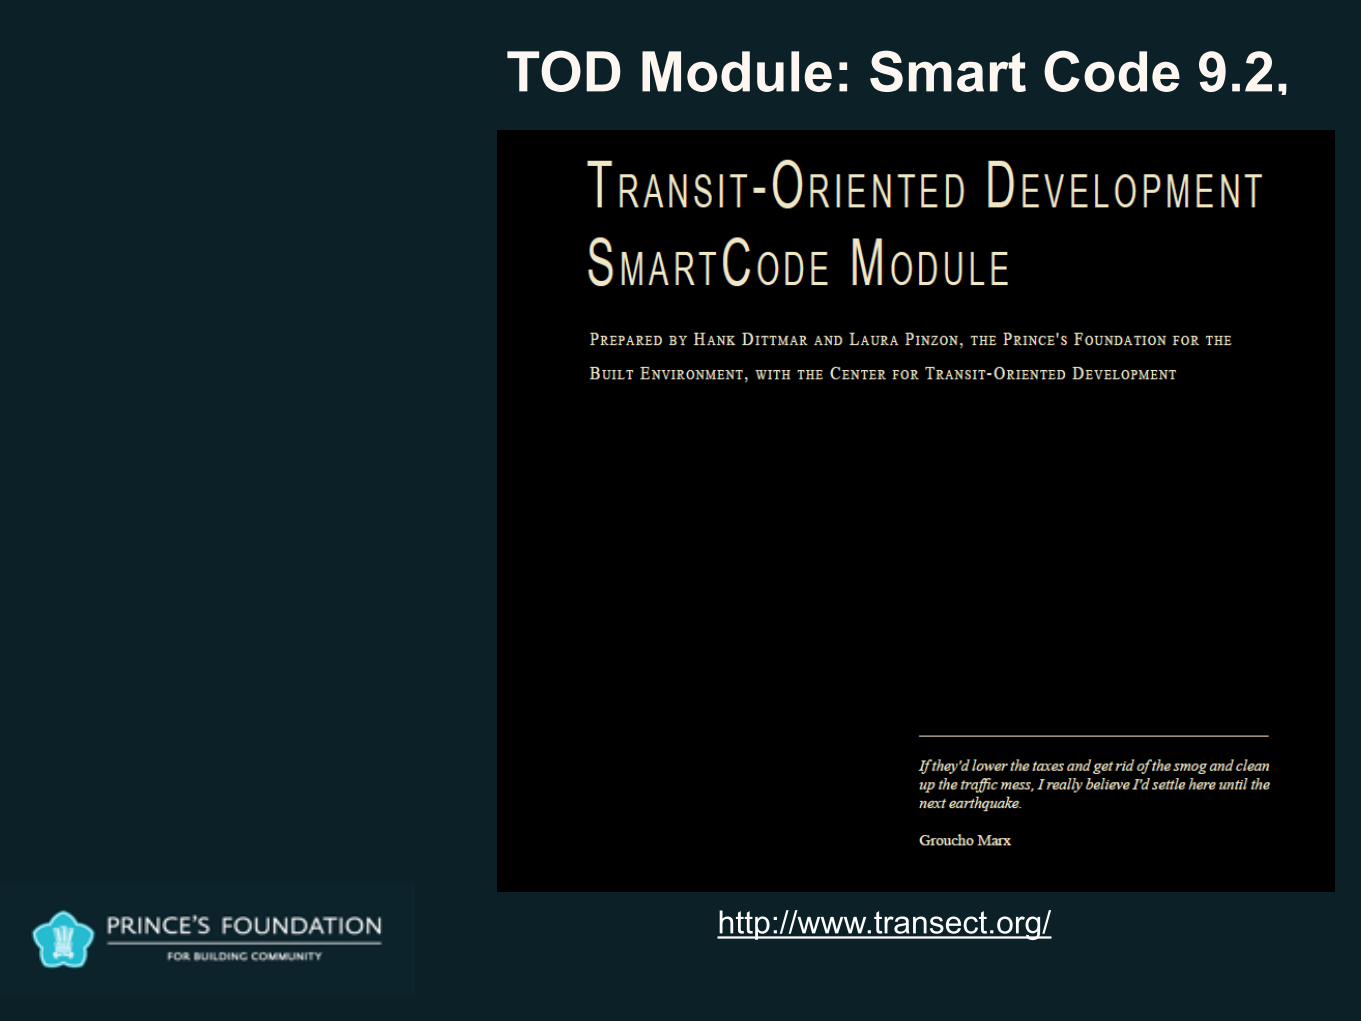
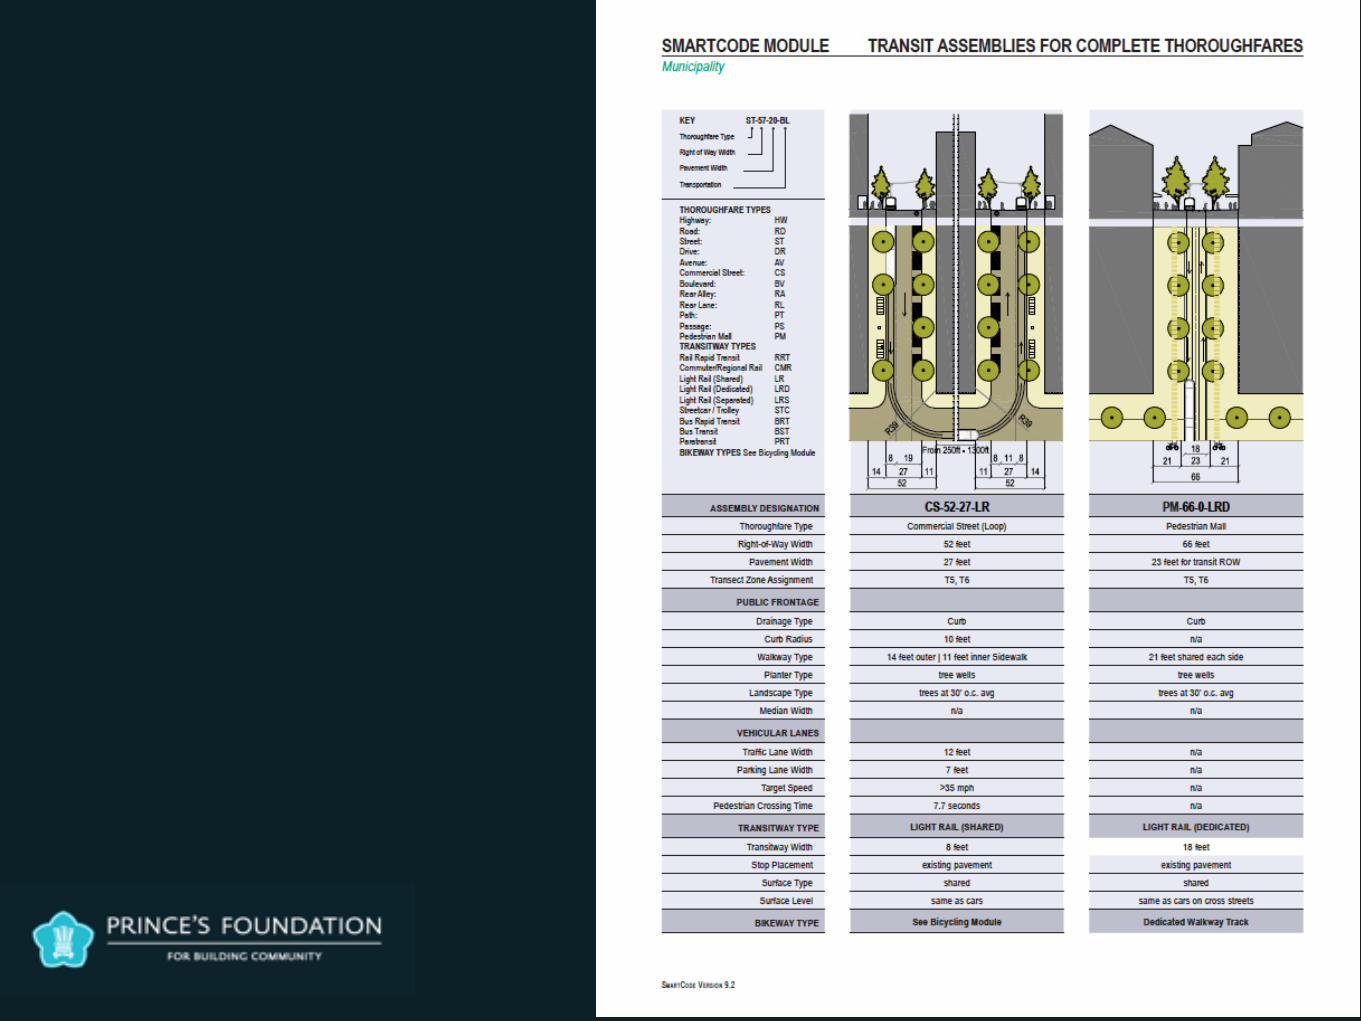
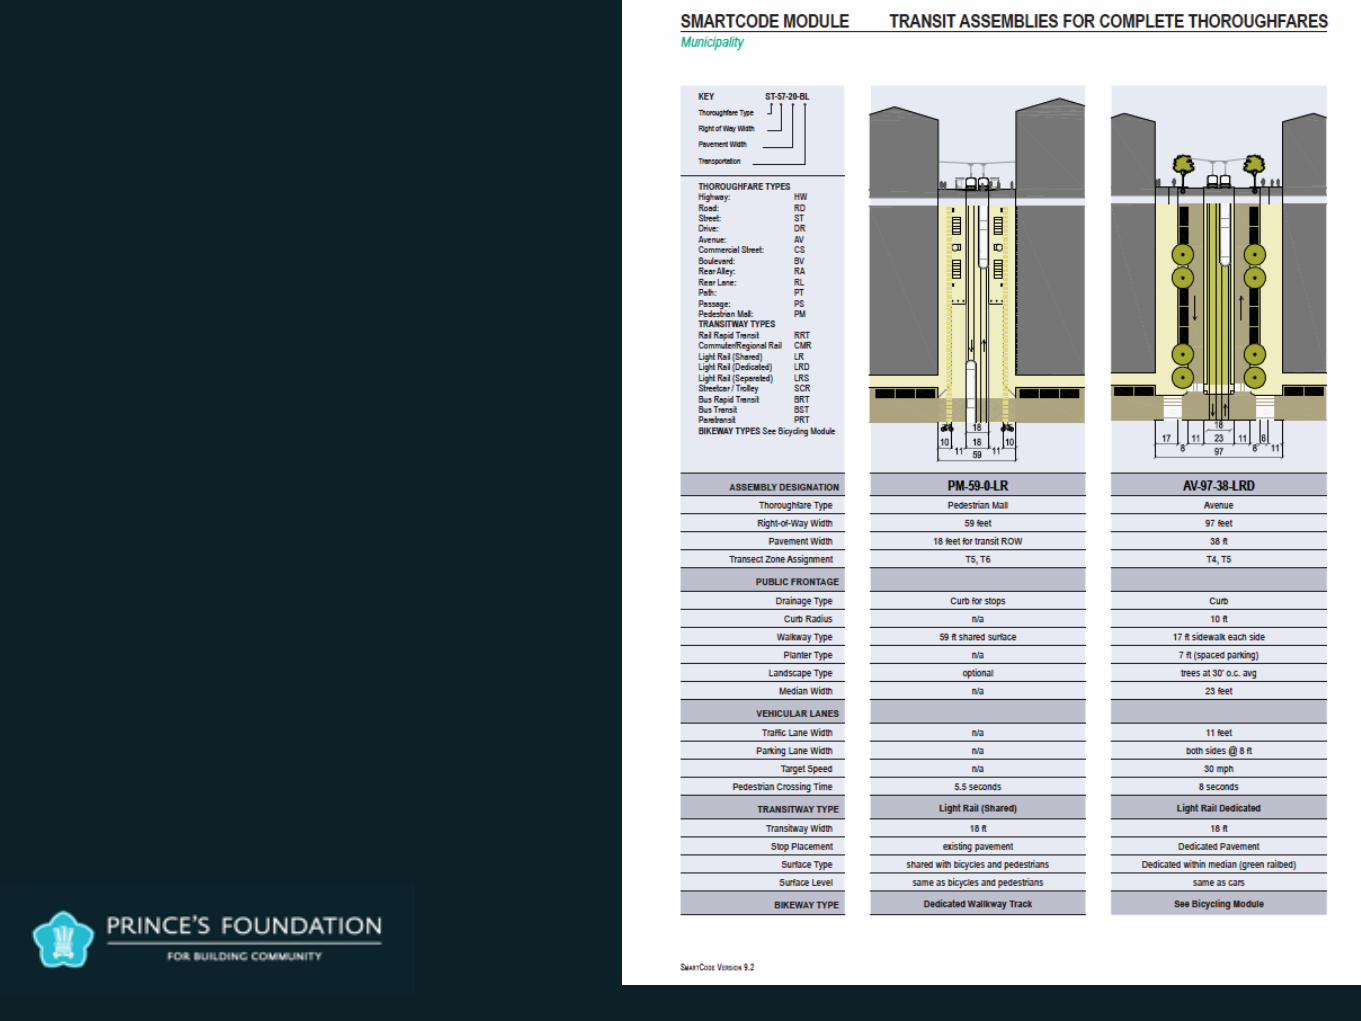
http://www.transect.org/
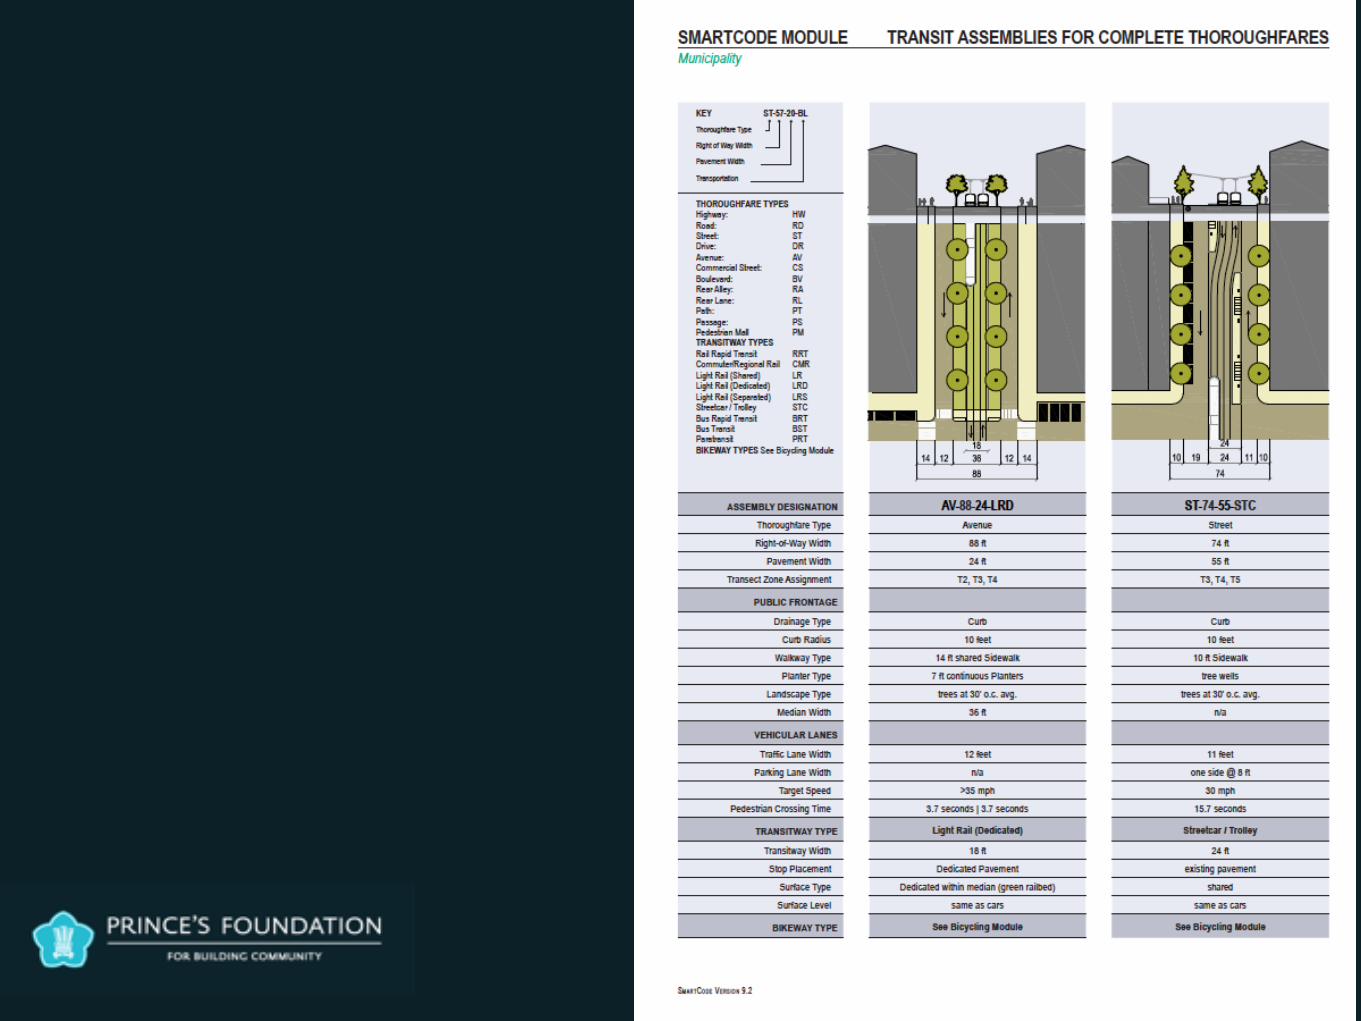
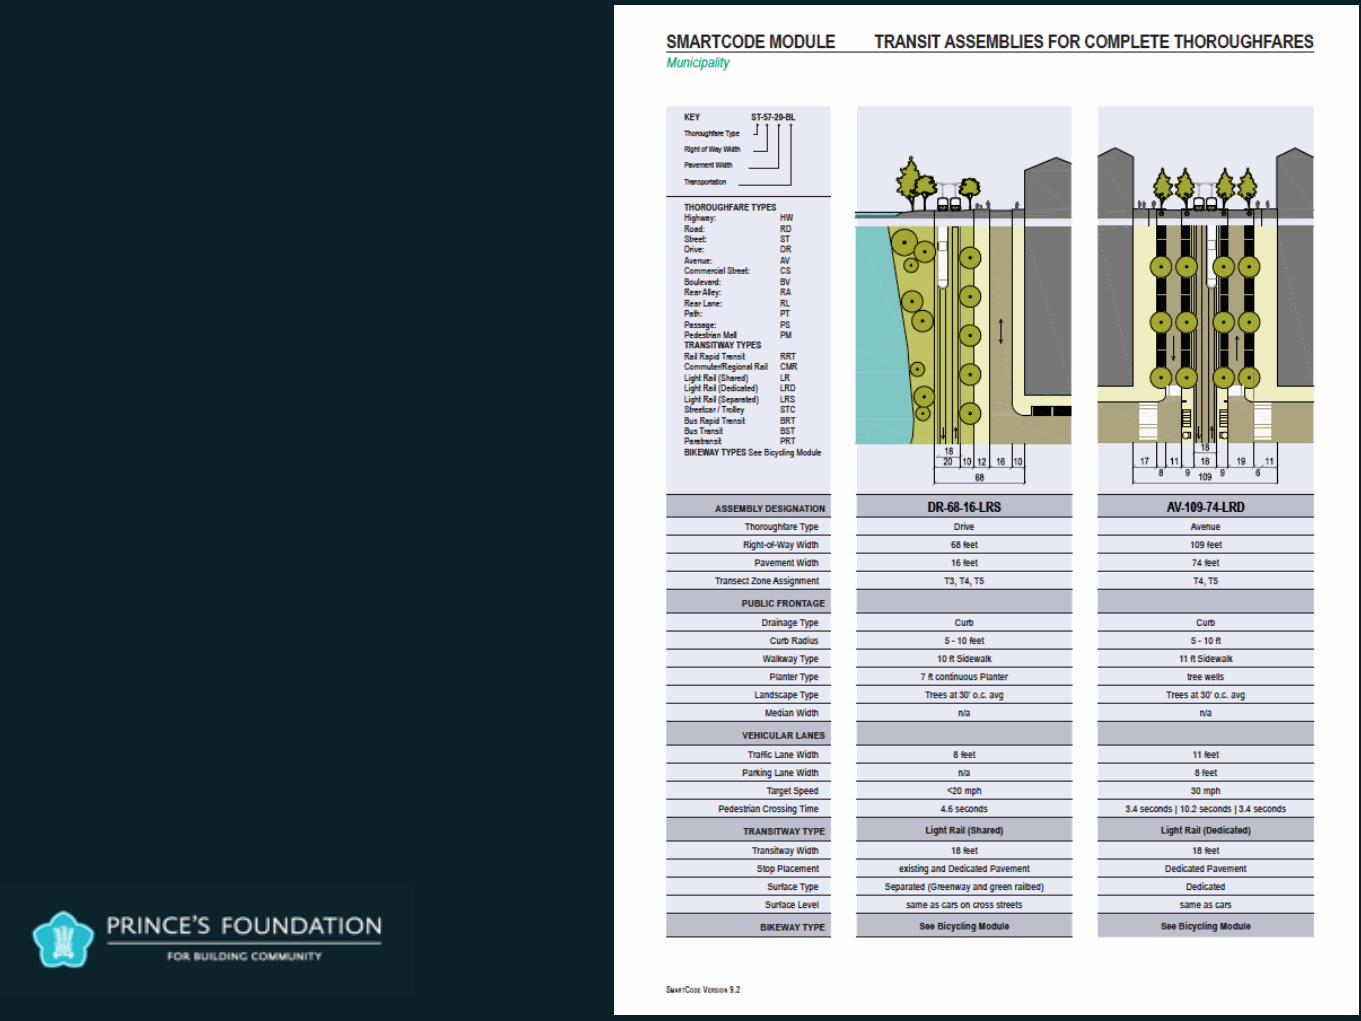
TOD Module: Smart Code 9.2,
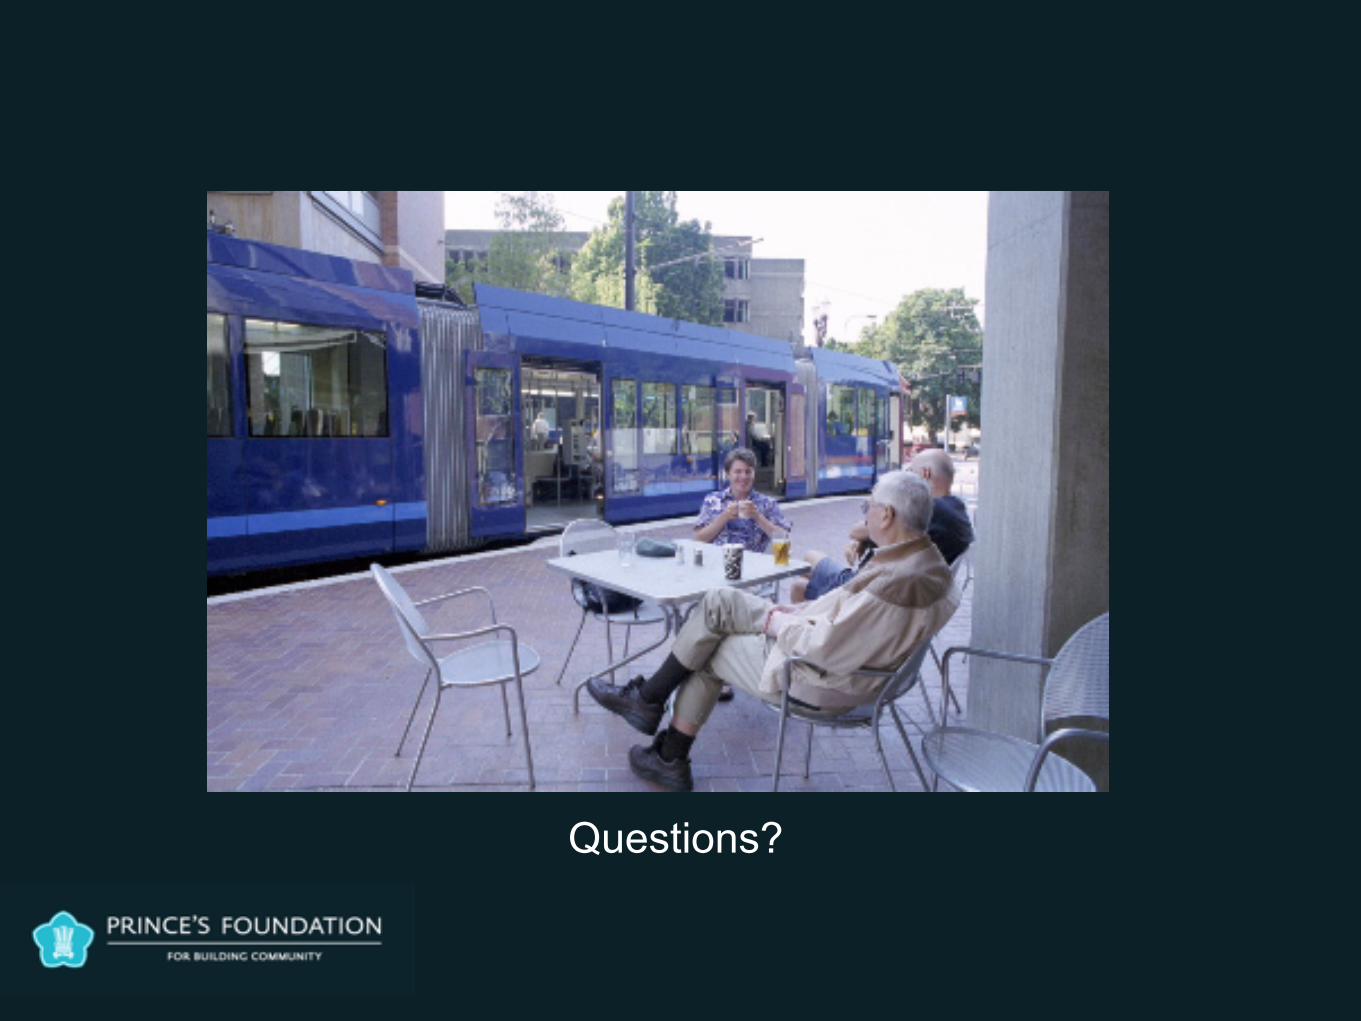
Questions?