Embed Size (px)
Citation preview
CADMUS
LONG-RUN SAVINGS AND COST-EFFECTIVENESS OF HOME ENERGY REPORT PROGRAMSAuthors: M. Sami Khawaja, Ph.D. James Stewart, Ph.D.
WINTER 2014/2015

A C K N O W L E D G M E N T SThe authors would like to thank the following individuals for very helpful discussions and comments about earlier drafts of this paper: Ken Agnew (DNV GL), Annika Todd (Lawrence Berkeley National Laboratory), Mike Li (U.S. Department of Energy), Scott Neuman (Opower), Alex Lopez (Opower), David Sumi (Cadmus), Brian Hedman (Cadmus), and Mehdi Maasoumy (C3). We are also grateful to Opower for providing us with publicly available evaluation reports of its home energy reports programs. This paper expresses the views of the authors and not necessarily those of the reviewers.
Copyright © 2014 by The Cadmus Group, Inc. All rights reserved. Any unauthorized use of this material is prohibited. This document or any portion thereof may not be reproduced or used in any manner whatsoever without the express written permission of The Cadmus Group, Inc.
Cadmus is an employee-owned consultancy committed to helping our clients address complex challenges by applying diverse skills and experiences in a highly collaborative environment. By assisting our clients in achieving their goals, we create social and economic value today and for future generations. Founded in 1983, we leverage our staff's exceptional expertise in the physical and life sciences, engineering, social sciences, strategic communication, architecture and design, law, policy analysis, and the liberal arts to provide an array of research and analytical services in the United States and abroad.
TA B L E O F C O N T E N T S
Introduction ��������������������������������������������������������������������������������������������� 1
Home Energy Report Programs ��������������������������������������������������������������� 2
In-Treatment Savings from HERs ����������������������������������������������������� 3
Post-Treatment Savings���������������������������������������������������������������������������� 5
Empirical Estimates of Savings Decay ���������������������������������������������� 6
Implications of Savings Decay for Lifetime HER Savings ������������������ 8
Measurement of Post-Treatment Savings ���������������������������������������� 9
Avoided Decay and Incremental Savings ����������������������������������������� 9
Implications for EERS Goals ������������������������������������������������������������ 12
Cost-Effectiveness of HER Programs ������������������������������������������������������ 13
Estimating HER Measure Life ��������������������������������������������������������� 13
Calculation of HER Program Cost-Effectiveness ����������������������������� 14
Conclusions and Recommendations ����������������������������������������������������� 17
References���������������������������������������������������������������������������������������������� 19

1
INTRODUCTION
Home energy report (HER) programs are a cornerstone of many utility energy-efficiency portfolios. These programs involve sending electronic or paper reports to residential customers, educating them about their energy use and encouraging them to conserve electricity or natural gas. The reports often include one or more of the following kinds of information:
• A summary of the home’s recent and historical energy use
• Energy-efficiency tips (including utility energy- efficiency offerings)
• A normative comparison of the home’s energy use to that of similar neighbors
• Offers of rewards or incentives for reducing energy use
Dozens of utilities in the United States send energy reports to their residential customers, and millions of utility customers receive these reports.1 Recently, utilities have begun launching energy reports programs aimed at commercial customers.
Since utilities launched the first large-scale HER programs in 2008, the utility industry has collected considerable evidence about the savings gained through these programs. Impact studies of one vendor’s programs (Opower) revealed that HERs typically resulted in average electricity savings between 1.5% and 2.5% of energy use during the first and second program years (Allcott, 2011; Davis, 2011; Rosenberg, Agnew, and Gaffney, 2013).2 Most Opower HER programs have been implemented as randomized control trials (RCTs), which yield unbiased and robust estimates of electricity savings and provide credible evidence of program effects.
1 The 2013 Consortium for Energy Efficiency database lists many utility HER programs; it is available for download at: http://library�cee1�org/content/2013-behavior-program-summary-public-version�
2 As the largest HER service provider, Opower’s programs have been studied the most� Other implementers of HER programs include Aclara, C3 Energy, and Simple Energy�
2
Now that many utility HER programs have been implemented for several years, we can assess savings over a longer term. In particular, Cadmus reviewed studies of mature HER programs—those running for three or more years—to evaluate the industry knowledge about savings, both while homes continue to receive reports and (for several utilities) after homes have stopped receiving them. In the past several years, numerous utilities have conducted RCTs to estimate post-treatment electricity savings. Findings from these studies can be used to improve estimates of HER measure life and cost-effectiveness.
This white paper addresses three primary questions about electricity savings from longer-running HER programs and savings after the end of treatment:
1. How do HER programs perform over time, and how does the program design (e.g., frequency of report delivery) affect savings?
2. What happens to savings when the program administrator stops sending HERs? In particular, do savings decay and, if so, how quickly? What effects result from continuing to send HERs?
3. How does the persistence or decay of HER savings after treatment ends affect program savings, measure-life calculations, and cost-effectiveness?
Section 2 of this paper presents evidence about the performance of mature HER programs, based on Cadmus’ review of Opower impact studies.
Section 3 presents evidence from recent studies of the persistence of savings after homes stop receiving reports. It also characterizes the savings impacts from continuing to send HERs after the first program year.
In Section 4, Cadmus reviews existing methodologies for estimating HER program cost-effectiveness and proposes an
alternative methodology that incorporates new findings about the persistence of savings after the end of treatment. This methodology was inspired by recent research demonstrating that HER savings persist after treatment ends (Allcott and Rogers, 2014; Brattle, 2012; Integral Analytics, 2012; KEMA, 2012; NMR Group, Tetra Tech, and Allcott, 2013).
The final section presents conclusions and recommendations for future research.
HOME ENERGY REPORT PROGRAMS
Many utilities send HERs to their residential customers. The reports provide education about energy use and encourage residents to save energy, both through changing energy-use behaviors (such as by turning off lights in unoccupied rooms or adjusting thermostat settings) and through upgrading home appliance efficiencies (e.g., air conditioners and refrigerators) and home envelopes (e.g., windows, insulation).
HER programs can differ along a number of dimensions, such as:
• The type of fuel targeted for savings (electricity or natural gas)
• Program populations (e.g., high-energy users, electric-heat customers)
• Report frequency (the number of reports per home, per year)
• The duration of treatment (length of time since the first reports were received)
• The report contents
3
That said, many programs share the following features:
• Implemented as an RCT, providing highly credible savings estimates
• Offered on a large scale (by energy-efficiency standards), targeting thousands of utility customers
• Provides customers with an analysis of their historical consumption, energy-savings tips, and energy efficiency in comparison to neighboring homes, either through personalized home reports or a web portal
• Implementation by independent third-party vendor
• Includes an opt-out option for customers to decline participation/receiving reports
In-Treatment Savings from HERs
HER programs save energy while homes are receiving reports (in-treatment savings) and, as we describe in the next section, after homes stop receiving reports (post-treatment savings).This section of the paper is focused on the current industry knowledge regarding in-treatment savings from HER programs; the following section discusses post-treatment savings.
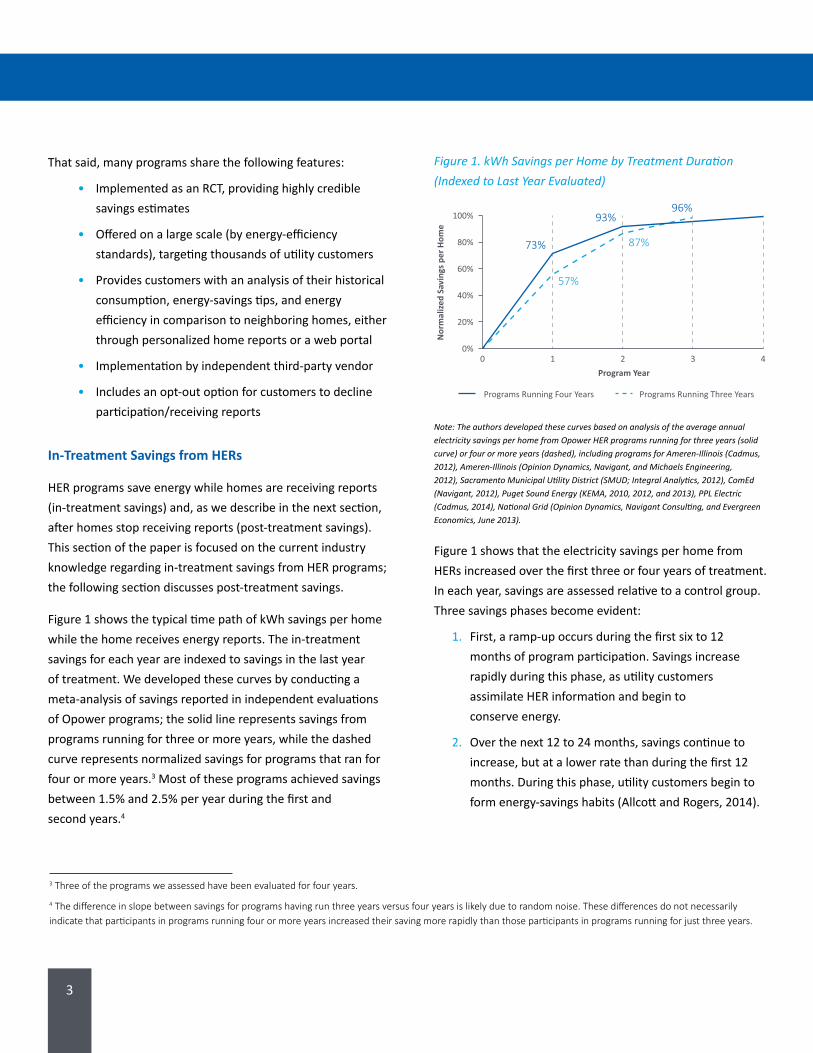
Figure 1 shows the typical time path of kWh savings per home while the home receives energy reports. The in-treatment savings for each year are indexed to savings in the last year of treatment. We developed these curves by conducting a meta-analysis of savings reported in independent evaluations of Opower programs; the solid line represents savings from programs running for three or more years, while the dashed curve represents normalized savings for programs that ran for four or more years.3 Most of these programs achieved savings between 1.5% and 2.5% per year during the first and second years.4
Figure 1. kWh Savings per Home by Treatment Duration (Indexed to Last Year Evaluated)
Programs Running Four Years
73%
57%
87%
93%96%
Program Year
Nor
mal
ized
Savi
ngs p
er H
ome
100%
80%
60%
40%
20%
0%0 1 2 3 4
Programs Running Three Years
Note: The authors developed these curves based on analysis of the average annual electricity savings per home from Opower HER programs running for three years (solid curve) or four or more years (dashed), including programs for Ameren-Illinois (Cadmus, 2012), Ameren-Illinois (Opinion Dynamics, Navigant, and Michaels Engineering, 2012), Sacramento Municipal Utility District (SMUD; Integral Analytics, 2012), ComEd (Navigant, 2012), Puget Sound Energy (KEMA, 2010, 2012, and 2013), PPL Electric (Cadmus, 2014), National Grid (Opinion Dynamics, Navigant Consulting, and Evergreen Economics, June 2013).
Figure 1 shows that the electricity savings per home from HERs increased over the first three or four years of treatment. In each year, savings are assessed relative to a control group. Three savings phases become evident:
1. First, a ramp-up occurs during the first six to 12 months of program participation. Savings increase rapidly during this phase, as utility customers assimilate HER information and begin to conserve energy.
2. Over the next 12 to 24 months, savings continue to increase, but at a lower rate than during the first 12 months. During this phase, utility customers begin to form energy-savings habits (Allcott and Rogers, 2014).
3 Three of the programs we assessed have been evaluated for four years�
4 The difference in slope between savings for programs having run three years versus four years is likely due to random noise� These differences do not necessarily indicate that participants in programs running four or more years increased their saving more rapidly than those participants in programs running for just three years�

4
3. In the last phase (program years 3 and 4), savings begin to level off. Savings maintain or increase at a very slow rate, while participants continue to receive reports that reinforce conservation habits. There is no evidence to indicate that average savings decrease in later treatment years because customers tire of or stop paying attention to the reports. However, there is little empirical evidence as to what happens to savings after the fourth year of treatment.
During our review of Opower HER programs, we identified a number of other savings patterns that are not evident in Figure 1. These include:
• Energy savings follow a seasonal pattern: they tend to be higher during winter and summer, when the demand for electric space heating and cooling is greatest (Summit Blue, 2009; Cadmus, January 2014; Power System Engineering, 2010; Navigant, 2011; Allcott, 2011; Opinion Dynamics, Cadmus, Navigant,
and Michaels Engineering; DNV-GL, 2014).
• Customers with above-average pre-treatment consumption tend to experience higher absolute and percentage savings than customers with average or below-average consumption (Navigant, 2010; Allcott, 2011; NMR Group, Tetra Tech, and Allcott, 2013).
• HER programs tend to increase the participation rate in utility energy-efficiency rebate programs (Navigant, 2010; Opinion Dynamics and Navigant Consulting, 2011; Cadmus, 2014).
The program design also can influence savings. Participants that receive reports at higher frequencies (e.g., monthly instead of quarterly) tend to experience greater savings, especially at the beginning of the program when they are forming conservation habits (KEMA, 2012; Allcott and Rogers, 2014).
5
POST-TREATMENT SAVINGS
This section addresses what happens to savings after participants stop receiving HER reports; specifically, whether they continue to conserve energy and for how long.
Several utilities have conducted studies of post-treatment savings; this section discusses findings from four such studies concerning Opower HER programs, and addresses ways for evaluators to measure post-treatment savings persistence.
HER recipients can take several different actions in response to the reports. These actions affect the potential for the persistence of savings after treatment ends, and characterizing the actions provides a useful context for understanding the study results about post-treatment savings.
• Equipment purchase behaviors: HER program participants may purchase and install energy-efficient durables (e.g., efficient appliances such as ENERGY STAR® refrigerators, washing machines, and air conditioners) or install envelope measures (e.g., high-efficiency windows and insulation). Such measures have lasting impacts on home energy use and require minimal or no attention after adoption.
• One-time behaviors: Participants may undertake low-cost actions that must be repeated infrequently, such as replacing incandescent lamps with CFLs or cleaning furnace filters.
• Habitual (or reoccurring) behaviors: Participants may undertake changes that require frequent attention and repetition, such as making daily adjustments to thermostat settings or lighting controls.
Several different types of analysis provide circumstantial evidence that most HER program savings come from habitual or reoccurring behavior changes. The evidence is
circumstantial because it is very difficult to directly observe behavior changes in response to the reports.
One area where researchers have observed HER impacts is on household purchases of efficient appliances and home envelope upgrades. Researchers have studied the HER program impacts on participation in utility energy efficiency rebate programs, finding that purchases of durable equipment and envelope measures only accounts for a small percentage of HER savings (typically less than 5%). Non-rebated durables and envelope measures also may account for some HER savings, likely with a smaller contribution. In addition, researchers have conducted telephone surveys and site visits to estimate HER impacts on residential CFL purchases. These analyses have not been conclusive, but suggest that the adoption of CFLs can account for only a small percentage of HER savings (FSC, 2013, DNV-GL, 2014).
Allcott and Rogers (2014) provide the strongest evidence that most HER program savings result from habitual changes. The authors used high-frequency interval billing data to document a gradual decline of energy savings as time passed since the last report. The authors interpret this pattern as “action and backsliding”—the relaxing of energy-savings activities as the cue for saving energy (the energy report) recedes in time.5 After the next report is received, recipients intensify their savings activities and energy savings increase again, followed by another period of backsliding.
However, Allcott and Rogers also found that as homes receive more reports, backsliding attenuates. HER recipients appeared to form energy savings habits that made conservation less costly and resulted in more consistent behavior changes. The backsliding early in the program and subsequent attenuation of backsliding suggests that the reports lead to behavior change, but until habits form, utility customers require periodic reinforcement of conservation messaging.
5 Another interpretation of this energy-savings pattern is that HER recipients accelerated the adoption of measures relative to customers in the control group� For example, if HER recipients purchase and install CFLs after receiving reports and before control group customers, relative energy savings would diminish with time as control group customers purchase and install CFLs�
6
Given the inference that most HER savings are behavior based, and that these behaviors depend on periodic reinforcement, the discontinuation of HERs is likely to result in gradual savings decay—a reduction in savings relative to what occurred while participants received HERs. The savings decay rate equals the reduction in energy use per unit of time, usually a month or a year.
Empirical Estimates of Savings Decay
To estimate the amount of savings decay after treatment, four studies randomly assigned homes receiving energy reports to either a discontinued treatment group or a continued treatment group, and compared the energy use of both groups to a control group.
Table 1 lists the four studies, their key attributes, their findings about post-treatment savings persistence and the rate of savings decay. The studies had different lengths of time during which the researchers measured savings decay, ranging from six months to 36 months.
NMR Group, Tetra Tech, and Allcott (2013) estimated post-treatment savings from Connecticut Light & Power homes that received energy reports for six months. Savings persisted for two months after the last treatment, then decreased significantly. Most electricity savings (83%) dissipated within five months of delivery of the final report. This rapid savings decay is consistent with the notion that customers require repeated exposure to energy reports to form and maintain energy-savings habits. Short treatment periods do not provide sufficient time for utility customers to form these habits.
AuthorsUtility or Service Area
Frequency of Reports
Number of Treatment Months
Number of Post-Treatment Savings Analysis Months
Key Findings About Saving Decay
Allcott and Rogers (2014)
Upper MidwestMonthly and quarterly
24–25 26Average annual savings decay of 21%
West CoastMonthly and quarterly
24 29Average annual savings decay of 18%
West CoastMonthly and quarterly
25–28 34Average annual savings decay of 15%
NMR Group, Tetra Tech, and Allcott (2013)
Connecticut Light & Power
Monthly 6 6Savings decay of 83% five months after treatment stopped
Integral Analytics (2012) SMUDMonthly and quarterly
27 12Savings decay of 32% one year after treatment stopped
DNV-GL (2014)Puget Sound Energy
Monthly and quarterly
24 36Average annual savings decay of 11%
Table 1. Studies of Post-Treatment Savings
7
For the other three studies listed in Table 1, evaluators estimated post-treatment savings in homes that had received reports for about two years, and measured savings decay for between 12 months and 36 months.
• Allcott and Rogers analyzed data from RCTs in three utility service areas (one in the Upper Midwest and two on the West Coast), finding that post-treatment savings decayed between 15% and 21% per year over two to three years.
• Integral Analytics (2012) estimated the post-treatment savings decay for one year for homes within SMUD’s service territory that received reports for 27 months. In the first 12 months after the end of treatment, savings
decreased by 32% but still remained large (1.6%) and statistically significant.
• Finally, DNV-GL (2014) estimated post-treatment savings for Puget Sound Energy homes for three years after treatment ended. In homes that stopped receiving reports, savings decayed at an average annual rate of 11%.6
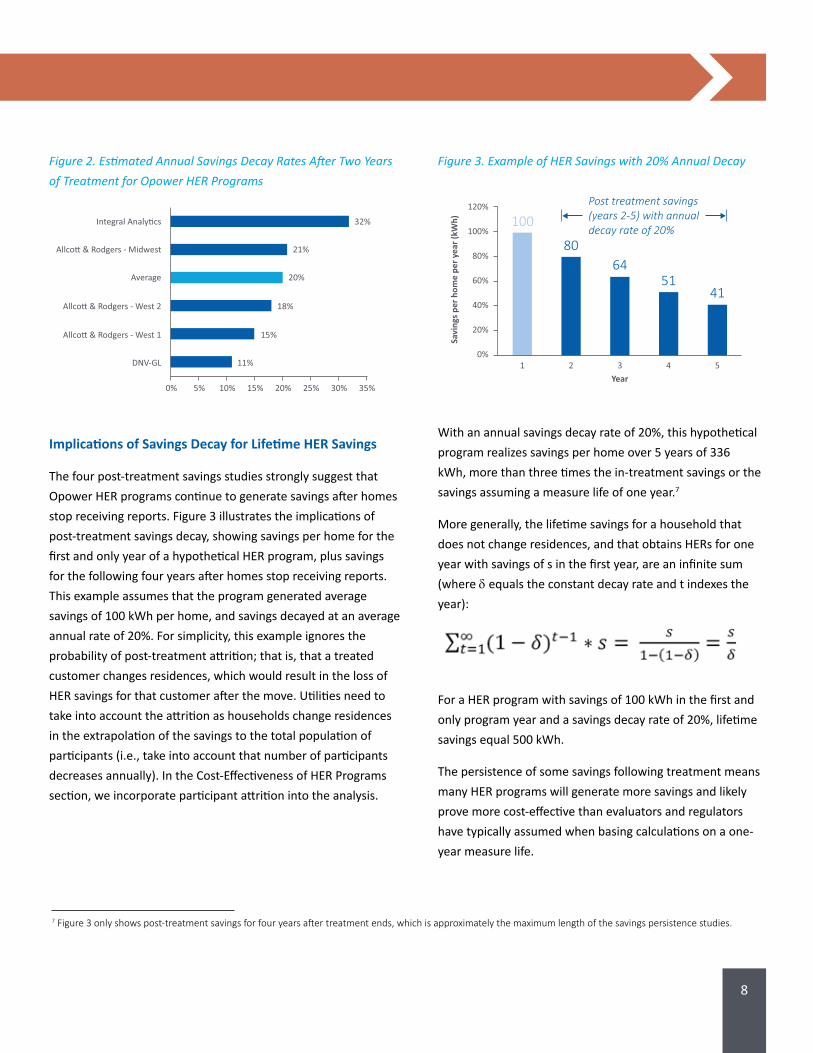
Figure 2 summarizes these findings, showing the estimated savings decay rates for utility HER programs that discontinued treatment after two years and that measured post-treatment savings for at least 12 months. The table also shows an average of the estimates. The average savings decay rate is approximately 20%.
6 DNV-GL (2014) also estimated the savings persistence and decay of natural gas savings for three years after treatment ended� The average annual rate of savings decay was 5%�
8
Figure 2. Estimated Annual Savings Decay Rates After Two Years of Treatment for Opower HER Programs
0%
15%
11%DNV-GL
Allco� & Rodgers - West 1
Allco� & Rodgers - West 2
Allco� & Rodgers - Midwest
Integral Analy�cs
Average
18%
20%
21%
32%
5% 10% 15% 20% 25% 30% 35%
Implications of Savings Decay for Lifetime HER Savings
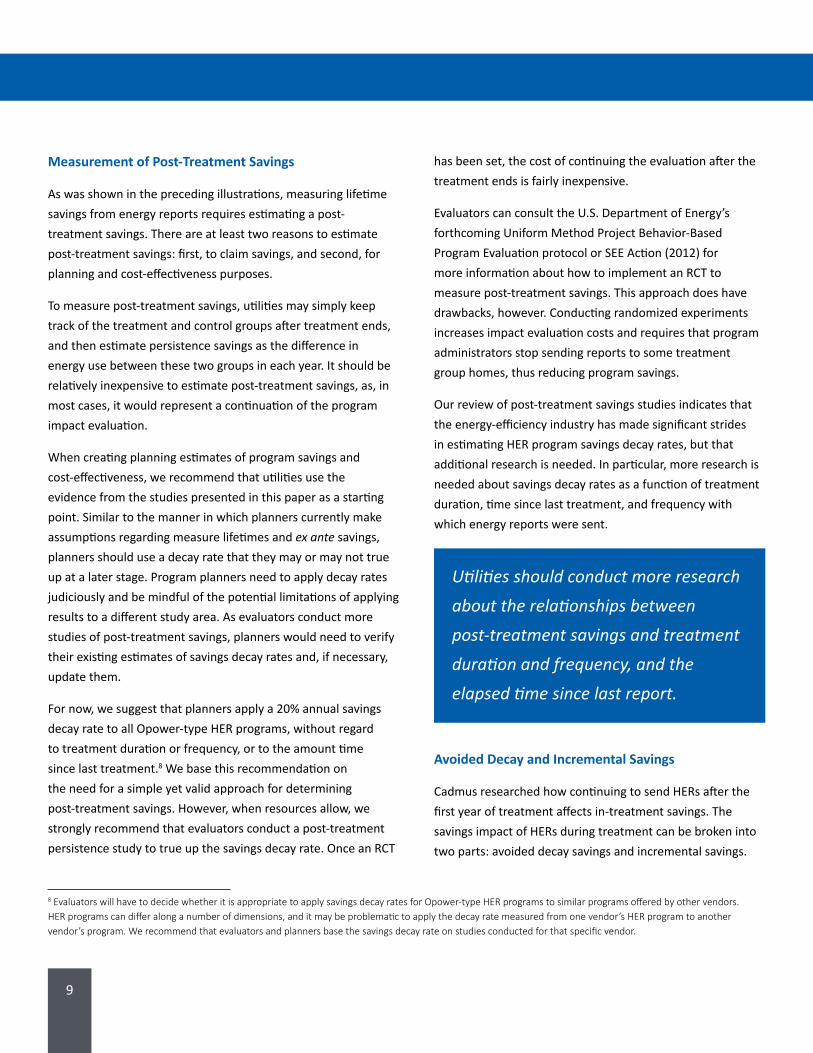
The four post-treatment savings studies strongly suggest that Opower HER programs continue to generate savings after homes stop receiving reports. Figure 3 illustrates the implications of post-treatment savings decay, showing savings per home for the first and only year of a hypothetical HER program, plus savings for the following four years after homes stop receiving reports. This example assumes that the program generated average savings of 100 kWh per home, and savings decayed at an average annual rate of 20%. For simplicity, this example ignores the probability of post-treatment attrition; that is, that a treated customer changes residences, which would result in the loss of HER savings for that customer after the move. Utilities need to take into account the attrition as households change residences in the extrapolation of the savings to the total population of participants (i.e., take into account that number of participants decreases annually). In the Cost-Effectiveness of HER Programs section, we incorporate participant attrition into the analysis.
Figure 3. Example of HER Savings with 20% Annual Decay
Year
Savi
ngs p
er h
ome
per y
ear (
kWh)
120%
100%
80%
60%
40%
20%
0%1
100
8064
Post treatment savings (years 2-5) with annual decay rate of 20%
5141
2 3 4 5
With an annual savings decay rate of 20%, this hypothetical program realizes savings per home over 5 years of 336 kWh, more than three times the in-treatment savings or the savings assuming a measure life of one year.7
More generally, the lifetime savings for a household that does not change residences, and that obtains HERs for one year with savings of s in the first year, are an infinite sum (where δ equals the constant decay rate and t indexes the year):
For a HER program with savings of 100 kWh in the first and only program year and a savings decay rate of 20%, lifetime savings equal 500 kWh.
The persistence of some savings following treatment means many HER programs will generate more savings and likely prove more cost-effective than evaluators and regulators have typically assumed when basing calculations on a one-year measure life.
7 Figure 3 only shows post-treatment savings for four years after treatment ends, which is approximately the maximum length of the savings persistence studies�
9
Measurement of Post-Treatment Savings
As was shown in the preceding illustrations, measuring lifetime savings from energy reports requires estimating a post-treatment savings. There are at least two reasons to estimate post-treatment savings: first, to claim savings, and second, for planning and cost-effectiveness purposes.
To measure post-treatment savings, utilities may simply keep track of the treatment and control groups after treatment ends, and then estimate persistence savings as the difference in energy use between these two groups in each year. It should be relatively inexpensive to estimate post-treatment savings, as, in most cases, it would represent a continuation of the program impact evaluation.
When creating planning estimates of program savings and cost-effectiveness, we recommend that utilities use the evidence from the studies presented in this paper as a starting point. Similar to the manner in which planners currently make assumptions regarding measure lifetimes and ex ante savings, planners should use a decay rate that they may or may not true up at a later stage. Program planners need to apply decay rates judiciously and be mindful of the potential limitations of applying results to a different study area. As evaluators conduct more studies of post-treatment savings, planners would need to verify their existing estimates of savings decay rates and, if necessary, update them.
For now, we suggest that planners apply a 20% annual savings decay rate to all Opower-type HER programs, without regard to treatment duration or frequency, or to the amount time since last treatment.8 We base this recommendation on the need for a simple yet valid approach for determining post-treatment savings. However, when resources allow, we strongly recommend that evaluators conduct a post-treatment persistence study to true up the savings decay rate. Once an RCT
has been set, the cost of continuing the evaluation after the treatment ends is fairly inexpensive.
Evaluators can consult the U.S. Department of Energy’s forthcoming Uniform Method Project Behavior-Based Program Evaluation protocol or SEE Action (2012) for more information about how to implement an RCT to measure post-treatment savings. This approach does have drawbacks, however. Conducting randomized experiments increases impact evaluation costs and requires that program administrators stop sending reports to some treatment group homes, thus reducing program savings.
Our review of post-treatment savings studies indicates that the energy-efficiency industry has made significant strides in estimating HER program savings decay rates, but that additional research is needed. In particular, more research is needed about savings decay rates as a function of treatment duration, time since last treatment, and frequency with which energy reports were sent.
Utilities should conduct more research about the relationships between post-treatment savings and treatment duration and frequency, and the elapsed time since last report.
Avoided Decay and Incremental Savings
Cadmus researched how continuing to send HERs after the first year of treatment affects in-treatment savings. The savings impact of HERs during treatment can be broken into two parts: avoided decay savings and incremental savings.
8 Evaluators will have to decide whether it is appropriate to apply savings decay rates for Opower-type HER programs to similar programs offered by other vendors� HER programs can differ along a number of dimensions, and it may be problematic to apply the decay rate measured from one vendor’s HER program to another vendor’s program� We recommend that evaluators and planners base the savings decay rate on studies conducted for that specific vendor�
10
• Avoided decay is savings that would have been foregone had the next report not been sent. Avoided decay can be estimated as the difference between savings during treatment and savings after treatment ends.
• Incremental savings are those in excess of the previous period’s savings. Incremental savings can be estimated as the difference in in-treatment savings between the current and previous periods.
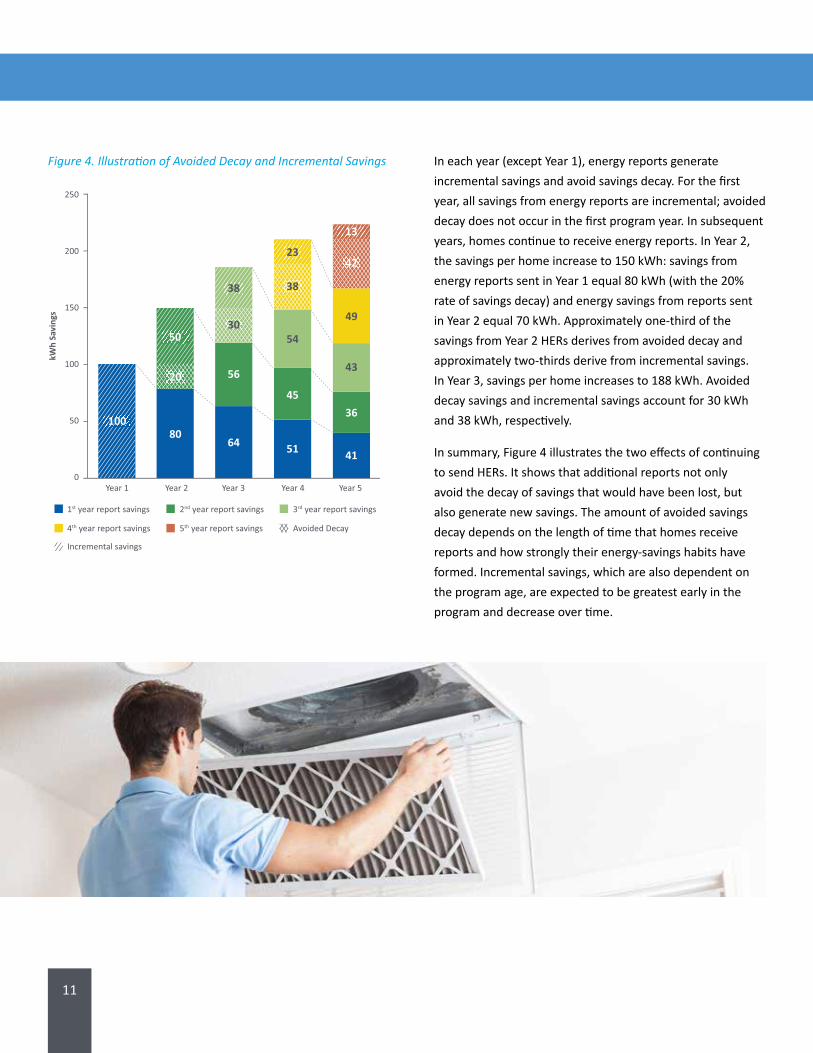
Figure 4 illustrates both effects on in-treatment savings for the first five years of a hypothetical HER program, including a breakdown of savings from sending additional energy reports
in each year into avoided decay and incremental savings. The figure assumes that energy reports generate 100 kWh of savings per home in the first year; that savings increase at a decreasing rate in subsequent years; and that the savings decay rate is 20% in the second year and all subsequent years. The time path of annual savings in Figure 4 is consistent with the annual savings observed in actual HER programs, as was shown in Figure 1. Figure 4 shows incremental savings with diagonal lines and avoided decay with cross-hatches, and color-codes savings from energy reports attributable to the year reports were sent.
11
Figure 4. Illustration of Avoided Decay and Incremental Savings
1st year report savings
5th year report savings Avoided Decay
Incremental savings
2nd year report savings 3rd year report savings
4th year report savings
kWh
Savi
ngs
Year 1 Year 2 Year 3 Year 4 Year 5
250
200
150
100
50
0
10080
20
50
64
56
51
45
41
36
43
49
42
13
54
38
23
30
38
In each year (except Year 1), energy reports generate incremental savings and avoid savings decay. For the first year, all savings from energy reports are incremental; avoided decay does not occur in the first program year. In subsequent years, homes continue to receive energy reports. In Year 2, the savings per home increase to 150 kWh: savings from energy reports sent in Year 1 equal 80 kWh (with the 20% rate of savings decay) and energy savings from reports sent in Year 2 equal 70 kWh. Approximately one-third of the savings from Year 2 HERs derives from avoided decay and approximately two-thirds derive from incremental savings. In Year 3, savings per home increases to 188 kWh. Avoided decay savings and incremental savings account for 30 kWh and 38 kWh, respectively.
In summary, Figure 4 illustrates the two effects of continuing to send HERs. It shows that additional reports not only avoid the decay of savings that would have been lost, but also generate new savings. The amount of avoided savings decay depends on the length of time that homes receive reports and how strongly their energy-savings habits have formed. Incremental savings, which are also dependent on the program age, are expected to be greatest early in the program and decrease over time.
12
Implications for EERS Goals
In most jurisdictions, regulators define energy-efficiency resource standards (EERS) for HERs using first-year savings targets and assuming a one-year measure life. This policy/practice attributes all HER savings measured in a year to that year’s savings goal.9
If savings from HERs had a one-year measure life, this approach would make sense: all savings in a program year could be properly attributed to spending in that year. However, HER savings persist after treatment, making this approach invalid. As Figure 3 and Figure 4 showed, some annual savings in the second and subsequent years can be attributed to spending in previous years. Therefore, it is incorrect to attribute all savings in the second and subsequent years only to spending in that year. Savings attributable to those years should include the avoided decay and incremental savings, but not the persistence savings. Using first-year savings as a metric, it is incorrect to credit the persistence savings toward the annual EERS goal.
To illustrate how savings persistence affects accounting toward EERS savings goals, Table 2 shows a comparison of the
accounting approach used in most jurisdictions (one-year measure life) to the approach that accounts for savings persistence. This example assumes that only first-year savings count towards the EERS goal and that the HER program runs for five years, using the values of annual incremental savings, avoided decay, and persistence savings from Figure 4.
In jurisdictions with EERS goals based on first-year savings, regulators should only count HER savings attributable to first-year spending. Attributable savings in subsequent years are then the sum of incremental savings and avoided decay savings.
Approach Currently Used in Most Jurisdictions
Year 1 Year 2 Year 3 Year 4 Year 5
Incremental savings 100 50 38 23 13
Avoided decay 0 20 30 38 42
Persistence savings from spending in previous years 0 80 120 150 169
Total 100 150 188 211 224
Alternative Approach for Accounting Toward EERS Savings Goals
Multiyear measure life (incremental + avoided decay) 100 70 68 61 55
* The annual incremental, avoided decay, and persistence HER savings are from Figure 4.
Table 2. Accounting for EERS Savings Goals*
9 Wisconsin is an exception; this state uses lifecycle savings for EERS goals� See Quackenbush and Bakkal (2013)�
13
Under the conventional accounting approach, total savings, the sum of incremental savings, avoided decay, and persistence savings (savings from spending in previous years) all count toward the annual EERS goal. These savings are shown as the Total in Table 2. In contrast, with a multiyear measure life, only incremental savings and avoided decay count toward the annual EERS savings goal. These savings are shown in the last row of Table 2.
COST-EFFECTIVENESS OF HER PROGRAMS
In this section, we describe how accounting for post-treatment savings affects calculations of HER measure life and program cost-effectiveness. Current practices for calculating measure life and cost-effectiveness are inconsistent with growing
evidence that HER savings persist after treatment ends. We recommend that regulators begin assigning HER measure lives and calculating cost-effectiveness that accounts for post-treatment savings. This approach would more accurately capture the lifetime benefits delivered by HER programs.
Estimating HER Measure Life
In general, a measure is cost-effective when its benefits exceed its costs; that is, when the measure achieves a benefit/cost ratio greater than 1.0. For energy efficiency in general, computation of cost-effectiveness requires:
• Costs to implement an intervention, often incurred up front
• Benefits resulting from such an intervention, which
14
often occur over a long period of time
• A method to temporally align these benefits and costs
• Identification of stakeholders impacted by the intervention
For HER programs, the most controversial input has been the duration of benefits (or measure life).
While measure life remains a matter of debate, even in traditional energy-efficiency programs (because the effective useful life of a piece of equipment is, at best, an estimate), HER programs require an additional level of scrutiny. When conducting effective analysis for installing a piece of equipment, one makes assumption regarding how long the equipment will remain useful to the average owner (equal to the effective useful life). There is a probability distribution of equipment lifetime, and the effective useful life represents the central tendency of the distribution.
HER programs have a lack of accepted, comparable effective useful lives, complicating the measurement of a savings lifetime. Most common approaches to HER program cost-effectiveness apply a one-year effective life for each year customers receive reports. This approach is flawed, as it ignores the fact that, while savings decay, they do not end abruptly when reports stop. A more appropriate approach is to account for savings that continue to occur after the end of treatment.
For simplicity, consider a HER program that runs for only one year. We propose to measure the effective useful life as:
Effective useful life is HER lifetime energy savings in first-year savings equivalents.
Lifetime savings include first-year savings, plus savings that persist after treatment. The amount of post-treatment savings
depends on the annual rate of savings decay (0<δ<1) and the annual attrition rate of participants from residence changes (0<a<1):
This formula assumes that savings decay indefinitely and at a constant annual rate (1-δ)*(1-a). As this is an infinite series, it converges at:
For example, if first-year savings equal 10,000 MWh, the annual savings decay rate equals 20%, and the annual rate of participant attrition is 7% (i.e., 7% of residential customers move to new homes), the series will converge to 39,062 MWh. In other words, lifetime savings equal 39,062 MWh, with a suggested effective useful life of approximately 3.9 years:
Calculation of HER Program Cost-Effectiveness
In this section, we demonstrate the effect of assuming a multiyear measure life on HER program cost-effectiveness. For each year, we compare the program’s cost-effectiveness assuming a multiyear measure life to the cost-effectiveness assuming a one-year measure life.
To illustrate, consider a HER program with $600,000 of annual deployment costs. As a result of the energy reports, participants save 13,000 MWh in the first year. If the program is deployed for more than one year, participants increase their savings by 30% in the second year and by 5%
Lifetime Savings 1st Yr Savings 1st Yr Savings 1 1
First Year Savings
Effective Useful Life
HER Program Effective Useful LifeLifetime Savings
First Year Savings
39,06210,000
3�9 Years
15
in the third year.10 Savings from previous treatments decay at a constant rate of 20% per year. Participant attrition due to changes in residence is assumed to be 7% per year. The avoided cost of energy is assumed to be five cents per kWh, with no increase in cost over time. We also assume that deployment costs stay at $600,000 annually regardless of the treatment duration. Table 3 summarizes these assumptions.
Table 3. Hypothetical HER Program Assumptions
Model Input Assumption
Annual program savings (without participant attrition)
Year 1: 13,000 MWh Year 2: 16,900 MWh Year 3: 17,745 MWh
Annual deployment cost $600,000
Annual savings decay rate 20%
Avoided cost ($/kWh) 0.05
Discount rate 8%
Participant attrition rate 7%
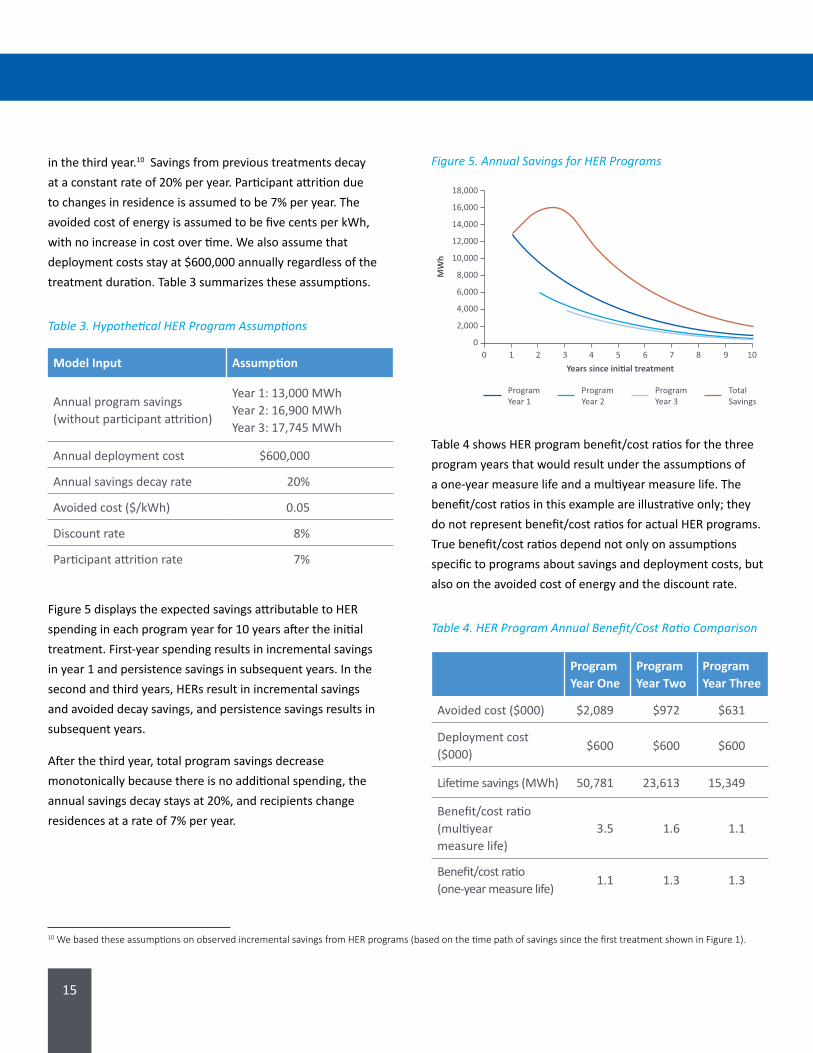
Figure 5 displays the expected savings attributable to HER spending in each program year for 10 years after the initial treatment. First-year spending results in incremental savings in year 1 and persistence savings in subsequent years. In the second and third years, HERs result in incremental savings and avoided decay savings, and persistence savings results in subsequent years.
After the third year, total program savings decrease monotonically because there is no additional spending, the annual savings decay stays at 20%, and recipients change residences at a rate of 7% per year.
Figure 5. Annual Savings for HER Programs
Years since ini�al treatment
MW
h
18,000
16,000
14,000
12,000
10,000
8,000
6,000
4,000
2,000
01 20 4 53 7 8 9 106
Program Year 1
Program Year 2
Program Year 3
Total Savings
Table 4 shows HER program benefit/cost ratios for the three program years that would result under the assumptions of a one-year measure life and a multiyear measure life. The benefit/cost ratios in this example are illustrative only; they do not represent benefit/cost ratios for actual HER programs. True benefit/cost ratios depend not only on assumptions specific to programs about savings and deployment costs, but also on the avoided cost of energy and the discount rate.
Table 4. HER Program Annual Benefit/Cost Ratio Comparison
Program Year One
Program Year Two
Program Year Three
Avoided cost ($000) $2,089 $972 $631
Deployment cost ($000)
$600 $600 $600
Lifetime savings (MWh) 50,781 23,613 15,349
Benefit/cost ratio (multiyear measure life)
3.5 1.6 1.1
Benefit/cost ratio (one-year measure life)
1.1 1.3 1.3
10 We based these assumptions on observed incremental savings from HER programs (based on the time path of savings since the first treatment shown in Figure 1)�

16
Table 4 shows benefit-cost ratios for annual program spending on a year-by-year basis. The first column in Table 4 shows the benefit/cost ratio of a one-year program. The second column shows the benefit/cost ratio for year 2 of a two-year program. For a program that runs for two years, it will be necessary to consult the benefit/cost ratios for both year 1 and year 2 (3.5 and 1.6). The same applies to a three-year program—the table shows the benefit/cost ratio for the third year of spending. The table does not show a combined benefit/cost ratio for all years of a two or three-year program.
HER spending in the first program year would result in first-year savings of 13,000 MWh and lifetime savings of approximately 50,800 MWh. These savings would yield a benefit/cost ratio of 3.5 assuming a multiyear measure life and a benefit/cost ratio of 1.1 assuming a one-year measure life. In the second program year, HER program spending would result in lifetime savings of approximately 23,600 MWh. This would yield a benefit/cost ratio of 1.6 with a multiyear measure life. Assumption of a one-year
measure life would yield a benefit/cost ratio of 1.3. In the third program year, HER program spending would result in lifetime savings of 15,350 MWh, yielding a benefit/cost ratio of 1.1 with a multiyear measure life and a benefit/cost ratio of 1.3 with a one-year measure life. A one-year measure life would yield a greater benefit/cost ratio because it credits all savings in the third program year to spending in that year, including some savings attributable to spending in the first and second years.
The important finding in Table 4 is that, in the first two years of the HER program, the benefit/cost ratio would be greater with a multiyear measure life than a one-year measure life, because a multi-year measure life accounts for savings persistence after treatment ends. In the third program year, the assumption of a one-year measure life results in a larger benefit/cost ratio because it incorrectly attributes all savings in year three to spending in that year, ignoring persistence of savings from the first and second years.
17
HER programs have become widespread, well-accepted means for utilities to achieve energy savings� As many utilities have operated these programs for three or more years, we assessed the current knowledge regarding long-run savings to determine whether standard approaches for estimating savings and program cost-effectiveness should be updated�
• Most jurisdictions assume HERs have a measure life of one year, thus neglecting post-treatment savings. By assuming a one-year measure life, this approach may reduce the amount of savings attributable to HERs and incorrectly lower program cost-effectiveness, which may lead utilities to make less-than-optimal investments in efficiency.
• During treatment, HERs produce two savings effects: the avoided decay of savings and additional (incremental) savings.
• Accounting for post-treatment savings will increase HER program lifetime savings and effective useful life. In the cost-effectiveness example, accounting for post-treatment savings improved program cost-effectiveness in the first and second program years. The effect of a multiyear measure life on lifetime savings and annual cost-effectiveness depends on the rate of the savings decay, avoided cost of energy, discount rate, and participant attrition rate.
CONCLUSIONS AND RECOMMENDATIONS
THIS WHITE PAPER ADDRESSED THREE PRIMARY QUESTIONS:1. How do HER program energy savings perform over time, and how does program design affect those savings?
2. What happens to energy savings when homes stop receiving energy reports? In particular, do savings decay and, if so, how fast? What effects result from continuing to send HERs?
3. How does persistence of HER savings after treatment affect program savings and cost-effectiveness?
To answer these questions, we reviewed saving estimates from dozens of independent impact evaluations and academic studies of HER programs, including a number of studies specifically examining post-treatment savings.
The following findings result from this review:
• HERs typically result in significant electricity savings. Our review of one implementer’s programs (Opower) revealed average electricity savings between 1.5% and 2.5% per year. Though average annual savings per treated home may be small, the total savings aggregated over a large number of program homes can be substantial.
• In-treatment savings, which occur while homes are receiving reports, increase during the first and second program years before leveling off in subsequent years.
• Growing evidence indicates that HERs continue to generate savings after homes stop receiving reports. Several studies show that savings decay gradually over time after treatment ends.
BASED ON THESE FINDINGS, WE OFFER THE FOLLOWING RECOMMENDATIONS:
Utilities should account for post-treatment savings when planning HER programs and estimating cost-effectiveness. Accounting for post-treatment savings will yield savings and cost-effectiveness estimates that more accurately reflect HER programs’ true benefits.
For purposes of program planning and estimating program cost-effectiveness, we propose that utilities apply a savings-decay rate of 20% per year. Cadmus’ analysis of post-treatment savings of Opower HER programs indicates that 20% per year is an appropriate savings-decay assumption.
In jurisdictions with annual EERS goals based on first-year savings, regulators should only count HER savings attributable to first-year spending. Attributable savings are the sum of incremental savings and avoided decay savings.
We recommend that utilities continue to evaluate HER program treatment and control group customers after the program ends to estimate post-treatment savings.
Utilities should conduct more research regarding post-treatment savings, as relatively few studies have estimated savings after homes stop receiving energy reports. More research is needed about the relationships between post-treatment savings and treatment duration, frequency, and time since last treatment.
Utilities should conduct more research about HER program design and delivery to optimize the programs. There may be opportunities to improve program delivery to maximize savings and cost-effectiveness.
18
19
REFERENCES
ADM Associates, Inc� Evaluation of Residential Incentive Program Portfolio: May 2012 through December 2012� July 2013�
Allcott, Hunt and S� Mullainathan� “Behavior and Energy Policy�” Science, Vol� 327� March 2010�
Allcott, Hunt, and Todd Rogers� “The Short-Run and Long-Run Effects of Behavioral Interventions: Experimental Evidence from Energy Conservation�” American Economic Review, 104(10): pp� 3003-37� October 2014�
Allcott, Hunt� “Social Norms and Energy Conservation�” Journal of Public Economics, Vol 95 (9-10), pp� 1,082–1,095� October 2011�
Ayres, Ian et al� “Evidence from Two Large Field Experiments that Peer Comparison Feedback can Reduce Residential Energy Usage�” NBER Working Paper� September 2009�
Cadmus� Home Energy Report Program Evaluation� Prepared for Ameren-Illinois� January 2012�
Cadmus� Impact Evaluation of PPL Electric Residential Behavior Program� In First Annual Report to the Pennsylvania Public Utility Commission for the Period June 2012 through May 2013, Program Year 4� January 2014�
Cadmus� Impact Evaluation of Vectren Residential Behavior Savings Program� In 2013 Core Plus Impact Evaluation� Prepared for Vectren Energy Delivery – Indiana� May 2014�
Cadmus� Impact Evaluation of Avista Residential Behavior Program� In Washington Electric Impact Evaluation Report� Prepared for Avista Corporation� May 2014�
Consortium for Energy Efficiency� Consortium for Energy Efficiency 2013 Behavior Program Summary� Last modified December 30, 2013� Accessed July 25, 2014� Available online: http://library�cee1�org/content/2013-behavior-program-summary-public-version
Costa, Dora L� and M�E� Kahn� “Energy Conservation ‘Nudges’ and Environmentalist Ideology: Evidence from a Randomized Residential Electricity Field Experiment�” NBER Working Paper� 2010� Available online: http://www�nber�org/papers/w15939
Davis, Matt� “Behavior and Energy Savings: Evidence from a Series of Experimental Interventions�” Environmental Defense Fund� May 2011�
DNV-GL� Home Energy Report Program: 2013 Impact Evaluation� Prepared for Puget Sound Energy� April 2014�
DNV KEMA� Review of PG&E Home Energy Reports Initiative Evaluation� August 2013�
DNV KEMA� SDG&E Home Energy Reports Program� August 2013�
DNV KEMA� National Grid Residential Building Practices and Demonstration Program Evaluation: Final Results� January 2014�
Evergreen Economics� Verification of Hawaii Energy 2011 Programs� December 2012�
Freeman, Sullivan & Company� Evaluation of Pacific Gas and Electric Company’s Home Energy Report Initiative for the 2010–2012 Program� April 2013�
Integral Analytics, Inc� with BuildingMetrics Incorporated and Sageview� Impact & Persistence Evaluation Report: Sacramento Municipal Utility District Home Energy Report Program� Prepared by May Wu� November 2012�
KEMA� Puget Sound Energy’s Home Energy Reports Program� October 2010�
KEMA� Energy & Sustainability. Puget Sound Energy’s Home Energy Reports Program: Three Year Impact, Behavioral, and Process Evaluation� April 2012�
KEMA� Puget Sound Energy’s Home Energy Reports: 2012 Impact Evaluation� March 2013�
Navigant Consulting� Energy Efficiency / Demand Response Plan: Plan Year 2 (6/1/2009-5/31/2010), Evaluation Report: Opower Pilot� Prepared by Randy Gunn� December 2010�
Navigant Consulting� Evaluation Report: Opower SMUD Pilot Year 2� Prepared by Kevin Cooney� February 2011�
Navigant Consulting� Evaluation Report: Home Energy Reports� Prepared by Randy Gunn� May 2012�
Navigant Consulting� Energy Efficiency / Demand Response Plan: Plan Year 4 (6/1/2011-5/31/2012), Evaluation Report: Home Energy Reports� Prepared by Randy Gunn� November 2012�
Navigant Consulting� Program Year 1 (2011-2012) EM&V Report for the Residential Energy Efficiency Benchmarking Program� December 2012�
Navigant Consulting� Home Energy Reports Program: Program Year 2012 Evaluation Report� May 2013�
NMR, Tetra Tech, and Hunt Allcott� Evaluation of the Year 1 CL&P Pilot Customer Behavior Program� March 2013�

20
Opinion Dynamics Corporation and Navigant Consulting� Massachusetts Cross-Cutting Behavioral Program Evaluation� Prepared by Anne Dougherty� June 2011�
Opinion Dynamics Corporation and Navigant Consulting� Massachusetts Three Year Cross-Cutting Behavioral Program Evaluation Integrated Report� Prepared by Anne Dougherty� July 2012�
Opinion Dynamics Corporation, Cadmus, Navigant, and Michaels Engineering� Impact and Process Evaluation of 2011 (PY4) Ameren Illinois Company Behavioral Modification Program� Prepared by Mary Sutter� October 2012�
Opinion Dynamics Corporation, Navigant Consulting, and Evergreen Economics� Massachusetts Cross-Cutting Behavioral Program Evaluation Integrated Report� June 2013�
Power System Engineering� Measurement and Verification Report of Opower Energy Efficiency Pilot Program� Prepared by Chris Ivanov� July 2010�
Power System Engineering� “Measurement and Verification Report of Lake Country’s Opower Energy Efficiency Pilot Program�” Prepared by Rich Macke� June 2010�
Quackenbush, John D� and Steve Bakkal� Readying Michigan to Make Good Energy Decisions: Energy Efficiency� November 2013�
Rosenberg, Mitchell, G�K� Agnew, and K� Gaffney� “Causality, Sustainability, and Scalability – What We Still Do and Do Not Know about the Impacts of Comparative Feedback Programs�” Paper prepared for 2013 International Energy Program Evaluation Conference, Chicago� 2013�
State and Local Energy Efficiency Action Network. Evaluation, Measurement, and Verification (EM&V) of Residential Behavior-Based Energy Efficiency Programs: Issues and Recommendations� Prepared by A� Todd, E� Stuart, S� Schiller, and C� Goldman, Lawrence Berkeley National Laboratory� 2012� Available online: http://behavioranalytics�lbl�gov
Summit Blue� Impact Evaluation of Opower SMUD Pilot Study� Prepared by Mary Klos� September 2009�
TecMarket Works� 2012 IPL Residential Peer Comparison EM&V Report� August 2013�
Todd, Annika, S� Schiller, and C� Goldman� Analysis of PSE’s Pilot Energy Conservation Project: Home Energy Reports� Lawrence Berkeley National Laboratory� October 2011�
Todd, Annika, M� Perry, B� Smith, M� Sullivan, P� Cappers, and C� Goldman� Insights from Smart Meters: Identifying Specific Actions, Behaviors and Characteristics that drive savings in Behavior-Based Programs� Lawrence Berkeley National Laboratory� 2014�
U�S� Department of Energy� Uniform Methods Project Behavior-Based Program Evaluation Protocols� Prepared by J� Stewart and A� Todd, Lawrence Berkeley National Laboratory� Forthcoming� Available online: http://www�nrel�gov/extranet/ump/pdfs/20140219_residential_behavior-based_protocol�pdf�

CADMUS HEADQUARTERS100 5th Avenue, Suite 100Waltham, MA 02451Phone: 617.673.7000Fax: 617.673.7001
www.cadmusgroup.com
CAD10312014 An Employee-Owned Company