Embed Size (px)
Citation preview
© BMA Inc. 2008. All rights reserved.
Month End Close
Lean Reporting and Control
© BMA Inc. 2008. All rights reserved.
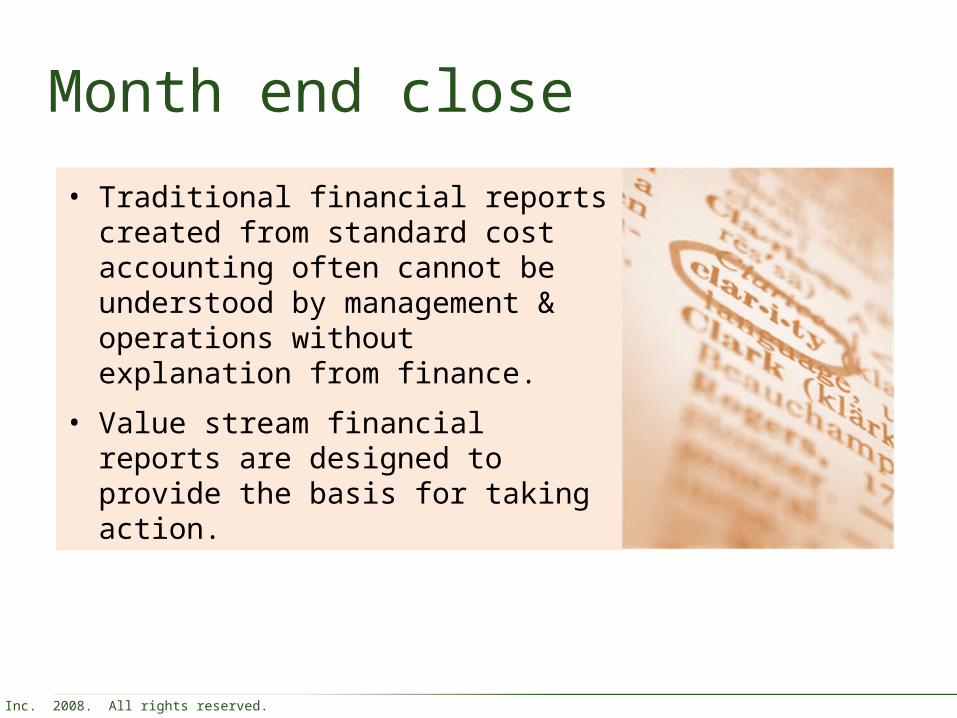
Month end close
• Traditional financial reports created from standard cost accounting often cannot be understood by management & operations without explanation from finance.
• Value stream financial reports are designed to provide the basis for taking action.
© BMA Inc. 2008. All rights reserved.
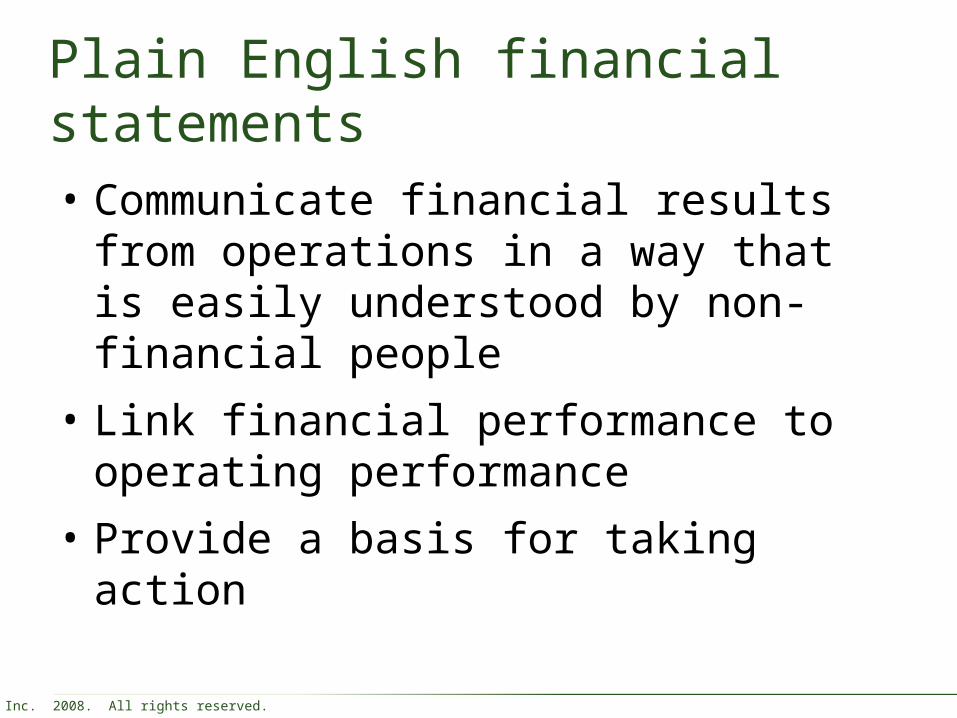
Plain English financial statements• Communicate financial results from
operations in a way that is easily understood by non-financial people
• Link financial performance to operating performance
• Provide a basis for taking action
© BMA Inc. 2008. All rights reserved.
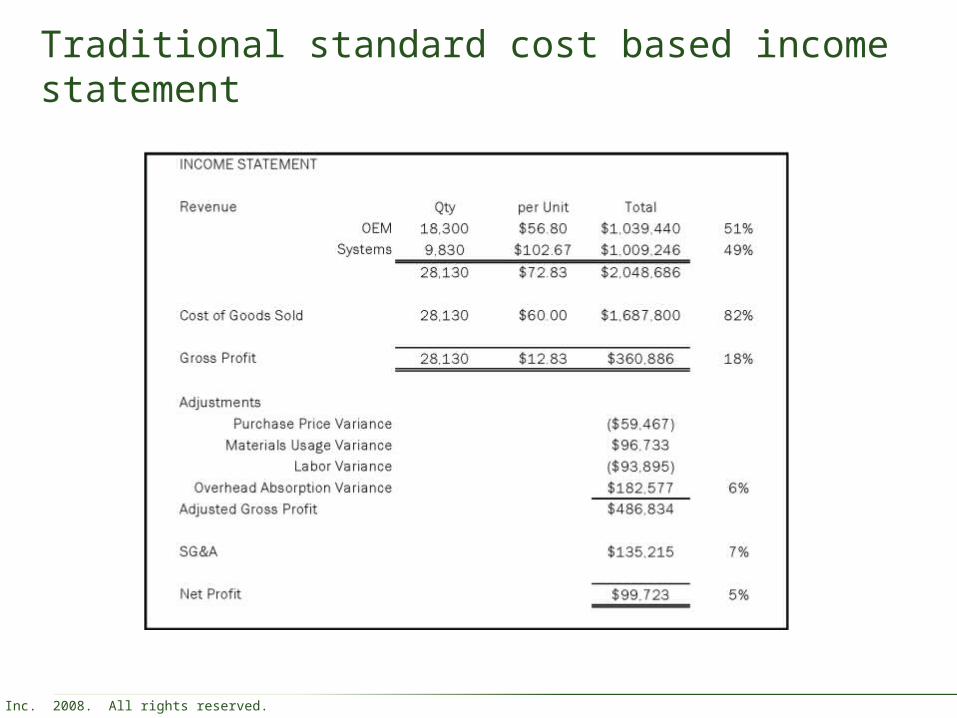
Traditional standard cost based income statement
© BMA Inc. 2008. All rights reserved.
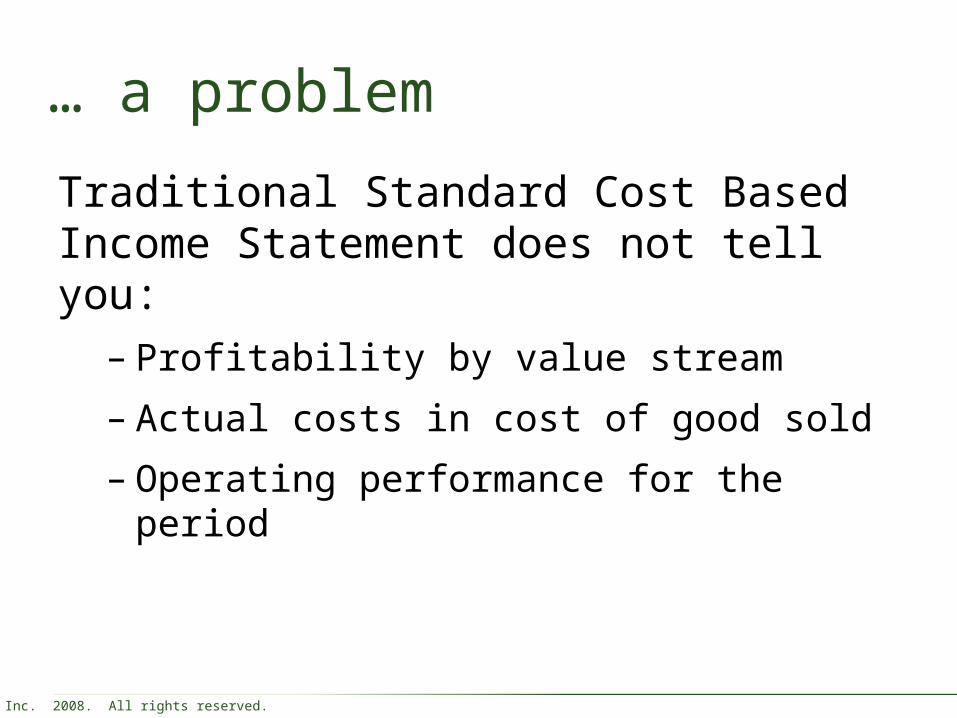
… a problem
Traditional Standard Cost Based Income Statement does not tell you:
– Profitability by value stream
– Actual costs in cost of good sold
– Operating performance for the period
© BMA Inc. 2008. All rights reserved.
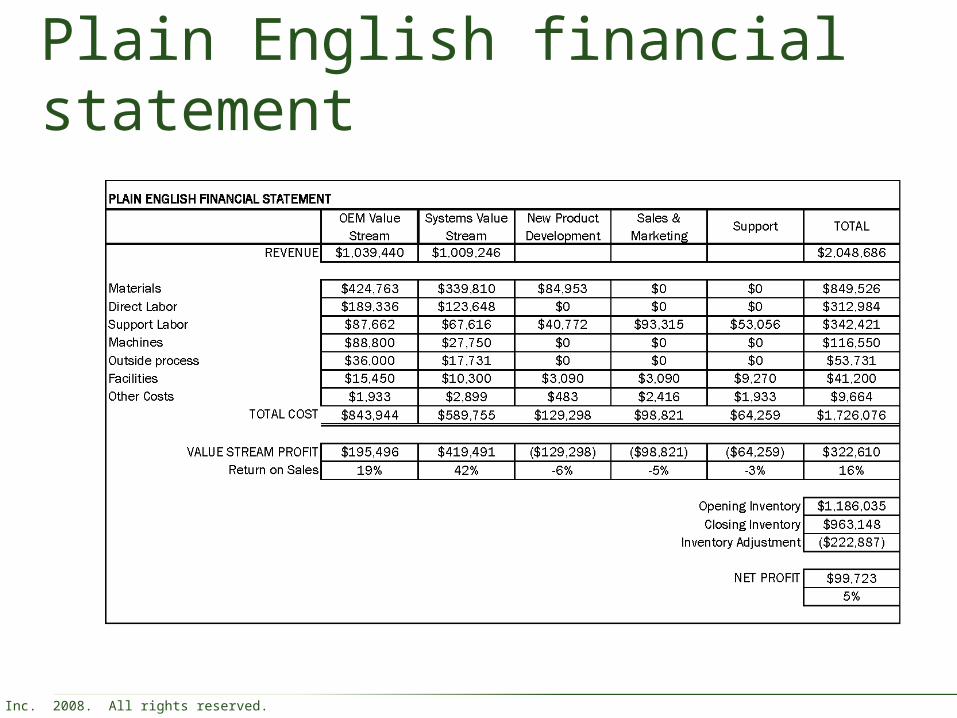
Plain English financial statement
© BMA Inc. 2008. All rights reserved.
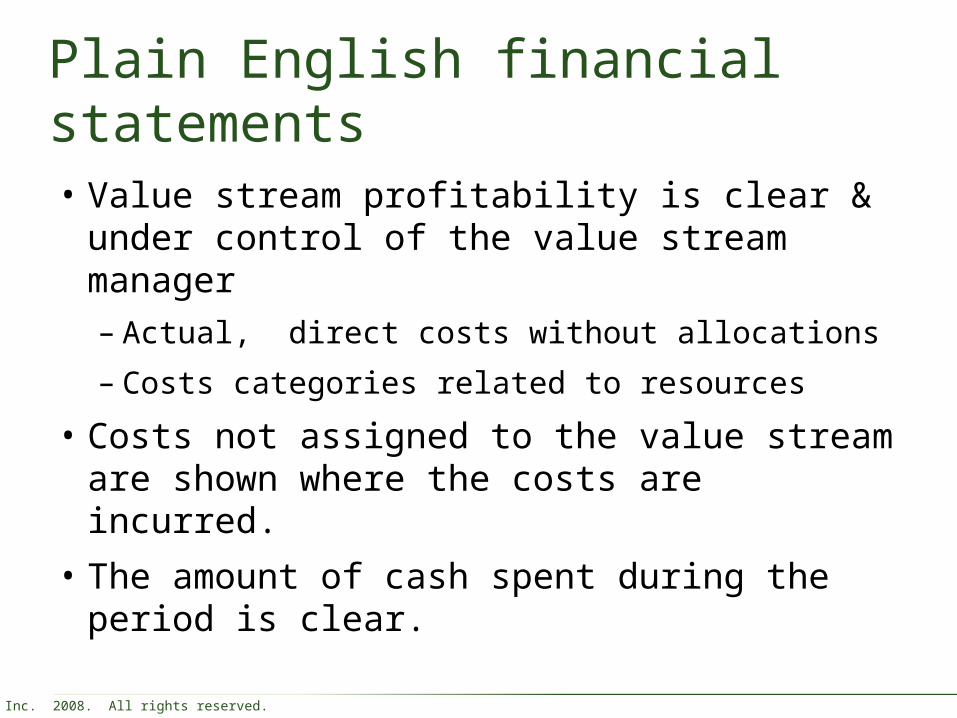
Plain English financial statements• Value stream profitability is clear &
under control of the value stream manager– Actual, direct costs without allocations
– Costs categories related to resources
• Costs not assigned to the value stream are shown where the costs are incurred.
• The amount of cash spent during the period is clear.
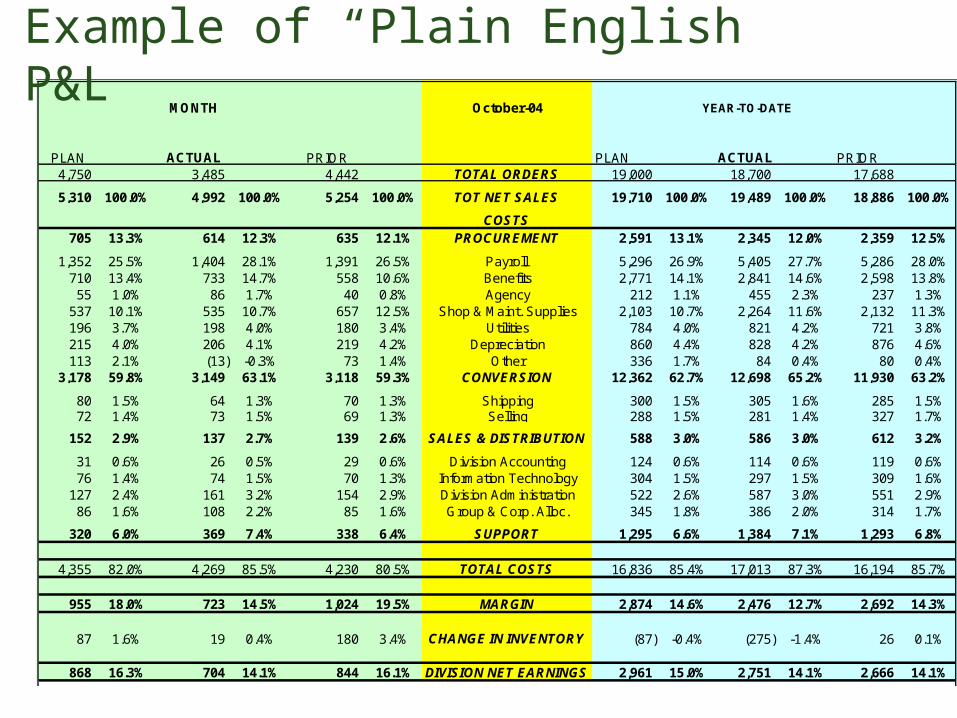
MONTH October-04
PLAN ACTUAL PRIOR PLAN ACTUAL PRIOR4,750 3,485 4,442 TOTAL ORDERS 19,000 18,700 17,688
5,310 100.0% 4,992 100.0% 5,254 100.0% TOT NET SALES 19,710 100.0% 19,489 100.0% 18,886 100.0%
COSTS705 13.3% 614 12.3% 635 12.1% PROCUREMENT 2,591 13.1% 2,345 12.0% 2,359 12.5%
1,352 25.5% 1,404 28.1% 1,391 26.5% Payroll 5,296 26.9% 5,405 27.7% 5,286 28.0%710 13.4% 733 14.7% 558 10.6% Benefits 2,771 14.1% 2,841 14.6% 2,598 13.8%
55 1.0% 86 1.7% 40 0.8% Agency 212 1.1% 455 2.3% 237 1.3%537 10.1% 535 10.7% 657 12.5% Shop & Maint. Supplies 2,103 10.7% 2,264 11.6% 2,132 11.3%196 3.7% 198 4.0% 180 3.4% Utilities 784 4.0% 821 4.2% 721 3.8%215 4.0% 206 4.1% 219 4.2% Depreciation 860 4.4% 828 4.2% 876 4.6%113 2.1% (13) -0.3% 73 1.4% Other 336 1.7% 84 0.4% 80 0.4%
3,178 59.8% 3,149 63.1% 3,118 59.3% CONVERSION 12,362 62.7% 12,698 65.2% 11,930 63.2%
80 1.5% 64 1.3% 70 1.3% Shipping 300 1.5% 305 1.6% 285 1.5%72 1.4% 73 1.5% 69 1.3% Selling 288 1.5% 281 1.4% 327 1.7%
152 2.9% 137 2.7% 139 2.6% SALES & DISTRIBUTION 588 3.0% 586 3.0% 612 3.2%
31 0.6% 26 0.5% 29 0.6% Division Accounting 124 0.6% 114 0.6% 119 0.6%76 1.4% 74 1.5% 70 1.3% Information Technology 304 1.5% 297 1.5% 309 1.6%
127 2.4% 161 3.2% 154 2.9% Division Administration 522 2.6% 587 3.0% 551 2.9%86 1.6% 108 2.2% 85 1.6% Group & Corp. Alloc. 345 1.8% 386 2.0% 314 1.7%
320 6.0% 369 7.4% 338 6.4% SUPPORT 1,295 6.6% 1,384 7.1% 1,293 6.8%
4,355 82.0% 4,269 85.5% 4,230 80.5% TOTAL COSTS 16,836 85.4% 17,013 87.3% 16,194 85.7%
955 18.0% 723 14.5% 1,024 19.5% MARGIN 2,874 14.6% 2,476 12.7% 2,692 14.3%
87 1.6% 19 0.4% 180 3.4% CHANGE IN INVENTORY (87) -0.4% (275) -1.4% 26 0.1%
868 16.3% 704 14.1% 844 16.1% DIVISION NET EARNINGS 2,961 15.0% 2,751 14.1% 2,666 14.1%
YEAR-TO-DATE
Example of “Plain English” P&L
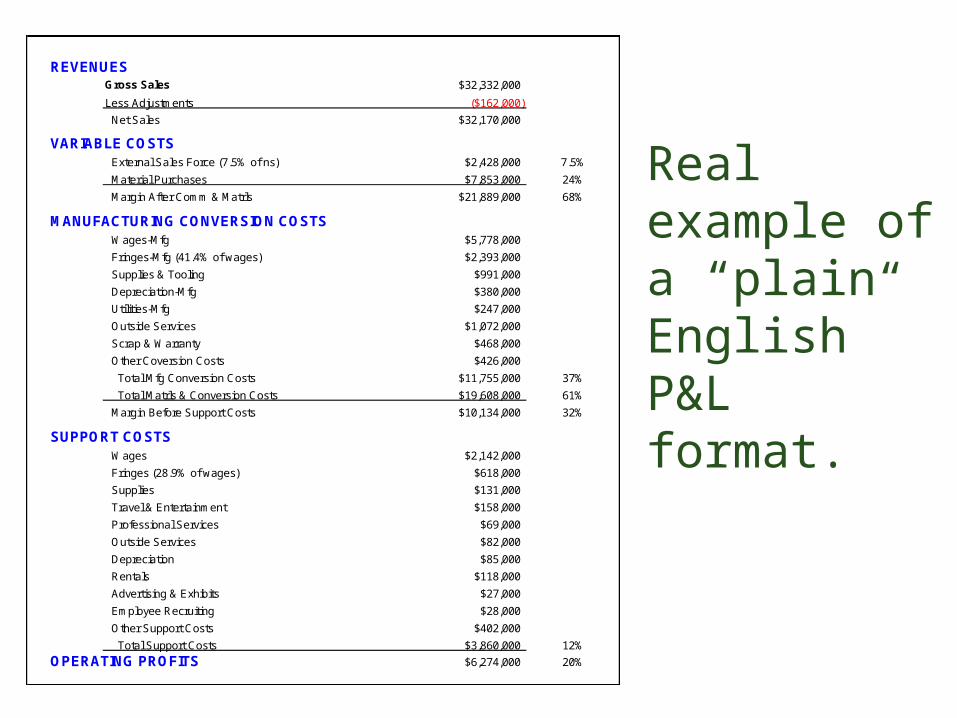
Real example of a “plain English” P&L format.
Gross Sales $32,332,000
Less Adjustments ($162,000)
Net Sales $32,170,000
External Sales Force (7.5% of ns) $2,428,000 7.5%
Material Purchases $7,853,000 24%
Margin After Comm & Matrls $21,889,000 68%
Wages-Mfg $5,778,000
Fringes-Mfg (41.4% of wages) $2,393,000
Supplies & Tooling $991,000
Depreciation-Mfg $380,000
Utilities-Mfg $247,000
Outside Services $1,072,000
Scrap & Warranty $468,000
Other Coversion Costs $426,000
Total Mfg Conversion Costs $11,755,000 37%
Total Matrls & Conversion Costs $19,608,000 61%
Margin Before Support Costs $10,134,000 32%
Wages $2,142,000
Fringes (28.9% of wages) $618,000
Supplies $131,000
Travel & Entertainment $158,000
Professional Services $69,000
Outside Services $82,000
Depreciation $85,000
Rentals $118,000
Advertising & Exhibits $27,000
Employee Recruiting $28,000
Other Support Costs $402,000
Total Support Costs $3,860,000 12%
$6,274,000 20%
SUPPORT COSTS
OPERATING PROFITS
REVENUES
VARIABLE COSTS
MANUFACTURING CONVERSION COSTS
© BMA Inc. 2008. All rights reserved.
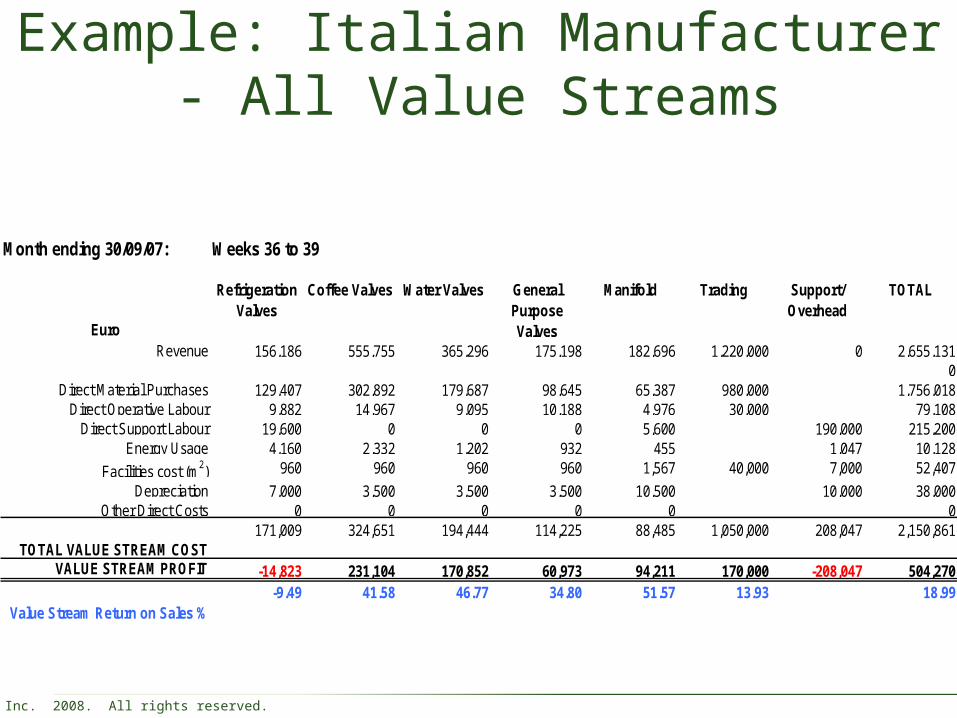
Example: Italian Manufacturer - All Value Streams
Month ending 30/09/07: Weeks 36 to 39
Euro
Refrigeration Valves
Coffee Valves Water Valves General Purpose Valves
Manifold Trading Support/ Overhead
TOTAL
Revenue 156,186 555,755 365,296 175,198 182,696 1,220,000 0 2,655,1310
Direct Material Purchases 129,407 302,892 179,687 98,645 65,387 980,000 1,756,018Direct Operative Labour 9,882 14,967 9,095 10,188 4,976 30,000 79,108
Direct Support Labour 19,600 0 0 0 5,600 190,000 215,200Energy Usage 4,160 2,332 1,202 932 455 1,047 10,128
Facilities cost (m2) 960 960 960 960 1,567 40,000 7,000 52,407
Depreciation 7,000 3,500 3,500 3,500 10,500 10,000 38,000Other Direct Costs 0 0 0 0 0 0
TOTAL VALUE STREAM COST171,009 324,651 194,444 114,225 88,485 1,050,000 208,047 2,150,861
VALUE STREAM PROFIT -14,823 231,104 170,852 60,973 94,211 170,000 -208,047 504,270
Value Stream Return on Sales %-9.49 41.58 46.77 34.80 51.57 13.93 18.99
© BMA Inc. 2008. All rights reserved.
Cash-based financial reporting
• The reduced time that products spend in the value stream and the stability of lean processes make cash-based financial reporting possible.
• The preparation of financial statements is simplified because the financial effects of inventory is reduced.
• Cash basis value stream profit must be adjusted for changes in inventory balances to arrive at GAAP profit.
© BMA Inc. 2008. All rights reserved.
Lean Accounting and GAAP
© BMA Inc. 2008. All rights reserved.
The Purpose of Lean Accounting Statements is Different from GAAP
• Lean Accounting statements are tailored to managing a lean value stream—for internal purposes
• GAAP statements are tailored for presentation of financial statements for shareholders and lenders to the company—for external purposes
© BMA Inc. 2008. All rights reserved.
Lean Accounting Statements Depict Internally Generated Working Capital and/or Cash Flow from Value Stream Operations
• Revenues are recorded when an item is shipped
• Expenses are shown when the commitment to spend is incurred as when---
– materials are received from a supplier
– Labor is incurred
– Depreciation is accrued
– Other expenses are incurred
© BMA Inc. 2008. All rights reserved.
GAPP Statements Depict the Profit of the Company for the Period
• Revenues are recorded generally when an item is shipped
• Expenses are recorded to match the timing of the revenue recognition for items shipped
– Costs of the items shipped—labor materials and other costs included in “overhead”
– Costs of items produced but not shipped remain in inventory
– Costs are matched against revenue generally on the basis of a convention such as First in First Out
© BMA Inc. 2008. All rights reserved.
Lean Accounting Statements Must be Adjusted to Conform to GAAP
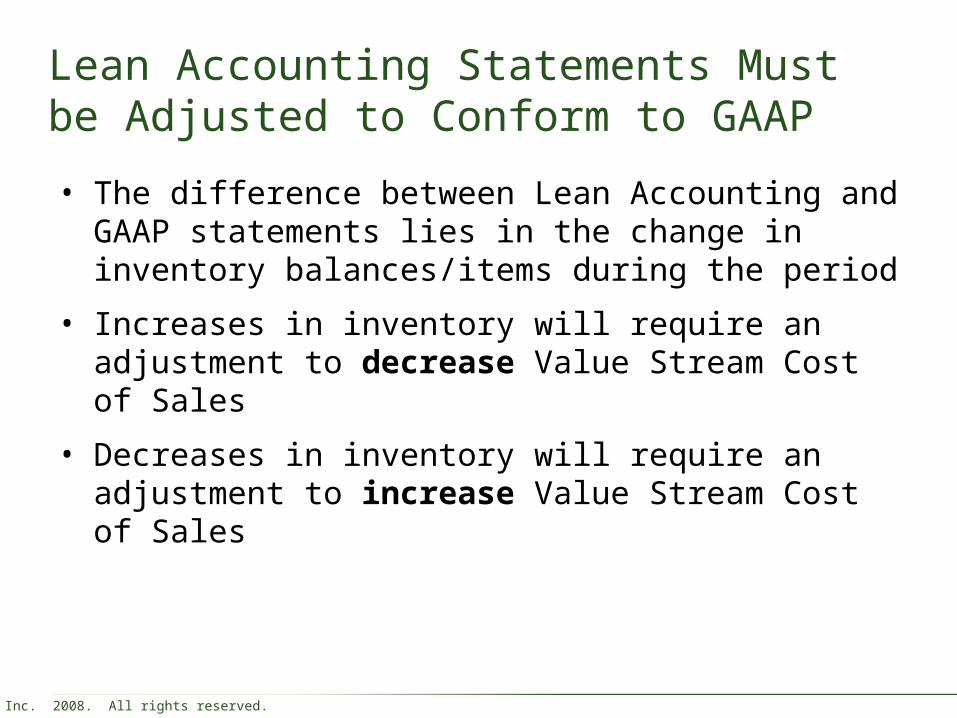
• The difference between Lean Accounting and GAAP statements lies in the change in inventory balances/items during the period
• Increases in inventory will require an adjustment to decrease Value Stream Cost of Sales
• Decreases in inventory will require an adjustment to increase Value Stream Cost of Sales
© BMA Inc. 2008. All rights reserved.
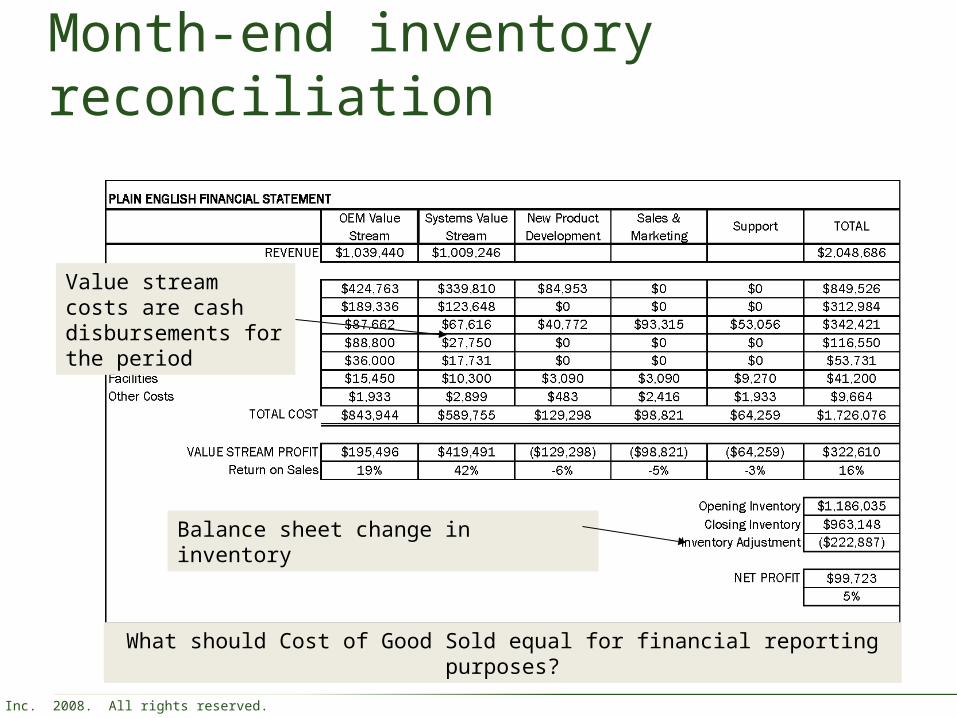
Month-end inventory reconciliation
Balance sheet change in inventory
Value stream costs are cash disbursements for the period
What should Cost of Good Sold equal for financial reporting purposes?
© BMA Inc. 2008. All rights reserved.
Month-End Inventory Reconciliation
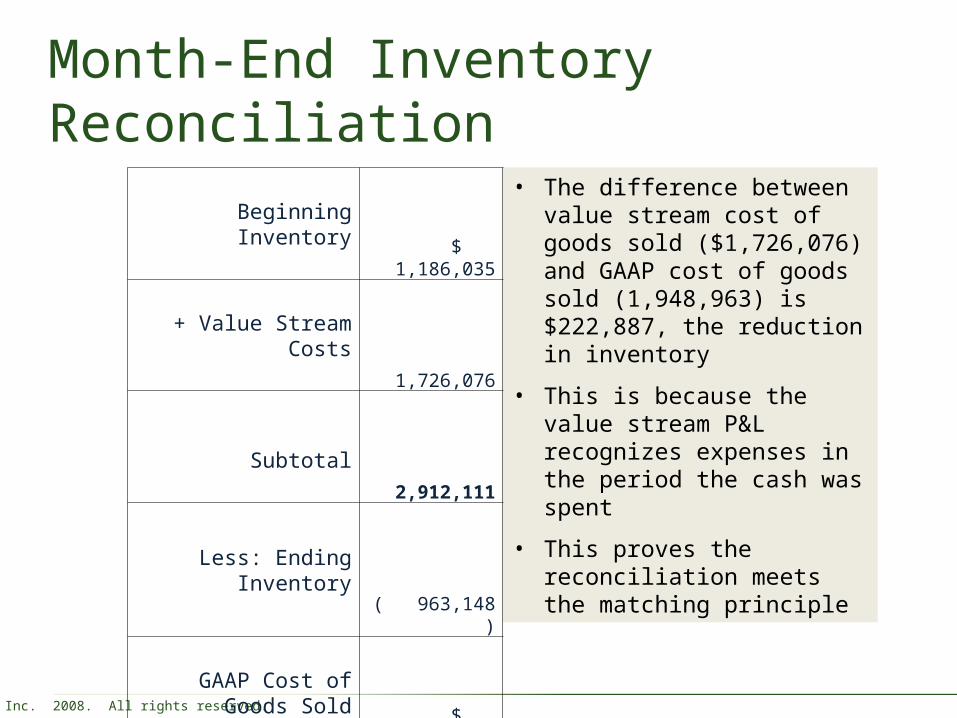
• The difference between value stream cost of goods sold ($1,726,076) and GAAP cost of goods sold (1,948,963) is $222,887, the reduction in inventory
• This is because the value stream P&L recognizes expenses in the period the cash was spent
• This proves the reconciliation meets the matching principle
Beginning Inventory
$ 1,186,035
+ Value Stream Costs
1,726,076
Subtotal 2,912,111
Less: Ending Inventory
(
963,148)
GAAP Cost of Goods Sold
$
1,948,963
© BMA Inc. 2008. All rights reserved.
Month-End Close
The Value Stream Income Statement :
• Fully complies with GAAP and accrual-based external reporting,
• Provides clear, timely, actionable information for managers to manage operations and make business decisions.