Embed Size (px)
Citation preview
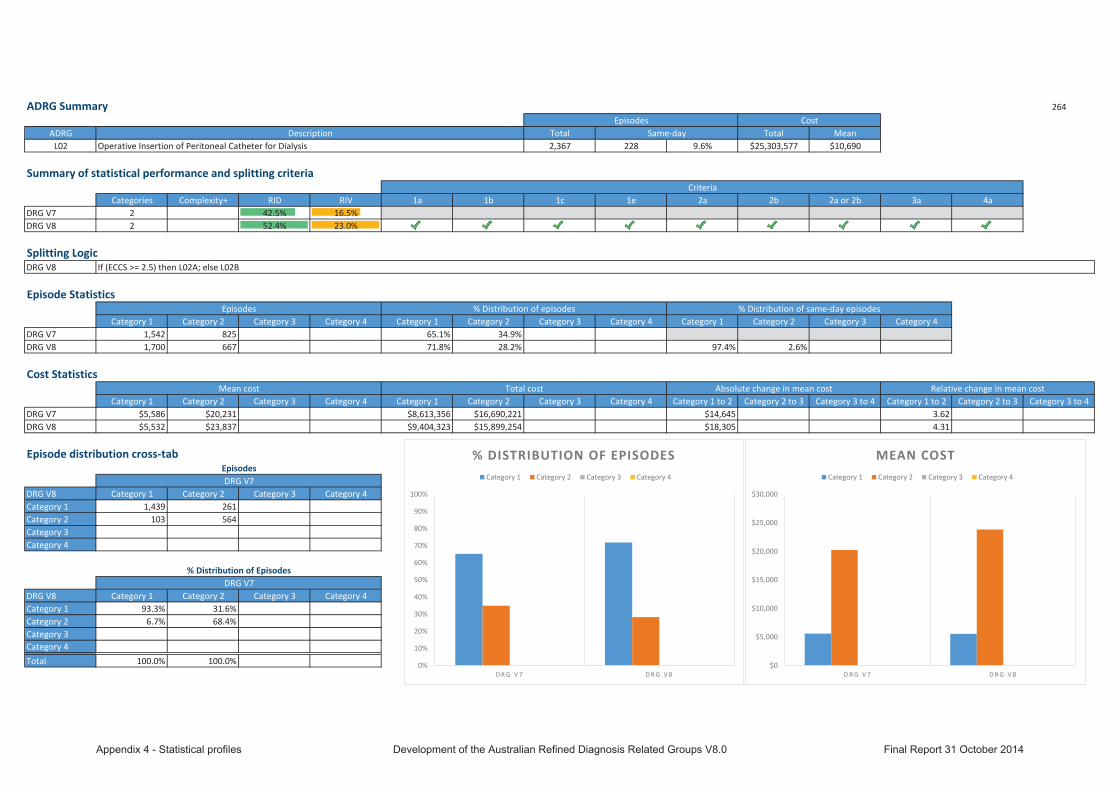
ADRG Summary 264
ADRG Total Total MeanL02 2,367 228 9.6% $25,303,577 $10,690
Summary of statistical performance and splitting criteria
Categories Complexity+ RID RIV 1a 1b 1c 1e 2a 2b 2a or 2b 3a 4aDRG V7 2 42.5% 16.5%DRG V8 2 52.4% 23.0%
Splitting LogicDRG V8
Episode Statistics
Category 1 Category 2 Category 3 Category 4 Category 1 Category 2 Category 3 Category 4 Category 1 Category 2 Category 3 Category 4DRG V7 1,542 825 #N/A #N/A 65.1% 34.9% #N/A #N/ADRG V8 1,700 667 #N/A #N/A 71.8% 28.2% #N/A #N/A 97.4% 2.6% #N/A #N/A
Cost Statistics
Category 1 Category 2 Category 3 Category 4 Category 1 Category 2 Category 3 Category 4 Category 1 to 2 Category 2 to 3 Category 3 to 4 Category 1 to 2 Category 2 to 3 Category 3 to 4DRG V7 $5,586 $20,231 #N/A #N/A $8,613,356 $16,690,221 #N/A #N/A $14,645 #N/A #N/A 3.62 #N/A #N/ADRG V8 $5,532 $23,837 #N/A #N/A $9,404,323 $15,899,254 #N/A #N/A $18,305 #N/A #N/A 4.31 #N/A #N/A
Episode distribution cross-tab
DRG V8 Category 1 Category 2 Category 3 Category 4Category 1 1,439 261Category 2 103 564Category 3Category 4
DRG V8 Category 1 Category 2 Category 3 Category 4Category 1 93.3% 31.6%Category 2 6.7% 68.4%Category 3Category 4Total 100.0% 100.0%
DRG V7
DRG V7
Episodes
% Distribution of Episodes
Episodes % Distribution of episodes % Distribution of same-day episodes
Mean cost Total cost Absolute change in mean cost Relative change in mean cost
If (ECCS >= 2.5) then L02A; else L02B
Episodes CostDescription Same-day
Operative Insertion of Peritoneal Catheter for Dialysis
Criteria
$0
$5,000
$10,000
$15,000
$20,000
$25,000
$30,000
D R G V 7 D R G V 8
MEAN COSTCategory 1 Category 2 Category 3 Category 4
0%
10%
20%
30%
40%
50%
60%
70%
80%
90%
100%
D R G V 7 D R G V 8
% DISTRIBUTION OF EPISODESCategory 1 Category 2 Category 3 Category 4
Appendix 4 - Statistical profiles Development of the Australian Refined Diagnosis Related Groups V8.0 Final Report 31 October 2014
ADRG Summary 265
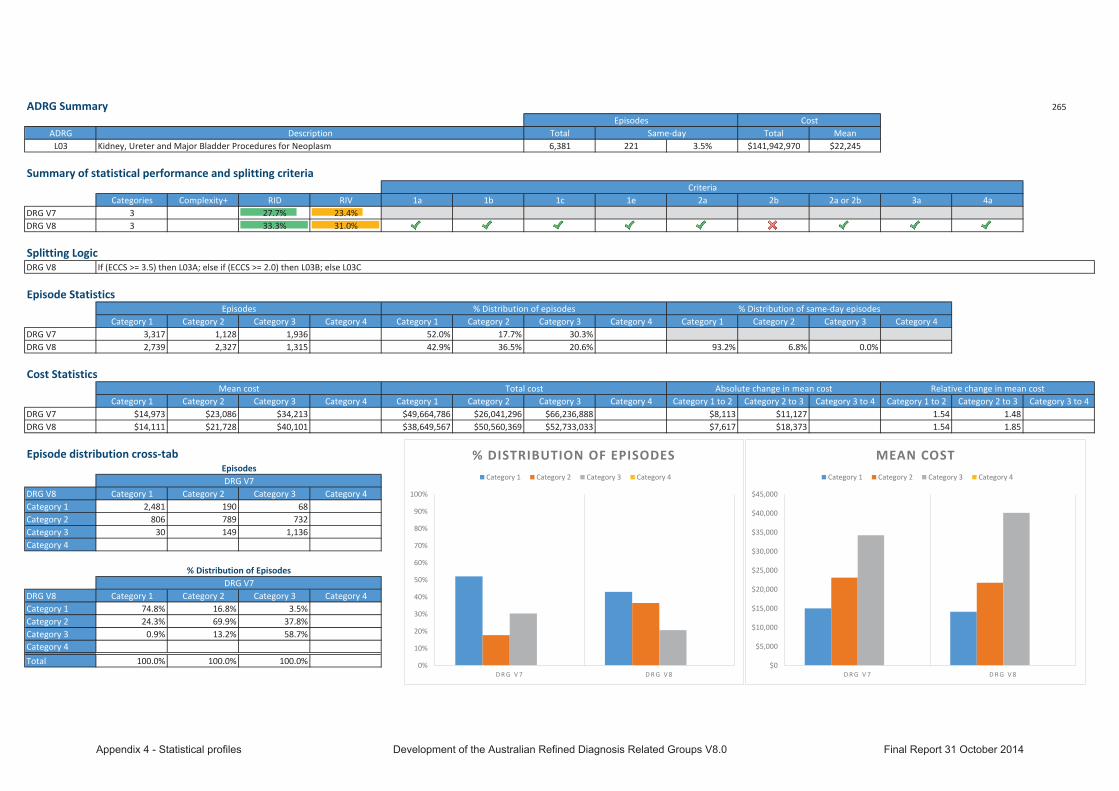
ADRG Total Total MeanL03 6,381 221 3.5% $141,942,970 $22,245
Summary of statistical performance and splitting criteria
Categories Complexity+ RID RIV 1a 1b 1c 1e 2a 2b 2a or 2b 3a 4aDRG V7 3 27.7% 23.4%DRG V8 3 33.3% 31.0%
Splitting LogicDRG V8
Episode Statistics
Category 1 Category 2 Category 3 Category 4 Category 1 Category 2 Category 3 Category 4 Category 1 Category 2 Category 3 Category 4DRG V7 3,317 1,128 1,936 #N/A 52.0% 17.7% 30.3% #N/ADRG V8 2,739 2,327 1,315 #N/A 42.9% 36.5% 20.6% #N/A 93.2% 6.8% 0.0% #N/A
Cost Statistics
Category 1 Category 2 Category 3 Category 4 Category 1 Category 2 Category 3 Category 4 Category 1 to 2 Category 2 to 3 Category 3 to 4 Category 1 to 2 Category 2 to 3 Category 3 to 4DRG V7 $14,973 $23,086 $34,213 #N/A $49,664,786 $26,041,296 $66,236,888 #N/A $8,113 $11,127 #N/A 1.54 1.48 #N/ADRG V8 $14,111 $21,728 $40,101 #N/A $38,649,567 $50,560,369 $52,733,033 #N/A $7,617 $18,373 #N/A 1.54 1.85 #N/A
Episode distribution cross-tab
DRG V8 Category 1 Category 2 Category 3 Category 4Category 1 2,481 190 68Category 2 806 789 732Category 3 30 149 1,136Category 4
DRG V8 Category 1 Category 2 Category 3 Category 4Category 1 74.8% 16.8% 3.5%Category 2 24.3% 69.9% 37.8%Category 3 0.9% 13.2% 58.7%Category 4Total 100.0% 100.0% 100.0%
DRG V7
DRG V7
Episodes
% Distribution of Episodes
Episodes % Distribution of episodes % Distribution of same-day episodes
Mean cost Total cost Absolute change in mean cost Relative change in mean cost
If (ECCS >= 3.5) then L03A; else if (ECCS >= 2.0) then L03B; else L03C
Episodes CostDescription Same-day
Kidney, Ureter and Major Bladder Procedures for Neoplasm
Criteria
$0
$5,000
$10,000
$15,000
$20,000
$25,000
$30,000
$35,000
$40,000
$45,000
D R G V 7 D R G V 8
MEAN COSTCategory 1 Category 2 Category 3 Category 4
0%
10%
20%
30%
40%
50%
60%
70%
80%
90%
100%
D R G V 7 D R G V 8
% DISTRIBUTION OF EPISODESCategory 1 Category 2 Category 3 Category 4
Appendix 4 - Statistical profiles Development of the Australian Refined Diagnosis Related Groups V8.0 Final Report 31 October 2014
ADRG Summary 266
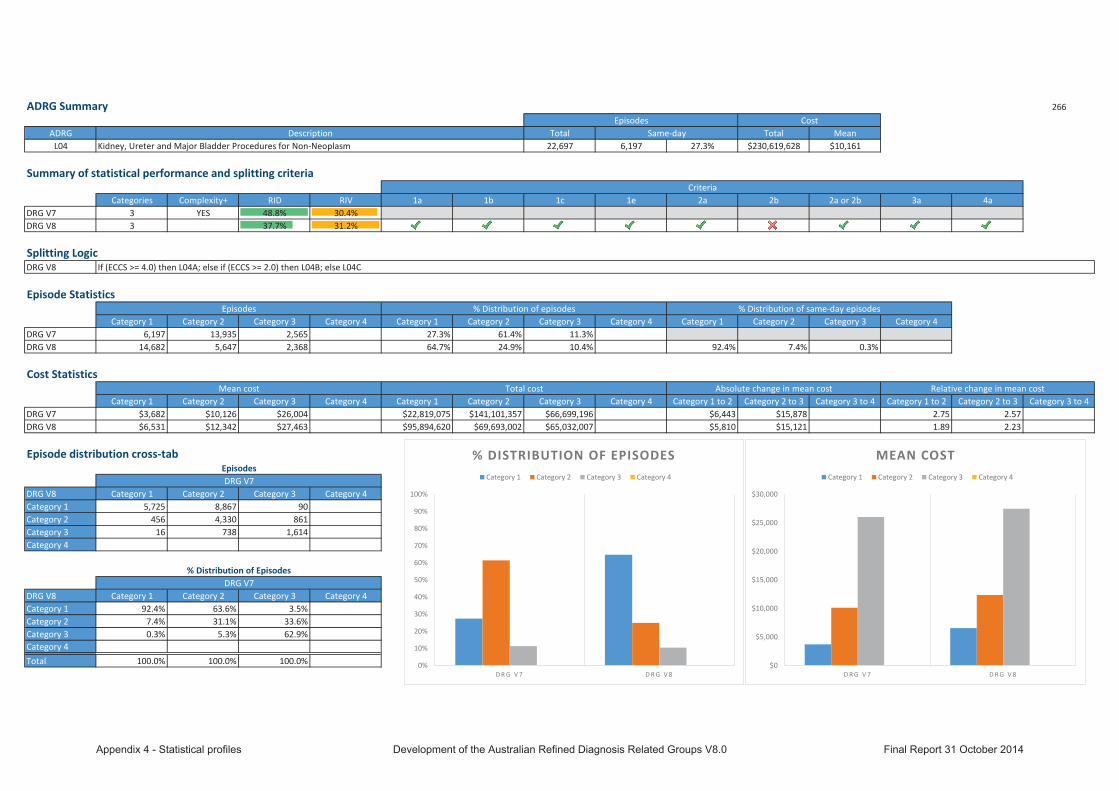
ADRG Total Total MeanL04 22,697 6,197 27.3% $230,619,628 $10,161
Summary of statistical performance and splitting criteria
Categories Complexity+ RID RIV 1a 1b 1c 1e 2a 2b 2a or 2b 3a 4aDRG V7 3 YES 48.8% 30.4%DRG V8 3 37.7% 31.2%
Splitting LogicDRG V8
Episode Statistics
Category 1 Category 2 Category 3 Category 4 Category 1 Category 2 Category 3 Category 4 Category 1 Category 2 Category 3 Category 4DRG V7 6,197 13,935 2,565 #N/A 27.3% 61.4% 11.3% #N/ADRG V8 14,682 5,647 2,368 #N/A 64.7% 24.9% 10.4% #N/A 92.4% 7.4% 0.3% #N/A
Cost Statistics
Category 1 Category 2 Category 3 Category 4 Category 1 Category 2 Category 3 Category 4 Category 1 to 2 Category 2 to 3 Category 3 to 4 Category 1 to 2 Category 2 to 3 Category 3 to 4DRG V7 $3,682 $10,126 $26,004 #N/A $22,819,075 $141,101,357 $66,699,196 #N/A $6,443 $15,878 #N/A 2.75 2.57 #N/ADRG V8 $6,531 $12,342 $27,463 #N/A $95,894,620 $69,693,002 $65,032,007 #N/A $5,810 $15,121 #N/A 1.89 2.23 #N/A
Episode distribution cross-tab
DRG V8 Category 1 Category 2 Category 3 Category 4Category 1 5,725 8,867 90Category 2 456 4,330 861Category 3 16 738 1,614Category 4
DRG V8 Category 1 Category 2 Category 3 Category 4Category 1 92.4% 63.6% 3.5%Category 2 7.4% 31.1% 33.6%Category 3 0.3% 5.3% 62.9%Category 4Total 100.0% 100.0% 100.0%
DRG V7
DRG V7
Episodes
% Distribution of Episodes
Episodes % Distribution of episodes % Distribution of same-day episodes
Mean cost Total cost Absolute change in mean cost Relative change in mean cost
If (ECCS >= 4.0) then L04A; else if (ECCS >= 2.0) then L04B; else L04C
Episodes CostDescription Same-day
Kidney, Ureter and Major Bladder Procedures for Non-Neoplasm
Criteria
$0
$5,000
$10,000
$15,000
$20,000
$25,000
$30,000
D R G V 7 D R G V 8
MEAN COSTCategory 1 Category 2 Category 3 Category 4
0%
10%
20%
30%
40%
50%
60%
70%
80%
90%
100%
D R G V 7 D R G V 8
% DISTRIBUTION OF EPISODESCategory 1 Category 2 Category 3 Category 4
Appendix 4 - Statistical profiles Development of the Australian Refined Diagnosis Related Groups V8.0 Final Report 31 October 2014
ADRG Summary 267
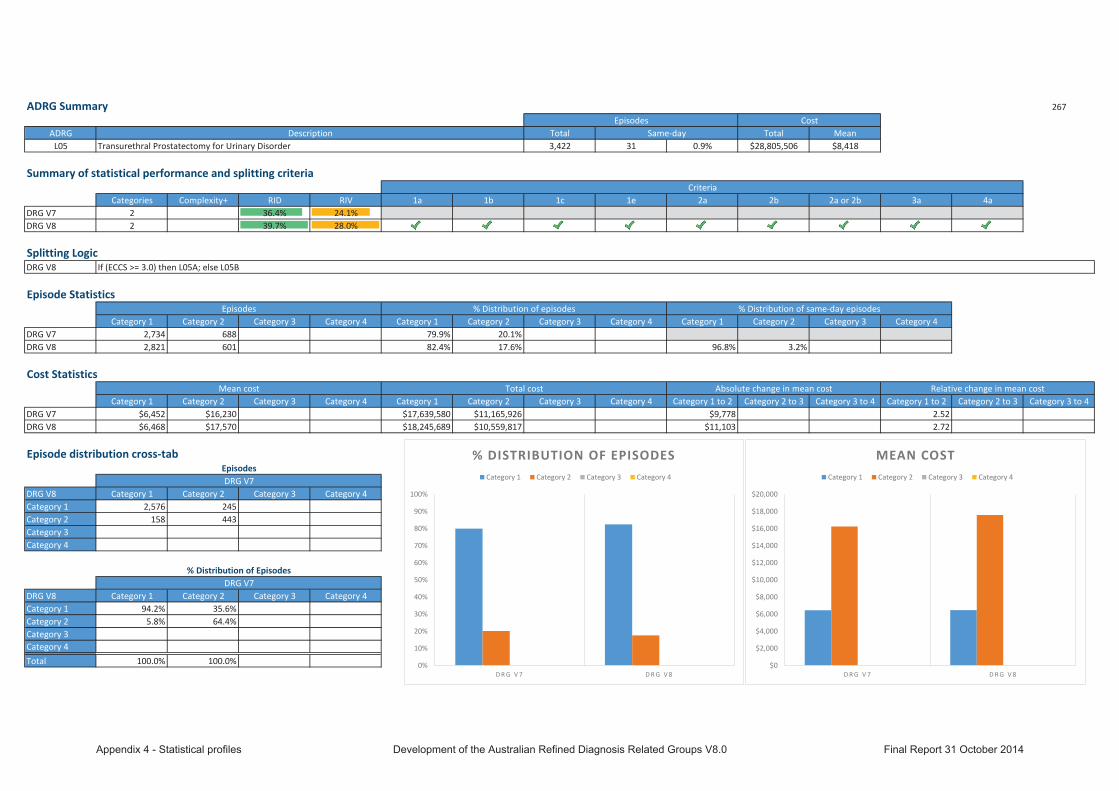
ADRG Total Total MeanL05 3,422 31 0.9% $28,805,506 $8,418
Summary of statistical performance and splitting criteria
Categories Complexity+ RID RIV 1a 1b 1c 1e 2a 2b 2a or 2b 3a 4aDRG V7 2 36.4% 24.1%DRG V8 2 39.7% 28.0%
Splitting LogicDRG V8
Episode Statistics
Category 1 Category 2 Category 3 Category 4 Category 1 Category 2 Category 3 Category 4 Category 1 Category 2 Category 3 Category 4DRG V7 2,734 688 #N/A #N/A 79.9% 20.1% #N/A #N/ADRG V8 2,821 601 #N/A #N/A 82.4% 17.6% #N/A #N/A 96.8% 3.2% #N/A #N/A
Cost Statistics
Category 1 Category 2 Category 3 Category 4 Category 1 Category 2 Category 3 Category 4 Category 1 to 2 Category 2 to 3 Category 3 to 4 Category 1 to 2 Category 2 to 3 Category 3 to 4DRG V7 $6,452 $16,230 #N/A #N/A $17,639,580 $11,165,926 #N/A #N/A $9,778 #N/A #N/A 2.52 #N/A #N/ADRG V8 $6,468 $17,570 #N/A #N/A $18,245,689 $10,559,817 #N/A #N/A $11,103 #N/A #N/A 2.72 #N/A #N/A
Episode distribution cross-tab
DRG V8 Category 1 Category 2 Category 3 Category 4Category 1 2,576 245Category 2 158 443Category 3Category 4
DRG V8 Category 1 Category 2 Category 3 Category 4Category 1 94.2% 35.6%Category 2 5.8% 64.4%Category 3Category 4Total 100.0% 100.0%
DRG V7
DRG V7
Episodes
% Distribution of Episodes
Episodes % Distribution of episodes % Distribution of same-day episodes
Mean cost Total cost Absolute change in mean cost Relative change in mean cost
If (ECCS >= 3.0) then L05A; else L05B
Episodes CostDescription Same-day
Transurethral Prostatectomy for Urinary Disorder
Criteria
$0
$2,000
$4,000
$6,000
$8,000
$10,000
$12,000
$14,000
$16,000
$18,000
$20,000
D R G V 7 D R G V 8
MEAN COSTCategory 1 Category 2 Category 3 Category 4
0%
10%
20%
30%
40%
50%
60%
70%
80%
90%
100%
D R G V 7 D R G V 8
% DISTRIBUTION OF EPISODESCategory 1 Category 2 Category 3 Category 4
Appendix 4 - Statistical profiles Development of the Australian Refined Diagnosis Related Groups V8.0 Final Report 31 October 2014
ADRG Summary 268
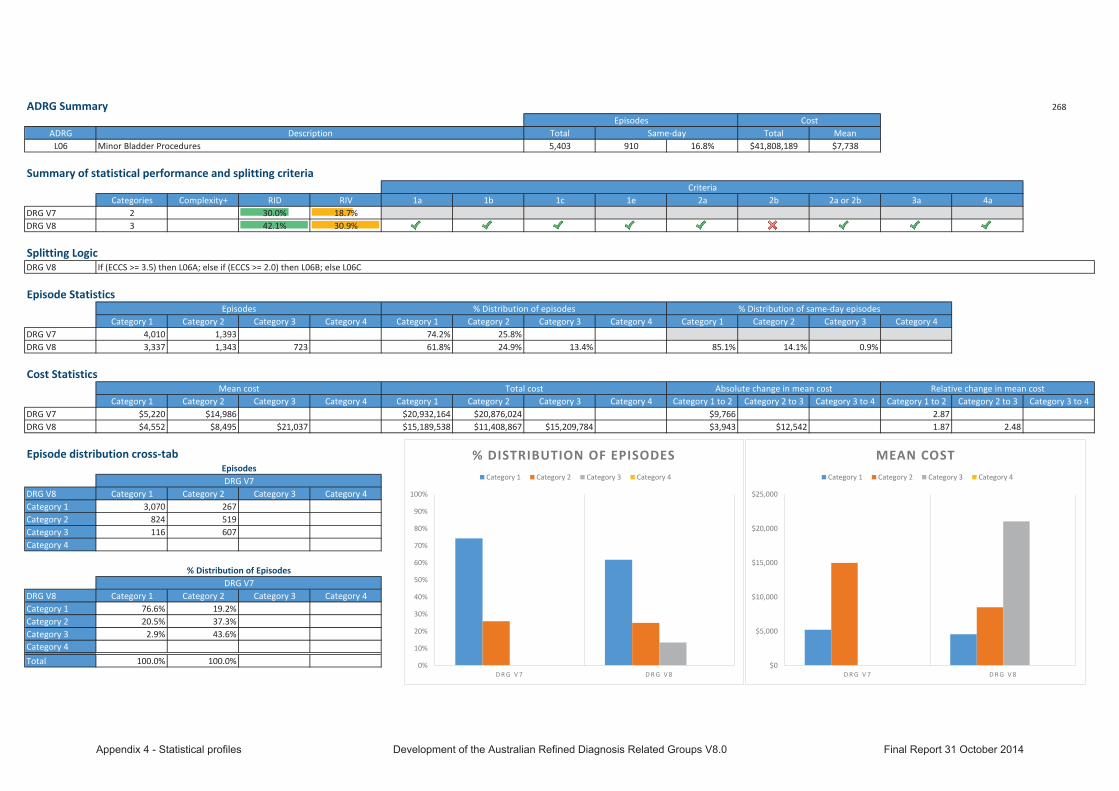
ADRG Total Total MeanL06 5,403 910 16.8% $41,808,189 $7,738
Summary of statistical performance and splitting criteria
Categories Complexity+ RID RIV 1a 1b 1c 1e 2a 2b 2a or 2b 3a 4aDRG V7 2 30.0% 18.7%DRG V8 3 42.1% 30.9%
Splitting LogicDRG V8
Episode Statistics
Category 1 Category 2 Category 3 Category 4 Category 1 Category 2 Category 3 Category 4 Category 1 Category 2 Category 3 Category 4DRG V7 4,010 1,393 #N/A #N/A 74.2% 25.8% #N/A #N/ADRG V8 3,337 1,343 723 #N/A 61.8% 24.9% 13.4% #N/A 85.1% 14.1% 0.9% #N/A
Cost Statistics
Category 1 Category 2 Category 3 Category 4 Category 1 Category 2 Category 3 Category 4 Category 1 to 2 Category 2 to 3 Category 3 to 4 Category 1 to 2 Category 2 to 3 Category 3 to 4DRG V7 $5,220 $14,986 #N/A #N/A $20,932,164 $20,876,024 #N/A #N/A $9,766 #N/A #N/A 2.87 #N/A #N/ADRG V8 $4,552 $8,495 $21,037 #N/A $15,189,538 $11,408,867 $15,209,784 #N/A $3,943 $12,542 #N/A 1.87 2.48 #N/A
Episode distribution cross-tab
DRG V8 Category 1 Category 2 Category 3 Category 4Category 1 3,070 267Category 2 824 519Category 3 116 607Category 4
DRG V8 Category 1 Category 2 Category 3 Category 4Category 1 76.6% 19.2%Category 2 20.5% 37.3%Category 3 2.9% 43.6%Category 4Total 100.0% 100.0%
DRG V7
DRG V7
Episodes
% Distribution of Episodes
Episodes % Distribution of episodes % Distribution of same-day episodes
Mean cost Total cost Absolute change in mean cost Relative change in mean cost
If (ECCS >= 3.5) then L06A; else if (ECCS >= 2.0) then L06B; else L06C
Episodes CostDescription Same-day
Minor Bladder Procedures
Criteria
$0
$5,000
$10,000
$15,000
$20,000
$25,000
D R G V 7 D R G V 8
MEAN COSTCategory 1 Category 2 Category 3 Category 4
0%
10%
20%
30%
40%
50%
60%
70%
80%
90%
100%
D R G V 7 D R G V 8
% DISTRIBUTION OF EPISODESCategory 1 Category 2 Category 3 Category 4
Appendix 4 - Statistical profiles Development of the Australian Refined Diagnosis Related Groups V8.0 Final Report 31 October 2014
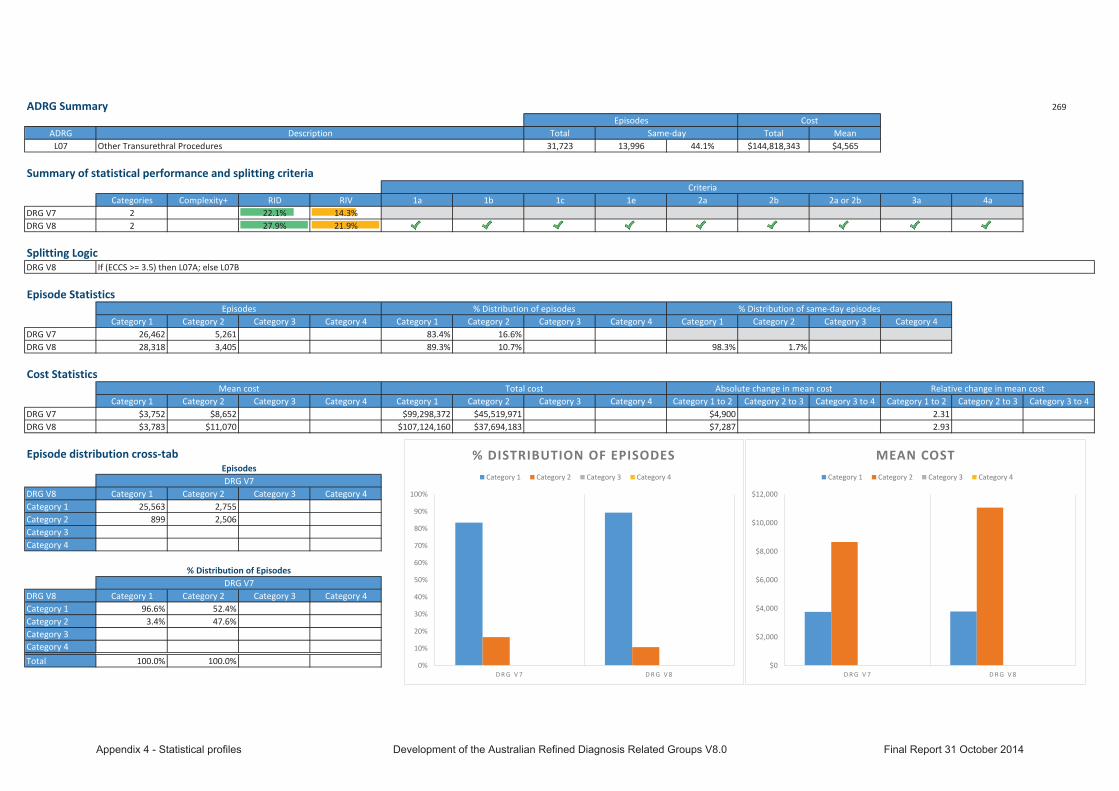
ADRG Summary 269
ADRG Total Total MeanL07 31,723 13,996 44.1% $144,818,343 $4,565
Summary of statistical performance and splitting criteria
Categories Complexity+ RID RIV 1a 1b 1c 1e 2a 2b 2a or 2b 3a 4aDRG V7 2 22.1% 14.3%DRG V8 2 27.9% 21.9%
Splitting LogicDRG V8
Episode Statistics
Category 1 Category 2 Category 3 Category 4 Category 1 Category 2 Category 3 Category 4 Category 1 Category 2 Category 3 Category 4DRG V7 26,462 5,261 #N/A #N/A 83.4% 16.6% #N/A #N/ADRG V8 28,318 3,405 #N/A #N/A 89.3% 10.7% #N/A #N/A 98.3% 1.7% #N/A #N/A
Cost Statistics
Category 1 Category 2 Category 3 Category 4 Category 1 Category 2 Category 3 Category 4 Category 1 to 2 Category 2 to 3 Category 3 to 4 Category 1 to 2 Category 2 to 3 Category 3 to 4DRG V7 $3,752 $8,652 #N/A #N/A $99,298,372 $45,519,971 #N/A #N/A $4,900 #N/A #N/A 2.31 #N/A #N/ADRG V8 $3,783 $11,070 #N/A #N/A $107,124,160 $37,694,183 #N/A #N/A $7,287 #N/A #N/A 2.93 #N/A #N/A
Episode distribution cross-tab
DRG V8 Category 1 Category 2 Category 3 Category 4Category 1 25,563 2,755Category 2 899 2,506Category 3Category 4
DRG V8 Category 1 Category 2 Category 3 Category 4Category 1 96.6% 52.4%Category 2 3.4% 47.6%Category 3Category 4Total 100.0% 100.0%
DRG V7
DRG V7
Episodes
% Distribution of Episodes
Episodes % Distribution of episodes % Distribution of same-day episodes
Mean cost Total cost Absolute change in mean cost Relative change in mean cost
If (ECCS >= 3.5) then L07A; else L07B
Episodes CostDescription Same-day
Other Transurethral Procedures
Criteria
$0
$2,000
$4,000
$6,000
$8,000
$10,000
$12,000
D R G V 7 D R G V 8
MEAN COSTCategory 1 Category 2 Category 3 Category 4
0%
10%
20%
30%
40%
50%
60%
70%
80%
90%
100%
D R G V 7 D R G V 8
% DISTRIBUTION OF EPISODESCategory 1 Category 2 Category 3 Category 4
Appendix 4 - Statistical profiles Development of the Australian Refined Diagnosis Related Groups V8.0 Final Report 31 October 2014

ADRG Summary 270
ADRG Total Total MeanL08 4,465 1,957 43.8% $18,959,983 $4,246
Summary of statistical performance and splitting criteria
Categories Complexity+ RID RIV 1a 1b 1c 1e 2a 2b 2a or 2b 3a 4aDRG V7 2 12.9% 9.5%DRG V8 2 16.6% 12.4%
Splitting LogicDRG V8
Episode Statistics
Category 1 Category 2 Category 3 Category 4 Category 1 Category 2 Category 3 Category 4 Category 1 Category 2 Category 3 Category 4DRG V7 3,835 630 #N/A #N/A 85.9% 14.1% #N/A #N/ADRG V8 3,815 650 #N/A #N/A 85.4% 14.6% #N/A #N/A 94.9% 5.1% #N/A #N/A
Cost Statistics
Category 1 Category 2 Category 3 Category 4 Category 1 Category 2 Category 3 Category 4 Category 1 to 2 Category 2 to 3 Category 3 to 4 Category 1 to 2 Category 2 to 3 Category 3 to 4DRG V7 $3,697 $7,591 #N/A #N/A $14,177,867 $4,782,116 #N/A #N/A $3,894 #N/A #N/A 2.05 #N/A #N/ADRG V8 $3,605 $8,010 #N/A #N/A $13,753,286 $5,206,697 #N/A #N/A $4,405 #N/A #N/A 2.22 #N/A #N/A
Episode distribution cross-tab
DRG V8 Category 1 Category 2 Category 3 Category 4Category 1 3,594 221Category 2 241 409Category 3Category 4
DRG V8 Category 1 Category 2 Category 3 Category 4Category 1 93.7% 35.1%Category 2 6.3% 64.9%Category 3Category 4Total 100.0% 100.0%
DRG V7
DRG V7
Episodes
% Distribution of Episodes
Episodes % Distribution of episodes % Distribution of same-day episodes
Mean cost Total cost Absolute change in mean cost Relative change in mean cost
If (ECCS >= 3.5) then L08A; else L08B
Episodes CostDescription Same-day
Urethral Procedures
Criteria
$0
$1,000
$2,000
$3,000
$4,000
$5,000
$6,000
$7,000
$8,000
$9,000
D R G V 7 D R G V 8
MEAN COSTCategory 1 Category 2 Category 3 Category 4
0%
10%
20%
30%
40%
50%
60%
70%
80%
90%
100%
D R G V 7 D R G V 8
% DISTRIBUTION OF EPISODESCategory 1 Category 2 Category 3 Category 4
Appendix 4 - Statistical profiles Development of the Australian Refined Diagnosis Related Groups V8.0 Final Report 31 October 2014

ADRG Summary 271
ADRG Total Total MeanL09 8,617 2,517 29.2% $90,315,060 $10,481
Summary of statistical performance and splitting criteria
Categories Complexity+ RID RIV 1a 1b 1c 1e 2a 2b 2a or 2b 3a 4aDRG V7 3 52.7% 28.6%DRG V8 3 57.9% 35.7%
Splitting LogicDRG V8
Episode Statistics
Category 1 Category 2 Category 3 Category 4 Category 1 Category 2 Category 3 Category 4 Category 1 Category 2 Category 3 Category 4DRG V7 5,903 1,128 1,586 #N/A 68.5% 13.1% 18.4% #N/ADRG V8 6,367 1,200 1,050 #N/A 73.9% 13.9% 12.2% #N/A 97.6% 2.3% 0.1% #N/A
Cost Statistics
Category 1 Category 2 Category 3 Category 4 Category 1 Category 2 Category 3 Category 4 Category 1 to 2 Category 2 to 3 Category 3 to 4 Category 1 to 2 Category 2 to 3 Category 3 to 4DRG V7 $5,618 $10,015 $28,911 #N/A $33,164,843 $11,297,386 $45,852,831 #N/A $4,397 $18,896 #N/A 1.78 2.89 #N/ADRG V8 $5,614 $14,006 $35,963 #N/A $35,746,424 $16,807,761 $37,760,875 #N/A $8,392 $21,956 #N/A 2.49 2.57 #N/A
Episode distribution cross-tab
DRG V8 Category 1 Category 2 Category 3 Category 4Category 1 5,592 698 77Category 2 273 369 558Category 3 38 61 951Category 4
DRG V8 Category 1 Category 2 Category 3 Category 4Category 1 94.7% 61.9% 4.9%Category 2 4.6% 32.7% 35.2%Category 3 0.6% 5.4% 60.0%Category 4Total 100.0% 100.0% 100.0%
DRG V7
DRG V7
Episodes
% Distribution of Episodes
Episodes % Distribution of episodes % Distribution of same-day episodes
Mean cost Total cost Absolute change in mean cost Relative change in mean cost
If (ECCS >= 3.5) then L09A; else if (ECCS >= 2.0) then L09B; else L09C
Episodes CostDescription Same-day
Other Procedures for Kidney and Urinary Tract Disorders
Criteria
$0
$5,000
$10,000
$15,000
$20,000
$25,000
$30,000
$35,000
$40,000
D R G V 7 D R G V 8
MEAN COSTCategory 1 Category 2 Category 3 Category 4
0%
10%
20%
30%
40%
50%
60%
70%
80%
90%
100%
D R G V 7 D R G V 8
% DISTRIBUTION OF EPISODESCategory 1 Category 2 Category 3 Category 4
Appendix 4 - Statistical profiles Development of the Australian Refined Diagnosis Related Groups V8.0 Final Report 31 October 2014

ADRG Summary 272
ADRG Total Total MeanL40 1,392 787 56.5% $5,838,216 $4,194
Summary of statistical performance and splitting criteria
Categories Complexity+ RID RIV 1a 1b 1c 1e 2a 2b 2a or 2b 3a 4aDRG V7 1 0.0% 0.0%DRG V8 1 0.0% 0.0%
Splitting LogicDRG V8
Episode Statistics
Category 1 Category 2 Category 3 Category 4 Category 1 Category 2 Category 3 Category 4 Category 1 Category 2 Category 3 Category 4DRG V7 1,392 #N/A #N/A #N/A 100.0% #N/A #N/A #N/ADRG V8 1,392 #N/A #N/A #N/A 100.0% #N/A #N/A #N/A 100.0% #N/A #N/A #N/A
Cost Statistics
Category 1 Category 2 Category 3 Category 4 Category 1 Category 2 Category 3 Category 4 Category 1 to 2 Category 2 to 3 Category 3 to 4 Category 1 to 2 Category 2 to 3 Category 3 to 4DRG V7 $4,194 #N/A #N/A #N/A $5,838,216 #N/A #N/A #N/A #N/A #N/A #N/A #N/A #N/A #N/ADRG V8 $4,194 #N/A #N/A #N/A $5,838,216 #N/A #N/A #N/A #N/A #N/A #N/A #N/A #N/A #N/A
Episode distribution cross-tab
DRG V8 Category 1 Category 2 Category 3 Category 4Category 1 1,392Category 2Category 3Category 4
DRG V8 Category 1 Category 2 Category 3 Category 4Category 1 100.0%Category 2Category 3Category 4Total 100.0%
DRG V7
DRG V7
Episodes
% Distribution of Episodes
Episodes % Distribution of episodes % Distribution of same-day episodes
Mean cost Total cost Absolute change in mean cost Relative change in mean cost
L40Z
Episodes CostDescription Same-day
Ureteroscopy
Criteria
$0
$500
$1,000
$1,500
$2,000
$2,500
$3,000
$3,500
$4,000
$4,500
D R G V 7 D R G V 8
MEAN COSTCategory 1 Category 2 Category 3 Category 4
0%
10%
20%
30%
40%
50%
60%
70%
80%
90%
100%
D R G V 7 D R G V 8
% DISTRIBUTION OF EPISODESCategory 1 Category 2 Category 3 Category 4
Appendix 4 - Statistical profiles Development of the Australian Refined Diagnosis Related Groups V8.0 Final Report 31 October 2014
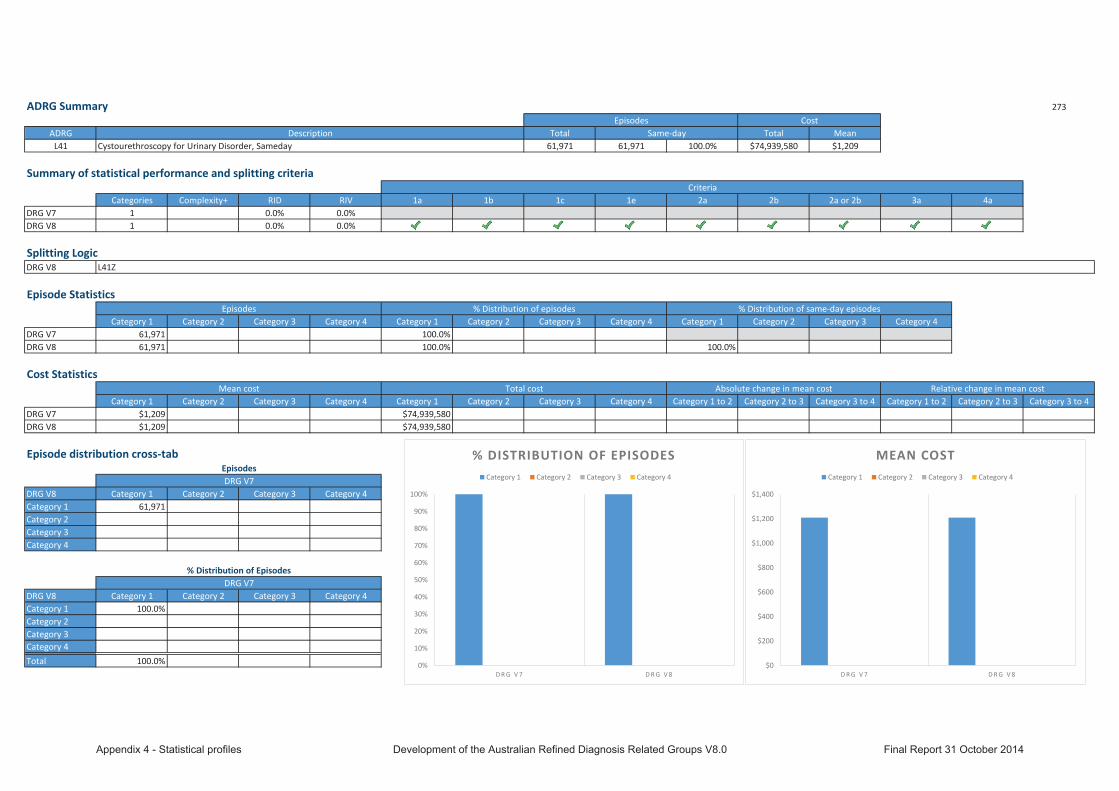
ADRG Summary 273
ADRG Total Total MeanL41 61,971 61,971 100.0% $74,939,580 $1,209
Summary of statistical performance and splitting criteria
Categories Complexity+ RID RIV 1a 1b 1c 1e 2a 2b 2a or 2b 3a 4aDRG V7 1 0.0% 0.0%DRG V8 1 0.0% 0.0%
Splitting LogicDRG V8
Episode Statistics
Category 1 Category 2 Category 3 Category 4 Category 1 Category 2 Category 3 Category 4 Category 1 Category 2 Category 3 Category 4DRG V7 61,971 #N/A #N/A #N/A 100.0% #N/A #N/A #N/ADRG V8 61,971 #N/A #N/A #N/A 100.0% #N/A #N/A #N/A 100.0% #N/A #N/A #N/A
Cost Statistics
Category 1 Category 2 Category 3 Category 4 Category 1 Category 2 Category 3 Category 4 Category 1 to 2 Category 2 to 3 Category 3 to 4 Category 1 to 2 Category 2 to 3 Category 3 to 4DRG V7 $1,209 #N/A #N/A #N/A $74,939,580 #N/A #N/A #N/A #N/A #N/A #N/A #N/A #N/A #N/ADRG V8 $1,209 #N/A #N/A #N/A $74,939,580 #N/A #N/A #N/A #N/A #N/A #N/A #N/A #N/A #N/A
Episode distribution cross-tab
DRG V8 Category 1 Category 2 Category 3 Category 4Category 1 61,971Category 2Category 3Category 4
DRG V8 Category 1 Category 2 Category 3 Category 4Category 1 100.0%Category 2Category 3Category 4Total 100.0%
DRG V7
DRG V7
Episodes
% Distribution of Episodes
Episodes % Distribution of episodes % Distribution of same-day episodes
Mean cost Total cost Absolute change in mean cost Relative change in mean cost
L41Z
Episodes CostDescription Same-day
Cystourethroscopy for Urinary Disorder, Sameday
Criteria
$0
$200
$400
$600
$800
$1,000
$1,200
$1,400
D R G V 7 D R G V 8
MEAN COSTCategory 1 Category 2 Category 3 Category 4
0%
10%
20%
30%
40%
50%
60%
70%
80%
90%
100%
D R G V 7 D R G V 8
% DISTRIBUTION OF EPISODESCategory 1 Category 2 Category 3 Category 4
Appendix 4 - Statistical profiles Development of the Australian Refined Diagnosis Related Groups V8.0 Final Report 31 October 2014

ADRG Summary 274
ADRG Total Total MeanL42 4,180 3,568 85.4% $13,700,848 $3,278
Summary of statistical performance and splitting criteria
Categories Complexity+ RID RIV 1a 1b 1c 1e 2a 2b 2a or 2b 3a 4aDRG V7 1 0.0% 0.0%DRG V8 1 0.0% 0.0%
Splitting LogicDRG V8
Episode Statistics
Category 1 Category 2 Category 3 Category 4 Category 1 Category 2 Category 3 Category 4 Category 1 Category 2 Category 3 Category 4DRG V7 4,180 #N/A #N/A #N/A 100.0% #N/A #N/A #N/ADRG V8 4,180 #N/A #N/A #N/A 100.0% #N/A #N/A #N/A 100.0% #N/A #N/A #N/A
Cost Statistics
Category 1 Category 2 Category 3 Category 4 Category 1 Category 2 Category 3 Category 4 Category 1 to 2 Category 2 to 3 Category 3 to 4 Category 1 to 2 Category 2 to 3 Category 3 to 4DRG V7 $3,278 #N/A #N/A #N/A $13,700,848 #N/A #N/A #N/A #N/A #N/A #N/A #N/A #N/A #N/ADRG V8 $3,278 #N/A #N/A #N/A $13,700,848 #N/A #N/A #N/A #N/A #N/A #N/A #N/A #N/A #N/A
Episode distribution cross-tab
DRG V8 Category 1 Category 2 Category 3 Category 4Category 1 4,180Category 2Category 3Category 4
DRG V8 Category 1 Category 2 Category 3 Category 4Category 1 100.0%Category 2Category 3Category 4Total 100.0%
DRG V7
DRG V7
Episodes
% Distribution of Episodes
Episodes % Distribution of episodes % Distribution of same-day episodes
Mean cost Total cost Absolute change in mean cost Relative change in mean cost
L42Z
Episodes CostDescription Same-day
ESW Lithotripsy
Criteria
$0
$500
$1,000
$1,500
$2,000
$2,500
$3,000
$3,500
D R G V 7 D R G V 8
MEAN COSTCategory 1 Category 2 Category 3 Category 4
0%
10%
20%
30%
40%
50%
60%
70%
80%
90%
100%
D R G V 7 D R G V 8
% DISTRIBUTION OF EPISODESCategory 1 Category 2 Category 3 Category 4
Appendix 4 - Statistical profiles Development of the Australian Refined Diagnosis Related Groups V8.0 Final Report 31 October 2014
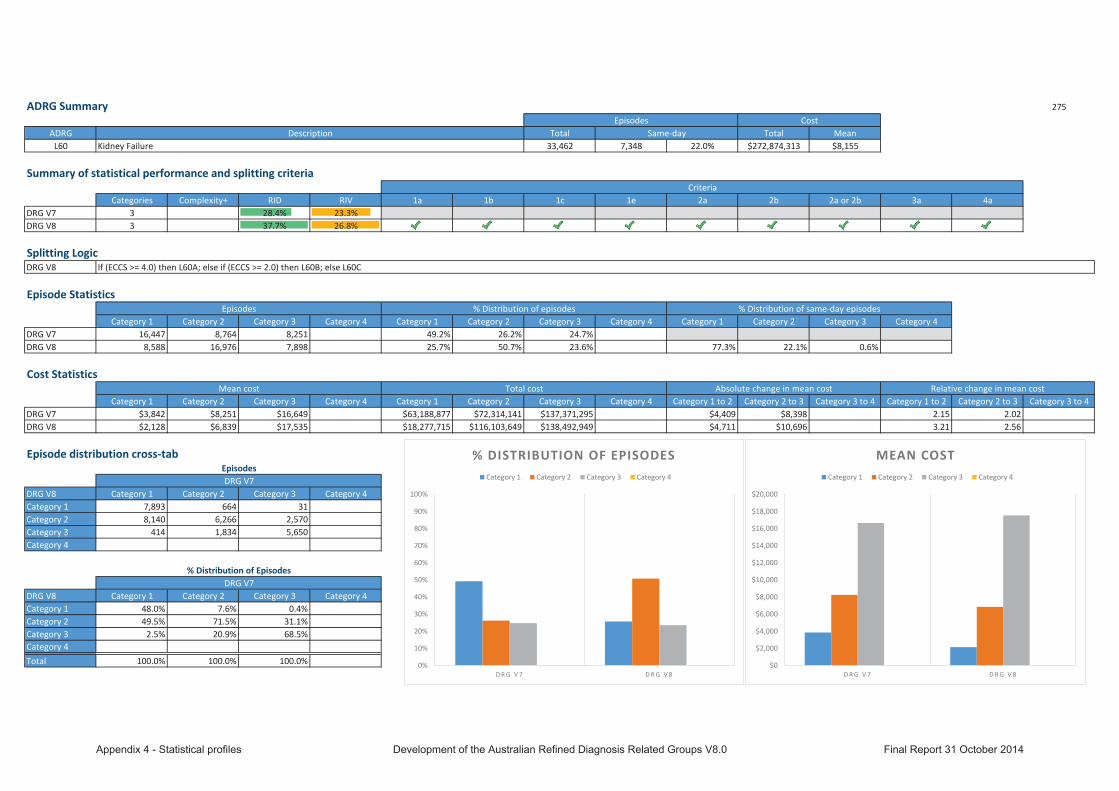
ADRG Summary 275
ADRG Total Total MeanL60 33,462 7,348 22.0% $272,874,313 $8,155
Summary of statistical performance and splitting criteria
Categories Complexity+ RID RIV 1a 1b 1c 1e 2a 2b 2a or 2b 3a 4aDRG V7 3 28.4% 23.3%DRG V8 3 37.7% 26.8%
Splitting LogicDRG V8
Episode Statistics
Category 1 Category 2 Category 3 Category 4 Category 1 Category 2 Category 3 Category 4 Category 1 Category 2 Category 3 Category 4DRG V7 16,447 8,764 8,251 #N/A 49.2% 26.2% 24.7% #N/ADRG V8 8,588 16,976 7,898 #N/A 25.7% 50.7% 23.6% #N/A 77.3% 22.1% 0.6% #N/A
Cost Statistics
Category 1 Category 2 Category 3 Category 4 Category 1 Category 2 Category 3 Category 4 Category 1 to 2 Category 2 to 3 Category 3 to 4 Category 1 to 2 Category 2 to 3 Category 3 to 4DRG V7 $3,842 $8,251 $16,649 #N/A $63,188,877 $72,314,141 $137,371,295 #N/A $4,409 $8,398 #N/A 2.15 2.02 #N/ADRG V8 $2,128 $6,839 $17,535 #N/A $18,277,715 $116,103,649 $138,492,949 #N/A $4,711 $10,696 #N/A 3.21 2.56 #N/A
Episode distribution cross-tab
DRG V8 Category 1 Category 2 Category 3 Category 4Category 1 7,893 664 31Category 2 8,140 6,266 2,570Category 3 414 1,834 5,650Category 4
DRG V8 Category 1 Category 2 Category 3 Category 4Category 1 48.0% 7.6% 0.4%Category 2 49.5% 71.5% 31.1%Category 3 2.5% 20.9% 68.5%Category 4Total 100.0% 100.0% 100.0%
DRG V7
DRG V7
Episodes
% Distribution of Episodes
Episodes % Distribution of episodes % Distribution of same-day episodes
Mean cost Total cost Absolute change in mean cost Relative change in mean cost
If (ECCS >= 4.0) then L60A; else if (ECCS >= 2.0) then L60B; else L60C
Episodes CostDescription Same-day
Kidney Failure
Criteria
$0
$2,000
$4,000
$6,000
$8,000
$10,000
$12,000
$14,000
$16,000
$18,000
$20,000
D R G V 7 D R G V 8
MEAN COSTCategory 1 Category 2 Category 3 Category 4
0%
10%
20%
30%
40%
50%
60%
70%
80%
90%
100%
D R G V 7 D R G V 8
% DISTRIBUTION OF EPISODESCategory 1 Category 2 Category 3 Category 4
Appendix 4 - Statistical profiles Development of the Australian Refined Diagnosis Related Groups V8.0 Final Report 31 October 2014

ADRG Summary 276
ADRG Total Total MeanL61 2,620,898 2,617,799 99.9% $1,472,826,211 $562
Summary of statistical performance and splitting criteria
Categories Complexity+ RID RIV 1a 1b 1c 1e 2a 2b 2a or 2b 3a 4aDRG V7 1 0.0% 0.0%DRG V8 1 0.0% 0.0%
Splitting LogicDRG V8
Episode Statistics
Category 1 Category 2 Category 3 Category 4 Category 1 Category 2 Category 3 Category 4 Category 1 Category 2 Category 3 Category 4DRG V7 2,620,898 #N/A #N/A #N/A 100.0% #N/A #N/A #N/ADRG V8 2,620,898 #N/A #N/A #N/A 100.0% #N/A #N/A #N/A 100.0% #N/A #N/A #N/A
Cost Statistics
Category 1 Category 2 Category 3 Category 4 Category 1 Category 2 Category 3 Category 4 Category 1 to 2 Category 2 to 3 Category 3 to 4 Category 1 to 2 Category 2 to 3 Category 3 to 4DRG V7 $562 #N/A #N/A #N/A $1,472,826,211 #N/A #N/A #N/A #N/A #N/A #N/A #N/A #N/A #N/ADRG V8 $562 #N/A #N/A #N/A $1,472,826,211 #N/A #N/A #N/A #N/A #N/A #N/A #N/A #N/A #N/A
Episode distribution cross-tab
DRG V8 Category 1 Category 2 Category 3 Category 4Category 1 2,620,898Category 2Category 3Category 4
DRG V8 Category 1 Category 2 Category 3 Category 4Category 1 100.0%Category 2Category 3Category 4Total 100.0%
DRG V7
DRG V7
Episodes
% Distribution of Episodes
Episodes % Distribution of episodes % Distribution of same-day episodes
Mean cost Total cost Absolute change in mean cost Relative change in mean cost
L61Z
Episodes CostDescription Same-day
Haemodialysis
Criteria
$0
$100
$200
$300
$400
$500
$600
D R G V 7 D R G V 8
MEAN COSTCategory 1 Category 2 Category 3 Category 4
0%
10%
20%
30%
40%
50%
60%
70%
80%
90%
100%
D R G V 7 D R G V 8
% DISTRIBUTION OF EPISODESCategory 1 Category 2 Category 3 Category 4
Appendix 4 - Statistical profiles Development of the Australian Refined Diagnosis Related Groups V8.0 Final Report 31 October 2014

ADRG Summary 277
ADRG Total Total MeanL62 5,563 1,955 35.1% $32,874,387 $5,909
Summary of statistical performance and splitting criteria
Categories Complexity+ RID RIV 1a 1b 1c 1e 2a 2b 2a or 2b 3a 4aDRG V7 2 20.7% 15.5%DRG V8 2 27.4% 23.0%
Splitting LogicDRG V8
Episode Statistics
Category 1 Category 2 Category 3 Category 4 Category 1 Category 2 Category 3 Category 4 Category 1 Category 2 Category 3 Category 4DRG V7 3,404 2,159 #N/A #N/A 61.2% 38.8% #N/A #N/ADRG V8 3,836 1,727 #N/A #N/A 69.0% 31.0% #N/A #N/A 95.8% 4.2% #N/A #N/A
Cost Statistics
Category 1 Category 2 Category 3 Category 4 Category 1 Category 2 Category 3 Category 4 Category 1 to 2 Category 2 to 3 Category 3 to 4 Category 1 to 2 Category 2 to 3 Category 3 to 4DRG V7 $3,296 $10,029 #N/A #N/A $11,220,961 $21,653,425 #N/A #N/A $6,733 #N/A #N/A 3.04 #N/A #N/ADRG V8 $3,228 $11,866 #N/A #N/A $12,382,036 $20,492,351 #N/A #N/A $8,638 #N/A #N/A 3.68 #N/A #N/A
Episode distribution cross-tab
DRG V8 Category 1 Category 2 Category 3 Category 4Category 1 3,010 826Category 2 394 1,333Category 3Category 4
DRG V8 Category 1 Category 2 Category 3 Category 4Category 1 88.4% 38.3%Category 2 11.6% 61.7%Category 3Category 4Total 100.0% 100.0%
DRG V7
DRG V7
Episodes
% Distribution of Episodes
Episodes % Distribution of episodes % Distribution of same-day episodes
Mean cost Total cost Absolute change in mean cost Relative change in mean cost
If (ECCS >= 2.5) then L62A; else L62B
Episodes CostDescription Same-day
Kidney and Urinary Tract Neoplasms
Criteria
$0
$2,000
$4,000
$6,000
$8,000
$10,000
$12,000
$14,000
D R G V 7 D R G V 8
MEAN COSTCategory 1 Category 2 Category 3 Category 4
0%
10%
20%
30%
40%
50%
60%
70%
80%
90%
100%
D R G V 7 D R G V 8
% DISTRIBUTION OF EPISODESCategory 1 Category 2 Category 3 Category 4
Appendix 4 - Statistical profiles Development of the Australian Refined Diagnosis Related Groups V8.0 Final Report 31 October 2014
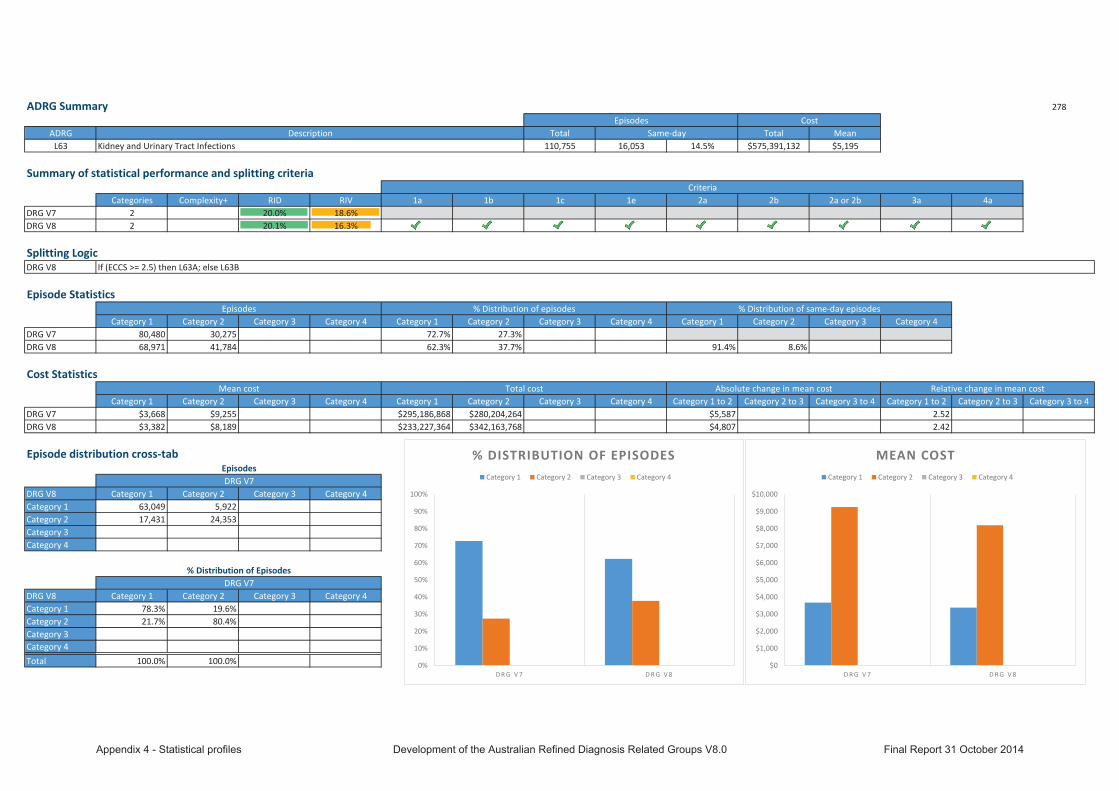
ADRG Summary 278
ADRG Total Total MeanL63 110,755 16,053 14.5% $575,391,132 $5,195
Summary of statistical performance and splitting criteria
Categories Complexity+ RID RIV 1a 1b 1c 1e 2a 2b 2a or 2b 3a 4aDRG V7 2 20.0% 18.6%DRG V8 2 20.1% 16.3%
Splitting LogicDRG V8
Episode Statistics
Category 1 Category 2 Category 3 Category 4 Category 1 Category 2 Category 3 Category 4 Category 1 Category 2 Category 3 Category 4DRG V7 80,480 30,275 #N/A #N/A 72.7% 27.3% #N/A #N/ADRG V8 68,971 41,784 #N/A #N/A 62.3% 37.7% #N/A #N/A 91.4% 8.6% #N/A #N/A
Cost Statistics
Category 1 Category 2 Category 3 Category 4 Category 1 Category 2 Category 3 Category 4 Category 1 to 2 Category 2 to 3 Category 3 to 4 Category 1 to 2 Category 2 to 3 Category 3 to 4DRG V7 $3,668 $9,255 #N/A #N/A $295,186,868 $280,204,264 #N/A #N/A $5,587 #N/A #N/A 2.52 #N/A #N/ADRG V8 $3,382 $8,189 #N/A #N/A $233,227,364 $342,163,768 #N/A #N/A $4,807 #N/A #N/A 2.42 #N/A #N/A
Episode distribution cross-tab
DRG V8 Category 1 Category 2 Category 3 Category 4Category 1 63,049 5,922Category 2 17,431 24,353Category 3Category 4
DRG V8 Category 1 Category 2 Category 3 Category 4Category 1 78.3% 19.6%Category 2 21.7% 80.4%Category 3Category 4Total 100.0% 100.0%
DRG V7
DRG V7
Episodes
% Distribution of Episodes
Episodes % Distribution of episodes % Distribution of same-day episodes
Mean cost Total cost Absolute change in mean cost Relative change in mean cost
If (ECCS >= 2.5) then L63A; else L63B
Episodes CostDescription Same-day
Kidney and Urinary Tract Infections
Criteria
$0
$1,000
$2,000
$3,000
$4,000
$5,000
$6,000
$7,000
$8,000
$9,000
$10,000
D R G V 7 D R G V 8
MEAN COSTCategory 1 Category 2 Category 3 Category 4
0%
10%
20%
30%
40%
50%
60%
70%
80%
90%
100%
D R G V 7 D R G V 8
% DISTRIBUTION OF EPISODESCategory 1 Category 2 Category 3 Category 4
Appendix 4 - Statistical profiles Development of the Australian Refined Diagnosis Related Groups V8.0 Final Report 31 October 2014
ADRG Summary 279
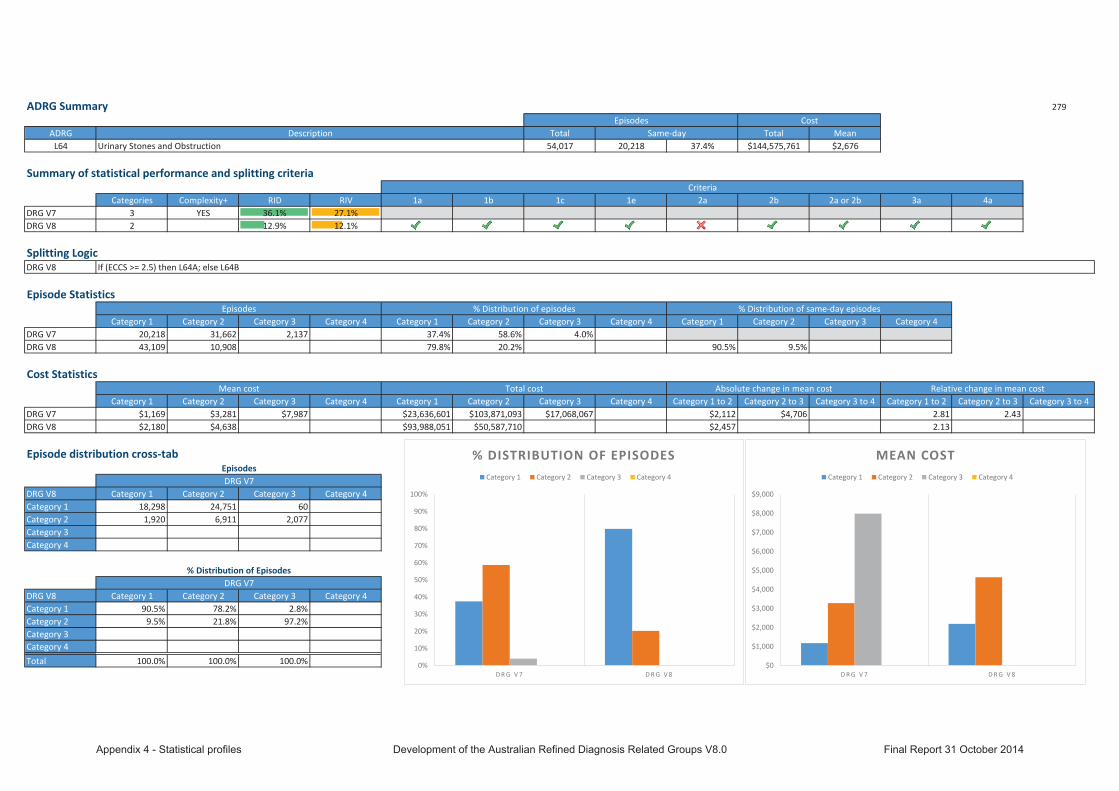
ADRG Total Total MeanL64 54,017 20,218 37.4% $144,575,761 $2,676
Summary of statistical performance and splitting criteria
Categories Complexity+ RID RIV 1a 1b 1c 1e 2a 2b 2a or 2b 3a 4aDRG V7 3 YES 36.1% 27.1%DRG V8 2 12.9% 12.1%
Splitting LogicDRG V8
Episode Statistics
Category 1 Category 2 Category 3 Category 4 Category 1 Category 2 Category 3 Category 4 Category 1 Category 2 Category 3 Category 4DRG V7 20,218 31,662 2,137 #N/A 37.4% 58.6% 4.0% #N/ADRG V8 43,109 10,908 #N/A #N/A 79.8% 20.2% #N/A #N/A 90.5% 9.5% #N/A #N/A
Cost Statistics
Category 1 Category 2 Category 3 Category 4 Category 1 Category 2 Category 3 Category 4 Category 1 to 2 Category 2 to 3 Category 3 to 4 Category 1 to 2 Category 2 to 3 Category 3 to 4DRG V7 $1,169 $3,281 $7,987 #N/A $23,636,601 $103,871,093 $17,068,067 #N/A $2,112 $4,706 #N/A 2.81 2.43 #N/ADRG V8 $2,180 $4,638 #N/A #N/A $93,988,051 $50,587,710 #N/A #N/A $2,457 #N/A #N/A 2.13 #N/A #N/A
Episode distribution cross-tab
DRG V8 Category 1 Category 2 Category 3 Category 4Category 1 18,298 24,751 60Category 2 1,920 6,911 2,077Category 3Category 4
DRG V8 Category 1 Category 2 Category 3 Category 4Category 1 90.5% 78.2% 2.8%Category 2 9.5% 21.8% 97.2%Category 3Category 4Total 100.0% 100.0% 100.0%
DRG V7
DRG V7
Episodes
% Distribution of Episodes
Episodes % Distribution of episodes % Distribution of same-day episodes
Mean cost Total cost Absolute change in mean cost Relative change in mean cost
If (ECCS >= 2.5) then L64A; else L64B
Episodes CostDescription Same-day
Urinary Stones and Obstruction
Criteria
$0
$1,000
$2,000
$3,000
$4,000
$5,000
$6,000
$7,000
$8,000
$9,000
D R G V 7 D R G V 8
MEAN COSTCategory 1 Category 2 Category 3 Category 4
0%
10%
20%
30%
40%
50%
60%
70%
80%
90%
100%
D R G V 7 D R G V 8
% DISTRIBUTION OF EPISODESCategory 1 Category 2 Category 3 Category 4
Appendix 4 - Statistical profiles Development of the Australian Refined Diagnosis Related Groups V8.0 Final Report 31 October 2014

ADRG Summary 280
ADRG Total Total MeanL65 31,404 9,804 31.2% $112,265,787 $3,575
Summary of statistical performance and splitting criteria
Categories Complexity+ RID RIV 1a 1b 1c 1e 2a 2b 2a or 2b 3a 4aDRG V7 2 19.4% 18.5%DRG V8 2 22.7% 20.0%
Splitting LogicDRG V8
Episode Statistics
Category 1 Category 2 Category 3 Category 4 Category 1 Category 2 Category 3 Category 4 Category 1 Category 2 Category 3 Category 4DRG V7 24,814 6,590 #N/A #N/A 79.0% 21.0% #N/A #N/ADRG V8 23,335 8,069 #N/A #N/A 74.3% 25.7% #N/A #N/A 92.8% 7.2% #N/A #N/A
Cost Statistics
Category 1 Category 2 Category 3 Category 4 Category 1 Category 2 Category 3 Category 4 Category 1 to 2 Category 2 to 3 Category 3 to 4 Category 1 to 2 Category 2 to 3 Category 3 to 4DRG V7 $2,562 $7,389 #N/A #N/A $63,569,443 $48,696,344 #N/A #N/A $4,828 #N/A #N/A 2.88 #N/A #N/ADRG V8 $2,372 $7,052 #N/A #N/A $55,360,587 $56,905,200 #N/A #N/A $4,680 #N/A #N/A 2.97 #N/A #N/A
Episode distribution cross-tab
DRG V8 Category 1 Category 2 Category 3 Category 4Category 1 21,869 1,466Category 2 2,945 5,124Category 3Category 4
DRG V8 Category 1 Category 2 Category 3 Category 4Category 1 88.1% 22.2%Category 2 11.9% 77.8%Category 3Category 4Total 100.0% 100.0%
DRG V7
DRG V7
Episodes
% Distribution of Episodes
Episodes % Distribution of episodes % Distribution of same-day episodes
Mean cost Total cost Absolute change in mean cost Relative change in mean cost
If (ECCS >= 2.5) then L65A; else L65B
Episodes CostDescription Same-day
Kidney and Urinary Tract Signs and Symptoms
Criteria
$0
$1,000
$2,000
$3,000
$4,000
$5,000
$6,000
$7,000
$8,000
D R G V 7 D R G V 8
MEAN COSTCategory 1 Category 2 Category 3 Category 4
0%
10%
20%
30%
40%
50%
60%
70%
80%
90%
100%
D R G V 7 D R G V 8
% DISTRIBUTION OF EPISODESCategory 1 Category 2 Category 3 Category 4
Appendix 4 - Statistical profiles Development of the Australian Refined Diagnosis Related Groups V8.0 Final Report 31 October 2014

ADRG Summary 281
ADRG Total Total MeanL66 1,817 673 37.0% $5,067,567 $2,789
Summary of statistical performance and splitting criteria
Categories Complexity+ RID RIV 1a 1b 1c 1e 2a 2b 2a or 2b 3a 4aDRG V7 1 0.0% 0.0%DRG V8 1 0.0% 0.0%
Splitting LogicDRG V8
Episode Statistics
Category 1 Category 2 Category 3 Category 4 Category 1 Category 2 Category 3 Category 4 Category 1 Category 2 Category 3 Category 4DRG V7 1,817 #N/A #N/A #N/A 100.0% #N/A #N/A #N/ADRG V8 1,817 #N/A #N/A #N/A 100.0% #N/A #N/A #N/A 100.0% #N/A #N/A #N/A
Cost Statistics
Category 1 Category 2 Category 3 Category 4 Category 1 Category 2 Category 3 Category 4 Category 1 to 2 Category 2 to 3 Category 3 to 4 Category 1 to 2 Category 2 to 3 Category 3 to 4DRG V7 $2,789 #N/A #N/A #N/A $5,067,567 #N/A #N/A #N/A #N/A #N/A #N/A #N/A #N/A #N/ADRG V8 $2,789 #N/A #N/A #N/A $5,067,567 #N/A #N/A #N/A #N/A #N/A #N/A #N/A #N/A #N/A
Episode distribution cross-tab
DRG V8 Category 1 Category 2 Category 3 Category 4Category 1 1,817Category 2Category 3Category 4
DRG V8 Category 1 Category 2 Category 3 Category 4Category 1 100.0%Category 2Category 3Category 4Total 100.0%
DRG V7
DRG V7
Episodes
% Distribution of Episodes
Episodes % Distribution of episodes % Distribution of same-day episodes
Mean cost Total cost Absolute change in mean cost Relative change in mean cost
L66Z
Episodes CostDescription Same-day
Urethral Stricture
Criteria
$0
$500
$1,000
$1,500
$2,000
$2,500
$3,000
D R G V 7 D R G V 8
MEAN COSTCategory 1 Category 2 Category 3 Category 4
0%
10%
20%
30%
40%
50%
60%
70%
80%
90%
100%
D R G V 7 D R G V 8
% DISTRIBUTION OF EPISODESCategory 1 Category 2 Category 3 Category 4
Appendix 4 - Statistical profiles Development of the Australian Refined Diagnosis Related Groups V8.0 Final Report 31 October 2014
ADRG Summary 282
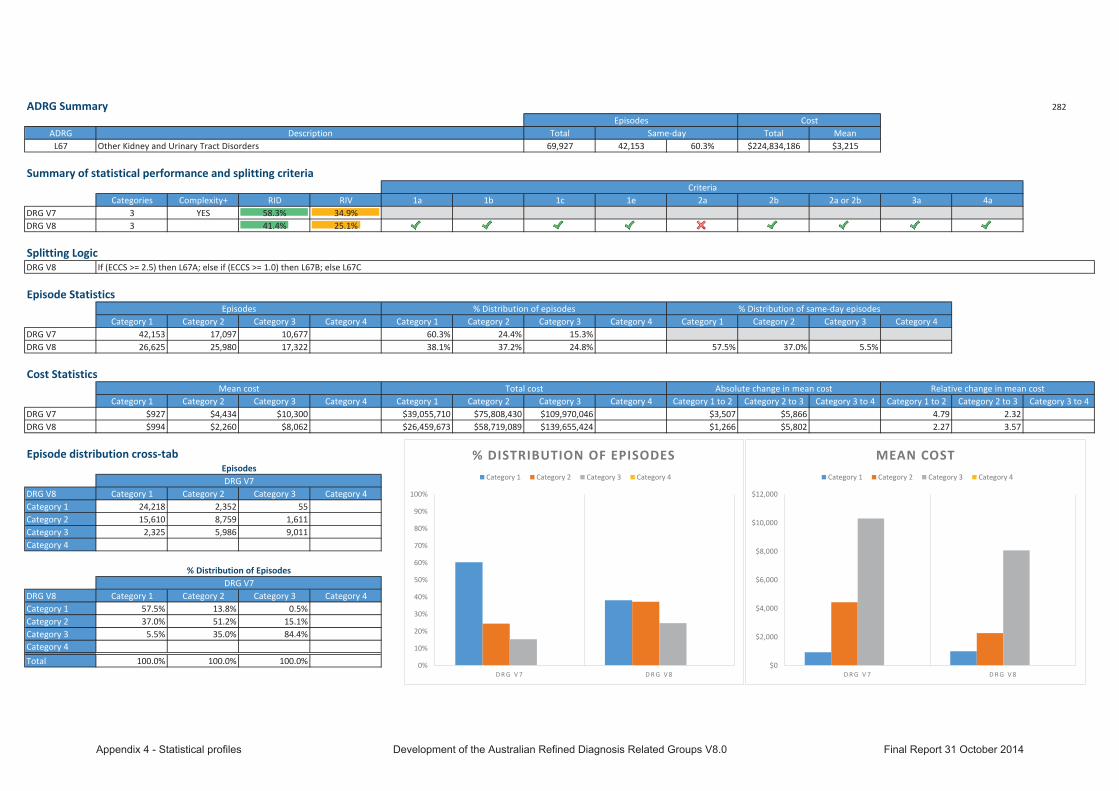
ADRG Total Total MeanL67 69,927 42,153 60.3% $224,834,186 $3,215
Summary of statistical performance and splitting criteria
Categories Complexity+ RID RIV 1a 1b 1c 1e 2a 2b 2a or 2b 3a 4aDRG V7 3 YES 58.3% 34.9%DRG V8 3 41.4% 25.1%
Splitting LogicDRG V8
Episode Statistics
Category 1 Category 2 Category 3 Category 4 Category 1 Category 2 Category 3 Category 4 Category 1 Category 2 Category 3 Category 4DRG V7 42,153 17,097 10,677 #N/A 60.3% 24.4% 15.3% #N/ADRG V8 26,625 25,980 17,322 #N/A 38.1% 37.2% 24.8% #N/A 57.5% 37.0% 5.5% #N/A
Cost Statistics
Category 1 Category 2 Category 3 Category 4 Category 1 Category 2 Category 3 Category 4 Category 1 to 2 Category 2 to 3 Category 3 to 4 Category 1 to 2 Category 2 to 3 Category 3 to 4DRG V7 $927 $4,434 $10,300 #N/A $39,055,710 $75,808,430 $109,970,046 #N/A $3,507 $5,866 #N/A 4.79 2.32 #N/ADRG V8 $994 $2,260 $8,062 #N/A $26,459,673 $58,719,089 $139,655,424 #N/A $1,266 $5,802 #N/A 2.27 3.57 #N/A
Episode distribution cross-tab
DRG V8 Category 1 Category 2 Category 3 Category 4Category 1 24,218 2,352 55Category 2 15,610 8,759 1,611Category 3 2,325 5,986 9,011Category 4
DRG V8 Category 1 Category 2 Category 3 Category 4Category 1 57.5% 13.8% 0.5%Category 2 37.0% 51.2% 15.1%Category 3 5.5% 35.0% 84.4%Category 4Total 100.0% 100.0% 100.0%
DRG V7
DRG V7
Episodes
% Distribution of Episodes
Episodes % Distribution of episodes % Distribution of same-day episodes
Mean cost Total cost Absolute change in mean cost Relative change in mean cost
If (ECCS >= 2.5) then L67A; else if (ECCS >= 1.0) then L67B; else L67C
Episodes CostDescription Same-day
Other Kidney and Urinary Tract Disorders
Criteria
$0
$2,000
$4,000
$6,000
$8,000
$10,000
$12,000
D R G V 7 D R G V 8
MEAN COSTCategory 1 Category 2 Category 3 Category 4
0%
10%
20%
30%
40%
50%
60%
70%
80%
90%
100%
D R G V 7 D R G V 8
% DISTRIBUTION OF EPISODESCategory 1 Category 2 Category 3 Category 4
Appendix 4 - Statistical profiles Development of the Australian Refined Diagnosis Related Groups V8.0 Final Report 31 October 2014
ADRG Summary 283
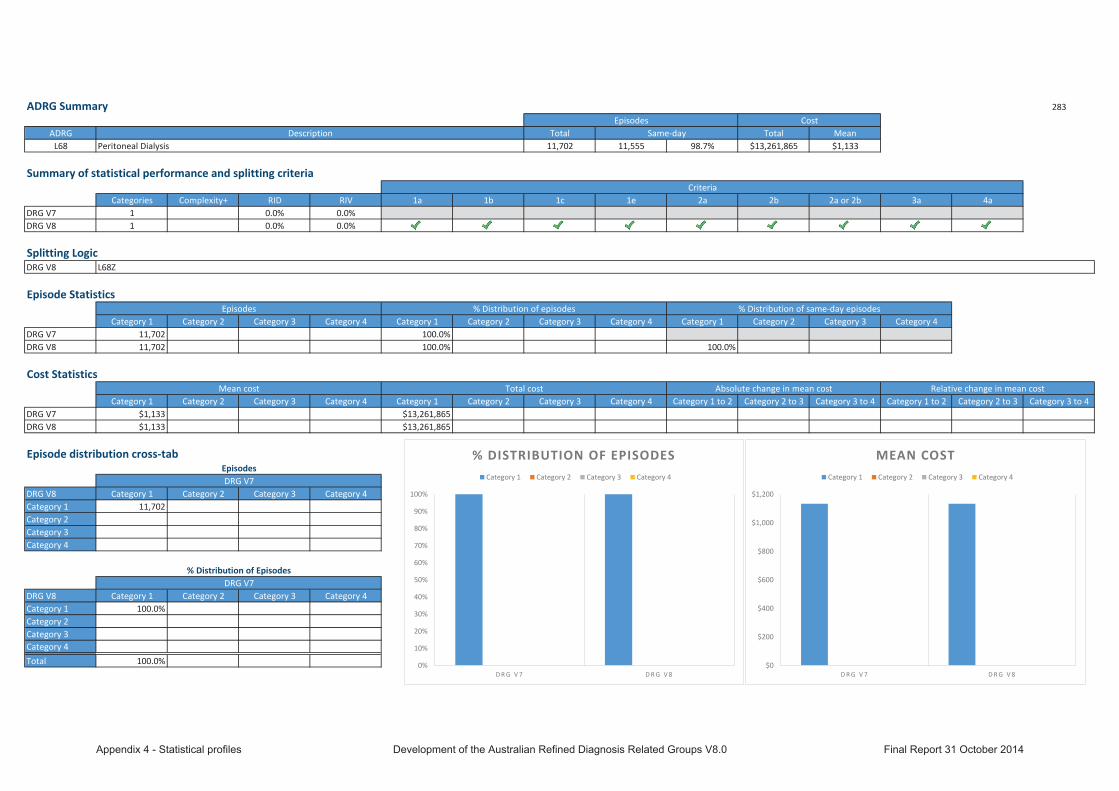
ADRG Total Total MeanL68 11,702 11,555 98.7% $13,261,865 $1,133
Summary of statistical performance and splitting criteria
Categories Complexity+ RID RIV 1a 1b 1c 1e 2a 2b 2a or 2b 3a 4aDRG V7 1 0.0% 0.0%DRG V8 1 0.0% 0.0%
Splitting LogicDRG V8
Episode Statistics
Category 1 Category 2 Category 3 Category 4 Category 1 Category 2 Category 3 Category 4 Category 1 Category 2 Category 3 Category 4DRG V7 11,702 #N/A #N/A #N/A 100.0% #N/A #N/A #N/ADRG V8 11,702 #N/A #N/A #N/A 100.0% #N/A #N/A #N/A 100.0% #N/A #N/A #N/A
Cost Statistics
Category 1 Category 2 Category 3 Category 4 Category 1 Category 2 Category 3 Category 4 Category 1 to 2 Category 2 to 3 Category 3 to 4 Category 1 to 2 Category 2 to 3 Category 3 to 4DRG V7 $1,133 #N/A #N/A #N/A $13,261,865 #N/A #N/A #N/A #N/A #N/A #N/A #N/A #N/A #N/ADRG V8 $1,133 #N/A #N/A #N/A $13,261,865 #N/A #N/A #N/A #N/A #N/A #N/A #N/A #N/A #N/A
Episode distribution cross-tab
DRG V8 Category 1 Category 2 Category 3 Category 4Category 1 11,702Category 2Category 3Category 4
DRG V8 Category 1 Category 2 Category 3 Category 4Category 1 100.0%Category 2Category 3Category 4Total 100.0%
DRG V7
DRG V7
Episodes
% Distribution of Episodes
Episodes % Distribution of episodes % Distribution of same-day episodes
Mean cost Total cost Absolute change in mean cost Relative change in mean cost
L68Z
Episodes CostDescription Same-day
Peritoneal Dialysis
Criteria
$0
$200
$400
$600
$800
$1,000
$1,200
D R G V 7 D R G V 8
MEAN COSTCategory 1 Category 2 Category 3 Category 4
0%
10%
20%
30%
40%
50%
60%
70%
80%
90%
100%
D R G V 7 D R G V 8
% DISTRIBUTION OF EPISODESCategory 1 Category 2 Category 3 Category 4
Appendix 4 - Statistical profiles Development of the Australian Refined Diagnosis Related Groups V8.0 Final Report 31 October 2014