Embed Size (px)
Citation preview
^Hf ffa *"^ V - / S ' S ^ T?1
Final Record of Decisionfor Operable Unit 1Schofield Army Barracks,Island of Oahu, Hawaii
SFUND RECORDS CTR
3315-00003
DD 11
U.S. ArmyEnvironmental
CenterPrepared by:
Harding Lawson Associates707 Seventeenth Street, Suite 2400Denver, Colorado 80202
235 Pearlridge Center Phase 198-1005 Moanalua RoadAiea, HI 96701
September 1995
Prepared for:
U.S. Army Environmental CenterAberdeen Proving Ground, MD 21010-5401
Contract No. DAAA15-91-D-0013Delivery Order No. 0005
Final Record of Decision forOperable Unit 1Schofield Army BarracksIsland of Oahu, Hawaii
Prepared for
U.S. Army Environmental CenterInstallation Restoration Division
HLA Project No. 22504 12.04.00Contract DAAA15-91-D-0013Delivery Order 0005
IN ACCORDANCE WITH U.S. ARMY REGULATION 200-2, THIS DOCUMENT IS INTENDED BY
THE U.S. ARMY TO COMPLY WITH THE NATIONAL ENVIRONMENTAL POLICY ACT OF 1969.
THE USE OF TRADE NAMES IN THIS REPORT DOES NOT CONSTITUTE AN OFFICIAL ENDORSE-
MENT OR APPROVAL OF THE USE OF SUCH COMMERCIAL PRODUCTS. THE REPORT MAY NOT
BE CITED FOR PURPOSES OF ADVERTISEMENT.
September 29, 1995
Harding Lawson AssociatesEngineering and Environmental Services707 Seventeenth Street, Suite 2400Denver, CO 80202 - (303) 292-5365
f+ PRINTED ON\IJRECYCLED PAPER
Total Environmental Program Support
Final Record of Decision for Operable Unit 1Schofield Army Barracks, Island of Oahu, Hawaii
September 29, 1995Contract Number DAAA15-91-D-0013
Delivery Order 0005
Report Preparation Team:
Neil MyersJoseph SeracuseDale Tischmak
Bruce Wedgeworth
Harding Lawson AssociatesEngineering and Environmental Services707 Seventeenth Street, Suite 2400Denver, CO 80202 - (303) 292-5365
Information contained in this report should not be used for purposes other
than immediately intended without prior consultation with Harding Lawson Associates
(HLA) regarding its applicability.
Harding Lawson AssociatesEngineering and Environmental Services707 Seventeenth Street, Suite 2400Denver, CO 80202 - (303) 292-5365
CONTENTS
1.0 DECLARATION • 1-1
1.1 Site Name and Location 1-1
1.2 Statement of Basis and Purpose 1-2
1.3 Description of the Selected Remedy 1-2
1.4 Declaration Statement 1-2
2.0 DECISION SUMMARY 2-1
2.1 Schofield Barracks Site Location and Description 2-1
2.2 Schofield Barracks Installation Operational History 2-3
2.3 Enforcement and Regulatory History 2-3
2.4 Operable Unit 1 Site Selection History 2-4
2.5 Operable Unit 1 Site Description 2-52.5.1 Site 17: DDL Vehicle Maintenance Motor Pool
(Building 1029) 2-62.5.2 Site 18: Distribution Warehouse (Building 1052) 2-62.5.3 Site 20: Petroleum, Oil and Lubricant Area (Area R) 2-62.5.4 Site 25: Auto Craft Shop (Building 910) 2-72.5.5 Site 42: Maintenance Area (Building 387) 2-72.5.6 Site 50: Old Burn Area 2-82.5.7 Site 51: East Range Drum Disposal Area 2-82.5.8 Site 52: Old Laundry 2-92.5.9 Site 53: Shaft Pump Chamber and Storage Chambers 2-92.5.10 Site 54a: Aircraft Fuselage Dumping and Cleaning Area 2-102.5.11 Site 54b: Aircraft Storage Area 2-102.5.12 Site 54c: Aircraft Engine Rebuild Area 2-11
2.6 Highlights of Community Participation 2-11
2.7 Scope and Role of Operable Unit 1 2-12
2.8 Site Characteristics 2-132.8.1 Site 17: DOL Vehicle Maintenance Motor Pool
(Building 1029) 2-142.8.2 Site 18: Distribution Warehouse (Building 1052) 2-162.8.3 Site 20: Petroleum, Oil and Lubricants Area (Area R) 2-182.8.4 Site 25: Automobile Craft Shop (Building 910) 2-202.8.5 Site 42: Maintenance Area (Building 387) 2-212.8.6 Site 50: Old Burn Area 2-23
2250412.04.00 Harding Lawson Associates i0927092895 ROD
2.8.7 Site 51: East Range Drum Disposal Area 2-262.8.8 Site 52: Old Laundry 2-282.8.9 Site 53: Shaft Pump Chamber and Storage Chambers 2-292.8.10 Site 54a: Aircraft Fuselage Dumping and Cleaning Area 2-292.8.11 Site 54b: Aircraft Storage Area • 2-302.8.12 Site 54c: Aircraft Engine Rebuild Area 2-32
2.9 Summary of Site Risks 2-35
2.10 Selection of No Action Alternative Based on Risk Evaluation 2-39
2.11 Documentation of Significant Changes 2-39
3.0 RESPONSIVENESS SUMMARY 3-1
3.1 Overview 3-1
3.2 Background on Community Involvement 3-1
3.3 Summary of Comments Received During Public Comment Period and . . . 3-23.3.1 Comments from Marcus Oshiro, State Representative 3-23.3.2 Comments from the Mililani/Waipio/Melemanu Neighborhood
Board No. 25 3-7
4.0 ACRONYMS 4-1
5.0 REFERENCES 5-1
TABLES
2.1 Summary of Target Organic Analytes Detected in Operable Unit 1 Surface Soil Samples2.2 Summary of Target Organic Analytes Detected in Operable Unit 1 Subsurface Soil Samples2.3 Summary of Metal Concentrations in Surface Soil that are Greater than Background Concen-
trations - Site 17 (DOL Vehicle Maintenance Motor Pool [Building 1029])2.4 Summary of Metal Concentrations in Subsurface Soil that are Greater than Background
Concentrations - Site 17 (DOL Vehicle Maintenance Motor Pool [Building 1029])2.5 Summary of Metal Concentrations in Surface Soil that are Greater than Background Concen-
trations - Site 18 (Distribution Warehouse [Building 1052])2.6 Summary of Metal Concentrations in Subsurface Soil that are Greater than Background
Concentrations - Site 18 (Distribution Warehouse [Building 1052])2.7 Summary of Metal Concentrations in Surface Soil that are Greater than Background Concen-
trations - Site 20 (Petroleum, Oil, and Lubricants Area [Area R])2.8 Summary of Metal Concentrations in Subsurface Soils that are Greater than Background
Concentrations - Site 20 (Petroleum, Oil, and Lubricants Area [Area R])2.9 Summary of Metal Concentrations in Subsurface Soil that are Greater than Background
Concentrations - Site 25 (Auto Craft Shop [Building 910])2.10 Summary of Metal Concentrations in Subsurface Soil that are Greater than Background
Concentrations - Site 42 (Maintenance Area [Building 387])2.11 Summary of Metal Concentrations in Surface Soil that are Greater than Background Concen-
trations - Site 50 (Old Burn Area)2.12 Summary of Metal Concentrations in Subsurface Soil that are Greater than Background
Concentrations - Site 50 (Old Burn Area)
ii Harding Lawson Associates 2250412.04.000927092995 ROD
2.13 Concentration Ranges of Polychlorinated Dibenzodioxins and Dibenzofurans Detected inSubsurface Soil Samples - Site 50 (Old Burn Area)
2.14 Summary of Metal Concentrations in Surface Soil that are Greater than Background Concen-trations - Site 51 (East Range Drum Disposal Area)
2.15 Summary of Metal Concentrations in Subsurface Soil that are Greater than BackgroundConcentrations - Site 51 (East Range Drum Disposal Area)
2.16 Stream Flow Measurements at Site 51 (East Range Drum Disposal Area)2.17 Summary of Metal Concentrations in Filtered Surface Water - Site 51 (East Range Drum
Disposal Area)2.18 Summary of Organic Concentrations in Sediment Samples - Site 51 (East Range Drum
Disposal Area)2.19 Summary of Metal Concentrations in Surface Soil that are Greater than Background Concen-
trations - Site 54a (Aircraft Fuselage Dumping and Cleaning Area)2.20 Summary of Metal Concentrations in Subsurface Soil that are Greater than Background
Concentrations - Site 54a (Aircraft Fuselage Dumping and Cleaning Area)2.21 Summary of Metal Concentrations in Subsurface Soil that are Greater than Background
Concentrations - Site 54b (Aircraft Storage Area)2.22 Summary of Metal Concentrations in Surface Soil that are Greater than Background Concen-
trations - Site 54c (Aircraft Engine Rebuild Area)2.23 Summary of Metal Concentrations in Subsurface Soil that are Greater than Background
Concentrations - Site 54c (Aircraft Engine Rebuild Area)2.24 Summary of Metal Concentrations in Perched, Unfiltered Groundwater - Site 54c (Aircraft
Engine Rebuild Area)2.25 Summary of Organic Concentrations in Unaltered Surface Water - Site 54c (Aircraft Engine
Rebuild Area)2.26 Summary of Metal Concentrations in Unfiltered Surface Water - Site 54c (Aircraft Engine
Rebuild Area)2.27 Summary of Metal Concentrations in Filtered Surface Water - Site 54c (Aircraft Engine
Rebuild Area)2.28 Summary of Metal Concentrations in Sediment Samples - Site 54c (Aircraft Engine Rebuild
Area)
FIGURES
1.1 Location Map of Schofield Barracks1.2 Site Map of Schofield Barracks1.3 Location Map of Sites in Operable Unit 12.1 Regional Groundwater Systems of Oahu, Hawaii2.2 Regional Hydrogeologic Cross Sections A-A' and B-B'2.3 Sampling Locations for Site 17 - Directorate of Logistics Motor Pool, Building 10292.4 Sampling Locations for Site 18 - Distribution Warehouse, Building 10522.5 Sampling Locations for Site 20 - POL Area R2.6 Sampling Locations for Site 25 - Automobile Craft Shop, Building 9102.7 Sampling Locations for Site 42 - Maintenance Area, Building 3872.8 Sampling Locations for Site 50 - Old Burn Area2.9 Sampling Locations for Site 51 - East Range Disposal Area2.10 Location Map of Former Laundry Site (Site 52)2.11 Schematic Diagram of Shaft Pump Chamber and Storage Chambers (Site 53)2.12 Approximate Arrangement of Wells in the Shaft Pump Chamber (Site 53)2.13 Schematic Diagram of Fuel Tanks Adjacent to the Main Tunnel2.14 Sampling Locations for Site 54a - Aircraft Fuselage Dumping and Cleaning Area2.15 Sampling Locations for Site 54b - Aircraft Storage Area2.16 Sampling Locations for Site 54c - Aircraft Engine Rebuild Area2.17 Geophysical Survey Coverage and Results Geophysical Investigation Site 50, Old Burn Area
22504 12.04.00 Harding Lawson Associates iii0927092895 ROD
2.18 Soil-gas Sampling Locations at the Former laundry Site (Site 52)2.19 Boring Locations at the Former Laundry Site (Site 52)
APPENDIX
A SYNOPSIS OF COMMUNITY RELATIONS ACTIVITY
iv Harding Lawson Associates 2250412.04.000927092895 ROD
1.0 DECLARATION
This Final Record of Decision (ROD) for Operable Unit (OU) 1 has been prepared by Harding Lawson
Associates (HLA) for the U.S. Army Environmental Center (USAEC) under Delivery Order 0005
(Task 5) of the Total Environmental Program Support (TEPS) Contract DAAA15-91-D-0013. This
ROD documents the remedial action plan for OU 1 at Schofield Army Barracks (Schofield Barracks),
Island of Oahu, Hawaii.
1.1 Site Name and Location
Schofield Barracks is located in the north-central plateau of the Island of Oahu in the State of Hawaii
(Figure 1.1). The Schofield Barracks installation is approximately 22 miles northwest of the City of
Honolulu. The closest municipality is Wahiawa, which is immediately north of Schofield Barracks.
The installation is divided into two sections, the East Range and the Main Post (Figure 1.2),
encompassing a total area of approximately 27.7 square miles. Wheeler Army Airfield lies between
and to the south of the two Schofield Barracks sections.
The Schofield Barracks Operable Unit 1 (OU 1) investigated the following 12 onpost sites, as shown
in Figure 1.3.
• Site 17: Directorate of Logistics (DOL) Vehicle Maintenance Motor Pool (Building 1029)
Site 18: Distribution Warehouse (Building 1052)
Site 20: Petroleum, Oil and Lubricants (POL) Area (Area R)
Site 25: Automobile Craft Shop (Building 910)
• Site 42: Maintenance Area (Building 387)
Site 50: Old Burn Area
• Site 51: East Range Drum Disposal Area
Site 52: Old Laundry
• Site 53: Shaft Pump Chamber and Storage Chambers
• Site 54a: Aircraft Fuselage Dumping and Cleaning Area
2250412.04.oo Harding Lawson Associates 1-10926092995 ROD
Declaration
• Site 54b: Aircraft Storage Area
• Site 54c: Aircraft Engine Rebuild Area
Based on the preliminary assessment/site investigation (PA/SI), 10 sites were identified as the most
likely sources of the trichloroethene (TCE) contamination detected in the Schofield Barracks water-
supply wells and were the subject of the subsequent remedial investigation (RI). Two of the twelve
sites investigated, Site 52 - Old Laundry and Site 53 - Shaft Pump Chamber and Storage Chambers
were eliminated as possible TCE sources based on the PA/SI effort. The above twelve sites are
discussed further in this document.
1.2 Statement of Basis and Purpose
This decision document (ROD) presents a response action for OU I, which consists of the 12 sites
listed in the previous section. These sites were selected in accordance with the Comprehensive
Environmental Response, Compensation, and Liability Act of 1980 (CERCLA), as amended by the
Superfund Amendments and Reauthorization Act of 1986 (SARA) and, to the extent practicable, the
National Oil and Hazardous Substances Pollution Contingency Plan (NCP). This ROD explains the
basis for selecting the response action for the twelve sites comprising OU 1. Information supporting
the selected response action is contained in the Administrative Record for Schofield Barracks. The
U.S. Environmental Protection Agency (EPA) and the State of Hawaii concur with the selected
response action (remedy).
1.3 Description of the Selected Remedy
On the basis of data collected at the OU 1 sites, no response action is necessary for the OU 1 sites
because these sites do not pose a current or potential threat to human health or the environment.
1.4 Declaration Statement
No response action is necessary to protect human health or the environment at the OU 1 site. This
"no remedial action" alternative was selected because no contaminants were found at the OU 1 sites
1 -2 Harding Lawson Associates 2250412.04.000926092995 ROD
Declaration
investigated that presented an unacceptable risk to human health or the environment based on EPA
risk guidelines.
The "no remedial action" alternative is protective of human health and the environment and complies
with federal and State of Hawaii requirements that are legally applicable or relevant and appropriate
to the remedial action. This action is a permanent solution to the maximum extent practicable or
necessary for OU 1. Because this action will not result in hazardous substances remaining onsite
exceeding unacceptable health-based levels, the five-year review "will not apply to this action.
22504 12.04.00 Harding Lawson Associates 1.30926092695 ROD
Declaration
. ,6/ w X3fcr
MaherBrigadier General, U.S. ArmyCommanding General25th Infantry Division (Light),and U.S. Army, Hawaii
#<A
^ohn J
1-4 Harding Lawson Associates 22504 12.04.000926092695 ROD
Declaration
Julie AndersonU.S. EPA, Region IXDirector, FederalCompliance Office
Facilities
1-5
Declaration
Lawrence Miike, M.D.Director of HealthState of Hawaii
1-6 Harding Lawson Associates 2250412.04.000926092995 ROD
2.0 DECISION SUMMARY
This section provides an overview of the site-specific factors and analyses that led to the selection of
the "no remedial action" decision for the OU 1 sites^ This overview includes a general site descrip-
tion, site history, enforcement and regulatory history, highlights of community participation, scope
and role of OU 1, site characteristics, summary of site risks, and documentation of significant
changes to these elements. Much of the information presented in this section was derived from
previous investigations performed by the U.S. Department of the Army [Army), its contractors, and
the EPA and has been previously presented in more detail in the PA/SI Report (HLA, 1992a),
Remedial Investigation/Feasibility Study (RI/FS) Work Plan (HLA, 1992b), the OU 1 Sampling and
Analysis Plan (SAP) (HLA, 1993), the OU 1 RI (HLA, 1995).
2.1 Schofield Barracks Site Location and Description
Schofield Barracks is located in central Oahu (Figure 1.1) within the physiographic province known
as the Schofield Plateau. Ground surface elevations range from approximately 700 feet (National
Geodetic Vertical Datum of 1929 [NGVD]) near the central portion of Schofield Barracks to approxi-
mately 4000 feet (NGVD) near the western boundary of the Main Post in the Waianae Mountain
Range. The drainage divide of the Schofield Plateau runs roughly east-west through the center of the
Main Post. North of this divide, watercourses flow to the north and discharge into Kaiaka Bay at the
town of Haleiwa. South of this divide, watercourses flow south and discharge into the West Loch of
Pearl Harbor. Narrow gulches dissect the plateau where streams have eroded the land surface.
The relatively flat Schofield Plateau was formed as basaltic lava flowed from the adjacent Koolau and
Waianae volcanoes to the east and west, respectively. The upper 100 to 200 feet of the basaltic
bedrock within the Schofield Plateau is weathered saprolite. The saprolite consists of soil (primarily
fine-grained materials including silt and clay) formed by in situ decomposition of the basaltic
bedrock. The saprolite is underlain by relatively unweathered basaltic bedrock consisting of
2250412.04.oo Harding Lawson Associates 2-10926092695 ROD
Decision Summary
interbedded pahoehoe and a'a lava flows. The lava flows are highly fractured with cinder and
clinker zones.
Three types of groundwater systems have been identified in central Oahu: (1) the Schofield High-
level Water Body, (2) basal groundwater, and (3) dike-impounded groundwater (Figures 2.1 and 2.2].
The Schofield High-level Water Body is located beneath the Schofield Plateau, and subsequently, the
site. This water body is bound to the east and west by dike-impounded groundwater and to the
north and south by basal groundwater. Lower permeability rocks (possibly volcanic dikes and/or
buried ridges) structurally separate these groundwater systems from one another. The Schofield
High-level Water Body aquifer has a relatively high transmissivity and hydraulic conductivity. The
depth to groundwater at the site is approximately BOfrfeet below ground surface (bgsj (approximately
270 feet above mean sea level [MSL]).
The climate at Schofield Barracks, which is south of the Tropic of Cancer at approximately
21 degrees north latitude, is characterized by moderate temperatures that remain relatively constant
throughout the year. The average annual rainfall in the vicinity of Schofield Barracks is approxi-
mately 1.2 meters (Giambelluca and others, 1986), more than half of which occurs during the rainy
season from November through February. Trade winds have an average speed of 12 knots and
prevail from the northeast or east approximately 70 percent of the time.
Because of the relatively large amounts of undeveloped land, combined with a relative!}' large
amount of vertical relief, Schofield Barracks is host to diverse and abundant flora and fauna.
Undisturbed natural vegetation at Schofield Barracks is found primarily in the steep gulches on the
south and west sides. These gulches support birds and other fauna and blocks of forestry plantings
and dense shrubbery growth.
2-2 Harding Lawson Associates 2250412.04.000926092695 ROD
Decision Summary
2.2 Schofield Barracks Installation Operational History
Schofield Barracks was established in 1908 as a base for the Army's mobile defense of Pearl Harbor
and the Island of Oahu. It served as a major support facility during World War Et (WWII) temporarily
housing more than 1 million troops. It also served as a support and training facility during the
Korean and Vietnam conflicts. Since the Vietnam conflict, it has served primarily as a training
facility.
Schofield Barracks is the Army's largest installation outside of the continental United States. It
currently serves as the home of the 25th Infantry Division (Light), whose mission is to be prepared to
respond to war at a moment's notice. Installation facilities include a medical facility, community and
housing support facilities, and transportation and repair facilities.
2.3 Enforcement and Regulatory History
TCE, a commonly used cleaning solvent, was detected in the Schofield Barracks water-supply wells
in 1985. The source of the TCE contamination could not be identified. In September 1986, the
Army installed air-stripping treatment units to remove TCE from the Schofield Barracks domestic
water supply, hi 1987, the EPA established a Maximum Contaminant Level (MCL) for TCE of 5 parts
per billion in drinking water. TCE has not been detected in the Schofield Barracks' treated ground-
water at concentrations greater than this EPA-established limit.
As a result of the detection of TCE in the Schofield Barracks water-supply wells, Schofield Barracks
was placed on the National Priorities List (NPL] in August 1991. The NPL was developed by EPA to
identify sites that may present a risk to public health or the environment.
After Schofield Barracks was placed on the NPL, a Federal Facility Agreement (FFA) was negotiated
among the EPA, the State of Hawaii, and the Army under CERCLA, Section 120. The FFA was
signed by the Army on September 23, 1991, and by the EPA on September 27, 1991. Signature by
the State of Hawaii is still pending. The FFA identified Schofield Barracks as being under the
2250412.04.00 Harding Lawson Associates 2-30926092695 ROD
Decision Summary
jurisdiction, custody, or control of the U.S. Department of Defense (DOD) and subject to the Defense
Environmental Restoration Program (DERP). There have been no enforcement actions at the OU 1
sites.
2.4 Operable Unit 1 Site Selection History
As a part of the FFA, the Army and regulatory agencies agreed to divide the program into subunits
called operable units (OUs) to address potential areas of contamination at Schofield Barracks in an
organized manner. This ROD addresses OU 1, which was established to investigate suspected
sources of TCE contamination to the groundwater system.
Nine sites were identified in the FFA as suspected sources of TCE contamination. These sites
included:
Site 17: DOL Vehicle Maintenance Motor Pool (Building 1029)
Site 18: Distribution Warehouse (Building 1052]
Site 25: Auto Craft Shop (Building 910)
• Site 42: Maintenance Area (Building 387)
Site 50: Old Burn Area
• Site 51: East Range Drum Disposal Area
Site 52: Old Laundry
• Site 53: Shaft Pump Chamber and Storage Chambers
• Site 54: East Range Aircraft Cleaning Areas
After signing of the FFA, the Army performed a PA on these nine sites. The PA involved a site
reconnaissance and extensive records searches to assess whether past or present activities at these
sites could have resulted in contaminant releases. Also, an SI, which involved limited sampling to
assess the presence of site contamination, was conducted at Site 52 (Old Laundry) and Site 51 (East
Range Disposal Area). The results of the PA and SI indicated that no contamination was present at
the Old Laundry site and that past activities at the Old Laundry and the Shaft Pump Chamber and
2-4 Harding Lawson Associates 2250412.04.000926092695 ROD
Decision Summary
Storage Chambers (Site 53) did not present a potential for the release of contamination. Therefore,
these sites were eliminated from further investigations upon completion of the PA/SI. In addition,
based on information obtained during the PA it was believed that the East Range Aircraft Cleaning
Areas (Site 54) included three areas having distinctly different operation histories. Therefore, Site 54
was divided into the following three sites:
• Site 54a: Aircraft Fuselage Dumping and Cleaning Area
• Site 54b: Aircraft Storage Area
• Site 54c: Aircraft Engine Rebuild Area
On the basis of the above discussed PA/SI, one site (20) was added to the nine originally identified
OU 1 sites in the FFA, Site 54 was divided into three sites (Sites 54a, 54b, and 54c) and two sites (52
and 53) were deleted, for a total often OU 1 sites (17, 18, 20, 25, 42, 50, 51, 54a, 54b, and 54c) to be
investigated during the RI. Site 20 (POL Area R) had been used to store and distribute POLs.
In 1992, the Army conducted an RI of the ten OU 1 sites. The RI included extensive soil-gas, surface
and subsurface soil, and surface-water and sediment sampling. The results of the RI were presented
in a Final RI Report, which was completed on April 18, 1995, and is available along with the PA/SI
Report in the Administrative Record.
2.5 Operable Unit 1 Site Description
The location of the twelve sites (i.e., the 10 sites identified above plus Sites 52 and 53) investigated
under the PA/SI or RI are shown in Figure 1.3. Six of the sites are located on the Schofield Barracks
Main Post, and six of the sites are located on the Schofield Barracks East Range. A description of
each OU 1 site, including physical characteristics, past operations, and potential sources of contami-
nation, is provided below.
2250412.04.oo Harding Lawson Associates 2-50926092995 ROD
Decision Summary
2.5.1 Site 17: DOL Vehicle Maintenance Motor Pool (Building 1029)
Site 17, which includes Building 1029 and its surrounding yard, is currently used for motor pool
storage and repair. The site is in the north-central portion of the Main Post. Figure 2.3* shows the
major features at the site. Aerial photographs taken from 1967 through 1981 indicate that up to 150
vehicles were stored in the yard. A grease rack installed during the 1970s is located near Build-
ing 1029. Most of the site is covered by a gravel parking lot.
Records and historical aerial photographs indicate that the area around Building 1029 has been used
for vehicle storage and maintenance for many years. This type of maintenance operation may have
involved the use of solvents for cleaning engine parts. A 1978 U.S. Army Corps of Engineers (COEJ
report listed this site as one of the facilities that discharged POL and solvents into a drainage ditch.
There is a potential that solvents may have spilled at the site, particularly in the area near the grease
rack.
2.5.2 Site 18: Distribution Warehouse (Building 1052)
Site 18, which includes Building 1052, a paved yard, and adjacent drainage ditch, is in the north-
central portion of the Main Post. Figure 2.4 shows the major features of the site. Records indicated
that Building 1052 was destroyed and rebuilt several times since its original construction in 1950.
This building was used to store automobile parts from 1950 to 1985. Historical aerial photographs
indicate that the surrounding parking lot was used to store crates or boxes. During certain periods
after the building was removed, large and small vehicles were stored on a concrete slab southeast of
the building. After 1985, the site was used to store a variety of materials, including drums of
solvents. Because of past vehicle and solvent storage, there is a potential that solvents, oils, and
lubricants may have been spilled on the parking lot surrounding the building.
2.5.3 Site 20: Petroleum, Oil and Lubricant Area (Area R)
Site 20, also known as Area R, is north of McMahon Road and is a storage area for POL products.
Site 20 contains aboveground storage and dispensing tanks enclosed in concrete retaining structures
2-6 Harding Lawson Associates 2250412.04.000926092695 ROD
Decision Summary
for leakage containment. Major features of the site are shown in Figure 2.5. Waste POL and solvents
are stored at the site, and records indicate that waste oil and waste solvent were stored onsite in
drums during past operations. Large areas of stained soil were observed during the review of
historical aerial photographs. This site was investigated because of the potential for spillage or leaks
of POLs or solvents during site operations.
2.5.4 Site 25: Auto Craft Shop (Building 910)
Site 25 is approximately 800 feet west of Lyman Gate on the Main Post of Schofield Barracks. The
major site features are shown in Figure 2.6. The site consists of Building 910, which was constructed
in 1977 and is used as an automobile craft shop. Prior to 1977, this site used as a parade and
practice ground by the llth Signal Corps. Building 910 has 32 bays that are used for a variety of
vehicle repairs. Oils and other materials generated from facility wash down and steam-cleaning
operations are collected in an oil/water separator. Oils are then discharged to a waste-oil storage
tank, and water is discharged to the sewer. Unused solvents and antifreeze are stored in a small
shed in 5-gallon containers and 55-gallon drums. The site was investigated because of its past
history of solvent use and the associated potential for spillage.
2.5.5 Site 42: Maintenance Area (Building 387)
Site 42 is in the eastern portion of the Main Post. The site consists of Building 387, which currently
houses the U.S. Army Test, Measurement, and Diagnostic Equipment Support Detachment (TMDE)
calibration shop. Major site features are shown in Figure 2.7. The building was originally con-
structed in 1924 and was used as an ice plant, refrigeration shop, and cold plant during much of its
history. There is also some evidence suggesting that the site was used as a maintenance facility at
one time. Records indicated that during past operations, wastes, possibly chlorinated solvents, were
stored in an aboveground storage tank and that waste oil may have been stored in drums above a
lined sand pit. More recently, oil and solvents were stored in 55-gallon drums before being
transferred to the central POL collection point. The site was investigated because of the reported
2250412.04.00 Harding Lawson Associates 2-70926092695 ROD
Decision Summary
usage of solvents for weed and dust control and because of the potential for leakage from the waste
storage tank.
2.5.6 Site 50: Old Bum Area
Site 50 is a 1/2-acre site on the north side of Kauai Street between Niihau and Lanai Streets on the
Main Post just west of the Former Landfill. Major site features are shown in Figure 2.8. The site is a
burn area used to incinerate unknown refuse material before the sanitary landfill was constructed.
Burn operations may have begun as early as 1942 and likely occurred from 1950 to 1960 and in
1985. The site is currently used to dispose of excess gunpowder. A review of historical aerial
photographs indicated that several potential disposal trenches were excavated at the site. Drums
were visible in some of these aerial photographs. The site terrain is generally flat; however, north-
south trending areas of subsided ground are present and may be a result of the disposal trenches.
The southern portion of the site is used for bivouac and round cutting operations. The northern
portion of the site is used exclusively for the ignition of cut powder in the burn trench. Records
indicate that the types of materials incinerated at the site likely consisted of gunpowder and
construction debris. The site was investigated because of its past history of disposal operations and
because drums were observed in some of the disposal trenches.
2.5.7 Site 51: East Range Drum Disposal Area
Site 51, known as the East Range Drum Disposal Area, is on a southwesterly facing slope of a ravine
in the Schofield Barracks East Range, approximately 2 miles east-northeast of the Schofield Barracks
water-supply wells. The southwest facing cliff drops approximately 150 feet to a northern tributary
of the South Fork of Kaukonahua Stream. As shown in Figure 2.9, three separate disposal areas are
located within the ravines along this southwest-facing cliff. Records indicate that dumping at the site
has occurred since WWII, when troops were bivouacked in the area. Wastes appear to be composed
of barbed and concertina wire, broken concrete and building debris, and empty, unmarked 55-gallon
drums. As many as 827 drums were reported to have been present at the site in 1988 [HLA, 1992a).
A review of historical aerial photographs indicates that wastes or debris appeared to have been
2-8 Harding Lawson Associates 2250412.04.000926092695 ROD

Decision Summary
dumped at the East Range Disposal Area after 1953 and before 1970. Most of the debris and rusted
drum remnants were removed in 1989. The site was investigated because of the potential that the
disposed drums may have contained solvents or other contaminants.
2.5.8 Site 52: Old Laundry
Site 52, known as the Old Laundry, was immediately north of the Schofield water-supply wells and
began operation around 1943. An associated boiler plant was adjacent to the laundry facility on the
east side. Figure 2.10 shows the location of the Old Laundry and associated boiler plant. The
laundry facility was demolished in approximately 1971, and most of the site now lies beneath
approximately 30 feet of artificial fill and a portion of the H2 Freeway. No indication was found of
onsite dry-cleaning equipment or solvent storage tanks at the Old Laundry. However, review of
records indicated that past usages of TCE at Schofield Barracks included many household products,
industrial dry-cleaning solvents, and degreasing agents. Because of the proximity of the site to the
Schofield Barracks water-supply wells and the possibility of historical dry cleaning operations, the
Army requested that the Old Laundry be investigated as a potential source of TCE or solvents to soil
or groundwater.
2.5.9 Site 53: Shaft Pump Chamber and Storage Chambers
Site 53 consists of two subterranean chambers (the underground storage chamber and the pump
chamber) in which the four Schofield Barracks water-supply wells and various pumping and
electrical equipment are located (Figure 2.11). The water-supply wells provide water to Schofield
Barracks, parts of Wheeler Army Airfield, Helemano Military Reservation, and the Naval Communica-
tions station near Wahiawa. The pump chamber is between Kamehameha Highway and the H2
Freeway. Oil was used in the pump chamber to lubricate the turbine-type pump assemblies.
Records indicate that operations in the tunnel are performed carefully and that precautions are taken
to prevent chemicals from entering the wells. At times, pump motors failed, spraying machine oil on
the walls of the pump room. These spills were cleaned up with wood shavings up through the
1970s, but more recently they have been cleaned up with clean rags and biodegradable detergents
2250412.04.oo Harding Lawson Associates 2-90926092695 ROD
Decision Summary
approved for the food industry. Drums have been used to store waste oil in the pump chamber
(Figure 2.12]. Three 10,000-gallon underground tanks are present in the underground storage
chamber (Figure 2.13). The underground tanks were used in the past to power emergency generators
during power failures. These underground tanks were also located in the underground storage
chamber. These underground tanks contained gasoline and were reported to have been cleaned and
filled with water before 1970 and are currently not in use. Records indicate that solvents were not
used at this site.
2.5.10 Site 54a: Aircraft Fuselage Dumping and Cleaning Area
Site 54a is a relatively flat area between two unnamed tributaries of Kaukonahua Stream. The site
was reported to have been used as an aircraft fuselage dumping and cleaning area. The site is a few
hundred feet west of the East Range Disposal Area. The site shown in Figure 2.14, is approximately
600 feet by 1400 feet in dimension, with a total area of approximately 19 acres. This area was
investigated because solvents, including TCE, were reportedly used to clean airplane parts in this
area.
2.5.11 Site 54b: Aircraft Storage Area
Site 54b is the location of a former aircraft storage area that was identified through interviews with
former and current Schofield Barracks employees and a review of historical aerial photographs. The
major features of this site are shown in Figure 2.15. The site is in the southwest corner of the East
Range and the southeast corner of Wheeler Army Airfield. The Leilehua Golf Course occupies part of
the site, extending across both Kamehameha Highway and the H2 Freeway. The site also includes
the eastern portion of Wheeler Army Airfield and a commercial offpost area south of the golf course.
Site 54b was used to store aircraft and also could have been used as an aircraft cleaning area.
Several bunkers were built on the site to protect airplanes from attack during WWIE. The site was
investigated because TCE, carbon tetrachloride, or other solvents may have been used to clean and
degrease aircraft at the site.
2-10 Harding Lawson Associates 2250412.04.000926092695 ROD
Decision Summary
2.5.12 Site54c: Aircraft Engine Rebuild Area
Site 54c is the site of a former aircraft engine rebuild area. Records indicate that this site may have
been an aircraft engine maintenance area for the entire Pacific region. As shown in Figure 2.16, this
site occupied a stream ravine that was probably chosen because it provided protection from air
attacks. The site operated 24 hours per day from 1942 through 1945 to overhaul piston-type aircraft
engines. Carbon tetrachloride was the solvent used for this type of activity during WWII, but other
solvents may also have been used.
The rebuild operations took place in 16 to 17 open structures that were located on concrete pads and
had roofs but no permanent walls. The site was investigated because of the use of carbon tetrachlo-
ride and possibly other solvents, including TCE.
2.6 Highlights of Community Participation
hi an effort to involve the public, the Army has undertaken several public and community awareness
efforts including issuance of employee bulletins and post newspaper articles for Schofield Barracks
employees, media interviews, news releases, and meetings with local officials and neighborhood
boards for offpost residents, hi addition, the Army has held public meetings, issued fact sheets, and
established an Army contact for the public at Schofield Barracks' Public Affairs Office. Information
repositories containing copies of work plans, technical reports, fact sheets, and other materials related
to the project are available for public review at the following local repositories:
Million! Public Library95-450 Makaimoimo StreetMililani, Hawaii 96879
Wahiawa Public Library820 California AvenueWahiawa, Hawaii 96786
U.S. Army Garrison, HawaiiDirectorate of Public WorksBuilding 300Wheeler Army Airfield, Hawaii
22S04i2.04.oo Harding Lawson Associates 2-110926092695 ROD
Decision Summary
State of Hawaii Department of HealthEnvironmental Quality Control Office465 South King StreetHonolulu, Hawaii 96813
On May 23,1995, the Army presented the Proposed Plan for OU 1 at Schofield Barracks to the public
for review and comment. The Proposed Plan summarizes information collected during the OU 1
PA/SI and RI and other documents in the Administrative Record for the Schofield Barracks that are
available at the above local repositories.
Comments regarding the Proposed Plan were accepted during a 30-day public review and comment
period that began on July 7, 1995. A public meeting was held on July 18, 1995, at Hale Koa at
Wahiawa District Park, Wahiawa, Hawaii. At that time, the public had the opportunity to ask the
Army questions and express concerns about the plan. In addition, written comments were accepted
during the public comment period. Responses to comments received during the public comment
period are included in the Responsiveness Summary (Section 3.0), which is part of this ROD. The
public comment period, as discussed above, is a continuation of the Army's commitment to
community involvement in the Schofield Barracks Installation Restoration Program (IRP) and is
required by CERCLA.
2.7 Scope and Role of Operable Unit 1
The role of OU 1 in the overall NPL program for Schofield Barracks is to identify and eliminate
sources of TCE to the groundwater system. The cleanup of TCE already in the groundwater system is
addressed under OU 2. OU 3 addresses contamination sources at Schofield Barracks not covered by
other OUs. OU 4 addresses contamination at the Former Schofield Barracks Landfill.
The objectives of the OU 1 program are to:
• Assess the presence or absence of TCE and other contaminants at these sites.
• Assess if TCE and other contaminants are present, assess the extent of contamination.
2-12 Harding Lawson Associates 2250412.04.000926092695 ROD
Decision Summary
• Assess if TCE and other contaminants are present, assess environmental and human healthrisks posed by this contamination.
• Assess if TCE and other contaminants are present in levels that endanger human health andthe environment, identify and evaluate remedial alternatives for site cleanup.
• Cleanup site contamination to levels that are protective of human health and the environ-ment by implementing the preferred remedial alternative.
A PA/SI and/or RI was performed for each of the initial 12 OU 1 sites. TCE was the primary
contaminant of concern that was analyzed for at the OU 1 sites. However, other potential contami-
nants were tested for during the OU 1 investigations. The list of contaminants that were tested for
was based on past site operations. SI and RI activities conducted at the OU 1 sites included surface
geophysics, shallow and deep soil-gas sampling, surface soil sampling, subsurface soil sampling of
soil borings, and surface-water and sediment sampling. The results of these OU 1 field investigations
indicated that no current or potential threat to human health or the environment existed at the OU 1
sites. Therefore, "no remedial action" is necessary to achieve protection of human health and the
environment for the OU 1 sites. For this reason, an FS to evaluate alternatives for remediating the
OU 1 sites was not performed.
2.8 Site Characteristics
To assess site characteristics surface geophysics, soil-gas, surface-water, sediment, surface soil,
subsurface soil, tank residual, and/or perched groundwater sampling/surveying were performed.
Samples were analyzed for target compound list (TCL) volatile organic compounds (VOCs), TCL
semivolatile organic compounds (SVOCs), target analyte list (TALj metals, total volatile hydrocarbons
(TVH), TCL pesticides/polychlorinatedbiphenyls (PCBs), explosives, polychlorinated dibenzodioxins
(PCDDs), and/or dibenzofurans (PCDFs). A summary of detected organic analytes in surface soil and
subsurface soil samples are presented in Tables 2.1 and 2.2, respectively.
To assess the detected metals in surface and subsurface soil, background soil samples were collected
and analyzed. Background analyses of surface soil and subsurface soil were performed to assess
whether the concentrations of chemicals detected at the Schofield Barracks sites are representative of
2250412.04.00 Harding Lawson Associates 2-130926092695 ROD
Decision Summary
natural conditions. Background concentrations are the concentrations of analytes occurring in native
soil related to geologic conditions and processes as well as to soil chemistry. Samples for back-
ground analyses were collected in areas assumed to be outside potentially contaminated areas.
For this assessment, the background concentrations for inorganic analytes are represented by the 95
percent upper confidence limit (UCL) developed using the data for background samples. The 95
percent UCL was calculated using the Student t distribution. The use of the 95 percent UCL analyte
concentration in environmental samples is consistent with EPA guidance (EPA, 1989). A discussion
of the background sampling and data evaluation is presented in the Final Remedial Investigation .
Report for OU 1 (HLA, 1995).
In cases where analytes were not detected above the analytical reporting level (RL), a value equal to
one-half the RL was used to calculate the UCL. For some analytes, the majority of the values used to
calculate the 95 percent UCL were not detected above the RL. Therefore, the calculated value for the
95 percent UCL background concentration is less than the RL for the respective analyte(s) in the
investigative samples, hi these cases and in cases where the analyte was not detected above the
respective RL, the RL is used instead of the 95 percent UCL on the appropriate summary table of
analyte concentrations that are greater than background concentrations. Therefore, the discussions in
the following subsections will pertain only to those analytes that were detected above the corre-
sponding RL and that exceed the 95 percent UCL background concentration.
Sections 2.8.1 through 2.8.12 present an evaluation of the investigative results for the 12 OU 1 sites.
2.8.1 Site 17: DOL Vehicle Maintenance Motor Pool (Building 1029)
Soil-gas sampling was performed at Site 17 as a screening tool to identify areas within the site where
VOCs may be present. This soil-gas information, in conjunction with site-specific information, was
then used to direct and perform subsequent sampling activities (i.e., surface and subsurface soil
sampling) in areas of highest potential contamination. Twenty-six shallow soil-gas samples were
2-14 Harding Lawson Associates 2250412.04.000926092695 ROD
Decision Summary
collected and analyzed at Site 17 (Figure 2.3). No detections of TCE or other solvents were reported
above method detection limits in any of the shallow soil-gas samples at Site 17. Relatively low
concentrations of TVH and aromatic VOCs related to fuel products (including ethylbenztene, toluene,
and total xylenes) were detected in some of the shallow soil-gas samples. The highest concentrations
of TVH were detected in samples collected from under and to the east of the grease rack.
Surface soil samples were collected from four rectangular plots at the site (Figure 2.3). The samples
were analyzed for TCL SVOCs and TAL metals. TCL SVOCs were not detected in any of the four
samples in concentrations above the method detection limit. Metals were detected in the four
samples. Metals concentrations exceeding background concentrations in surface soil are summarized
in Table 2.3.
At Site 17, four borings were drilled and sampled to 20 feet bgs. The locations of the four borings
are shown in Figure 2.3. Subsurface soil samples from each of the borings were analyzed for TCL
VOCs, TCL SVOCs, TAL metals, and TVH. VOCs were not detected at concentrations above the
method detection limits in subsurface samples from the four borings. The only SVOCs detected were
low concentrations of tentatively identified compounds (TICs). TVH (diesel fraction) was detected at
a concentration of 17.0 micrograms per gram (/;g/g) at 2.5 feet bgs in Boring 17MPSB001 (Table 2.2).
The location of Boring 17MPSB001 is presented in Figure 2.3 as Soil Boring Location 1. Metals
concentrations exceeding background concentrations for subsurface soil are presented in Table 2.4.
In summary, TCE or other solvents were not detected in the samples collected and analyzed at
Site 17. The absence of TCE detections at Site 17 indicates that significant quantities of TCE were
not released at this site and that the site does not appear to be a source of TCE. Low levels of TVH
and some fuel-related aromatic VOCs were detected in the shallow soil-gas and subsurface soil
samples indicating that motor pool operations at Site 17 may have resulted in the release of small
amounts of POLs to soil at the site. Some metals were detected in the surface and subsurface soil
22504i2.04.oo Harding Lawson Associates 2-150926092695 ROD
Decision Summary
samples above background concentrations; however, on the basis of available historical site
information, no activities have been identified that could have resulted in metals deposition (HLA,
1995).
2.8.2 Site 18: Distribution Warehouse (Building 1052)
Soil-gas sampling was performed at Site 18 as a screening tool to identify areas within the site where
VOCs may be present. This soil-gas information, in conjunction with site-specific information was
then used to direct and perform subsequent sampling activities (i.e., surface and subsurface soil
sampling) in areas of highest potential contamination. Twenty shallow soil-gas samples were
collected and analyzed at Site 18 (Figure 2.4). No detections of TCE or other solvents were reported
above method detection limits in the shallow soil-gas samples at Site 18. Relatively low concentra-
tions of TVH and aromatic VOCs related to fuel products (including ethylbenzene, toluene, and total
xylenes) were detected in some of the shallow soil-gas samples. The highest concentrations of TVH
were detected in samples collected from the following areas: (1) near the southern corner of the
building where 55-gallon drums are presently stored; (2) on the northeast side of the building, which
is outside the commodity storage area; and (3) adjacent to and in the northwestern end of the
drainage ditch.
A deep soil-gas sample was collected and analyzed from Boring 18DWSB005 (Soil Boring Location 5
in Figure 2.4) at a depth of 20 feet. No TVH or VOCs were detected above method detection limits in
this sample.
Three surface soil samples were collected from the drainage area, which is the only unpaved area of
the site (Figure 2.4). The samples were analyzed for TCL SVOCs and TAL metals. SVOCs were not
detected in any of the three samples in concentrations above the method detection limit. Metals
were detected in all of the surface soil samples. Metals concentration exceeding background
concentrations in surface soil are summarized in Table 2.5.
2-16 Harding Lawson Associates 2250412.04.000926092695 ROD
Decision Summary
At Site 18, five soil borings were drilled and sampled. The locations of the five borings are shown in
Figure 2.4. Four of the five borings were drilled to 20 feet bgs, and one was drilled to 60 feet bgs.
Subsurface soil samples from each of the borings were analyzed for TCL VOCs, TCL SVOCs, TAL
metals, and TVH. TCE was detected at a concentration of 0.220 ;/g/g in Boring 18DWSB003 (Soil
Boring Location 3 in Figure 2.4) at a depth of 2.5 feet (Table 2.2). However, this result was qualified
by the laboratory as uncertain because of analytical interferences from the native soil matrix making
the quantitatton and/or identification of TCE suspect. Boring 18DWSB003 is one of two 20-foot
borings located in the drainage ditch adjacent to Site 18. This TCE detection is believed to be an
anomaly because (1) it is a low concentration that was qualified by the laboratory as estimated
because of interferences in the sample, (2) TCE was not detected in deeper soil samples from the
same boring, and (3) TCE was not detected in any of the soil samples from a 20-foot boring upstream
of Boring 18DWSB003 in the same drainage ditch. No other VOCs were detected above method
detection limits in any of the subsurface soil samples collected at Site 18.
The only SVOCs detected in the subsurface soil samples were low concentrations of TICs. TVH was
not detected at concentrations exceeding the method detection limits in the subsurface soil samples.
Metals were detected in the subsurface soil samples. Metals concentrations exceeding background
concentrations in subsurface soil are summarized in Table 2.6.
In summary, a low concentration of TCE was detected in a shallow subsurface soil sample in the
drainage ditch adjacent to the site. However, because this sample was qualified as estimated and
because TCE was not detected in deeper samples from the same boring, samples from an upstream
boring in the same drainage ditch or other samples from the site, it is considered to be a spurious
detection of TCE. This lack of TCE contamination indicates that significant quantities of TCE have
not been released at Site 18 and that this site does not appear to be a source of TCE to the ground-
water system. No other solvents were detected in any of the samples. Low levels of TVH and some
fuel-related aromatic VOCs were detected in the shallow soil-gas samples indicating that motor pool
2250412.04.00 Harding Lawson Associates 2-170926092695 ROD
Decision Summary
operations at Site 18 may have resulted in release of small amounts of POLs to soil at the site.
However, TVH was not detected in subsurface soil samples throughout the site. Metals were
detected in concentrations above background concentrations in the surface and subsurface soil
samples (HLA, 1995); however, on the basis of available historical information, no activities have
been identified that could have resulted in metals deposition (HLA, 1992a).
2.8.3 Site 2O: Petroleum, Oil and Lubricants Area (Area R)
Soil-gas sampling was performed at Site 20 as a screening tool to identify areas within the site where
VOCs may be present. This soil-gas information, in conjunction with site-specific information, was
then used to direct and perform the subsequent sampling activities (i.e., surface and subsurface soil
sampling) in areas of highest potential contamination. Thirty-five shallow soil-gas samples were
collected at Site 20 (Figure 2.5). Neither TCE or other solvents were detected above method
detection limits in the shallow soil-gas samples. TVH and aromatic VOCs related to fuel products
(including toluene, total xylenes, and benzene) were detected in some of the shallow soil-gas
samples. The highest concentrations of TVH were detected in samples just off the road within
Waikoloa Gulch and on either side of the solvent storage tanks.
Deep soil-gas samples were collected from three soil borings drilled at Site 20 (Figure 2.5). Neither
TCE or other solvents were detected above method detection limits in these samples. TVH was
detected in samples from the three borings.
Surface soil samples were collected from three rectangular plots at the site (Figure 2.5). The samples
were analyzed for TCL SVOCs and TAL metals. SVOCs were not detected in the three samples in
concentrations exceeding the method detection limits Metals were detected in the three surface soil
samples. Metals concentrations exceeding background concentrations in surface soil are summarized
in Table 2.7.
2-18 Harding Lawson Associates 2250412.04.000926092695 ROD
Decision Summary
Three borings were drilled and sampled at the site. Two of the borings were drilled to 100 feet bgs,
and one boring was drilled to 60 feet bgs (Figure 2.5). Subsurface soil samples from each of the
borings were analyzed for TCL VOCs, TCLs SVOCs, TAL metals, TVH, and pesticides/polychlorinated
biphenyls (PCBs). SVOCs were not detected at concentrations exceeding the method detection limits
in the subsurface soil samples. Acetone was the only VOC detected (Table 2.2). Acetone was
detected in Boring 20ARSB002 (Soil Boring Location 2 in Figure 2.5) at 2.5, 9.0, and 19.0 feet bgs at
concentrations of 0.014, 0.028, and 0.018 fjg/g, respectively. Acetone is commonly used in analytical
laboratories. Therefore, it is likely that this low level of acetone is a laboratory artifact (HLA, 1995).
Arochlor 1260 was detected at a concentration of 0.201 ji/g/g in one sample from a depth of 2.5 feet in
Boring 20ARSB001 (Table 2.2). The location of Boring 20ARSB001 is presented in Figure 2.5 as Soil
Boring Location 1. Because Arochlor 1260 was detected in only one sample and because it was not
detected in surface soil, it is believed to either be an anomaly or the result of a very small, localized
spill that does not necessitate further investigation. Metals concentrations were detected in the
subsurface soil samples. Metals concentrations exceeding the background concentrations in
subsurface soil are summarized in Table 2.8.
Samples of residual tank contents were collected from the three solvent storage tanks at Battery 2A.
The sampling activity was conducted at the request of USAEC. The liquid samples were submitted
to the laboratory for solvent identification. Tank samples were labeled TANKl, TANK2, and TANKS
and, correspondingly, the solvent tanks are identified from east to west as 1, 2, and 3 (see Figure 2.5).
Target VOCs that were detected in Sample TANKl include acetone and total xylenes at concentra-
tions of 6.0 grams per liter (g/1) and 2.0 g/1, respectively. Acetone was the only target VOC detected
in Sample TANK2. Acetone was detected at a concentration of 5.5 g/1. Target VOCs detected in
Sample TANKS include acetone and total xylenes at concentrations of 5.3 g/1 and 1.8 g/1, respective-
ly. TCE was not detected in the three storage tank samples. Several TTCs were reported in the three
tank samples. Many of the TICs appear to be related to petroleum products. For this reason, it is
believed that the most recent use of these tanks was to store petroleum-related products.
2250412.04.oo Harding Lawson Associates 2-190926092695 ROD
Decision Summary
In summary, no TCE or other solvents were detected in the soil samples, indicating that TCE or other
solvents were not released in significant quantities at Site 20 and that this site does not appear to be
a source of contamination to the groundwater system. However, because of the presence of TICs
related to petroleum products (gasoline), it is believed that these tanks were most recently used to
store petroleum products. Metals were detected above background concentrations in the surface and
subsurface soil samples; however, on the basis of available historical information, no activities have
been identified that could have resulted in metals deposition (HLA, 1995]. Low concentrations of
TVH and aromatic VOCs were detected in the shallow soil-gas samples, which indicates that
activities at Site 20, also known as the Bulk Fuel Yard, may have resulted in the release of small
quantities of some POL products to the soil. However, TVH was not detected in the subsurface-soil
samples located in the area of highest soil-gas concentrations.
2.8.4 Site 25: Automobile Craft Shop (Building 910)
Soil-gas sampling was performed at Site 25 as a screening tool to identify areas within the site where
VOCs may be present. This soil-gas information, in conjunction with site-specific information, was
then used to direct and perform the subsequent sampling activities (i.e., subsurface soil sampling) in
areas of highest potential contamination. Eighteen shallow soil-gas samples at Site 25 were collected
and analyzed from locations shown in Figure 2.6. No TCE or other solvents were detected above
method detection limits in the shallow soil-gas samples. TVH and toluene were the only volatiles
detected in some of the soil-gas locations. The highest concentrations of TVH were detected in
samples from the easternmost end of the building and at the drum storage area.
At Site 25, three borings were drilled and sampled to 20 feet bgs. The locations of these borings are
shown in Figure 2.6. Subsurface soil samples from each of the borings were analyzed for TCL VOCs,
TCL SVOCs, TAL metals and TVH. The only reported detections of VOCs were acetone and
methyethyl ketone (MEK) (Table 2.2). Acetone was detected in samples from Boring 25ARSB001
(Soil Boring Location 1 in Figure 2.6) at 2.0 and 2.5 feet bgs at concentrations of 0.180 and
0.020 //g/g, respectively, and from Boring 25ARSB002 (Soil Boring Location 2 in Figure 2.6) at 2.5
2-20 Harding Lawson Associates 2250412.04.000926092695 ROD
Decision Summary
and 14.5 feet bgs at concentrations of 0.200 and 0.440 ;/g/g, respectively. MEK was detected in a
sample from Boring 25ARSB002 at 14.5 feet bgs at a concentration of 0.047 fjg/g. Because of the low
concentrations of these compounds and because they are both common laboratory contaminants, it is
likely that these detections are laboratory artifacts. The only SVOCs reported by the laboratory were
identified as low concentrations of TTCs. TVH was not detected in any of the subsurface soil
samples. Metals were detected in the subsurface soil samples. Metals concentration exceeding
background concentrations in subsurface soil are summarized in Table 2.9.
La summary, TCE was not detected in the environmental samples collected and analyzed from this
site, indicating that TCE was not released in significant quantities at Site 25 and that this site does
not appear to be a source of contamination to the groundwater system. The only solvents detected in
samples at Site 25 were low concentrations of acetone and MEK, which are likely laboratory artifacts.
Metals were detected in the subsurface soil samples above background concentrations; however, on
the basis of available historical information, no activities have been identified that could have
resulted in metals deposition (HLA, 1995).
TVH and toluene were detected at low levels in some shallow soil-gas samples. The detection of low
concentrations of TVH and toluene indicates that the Automobile Craft Shop (Site 25) operations may
have resulted in the release of small quantities of POL products to the soil at this site. However,
TVH was not detected in the subsurface soil samples located in the areas of highest soil-gas
concentrations.
2.8.5 Site 42: Maintenance Area (Building 387)
Soil-gas sampling was performed at Site 42 as a screening tool to identify areas within the site where
VOCs may be present. This soil-gas information, in conjunction with site-specific information, was
then used to direct and perform subsequent sampling activities (i.e., subsurface soil sampling) in
areas of highest potential contamination. Twelve shallow soil-gas samples were collected and
analyzed from Site 42 (Figure 2.7). Neither TCE nor other solvents were reported above method
2250412.04.00 Harding Lawson Associates 2-210926092695 ROD
Decision Summary
detection limits in the shallow soil-gas samples. TVH was detected in samples from 3 of the
12 sampling locations. The highest concentrations of TVH were detected near the loading platforms
on the northeast and southeast sides of the building.
Two borings were drilled and sampled at Site 42. One of the borings was drilled to 20 feet bgs on
the basis of the shallow soil-gas survey results. The other boring was drilled to 60 feet bgs in the
suspected location of a reported 250-gallon storage tank. The locations of the borings are shown in
Figure 2.7. Subsurface soil samples from each boring were analyzed for TCL VOCs, TCL SVOCs,
TAL metals, and TVH. VOCs were not detected at concentrations exceeding the method detection
limits in the subsurface soil samples from the two borings. The only SVOCs that were reported by
the laboratory were identified as low concentrations of TICs. Metals were detected in both borings,
and concentrations exceeding background concentrations are summarized in Table 2.10. TVH (diesel
fraction) was detected in Boring 42MASB001 (Soil Boring Location 1 in Figure 2.7) at a concentration
of 19.7 //g/g in a sample collected at 2.5 feet bgs (Table 2.2). TVH as gasoline was detected in Boring
42MASB002 (Soil Boring Location 2 in Figure 2.7) at 2.5 feet bgs at a concentration of 13.9 fjg/g
(Table 2.2).
In summary, TCE and other solvents were not detected in any of the samples from this site,
indicating that TCE was not released in significant quantities at Site 42 and that this site does not
appear to be a source of TCE contamination to the groundwater system. Metals concentrations
exceeding background were detected in the soil samples; however, on the basis of available
information, no activities have been identified that could have resulted in metals deposition (HLA,
1995). Low concentrations of TVH were detected in shallow soil-gas samples and in two subsurface
soil samples, respectively. The detection of low TVH concentrations indicates that the past
maintenance operations at this site may have resulted in the release of small quantities of some POL
products to the soil.
2-22 Harding Lawson Associates 2250412.04.000926092695 ROD
Decision Summary
2.8.6 Site 50: Old Bum Area
Two geophysical methods, magnetics and electromagnetic (EM) profiling, were used to assess the
locations and extent of disposal areas at Site 50. The extent of the disposal areas was mapped by
correlating areas of anomalous geophysical response recorded on adjacent survey transects. The
locations of the geophysical survey transects and interpreted locations of subsurface disposal at
Site 50 are shown in Figure 2.17. La general, substantial amounts of buried metal were detected in
the western half of the site. The data indicate that there may be subsurface debris to the north,
south, and west, beyond the limits of the geophysical survey. In particular, EM data obtained along
the access road in the southwest corner of the site indicate that buried metal is present approxi-
mately 50 feet west of the current site boundary. In addition, data obtained along Transects N 337.5
and N 075, the northern and southern site boundaries, show anomalous patterns indicative of buried
metal. Because of the surrounding dense brush, the geophysical survey area could not be extended
to the limits of subsurface disposal.
There are north-south trending elongated depressions in the ground surface in the western half of
Site 50. The depressions are 2 to 3 feet wide and spaced 2 to 3 feet apart, suggesting narrow and
closely-spaced burial trenches. It is not possible to distinguish the individual trench boundaries on
the basis of the geophysical data because the data show overlapping patterns in this area.
Soil-gas sampling was performed at Site 50 as a screening tool to identify areas within the site where
VOCs may be present. This soil-gas information, in conjunction with site-specific information, was
then used to direct and perform the subsequent sampling activities (i.e., surface and subsurface soil
sampling) in areas of highest potential contamination. Thirty-four shallow soil-gas samples at Site 50
were collected and analyzed from the sample locations shown in Figure 2.8. VOCs were not detected
above method detection limits in the shallow soil-gas samples. TVH was detected in some of the
shallow soil-gas samples. The highest TVH concentrations were detected in the west and southwest
areas of the site.
2250412.04.oo Harding Lawson Associates 2-230926092695 ROD
Decision Summary
Deep soil-gas samples were collected and analyzed for Borings 50BASB003, 50BASB004, and
50BASB005 (Soil Boring Locations 3 through 5, respectively, in Figure 2.8). Low concentrations of
TVH; l,l,l-trichloroethane(l,l,l-TCA); and tetrachlorethene (PCE) were detected in some of the deep
soil-gas samples.
Surface soil samples were collected from seven rectangular plots at the site (Figure 2.8). The samples
were analyzed for TCL SVOCs, TCL pesticides/PCBs, TAL metals, explosives, and PCDD/PCDF.
The SVOCs fluorene and phenanthrene were detected in Sample 50BASS003 (Surface Soil Sampling
Location 3 in Figure 2.8) at concentrations of 4.40 and 0.670 g/g, respectively (Table 2.1). These
analytes are combustion products of petroleum fuels. Metals were detected in all seven of the
samples; those samples exceeding background concentrations are summarized in Table 2.11.
Arochlorl260 was detected in Samples 50BASS001, 50BASS003, and 50BASS005 (Surface Soil
Sampling Locations 1, 3, and 5 in Figure 2.8) at concentrations of 0.0422, 0.0724, and 0.0672 /^g/g,
respectively (Table 2.1). Arochlor 1260 concentrations in Sample 50BASS001 were not confirmed by
the laboratory. PCDD and PCDF were detected in the surface soil samples. PCDD concentrations
ranged from 0.000002 to 0.003800 jjg/g, and PCDF concentrations ranged from 0.000001 to
0.000640 fjg/g. The highest PCDD concentration was detected in Sample 50BASS006 (Surface Soil
Sample Location 6 in Figure 2.8), and the highest PCDF concentration was detected in Sam pi a
50BASS002 (Surface Soil Sample Location 2 in Figure 2.8).
Seven borings were drilled and sampled at the site on the basis of geophysics, soil-gas results, and
requirements of the Final OU 1 SAP (HLA, 1993). Four of the borings were drilled to 20 feet bgs,
and three were drilled to 60 feet bgs. Boring locations are shown in Figure 2.8. Subsurface soil
samples from each boring were analyzed for TCL VOCs, TCL SVOCs, TAL metals, explosives, TCL
pesticides/PCBs, and PCDD/PCDF.
2-24 Harding Lawson Associates 2250412.04.000926092695 ROD
Decision Summary
Acetone, a common laboratory contaminant, was the only VOC detected in the subsurface soil
samples (Table 2.2). Acetone was detected at a concentration of 0.016 /jg/g in a duplicate sample at
9.0 feet bgs in Boring 50BASB001 (Soil Boring Location 1 in Figure 2.8). The only SVOCs reported
by the laboratory were identified as low concentrations of TICs. Metals were detected in some of the
subsurface soil samples, and those exceeding the background concentrations are summarized in
Table 2.12. PCDD and PCDF were detected in samples from the seven borings. Table 2.13 presents
the borings, depths, and PCDD and PCDF concentrations at Site 50. An explosive analyte, 2,6-dinitr-
otoluene, was detected at a concentration of 0.975 //g/g from a sample collected at 58.5 feet bgs in
Boring 50BASB005 (Table 2.2). The location of Boring 50BASB005 is presented in Figure 2.8 as Soil
Boring Location 5.
In summary, TCE was not detected in any. of the samples from Site 50, indicating that significant
quantities of TCE were not released at this site and that the site does not appear to be a source of
contamination to the groundwater system. Low concentrations of 1,1,1-TCA and PCE were detected
in the deep soil-gas samples. However, similar detections of 1,1,1-TCA were found in the system
blanks, indicating that the low concentrations of 1,1,1-TCA and possibly PCE were the result of
contaminated tubing or equipment. Low levels of the SVOCs fluorene and phenanthrene were
detected in one surface soil sample, and a low concentration of the explosive 2,6-dinitrotoluene was
detected in one subsurface soil sample. Low concentrations of TVH were detected in the shallow
and deep soil-gas samples. Low concentrations of Arochlor 1260 were detected in surface soil
samples and may have resulted from past storage activities at the site. Some metals were detected
above background concentrations in the surface and subsurface soil samples; however, on the basis
of available historical site information, no activities have been identified that could have resulted in
metals deposition (HLA, 1995). The low-level detections of fluorene; phenanthrene; 2,6-dinitro-
toluene; PCDDs; and PCDFs indicate that burn operations at this site have resulted in releases of
small quantities of contaminants to the soil at Site 50.
2250412.04.00 Harding Lawson Associates 2-250926092695 ROD
Decision Summary
2.8.7 Site 51: East Range Drum Disposal Area
Soil-gas sampling was performed at Site 51 as a screening tool to identify areas within the site where
VOCs may be present. This soil-gas information, in conjunction with site-specific information, was
then used to direct and perform the subsequent sampling activities (i.e., surface and subsurface soil
sampling) in areas of highest potential contamination. Sixteen shallow soil-gas samples were
collected at Site 51 and analyzed from locations shown in Figure 2.9. TCE and other solvents were
not detected above method detection limits in any of the soil-gas samples. TVH was detected in
samples from 3 of the 16 sampling locations. The highest concentrations of TVH were detected near
the stream at the base of the westernmost valley.
Deep soil-gas samples were collected at 50, 150, and 200 feetbgs in Boring 51DASB001 (Soil Boring
Location 1 in Figure 2.9). TCE and other solvents were not detected above method detection limits
in any of the soil-gas samples. One very low concentration of TVH was detected at 150 feet bgs.
This detection was considered unreliable because the ambient air and system blank samples collected
before sampling and after sampling also had similar TVH concentrations.
Surface soil samples were collected from three rectangular plots at the site (Figure 2.9). The samples
were analyzed for TCL SVOCs and TAL metals. An SVOC, 4-methylphenol, was detected at a
concentration of 0.54 //g/g in Sample 51DASS001 (Table 2.1). The location of Surface Soil Sample
51DASS001 is presented in Figure 2.9 as Surface Soil Sample Location 1. Metals were detected in
the surface soil samples. Metals concentrations exceeding background concentrations in surface soil
samples are summarized in Table 2.14.
One slant boring was drilled at the site to 277 feet bgs (Figure 2.9). This boring was drilled at
approximately 30 degrees from vertical, parallel to the surface of the slope on which drums and other
material were reported to have been disposed. Subsurface soil samples were analyzed for TCL VOCs,
TCL SVOCs, TAL metals, and TVH. VOCs, SVOCs, and TVH were not detected in the subsurface
2-26 Harding Lawson Associates 2250412.04.000926092695 ROD
Decision Summary
soil samples. Metals were detected in the subsurface soil samples. Metals concentrations exceeding
background concentrations in subsurface soil are presented in Table 2.15.
Four surface-water and stream sediment samples were also collected and analyzed from Site 51. The
sample locations are shown in Figure 2.9. Mean stream flow at the sampling locations ranged from
0.09 to 0.32 cubic feet per second (cfs) (Table 2.16). The samples were analyzed for TCL VOCs, TCL
SVOCs, TCL pesticides/PCBs, explosives, total.and dissolved TAL metals (water), and total TAL
metals (sediment).
Acetone and MEK were the only VOCs detected in the surface water at Site 51. Acetone concentra-
tions of 3.7 and 4.3 micrograms per liter (#g/l) were detected in Samples 51DASW001 and
51DASW002 (Surface Water Sample Locations 1 and 2 in Figure 2.9), respectively. MEK was
detected at a concentration of 11.0 fjgfl in Sample 51DASW003 (Surface Water Sample Location 3 in
Figure 2.9). These analytes are common laboratory contaminants. Therefore, these low concentra-
tions are likely laboratory artifacts.
Acetone, methylene chloride, and MEK were the only VOCs detected in the sediment samples
collected at Site 51. Acetone was detected in three of the four samples at concentrations ranging
from 0.0056 to 0.0059 micrograms per gram (^g/g). Methylene chloride was detected in the four
samples at concentrations ranging from 0.0033 to 0.0097 jUg/g. MEK was detected in Samples
51DASE001 and 51DASE003 (Surface Water Sample Locations 1 and 3 in Figure 2.9) at concentra-
tions of 0.0028 and 0.0088 jc/g/g, respectively. These analytes are common laboratory contaminants.
Therefore, these low concentrations are likely laboratory artifacts. The only SVOCs reported by the
laboratory were identified as low concentrations of TICs. Metals were detected in the surface-water
and sediment samples. Metals detected in surface-water and stream sediment samples at Site 51 are
summarized in Tables 2.17 through 2.18. Although an increase in metals concentrations was
2250412.04.00 Harding Lawson Associates 2-270926092695 ROD
Decision Summary
observed between the upgradient and dovmgradient surface-water samples, this increase could be the
result of contributions from either natural soil or disposal operations.
In summary, with the exception of low concentrations of likely laboratory artifacts in the surface-
water and sediment samples, TCE and other solvents were not detected in a^ of the samples from
this site. The absence of TCE in samples collected from this site indicate that TCE was not^eleased
in significant quantities at Site 51 and that this site does not appear to be a source of contamination
to the groundwater system. Low concentrations of TVH were detected in the shallow soil-gas
samples. Some metals were detected above background concentrations in the surface and subsurface
soil, and surface water and sediment samples; however, on the basis of available historical site
information, no activities have been identified that could have resulted in metals deposition (HLA,
1995].
2.8.8 Site 52: Old Laundry
During the PA/SI (HLA, 1992), eight shallow soil-gas samples were collected at Site 52 and analyzed
from locations shown in Figure 2.18. Soil-gas sampling was performed at Site 52 as a screening tool
to identify areas within the site where VOCs may be present. This soil-gas information in conjunc-
tion with site-specific information wa^then used to direct and perform the subsequent sampling
activities (i.e., subsurface soil sampling) in areas of highest potential contamination. No detections of
TCE; PCE; 1,1,1-TCA; or fuel contamination (possibly caused by the boiler plant) were detected
during the soil-gas investigation above background levels.
Three soil borings were drilled and sampled during the PA/SI. Two were drilled to depths of
100.5 feet bgs and one to a depth of 120.5 feet bgs. The locations of these borings are shown in
Figure 2.19. A total of 35 (33 investigative and 2 quality control) samples were submitted for TCL
VOC analysis. TCE was not detected in the samples analyzed, and detections of toluene were
reported in 3 of the 35 samples. An unknown hydrocarbon was also detected in one sample^
Toluene was detected at some relatively shallow depths (i.e., 24.7 and 29.0 feet bgs). The toluene
2-28 Harding Lawson Associates 2250412.04.000926092695 ROD
Decision Summary
was not detected below these depths. Based on this data, Site 53 was eliminated from OU 1 upon
completion of the PA/SI.
2.8.9 Site 53: Shaft Pump Chamber and Storage Chambers
As previously discussed in this document, the results of the OU 1 PA/SI (HLA, 1992a) indicated that
past activities at the Shaft Pump Chamber and Storage Chambers did not present a potential for the
release of TCE contamination. Therefore, this site was eliminated from OU 1 upon completion of the
PA/SI and no additional characterization of this site was necessary to be performed during the OU 1
RI.
2.8.10 Site 54a: Aircraft Fuselage Dumping and Cleaning Area
Soil-gas sampling was performed at Site 54a as a screening tool to identify areas within the site
where VOCs may be present. This soil-gas information, in conjunction with site-specific information,
was then used to direct and perform subsequent sampling activities (i.e., surface and subsurface soil
sampling) in areas of highest potential contamination. Twenty-two shallow soil-gas samples at
Site 54a were collected and analyzed at the locations presented in Figure 2.14. TCE and other
solvents were not detected above method detection limits in the soil-gas samples. TVH was detected
at 5 of the 22 sampling locations. The highest concentrations of TVH were detected near the north
and southwest sides of the site. Benzene, an aromatic VOC related to petroleum products, was
detected in one shallow soil-gas sample. Deep soil-gas samples were collected from three soil borings
at Site 54a. TVH and VOCs were not detected above method detection limits. No TVH or VOCs
were detected in the deep soil-gas samples.
Surface soil samples were collected from four areas of the site (Figure 2.14). The samples were
analyzed for TCL SVOCs and TAL metals. The only SVOCs reported by the laboratory were
identified as low concentrations of TICs. Metals were detected in the four surface soil samples.
Metals concentrations exceeding background concentrations in surface soil are summarized in
Table 2.19.
22504 I2.04.oo Harding Lawson Associates 2-290926092695 ROD
Decision Summary
Three borings were drilled and sampled at the site. Two borings were drilled to approximately
100 feet bgs and the third was drilled to 87 feet bgs. Subsurface soil samples from each boring were
analyzed for TCL VOCs, TCL SVOCs, and TAL metals. Acetone, a common laboratory contaminant,
was the only VOC detected (Table 2.2). It was detected at a concentration of 0.018 //g/g in a
duplicate sample from Boring 54AFDSB001 (Soil Boring Location 1 in Figure 2.14) at 13.5 feet bgs.
The only SVOCs reported by the laboratory were identified as low concentrations of TICs. Metals
were detected in the four subsurface samples. Metals concentrations exceeding background
concentrations in subsurface soil are summarized in Table 2.20.
In summary, with the exception of the detection of a low concentration of acetone in one subsurface
soil sample, TCE and other solvents were not detected in any of the samples. Therefore, it is
believed that significant quantities of TCE were not released at Site 54a and that this site is not a
source of contamination to the groundwater system. Low concentrations of TVH and benzene were
detected in the shallow soil-gas samples. The detection of low concentrations of TVH and benzene
indicate that the aircraft fuselage dumping and cleaning operations may have resulted in the release
of small quantities of POL products to the soil at the site. Some metals were detected above
background concentrations in the surface and subsurface soil samples; however, on the basis of
available historical site information, no activities have been identified that could have resulted in
metals deposition (HLA, 1995).
2.8.11 Site54b: Aircraft Storage Area
Soil-gas sampling was performed at Site 54b as a screening tool to identify areas within the site
where VOCs may be present. This soil-gas information, in conjunction with site-specific information,
was then used to direct and perform the subsequent sampling activities (i.e., subsurface soil
sampling) in areas of highest potential contamination. Fifty-five shallow soil-gas samples at Site 54b
were collected and analyzed at the locations shown in Figure 2.15. A low concentration of PCE was
detected in one sample. This detection was not confirmed in the replicate sample. No other solvents
were detected above method detection limits in any of the other samples. TVH was detected in
2-30 Harding Lawson Associates 2250412.04.000926092695 ROD
Decision Summary
samples from 15 of the 55 sampling locations. The highest concentration of TVH was detected at the
easternmost aircraft storage area next to the golf course.
Some aromatic VOCs related to petroleum products were also detected. Toluene was detected in
samples from 5 of the 55 sampling locations. Ethylbenzene was detected in samples from 2 of the
sampling locations. Total xylenes were detected in samples from 4 of the sampling locations.
Deep soil-gas samples were collected in 10 soil borings at various depths. TVH was detected in the
deep soil-gas sample from 7 of the 10 borings. TCE was not detected above method detection limits
in any of the samples; however, other solvent compounds (e.g., methylene chloride; chloroform;
1,1,1-TCA; carbon tetrachloride; and PCE) were detected at low concentrations.
Nine borings were drilled and sampled to 100 feet bgs. At the request of USAEC, three additional
100-foot borings were drilled. The locations of the 12 borings are shown in Figure 2.15. Subsurface
soil samples from each of the borings were analyzed for TCL VOCs, TCL SVOCs, and TAL metals.
VOCs were not detected at concentrations above the method detection limits in the samples from the
12 borings. The only SVOCs reported by the laboratory were identified as low concentrations of
TICs. Metals were detected in most of the samples. Metals concentrations exceeding background
concentrations in subsurface soil are summarized in Table 2.21.
A perched groundwater sample was collected from Boring 54BASSB001 (Soil Boring Location 1 in
Figure 2.15). The sample was analyzed for TCL VOCs, TCL SVOCs, and TAL metals. No VOCs were
detected in the sample. The only SVOC detected was bis(2-ethylhexyl) phthalate at a concentration
of 1.80 fig/I. Because of its low concentration and common laboratory use, this SVOC detection is
likely a laboratory artifact.
2250412.04.oo Harding Lawson Associates 2-310926092695 ROD
Decision Summary
In summary, TCE was not detected in any of the samples, indicating that TCE was not released in
significant quantities at this site and that the site does not appear to be a source of contamination to
the groundwater system. Low concentrations of a few other solvent compounds were detected in the
deep soil-gas samples only. A low concentration of bis(2-ethylhexyl) phthalate, which is a likely
laboratory artifact, was detected in the perched groundwater sample. Low concentrations of TVH
were detected in the shallow and deep soil-gas samples. Some metals concentrations were detected
above background concentrations in the subsurface soil samples; however, on the basis of available
historical site information, no activities have been identified that could have resulted in metals
deposition (HLA, 1995). The low concentrations of solvent compounds, TVH, and aromatic VOCs
indicate that the past aircraft storage and cleaning operations may have resulted in the release of
small quantities of solvent and POL products to the soil at the site.
2.8.12 Site 54e: Aircraft Engine Rebuild Area
Soil-gas sampling was performed at Site 54c as a screening tool to identify areas within the site
where VOCs may be present. This soil-gas information in conjunction with site-specific information
was then used during subsequent sampling (i.e., surface and subsurface soil sampling) to direct and
perform the subsequent sampling activities in areas of highest potential contamination. One-hundred
and four shallow soil-gas samples at Site 54c were collected and analyzed from the locations shown
in Figure 2.16. TCE and other solvents were not detected above method detection limits in the
shallow soil-gas samples. TVH was detected in samples from 18 of the 104 sampling locations. The
highest concentrations of TVH were detected in the western part of the site. A few aromatic VOCs
related to petroleum products were also detected. Benzene was detected in four samples, toluene
was detected in two samples, and total xylenes were detected in one sample.
Deep soil-gas samples were collected from three of the four soil borings at Site 54c. A low concentra-
tion of methylene chloride was the only compound detected in the deep soil-gas samples.
2-32 Harding Lawson Associates 2250412.04.000926092695 ROD
Decision Summary
A surface soil sample was collected from one rectangular plot at the site (Figure 2.16). The sample
was analyzed for TCL SVOCs and TAL metals. The only SVOC reported by the laboratory was a low
concentration of a TIC. Metals were also detected in the sample. Metals concentrations-exceeding
background concentrations are summarized in Table 2.22.
Four borings were drilled and sampled at the site. The four borings were drilled to approximately
100 feet bgs. Subsurface soil samples from the borings were analyzed for TCL VOCs, TCL SVOCs,
TAL metals, and TVH. Acetone, a common laboratory contaminant, was the only VOC detected
(Table 2.2). It was detected at concentrations of 0.020 and 0.024 ;/g/g in samples from 2.5 and
9.0 feet, respectively, at Boring 54CAESB001 (Soil Boring Location I in Figure 2.16). The only
SVOCs reported by the laboratory were identified as low concentrations of TICs. Metals were
detected in the subsurface soil samples. Metals concentrations exceeding background concentrations
in subsurface soil samples are summarized in Table 2.23.
Shallow groundwater samples were collected from the four test borings at the site. The groundwater
samples were analyzed for TVH, TCL VOCs, TCL SVOCs, and TAL metals. Acetone, methylene
chloride, and MEK were found in samples from Borings 54CAESB001, 54CAESB003, and
54CAESB004 (Soil Boring Locations 1, 3, and 4, respectively, in Figure 2.16). Acetone detections
ranged from 3.00 to 4.00 fjgfi, methylene chloride concentrations ranged from 2.6 to 4.5 jjgfl, and
MEK detections ranged from 2.10 to 4.50 jE/g/1. These analytes are common laboratory contaminants;
therefore, these low concentrations are likely laboratory artifacts. Metals were detected in the
groundwater samples. Metals concentrations in the groundwater samples are summarized in
Table 2.24. TVH (as diesel) was detected in one groundwater sample from Boring 54CEASB003 at a
concentration of 110.00 //g/1.
Five surface water and five stream sediment samples were collected and analyzed. Samples were
analyzed for TCL VOC, TCL SVOCs, TCL pesticides/PCBs, explosives, and total and dissolved TAL
2250412.04.00 Harding Lawson Associates 2-330926092695 ROD
Decision Summary
metals (water) or total TAL metals (sediment). The following VOCs were detected in the surface-
water and stream sediment samples: acetone; 1,2-dichloroethane (1,2-DCA); methylene chloride; and
MEK. Table 2.25 summarizes the concentrations of organics detected in the surface water samples
collected from Site 54c. These concentrations were detected near or below the detection levels
specified in the SAP (HLA, 1993). A review of the data package indicated that 1,2-DCA was present
in the laboratory blank at a concentration below the reporting limit. Therefore, these detections are
believed to likely be laboratory artifacts.
Bis(2-ethylhexyl) phthalate was the only SVOC detected in the surface-water and sediment samples.
It was detected in surface-water Sample 54CAESW004 (Surface Water Sample Location 4 in
Figure 2.16) at a concentration of 3.4 //g/[. Because of its low concentration and common laboratory
usage, it is likely a laboratory artifact.
Metals were detected in the filtered and unfiltered surface-water samples and in sediment samples.
Metals concentrations are summarized in Tables 2.26 and 2.27 for surface water and Table 2.28 for
sediments. No trend in surface-water or sediment concentrations was observed.
In summary, with the exception of low concentrations of VOCs that are likely laboratory artifacts,
TCE and other solvents were not detected in soil-gas, soil, or water samples. Therefore, TCE is not
believed to have been released in significant quantities at Site 54c and the site does not appear to be
a source of contamination to the groundwater system. A low concentration of bis(2-ethylhexyl)
phthalate, which is a likely laboratory artifact, was detected in one surface-water sample. Some
metals were detected in soil samples above background concentrations. Metals were detected in
surface-water and sediment samples but no trends were observed; however, on the basis of available
historical site information, no activities have been identified that could have resulted in metals
deposition (HLA, 1995). TVH and aromatic VOCs were detected in soil-gas samples, and TVH was
detected in one groundwater sample. The detection of low concentrations of TVH and aromatic
2-34 Harding Lawson Associates 2250412.04.000926092695 ROD
Decision Summary
VOCs indicates that past aircraft engine rebuild operations may have resulted in the release of small
quantities of POL products to the soil and groundwater at the site. However, TVH was not detected
in the subsurface soil samples located in the areas of highest soil-gas concentrations.
2.9 Summary of Site Risks
TCE was detected at only one of the OU 1 sites, at a concentration of 0.220 //g/g in one subsurface
soil sample at Site 18. This detection was qualified as estimated by the laboratory because of sample
interferences and is believed to be anomalous. This detection is also below the EPA Region IX
Preliminary Remediation Goal (PRG) of 25.0 //g/g for industrial soil (EPA, 1993). Therefore, it can be
concluded that TCE does not present a risk to humans or the environment at the OU 1 sites investi-
gated under the RI.
As part of the OU 1 RI, risk values were estimated for other specific organic and inorganic chemicals
detected at the ten OU 1 sites to assess whether further investigation is warranted. The following
presents a summary of the risks at these sites. Further discussions regarding the 1) identification of
potential chemicals of concern (COCs) included in the risk estimation, 2] risk estimation procedures
and results, and 3) a perspective on background concentrations of inorganic chemicals in soil of the
Hawaiian Islands are presented in the Final OU 1 RI (HLA, 1995).
To allow evaluation of the potential risks, chemicals of concern were identified for each of the OU 1
sites. Only a few organic compounds were detected at very low concentrations in samples from the
OU 1 sites. TCE was detected in only one sample at a very low level. Organic chemicals detected in
concentrations greater than EPA Region EX risk-based guidelines (PRGs) were identified as chemicals
of concern. The detected levels of most of these organic compounds, including the TCE detection,
were too low to qualify as chemicals of concern. Based on the results of the OU 1 sampling program,
the OU 1 sites are not considered to be sources of TCE to the groundwater system. Most of the
chemicals selected as chemicals of concern were naturally occurring metals.
2250412.04.oo Harding Lawson Associates 2-350926092695 ROD
Decision Summary
Risk estimates were developed for the chemicals of concern at each site to assess the potential
cumulative affects of these chemicals on human health. A discussion of the estimated risks for each
site is provided below. The chemicals of concern were assessed as not being a threat to'human
health if the risk estimates were within ranges considered acceptable by EPA (i.e., a 10"4 to 10"6 risk
range for carcinogenic risks or a hazard index of 1.0 for noncarcinogenic health risks), detections
were within the range of background detections and are likely to be representative of background
conditions, or a route of exposure to the chemical did not exist. None of the identified chemicals of
concern exceeded these criteria. On this basis, none of the chemicals of concern or OU 1 sites poses
a threat to human health. Because of the lack of contamination and because the OU 1 sites are
designated for industrial use, they also do not pose a threat to the environment. A summary of the
risk evaluations for the OU 1 sites investigated under the RI is presented below.
Site 17; DDL Vehicle Maintenance Motor Poof (Building 1029)
The chemicals of concern identified at Site 17 include aluminum, arsenic, and manganese in
subsurface soil. Risk estimates indicated that the levels of arsenic in the subsurface soil were within
a risk range considered acceptable by EPA and were not a threat to human health or the environ-
ment. The manganese and aluminum present a minor noncarcinogenic risk to human health.
However, because the levels of these chemicals are below the maximum levels detected in back-
ground samples, the aluminum and manganese detections are believed to be representative of back-
ground conditions. In addition, because the detections occurred in the subsurface soil at an
industrial site, a human or ecological route of exposure does not exist. Therefore, the contaminants
present at this site do not present a threat to human health or the environment.
Site 1B: Distribution Warehouse (Building 1052)
The chemicals of concern identified at Site 18 include beryllium in surface soil, and aluminum and
arsenic in subsurface soil. Estimated risks indicate that the levels of both beryllium and arsenic are
within a risk range considered acceptable by EPA. The aluminum presents a minor noncarcinogenic
risk to human health. However, because the levels of aluminum are below the maximum levels
2-36 Harding Lawson Associates 2250412.04.000926092695 ROD
Decision Summary
detected in background samples, these detections are believed to be representative of background
conditions. In addition, because the aluminum detections occurred in the subsurface soil at an
industrial site, a human or ecological route of exposure does not exist. Therefore, a threat to human
health or the environment does not exist.
Sfte 20: Petroleum, Oil, and Lubricants (POL) Area (Area R)
The chemicals of concern identified at Site 20 include arsenic, beryllium, and manganese in surface
soil, and aluminum and manganese in subsurface soil. The estimated risks for arsenic and beryllium
are within a risk range considered acceptable by EPA. The detections of manganese in the surface
soil and aluminum and manganese in the subsurface soil pose a small noncarcinogenic risk to human
health. However, these detections are believed to be representative of background levels of
aluminum and manganese in Hawaiian soil. In addition, the current and anticipated usage of this
site for industrial purposes does not warrant further action.
Site 25: Automobile Craft Shop (Building 910)
The only chemical of concern identified at Site 25 was arsenic in subsurface soil. Risk estimates
indicate that arsenic concentrations in subsurface soil at this site were within a risk range considered
acceptable by EPA. Therefore, the site does not pose a risk to human health or the environment.
Site 42: Maintenance Area (Building 3B7)
The chemicals of concern identified at Site 42 include aluminum and arsenic in subsurface soil.
The estimated risks for arsenic are within a risk range considered acceptable by EPA. The aluminum
presents a minor noncarcinogenic risk to human health. However, because the aluminum concentra-
tions are below the maximum levels detected in background samples, these detections are believed to
be representative of background conditions. In addition, because the aluminum was detected in the
subsurface soil at an industrial site, a human or ecological route of exposure does not exist.
Therefore, a threat to human health and the environment does not exist.
22504 i2.04.oo Harding Lawson Associates 2-370926092995 ROD
Decision Summary
S'rteSO: Old Bum Area
The chemicals of concern for Site 50 include berylh'um and some dioxin compounds in surface soil,
and aluminum, arsenic, and some dioxin compounds in subsurface soil. Estimated risks Indicate that
the levels of the arsenic, beryllium, and dioxin compounds are within a risk range considered
acceptable by EPA. The aluminum presents a minor noncarcinogenicrisk to human health.
However, because the aluminum concentrations are below the maximum levels detected in back-
ground samples, these detections are believed to be representative of background conditions. In
addition, because the aluminum was detected in the subsurface soil at an industrial site, a human or
ecological route of exposure does not exist. Therefore, the site does not pose a threat to human
health or the environment.
Site 51: East Range Drum Disposal Area
The chemicals of concern identified at Site 51 include arsenic and beryllium in surface soil. The
estimated risks for these chemicals are within a risk range considered acceptable by EPA. Therefore,
no threat to human health or the environment exists at this site.
Site 54a: Aircraft Fuselage Dumping and Cleaning Area
The chemicals of concern identified at Site 54a include arsenic and beryllium in surface soil, and
aluminum in subsurface soil. The estimated risks resulting from the arsenic and beryllium detec-
tions are within a risk range considered acceptable by EPA. The aluminum detected in the
subsurface soil presents a minor noncarcinogenic health risk. However, several detections of
aluminum in background soil were greater than the maximum detection at Site 54a. Therefore, this
maximum detection of aluminum is believed to be representative of aluminum levels in background
soil and does not pose a threat to human health or the environment greater than that presented by
natural Hawaiian soil.
Site 54b: Aircraft Storage Area
The chemicals of concern identified at Site 54b include beryllium in surface soil, and aluminum and
arsenic in subsurface soil. The estimated risk for arsenic and beryllium are within a risk range
2-38 Harding Lawson Associates 2250412.04.000926092695 ROD
Decision Summary
considered acceptable by EPA. The aluminum presents a minor noncarcinogenicrisk to human
health. However, because the aluminum concentrations are below the maximum levels detected in
background samples, these detections are believed to be representative of background conditions. In
addition, because the aluminum was detected in the subsurface soil at an industrial site, a human or
ecological route of exposure does not exist. Therefore, no threat to human health or the environment
exists at this site.
Site 54c: Aircraft Engine Rebuild Area
The chemicals of concern identified at Site 54c include beryllium in the surface soil, and aluminum
and arsenic in subsurface soil. The estimated risks for arsenic are within a risk range considered
acceptable by EPA. The aluminum presents a minor noncarcinogenicrisk to human health.
However, because the aluminum concentrations are below the maximum levels detected in back-
ground samples, these detections are believed to be representative of background conditions. In
addition, because the aluminum was detected in the subsurface soil at an industrial site, a human or
ecological route of exposure does not exist. Therefore, no threat to human health or the environment
exists at this site.
2.10 Selection of No Action Alternative Based on Risk Evaluation
Risk evaluations performed on the RI data for the OU I sites indicate that chemicals detected in the
surface soil, subsurface soil, and surface water and sediment at the OU 1 sites do not pose a threat to
human health and the environment because either: (1) estimated risks are within ranges considered
acceptable by EPA; (2) chemical concentrations are representative of background conditions; and/or
(3) a route of exposure does not exist. Therefore, no remedial actions at the OU 1 sites are necessary
for protection of human health and the environment.
2.11 Documentation of Significant Changes
As described in the Responsiveness Summary (Section 3.0), the Proposed Plan was released for
public comment on May 23, 1994, and a public meeting was held on June 7, 1994. This Proposed
Plan identified as "no action" as the selected response action for the OU 1 sites investigated.
2250412.04.oo Harding Lawson Associates 2-390926092695 ROD
Decision Summary
Comments collected over the 30-day public review period between May 23 and June 22, 1994, did
not necessitate any significant changes to the conclusions or procedures outlined in the Proposed
Plan. In addition, no new OU 1 sites beyond those previously investigated that may require further
investigation have been identified.
2-4O Harding Lawson Associates 22504 12.04.000926092695 ROD
3.0 RESPONSIVENESS SUMMARY
3.1 Overview
This section provides a summary of the public comments and concerns regarding the Proposed Plan
at Schofield Barracks, Island of Oahu, Hawaii. At the time of the public review period, the Army had
selected the "no remedial action" preferred alternative for the OU 1 sites. On the basis of the written
and verbal comments received, the Army's Proposed Plan was generally accepted by the public.
3.2 Background on Community Involvement
The Army has implemented a progressive public relations and involvement program for environmen-
tal activities at Schofield Barracks. A Technical Review Committee, comprised of representatives
from the Army, the EPA, the State of Hawaii Department of Health, HLA, and members of the general
public has been established and meets periodically to involve the public in decisions made regarding
investigation results, proposed work, and potential remedial actions. The Army has also presented RI
plans and results at public meetings conducted on February 25, 1993 and on September 13 and 14,
1994. Prior to each of these public meetings, the Army distributed over 50 copies of a fact sheet to
interested parties and to the information repositories (Section 2.4). These fact sheets described the
installation restoration program at Schofield Barracks, including a discussion of how the public could
get more information and get involved in the program. A synopsis of community relations activities
conducted by the Army is presented in Appendix A.
The Army held a public comment period on the OU 1 no action preferred alternative from July 7
through August 6, 1995. One hundred copies of the Proposed Plan were mailed to the public for
review and comment and were placed in the above discussed repositories (Section 2.4). The
Proposed Plan also invited readers to a public meeting to voice their concerns. This public meeting
was held to discuss the selected "no remedial action" preferred alternative. The meeting was held on
July 18, 1995, from 7:00 to 8:00 p.m., in the Hale Koa at Wahiawa District Park, Wahiawa, Hawaii.
2250412.04.00 Harding Lawson Associates 3-10926092695 ROD
Responsiveness Summary
Comments received during the public comment period are addressed below.
3.3 Summary of Comments Received During Public Comment Period andDepartment of the Army Responses
The following presents the comments to the Draft ROD for OU 1 received from the public during the
public comment period. The Army's responses are presented immediately following the corre-
sponding comment.
3.3.1 Comments from Marcus Oshiro, State Representative
Comment No. 1
The objective of the OU 1 remedial investigation was to identify a source of the TCE found in the
Army's drinking water wells. The source has NOT been found or identified.
Further remedial action on other operable units that also address the TCE appears useless if the
primary source of contamination has not been identified.
The conclusions presented at the July 18, 1995 public informational meeting noted that the TCE
contamination is situated "somewhere" on the East Range and is "largen. I find this conclusion
inadequate in addressing the problem that still remains at hand.
Response
The Army is also very frustrated that we have not been able to locate the source of TCE. In any
remedial investigation, the primary emphasis is placed on finding the sources of contamination. The
Army feels that removal of a contaminant source is far more effective and efficient than removing the
contaminants once they have migrated from the source. This is precisely why the Army placed TCE
source identification at the top of its priorities.
The normal approach for such an investigation is to use monitoring wells to locate the plume and
track the contamination back to its source. However, because of the extreme depth to groundwater at
3-2 Harding Lawson Associates 2250412.04.000926092995 ROD
Responsiveness Summary
Schofield Barracks, this approach is not economically feasible. Therefore, the Army was faced with
locating a source that may be as much as 40 years old and for which little, if any, visible evidence
may still exist. In an area covering over 13,000 acres, this is an extremely difficult task.'
The approach used by the Army included locating probable TCE source areas through intensive
records searches, interviews with past personnel and residents, review of historical aerial photo-
graphs, and site visits. The Army has conducted a thorough search of Army records regarding
activities at Schofield Barracks (and Wheeler Army Airfield) and within Wahiawa, conducted
interviews with past employees knowledgeable about past activities and reviewed historical aerial .
photographs from early 1940 up to the present. This effort included a review of over 136 historical
aerial photographs, 120 interviews with past personnel and residents, and onsite surveys of 138 sites.
From these efforts, the Army and EPA identified over 120 individual sites where some type of
activity occurred or soil was disturbed. Each of these sites was subsequently investigated for possible
contamination.
The 12 sites noted in the OU 1 report are the only sites identified as probable sources of TCE. These
12 sites were subjected to extensive investigations under OU 1. However, recent information
obtained during the OU 4 investigation indicates that even such extensive investigations may not be
effective in determining whether a site is the source of TCE groundwater contamination. An
infiltration test recently performed as a part of OU 4 indicated that liquids may move through the
fine-grained surface materials much more quickly than anticipated. This means that, even if large
volumes of TCE were disposed of at some of the OU 1 sites in the past, the TCE may have been
washed out of the fine-grained surface materials by infiltrating rainfall and may no longer be
detectable. The TCE source may now be several hundred feet below the ground surface and,
therefore, would not be detectable or treatable with current available technologies. Under these
circumstances, additional investigations to locate a surface or near surface source of TCE would be
considered an inefficient use of taxpayer funds.
2250412.04.oo Harding Lawson Associates 3-30926092995 ROD
Responsiveness Summary
Regarding the Army's conclusions, the source is located somewhere in the East Range and is large.
These conclusions are based on groundwater level data which show the groundwater is flowing from
the east to the Schofield supply wells and chemical data from the Schofield supply wells which
indicate that the concentrations have not decreased over the 10 years since data collection was
initiated. The data that were used to generate these general conclusions are also being used in our
continuing effort to determine the potential for the TCE plume to migrate to other supply wells
downgradient of the installation. That effort is being conducted under OU 2 (Groundwater Investi-
gations). The ongoing groundwater investigations, scheduled to be completed in November 1995,
will provide the basis for evaluating how to best address the potential exposure of the public to
contaminated groundwater.
As a team, the Army, the Hawaii Department of Health and the EPA have agreed that the most
effective and technically feasible approach to preventing exposure of the general public to TCE
contaminated groundwater is to monitor the wells identified in the path of the plume and to install
treatment systems on impacted wells. Although the Army's search for the source of TCE has not
been successful, the overall program is designed to ensure that human health and the environment
are protected. By initiating a long term monitoring program of wells within the path of the plume,
the Army will provide for the earliest possible detection of TCE and installation of effective treatment
systems. This approach will protect the public. The Army has investigated areas of the East Range
for which available information indicated that there was a potential for the presence of TCE. Because
the Army's current approach will ensure protection of the public health, further investigations
without new leads would provide no additional benefit. However, the Army continues to be
committed to further investigation should new information arise.
Comment No. 2
Based upon the comments by meeting attendee Mr. Bob Kent of the Wahiawa Neighborhood Board, it
appears that he or other members of the general public may have additional knowledge that could
assist the U.S. Army in identifying the source of TCE contamination.
3-4 Harding Lawson Associates 2250412.04.000926092995 ROD
Responsiveness Summary
Thus, a more comprehensive historical review of U.S. Army records and public survey is necessary and
in order.
Response
As discussed in our response to your first comment, the Army, in conjunction with the EPA and the
Hawaii Department of Health, has conducted an extensive review of historical records, conducted
interviews with past employees (both military and civilian), and reviewed stacks of historical aerial
photographs from the 1940's to the present in search of possible information that would point us to
the source.
That effort is a continuing one as evidenced by our recent investigation of sites that was performed
as a result of an interview with an enlisted soldier who served during the late sixties and early
seventies. Based on his information, the Army investigated the Koolau Reservoir, the Ku Tree
Reservoir, two ravines, and Building 6015, all on the East Range, for signs of past dumping activities.
Based on site surveys, magnetometer sweeps, and soil sampling, none of these sites are considered
possible sources of the TCE.
Another recent sampling effort was prompted by information from Mr. Ken Stover, Mililani
Neighbor hood Board member, who used to be a soldier in the tank brigade on Schofield Barracks
approximately 40 years ago. According to Mr. Stover, large amounts of TCE were dumped into a
trench located within the boundaries of a main post motor pool (Site K under investigation under
OU 3). Although we had already investigated this site and found no concerns, we had Mr. Stover
point out the specific trench location, we conducted a geophysical survey to assess if the area had
been disturbed. In addition, we install three 20-foot deep soil borings at the trench location and took
soil samples from each boring for analysis for VOCs. Laboratory data from this effort is not yet
available; however, field instrument readings indicated no VOCs were present in the samples.
22504 i2.04.oo Harding Lawson Associates 3-50926092995 ROD
Responsiveness Summary
The Army has always been willing to followup on information and will continue that practice;
however, continuing an active program to search for a TCE source is not considered practical, based
on thorough search already conducted.
Comment No. 3
Given the inability to precisely predict groundwater flows, there exists the opportunity for the TCE to
migrate into the surrounding aquifer systems, namely the Wahiawa aquifer and the Pearl Harbor
aquifer.
While it is my understanding that the U.S. Army addresses the TCE contamination in its water supply
through a filtration system, is the U.S. Army wiUing to be responsible for filtering the civilian water
systems if they become contaminated with significant amounts of TCE?
Response
While "precise" predictions of groundwater flows are not possible because of the depth to ground-
water, the flat water table, and limited water level data, the Army and its contractors have developed
a firm understanding of the aquifers underlying Schofield Barracks and the surrounding area. We are
also in the final stages of developing a groundwater model which will assist in predictions of
potential impacts downgradient of the installation.
We know that the Schofield High Level Water Body, which is the aquifer that serves both the
Schofield supply wells and the Wahiawa supply wells, is contaminated; however, contamination has
not been detected in the Wahiawa wells. We also know from water level surveys and literature
reviews of past hydrogeological studies of Oahu that the Schofield High Level Water Body is fed by
water flowing predominantly from the Koolau Mountain Range and to a lesser extent from the
Waianae Mountain Range. The groundwater flowing into the system from the east (predominantly)
and the west then flows south to the Honolulu-Pearl Harbor Basal Aquifer and north to the Waialua
Basal Aquifer over groundwater dams created by areas of higher impermeability (possible buried
3-6 Harding Lawson Associates 2250412.04.000926092995 ROD
Responsiveness Summary
ridges). These ground water dams have created what is known as the Schofield High Level Water
Body from which the Schofield supply wells and Wahiawa supply wells draw water.
We also know, based on past hydrogeological studies of the island, that the majority of the water
flows to the south (approximately 125 million gallons per day). Also, based on the proximity of the
Schofield supply wells to the southern groundwater dam and on data from monitoring wells on the
Main Post of Schofield and from the Wahiawa supply wells, the East Range TCE plume is migrating
towards the south.
The information gathered during our studies has narrowed down the downgradient supply wells
potentially impacted by the TCE. The groundwater model, along with a continuing supply well
sampling program, will provide an early warning of potential impacts to those wells in the path of
the plume. There will be plenty of time to react to rising concentrations in the wells when, and if,
they occur. The Army's plans for the groundwater operable unit (OU 2) do commit the Army to
installing treatment systems on the supply wells if they are impacted by contamination emanating
from the Schofield Barracks/Wheeler Army Airfield complex. These plans are available in the
information repositories established to provide information about the Schofield Barracks Installation
Restoration Program. The Army's goal is to meet the requirements of CERCLA to ensure protection of
human health and the environment.
3.3.2 Comments from the Mililani/Waipio/Melemanu Neighborhood BoardNo. 25
Comment No. 1
The Board believes that the Army should complete and report the second, third and fourth priorities in
the investigation and cleanup, and if there is a failure to pinpoint the source of contamination during
these additional studies it should intensify its search for sources of contamination. Otherwise, any
possible cleanup will be negated by continuing contamination from the source.
2250412.04.oo Harding Lawson Associates 3-70926092995 ROD
Responsiveness Summary
Response
In any remedial investigation, the primary emphasis is placed on finding the sources of contami-
nation. The Army feels that removal of a contaminant source is far more effective and efficient than
removing the contaminants once they have migrated from the source. This is precisely why the
Army placed TCE source identification at the top of its priorities.
The normal approach for such an investigation is to use monitoring wells to locate the plume and
track the contamination back to its source. However, because of the extreme depth to groundwater at
Schofield Barracks, this approach is not economically feasible. Therefore, the Army was faced with
locating a source that may be as much as 40 years old and for which little, if any, visible evidence
may still exist. In an area covering over 13,000 acres, this is an extremely difficult task.
The approach used by the Army included locating probable TCE source areas through intensive
records searches, interviews with past personnel and residents, review of historical aerial photo-
graphs, and site visits. The Army has conducted a thorough search of Army records regarding
activities at Schofield Barracks (and Wheeler Army Airfield) and within Wahiawa, conducted
interviews with past employees knowledgeable about past activities and reviewed historical aerial
photographs from the early 1940s up to the present. This effort included a review of over
136 historical aerial photographs, 120 interviews with past personnel and residents, and onsite
surveys of 138 sites. From these efforts, the Army and EPA identified over 120 individual sites
where some type of activity occurred or soil was disturbed. Each of these sites was subsequently
investigated for possible contamination.
The 12 sites noted in the OU 1 report are the only sites identified as probable sources of TCE. These
12 sites were subjected to extensive investigations under OU 1. However, recent information
obtained during the OU 4 investigation indicates that even such extensive investigations may not be
effective in determining whether a site is the source of the TCE groundwater contamination. An
3-8 Harding Lawson Associates 2250412.04.000926092995 ROD
Responsiveness Summary
infiltration test recently performed as a part of OU 4 indicated that liquids may move through the
fine-grained surface materials much more quickly than anticipated. This means that, even if large
volumes of TCE were disposed of at some of the OU 1 sites in the past, the TCE may have been
washed out of the fine-grained surface materials by infiltrating rainfall and may no longer be
detectable. The TCE source may now be several hundred feet below the ground surface and,
therefore, would not be detectable or treatable with current available technologies. Under these
circumstances, additional investigations to locate a surface or near surface source of TCE would be
considered an inefficient use of tax payer funds.
Regarding your recommendation that a final decision, and possibly further action on OU 1, be
delayed until the investigative results of the other "priorities" are available, the other operable units
were established to investigate other concerns, not to identify the TCE source. OU 2 will address
TCE, but only in the groundwater and what should be done to protect the public from exposure to
contaminated groundwater. OU 3 will investigate the small waste sites on the installation; these sites
were akeady screened out as potential sources of TCE. Finally, OU 4 was established to investigate
the former sanitary landfill and to identify what actions have to be taken at that site to prevent
migration of contaminants. OU 4 has been found to be the source of a localized TCE plume in the
groundwater beneath the landfill; however, this plume is not connected to the East Range TCE plume
that has contaminated the Schofield supply wells. Because the other three operable units will
provide no further information regarding the location of TCE source areas, there is no need to delay
action on the OU 1 sites discussed in the Proposed Plan.
The Army has always been willing to followup on information and will continue that practice;
however continuing an active program to search for a TCE source is not considered practical, based
on the thorough search already conducted.
2250412.04.00 Harding Lawson Associates 3-90926092995 ROD

Responsiveness Summary
Comment No. 2
While it is reasonable for the Army to suspend drilling Phase one, the Board is concerned that the
adoption of a "no action" proposal may mean the end of the search for the source of contamination in
OU 1. The area should be reserved for farther resolution unless the sources of contamination are found
in the other three areas. There should be an effort to investigate areas outside of the present bound-
aries of the study.
Response
As discussed in our response to your first comment, the Army, in conjunction with the EPA and the
Hawaii Department of Health, has conducted an extensive review of historical records, conducted
interviews with past employees (both military and civilian) and residents, and reviewed stacks of
historical aerial photographs from the 1940's to the present in search of possible information that
would point us to the source. This effort included a review of over 136 historical aerial photographs,
120 interviews with past personnel and residents, and onsite surveys of 138 sites. That effort is a
continuing one as evidenced by our recent investigation of sites based on an interview with an
enlisted soldier who served during the late sixties and early seventies. Based on his information, the
Army investigated the Koolau Reservoir, the Ku Tree Reservoir, two ravines, and Building 6015, all
on the East Range, for signs of past dumping activities. Based on site surveys, magnetometer sweeps,
and soil sampling, none of these sites are considered possible sources of the TCE. Another recent
sampling effort was prompted by information from Mr. Ken Stover, Milalani Neighborhood Board
Member, who used to be a soldier in the tank brigade on Schofield Barracks approximately 40 years
ago. According to Mr. Stover, large amounts of TCE were dumped in a trench located within the
boundaries of a main post motor pool (Site K under investigation under OU 3). Although we had
already investigated this site and found no concerns, we had Mr. Stover point out the specific trench
location, and we conducted a geophysical survey to assess if the area had been disturbed. In
addition, we install three 20-foot deep soil borings at the trench location and took soil samples from
each boring for analysis for VOCs. Laboratory data from this effort is not yet available; however,
field instrument readings indicated no VOCs were present in the samples.
3-10 Harding Lawson Associates 2250412.04.000926092995 ROD
Responsiveness Summary
The Army has always been willing to followup on information and will continue that practice;
however, continuing an active program to search for a TCE source is not considered practical, based
on the thorough search already conducted. Although the Army's search for the source oT TCE has
not been successful, the overall program is designed to ensure that human health and the environ-
ment are protected. By initiating a long term monitoring program of wells within the path of the
plume, the Army will provide for the earliest possible detection of TCE and installation of effective
treatment systems. This approach will protect the public. Also, as discussed in our response to your
first comment, the objectives of the other operable unit investigations are not intended to continue
the search for the TCE source; the sites still under investigation under those operable units have been
screened out as possible TCE sources.
Regarding searching for sources outside of the Schofield Barracks boundaries, the Army has included
Wheeler Army Air field in its search for a TCE source and the Air Force is conducting an ongoing,
comprehensive investigation of contaminant sources on Wheeler under its installation restoration
program. The Army also conducted an industrial activity survey as part of the original Preliminary
Assessment/Site Investigation efforts conducted in 1991. Through the industrial activity survey, the
Army identified to the EPA and Hawaii Department of Health potential historical sources of TCE in
the town of Wahiawa. The potential sites included an old train depot, several dry cleaners, and three
disposal sites. Appropriations limitations on the Defense Environmental Restoration Account, which
pays for the installation restoration program, prohibit investigation of non-Defense Department sites,
unless the contamination migrated across an installation boundary onto private property. Any
investigations of private sites must be conducted by the State or EPA.
Comment No. 3
We therefore urge the Army to keep an open mind and reserve the option of revisiting OU #1. In the
meantime, we ask that the Army keep us up to date on the levels of contamination in the Schofield
Wells and present an analysis of the trends in such detection. Any other information regarding the
ongoing studies will help the public to better understand the issue.
22504i2.04.oo Harding Lawson Associates 3-110926092995 ROD
Responsiveness Summary
Response
As discussed in our response to you second comment, the Army intends to followup on all leads on
potential sources of TCE on the installation as they are brought to our attention. We firmly believe
the best solution is to remove the source. However, as we have discussed, we have reviewed the
Army records and have eliminated identified sites as sources of TCE. As always, members of your
neighborhood board are invited to attend and participate in the Technical Review Committee (TRC)
meetings. You will find that the TRC meetings are an excellent forum for learning more about the
program and the technical rationale for the decisions made by the Army, EPA, and Hawaii Depart-
ment of Health. Current data and conclusions are presented at these meetings and discussed
thoroughly to provide a continuing guide to the program.
3-12 Harding Lawson Associates 2250412.04.000926092995 ROD
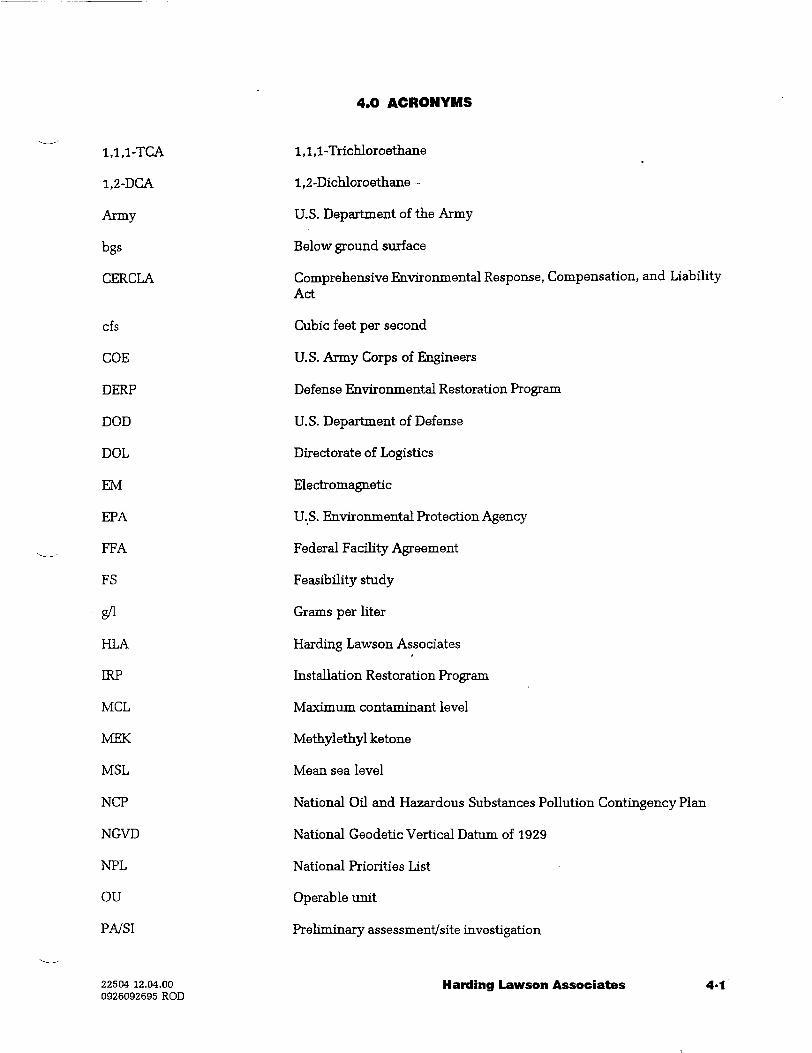
4.0 ACRONYMS
1,1,1-TCA
1,2-DCA
Army
bgs
CERCLA
cfs
COE
DERP
DOD
DOL
EM
EPA
FFA
FS
8/1
HLA
IRP
MCL
MEK
MSL
NCP
NGVD
NPL
OU
PA/SI
1,1,1-Trichloroethane
1,2-Dichloroethane -
U.S. Department of the Army
Below ground surface
Comprehensive Environmental Response, Compensation, and LiabilityAct
Cubic feet per second
U.S. Army Corps of Engineers
Defense Environmental Restoration Program
U.S. Department of Defense
Directorate of Logistics
Electromagnetic
U.S. Environmental Protection Agency
Federal Facility Agreement
Feasibility study
Grams per liter
Harding Lawson Associates
Installation Restoration Program
Maximum contaminant level
Methylethyl ketone
Mean sea level
National Oil and Hazardous Substances Pollution Contingency Plan
National Geodetic Vertical Datum of 1929
National Priorities List
Operable unit
Preliminary assessment/site investigation
22504 12.04.000926092695 ROD
Harding Lawson Associates 4-1
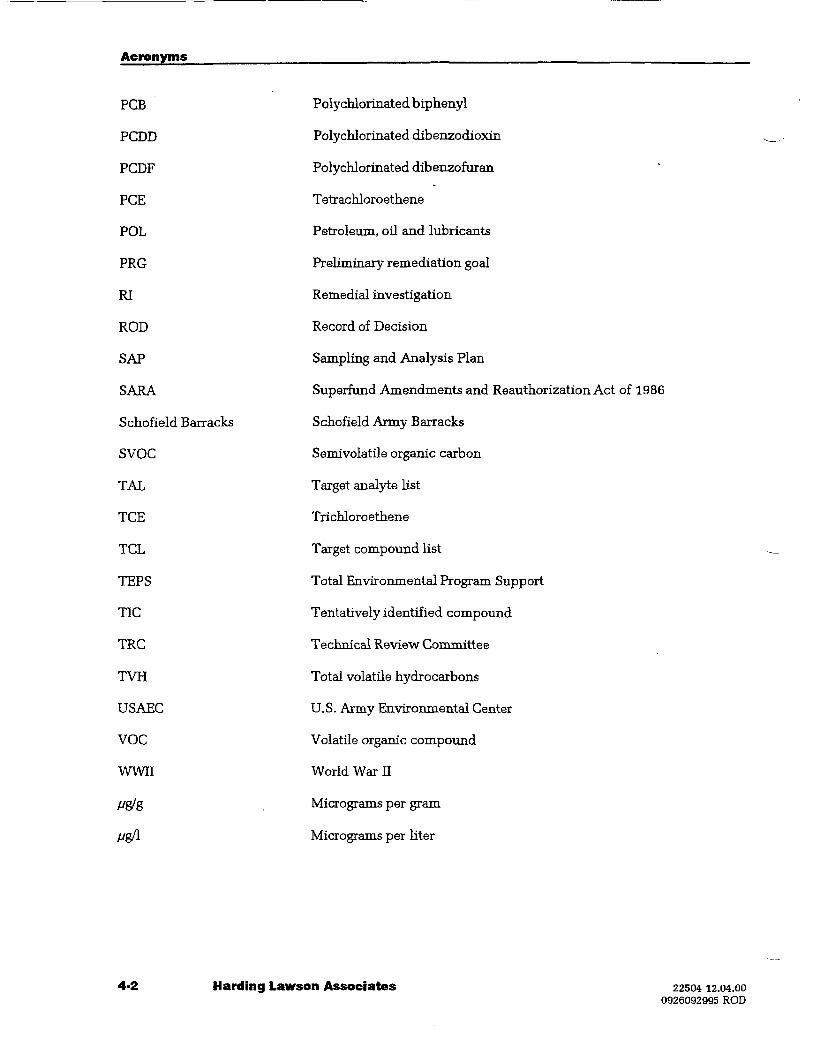
Acronyms
PCB
PCDD
PCDF
PCE
POL
PRG
RI
ROD
SAP
SARA
Schofield Barracks
SVOC
TAL
TCE
TCL
TEPS
TIC
TRC
TVH
USAEC
VOC
WWII
/>g/g
Poly chlorinated biphenyl
Polychlorinated dibenzodioxin
Polychlorinated dibenzofuran
Tetrachloroethene
Petroleum, oil and lubricants
Preliminary remediation goal
Remedial investigation
Record of Decision
Sampling and Analysis Plan
Superfund Amendments and Reauthorization Act of 1986
Schofield Army Barracks
Semivolatile organic carbon
Target analyte list
Trichloroethene
Target compound list
Total Environmental Program Support
Tentatively identified compound
Technical Review Committee
Total volatile hydrocarbons
U.S. Army Environmental Center
Volatile organic compound
World War E
Micrograms per gram
Micrograms per liter
4-2 Harding Lawson Associates 22504 12.04.000926092995 ROD
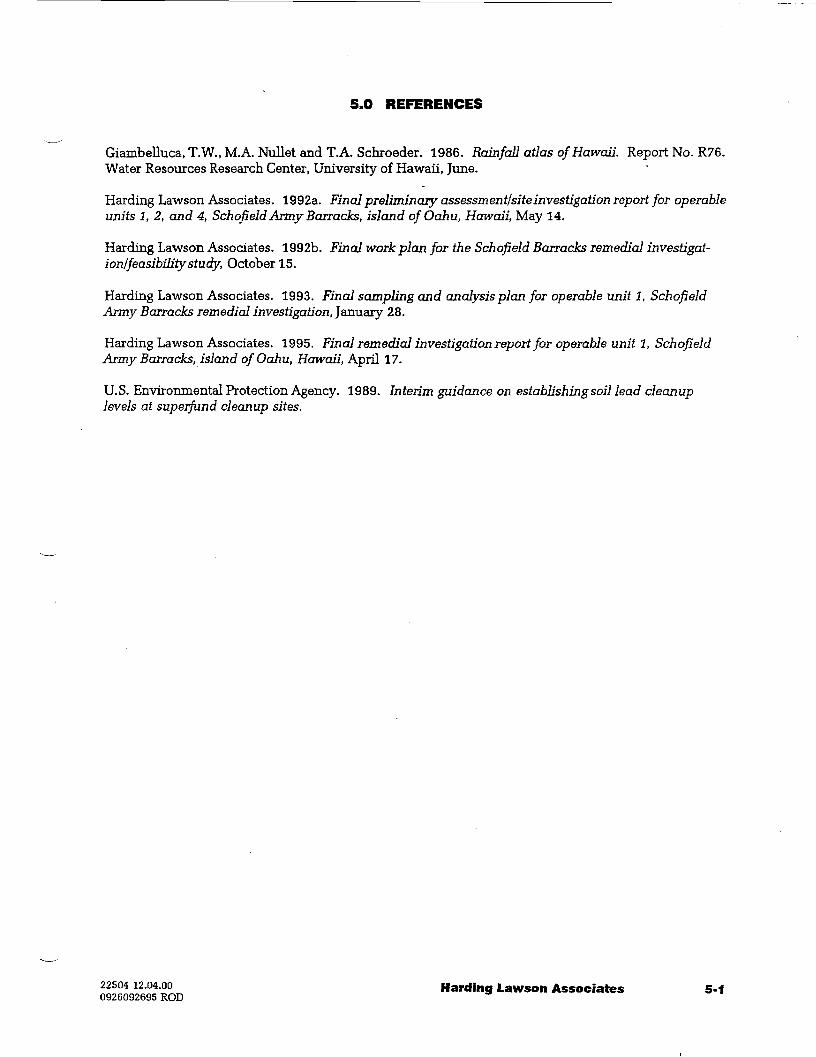
S.O REFERENCES
Giambelluca, T.W., M.A. Mullet and T.A. Schroeder. 1986. Rainfall atlas of Hawaii. Report No. R76.Water Resources Research Center, University of Hawaii, June.
Harding Lawson Associates. 1992a. Final preliminary assessment/site investigation report for operableunits I, 2, and 4, Schofield Army Barracks, island ofOahu, Hawaii, May 14.
Harding Lawson Associates. 1992b. Final work plan for the Schofield Barracks remedial investigat-ion/feasibility study, October 15.
Harding Lawson Associates. 1993. Final sampling and analysis plan for operable unit 1, SchofieldArmy Barracks remedial investigation, January 28.
Harding Lawson Associates. 1995. Final remedial investigation report for operable unit 1, SchofieldArmy Barracks, island ofOahu, Hawaii, April 17.
U.S. Environmental Protection Agency. 1989. Interim guidance on establishing soil lead cleanuplevels at superfand cleanup sites.
2250412.04.00 Harding Lawson Associates 5-10926092695 ROD

TABLES
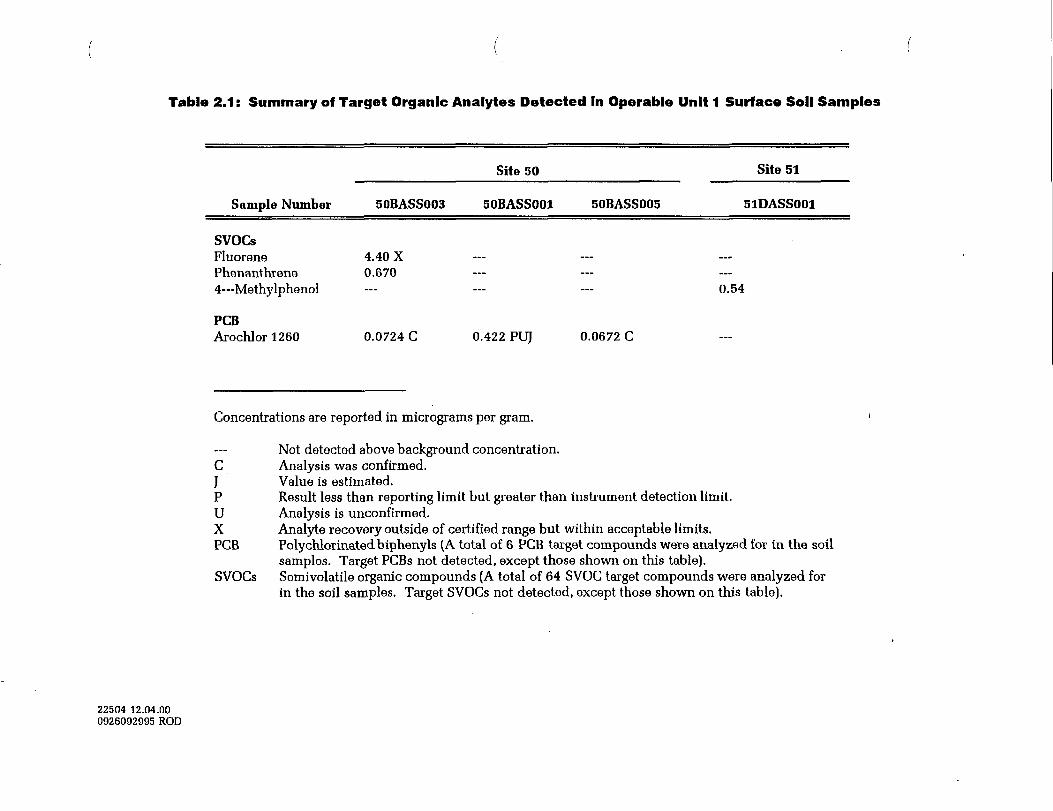
Table 2.1: Summary of Target Organic Analytes Detected In Operable Unit 1 Surface Soil Samples
Sample Number 50BASS003
Site 50 Site 51
50BASS001 50BASS005 51DASS001
SVOCsFluorenePhenanthrene4—Methylphenol
PCBArochlor 1260
4.40 X0.670
0.0724 C 0.422 PUJ
0.54
0.0672 G
Concentrations are reported in micrograms per gram.
Not detected above background concentration.C Analysis was confirmed.J Value is estimated.P Result less than reporting limit but greater than instrument detection limit.U Analysis is unconfirmed.X Analyte recovery outside of certified range but within acceptable limits.PCB Polychlorinatedbiphenyls (A total of 6 PCB target compounds were analyzed for in the soil
samples. Target PCBs not detected, except those shown on this table).SVOCs Semivolatile organic compounds (A total of 64 SVOC target compounds were analyzed for
in the soil samples. Target SVOCs not detected, except those shown on this table).
22504 12.04.000926092995 ROD
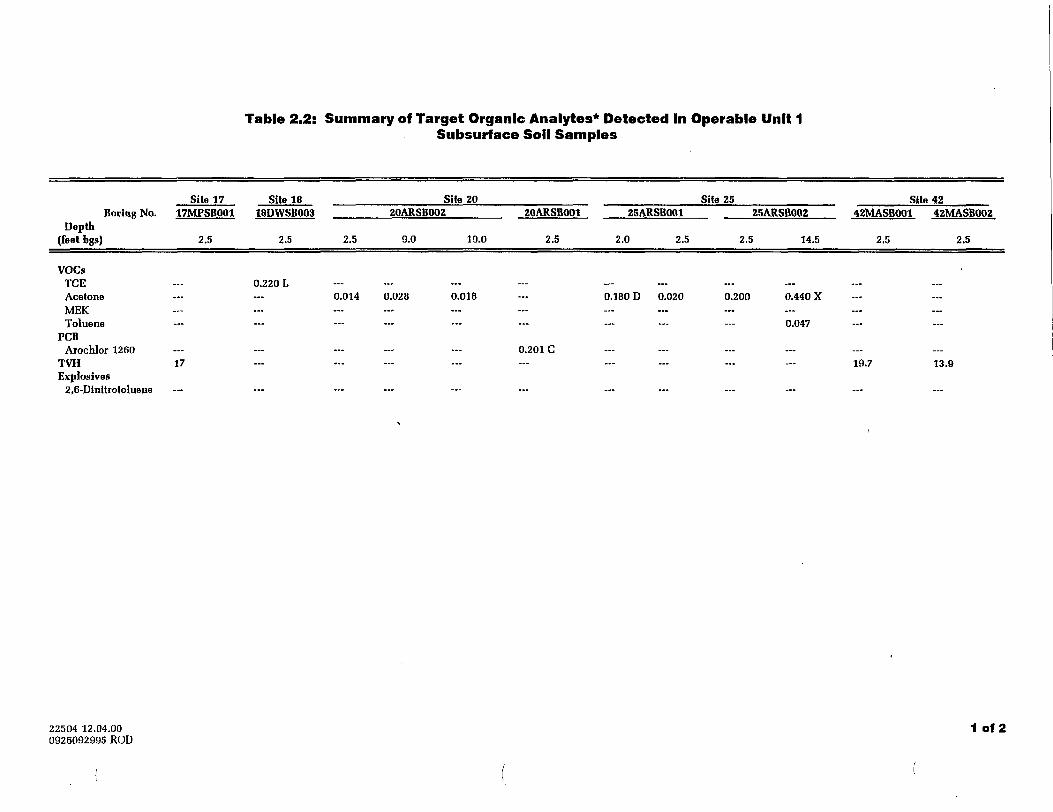
Table 2.2: Summary of Target Organic Analytes* Detected In Operable Unit 1Subsurface Soil Samples
Site 17 Site 18 Site 20 Site 25 Site 42
Depth(feet bgs)
Boring No. 17MPSB001 18DWSB003 20ARSB002 20ARSB001 25ARSB001
2.5 2.5 2.5 9.0 19.0 2.5 2.0 2.5
25ARSB002
2.5 14.5
42MASB001 42MASB002
2.5 2.5
VOCsTCEAcetoneMEKToluene
PCBArochlor 1260
TVHExplosives
2,6-Dinltrotoluene
17
0.220 L0.014 0.028 0.018
0.201 C
0.180 D 0.020 0.200 0.440 X
0.047
19.7 13.9
22504 12.04.000926092995 ROD
1 of 2
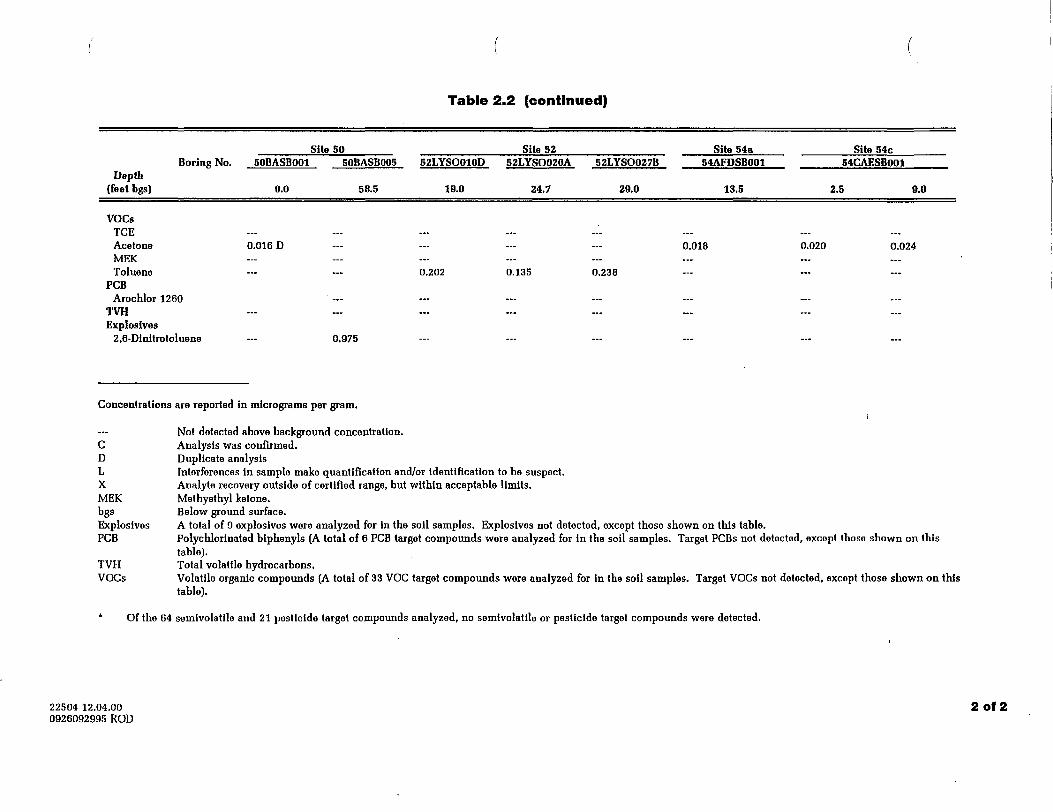
Table 2.2 (continued)
Site 50 Site 52 Site 54aBoring No. 50BASB001 50BASB005 52LYSO010D 52LYSO020A 52LYSO027B 54AFDSB001
Depth(feetbgs) 0.0 58.5 10.0 24.7 20.0 13.5
VOCsTCEAcetone 0.016 D — — — — 0.018MEKToluene — — 0.202 0.135 0.238
PCBArochlor 1260
TVHExplosives
2,6-Dinltrotoluene — 0.975
Site 54c54CAESB001
2.5 0.0
—0.020 0.024......
—
—
...
Concentrations are reported in micrograms per gram.
Not detected above background concentration.C Analysis was confirmed.D Duplicate analysisL Interferences in sample make quantification and/or identification to bo suspect.X Analyte recovery outside of certified range, but within acceptable limits.MEK Methyethyl ketone.bgs Below ground surface.Explosives A total of 9 explosives were analyzed for in the soil samples. Explosives not detected, except those shown on this table.PCB Polychlorlnated blphenyls (A total of 6 PCB target compounds were analyzed for in the soil samples. Target PCBs not detected, except those shown on this
table).TVH Total volatile hydrocarbons.VOCs Volatile organic compounds (A total of 33 VOC target compounds were analyzed for in the soil samples. Target VOCs not detected, except those shown on this
table).
* Of the 64 semivolatile and 21 pesticide target compounds analyzed, no semivolatlle or pesticide target compounds were detected.
22504 12.04.000926092995 ROD
2 of 2
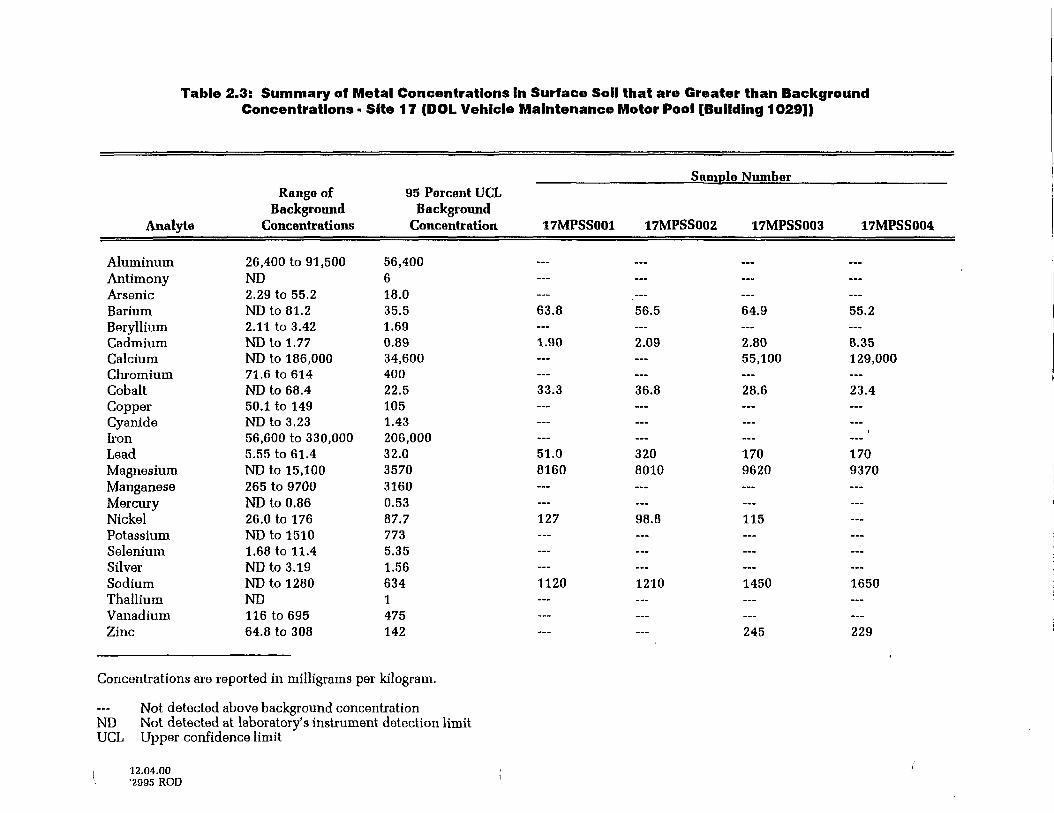
Table 2.3: Summary of Metal Concentrations In Surface Soil that are Greater than BackgroundConcentrations • Site 17 (DOL Vehicle Maintenance Motor Pool [Building 1029])
Analyte
Sample NumberRange of
BackgroundConcentrations
95 Percent UCLBackground
Concentration 17MPSS001 17MPSS002 17MPSS003 17MPSS004
AluminumAntimonyArsenicBariumBerylliumCadmiumCalciumChromiumCobaltCopperCyanideIronLeadMagnesiumManganeseMercuryNickelPotassiumSeleniumSilverSodiumThalliumVanadiumZinc
26,400 to 91,500ND2. 29 to 55. 2NDto81.22.11 to 3.42ND to 1.77ND to 186,00071.6 to 614ND to 68.450.1 to 149ND to 3.2356,600 to 330,0005.55 to 61.4ND to 15,100265 to 9700ND to 0.8626.0 to 176ND to 15101.68 to 11.4ND to 3.19ND to 1280ND116 to 69564.8 to 308
56,400618.035.51.690.8934,60040022.51051.43206,00032.0357031600.5387.77735.351.566341475142
—
—63.8...
1.90...
—33.3...
—...
51.08160
—
—127
——...
1120
———
...
56.5—2.09
——36.8
——...
3208010
—...98.8
—......
1210
—.„
—
—
—64.9
—2.8055,100
—28.6
———1709620
—...
115
—......
1450
—
245
...
—55.2...8.35129,000—23.4......
1709370
————......
1650
——229
Concentrations are reported in milligrams per kilogram.
Not detected above background concentrationND Not detected at laboratory's instrument detection limitUCL Upper confidence limit
12.04.00'2995 ROD
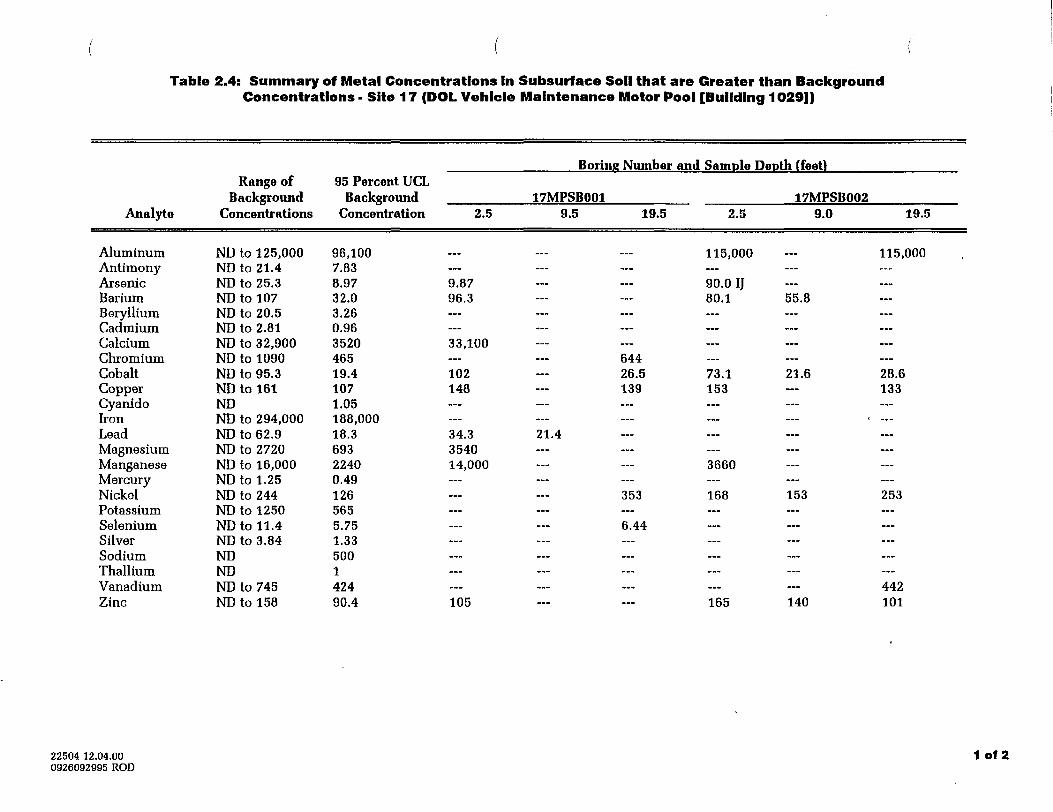
Table 2.4: Summary of Metal Concentrations In Subsurface Soil that are Greater than BackgroundConcentrations - Site 17 (DOL Vehicle Maintenance Motor Pool [Building 1029])
Analyte
AluminumAntimonyArsenicBai'iumBerylliumCadmiumCalciumChromiumCobaltCopperCyanideIronLeadMagnesiumManganeseMercuryNickelPotassiumSeleniumSilverSodiumThalliumVanadiumZinc
Range ofBackground
Concentrations
ND to 125,000ND to 21.4ND to 25.3ND to 107ND to 20.5ND to 2.81ND to 32,900ND to 1090ND to 95.3ND to 161NDND to 294,000ND to 62.9ND to 2720ND to 16,000ND to 1.25ND to 244ND to 1250ND to 11.4ND to 3.84NDNDND to 745ND to 158
95 Percent UCLBackground
Concentration
96,1007.838.9732.03.260.96352046519.41071.05188,00018.369322400.491265655.751.33500142490.4
2.5
...
—9.8796.3
—...33,100
—102148
——34.3354014,000
—————...
——105
Boring Number and Sample Depth (feet)
17MPSB001 17MPSB0029.5 19.5 2.5 9.0 19.5
115,000 — 115,000
—90.0 IJ80.1 55.8
—...
—64426.5 73.1 21.6 28.6139 153 — 133
— i —21.4
—3660
— 353 168 153 253
— 6.44_„...
—442
165 140 101
22504 12.04.000926092995 ROD
1 of 2
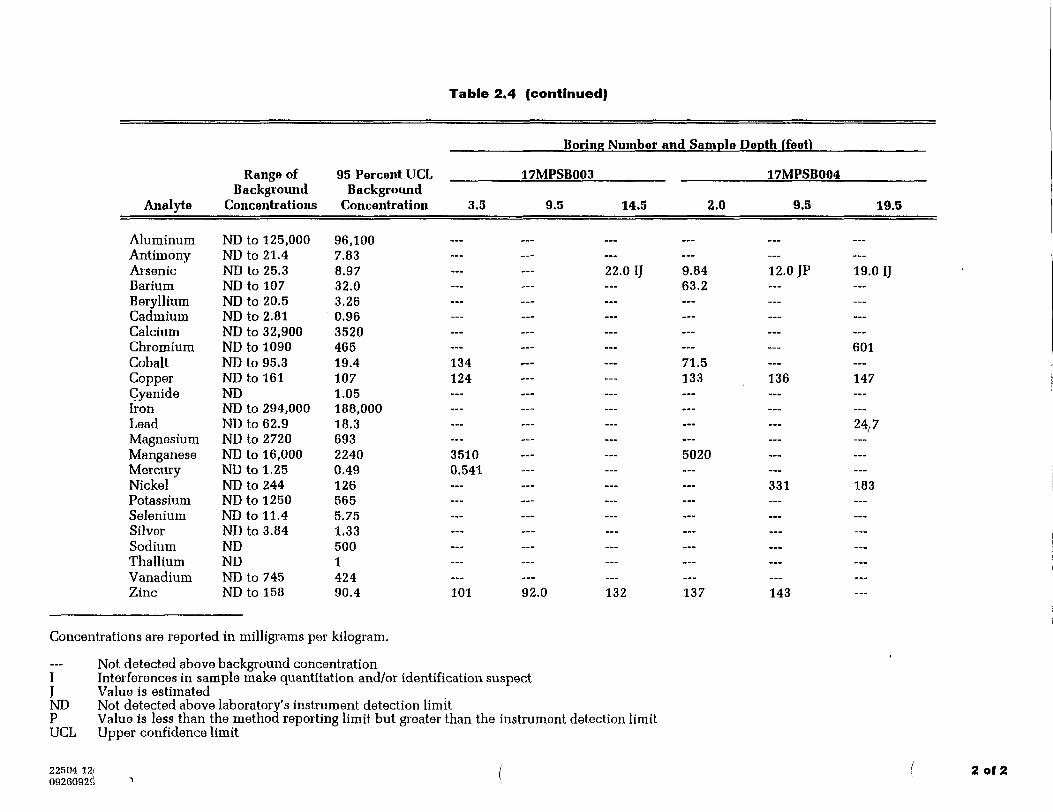
Table 2.4 (continued)
Boring Number and Sample Depth ffeet)
Analyte
Range ofBackground
Concentrations
95 Percent UCLBackground
Concentration
17MPSB003 17MPSB004
3.5 9.5 14.5 2.0 9.5 19.5
AluminumAntimonyArsenicBariumBerylliumCadmiumCalciumChromiumCobaltCopperCyanideIronLeadMagnesiumManganeseMercuryNickelPotassiumSeleniumSilverSodiumThalliumVanadiumZinc
ND to 125,000NDto21.4ND to 25.3ND to 107ND to 20.5ND to 2.81ND to 32,900ND to 1090ND to 95.3ND to 161NDND to 294,000ND to 62.9ND to 2720ND to 16,000ND to 1.25ND to 244ND to 1250ND to 11.4ND to 3.84NDNDND to 745ND to 158
96,1007.838.9732.03.260.96352046519.41071.05188,00018.369322400.491265655.751.33500142490.4
—......
——...
—134124
——...
—35100.541
—...............
—101 92.0
—22.0 IJ 9.84 12.0 JP 19.0 IJ
63.2
—......
60171.5133 136 147
——
24.7
—5020
—331 183
...
—...— — ... ...
—
132 137 143
Concentrations are reported in milligrams per kilogram.
Not detected above background concentrationI Interferences in sample make quantitation and/or identification suspectJ Value is estimatedND Not detected above laboratory's instrument detection limitP Value is less than the method reporting limit but greater than the instrument detection limitUCL Upper confidence limit
22504 12(0926092&
2 of 2
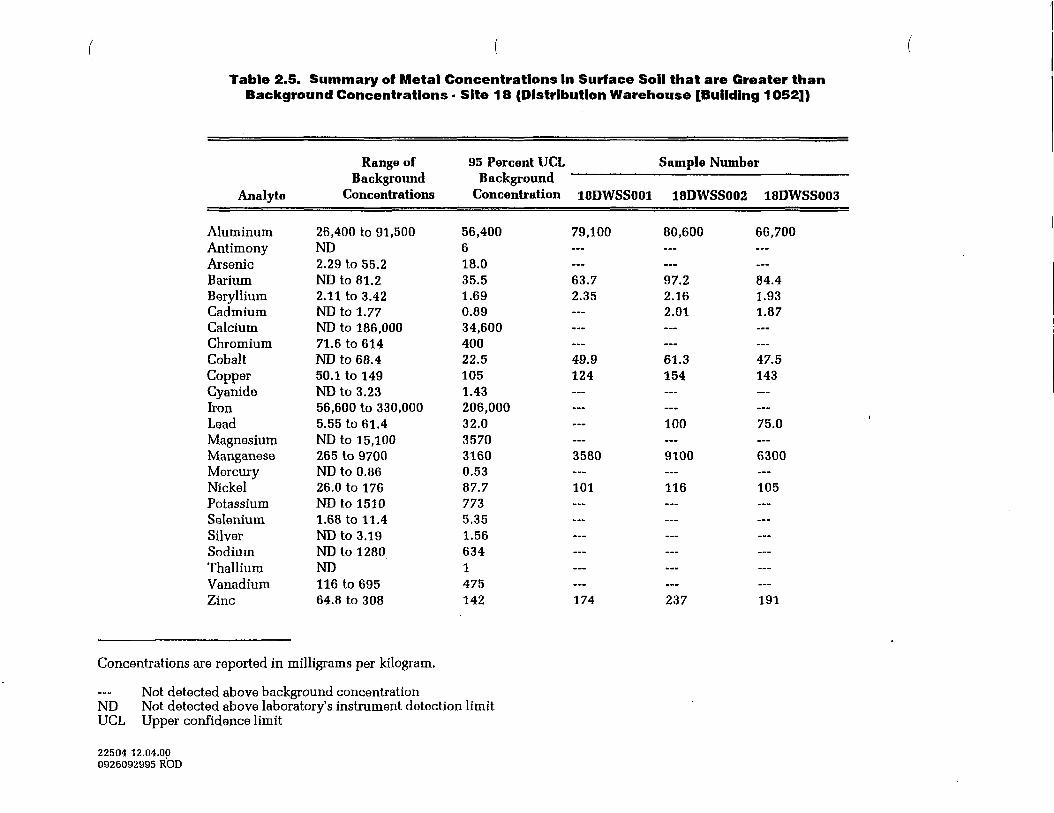
Table 2.5. Summary off Metal Concentrations In Surface Soil that are Greater thanBackground Concentrations • Site 18 (Distribution Warehouse [Building 1052])
Analyte
AluminumAntimonyArsenicBariumBerylliumCadmiumCalciumChromiumCobaltCopperCyanideIronLeadMagnesiumManganeseMercuryNickelPotassiumSeleniumSilverSodiumThalliumVanadiumZinc
Range ofBackground
Concentrations
26,400 to 91,500ND2.29 to 55.2ND to 81.22.11 to 3.42ND to 1.77ND to 186,00071.6 to 614ND to 68.450.1 to 149ND to 3.2356,600 to 330,0005.55 to 61.4ND to 15,100265 to 9700ND to 0.8626.0 to 176ND to 15101.68 to 11.4NDto 3.19ND to 1280ND116 to 69564.8 to 308
95 Percent UCLBackground
Concentration
56,400618.035.51.690.8934,60040022.51051.43206,00032.0357031600.5387.77735.351.566341475142
Sample Number
18DWSS001
79,100
——63.72.35
—...
—49.9124
—......
—3580...101
——...
———174
18DWSS002
80,600...
—97.22.162.01
——61.3154
——100
—9100
—116...
—————237
18DWSS003
66,700
——84.41.931.87
——47.5143
——75.0...6300
—105
—......— _
——191
Concentrations are reported in milligrams per kilogram.
Not detected above background concentrationND Not detected above laboratory's instrument detection limitUCL Upper confidence limit
22504 12.04.000926092995 ROD
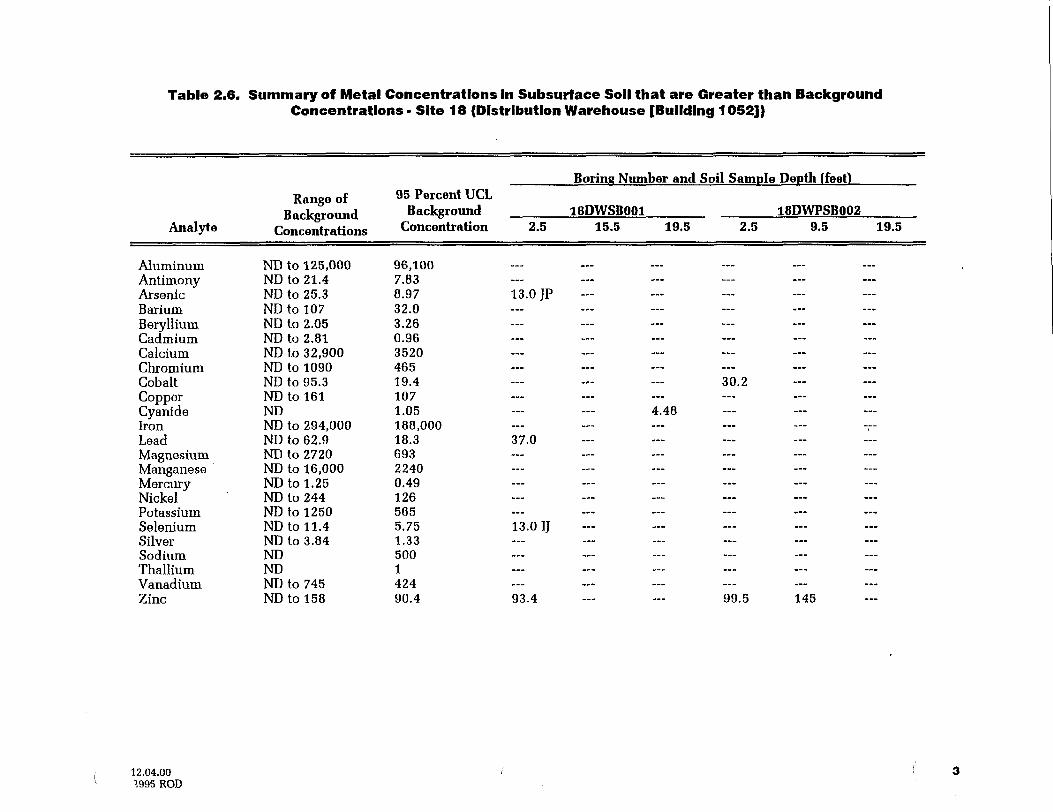
Table 2.6. Summary of Metal Concentrations In Subsurface Soil that are Greater than BackgroundConcentrations- Site 18 (Distribution Warehouse [Building 1052])
Analyte
AluminumAntimonyArsenicBariumBerylliumCadmiumCalciumChromiumCobaltCopperCyanideIronLeadMagnesiumManganeseMercuryNickelPotassiumSeleniumSilverSodiumThalliumVanadiumZinc
Range ofBackground
Concentrations
ND to 125,000ND to 21.4ND to 25.3ND to 107ND to 2.05ND to 2.81ND to 32,900ND to 1090ND to 95.3ND to 161NDND to 294,000ND to 62.9ND to 2720ND to 16,000ND to 1.25ND to 244ND to 1250ND to 11.4ND to 3.84NDNDND to 745ND to 158
Boring Number and Soil Sample Depth (feet)95 Percent UCL
Background 18DWSB001 18DWPSB002Concentration 2.5 15.5 19.5 2.5 9.5 19.5
96,1007.838.97 13.0 JP32.03.260.96352046519.4 — — — 30.21071.05 — — 4.48188,00018.3 37.069322400.491265655.75 13.0 IJ1.33500142490.4 93.4 — — 99.5 145
12.04.00•>,995 ROD
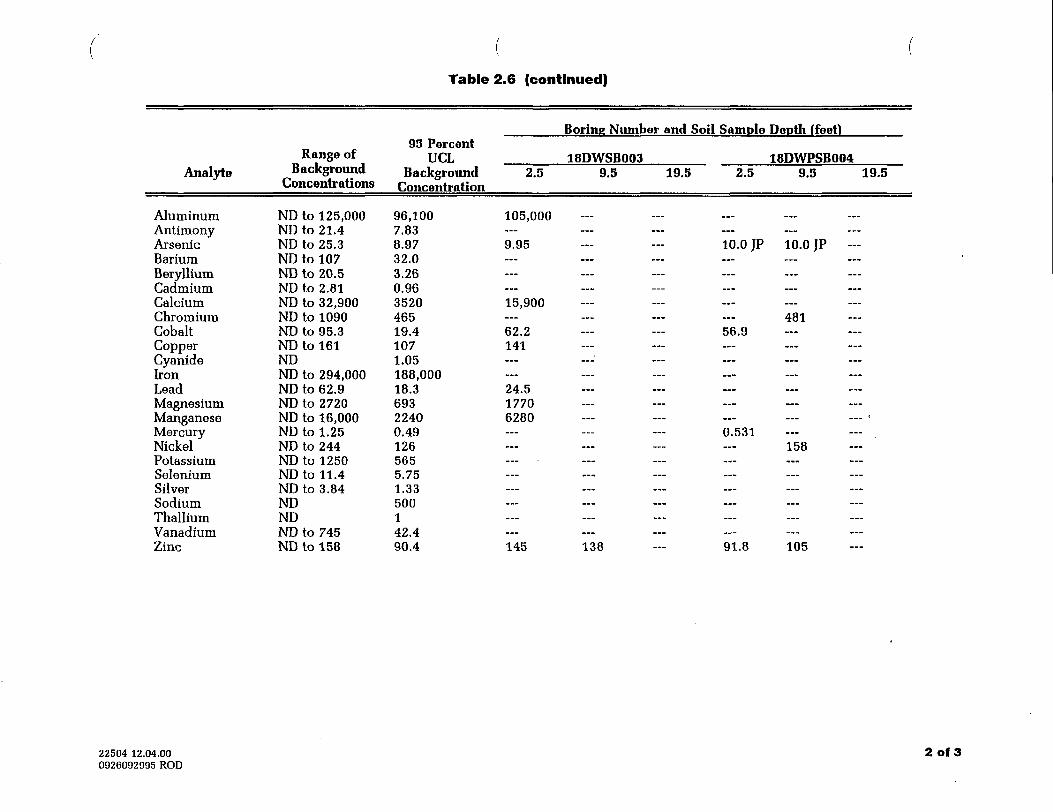
Table 2.6 (continued)
Analyte
AluminumAntimonyArsenicBariumBerylliumCadmiumCalciumChromiumCobaltCopperCyanideIronLeadMagnesiumManganeseMercuryNickelPotassiumSeleniumSilverSodiumThalliumVanadiumZinc
Range ofBackground
Concentrations
ND to 125,000ND to 21.4ND to 25.3ND to 107ND to 20.5ND to 2.81ND to 32,900ND to 1090ND to 95.3ND to 161NDND to 294,000ND to 62.9ND to 2720ND to 16,000ND to 1.25ND to 244ND to 1250ND to 11.4ND to 3.84NDNDND to 745ND to 158
95 PercentUCL
BackgroundConcentration
96,1007.838.9732.03.260.96352046519.41071.05188,00018.369322400.491265655.751.33500142.490.4
Boring Number and Soil Sample Depth (feet)
18DWSB003 18DWPSB0042.5 9.5 19.5 2.5 9.5 19.5
105,000
—9.95 — — 10.0 JP 10.0 JP —
——...15,900
48162.2 — — 56.9141
——24.517706280
0.531158
...
...
—.........145 138 — 91.8 105
22504 12.04.000926092995 ROD
2 of 3
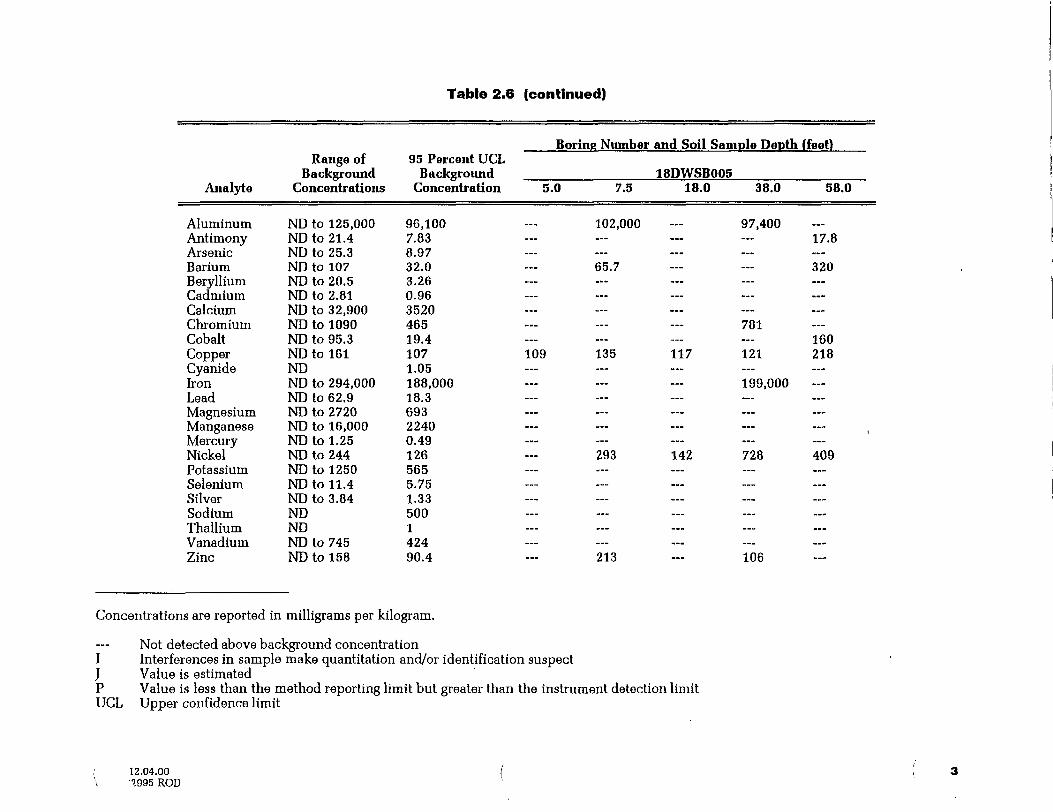
Table 2.6 (continued)
Boring Number and Soil Sample Depth ffaet)
Analyte
AluminumAntimonyArsenicBariumBerylliumCadmiumCalciumChromiumCobaltCopperCyanideIronLeadMagnesiumManganeseMercuryNickelPotassiumSeleniumSilverSodiumThalliumVanadiumZinc
Range ofBackground
Concentrations
ND to 125,000ND to 21.4ND to 25.3ND to 107ND to 20.5ND to 2.81ND to 32,900ND to 1090ND to 95.3ND to 161NDND to 294,000ND to 62.9ND to 2720ND to 16,000ND to 1.25ND to 244ND to 1250ND to 11.4ND to 3.84NDNDND to 745ND to 158
95 Percent UCLBackground
Concentration 5.0
96,1007.838.9732.03.260.96352046519.4107 1091.05188,00018.369322400.491265655.751.33500142490.4
7.5
102,000......65.7
—...
—_~...135
——...
———293......
—.........213
18DWSB00518.0 38.0
97,400
—.........
—...781
—117 121...
199,000
————142 728.........
—......
106
58.0
...
17.8...320
—...
—.—160218
——...
———409.......__.........
—
Concentrations are reported in milligrams per kilogram.
Not detected above background concentrationI Interferences in sample make quantitation and/or identification suspectJ Value is estimatedP Value is less than the method reporting limit but greater than the instrument detection limitUCL Upper confidence limit
12.04.00•2995 ROD
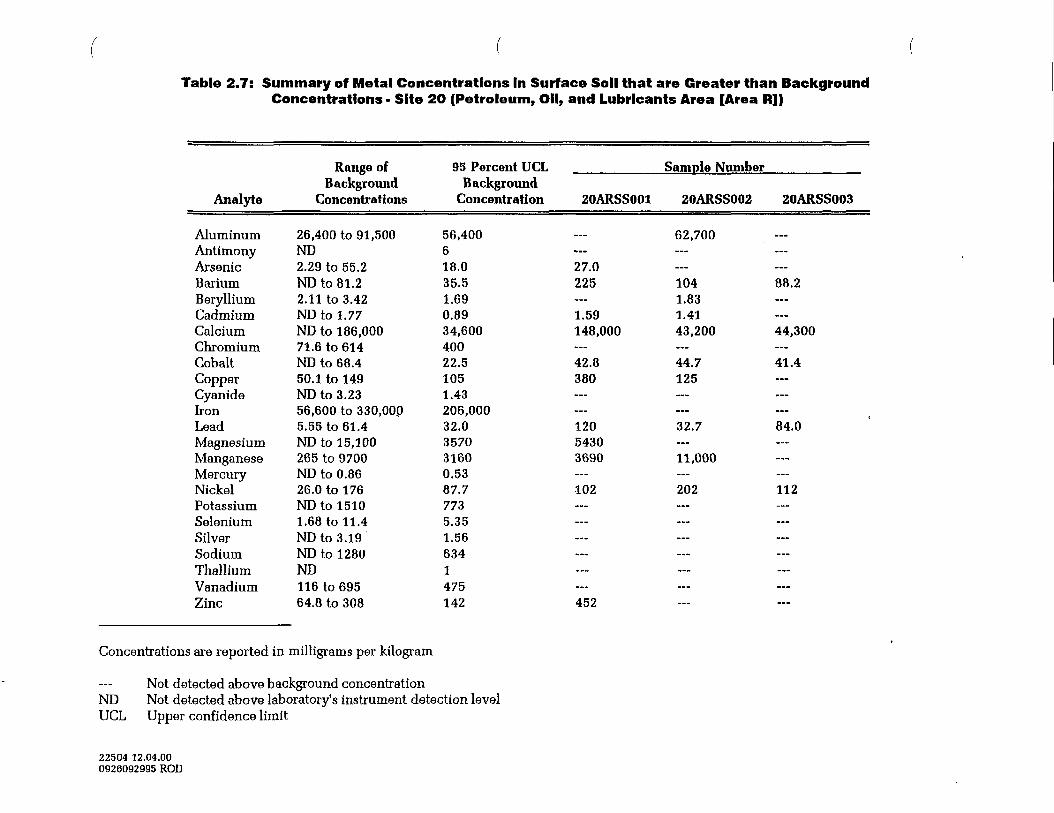
Table 2.7: Summary of Metal Concentrations In Surface Soil that are Greater than BackgroundConcentrations • Site 2O (Petroleum, OH, and Lubricants Area [Area R])
Analyte
AluminumAntimonyArsenicBariumBerylliumCadmiumCalciumChromiumCobaltCopperCyanideIronLeadMagnesiumManganeseMercuryNickelPotassiumSeleniumSilverSodiumThalliumVanadiumZinc
Range ofBackground
Concentrations
26,400 to 91,500ND2.29 to 55.2ND to 81.22.11 to 3.42ND to 1.77ND to 186,00071.6 to 614ND to 68.450.1 to 149ND to 3.2356,600 to 330,00p5.55 to 61.4ND to 15,100265 to 9700ND to 0.8626.0 to 176ND to 15101.68 to 11.4ND to 3.19ND to 1280ND116 to 69564.8 to 308
95 Percent UCLBackground
Concentration
56,400618.035.51.690.8934,60040022.51051.43206,00032.0357031600.5387.77735.351.566341475142
20ARSS001
.
...27.0225
—1.59148,000
—42.8380
——12054303690
—102
—......
———452
Sample Number
20ARSS002 20ARSS003
62,700
——104 88.21.831.4143,200 44,300
—44.7 41.4125
——32.7 84.0—11,000
—202 112
—...
————— ...
Concentrations are reported in milligrams per kilogram
Not detected above background concentrationND Not detected above laboratory's instrument detection levelUCL Upper confidence limit
22504 12.04.000926092995 ROD
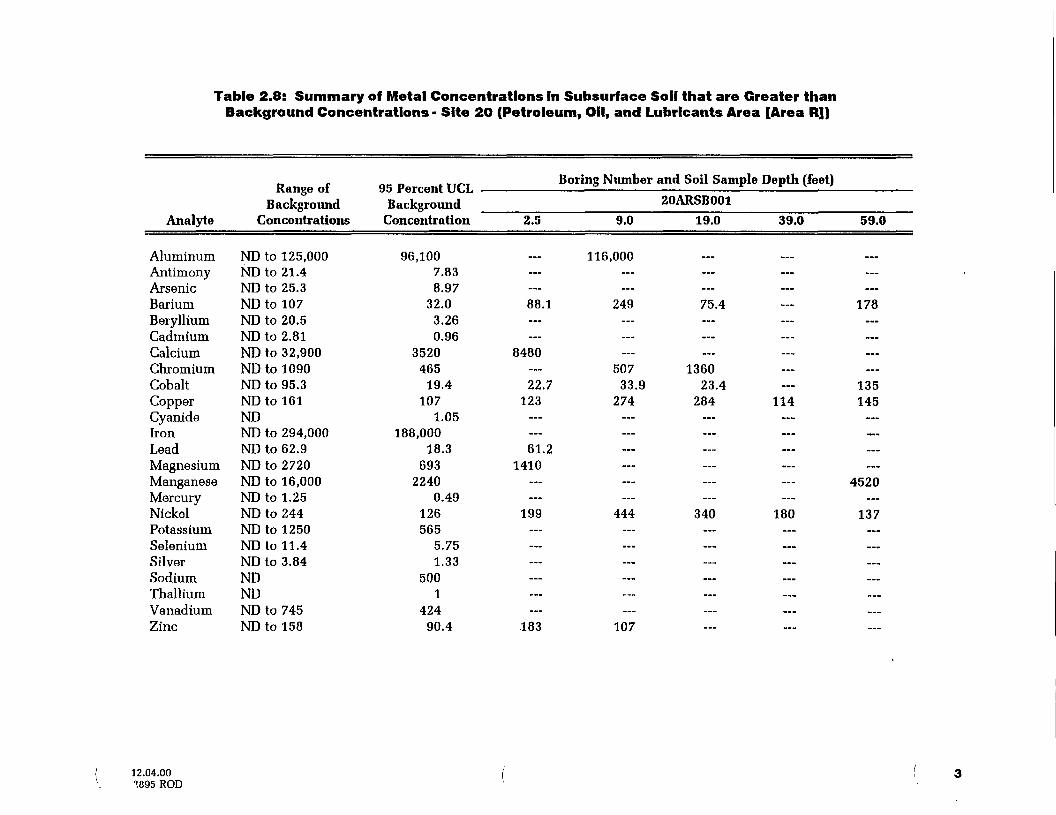
Table 2.8: Summary of Metal Concentrations In Subsurface Soil that are Greater thanBackground Concentrations - Site 2O (Petroleum, OH, and Lubricants Area [Area R])
Analyte
AluminumAntimonyArsenicBariumBerylliumCadmiumCalciumChromiumCobaltCopperCyanideIronLeadMagnesiumManganeseMercuryNickelPotassiumSeleniumSilverSodiumThalliumVanadiumZinc
Range ofBackground
Concentrations
ND to 125,000ND to 21.4ND to 25.3ND to 107ND to 20.5ND to 2.81ND to 32,900ND to 1090ND to 95.3ND to 161NDND to 294,000ND to 62.9ND to 2720ND to 16,000ND to 1.25ND to 244ND to 1250ND to 11.4ND to 3.84NDNDND to 745ND to 158
95 Percent UCLBackground
Concentration
96,1007.838.97
32.03.260.96
3520465
19.4107
1.05188,000
18.3693
22400.49
126565
5.751.33
5001
42490.4
2.5
__-
——88.1—
—8480
—22.7123
——61.2
1410
——
199...
———......
.183
Boring Number
9.0
116,000——249—
——
50733.9
274
—.........
——
444
——......„_
—107
and Soil Sample Depth (feet)20ARSB001
19.0 39.0
_•• „__
——75.4...
—...
136023.4
284 114...
————...
340 180
—...
—— ...— ...— ...
— —
59.0
...
——178
——......
135145
—
———
4520
—137...
——
12.04.00•>895 ROD
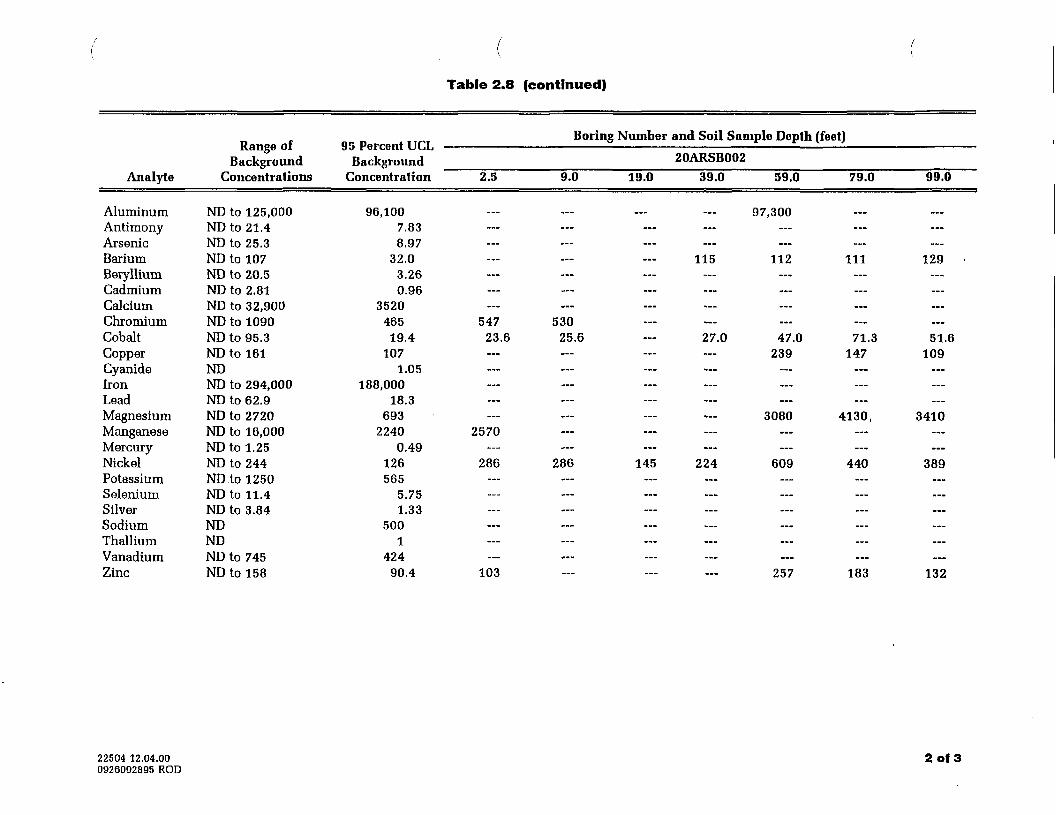
Table 2.8 (continued)
Analyte
AluminumAntimonyArsenicBariumBerylliumCadmiumCalciumChromiumCobaltCopperCyanideIronLeadMagnesiumManganeseMercuryNickelPotassiumSeleniumSilverSodiumThalliumVanadiumZinc
Range ofBackground
Concentrations
ND to 125,000NDto 21.4ND to 25.3ND to 107ND to 20.5ND to 2.81ND to 32,900ND to 1090ND to 95.3ND to 161NDND to 294,000ND to 62.9ND to 2720ND to 16,000ND to 1.25ND to 244NDto 1250NDto 11.4ND to 3.84NDNDND to 745ND to 158
Boring Number and Soil Sample Depth (feet)05 Percent LJCL
BackgroundConcentration 2.5 9.0
96,1007.838.97
32.03.260.96
3520465 547 53019.4 23.6 25.6
1071.05
188,00018.3
6932240 2570
0.49126 286 286565
5.751.33
5001
42490.4 103
20ARSB00219.0 39.0 59.0
97,300
115 112
—
...
27.0 47.0239
3080
145 224 609
——...
—...
—257
79.0
—
Ill
—
—
71.3147
4130,
440
———....„
—183
99.0
...
129 •
—
...
51.6109
3410
389.........
—...
—132
22504 12.04.000926092895 ROD
2 of 3
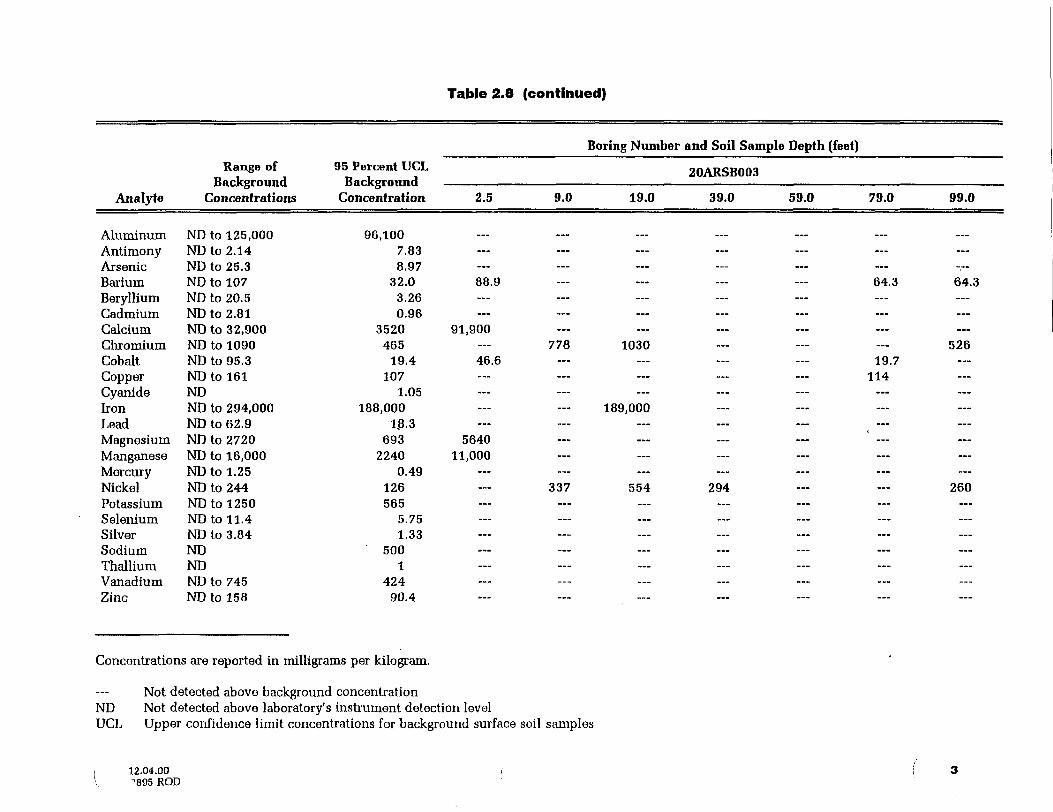
Table 2.8 (continued)
Boring Number and Soil Sample Depth (feet)
Analyte
AluminumAntimonyArsenicBariumBerylliumCadmiumCalciumChromiumCobaltCopperCyanideIronLeadMagnesiumManganeseMercuryNickelPotassiumSeleniumSilverSodiumThalliumVanadiumZinc
Range ofBackground
Concentrations
ND to 125,000ND to 2.14ND to 25.3ND to 107ND to 20.5ND to 2.81ND to 32,900ND to 1090ND to 95.3ND to 161NDND to 294,000ND to 62.9ND to 2720ND to 16,000ND to 1.25ND to 244ND to 1250NDtoll.4ND to 3.84NDNDND to 745ND to 158
95 Percent UCL 20ARSB003B ackground
Concentration 2.5 9.0 19.0 39.0 59.0 79.0 99.0
96,1007.838.97
32.0 88.9 — --- — — 64.3 64.33.260.96
3520 91,900465 --- 778 1030 --- — --- 526
19.4 46.6 — — — — 19.7107 — — — — — 114
1.05188,000 — — 189,000
18.3693 5640
2240 11,0000.49
126 — 337 554 294 — — 260565
5.751.33
5001
42490.4
Concentrations are reported in milligrams per kilogram.
Not detected above background concentrationND Not detected above laboratory's instrument detection levelUCL Upper confidence limit concentrations for background surface soil samples
12.04.00••895 ROD
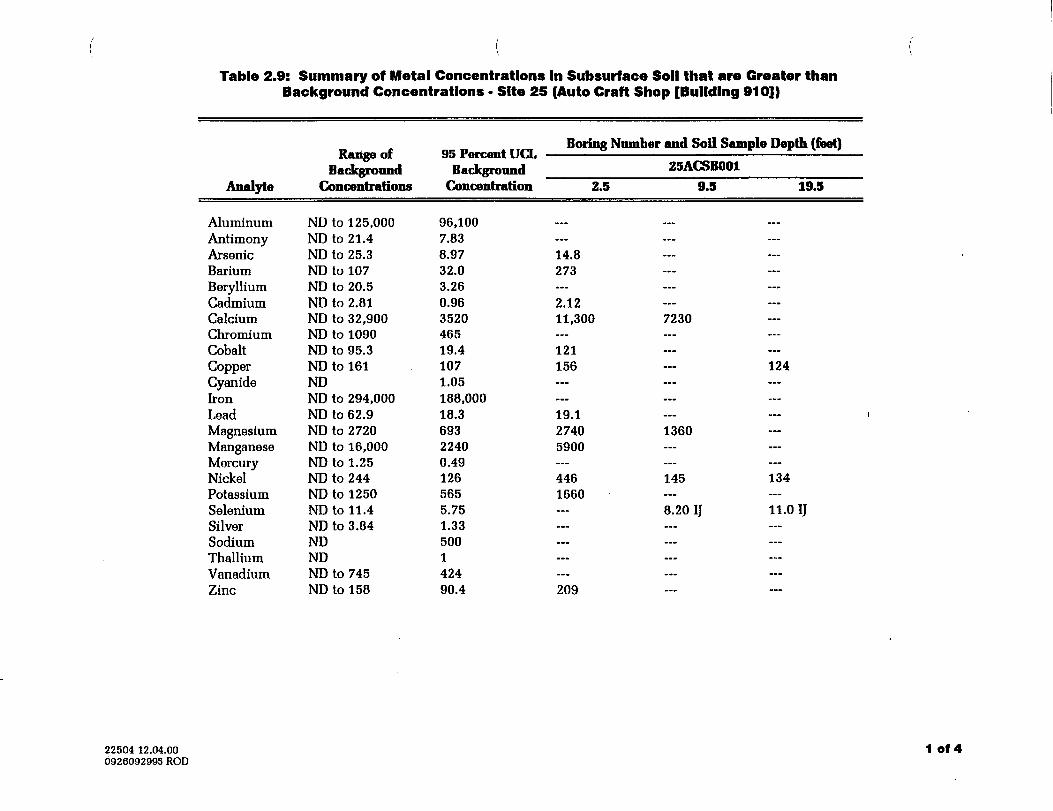
I\
Table 2.9: Summary of Metal Concentrations In Subsurface Soil that are Greater thanBackground Concentrations - Site 25 (Auto Craft Shop [Building 91OJ)
Analyte
AluminumAntimonyArsenicBariumBerylliumCadmiumCalciumChromiumCobaltCopperCyanideIronLeadMagnesiumManganeseMercuryNickelPotassiumSeleniumSilverSodiumThalliumVanadiumZinc
Range ofBackground
Concentrations
ND to 125,000ND to 21.4ND to 25.3ND to 107ND to 20.5ND to 2.81ND to 32,900ND to 1090ND to 95.3ND to 161NDND to 294,000ND to 62.9ND to 2720ND to 16,000ND to 1.25ND to 244ND to 1250ND to 11.4ND to 3.84NDNDND to 745ND to 158
95 Percent UCLBackground
Concentration
96,1007.838.9732.03.260.96352046519.41071.05188,00018.369322400.491265655.751.33500142490.4
Boring Number
2.5
...
...
14.8273...
2.1211,300
—121156
——19.127405900
—4461660
——...
—...209
and Soil Sample Depth (feet)
25ACSB0019.5 19.5
... ...
...
...
—...
—7230
——
124...
——1360
—...145 134...8.20 IJ 11.0 IJ...
—...
——
22504 12.04.000926092995 ROD
1 of 4
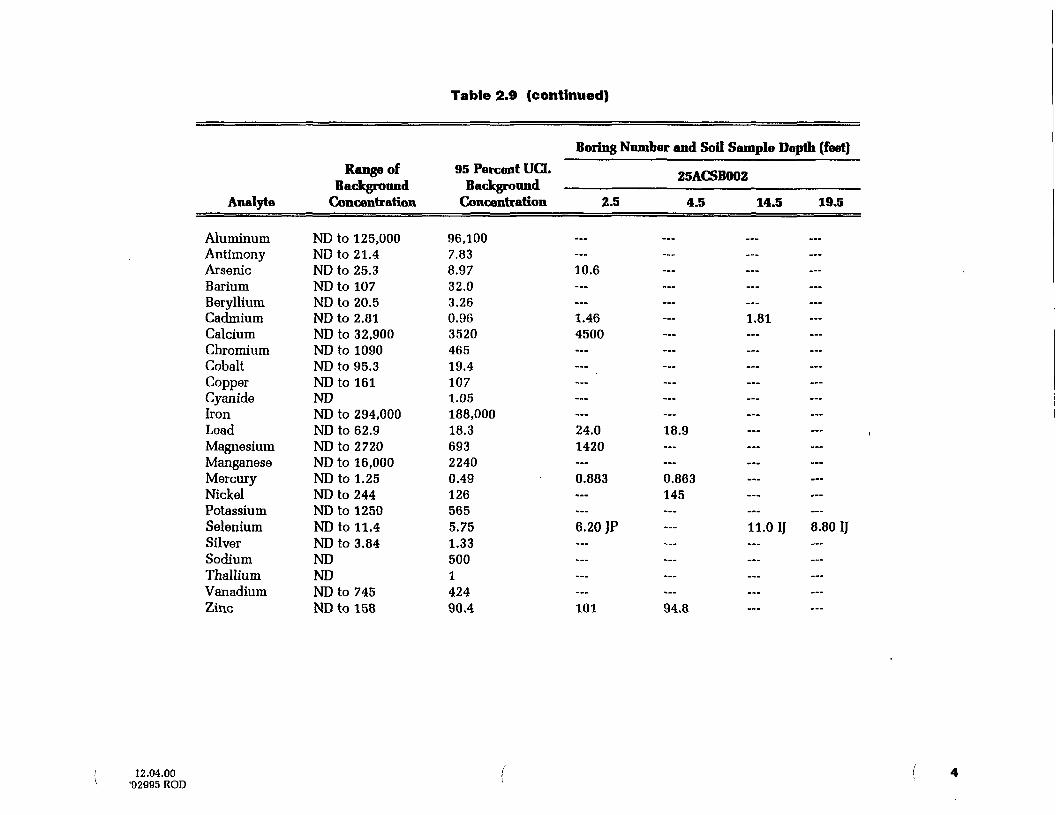
Table 2.9 (continued)
Analyta
AluminumAntimonyArsenicBariumBerylliumCadmiumCalciumChromiumCobaltCopperCyanideIronLeadMagnesiumManganeseMercuryNickelPotassiumSeleniumSilverSodiumThalliumVanadiumZinc
Range ofBackground
Concentration
ND to 125,000ND to 21.4ND to 25.3ND to 107ND to 20.5ND to 2.81ND to 32,900ND to 1090ND to 95.3ND to 161NDND to 294,000ND to 62.9ND to 2720ND to 16,000ND to 1.25ND to 244ND to 1250ND to 11.4ND to 3.84NDNDND to 745ND to 158
95 Percent UCLBackground
Concentration
96,1007.838.9732.03.260.96352046519.41071.05188,00018.369322400.491265655.751.33500142490.4
Boring Number and Soil Sample Depth (feet)
25ACSB002
2.5 4.5 14.5 19.5
••__ ___ ._ »•»
...10.6
——1.46 — 1.814500...
—...
—...24.0 18.91420
—0.883 0.863145
—6.20 JP — 11.0 IJ 8.80 IJ
—,.....
—101 94.8
12.04.00'92995 ROD
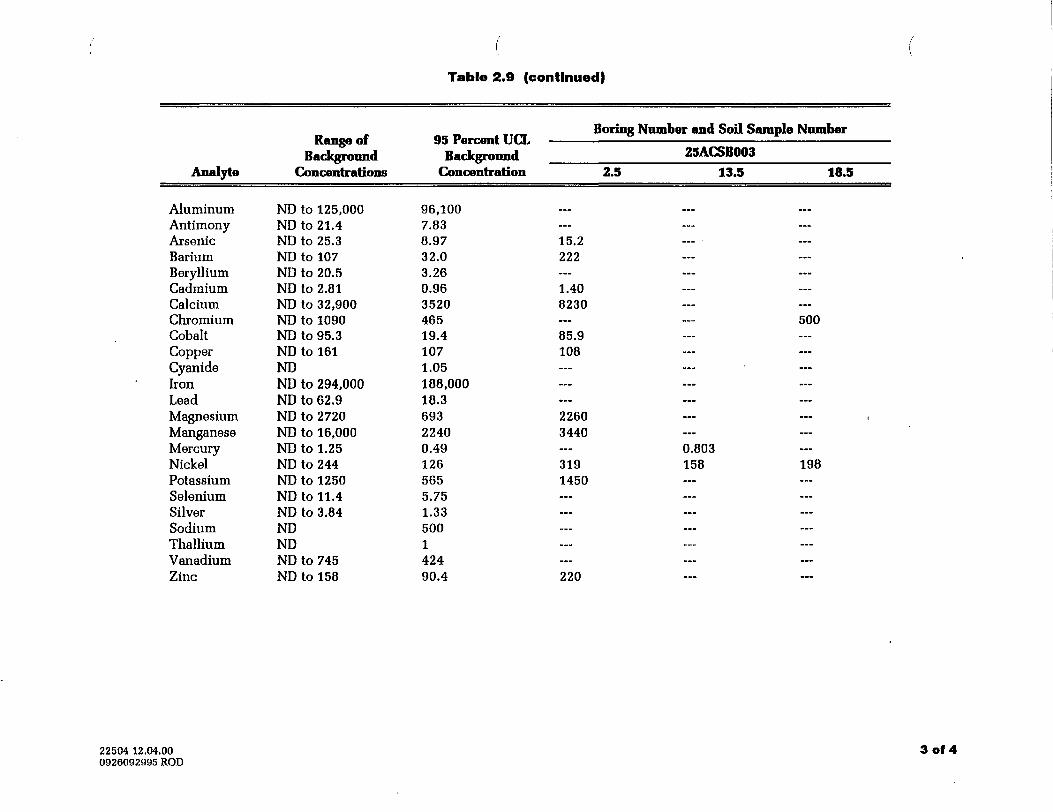
Table 2.9 (continued)
Analyte
AluminumAntimonyArsenicBariumBerylliumCadmiumCalciumChromiumCobaltCopperCyanideIronLeadMagnesiumManganeseMercuryNickelPotassiumSeleniumSilverSodiumThalliumVanadiumZinc
Range ofBackground
Concentrations
ND to 125,000ND to 21.4ND to 25.3ND to 107ND to 20.5ND to 2.81ND to 32,900ND to 1090ND to 95.3ND to 161NDND to 294,000ND to 62.9ND to 2720ND to 16,000ND to 1.25ND to 244ND to 1250ND to 11.4ND to 3.84NDNDND to 745ND to 158
95 Percent UCLBackground
Concentration
96,1007.838.9732.03.260.96352046519.41071.05188,00018.369322400.491265655.751.33500142490.4
Boring Number and Soil Sample Number
25ACSB0032.5 13.5 18.5
...
...15.2222
—1.408230
50085.9108...
——22603440
0.803319 158 1981450.........
——220
22504 12.04.000926092995 ROD
3 of 4
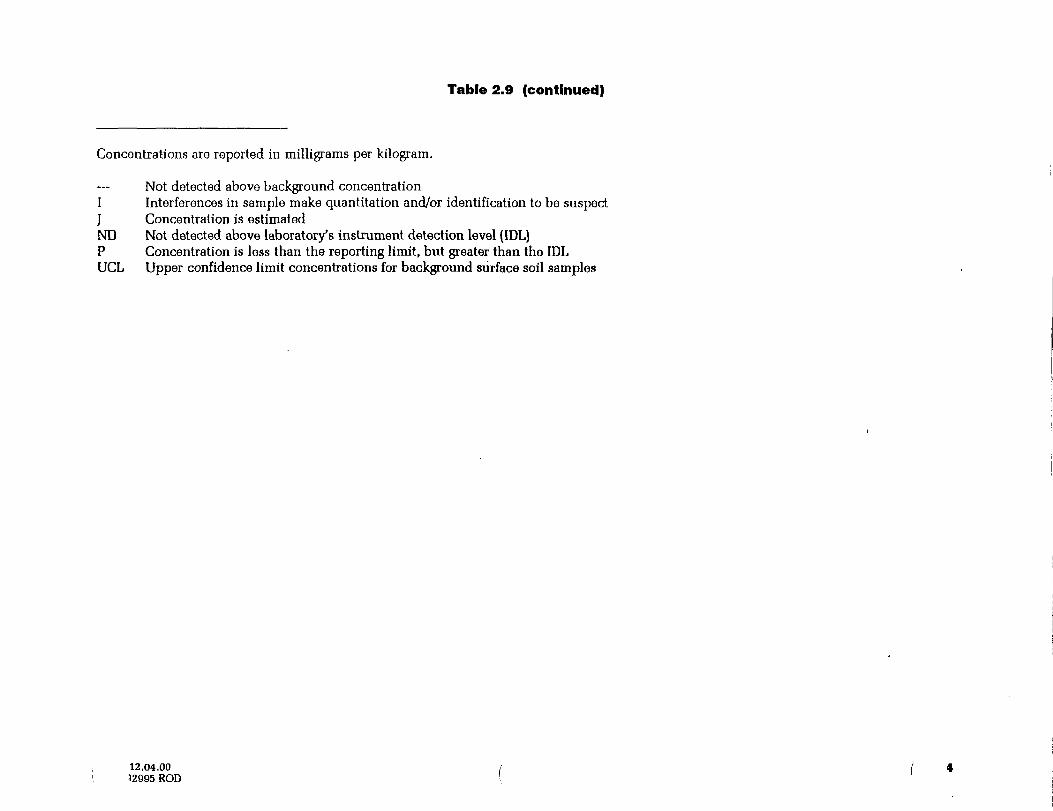
Table 2.9 (continued)
Concentrations are reported in milligrams per kilogram.
Not detected above background concentrationI Interferences in sample make quantitation and/or identification to be suspectJ Concentration is estimatedND Not detected above laboratory's instrument detection level (IDL)P Concentration is less than the reporting limit, but greater than the IDLUCL Upper confidence limit concentrations for background surface soil samples
12.04.0012995 ROD
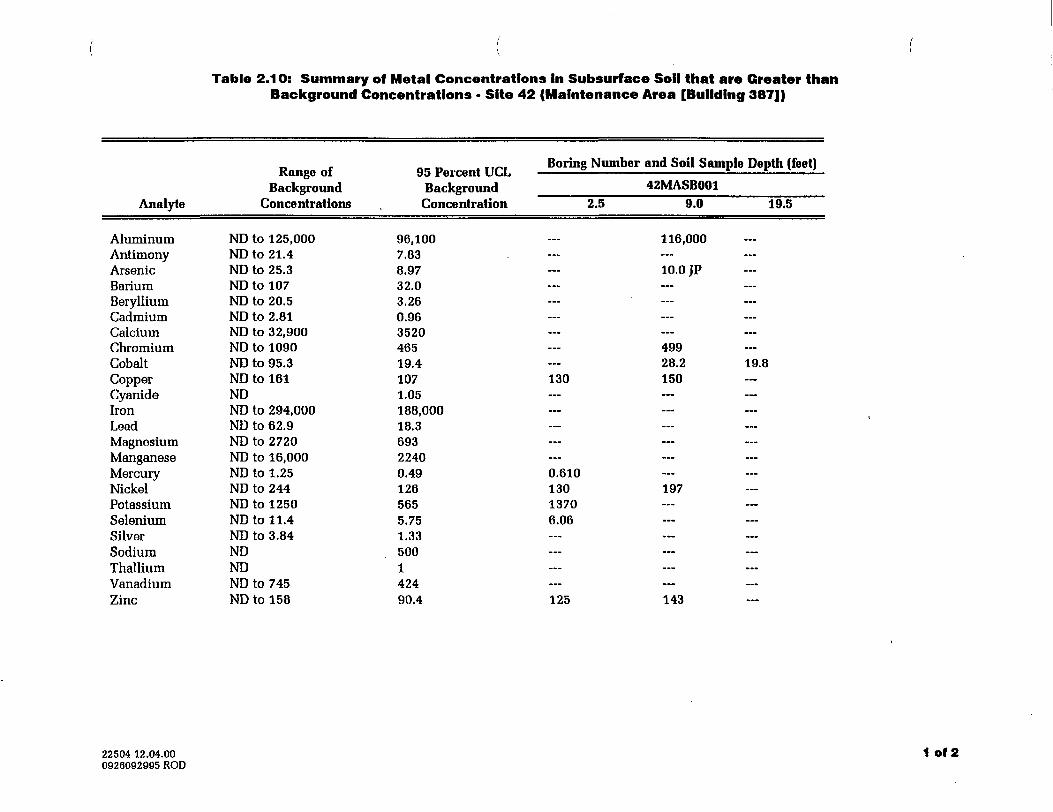
Table 2.10: Summary of Metal Concentrations In Subsurface Soil that are Greater thanBackground Concentrations • Site 42 (Maintenance Area [Building 387])
Analyte
AluminumAntimonyArsenicBariumBerylliumCadmiumCalciumChromiumCobaltCopperCyanideIronLeadMagnesiumManganeseMercuryNickelPotassiumSeleniumSilverSodiumThalliumVanadiumZinc
Range ofBackground
Concentrations
ND to 125,000ND to 21.4ND to 25.3ND to 107ND to 20.5ND to 2.81ND to 32,900ND to 1090ND to 95.3ND to 161NDND to 294,000ND to 62.9ND to 2720ND to 16,000ND to 1.25ND to 244ND to 1250ND to 11.4ND to 3.84NDNDND to 745ND to 158
95 Percent UCLBackgroundConcentration
96,1007.838.9732.03.260.96352046519.41071.05188,00018.369322400.491265655.751.33500142490.4
Boring Number
2.5
...
...
—...—
——...
—130
—...
———0.61013013706.06
————125
and Soil Sample Depth (feet)
42MASB0019.0 19.5
116,000
—10.0 JP
——
——49928.2 19.8150
—...
————197
——————143
22504 12.04.000926092995 ROD
1 of 2
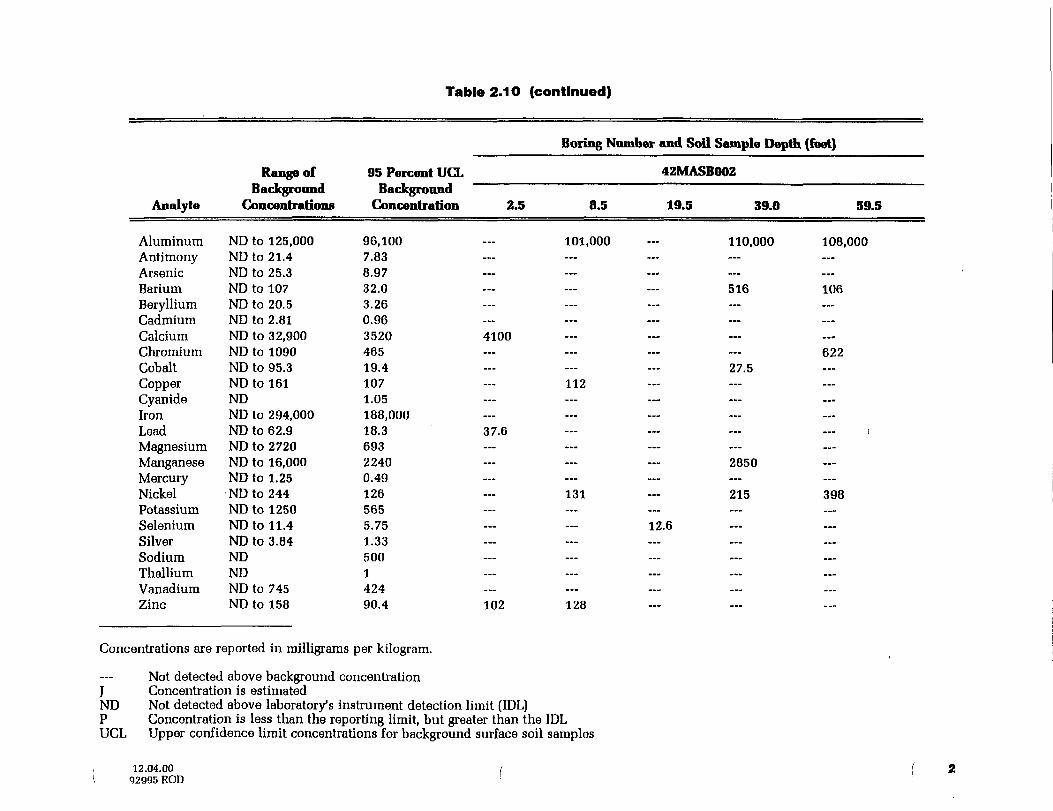
Table 2.10 (continued)
Boring Number and Soil Sample Depth (feet)
Analyte
AluminumAntimonyArsenicBariumBerylliumCadmiumCalciumChromiumCobaltCopperCyanideIronLeadMagnesiumManganeseMercuryNickelPotassiumSeleniumSilverSodiumThalliumVanadiumZinc
Range ofBackground
Concentrations
ND to 125,000ND to 21.4ND to 25.3ND to 107ND to 20.5ND to 2.81ND to 32,900ND to 1090ND to 95.3ND to 161NDND to 294,000ND to 62.9ND to 2720ND to 16,000ND to 1.25ND to 244ND to 1250ND to 11.4ND to 3.84NDNDND to 745ND to 158
95 Percent UCLBackground
Concentration 2.5
96,1007.838.9732.03.260.963520 410046519.41071.05188,00018.3 37.669322400.491265655.751.33500142490.4 102
42MASB002
8.5 19.5 39.0 59.5
101,000 — 110,000 108,000...
—516 106
—
—-—622
27.5112
—— i...
2850
—131 — 215 398
— 12.6...
— — — ——...128
Concentrations are reported in milligrams per kilogram.
Not detected above background concentrationJ Concentration is estimatedND Not detected above laboratory's instrument detection limit (IDL)P Concentration is less than the reporting limit, but greater than the IDLUCL Upper confidence limit concentrations for background surface soil samples
12.04.0092995 ROD
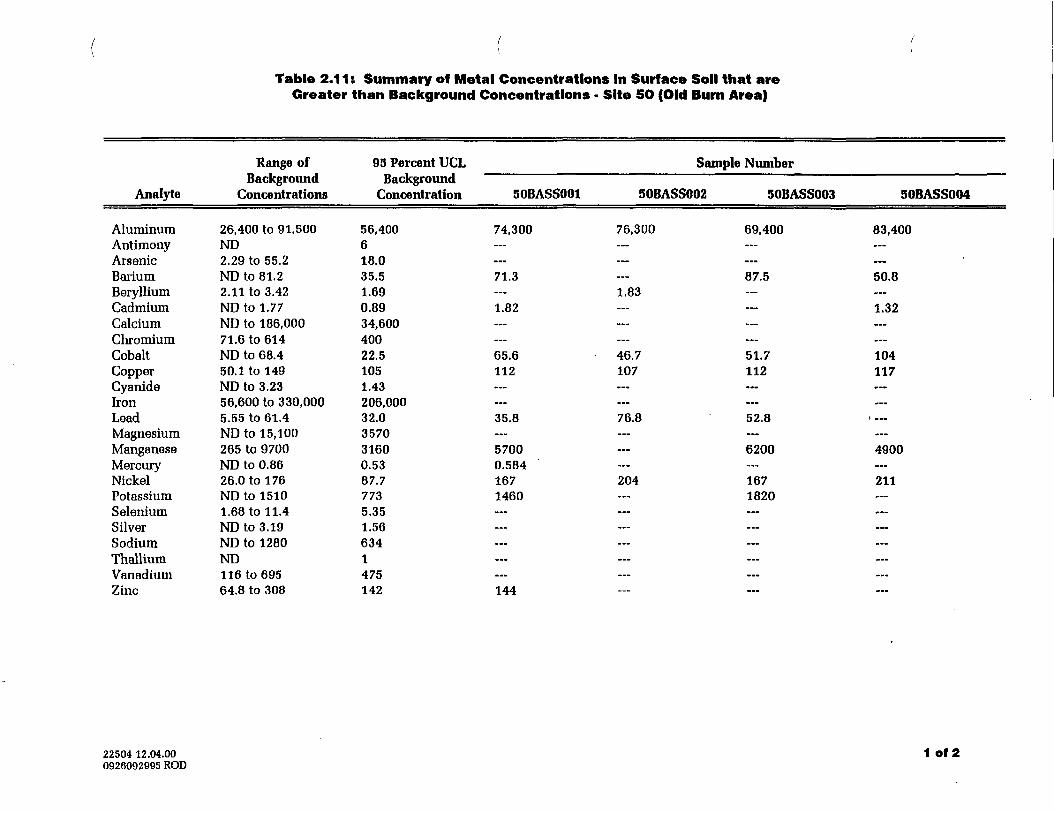
Table 2.11: Summary of Metal Concentrations In Surface Soil that areGreater than Background Concentrations • Site 50 (Old Burn Area)
Analyte
AluminumAntimonyArsenicBariumBerylliumCadmiumCalciumChromiumCobaltCopperCyanideIronLeadMagnesiumManganeseMercuryNickelPotassiumSeleniumSilverSodiumThalliumVanadiumZinc
Range ofBackground
Concentrations
26,400 to 91,500ND2.29 to 55.2ND to 81.22.11 to 3.42ND to 1.77ND to 186,00071.6 to 614ND to 68.450.1 to 149ND to 3.2356,600 to 330,0005.55 to 61.4ND to 15,100265 to 9700ND to 0.8626.0 to 176ND to 15101.68 to 11.4ND to 3.19ND to 1280ND116 to 69564.8 to 308
95 Percent UCLBackground
Concentration
56,400618.035.51.690.8934,60040022.51051.43206,00032.0357031600.5387.77735.351.566341475142
50BASS001
74,300—
—71.3
—1.82
——65.6112...
—35.8...57000.5841671460
——...
—...144
Sample Number
50BASS002 50BASS003 50BASS004
76,300 69,400 83,400
——
87.5 50.81.83
1.32
——46.7 51.7 104107 112 117
——76.8 52.8
— 6200 4900
—204 167 211
1820
——...
———
22504 12.04.000926092995 ROD
1 of 2
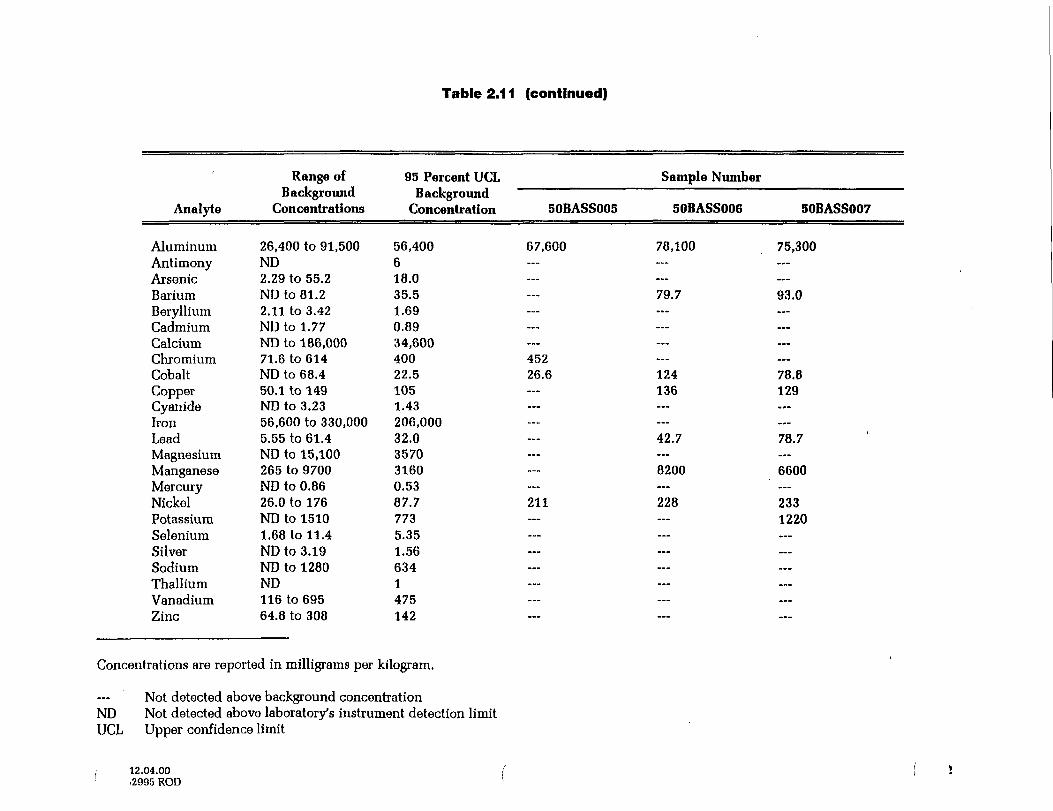
Table 2.11 (continued)
Analyte
AluminumAntimonyArsenicBariumBerylliumCadmiumCalciumChromiumCobaltCopperCyanideIronLeadMagnesiumManganeseMercuryNickelPotassiumSeleniumSilverSodiumThalliumVanadiumZinc
Range ofBackground
Concentrations
26,400 to 91,500ND2.29 to 55.2ND to 81.22.11 to 3.42ND to 1.77ND to 186,00071.6 to 614ND to 68.450.1 to 149ND to 3.2356,600 to 330,0005.55 to 61.4ND to 15,100265 to 9700ND to 0.8626.0 to 176ND to 15101.68 to 11.4ND to 3.19ND to 1280ND116 to 69564.8 to 308
95 Percent UCLBackground
Concentration 50BASS005
56,400 67,600618.035.51.690.8934,600400 45222.5 26.61051.43206,00032.0357031600.5387.7 2117735.351.566341475142
Sample Number
50BASS006
78,100
...
79.7...
...
—124136
42.7
8200
228
———......
——
50BASS007
75,300— •
93.0
:::——78.8129
78.7
6600
2331220
——.........
—
Concentrations are reported in milligrams per kilogram.
Not detected above background concentrationND Not detected above laboratory's instrument detection limitUCL Upper confidence limit
12.04.00.2995 ROD
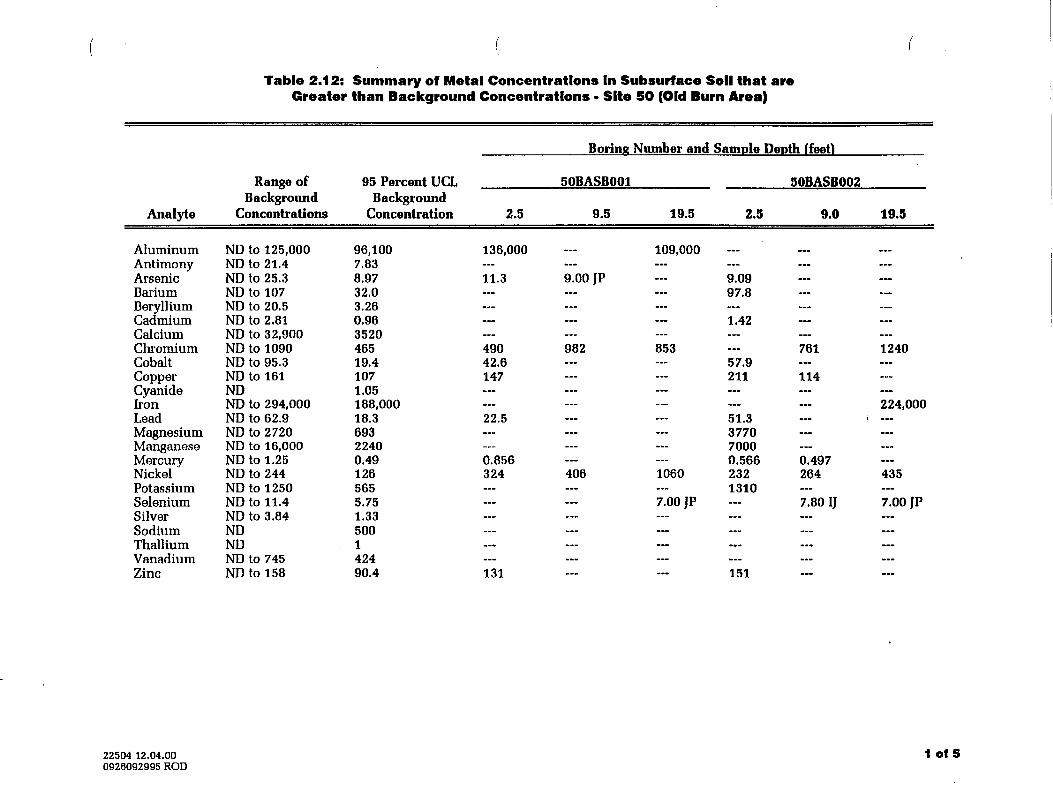
Table 2.12: Summary of Metal Concentrations In Subsurface Soil that areGreater than Background Concentrations - Site SO (Old Burn Area)
Analyte
AluminumAntimonyArsenicBariumBerylliumCadmiumCalciumChromiumCobaltCopperCyanideIronLeadMagnesiumManganeseMercuryNickelPotassiumSeleniumSilverSodiumThalliumVanadiumZinc
Range ofBackground
Concentrations
ND to 125,000ND to 21.4ND to 25.3ND to 107ND to 20.5ND to 2.81ND to 32,900ND to 1090ND to 95.3ND to 161NDND to 294,000ND to 62.9ND to 2720ND to 16,000ND to 1.25ND to 244ND to 1250ND to 11.4ND to 3.84NDNDND to 745ND to 158
95 Percent UCLBackground
Concentration
96,1007.838.9732.03.260.96352046519.41071.05188,00018.369322400.491265655.751.33500142490.4
Boring
50BASB001
2.5 9.5
136,000
—11.3 9.00 ]P......
——490 98242.6147
——22.5
——0.856324 406...
——...
——131
Number and Sample Depth (feet)
50BASB002
19.5 2.5 9.0
109,000...
9.0997.8
— — ...1.42
—853 — 76157.9211 114
—— 51.3
377070000.566 0.497
1060 232 2641310
7.00 JP — 7.80 IJ
————
151
19.5
...
...
—————1240
———224,000
i —
———435
—7.00 JP
———...
—
22504 12.04.000926092995 ROD
1 of 5
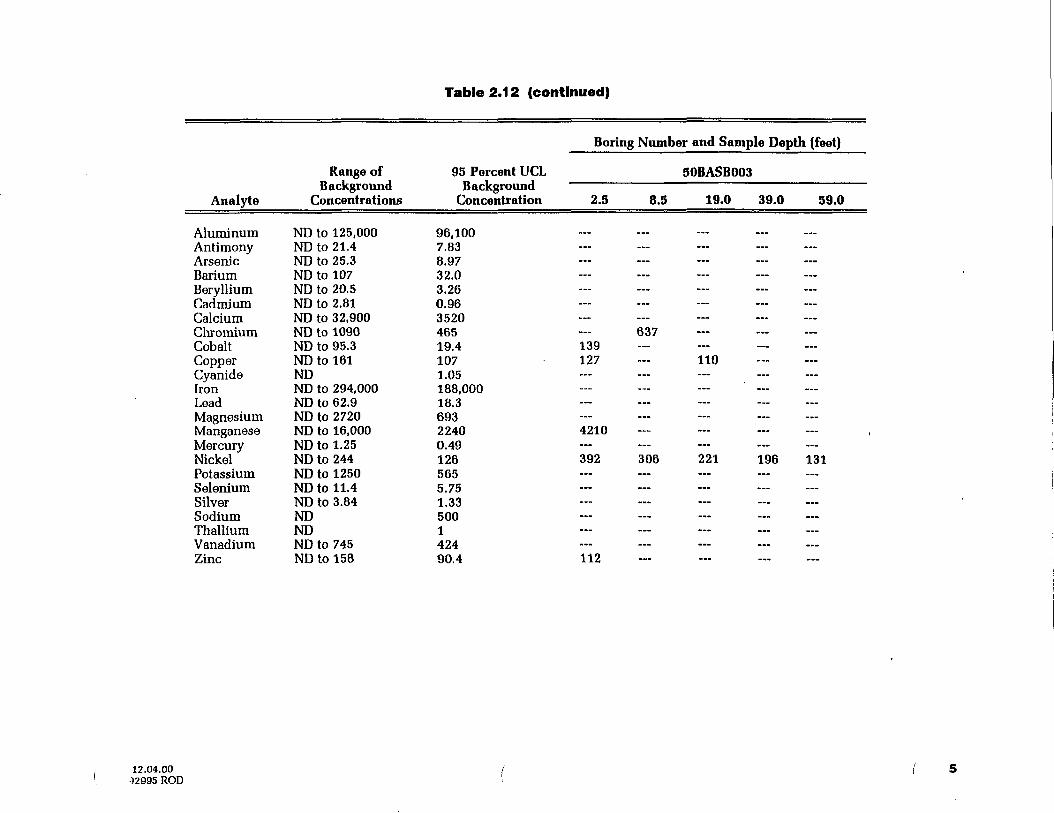
Table 2.12 (continued)
Analyte
AluminumAntimonyArsenicBariumBerylliumCadmiumCalciumChromiumCobaltCopperCyanideIronLeadMagnesiumManganeseMercuryNickelPotassiumSeleniumSilverSodiumThalliumVanadiumZinc
Range ofBackground
Concentrations
ND to 125,000ND to 21.4ND to 25.3ND to 107ND to 20.5ND to 2.81ND to 32,900ND to 1090ND to 95.3ND to 161NDND to 294,000ND to 62.9ND to 2720ND to 16,000ND to 1.25ND to 244ND to 1250ND to 11.4ND to 3.84NDNDND to 745ND to 158
Boring Number and Sample Depth (feet)
95 Percent UCL 50BASB003Background
Concentration 2.5 8.5 19.0 39.0 59.0
96,100 — — —7.83 — — —8.97 — — —32.0 — — —3.26 — — —0.96 — — —3520 — — —465 — 637 —19.4 139 — —107 127 — 1101.05 — — —188,000 — — —18.3 — — —693 — — —2240 42100.49 — — —126 392 306 221 196 131565 — — —5.75 — — ™1.33 — — —500 — — ---1 — — —424 — — —90.4 112 — —
12.04.0032995 ROD
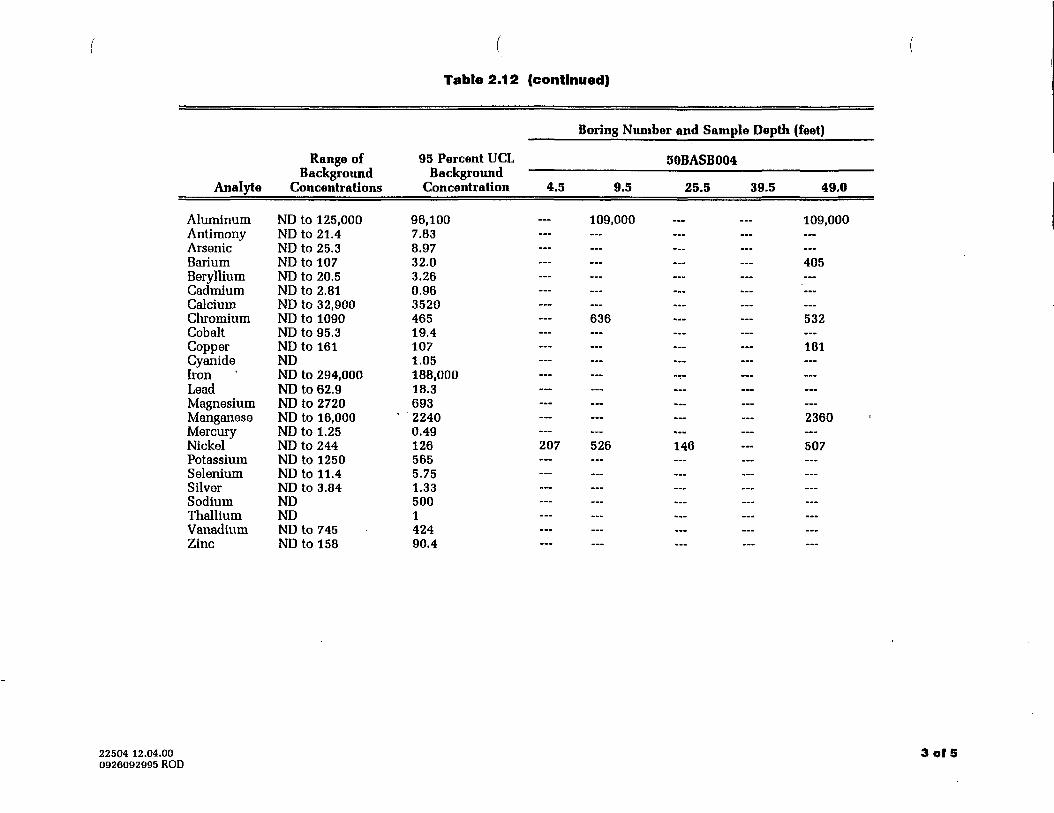
Table 2.12 (continued)
Boring Number and Sample Depth (feet)
Analyte
AluminumAntimonyArsenicBariumBerylliumCadmiumCalciumChromiumCobaltCopperCyanideIronLeadMagnesiumManganeseMercuryNickelPotassiumSeleniumSilverSodiumThalliumVanadiumZinc
Range ofn 1 jBackground
Concentrations
ND to 125,000ND to 21.4ND to 25.3ND to 107ND to 20.5ND to 2.81ND to 32,900ND to 1090ND to 95.3ND to 161NDND to 294,000ND to 62.9ND to 2720ND to 16,000ND to 1.25ND to 244ND to 1250ND to 11.4ND to 3.84NDNDND to 745ND to 158
95 Percent UCLBackground
Concentration 4.5 9.5
96,100 — 109,0007.838.9732.03.260.963520465 — 63619.41071.05188,00018.3693
' 22400.49126 207 5265655.751.33500142490.4
50BASB004
25.5 39.5 49.0
109,000
—— 405
—...
— 532...
181
—...
—— 2360
—146 --- 507
—...— ... —
— — —... ... ...
——
22504 12.04.000926092995 ROD
3 of 5
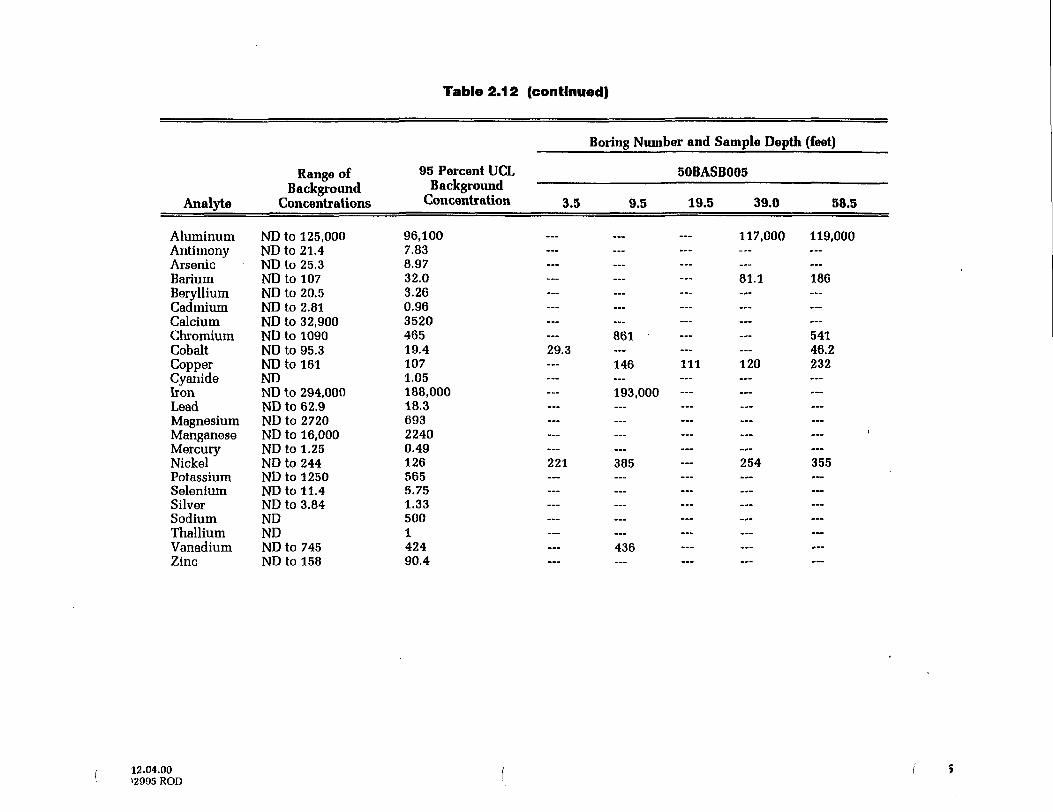
Table 2.12 (continued)
Boring Number and Sample Depth (feet)
Analyte
AluminumAntimonyArsenicBariumBerylliumCadmiumCalciumChromiumCobaltCopperCyanideIronLeadMagnesiumManganeseMercuryNickelPotassiumSeleniumSilverSodiumThalliumVanadiumZinc
Range ofBackground
Concentrations
ND to 125,000ND to 21.4ND to 25.3ND to 107ND to 20.5ND to 2.81ND to 32,900ND to 1090ND to 95.3ND to 161NDND to 294,000ND to 62.9ND to 2720ND to 16,000ND to 1.25ND to 244ND to 1250ND to 11.4ND to 3.84NDNDND to 745ND to 158
95 Percent UCLBackground
Concentration
96,1007.838.9732.03.260.96352046519.41071.05188,00018.369322400.491265655.751.33500142490.4
50BASB005
3.5 9.5 19.5
... ... ..-
...
————— 86129.3
146 111—
193,000
————221 385
——...
——
436
—
39.0 58.5
117,000 119,000—
—81.1 186
——...54146.2
120 232...
——...
——254 355
—......
————
12.04.00'2995 ROD
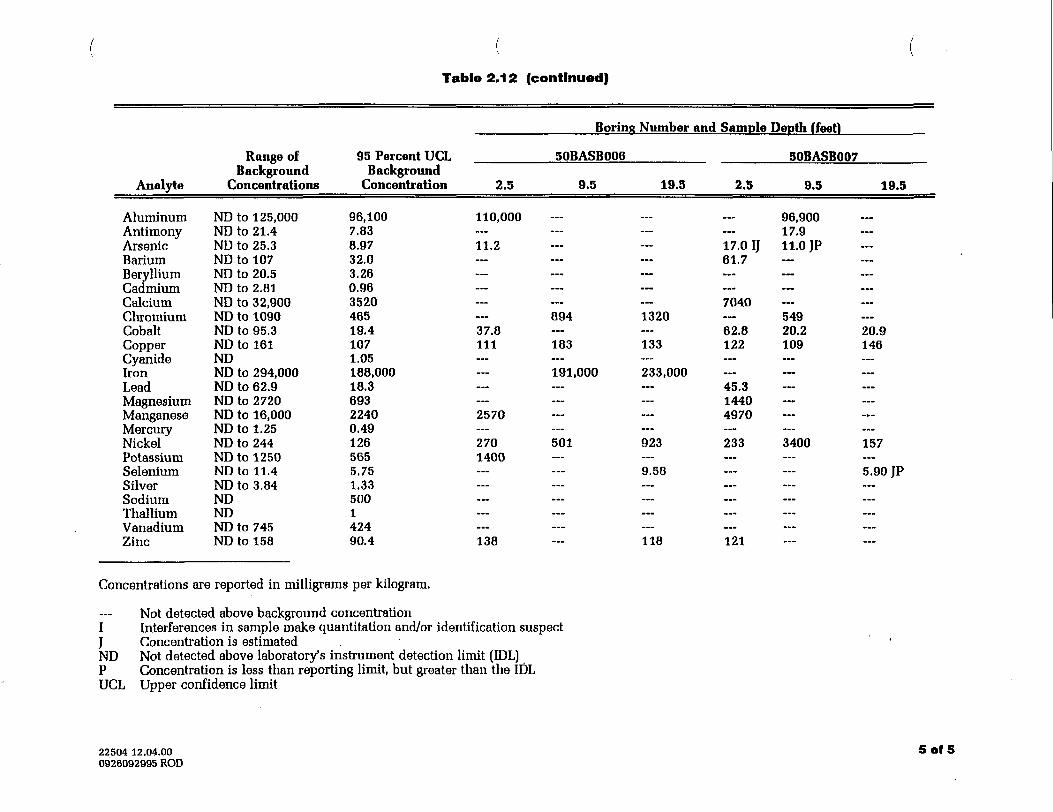
Table 2.12 (continued)
Boring Number and Sample Depth ffeetl
Analyte
AluminumAntimonyArsenicBariumBerylliumCadmiumCalciumChromiumCobaltCopperCyanideIronLeadMagnesiumManganeseMercuryNickelPotassiumSeleniumSilverSodiumThalliumVanadiumZinc
Range ofBackground
Concentrations
ND to 125,000ND to 21.4ND to 25.3ND to 107ND to 20.5ND to 2.81ND to 32,900ND to 1090ND to 95.3ND to 161NDND to 294,000ND to 62.9ND to 2720ND to 16,000ND to 1.25ND to 244ND to 1250NDto 11.4ND to 3.84NDNDND to 745ND to 158
95 Percent UCLBackground
Concentration
96,1007.838.9732.03.260.96352046519.41071.05188,00018.369322400.491265655.751.33500142490.4
50BASB006
2.5 9.5
110,000...11.2
————
89437.8111 183
— 191,000
—...2570—270 5011400...
—...
——138
19.5 2.5
...
— 17.0 IJ61.7
—— 70401320
62.8133 122
—233,00045.314404970
—923 233
—9.58
————118 121
30BASB007
9.5 19.5
96,90017.911.0 JP
————54920.2 20.9109 146
———— -_
—3400 157— 5.90 JP
—————
Concentrations are reported in milligrams per kilogram.
Not detected above background concentrationI Interferences in sample make quantitation and/or identification suspectJ Concentration is estimatedND Not detected above laboratory's instrument detection limit (IDL)P Concentration is less than reporting limit, but greater than the IDLUCL Upper confidence limit
22504 12.04.000926092995 ROD
5 of 5
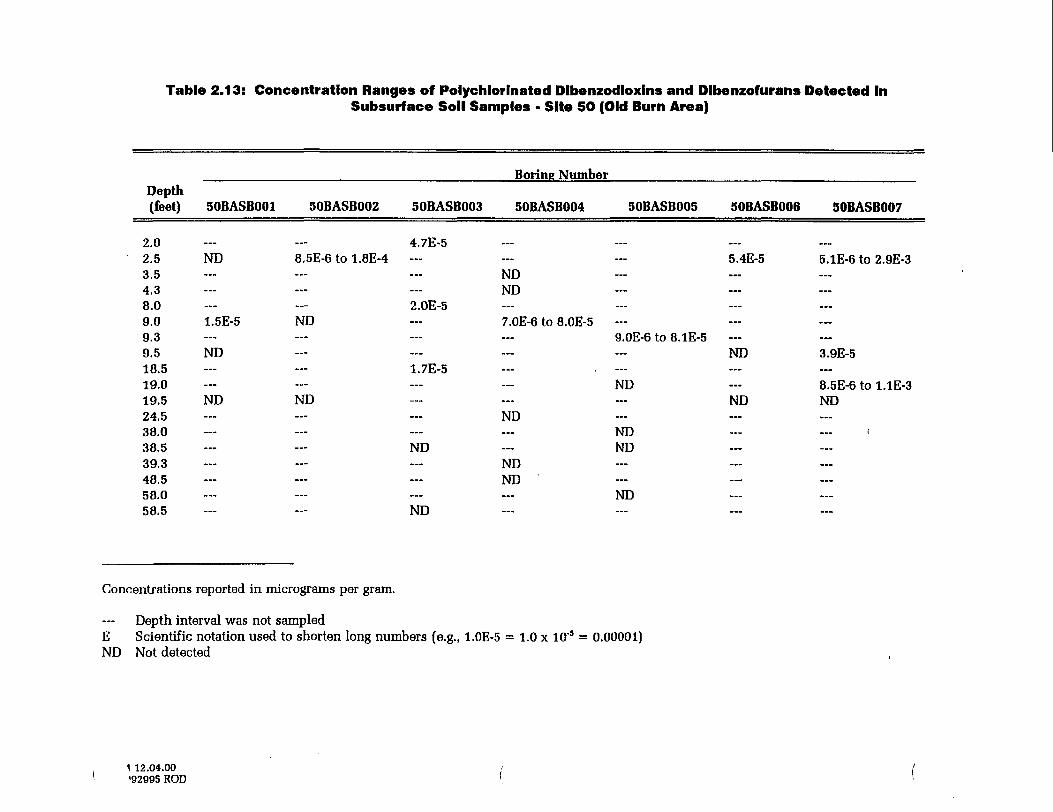
Table 2.13: Concentration Ranges of Polychlorlnated Dlbenzodloxins and Dlbenzofurans Detected InSubsurface Soil Samples - Site 50 (Old Burn Area)
Bonne NumberDepth(feet) 50BASB001 50BASB002 50BASB003 50BASB004 50BASB005 50BASB006 50BASB007
2.02.5 ND3.54.38.09.0 1.5E-59.39.5 ND18.519.019.5 ND24.538.038.539.348.558.058.5
4.7E-58.5E-6 to 1.8E-4 — — — 5.4E-5 5.1E-6 to 2.9E-3
NDND
2.0E-5ND — 7.0E-6 to 8.0E-5 —
9.0E-6 to 8.1E-5ND 3.9E-5
1.7E-5 — • —ND --- 8.5E-6 to 1.1E-3
ND — — — ND NDND
NDND - ND
NDND
NDND
Concentrations reported in micrograms per gram.
Depth interval was not sampledE Scientific notation used to shorten long numbers (e.g., l.OE-5 = 1.0 x 10'5 = 0.00001)ND Not detected
\ 12.04.00'92995 ROD
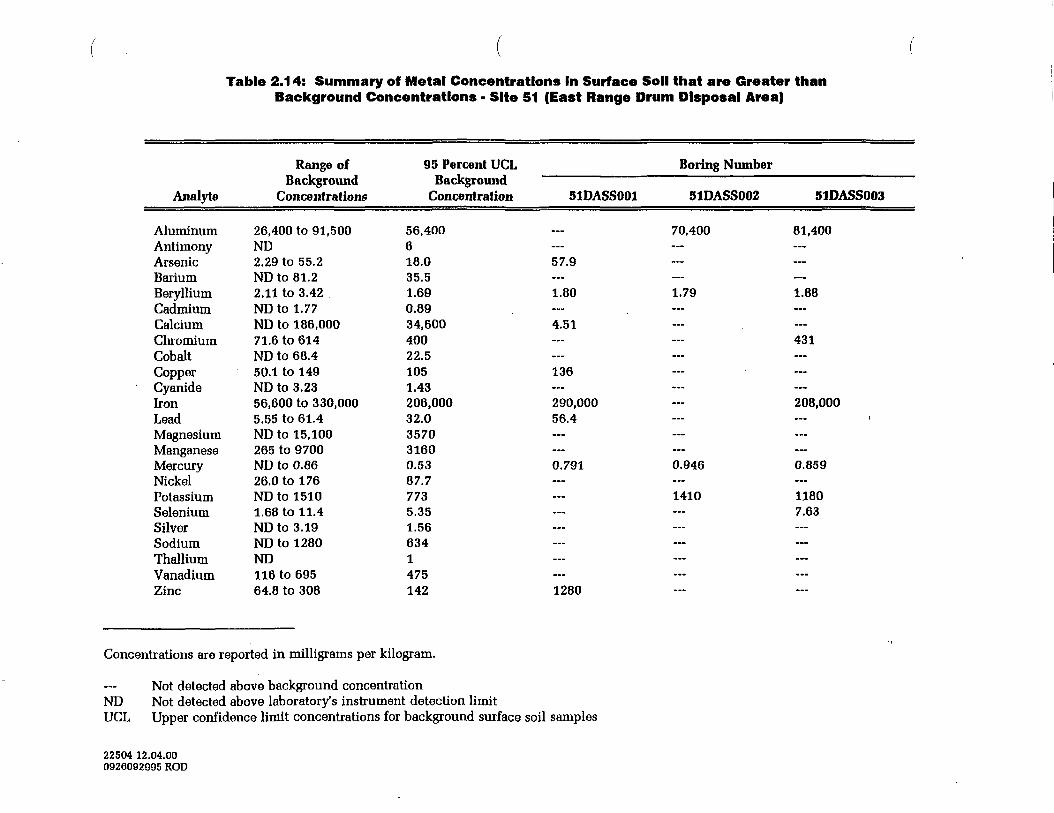
Table 2.14: Summary of Metal Concentrations In Surface Soil that are Greater thanBackground Concentrations - Site 51 (East Range Drum Disposal Area)
Analyte
AluminumAntimonyArsenicBariumBerylliumCadmiumCalciumChromiumCobaltCopper
' CyanideIronLeadMagnesiumManganeseMercuryNickelPotassiumSeleniumSilverSodiumThalliumVanadiumZinc
Range ofBackground
Concentrations
26,400 to 91,500ND2.29 to 55.2ND to 81.22.11 to 3.42NDto 1.77ND to 186,00071.6 to 614ND to 68.450.1 to 149ND to 3.2356,600 to 330,0005.55 to 61.4ND to 15,100265 to 9700ND to 0.8626.0 to 176ND to 15101.68 to 11.4ND to 3.19ND to 1280ND116 to 69564.8 to 308
95 Percent UCLBackground
Concentration
56,400618.035.51.690.8934,60040022.51051.43206,00032.0357031600.5387.77735.351.566341475142
51DASS001
...
57.9
—1.80
4.51
——136
290,00056.4
0.791
...
——...
——1280
Boring Number
51DASS002 51DASS003
70,400 81,400
:;: :::—1.79 1.88
— 431
—
208,000
—
0.946 0.859
1410 11807.63
...
...
—...
Concentrations are reported in milligrams per kilogram.
Not detected above background concentrationND Not detected above laboratory's instrument detection limitUCL Upper confidence limit concentrations for background surface soil samples
22504 12.04.000926092995 ROD
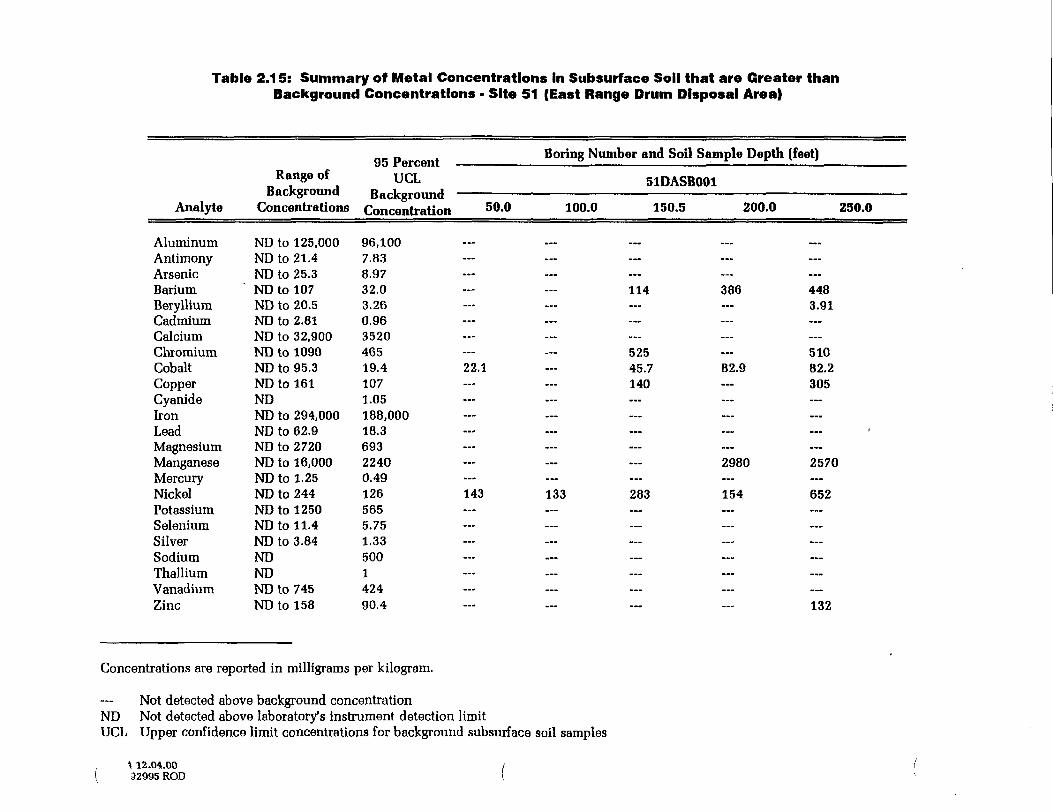
Table 2.15: Summary of Metal Concentrations In Subsurface Soil that are Greater thanBackground Concentrations • Site 51 (East Range Drum Disposal Area)
Analyte
AluminumAntimonyArsenicBariumBerylliumCadmiumCalciumChromiumCobaltCopperCyanideIronLeadMagnesiumManganeseMercuryNickelPotassiumSeleniumSilverSodiumThalliumVanadiumZinc
Range of UCLBflcktround n. i ....... ,1 . , .. .uaL,n.giuuuu Uuckgrouiiu
Concentrations Concentration 50-°
ND to 125,000 96,100ND to 21.4 7.83ND to 25.3 8.97ND to 107 32.0ND to 20.5 3.26ND to 2.81 0.96ND to 32,900 3520ND to 1090 465ND to 95.3 19.4 22.1ND to 161 107ND 1.05ND to 294,000 188,000ND to 62.9 18.3ND to 2720 693ND to 16,000 2240ND to 1.25 0.49ND to 244 126 143ND to 1250 565ND to 11.4 5.75ND to 3.84 1.33ND 500ND 1ND to 745 424ND to 158 90.4
Concentrations are reported in milligrams per kilogram.
Not detected above background concentrationND Not detected above laboratory's instrument detection limitUCL Upper confidence limit concentrations for background subsurface
\ 12.04.00 /32995 ROD (
Boring Number and Soil Sample Depth (feet)
51DASB001
100.0 150.5 200.0 230.0
114 386 4483.91
525 — 51045.7 B2.9 82.2140 — 305
2980 2570
133 283 154 652
132
soil samples
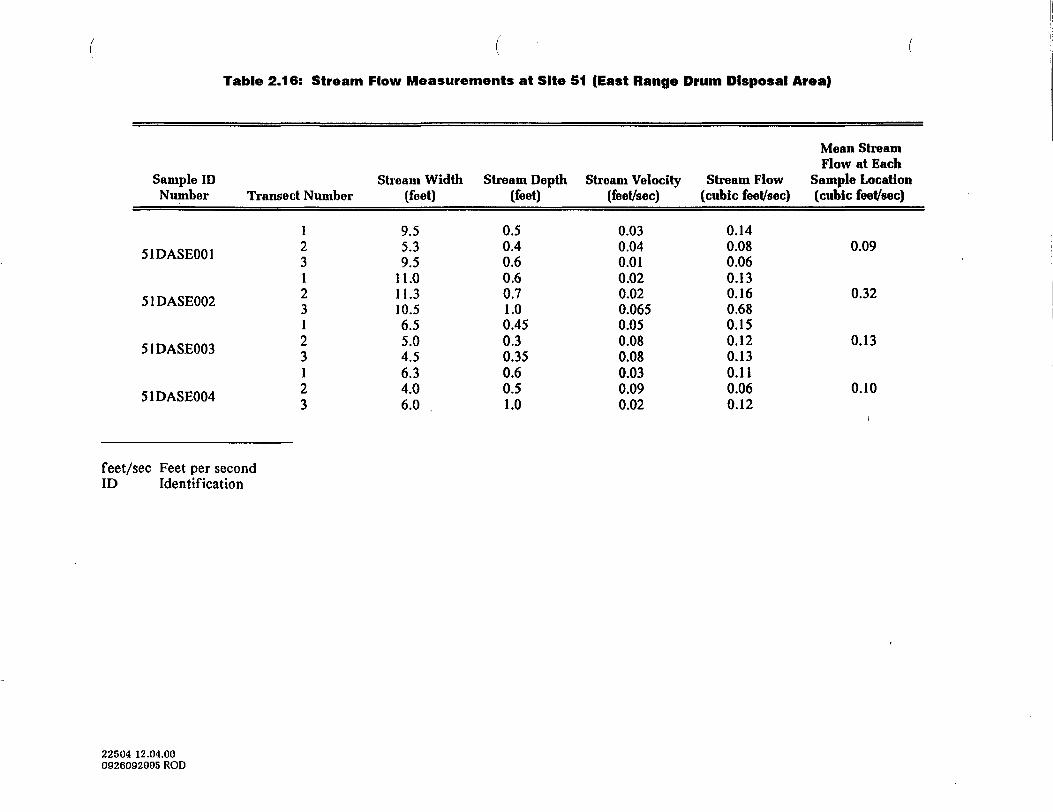
Table 2.16: Stream Flow Measurements at Site 51 (East Range Drum Disposal Area)
Sample IDNumber
51DASE001
51DASE002
51DASE003
51DASE004
Transect Number
123123123123
Stream Width(feet)
9.55.39.5
11.011.310.56.55.04.56.34.06.0
Stream Depth(feet)
0.50.40.60.60.71.00.450.30.350.60.51.0
Stream Velocity Stream Flow(feet/sec)
0.030.040.010.020.020.0650.050.080.080.030.090.02
(cubic feel/sec)
0.140.080.060.130.160.680.150.120.130.110.060.12
Mean StreamFlow at Each
Sample Location(cubic feet/sec)
0.09
0.32
0.13
0.10
feet/sec Feet per secondID Identification
22504 12.04.000926092995 ROD
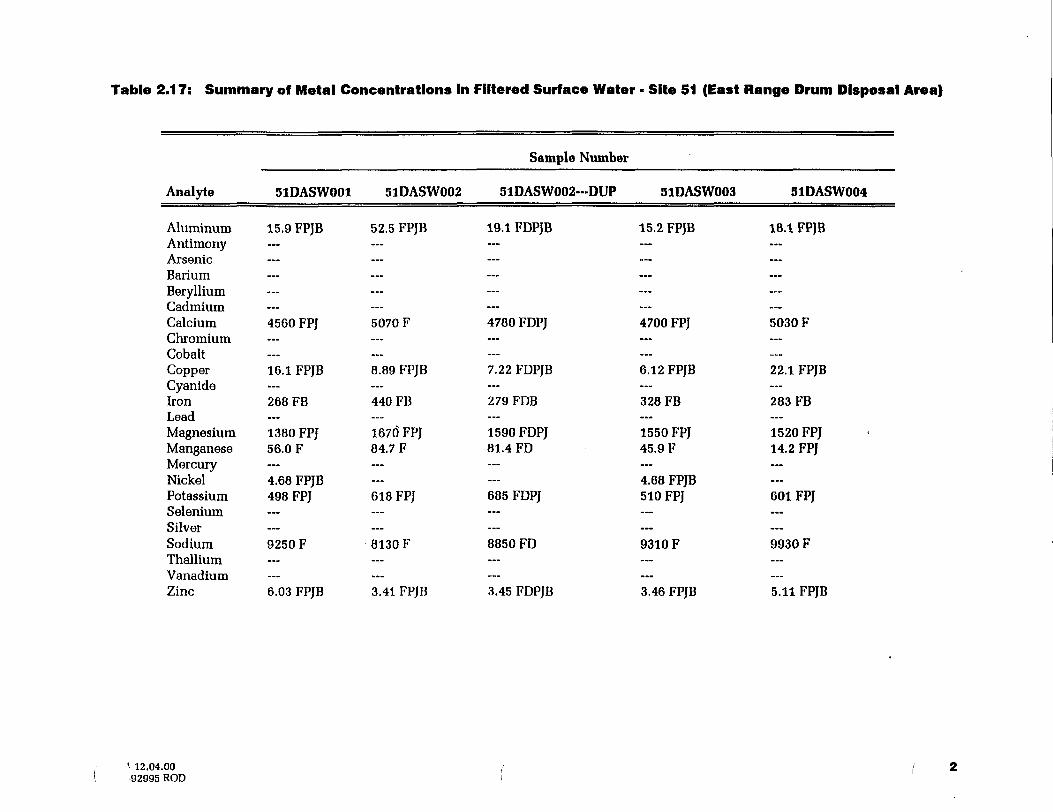
Table 2.17: Summary of Metal Concentrations In Filtered Surface Water - Site 51 (East Range Drum Disposal Area)
Sample Number
Analyte
AluminumAntimonyArsenicBariumBerylliumCadmiumCalciumChromiumCobaltCopperCyanideIronLeadMagnesiumManganeseMercuryNickelPotassiumSeleniumSilverSodiumThalliumVanadiumZinc
51DASW001
15.9 FPJB
——
4560 FPJ
...16.1 FPJB
268 FB
—1380 FPJ56.0 F
4.68 FPJB498 FPJ
—9250 F
—— .6.03 FPJB
51DASW002
52.5 FPJB
—...
5070 F
...8.89 FPJB
440 FB
—167(J FPJ84.7 F
618 FPJ
...8130 F
—...3.41 FPJB
51DASW002-DUP
19.1 FDPJB
——
4780 FDPJ
—7.22 FDPJB
279 FDB
—1590 FDPJ81.4 FD
685 FDPJ
—8850 FD
——3.45 FDPJB
51DASW003
15.2 FPJB
——
4700 FPJ
—6.12 FPJB
328 FB
—1550 FPJ45.9 F
4.68 FPJB510 FPJ
—9310 F
——3.46 FPJB
51DASW004
18.1 FPJB
——
5030 F
—22.1 FPJB
283 FB
—1520 FPJ14.2 FPJ
601 FPJ
...9930 F
——5.11 FPJB
* 12.04.0092995 ROD
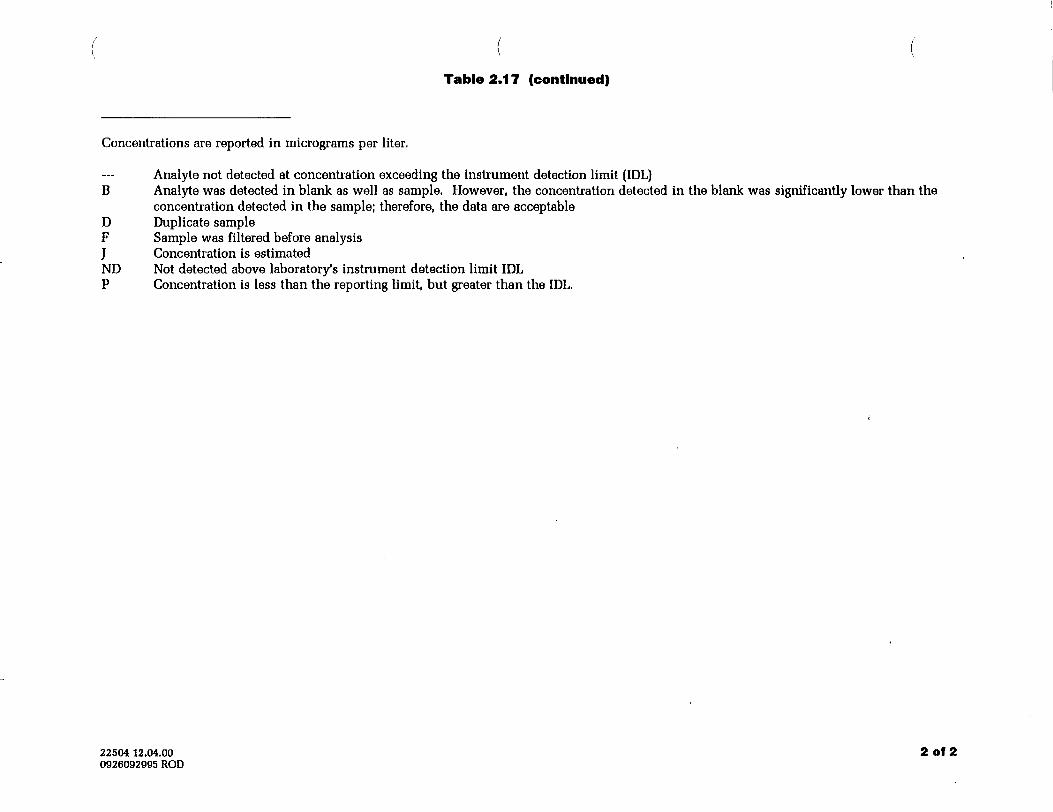
Table 2.17 (continued)
Concentrations are reported in micrograms per liter.
Analyte not detected at concentration exceeding the instrument detection limit (IDL)B Analyte was detected in blank as well as sample. However, the concentration detected in the blank was significantly lower than the
concentration detected in the sample; therefore, the data are acceptableD Duplicate sampleF Sample was filtered before analysisJ Concentration is estimatedND Not detected above laboratory's instrument detection limit IDLP Concentration is less than the reporting limit, but greater than the IDL.
22504 12.04.00 2 Of 20926092995 ROD
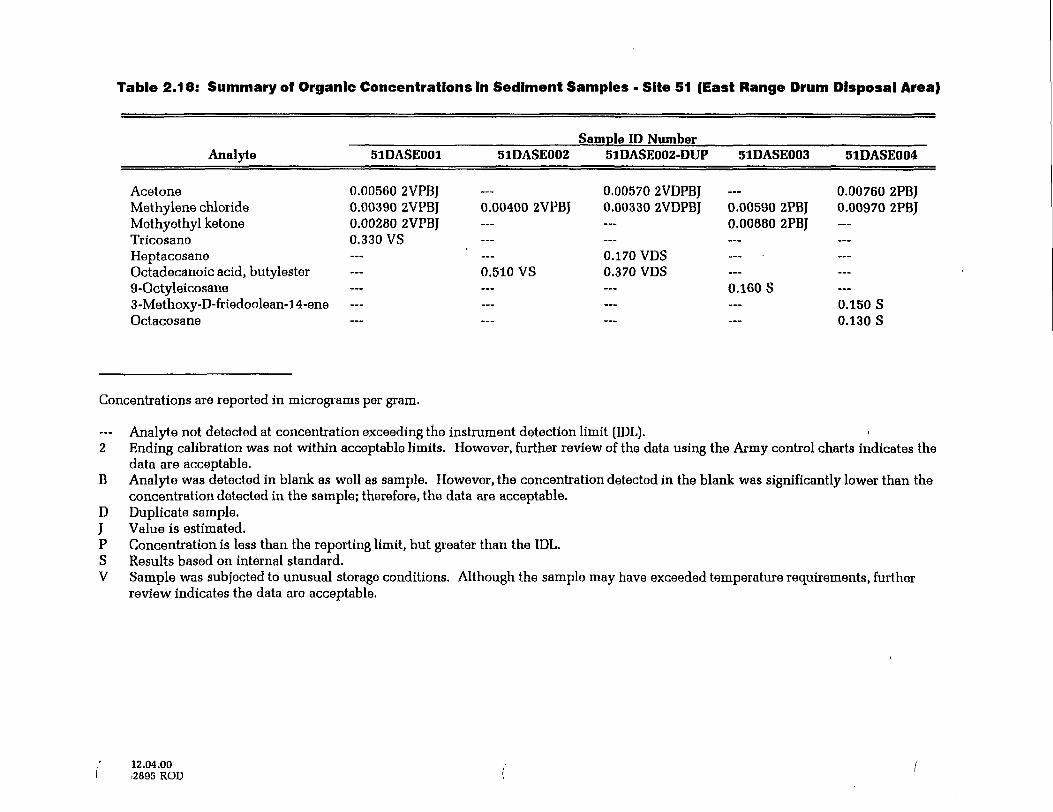
Table 2.18: Summary of Organic Concentrations In Sediment Samples - Site 51 (East Range Drum Disposal Area)
Analyte
AcetoneMethylene chlorideMethyethyl ketoneTricosane
51DASE001
0.00560 2VPBJ0.00390 2VPBJ0.00280 2VPBJ0.330 VS
Sample ID Number51DASE002 51DASE002-DUP
0.00570 2VDPBJ0.00400 2VPBJ 0.00330 2VDPBJ
51DASE003
0.00590 2PBJ0.00880 2PBJ
51DASE004
0.00760 2PBJ0.00970 2PBJ
HeptacosaneOctadecanoic acid, butylester9-Octyleicosane3-Methoxy-D-friedoolean-14-eneOctacosane
0.510 VS0.170 YDS0.370 VDS
0.160 S0.150 S0.130 S
Concentrations are reported in micrograms per gram.
Analyte not detected at concentration exceeding the instrument detection limit (IDL).2 Ending calibration was not within acceptable limits. However, further review of the data using the Army control charts indicates the
data are acceptable.B Analyte was detected in blank as well as sample. However, the concentration detected in the blank was significantly lower than the
concentration detected in the sample; therefore, the data are acceptable.D Duplicate sample.J Value is estimated.P Concentration is less than the reporting limit, but greater than the IDL.S Results based on internal standard.V Sample was subjected to unusual storage conditions. Although the sample may have exceeded temperature requirements, further
review indicates the data are acceptable.
12.04.00.2895 ROD
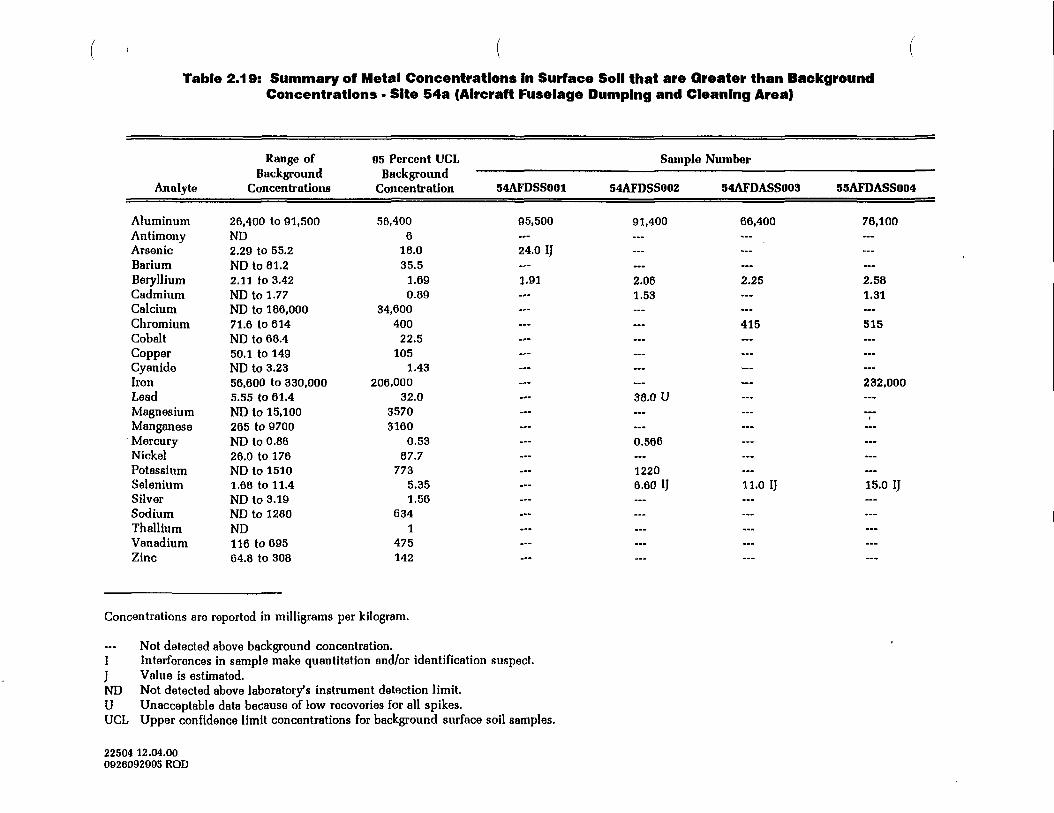
Table 2.19: Summary of Metal Concentrations In Surface Soil that are Greater than BackgroundConcentrations • Site 54a (Aircraft Fuselage Dumping and Cleaning Area)
Analyte
AluminumAntimonyArsenicBariumBerylliumCadmiumCalciumChromiumCobaltCopperCyanideIronLeadMagnesiumManganeseMercuryNickelPotassiumSeleniumSilverSodiumThalliumVanadiumZinc
Range ofBackground
Concentrations
26,400 to 91,500ND2.29 to 55.2ND to 81.22.11 to 3.42ND to 1.77ND to 186,00071.6 to 614ND to 68.450.1 to 149ND to 3.2356,600 to 330,0005.55 to 61.4ND to 15,100265 to 9700ND to 0.8626.0 to 176ND to 15101.68 to 11.4ND to 3.19ND to 1280ND116 to 69564.8 to 308
05 Percent UCLBackground
Concentration
56,4006
18.035.5
1.690.89
34,600400
22.5105
1.43206,000
32.035703160
0.5387.7
7735.351.56
6341
475142
Sample Number
54AFDSS001 54AFDSS002 54AFDASS003
95,500 91,400 66,400
24.0 IJ
—1.91 2.06 2.251.53
— 415
—.,-
38.0 U
0.566
12206.60 IJ 11.0 IJ
—...
—...
55AFDASS004
76,100
::.—2.581.31
—515
—
232,000
—
...
—15.0 IJ
...
———
Concentrations are reported in milligrams per kilogram.
Not detected above background concentration.I Interferences in sample make quantitation and/or identification suspect.J Value is estimated.ND Not detected above laboratory's instrument detection limit.U Unacceptable data because of low recoveries for all spikes.UCL Upper confidence limit concentrations for background surface soil samples.
22504 12.04.000926092995 ROD
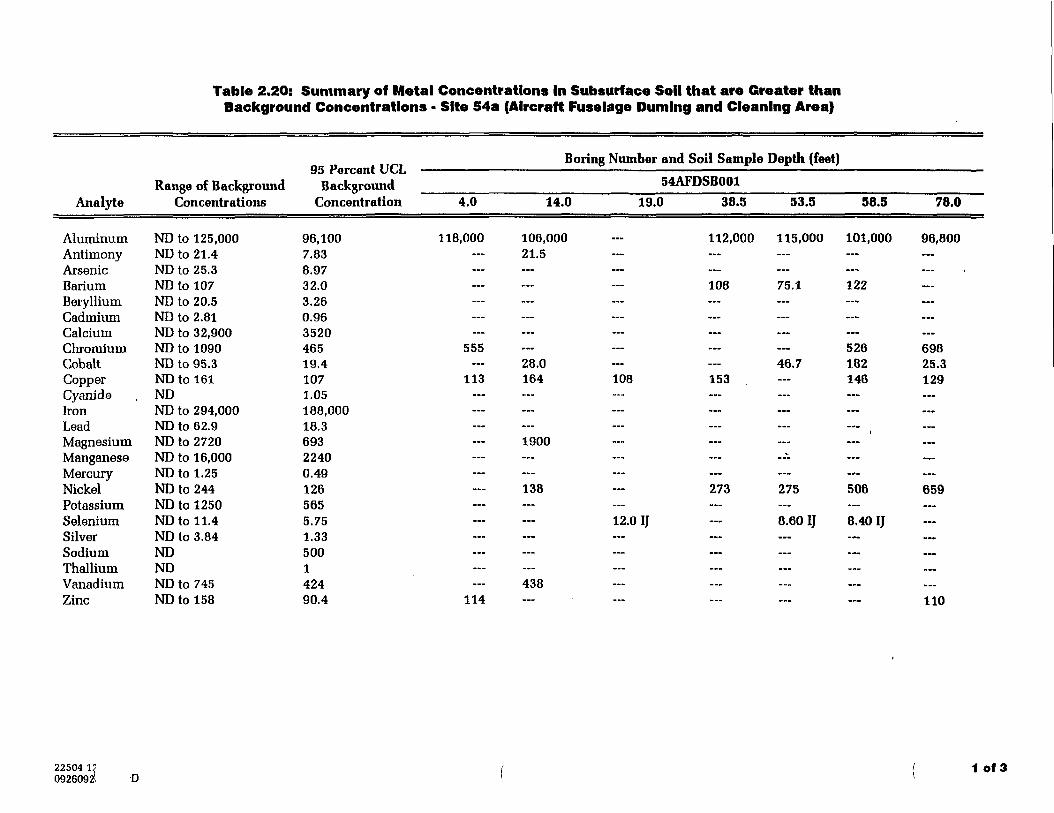
Table 2.20: Summary of Metal Concentrations In Subsurface Soil that are Greater thanBackground Concentrations • Site 54a (Aircraft Fuselage Dunning and Cleaning Area)
Analyte
AluminumAntimonyArsenicBariumBerylliumCadmiumCalciumChromiumCobaltCopperCyanideIronLeadMagnesiumManganeseMercuryNickelPotassiumSeleniumSilverSodiumThalliumVanadiumZinc
95 Percent UCLRange of Background Background
Concentrations Concentration
ND to 125,000ND to 21.4ND to 25.3ND to 107ND to 20.5ND to 2.81ND to 32,900ND to 1090ND to 95.3ND to 161NDND to 294,000ND to 62.9ND to 2720ND to 16,000ND to 1.25ND to 244ND to 1250ND to 11.4ND to 3.84NDNDND to 745ND to 158
96,1007.838.9732.03.260.96352046519.41071.05188,00018.369322400.491265655.751.33500142490.4
Boring Number and Soil Sample Depth (feet)
54AFDSB0014.0 14.0 19.0 38.3 53.5 58.5 78.0
118,000 106,000 --- 112,000 115,000 101,000 96,80021.5
— 108 75.1 122— ... ... ... — ... ...
—555 ™ — — — 526 698
28.0 — — 46.7 182 25.3113 164 108 153 — 148 129
1900
138 --- 273 275 506 659
— 12.0 IJ — 8.60 IJ 8.40 IJ
——
438114 — - — — — HO
22504 1?09260921
1 of 3
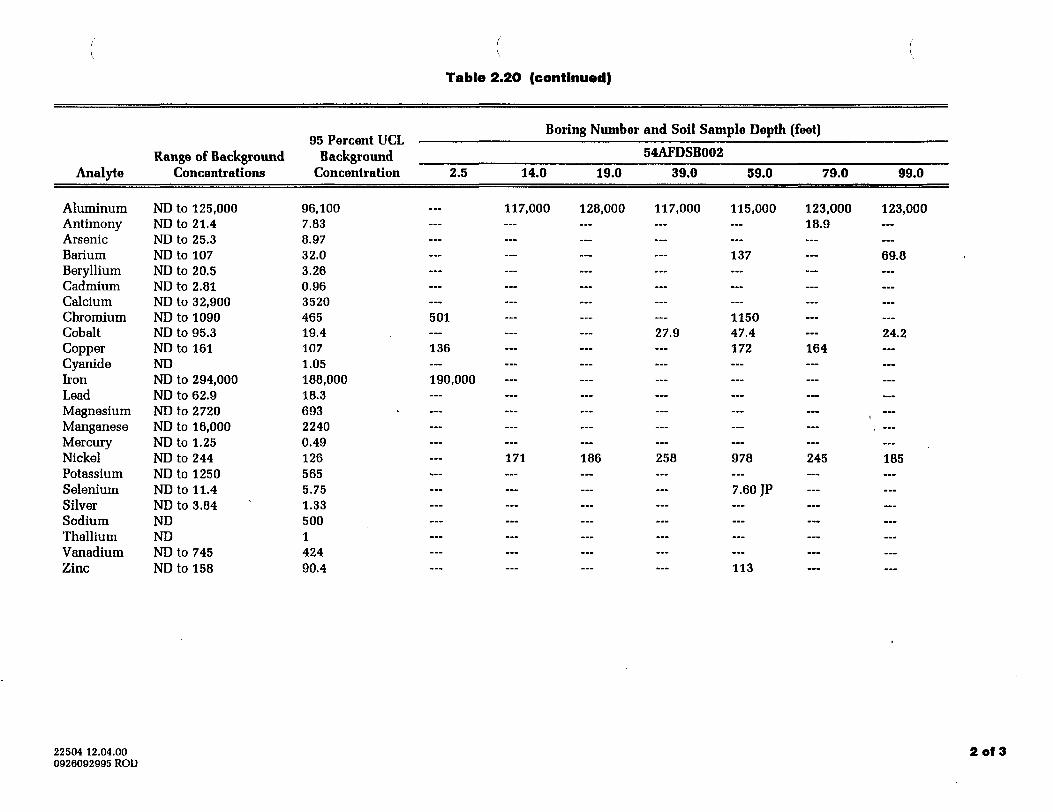
Table 2.2O (continued)
Analyte
AluminumAntimonyArsenicBariumBerylliumCadmiumCalciumChromiumCobaltCopperCyanideIronLeadMagnesiumManganeseMercuryNickelPotassiumSeleniumSilverSodiumThalliumVanadiumZinc
Range of BackgroundConcentrations
ND to 125,000ND to 21.4ND to 25.3ND to 107ND to 20.5ND to 2.81ND to 32,900ND to 1090ND to 95.3ND to 161NDND to 294,000ND to 62.9ND to 2720ND to 16,000ND to 1.25ND to 244ND to 1250ND to 11.4ND to 3.84NDNDND to 745ND to 158
35 Porcont UCLBackground
Concentration 2.5
96,1007.838.9732.03.260.963520465 50119.4107 1361.05188,000 190,00018.369322400.491265655.751.33500
1 —
42490.4
Boring Number and Soil Sample Depth (feet)
54AFDSB002
14.0 19.0 39.0 59.0 79.0 99.0
117,000 128,000 117,000 115,000 123,000 123,00018.9
— 137 — 69.8
——...
115027.9 47.4 --- 24.2
172 164
———
—......171 186 258 978 245 185
— 7.60 JP
——
—— 113
22504 12.04.000926092995 ROD
2 of 3
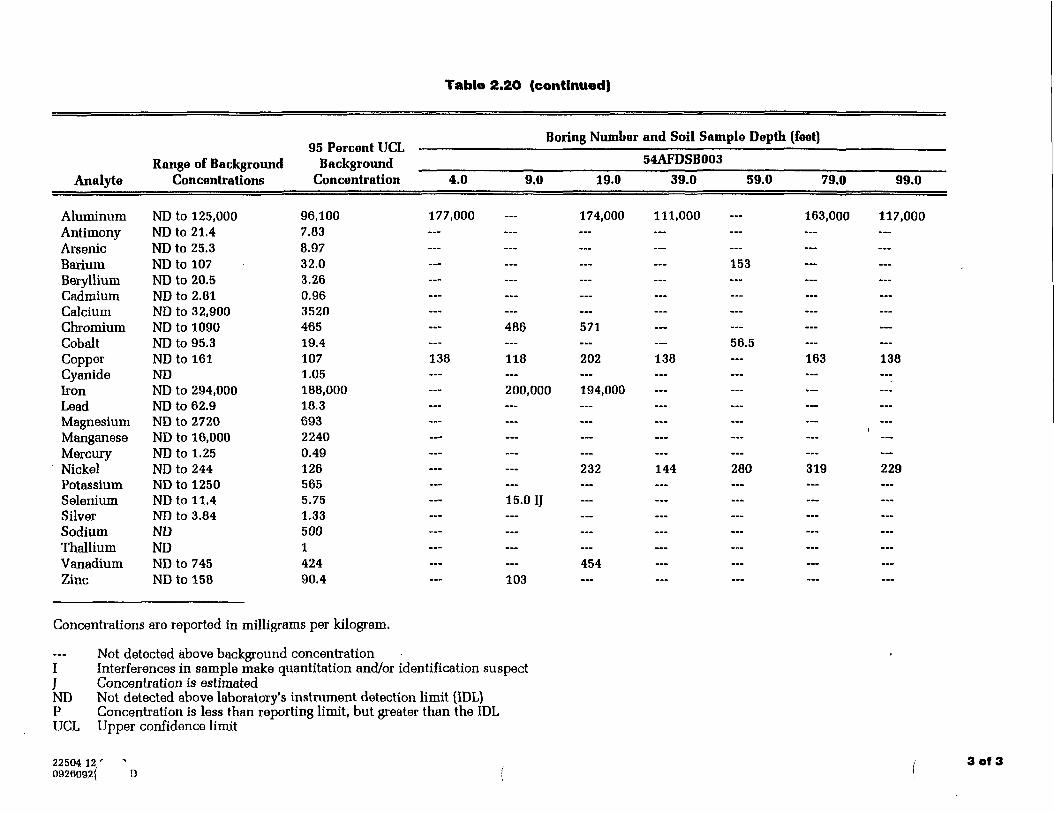
Table 2.20 (continued)
Analyte
AluminumAntimonyArsenicBariumBerylliumCadmiumCalciumChromiumCobaltCopperCyanideIronLeadMagnesiumManganeseMercuryNickelPotassiumSeleniumSilverSodiumThalliumVanadiumZinc
Range of BackgroundConcentrations
ND to 125,000ND to 21.4ND to 25.3ND to 107ND to 20.5ND to 2.81ND to 32,900ND to 1090ND to 95.3ND to 161NDND to 294,000ND to 62.9ND to 2720ND to 16,000ND to 1.25ND to 244ND to 1250ND to 11.4ND to 3.84NDNDND to 745ND to 158
Boring Number and Soil Sample Depth (feet)95 Porcont UCL
[ BackRround 54AFDSB003Concentration 4.0 9.0 19.0 39.0 59.0 79.0 99.0
96,100 177,000 — 174,000 111,000 — 163,000 117,0007.838
Q7 .„ ___ __„ _„tZJ f " ""• "
32.0 — — — — 1533.260.963520465 — 486 57119.4 — — — — 56.5107 138 118 202 138 — 163 1381.05188,000 — 200,000 194,00018.36932240 — — — — — --- ' —0.49126 — — 232 144 280 319 2295655.75 ... 15.0 IJ1 <R1 ... ... - .^.^j^j ... ... ... ... — ... ... ...
5001424 — «- 45490.4 — 103
Concentrations are reported in milligrams per kilogram.
Not detected above background concentrationI Interferences in sample make quantitation and/or identification suspect} Concentration is estimatedND Not detected above laboratory's instrument detection limit (IDL)P Concentration is less than reporting limit, but greater than the IDLUCL Upper confidence limit
22504 12 '0926092<
3 of 3
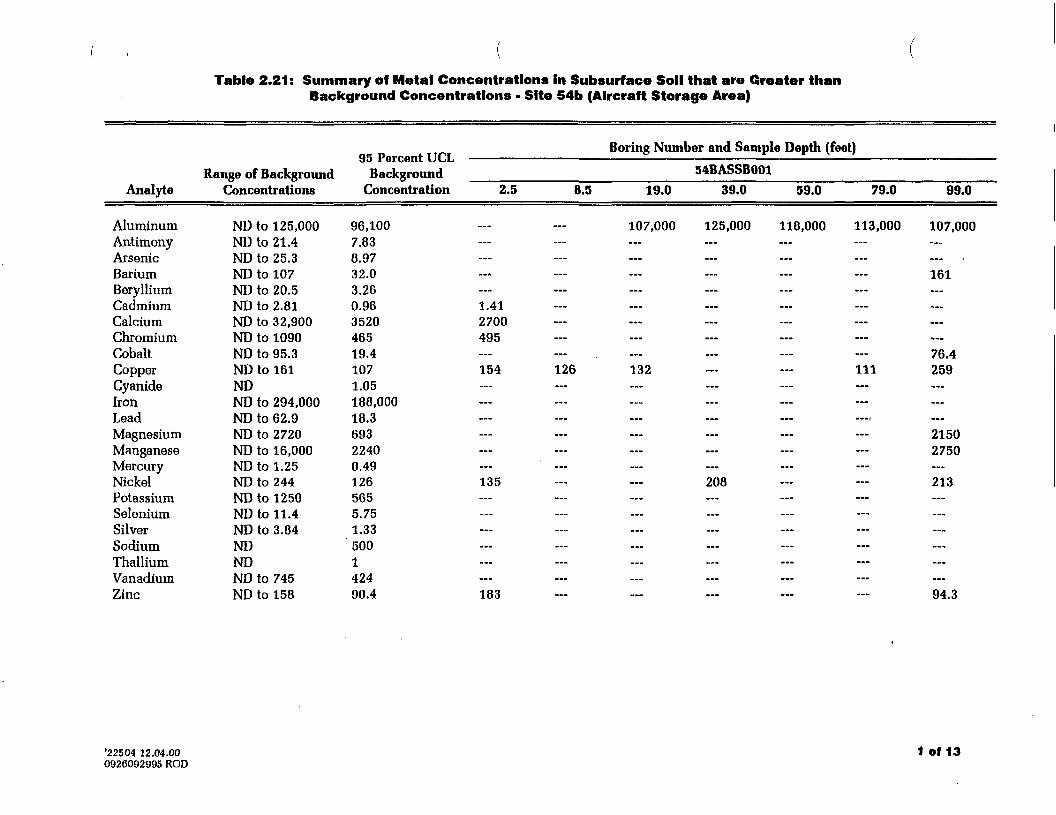
Table 2.21: Summary of Metal Concentrations In Subsurface Soil that are Greater thanBackground Concentrations - Site 54b (Aircraft Storage Area)
Analyte
AluminumAntimonyArsenicBariumBerylliumCadmiumCalciumChromiumCobaltCopperCyanideIronLeadMagnesiumManganeseMercuryNickelPotassiumSeleniumSilverSodiumThalliumVanadiumZinc
Range of BackgroundConcentrations
ND to 125,000ND to 21.4ND to 25.3ND to 107ND to 20.5ND to 2.81ND to 32,900ND to 1090ND to 95.3ND to 161NDND to 294,000ND to 62.9ND to 2720ND to 16,000ND to 1.25ND to 244ND to 1250ND to 11.4ND to 3.84NDNDND to 745ND to 158
*1*S Pnrr-nnt T TPI
BackgroundConcentration 2.5
96,1007.838.9732.03.260.96 1.413520 2700465 49519.4107 1541.05188,00018.369322400.49126 1355655.751.33500142490.4 183
Boring Number and Sample Depth (feet)
54BASSB0018.5 19.0 39.0 59.0 79.0 99.0
107,000 125,000 118,000 113,000 107,000...
—161
...
———
76.4126 132 — — 111 259
——
!
21502750
...208 — — 213
——— ... ... — —
——— 94.3
'22504 12.04.000926092995 ROD
1 of 13
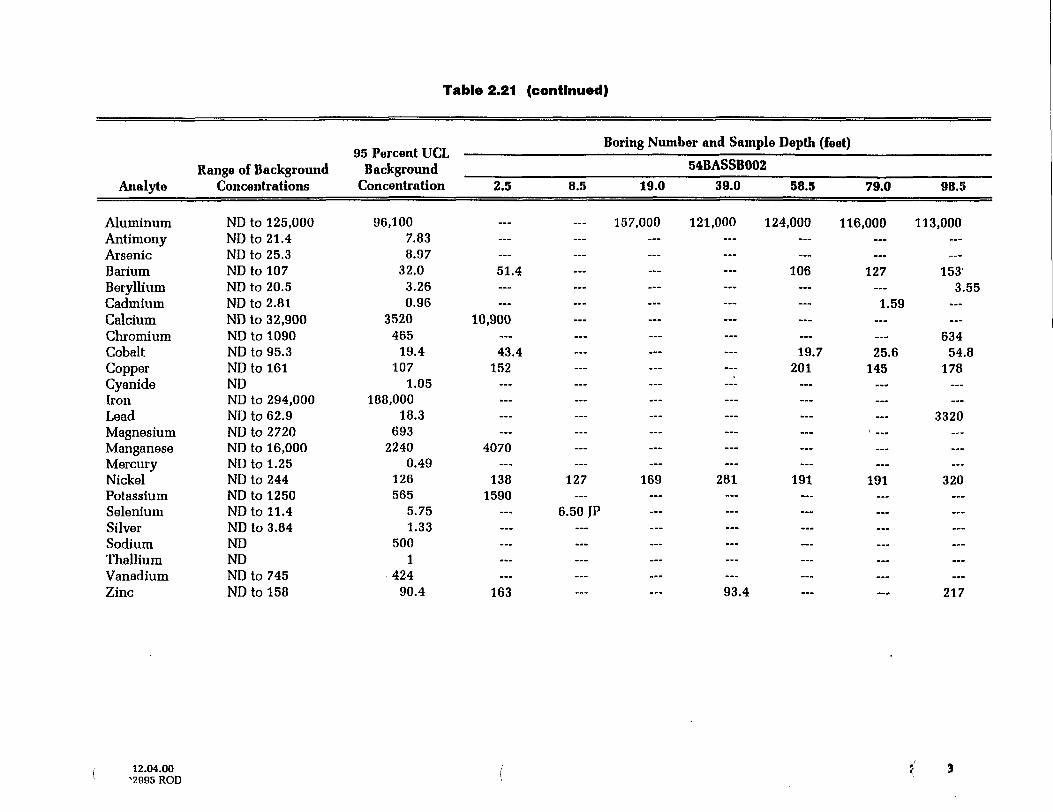
Table 2.21 (continued)
Analyte
AluminumAntimonyArsenicBariumBerylliumCadmiumCalciumChromiumCobaltCopperCyanideIronLeadMagnesiumManganeseMercuryNickelPotassiumSeleniumSilverSodiumThalliumVanadiumZinc
Range of BackgroundConcentrations
ND to 125,000ND to 21.4ND to 25.3ND to 107ND to 20.5ND to 2.81ND to 32,900ND to 1090ND to 95.3ND to 161NDND to 294,000ND to 62.9ND to 2720ND to 16,000ND to 1.25ND to 244ND to 1250ND to 11.4ND to 3.84NDNDND to 745ND to 158
95 Percent UCLBackground
Concentration
96,1007.838.97
32.03.260.96
3520465
19.4107
1.05188,000
18.3693
22400.49
126565
5.751.33
5001
42490.4
2.5
Boring Number and Sample
54BASSB0028.5 19.0 39.0
Depth
58.5
157,000 121,000 124,000
——51.4...
—10,900
—43.4152
—...
—...4070
—1381590
——
...
—163
...
—......
———...—
—...
—...
——
127 169 281
—6.50 JP
—...
——
93.4
...
—106...
———19.
201......
—......
—191
——...
—— .
——
(feet)
79.0
116,000
——127
—1.59
——7 25.6
145
———
—...
191
——...............
98.5
113,000...
—153
3.55...
—63454.8
178
——3320......
—320...
———...
—217
12.04.00^2995 ROD
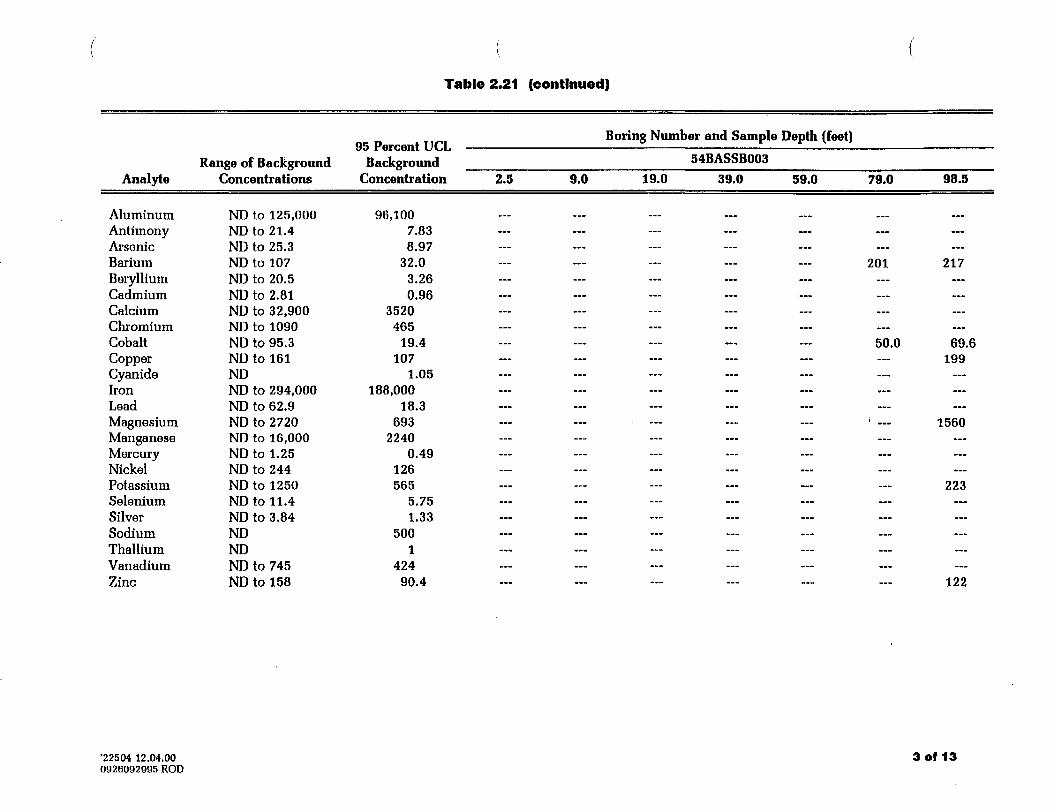
Table 2.21 (continued)
Analyte
AluminumAntimonyArsenicBariumBerylliumCadmiumCalciumChromiumCobaltCopperCyanideIronLeadMagnesiumManganeseMercuryNickelPotassiumSeleniumSilverSodiumThalliumVanadiumZinc
Range of BackgroundConcentrations
ND to 125,000ND to 21.4ND to 25.3ND to 107ND to 20.5ND to 2.81ND to 32,900ND to 1090ND to 95.3ND to 161NDND to 294,000ND to 62.9ND to 2720ND to 16,000ND to 1.25ND to 244ND to 1250ND to 11.4ND to 3.84NDNDND to 745ND to 158
I1? Pnrrnnt TTI
BackgroundConcentration 2.5
96,1007.838.97
32.03.260.96
3520465
19.4107
1.05188,000
18.3693
22400.49
126565
5.751.33
5001
42490.4
Boring Number and Sample Depth (feet)
54BASSB0039.0 19.0 39.0 59.0 79.0 98.5
...
201 217
—
...
50.0 69.6199
1560
223
—.........
—122
'22504 12.04.000926092995 ROD
3 of 13
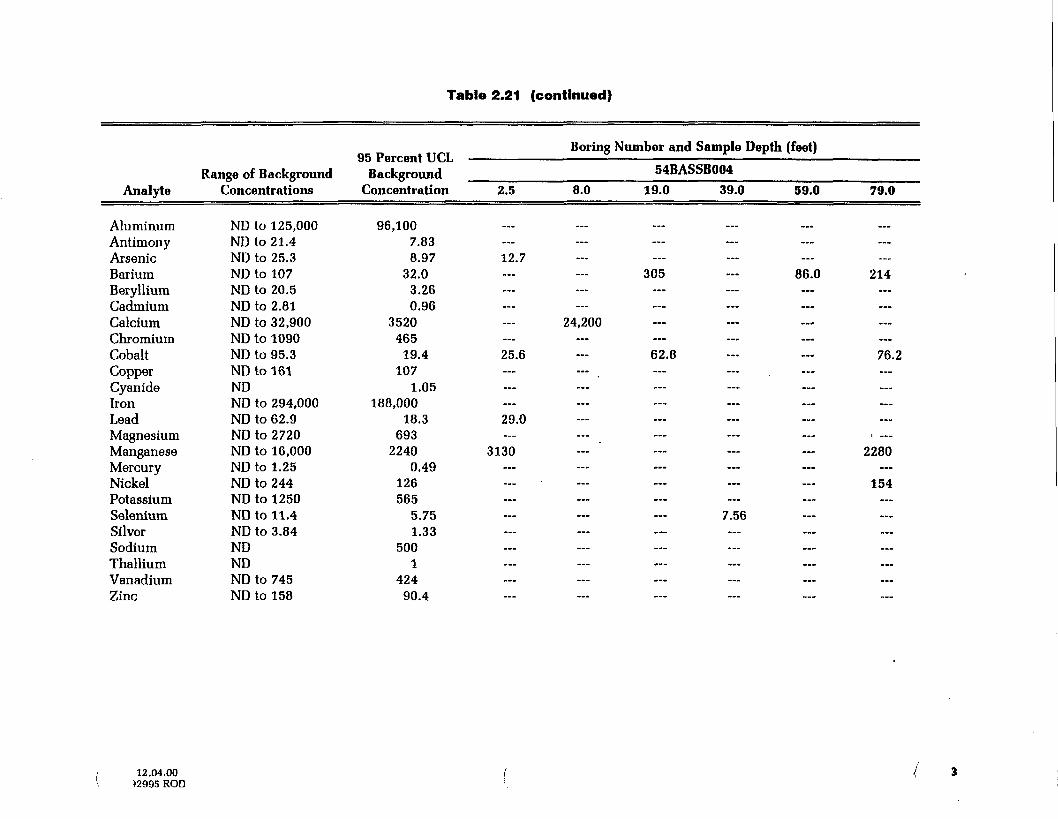
Table 2.21 (continued)
Analyte
AluminumAntimonyArsenicBariumBerylliumCadmiumCalciumChromiumCobaltCopperCyanideIronLeadMagnesiumManganeseMercuryNickelPotassiumSeleniumSilverSodiumThalliumVanadiumZinc
Range of BackgroundConcentrations
ND to 125,000ND to 21.4ND to 25.3ND to 107ND to 20.5ND to 2.81ND to 32,900ND to 1090ND to 95.3ND to 161NDND to 294,000ND to 62.9ND to 2720ND to 16,000ND to 1.25ND to 244ND to 1250ND to 11.4ND to 3.84NDNDND to 745ND to 158
11 Pnrrnnt TIfl
BackgroundConcentration 2.5
96,1007.838.97 12.7
32.03.260.96
3520465
19.4 25.6107
1.05188,000
18.3 29.0693
2240 31300.49
126565
5.751.33
5001
42490.4
Boring Number and Sample Depth (feet)
54BASSB0048.0 19.0 39.0 59.0 79.0
... — »— -_„
305 --- 86.0 214— --- — — —
24,200
—62.8 — — 76.2
...
—
2280
154
...7.56
...
...
———
12.04.0052995 ROD
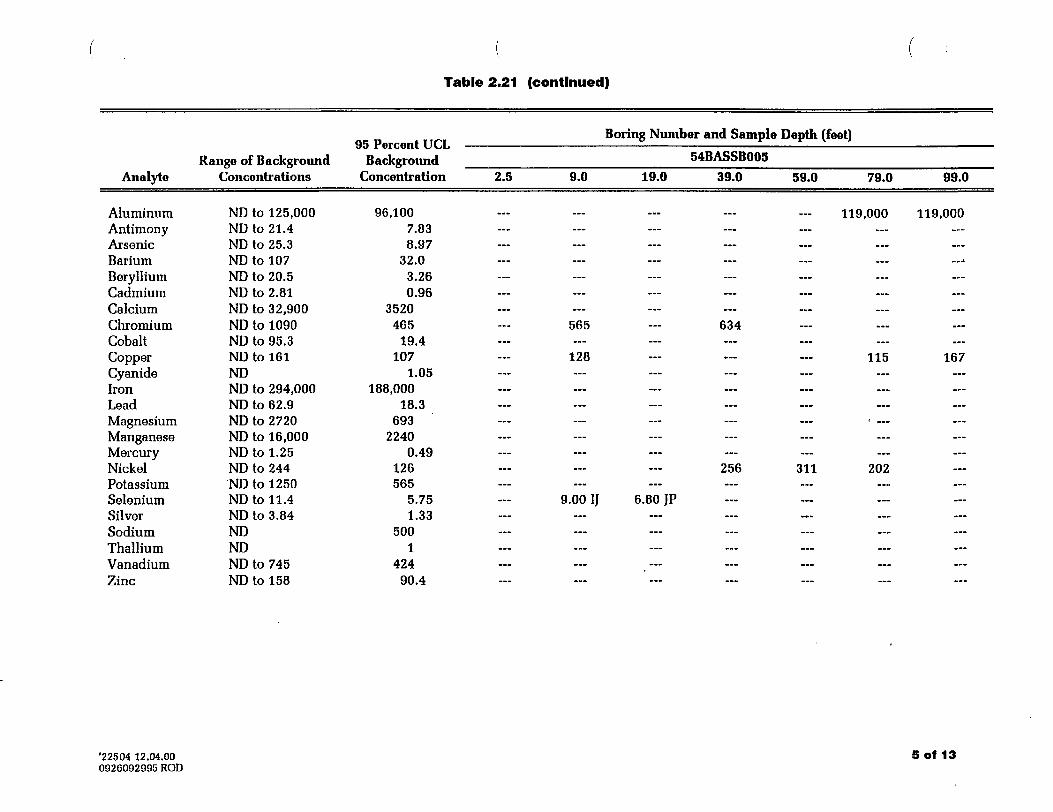
Table 2.21 (continued)
Analyte
AluminumAntimonyArsenicBariumBerylliumCadmiumCalciumChromiumCobaltCopperCyanideIronLeadMagnesiumManganeseMercuryNickelPotassiumSeleniumSilverSodiumThalliumVanadiumZinc
Range of BackgroundConcentrations
ND to 125,000ND to 21.4ND to 25.3ND to 107ND to 20.5ND to 2.81ND to 32,900ND to 1090ND to 95.3ND to 161NDND to 294,000ND to 62.9ND to 2720ND to 16,000ND to 1.25ND to 244ND to 1250ND to 11.4ND to 3.84NDNDND to 745ND to 158
95 Porront UCTBackground
Concentration 2.5
96,1007.838.97
32.03.260.96
3520465
19.4107
1.05188,000
18.3693
22400.49
126565
5.751.33
5001
42490.4
Boring Number and Sample Depth (feet)
54BASSB0059.0 19.0 39.0 59.0 79.0 99.0
119,000 119,000
::: ::: ::: ::: ::: :::_.j— — — ... — ——
565 — 634
—128 — — — 115 167
—
256 311 202
—9.00 IJ 6.80 JP
—......
—
'22504 12.04.000926092995 ROD
Sofia
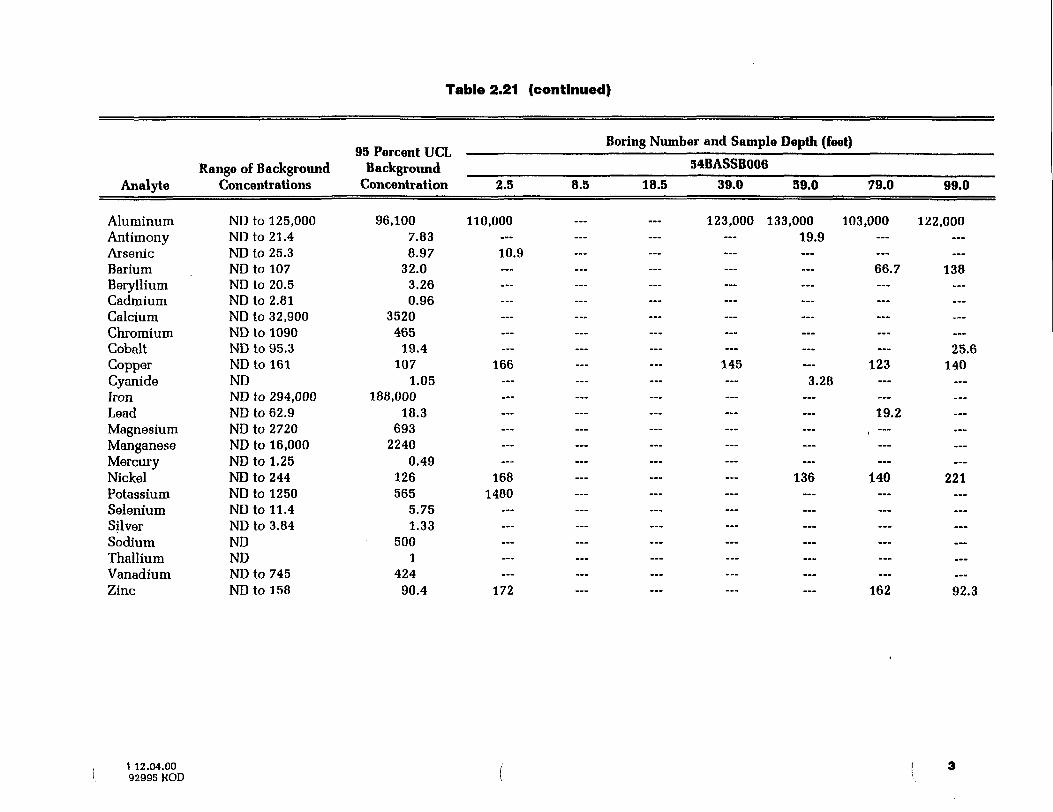
Table 2.21 (continued)
Analyte
AluminumAntimonyArsenicBariumBerylliumCadmiumCalciumChromiumCobaltCopperCyanideIronLeadMagnesiumManganeseMercuryNickelPotassiumSeleniumSilverSodiumThalliumVanadiumZinc
Range of BackgroundConcentrations
ND to 125,000NDto 21.4ND to 25.3ND to 107ND to 20.5ND to 2.81ND to 32,900ND to 1090ND to 95.3ND to 161NDND to 294,000ND to 62.9ND to 2720ND to 16,000ND to 1.25ND to 244ND to 1250ND to 11.4ND to 3.84NDNDND to 745ND to 158
95 Percent UCLBackground
Concentration
96,1007.838.97
32.03.260.96
3520465
19.4107
1.05188,000
18.3693
22400.49
126565
5.751.33
5001
42490.4
Boring Number and Sample Depth (feet)
2.5 8.5
110,000
10.9
—... —
———
166
—
1681480
...
...
———172
54BASSB006
18.5 39.0 59.0 79.0
123,000 133,000 103,00019.9
66.7
::: ::: ::: :::......—145 — 123
3.28
19.2
136 140...
—.-....
—— 162
99.0
122,000
138
—
——25.6
140
—
221
—.--...
—......92.3
\ 12.04.0092995 ROD
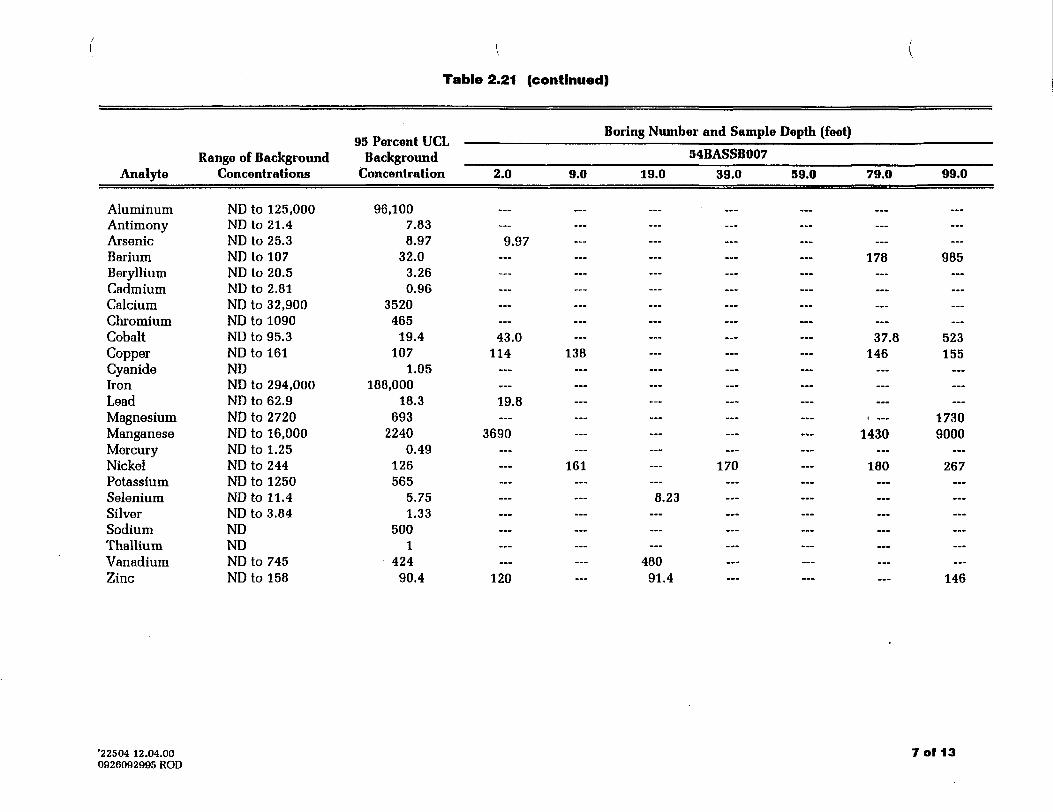
Table 2.21 (continued)
Analyte
AluminumAntimonyArsenicBariumBerylliumCadmiumCalciumChromiumCobaltCopperCyanideIronLeadMagnesiumManganeseMercuryNickelPotassiumSeleniumSilverSodiumThalliumVanadiumZinc
Range of BackgroundConcentrations
ND to 125,000ND to 21.4ND to 25.3ND to 107ND to 20.5ND to 2.81ND to 32,900ND to 1090ND to 95.3ND to 161NDND to 294,000ND to 62.9ND to 2720ND to 16,000ND to 1.25ND to 244ND to 1250ND to 11.4ND to 3.84NDNDND to 745ND to 158
Boring Number and Sample Depth (feet)95 Porcont UCL
Backaround 54BASSB007Concentration 2.0 9.0 19.0 39.0 99.0 79.0
96,1007.838.97 9.97
32.0 — — — — — 1783.260.96
3520465
19.4 43.0 — — — -- 37.8107 114 138 — — --- 146
1.05188,000
18.3 19.8693
2240 3690 — — — — 14300.49
126 --- 161 — 170 — 180565
5.75 — — 8.231.33
5001
424 — — 48090.4 120 — 91.4
99.0
...
—
985...
...
...523155
—17309000
267
—...
—...
—...146
'22504 12.04.000926092995 ROD
7 of 13
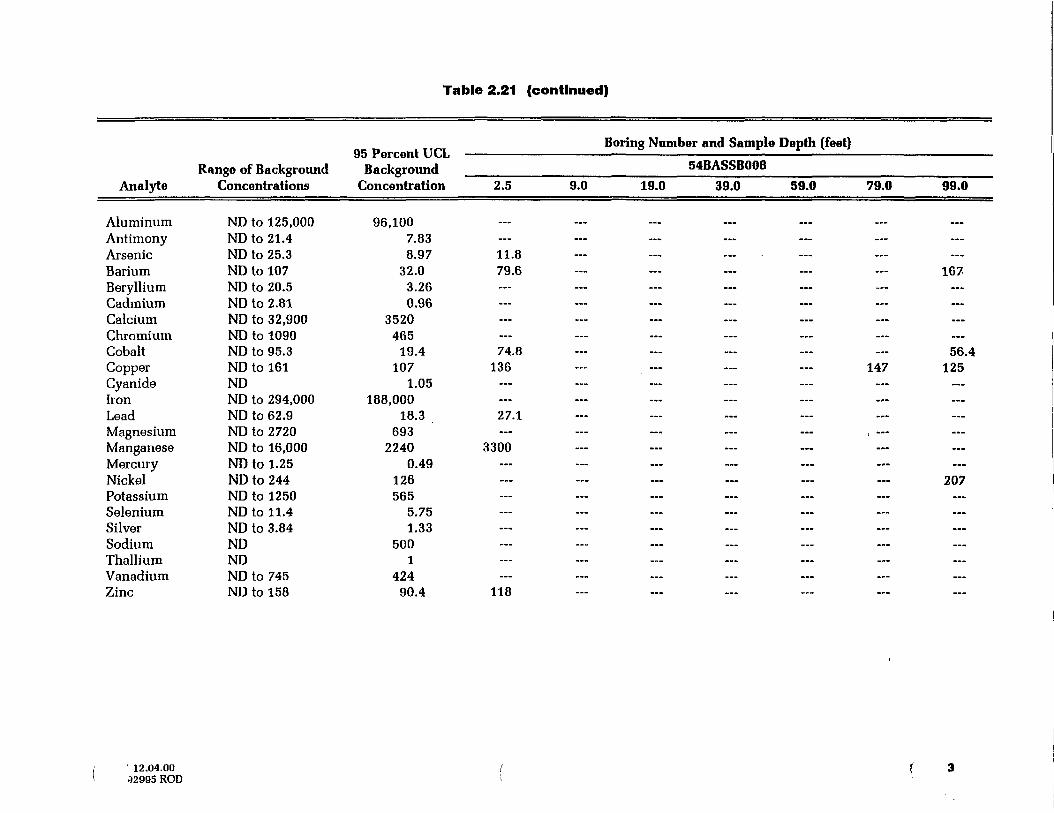
Table 2.21 (continued)
Analyte
AluminumAntimonyArsenicBariumBerylliumCadmiumCalciumChromiumCobaltCopperCyanideIronLeadMagnesiumManganeseMercuryNickelPotassiumSeleniumSilverSodiumThalliumVanadiumZinc
Range of BackgroundConcentrations
ND to 125,000ND to 21.4ND to 25.3ND to 107ND to 20.5ND to 2.81ND to 32,900ND to 1090ND to 95.3ND to 161NDND to 294,000ND to 62.9ND to 2720ND to 16,000ND to 1.25ND to 244ND to 1250ND to 11.4ND to 3.84NDNDND to 745ND to 158
95 Percent UCL •Background
Concentration
96,1007.838.97
32.03.260.96
3520465
19.4107
1.05188,000
18.3693
22400.49
126565
5.751.33
5001
42490.4
Boring Number and Sample Depth (feet)
54BASSB0082.5 9.0 19.0 39.0 39.0 79.0 99.0
— — — mmm •« mmm _•_ »« ___
...
11.879.6 — — — — — 167
———...74.8 — — --- — — 56.4
136 — — — — 147 125
——27.1
, ...3300
— 207
——...
——
—118
' 12.04.00^2995 ROD
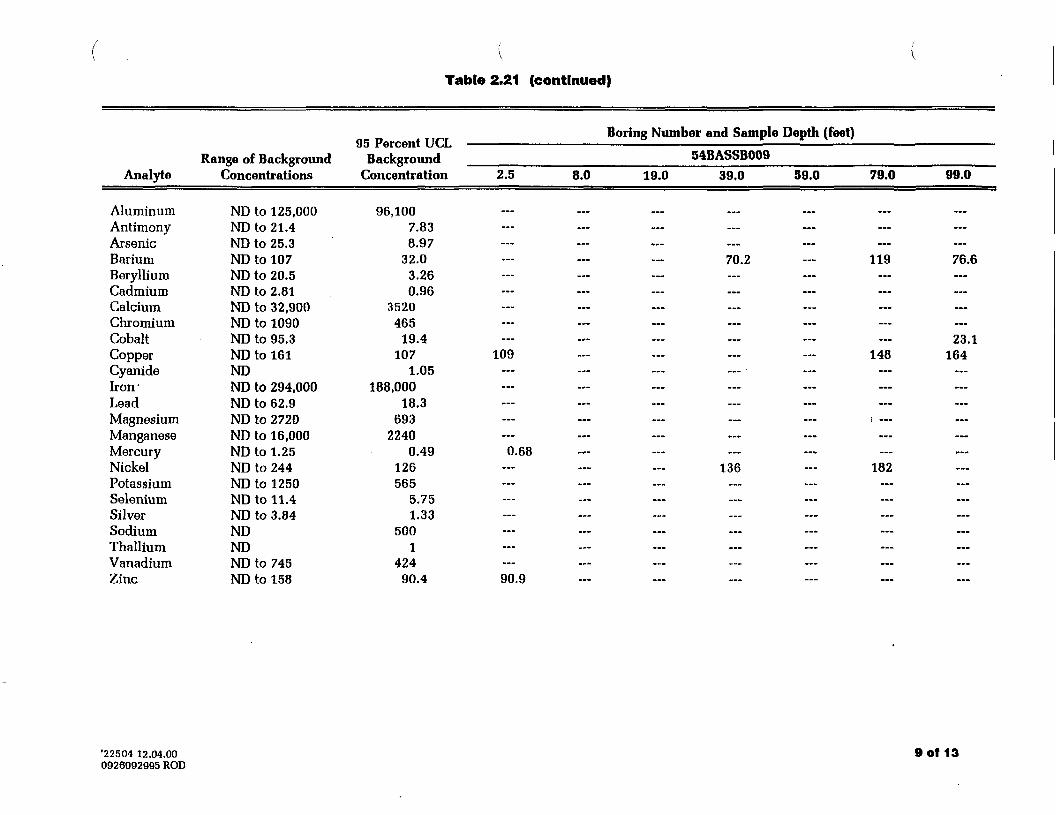
Table 2.21 (continued)
Analyte
AluminumAntimonyArsenicBariumBerylliumCadmiumCalciumChromiumCobaltCopperCyanideIron"LeadMagnesiumManganeseMercuryNickelPotassiumSeleniumSilverSodiumThalliumVanadiumZinc
Range of BackgroundConcentrations
ND to 125,000ND to 21.4ND to 25.3ND to 107ND to 20.5ND to 2.81ND to 32,900ND to 1090ND to 95.3ND to 161NDND to 294,000ND to 62.9ND to 2720ND to 16,000ND to 1.25ND to 244ND to 1250ND to 11.4ND to 3.84NDNDND to 745ND to 158
95 Percent UCL -Background
Concentration
96,1007.838.97
32.03.260.96
3520465
19.4107
1.05188,000
18.3693
22400.49
126565
5.751.33
5001
42490.4
Boring Number and Sample Depth (feet)
54BASSB0092.5 8.0 19.0 39.0 59.0 79.0 99.0
...
70.2 — 119 76.6
—
—
23.1109 — — — — 148 164
0.68136 — 182
————...
—90.9
•22504 12.04.000926092995 ROD
9 of 13
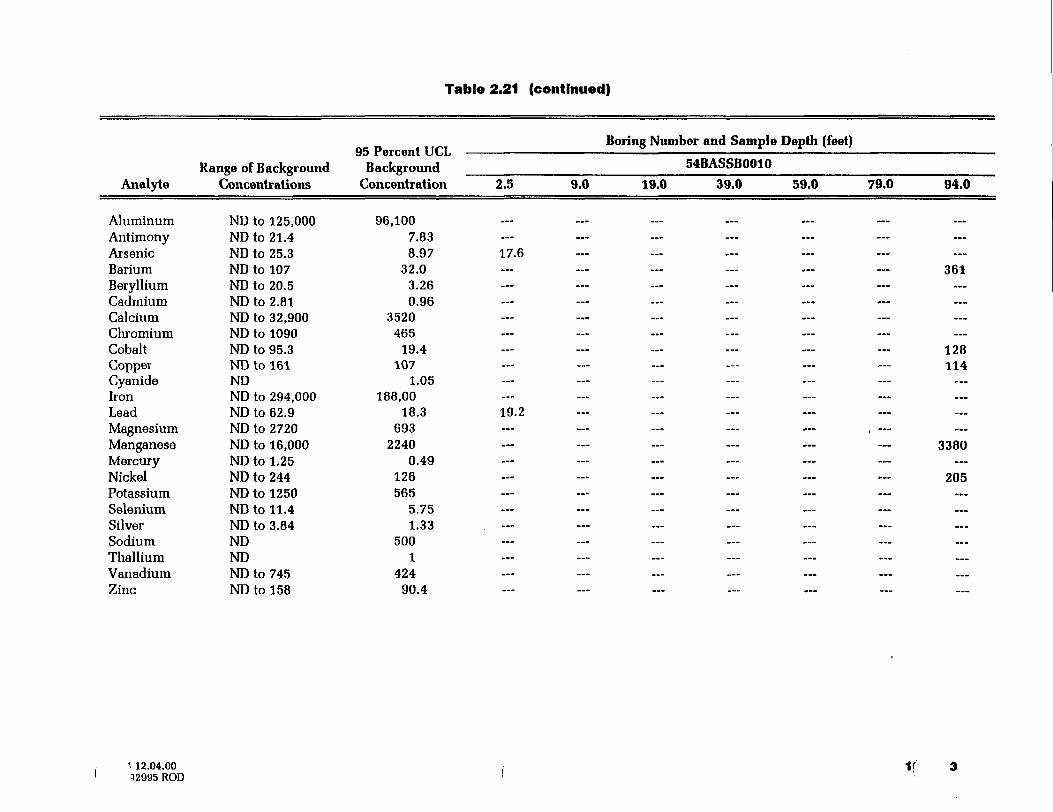
Table 2.21 (continued)
Analyte
AluminumAntimonyArsenicBariumBerylliumCadmiumCalciumChromiumCobaltCopperCyanideIronLeadMagnesiumManganeseMercuryNickelPotassiumSeleniumSilverSodiumThalliumVanadiumZinc
Range of BackgroundConcentrations
ND to 125,000ND to 21.4ND to 25.3ND to 107ND to 20.5ND to 2.81ND to 32,900ND to 1090ND to 95.3ND to 161NDND to 294,000ND to 62.9ND to 2720ND to 16,000ND to 1.25ND to 244ND to 1250ND to 11.4ND to 3.84NDNDND to 745ND to 158
15 Porrnnt IJCIBackground
Concentration 2.5
96,1007.838.97 17.6
32.03.260.96
3520465
19.4107
1.05188,00
18.3 19.2693
22400.49
126565
5.751.33
5001
42490.4
Boring Number and Sample Depth (feet)
54BASSB00109.0 19.0 39.0 59.0 79.0 94.0
...
— 361
———— 128
114...
—— , —
3380
— 205
——— ... ... — ... ...— — — — ... ...
———
• 12.04.0032995 ROD
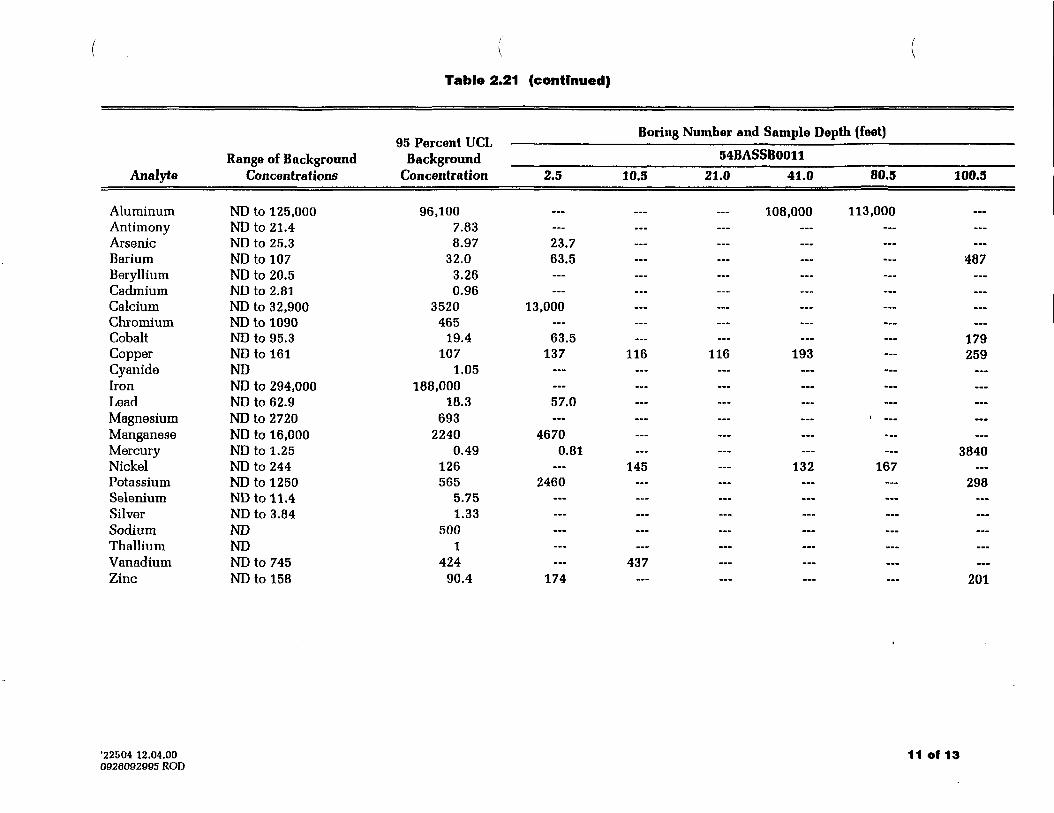
Table 2.21 (continued)
Analyte
AluminumAntimonyArsenicBariumBerylliumCadmiumCalciumChromiumCobaltCopperCyanideIronLeadMagnesiumManganeseMercuryNickelPotassiumSeleniumSilverSodiumThalliumVanadiumZinc
Range of BackgroundConcentrations
ND to 125,000ND to 21.4ND to 25.3ND to 107ND to 20.5ND to 2.81ND to 32,900ND to 1090ND to 95.3ND to 161NDND to 294,000ND to 62.9ND to 2720ND to 16,000ND to 1.25ND to 244ND to 1250ND to 11.4ND to 3.84NDNDND to 745ND to 158
95 Percent UCLBackground
Concentration
96,1007.838.97
32.03.260.96
3520465
19.4107
1.05188,000
18.3693
22400.49
126565
5.751.33
5001
42490.4
2.5
...
—23.763.5...
—13,000
—63.5
137...
—57.0
—46700.81...
2460
—......
——
174
Boring Number and Sample Depth (feet)
54BASSB001110.5 21.0 41.0 80.5
108,000 113,000...
—...
——.........
116 116 193...
——
• ——...
145 --- 132 167...
—— ... — ...... — ... ......
437...
100.5
...
——487
—......
—179259
—————3840
—298...
—...
——201
'22504 12.04.000926092995 ROD
11 of 13
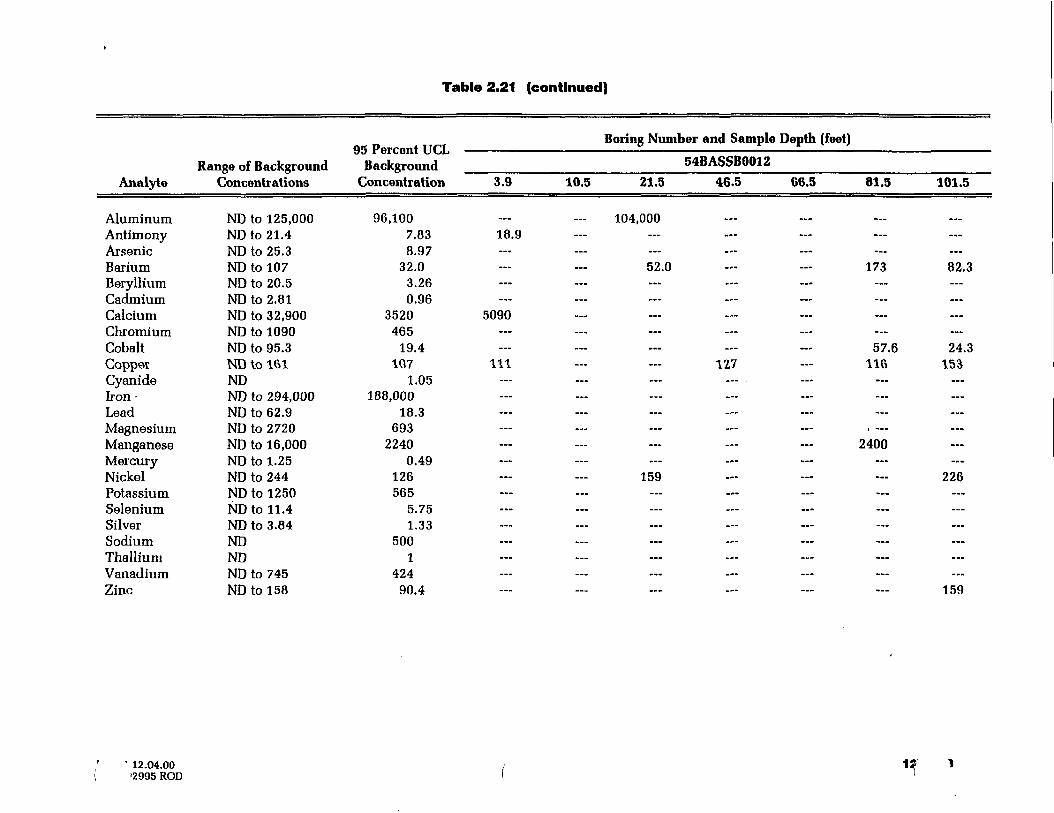
Table 2.21 (continued)
Analyte
AluminumAntimonyArsenicBariumBerylliumCadmiumCalciumChromiumCobaltCopperCyanideIron •LeadMagnesiumManganeseMercuryNickelPotassiumSeleniumSilverSodiumThalliumVanadiumZinc
Range of BackgroundConcentrations
ND to 125,000ND to 21.4ND to 25.3ND to 107ND to 20.5ND to 2.81ND to 32,900ND to 1090ND to 95.3ND to 161NDND to 294,000ND to 62.9ND to 2720ND to 16,000ND to 1.25ND to 244ND to 1250ND to 11.4ND to 3.84NDNDND to 745ND to 158
Bonne Number and Sample Depth (feet)Ti Porcnnt I Id
Backwound 54BASSB0012Concentration 3.9 10.5 21.5 46.5 66.5 81.5 101.5
96,100 — — 104,0007.83 18.98.97
32.0 — — 52.0 — — 173 82.33.260.96
3520 5090465
19.4 --- — — — — 57.6 24.3107 111 — — 12,7 — 116 153
1.05188,000
18.3693
2240 — — — — — 24000.49
126 — — 159 — — — 226565
5.751.33
5001
42490.4 ™ — — — — — 159
' 12.04.00'2995 ROD
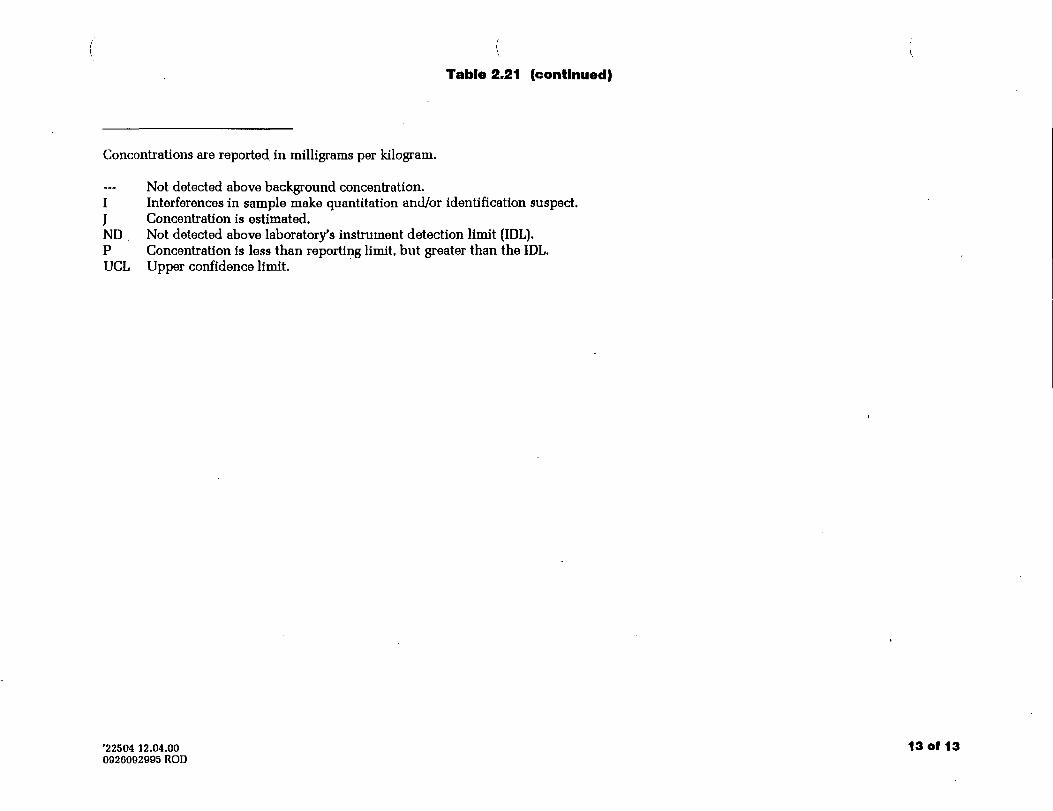
Table 2.21 (continued)
Concentrations are reported in milligrams per kilogram.
Not detected above background concentration.I Interferences in sample make quantitation and/or identification suspect.J Concentration is estimated.ND Not detected above laboratory's instrument detection limit (IDL).P Concentration is less than reporting limit, but greater than the IDL.UCL Upper confidence limit.
'22504 12.04.00 13 Of 130926092995 ROD
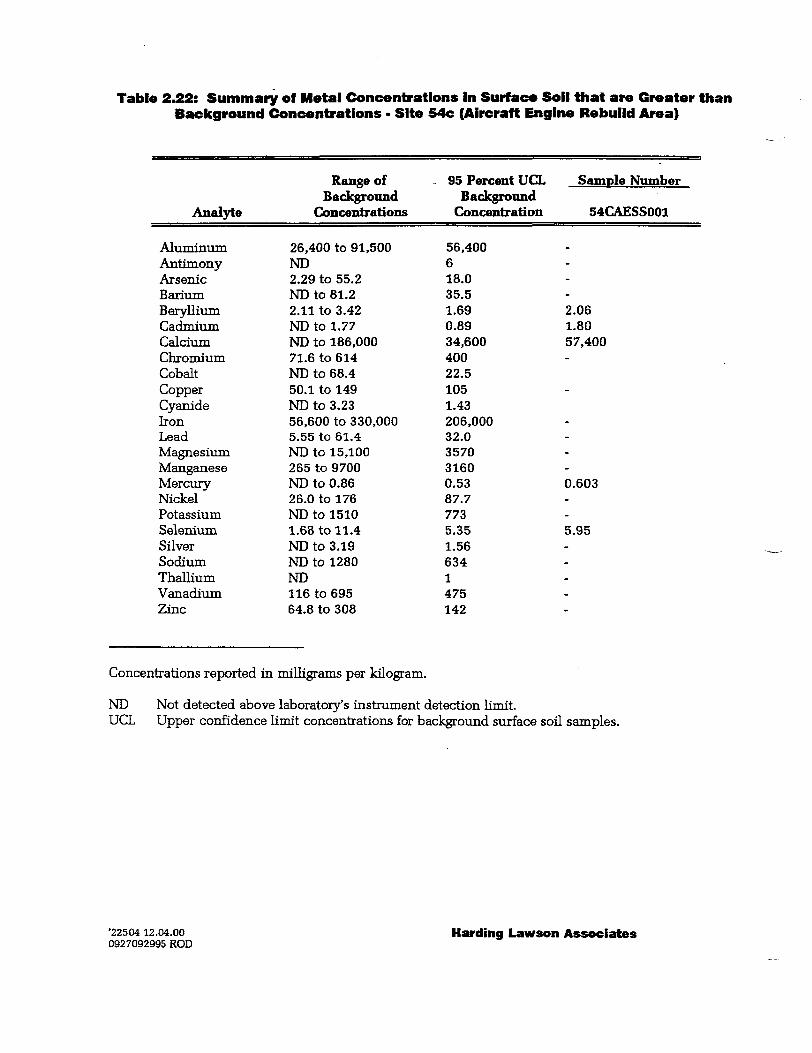
Table 2.22: Summary of Metal Concentrations In Surface Soil that are Greater thanBackground Concentrations • Site 54c (Aircraft Engine Rebuild Area)
Analyte
Range ofBackground
Concentrations
95 Percent UCLBackground
Concentration
ale Number
54CAESS001
AluminumAntimony
ArsenicBariumBerylliumCadmiumCalciumChromiumCobaltCopperCyanideIronLeadMagnesiumManganeseMercuryNickelPotassiumSeleniumSilverSodiumThalliumVanadiumZinc
26,400 to 91,500ND2.29 to 55.2ND to 81.22.11 to 3.42ND to 1.77ND to 186,00071.6 to 614ND to 68.450.1 to 149ND to 3.2356,600 to 330,0005.55 to 61.4ND to 15,100265 to 9700ND to 0.8626.0 to 176ND to 15101.68 to 11.4ND to 3.19ND to 1280ND116 to 69564.8 to 308
56,400618.035.51.690.8934,60040022.51051.43206,00032.0357031600.5387.77735.351.566341475142
"
-2.061.8057,400-
-
0.603
-5.95-....
Concentrations reported in milligrams per kilogram.
ND Not detected above laboratory's instrument detection limit.UCL Upper confidence limit concentrations for background surface soil samples.
'22504 12.04.000927092995 ROD
Harding Lawson Associates
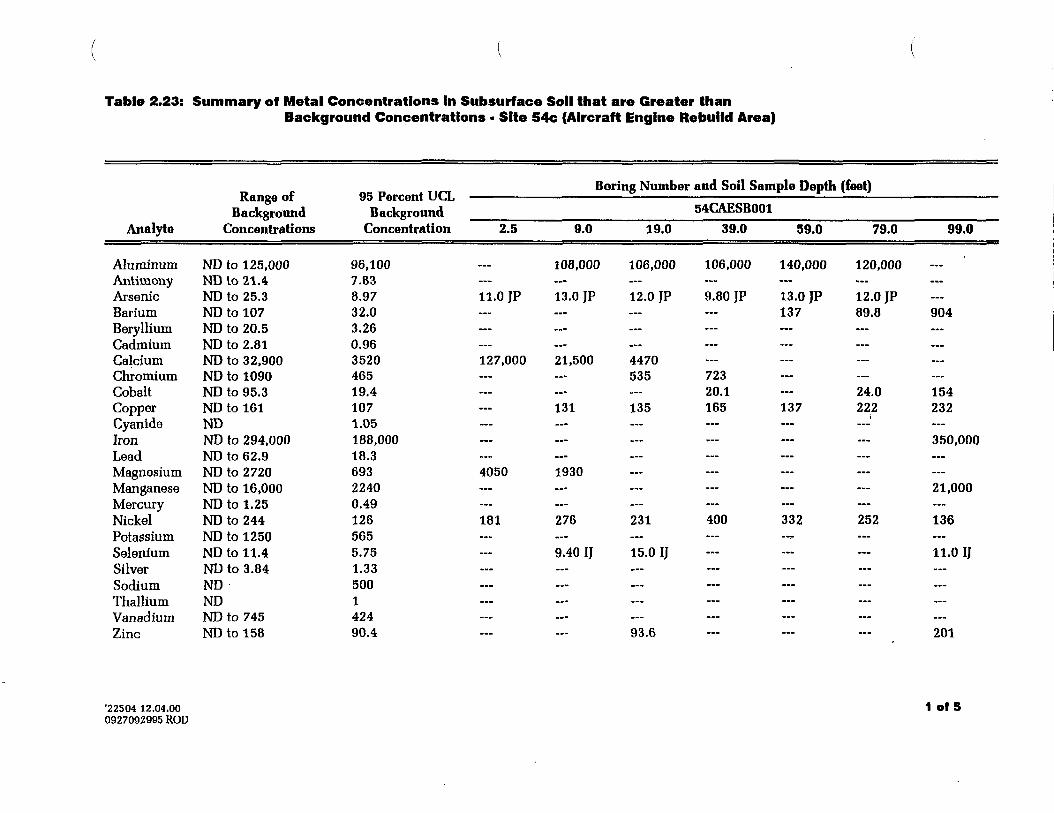
Table 2.23: Summary off Metal Concentrations In Subsurface Soil that are Greater thanBackground Concentrations • Site 54c (Aircraft Engine Rebuild Area)
Analyte
AluminumAntimonyArsenicBariumBerylliumCadmiumCalciumChromiumCobaltCopperCyanideIronLeadMagnesiumManganeseMercuryNickelPotassiumSeleniumSilverSodiumThalliumVanadiumZinc
'22504 12.04.000927092995 ROD
Range ofBackground
Concentrations
ND to 125,000NDto21.4ND to 25.3ND to 107ND to 20.5ND to 2.81ND to 32,900ND to 1090ND to 95.3ND to 161NDND to 294,000ND to 62.9ND to 2720ND to 16,000ND to 1.25ND to 244ND to 1250ND to 11.4ND to 3.84NDNDND to 745ND to 158
Boring Numberna n 1 I Tfl f
BackgroundConcentration 2.5 9.0 19.0
96,100 — 108,000 106,0007.838.97 11.0 JP 13.0 JP 12.0 JP32.03.260.963520 127,000 21,500 4470465 — — 53519.4107 --- 131 1351.05188,00018.3693 4050 193022400.49126 181 276 2315655.75 — 9.40 IJ 15.0 IJ1.33500142490.4 — — 93.6
and Soil Sample Depth (feet)
54CAESB001
39.0 59.0 79.0 99.0
106,000 140,000 120,000
—9.80 JP 13.0 JP 12.0 JP137 89.8 904
———72320.1 --- 24.0 154165 137 222 232—
350,000
—...21,000
—400 332 252 136
— 11.0 IJ
————
201
1 of 5
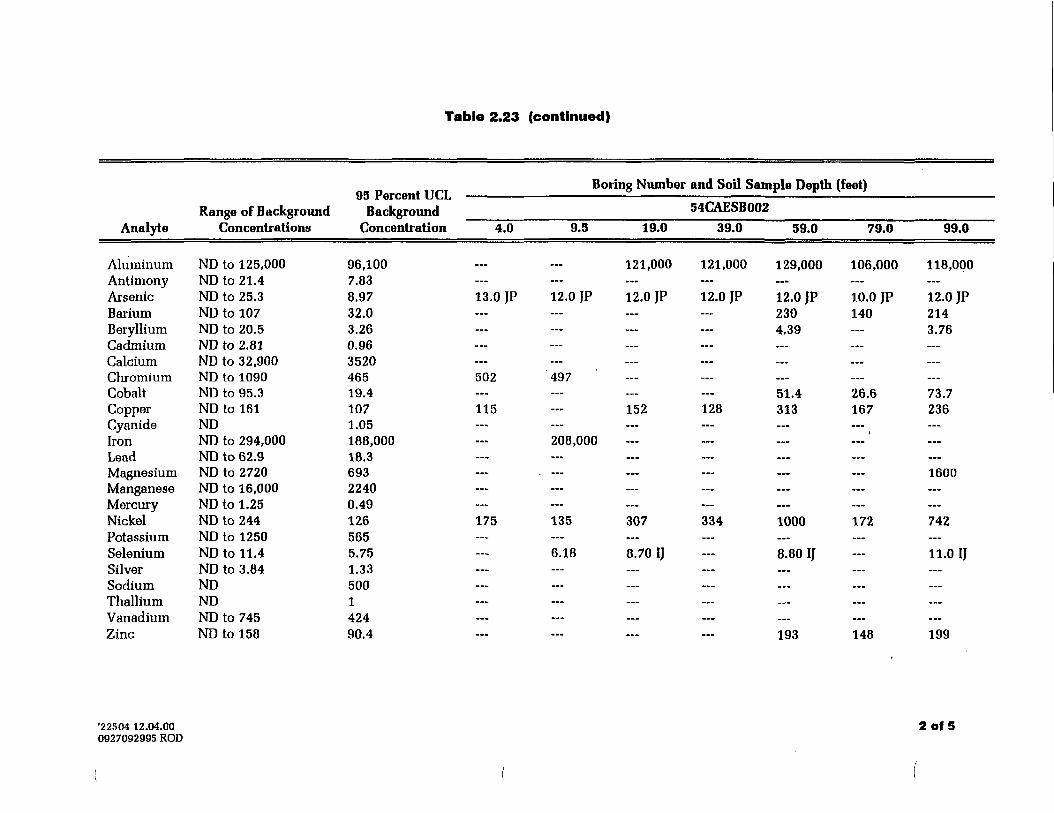
Table 2.23 (continued)
Analyte
AluminumAntimonyArsenicBariumBerylliumCadmiumCalciumChromiumCobaltCopperCyanideIronLeadMagnesiumManganeseMercuryNickelPotassiumSeleniumSilverSodiumThalliumVanadiumZinc
'22504 12.04.000927092995 ROD
Range of BackgroundConcentrations
ND to 125,000ND to 21.4ND to 25.3ND to 107ND to 20.5ND to 2.81ND to 32,900ND to 1090ND to 95.3ND to 161NDND to 294,000ND to 62.9ND to 2720ND to 16,000ND to 1.25ND to 244ND to 1250ND to 11.4ND to 3.84NDNDND to 745ND to 158
01 Pnrcont UflBackground
Concentration 4.0
96,1007.838.97 13.0 JP32.03.260.963520465 50219.4107 1151.05188,00018.369322400.49126 1755655.751.33500142490.4
Boring Number and Soil Sample Depth (feet)
54CAESB0029.3 19.0 39.0 59.0 79.0
121,000 121,000 129,000 106,000
—12.0 JP 12.0 JP 12.0 JP 12.0 JP 10.0 JP
230 1404.39
—
—49751.4 26.6
152 128 313 167I
208,000
——
——135 307 334 1000 172
—6.18 8.70 IJ — 8.80 IJ—...
—...193 148
99.0
118,000
—12.0 JP2143.76
——
73.7236—
—...1600
——742
—11.0 IJ
—.........199
2 of 5
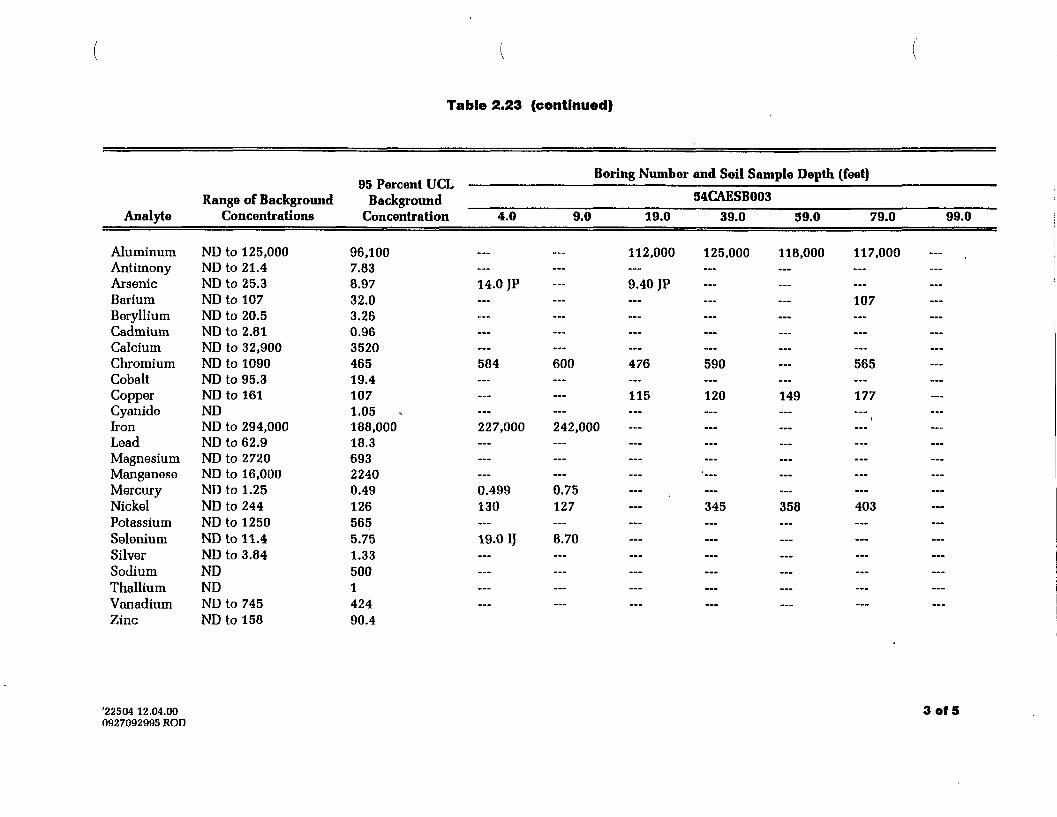
Table 2.23 (continued)
Analyte
AluminumAntimonyArsenicBariumBerylliumCadmiumCalciumChromiumCobaltCopperCyanideIronLeadMagnesiumManganeseMercuryNickelPotassiumSeleniumSilverSodiumThalliumVanadiumZinc
'22504 12.04.000927092995 ROD
Range of BackgroundConcentrations
ND to 125,000ND to 21.4ND to 25.3ND to 107ND to 20.5ND to 2.81ND to 32,900ND to 1090ND to 95.3ND to 161NDND to 294,000ND to 62.9ND to 2720ND to 16,000ND to 1.25ND to 244ND to 1250ND to 11.4ND to 3.84NDNDND to 745ND to 158
Boring Number and Soil Sample Depth (feet)n*t Pnrrnnt IIPI
Background 54CAESB003Concentration 4.0 9.0 19.0 39.0 59.0 79.0 99.0
96,100 — — 112,000 125,000 118,000 117,0007.838.97 14.0 JP — 9.40 JP32.0 — — — — — 1073.260.963520465 584 600 476 590 — 56519.4107 — — 115 120 149 1771.05188,000 227,000 242,00018.369322400.49 0.499 0.75126 130 127 --- 345 358 4035655.75 19.0 IJ 8.701.33500142490.4
3 of 5
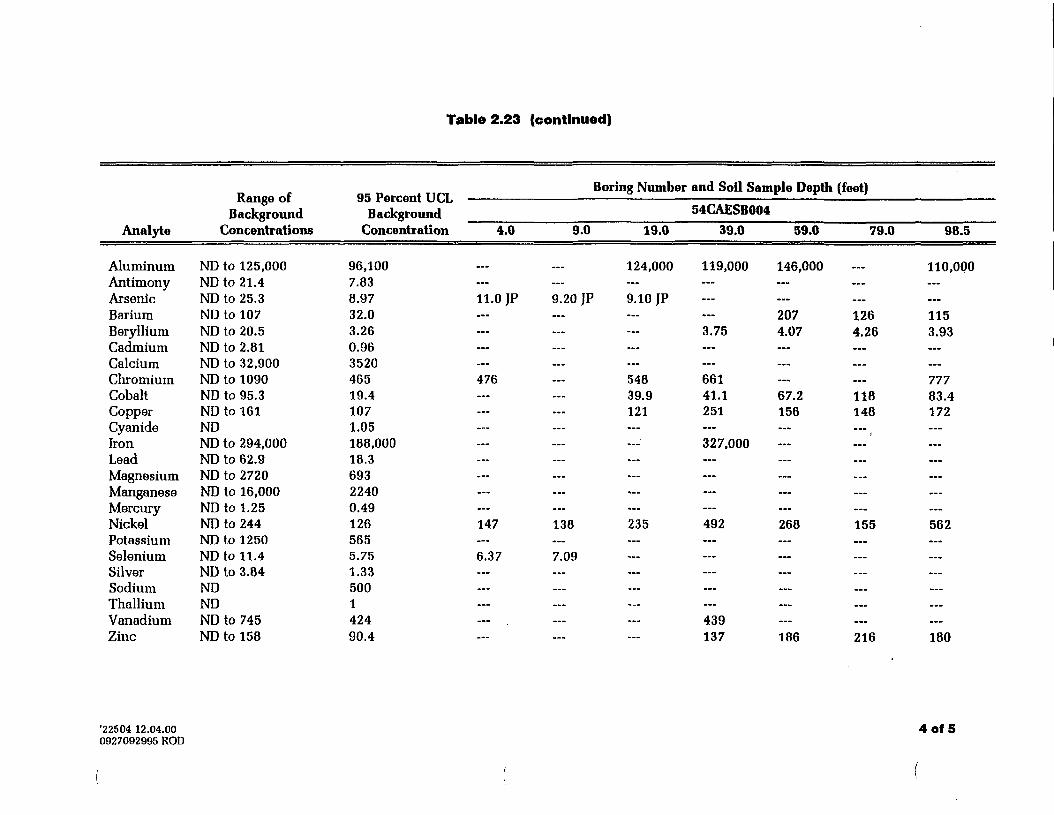
Table 2.23 (continued)
Analyte
AluminumAntimonyArsenicBariumBerylliumCadmiumCalciumChromiumCobaltCopperCyanideIronLeadMagnesiumManganeseMercuryNickelPotassiumSeleniumSilverSodiumThalliumVanadiumZinc
'22504 12.04.000927092995 ROD
Range ofBackground
Concentrations
ND to 125,000ND to 21.4ND to 25.3ND to 107ND to 20.5ND to 2.81ND to 32,900ND to 1090ND to 95.3ND to 161NDND to 294,000ND to 62.9ND to 2720ND to 16,000ND to 1.25ND to 244ND to 1250ND to 11.4ND to 3.84NDNDND to 745ND to 158
95 Percent UCLBackground
Concentration 4.0
96,1007.838.97 11.0 JP32.03.260.963520465 47619.41071.05188,00018.369322400.49126 1475655.75 6.371.33500142490.4
Boring Number and Soil Sample Depth
54CAESB0049.0 19.0 39.0 39.0
124,000 119,000 146,000...9.20 JP 9.10 JP
2073.75 4.07
—...548 66139.9 41.1 67.2121 251 156
...327,000
—...
——138 235 492 268
—7.09... ... — ......
— 439
137 186
(feet)
79.0 98.5
110,000
——126 1154.26 3.93
—...777
118 83.4148 172.........
———155 562...— ...
... ...
... ......
216 180
4 of 5
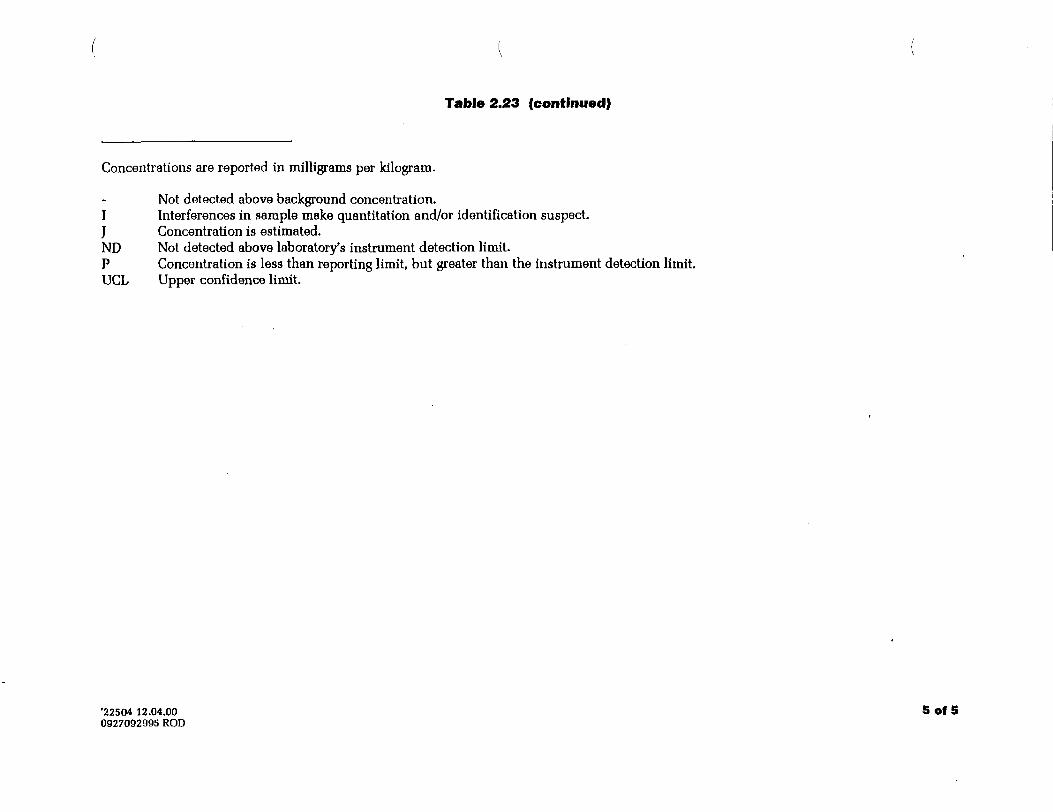
Table 2.23 (continued)
Concentrations are reported in milligrams per kilogram.
Not detected above background concentration.I Interferences in sample make quantitation and/or identification suspect.J Concentration is estimated.ND Not detected above laboratory's instrument detection limit.P Concentration is less than reporting limit, but greater than the instrument detection limit.UCL Upper confidence limit.
'22504 12.04.00 5 of 50927092995 ROD
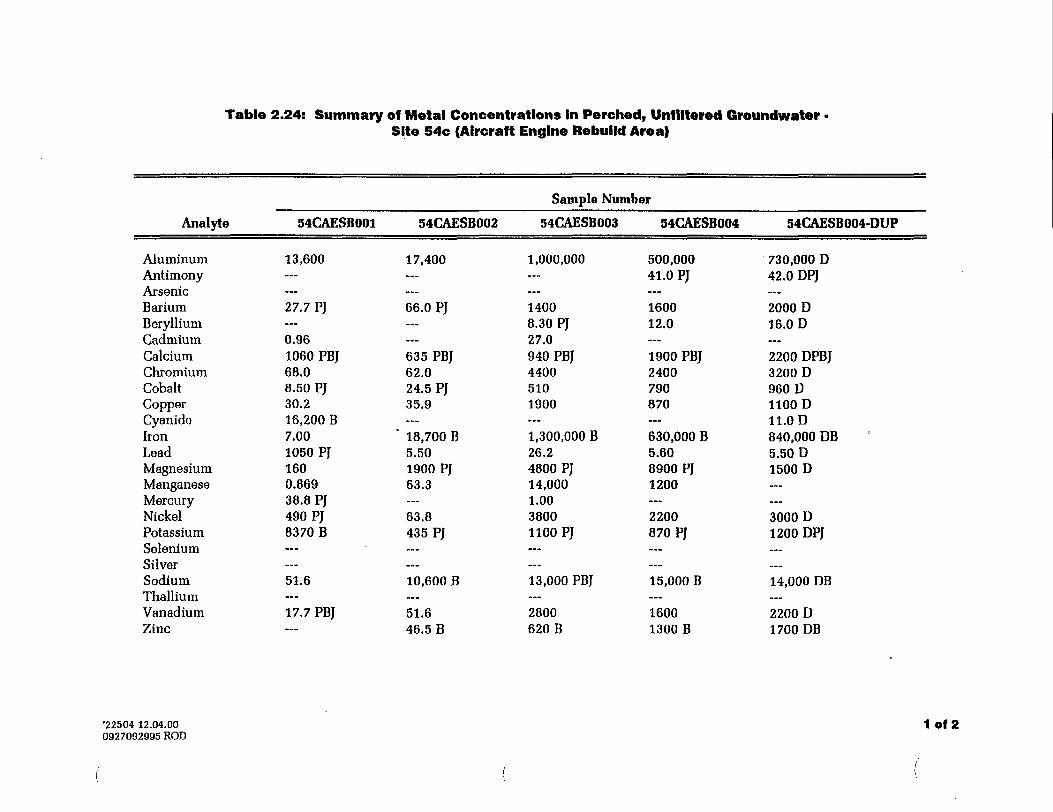
Table 2.24: Summary of Metal Concentrations In Perched, Unf lltered GroundwaterSite 54c (Aircraft Engine Rebuild Area)
Sample Number
Analyte
AluminumAntimonyArsenicBariumBerylliumCadmiumCalciumChromiumCobaltCopperCyanideIronLeadMagnesiumManganeseMercuryNickelPotassiumSeleniumSilverSodiumThalliumVanadiumZinc
54CAESB001
13,600—...27.7 PJ—0.961060 PBJ68.08.50 PJ30.216,200 B7.001050 PJ1600.86938.8 PJ490 PJ8370 B
—...51.6...17. 7 PBJ...
54CAESB002
17,400
——66.0 PJ
——635 PBJ62.024.5 PJ35.9...
" 18,700 B5.501900 PJ63.3—63.8435 PJ...
—10,600 B...51.646.5 B
54CAESB003
1,000,000
——14008.30 PJ27.0940 PBJ44005101900...1,300,000 B26.24800 PJ14,0001.0038001100 PJ......13,000 PBJ
—2800620 B
54CAESB004
500,00041.0 PJ
—160012.0
—1900 PBJ2400790870
—630,000 B5.608900 PJ1200
—2200870 PJ
—
15,000 B
—16001300 B
54CAESB004-DUP
730,000 D42.0 DPJ
—2000 D16.0 D
—2200 DPBJ3200 D960 DHOOD11.0 D840,000 DB5.50 D1500 D
——3000 D1200 DPJ...
—14,000 DB...2200 D1700 DB
'22504 12.04.000927092995 ROD
1 of 2
Table 2.24 (continued)
Concentrations are reported in micrograms per liter.
Analyte not detected at concentration exceeding the instrument detection limit (IDL).B Analyte detected in blank as well as sample.D Duplicate sample.F Sample was filtered before analysis.J Concentration is estimatedP Concentration is less than the reporting limit, but greater than the IDL.
'22504 12.04.00 2 Of 20927092995 ROD
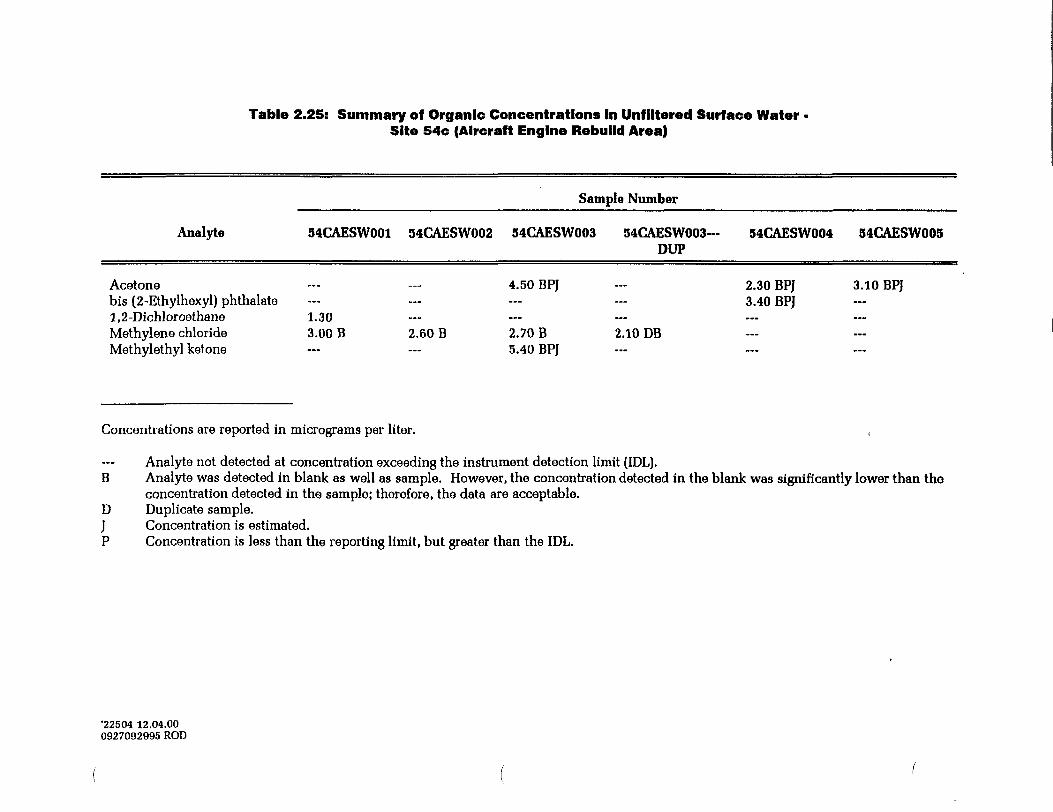
Table 2.25: Summary of Organic Concentrations In Unflltered Surface WaterSite 54c (Aircraft Engine Rebuild Area)
Sample Number
Analyte 54CAESW001 54CAESW002 54CAESW003 54CAESW003- 54CAESW004 54CAESW005DUP
Acetone — — 4.50 BPJ — 2.30 BPJ 3.10 BPJbis (2-Ethylhexyl) phthalate — — — — 3.40 BPJ1,2-Dichloroethane 1.30Methylene chloride 3.00 B 2.60 B 2.70 B 2.10 DBMethylethyl ketone — — 5.40 BP]
Concentrations are reported in micrograms per liter. ,
Analyte not detected at concentration exceeding the instrument detection limit (IDL).B Analyte was detected in blank as well as sample. However, the concentration detected in the blank was significantly lower than the
concentration detected in the sample; therefore, the data are acceptable.D Duplicate sample.J Concentration is estimated.P Concentration is less than the reporting limit, but greater than the IDL.
'22504 12.04.000927092995 ROD
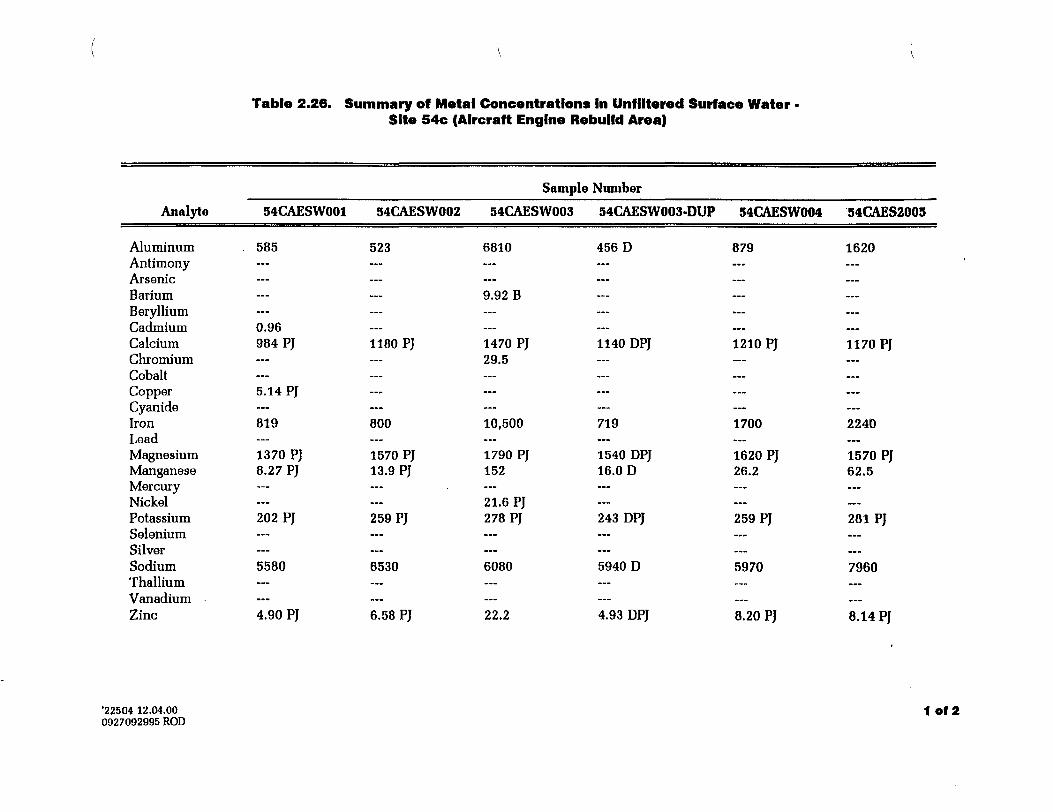
Table 2.26. Summary of Metal Concentrations In Unflltered Surface WaterSite 54c (Aircraft Engine Rebuild Area)
Sample Number
Analyte
AluminumAntimonyArsenicBariumBerylliumCadmiumCalciumChromiumCobaltCopperCyanideIronLeadMagnesiumManganeseMercuryNickelPotassiumSeleniumSilverSodiumThalliumVanadiumZinc
'22504 12.04.000927092995 ROD
54CAESW001
585...
—...
—0.96984 PJ
——5.14 PJ...819
—1370 PJ8.27 PJ—
—202 PJ
——5580
—...4.90 PJ
54CAESW002
523
—————1180 PJ
————800
—1570 PJ13.9 PJ
——259 PJ
—...6530......6.58 PJ
54CAESW003
6810...
—9.92 B
——1470 PJ29.5
——...10,500...1790 PJ152...21.6 PJ278 PJ
—...6080...„.22.2
54CAESW003-DUP 54CAESW004 54CAES2005
456 D 879 1620
—————1140 DPJ 1210 PJ 1170 PJ
——......719 1700 2240
—1540 DPJ 1620 PJ 1570 PJ16.0 D 26.2 62.5
——243 DPJ 259 PJ 281 PJ...— — ...5940 D 5970 7960— — ...— — ...4.93 DPJ 8.20 PJ 8.14 PJ
1 «
Table 2.26 (continued)
Concentrations are reported in micrograms per liter.
Analyte not detected at concentration exceeding background.B Analyte was detected in blank as well as sample.D Duplicate sample.J Concentration is estimated.P Concentration is less than the reporting limit, but greater than the instrument detection limit.
'22504 12.04.00 2 of 20927092995 ROD
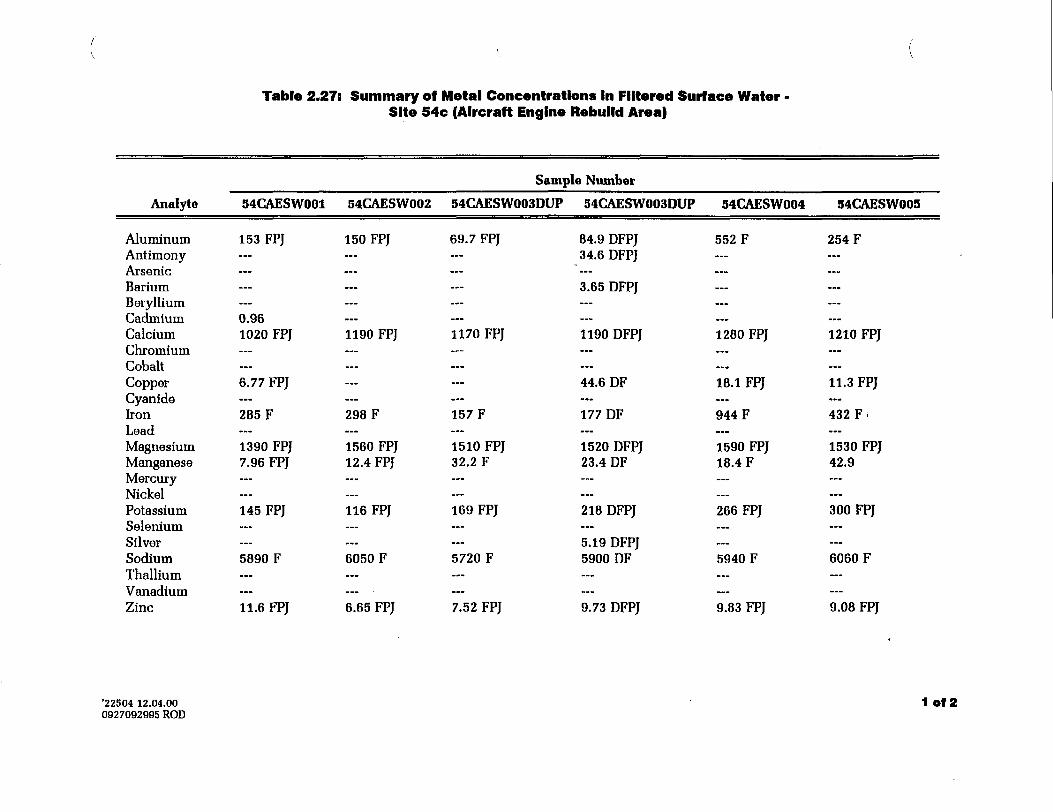
Table 2.27: Summary of Metal Concentrations In Filtered Surface WaterSite 54c (Aircraft Engine Rebuild Area)
Sample Number
Analyte
AluminumAntimonyArsenicBariumBerylliumCadmiumCalciumChromiumCobaltCopperCyanideIronLeadMagnesiumManganeseMercuryNickelPotassiumSeleniumSilverSodiumThalliumVanadiumZinc
'22504 12.04.000927092995 ROD
54CAESW001
153 FPJ
0.961020 FPJ
...6.77 FPJ
285 F...1390 FPJ7.96 FPJ
145 FPJ
5890 F...
—11.6 FPJ
54CAESW002
150 FPJ
—
1190 FPJ
—
298 F...1560 FPJ12.4 FPJ
116 FPJ
6050 F......6.65 FPJ
54CAESW003DUP
69.7 FPJ
...
1170 FPJ
—
157 F
—1510 FPJ32.2 F
169 FPJ
5720 F
——7.52 FPJ
54CAESW003DUP
84.9 DFPJ34.6 DFPJ
3.65 DFPJ
1190 DFPJ
—44.6 DF
177 DF...1520 DFPJ23.4 DF
218 DFPJ
5.19 DFPJ5900 DF
——9.73 DFPJ
34CAESW004
552 F
—
1280 FPJ
...18.1 FPJ
944 F...1590 FPJ18.4 F
266 FPJ
5940 F...
—9.83 FPJ
34CAESW005
254 F
—
1210 FPJ
—11.3 FPJ
432 F....1530 FPJ42.9
300 FPJ
6060 F
——9.08 FPJ
1 0
Table 2.27 (continued)
Concentrations are reported in micrograms per liter.
Analyte not detected at concentration exceeding background.D Duplicate sample.F Sample was filtered before analysis.J Concentration is estimated.P Concentration is less than the reporting limit, but greater than the instrument reporting limit.
'22504 12.04.00 2 Of 20927092995 ROD
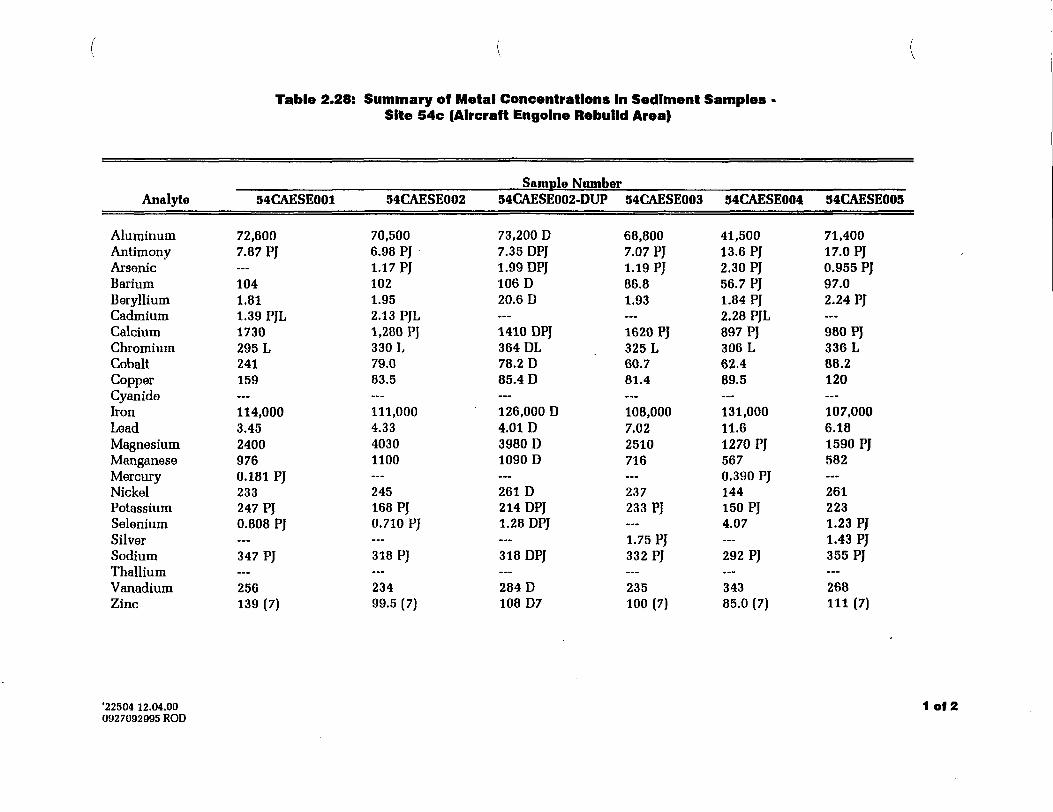
Table 2.28: Summary of Metal Concentrations In Sediment SamplesSite 54c (Aircraft Engolne Rebuild Area)
Sample NumberAnalyte
AluminumAntimonyArsenicBariumBerylliumCadmiumCalciumChromiumCobaltCopperCyanideIronLeadMagnesiumManganeseMercuryNickelPotassiumSeleniumSilverSodiumThalliumVanadiumZinc
'22504 12.04.000927092995 ROD
54CAESE001
72,6007.87 PJ...1041.811.39 PJL1730295 L241159...114,0003.4524009760.181 PJ233247 PJ0.808 PJ
—347 PJ...256139 (7)
54CAESE002
70,5006.98 PJ1.17 PJ1021.952.13 PJL1,280 PJ330 L79.083.5
—111,0004.3340301100
—245168 PJ0.710 PJ
—318 PJ
—23499.5 (7)
54CAESE002-DUP
73,200 D7.35 DPJ1.99 DPJ106 D20.6 D
—1410 DPJ364 DL78.2 D85.4 D
—126,000 D4.01 D3980 D1090 D
—261 D214 DPJ1.28 DPJ
—318 DPJ
—284 D108 D7
54CAESE003
68,8007.07 PJ1.19 PJ86.81.93
—1620 PJ325 L60.781.4...108,0007.022510716...237233 PJ...1.75 PJ332 PJ
—235100 (7)
54CAESE004
41,50013.6 PJ2.30 PJ56.7 PJ1.84 PJ2.28 PJL897 PJ306 L62.489.5
—131,00011.61270 PJ5670.390 PJ144150 PJ4.07
—292 PJ...34385.0 (7)
54CAESE005
71,40017.0 PJ0.955 PJ97.02.24 PJ
—980 PJ336 L88.2120
—107,0006.181590 PJ582
—2612231.23 PJ1.43 PJ355 PJ
—268111 (7)
1 of 2
Table 2.28 (continued)
Concentrations are reported in milligrams per gram.
Analyte not detected at concentration exceeding the instrument detection limit (IDL).(7) Low spike recovery is not within control limits.D Duplicate sample.J Concentration is estimated.L Out of control, data was rejected due to low recoveries. Therefore, cadmium and chromium data were not evaluated for this report.P Concentration is less than the reporting limit, but greater than the IDL.
'22504 12.04.00 2 Of 20927092995 ROD
FIGURES
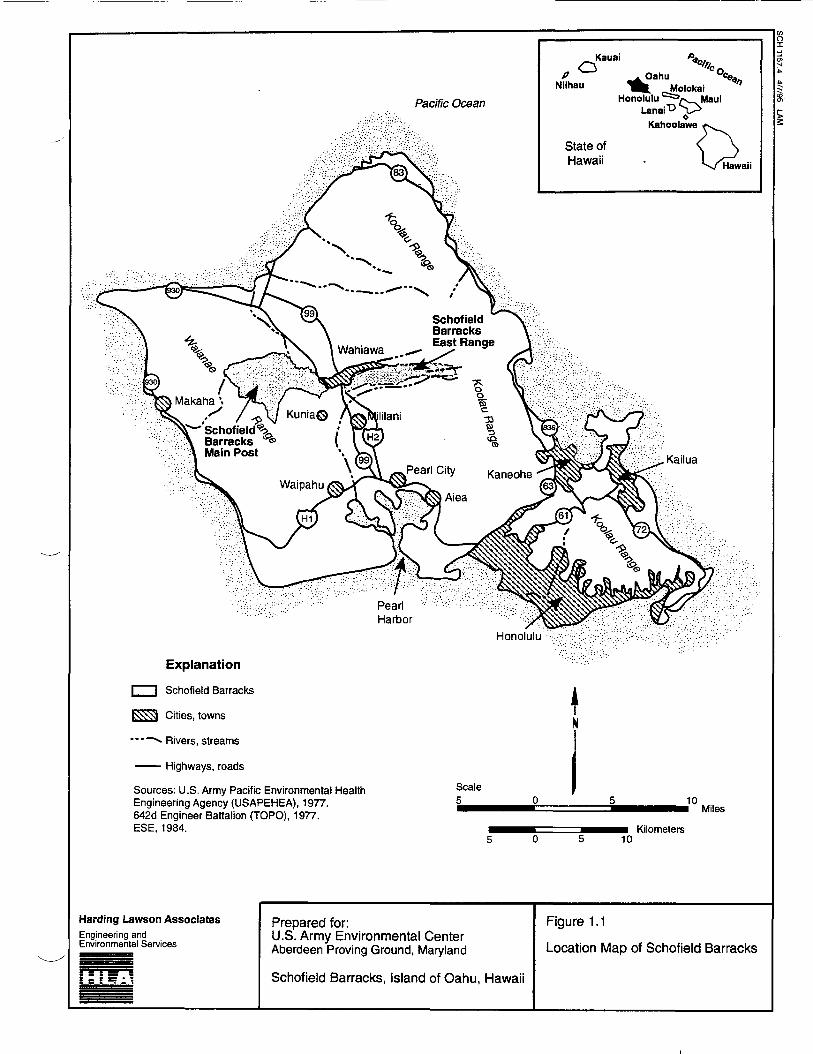
PearlHarbor
Honolulu
Explanation
Schofield Barracks
Cities, towns
. Rivers, streams
Highways, roads
Sources: U.S. Army Pacific Environmental HealthEngineering Agency (USAPEHEA), 1977.642d Engineer Battalion (TOPO), 1977.ESE, 1984.
Scale5 10
Miles
10Kilometers
Harding Lawson AssociatesEngineering andEnvironmental Services
Prepared for:U.S. Army Environmental CenterAberdeen Proving Ground, Maryland
Schofield Barracks, Island of Oahu, Hawaii
Figure 1.1
Location Map of Schofield Barracks
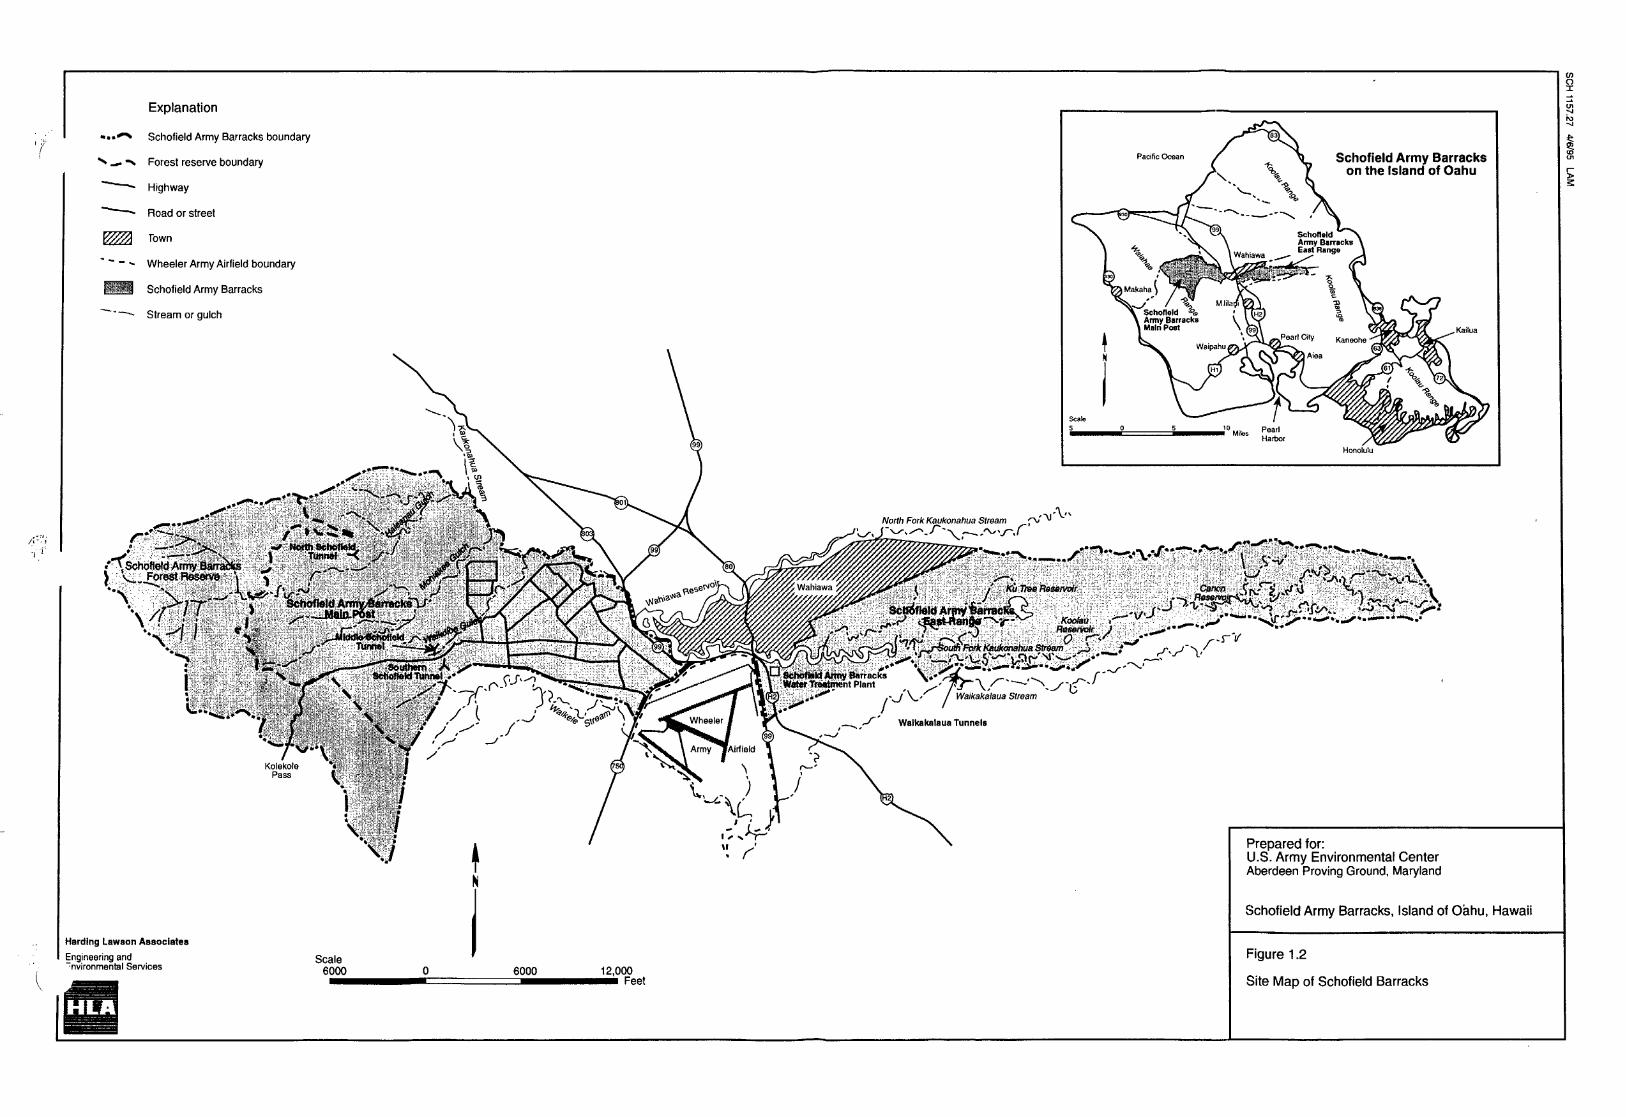
Explanation
••••"> Schofield Army Barracks boundary
*•» — -s Forest reserve boundary
~~ • Highway
~~" • Road or street
" " ~ - Wheeler Army Airfield boundary
Schofield Army Barracks
~~ - Stream or gulch
Pacific Ocean Schofield Army Barrackson the Island of Oahu
,-v
V ' ..Forest Ftes*v«*'
«.^M-T 3rmy&r™?'"1 \»*'£SK_ ./",—-. .^ **~ r rWopn Tfwnmcnt Plant
" ...i**** i\/\.'r I Waikakalaua Stream
Walkakalaua Tunnels
Kailua
Honolulu
_
.-»»«-rV
Harding Lawaon Associates
Engineering and•nvironmental Services
Scale6000 6000 12,000
tmm Feet
Prepared for:U.S. Army Environmental CenterAberdeen Proving Ground, Maryland
Schofield Army Barracks, Island of Oahu, Hawaii
Figure 1.2
Site Map of Schofield Barracks
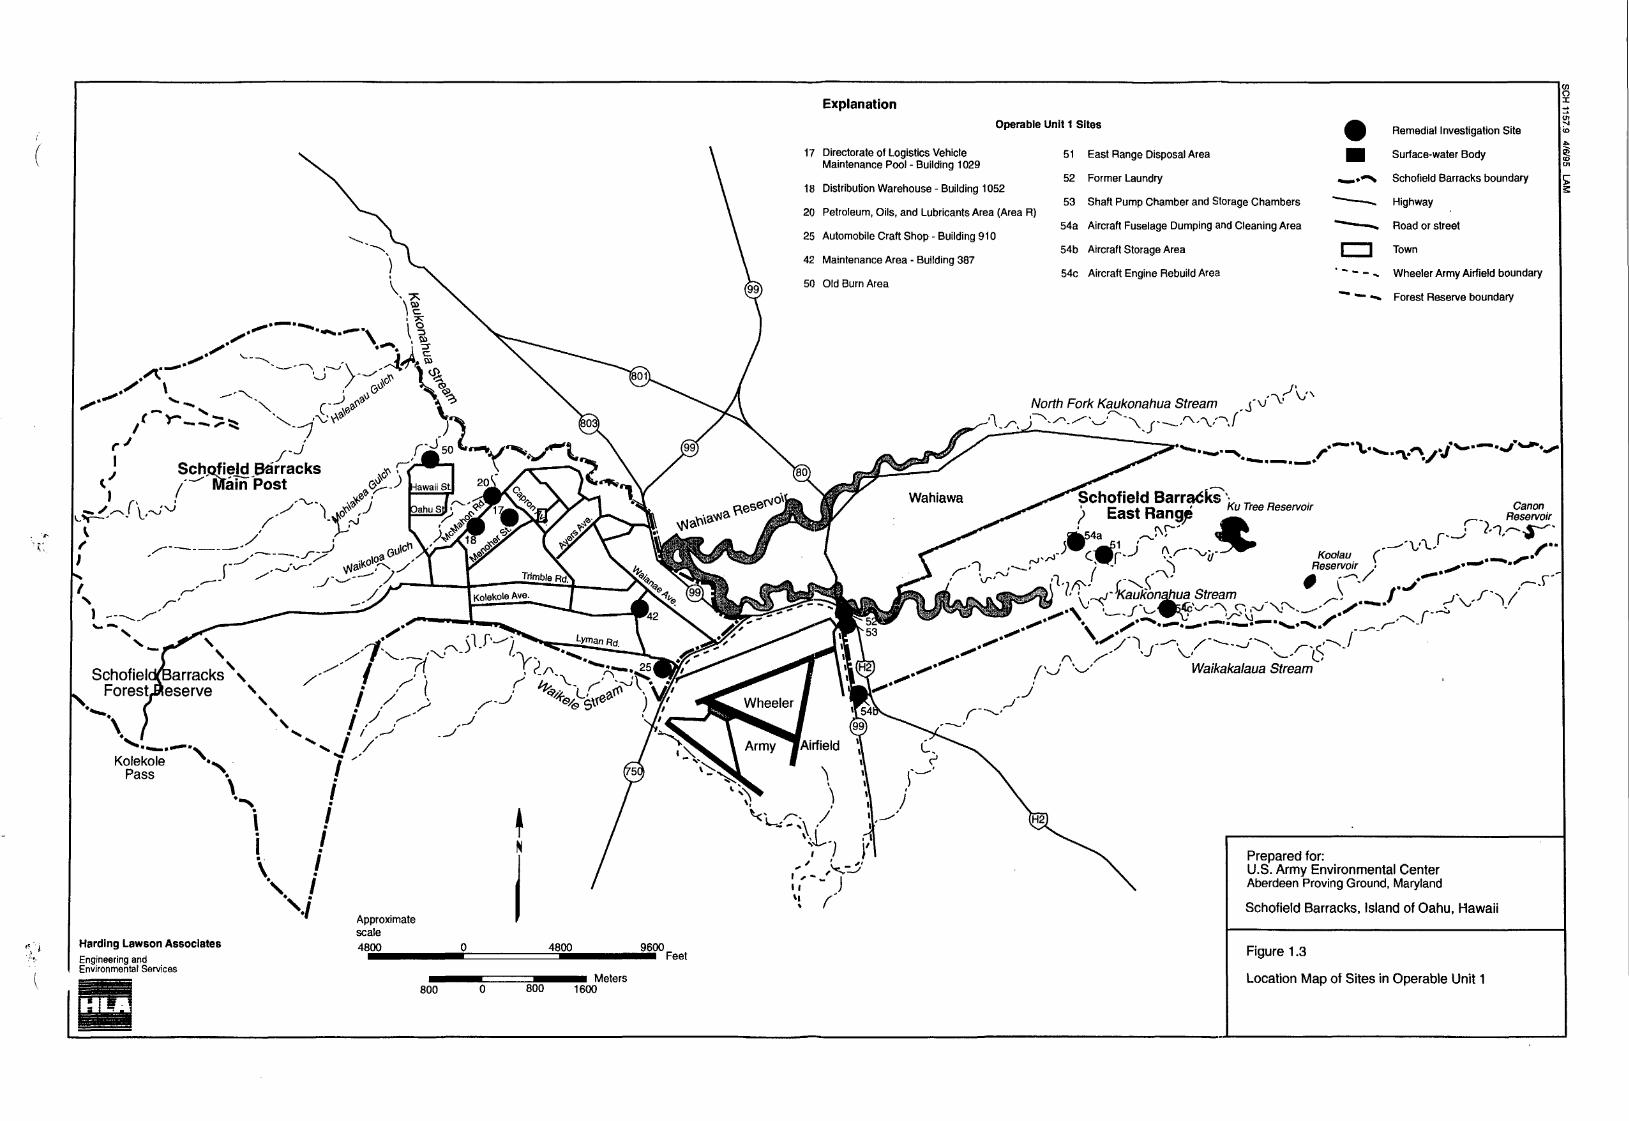
ExplanationOperable Unit 1 Sites Remedial Investigation Site
Surface-water Body
Schofield Barracks boundary
Highway
Road or street
Town
' .. Wheeler Army Airfield boundary
""• —• -* Forest Reserve boundary
17 Directorate of Logistics VehicleMaintenance Pool - Building 1029
51 East Range Disposal Area
52 Former Laundry
53 Shaft Pump Chamber and Storage Chambers
54a Aircraft Fuselage Dumping and Cleaning Area
54b Aircraft Storage Area
54c Aircraft Engine Rebuild Area
18 Distribution Warehouse - Building 1052
20 Petroleum, Oils, and Lubricants Area (Area R)
25 Automobile Craft Shop - Building 910
42 Maintenance Area - Building 387
50 Old Burn Area
North Fork Kaukonahua Stream
Sch,Qfieid BarracksMain Post
sSchofield Barracks') East Range'
•
CanonReservoir
KoolauReservoir
Waikakalaua StreamSchofieldfBarracks \Forest^eserve
KolekolePass
Prepared for:U.S. Army Environmental CenterAberdeen Proving Ground, Maryland
Schofield Barracks, Island of Oahu, Hawaii
Harding Lawson AssociatesFigure 1.3
Location Map of Sites in Operable Unit 1
Engineering andEnvironmental Services
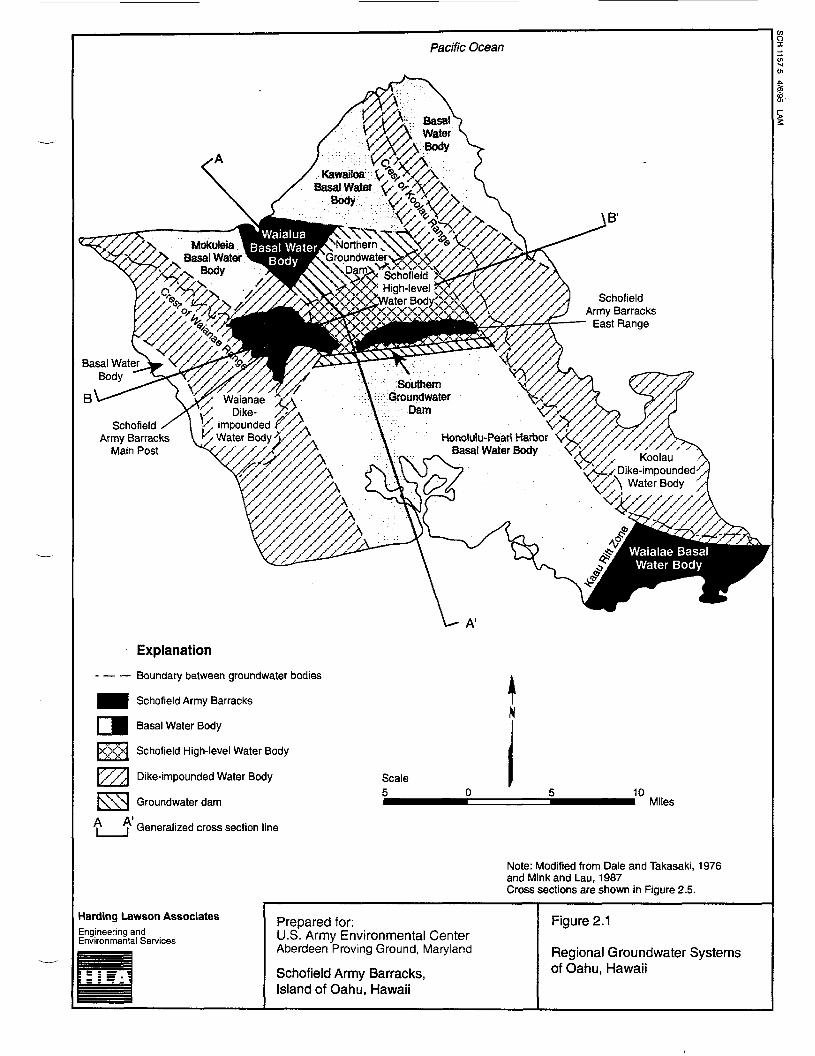
Pacific Ocean
B1
MokuleiaBasal Water
Body
Northern ^GroundwaterNo Schofield
High-levelater Bod Schofield
Army BarracksEast Range
Basal WaterBody Southern
GroundwaterDamY Dike- #A.
V. impounded f /AHonolulu-Pearl Harbor
Basal Water BodyDike-impounded
B
SchofieldArmy Barracks
Main Post
Explanation
Boundary between groundwater bodies
^m Schofield Army Barracks
Basal Water Body
Schofield High-level Water Body
Dike-impounded Water Body
Groundwater dam
A1,Generalized cross section line
Scale5 10
Miles
Note: Modified from Dale and Takasaki, 1976and Mink and Lau, 1987Cross sections are shown in Figure 2.5.
Harding Lawson AssociatesEngineering andEnvironmental Services
Prepared for:U.S. Army Environmental CenterAberdeen Proving Ground, Maryland
Schofield Army Barracks,Island of Oahu, Hawaii
Figure 2.1
Regional Groundwater Systemsof Oahu, Hawaii
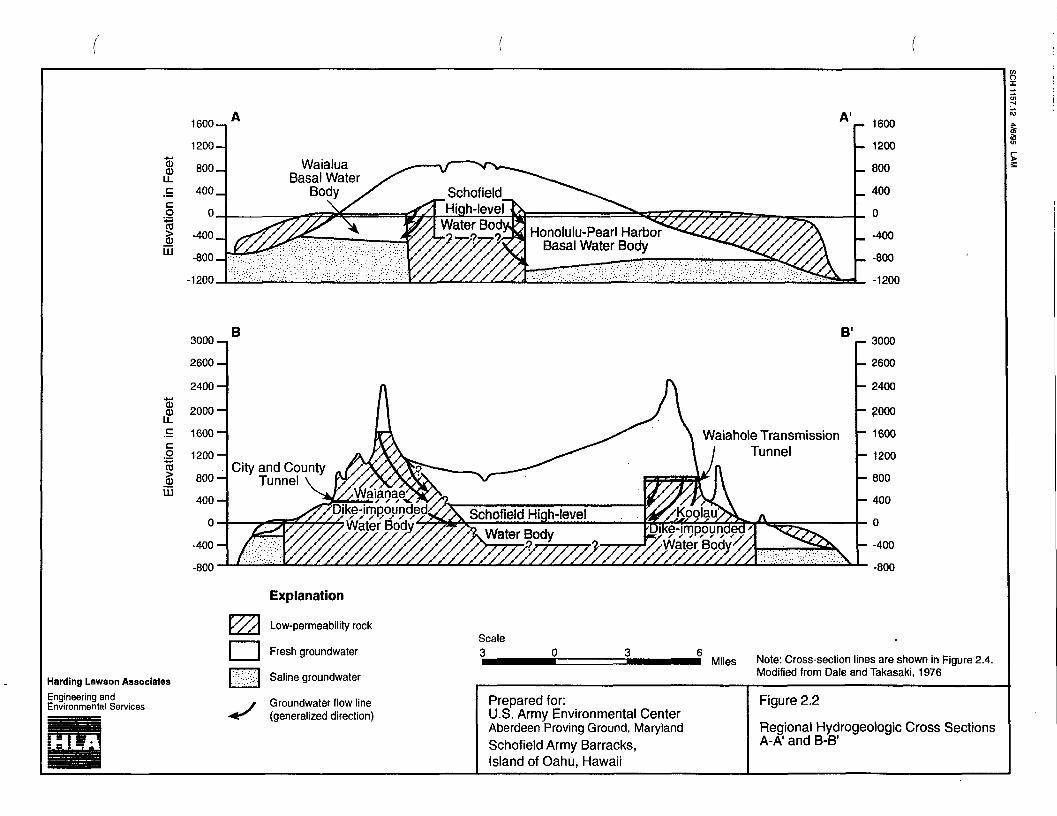
CDCD
.O
I111
cc
03
.S>UJ
Harding Lawson Associates
Engineering andEnvironmental Services
IlLA
1600-,
1200-
800 _
400 _
0
-400 _
-800-
-1200
WaialuaBasal Water
Body
3000 -,
2600-
2400-
2000-
1600-
1200-
800-
400-
0
B
City and CountyTunnel
t•4r
Explanation
Low-permeability rock
Fresh groundwater
Saline groundwater
Groundwater flow line(generalized direction)
Honolulu-Pearl HarborBasal Water Body
B1
Waiahole TransmissionTunnel
- 3000
- 2600
- 2400
- 2000
- 1600
- 1200
- 800
- 400
0
- -400
-800
Scale3 Miles Note: Cross-section lines are shown in Figure 2.4.
Modified from Dale and Takasaki, 1976
Prepared for:U.S. Army Environmental CenterAberdeen Proving Ground, MarylandSchofield Army Barracks,Island of Oahu, Hawaii
Figure 2.2
Regional Hydrogeologic Cross SectionsA-A' and B-B1
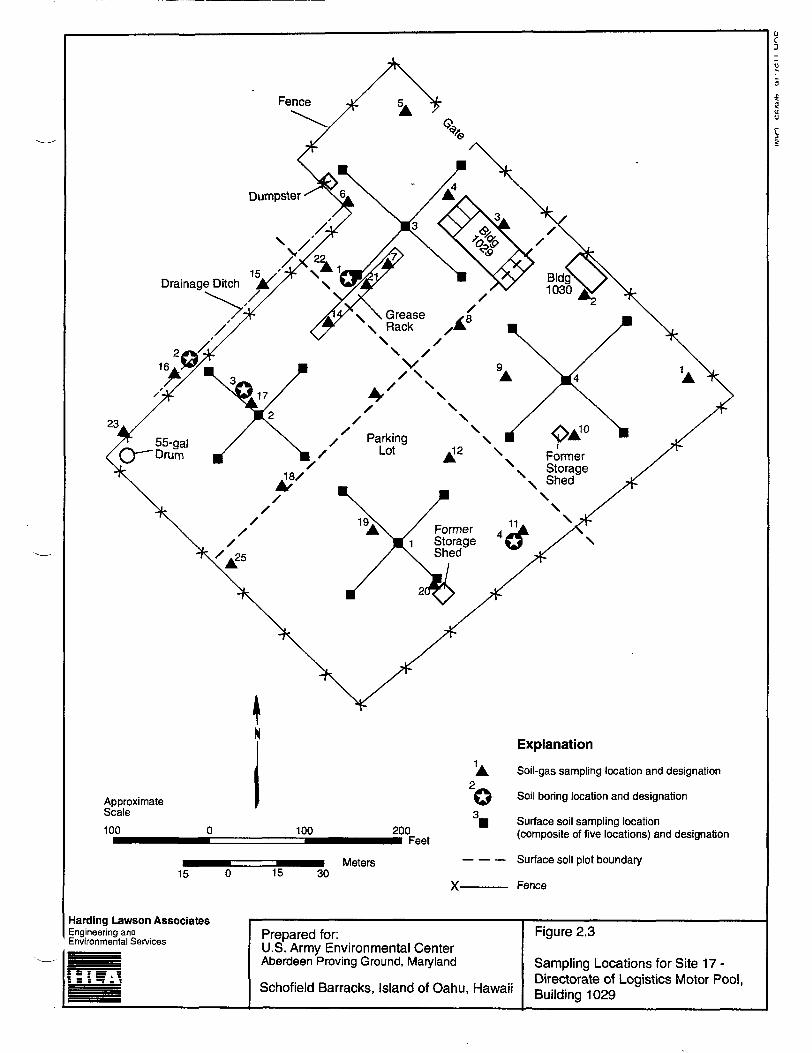
Fence
Drainage Ditch\
23
ApproximateScale
o100 100 200
Feet
15
Harding Lawson AssociatesEngineering andEnvironmental Services
15 30Meters
Explanation
Soil-gas sampling location and designation
Soil boring location and designation
Surface soil sampling location(composite of five locations) and designation
Surface soil plot boundary
Fence
Prepared for:U.S. Army Environmental CenterAberdeen Proving Ground, Maryland
Schofield Barracks, Island of Oahu, Hawaii
Figure 2.3
Sampling Locations for Site 17 -Directorate of Logistics Motor Pool,Building 1029
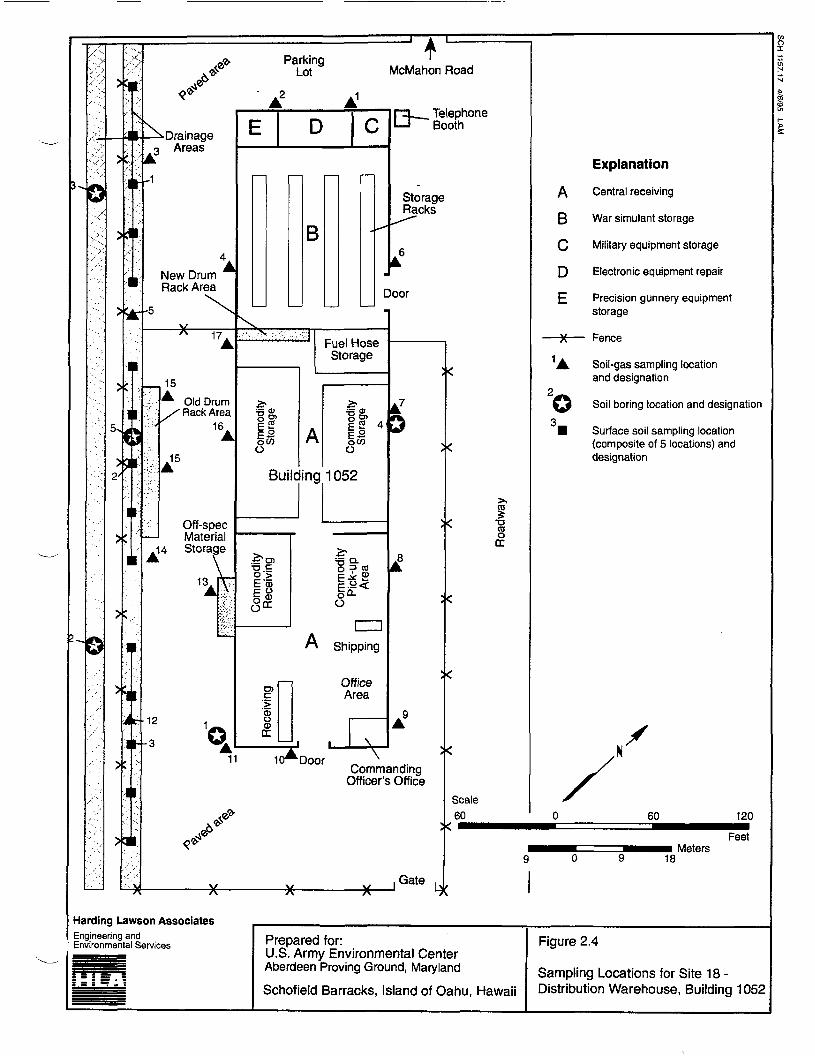
J^
' /',,
.. >
0
VX
t
5-,
2'
>.?
>/*
VS
sX
>
;x;
11M ^
31
II
1
1
•'- v
<f
- •Drainage3 Areas
-1
ANew DrumRack Area
-5 ^s
VA 17
A
15^ Old Drum/ Rack Area
16A
A15
Off-spec— ' Material
14 Storage
13 \
12 1
-3 ^11
<f
v'\ y\
Harding Lawson AssociatesEngineering andEnvironmental Services
ParkingLot
A2
E D
B
:v-,^S -.•-••*.;.-..• , -;;|FuS
A1
C
• ^*
C
el Hosetorage
•• 0, . a,
ll A llOW *» OWo o
Building 1052
4
XI O) :
~Q->
IsJ*
A E
0)
'5Str
— ' i10^ Door
>>
B- Q.= CO
= .i £= .a<50-
cmhipping
OfficeArea
v
-1!1McMahon Road
rru__ TelephoneI— » Booth
StorageRacks
6
)oor
^
»^
A6
*
>/
A9
\ *
CommandingOfficer's Office
st
^ i Qate ,,•/
<
<
OS
CC
VS
ss
s**
Scale60
I9
Prepared for:U.S. Army Environmental CenterAberdeen Proving Ground, Maryland
Schofield Barracks, Island of Oahu, Hawaii
Explanation
A Central receiving
B War simulant storage
Q Military equipment storage
D Electronic equipment repair
E Precision gunnery equipmentstorage
— )K. — Fence
1 A Soil-gas sampling locationand designation
2^5 Soil boring location and designation3• Surface soil sampling location
(composite of 5 locations) anddesignation
/0 60 120
Feet•BHMB==MMi H Meters
0 9 18
Figure 2.4
Sampling Locations for Site 1 8 -Distribution Warehouse, Building 1052
SC
H 1157.17
4/6
/95
LA
M
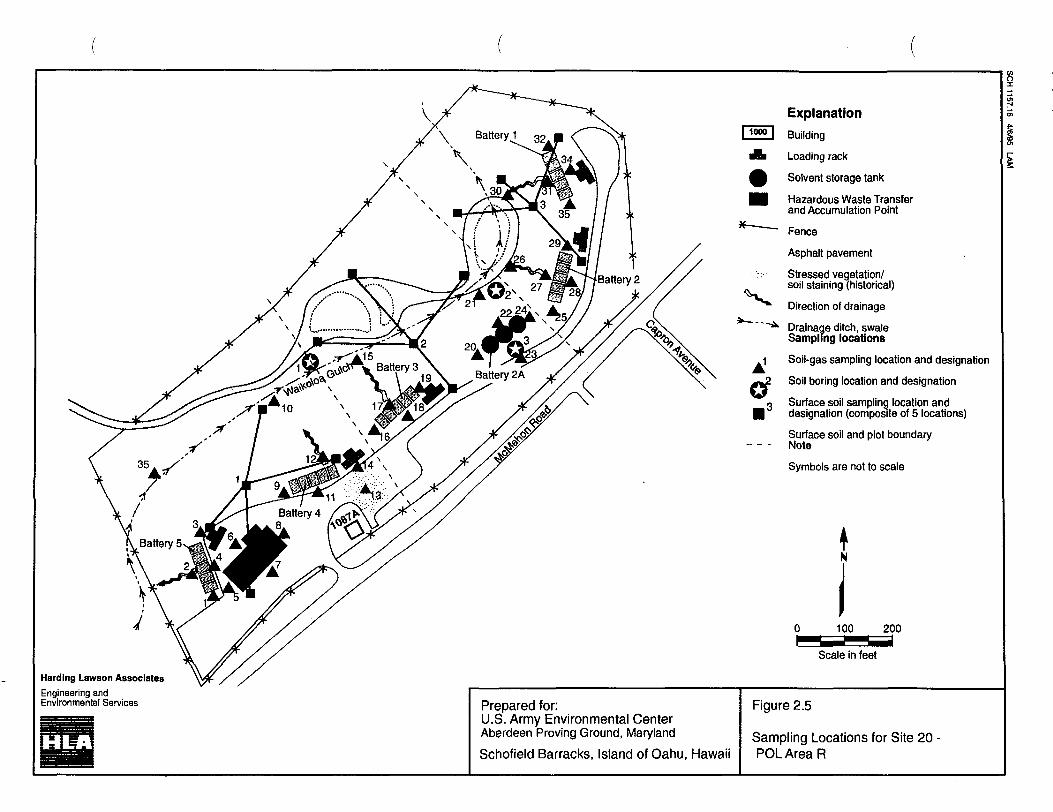
Explanation1000 I Building
Jh Loading rack
£ Solvent storage tank
HI Hazardous Waste Transferand Accumulation Point
^~~ Fence
Asphalt pavement
• ' : : • • Stressed vegetation/soil staining (historical)
Direction of drainage
" ~"^ Drainage ditch, swaleSampling locations
. 1 Soil-gas sampling location and designation
Soil boring location and designation
3 Surface soil sampling location anddesignation (composite of 5 locations)
Surface soil and plot boundary- Note
Symbols are not to scale
0 100 200
Scale in feet
Harding Lawson Associates
Engineering andEnvironmental Services
HLA
Prepared for:U.S. Army Environmental CenterAberdeen Proving Ground, Maryland
Schofield Barracks, Island of Oahu, Hawaii
Figure 2.5
Sampling Locations for Site 20 -POL Area R
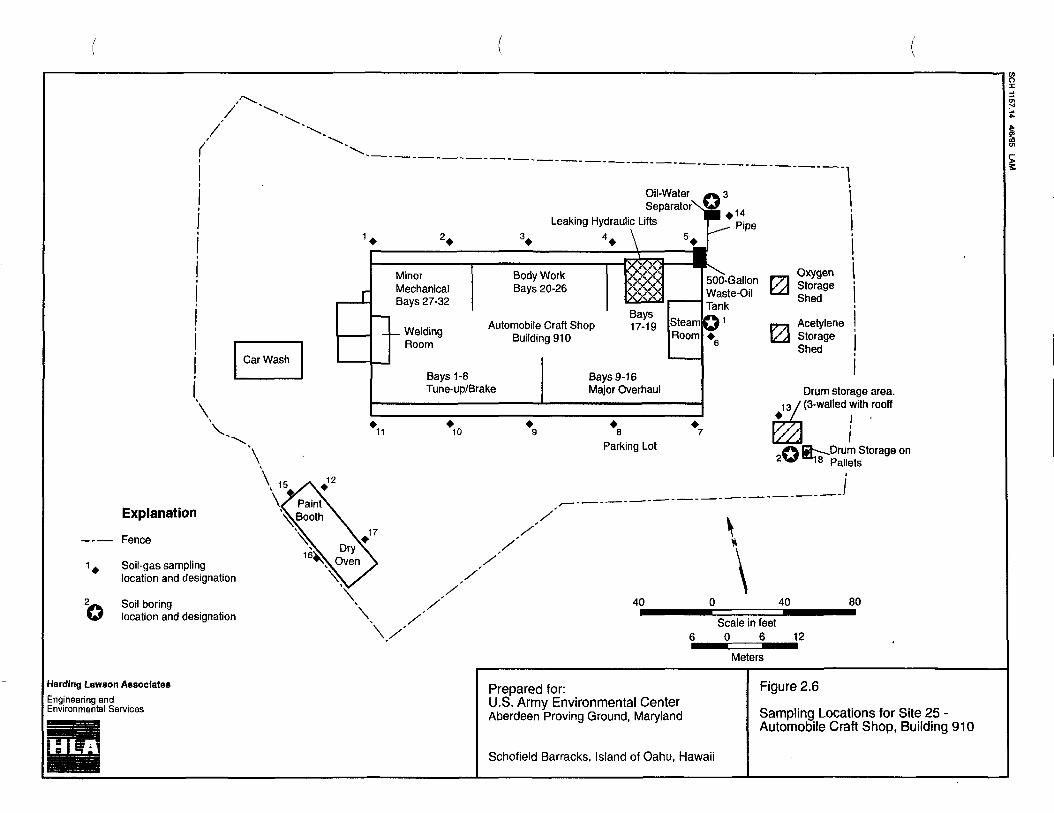
/ \/ \
< \. .
Oil-Water g^ 3SeparatorXg
Leaking Hydraulic Lifts ^~ Pjpe
1* 2* 3+ *+ \ 5+[\ •
Minor Body Work S8S< "T_ Mechanical Bays 20-26 OsXX
— . Baysi/u»Min/. Automobile Craft Shop 17-19 steam
M BllllHmnC)10 HOOm
Rayg i-R BayG 916Tune-up/Brake Major Overhaul
\
\. *11 *10 % *8 47
-. Parking Lot
\V^Explanation ^Booth\ / '^~
Fence \v \* /'A Dry\ /
14 Soil-gas sampling ^NyOven \ /location and designation v^^ -^
2^ Soil boring \ /' 40
\/ 6••
Harding Lawson Associates Prepared fOP
ISrLTservices U:S -Army Environmental Center^^^^s Aberdeen Proving Ground, Maryland
" ^™»
I '
S?°f an? 0 StorageWaste-0.1 1^3 Sheda
Tank •
51 p— Acetylene*B L^J Storage
6 Shed
Drum storage area.1 3 / (3-walled with rooff
f\ g- Drum Storage on2%f 18 pa||ets
I
0 40 80
Scale in feet0 6 12
Meters
Figure 2.6
Sampling Locations for Site 25 -Automobile Craft Shop, Building 910
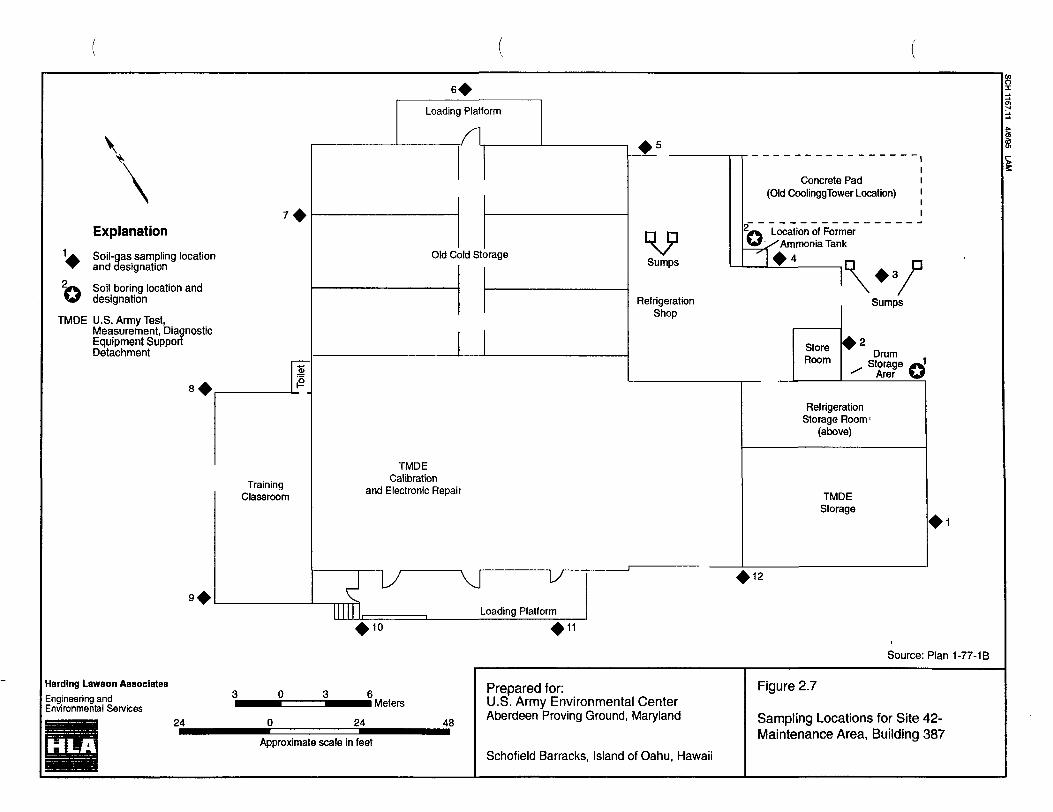
Explanation
IA Soil-gas sampling location" and designation
Soil boring location anddesignation
TMDE U.S. Army Test,Measurement, DiagnosticEquipment SupportDetachment
TrainingClassroom
Loading Platform
Old Cold StorageSumps
RefrigerationShop
Concrete Pad(Old CoolinggTower Location)
© Location of Former>^ Ammonia Tank
TMDECalibration
and Electronic Repair
StoreRoom
Sumps
DrumStorage
Arer
RefrigerationStorage Room'
(above)
TMDEStorage
\JLoading Platform
10
Source: Plan 1-77-1B
Harding Lawson Associates
Engineering andEnvironmental Services I Meters
24 24 48
Approximate scale in feet
Prepared for:U.S. Army Environmental CenterAberdeen Proving Ground, Maryland
Schofield Barracks, Island of Oahu, Hawaii
Figure 2.7
Sampling Locations for Site 42-Maintenance Area, Building 387
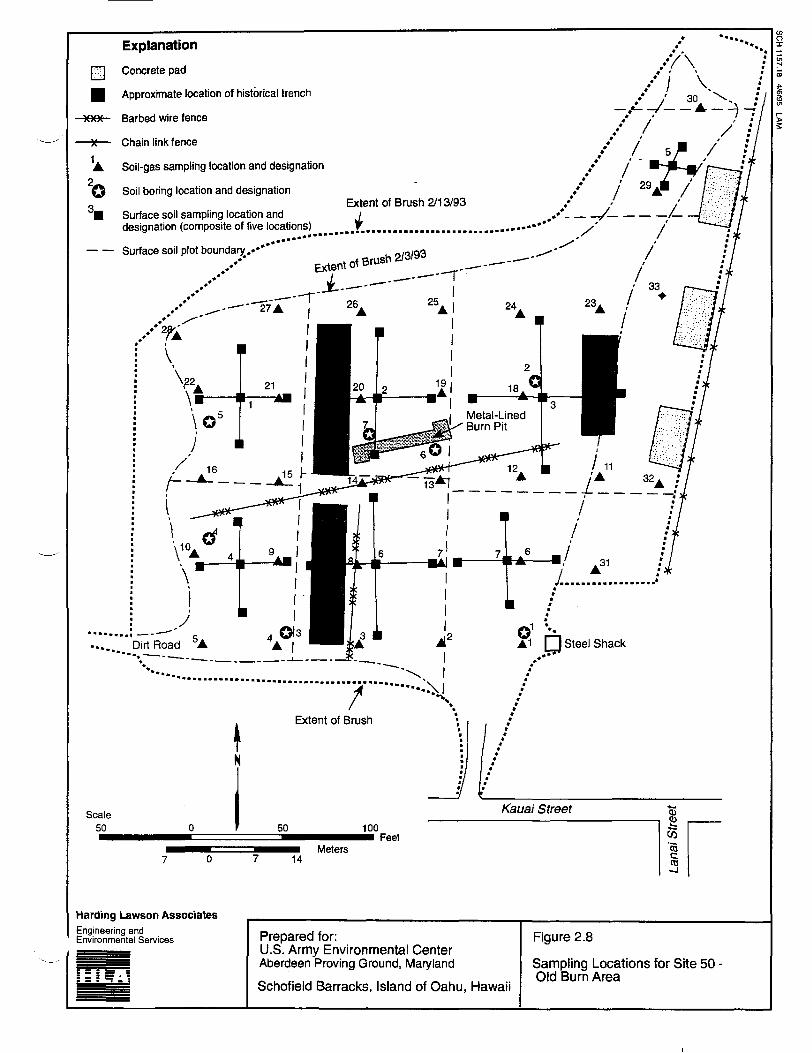
Explanation
Concrete pad
•\f\f^eAAA "
Concrete pad
Approximate location of historical trench
Barbed wire fence
10
Chain link fence
Soil-gas sampling location and designation
Soil boring location and designationExtent of Brush 2/13/93
Surface soil sampling location and /designation (composite of five locations) f. ,
• Surface soil plot boundary..'*"" 9/3/93
^»* _ i_rt+ d\ 0rus«'# cXi.61''-v' ,^—
V
••••• • H Feet^m Meters
14
Harding Lawson AssociatesEngineering andEnvironmental Services Prepared for:
U.S. Army Environmental CenterAberdeen Proving Ground, Maryland
Schofield Barracks, Island of Oahu, Hawaii
Figure 2.8
Sampling Locations for Site 50 •Old Burn Area
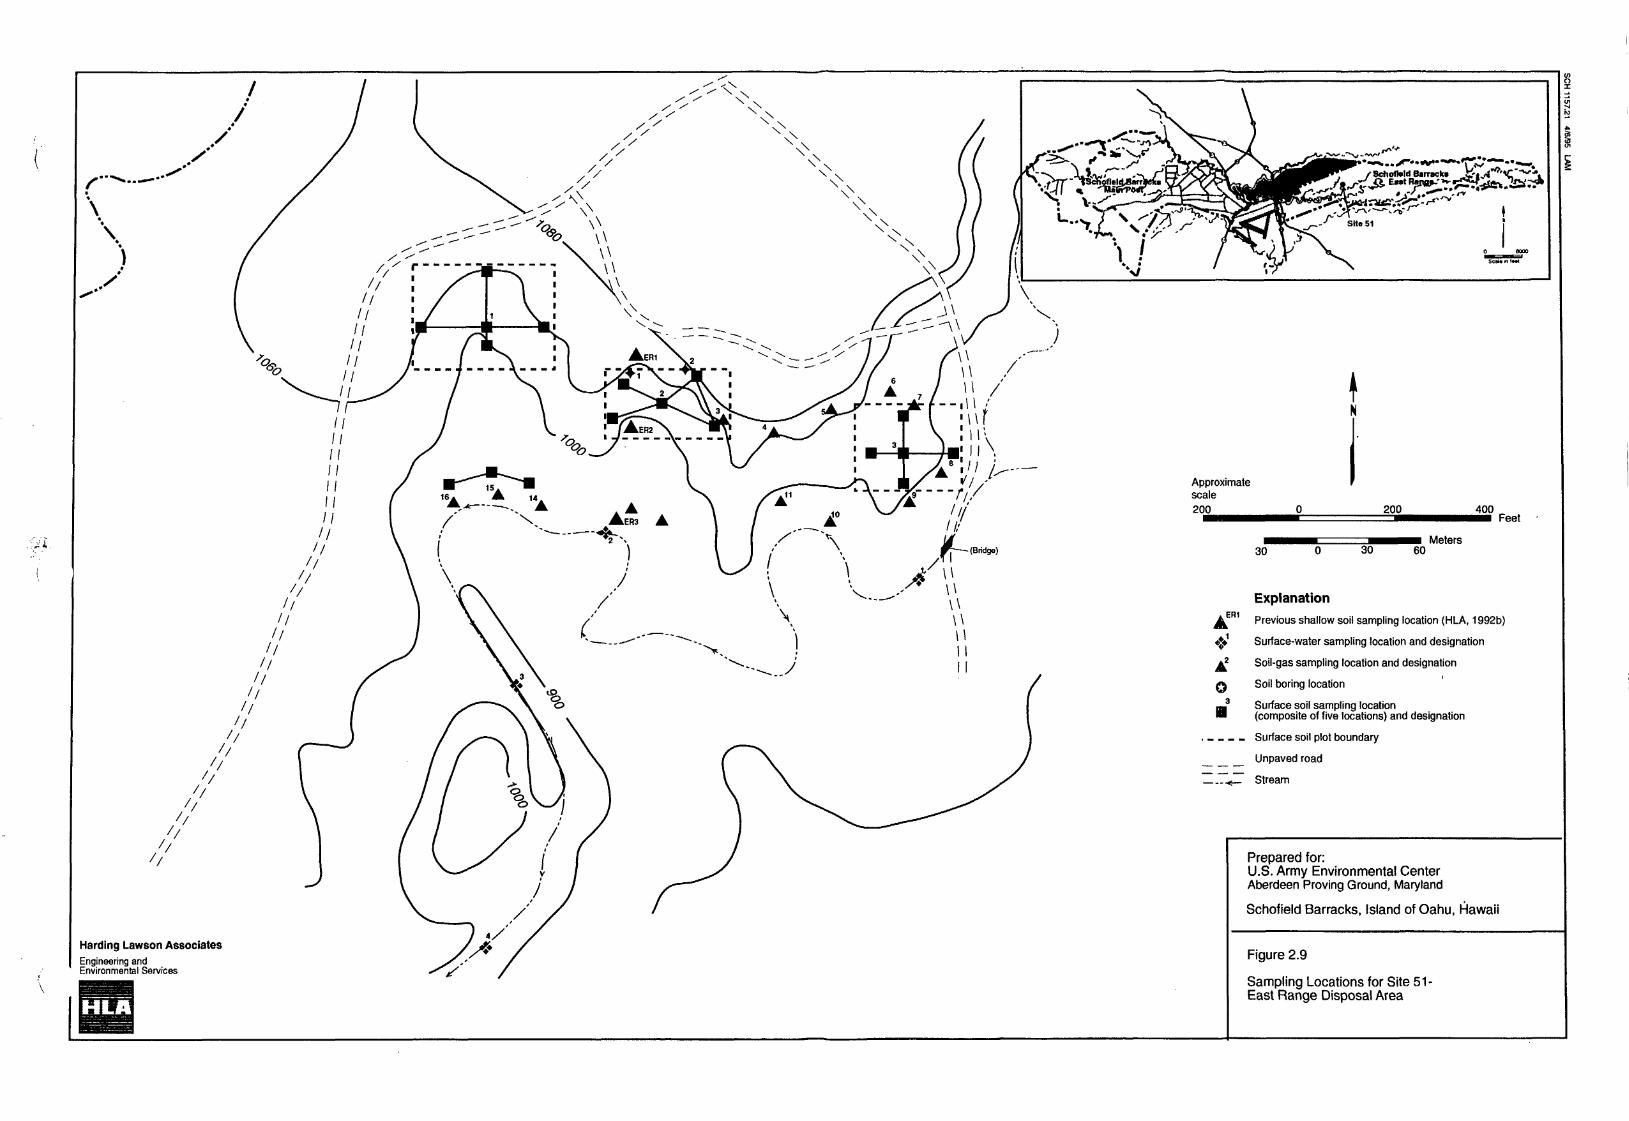
':',? A.
200 400Feet
30 60Meters
Harding Lawson AssociatesEngineering andEnvironmental Services
ExplanationER1
Previous shallow soil sampling location (HLA, 1992b)
^ Surface-water sampling location and designation
^ Soil-gas sampling location and designation
Q Soil boring location
_3 Surface soil sampling location• (composite of five locations) and designation
. _ _ _ _ Surface soil plot boundary
Unpaved road
Z .T IT Stream
Prepared for:U.S. Army Environmental CenterAberdeen Proving Ground, Maryland
Schofield Barracks, Island of Oahu, Hawaii
Figure 2.9
Sampling Locations for Site 51-East Range Disposal Area
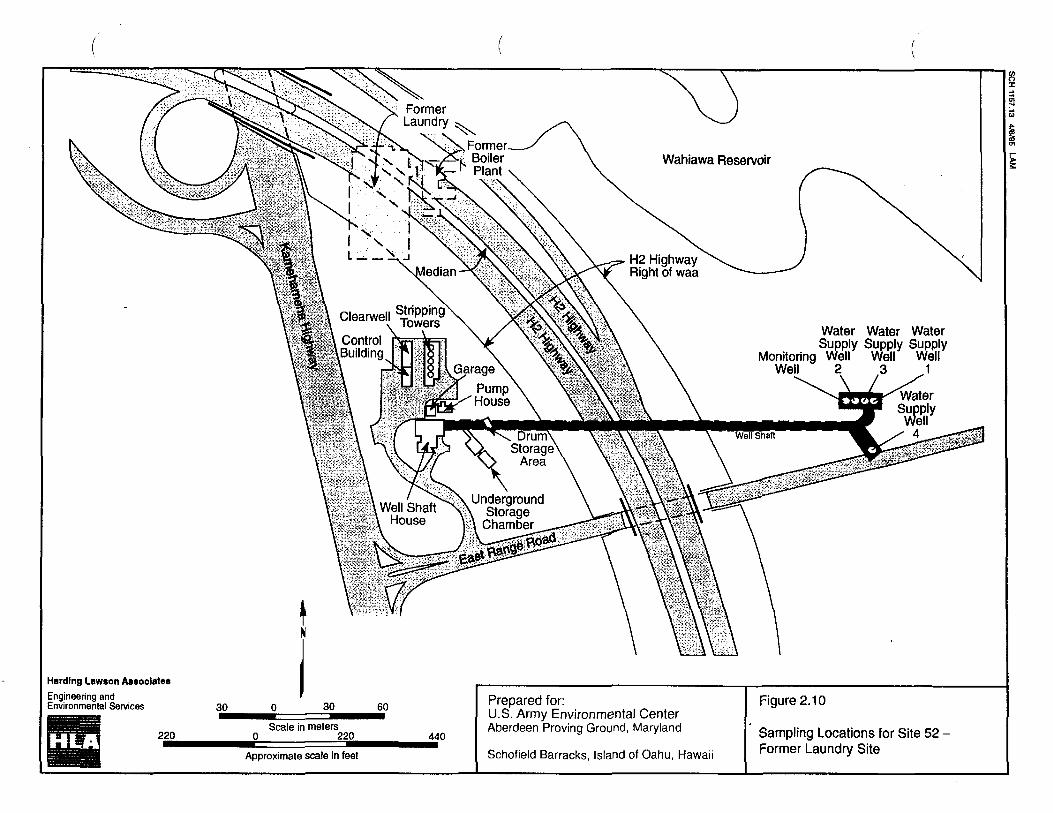
FormerLaundry 5.
i N ;>, Formerr Boiler
r-f PlantWahiawa Reservoir
H2 HighwayRight of waa
Water Water WaterSupply Supply Supply
Monitoring Well Well Well
rumStorage
Area
We,,Sha« \U1Sn
House N x a
Harding Lawson Associate*
Engineering andEnvironmental Services Prepared for:
U.S. Army Environmental CenterAberdeen Proving Ground, Maryland Sampling Locations for Site 52
Former Laundry SiteSchofield Barracks, Island of Oahu, HawaiiApproximate scale in feet
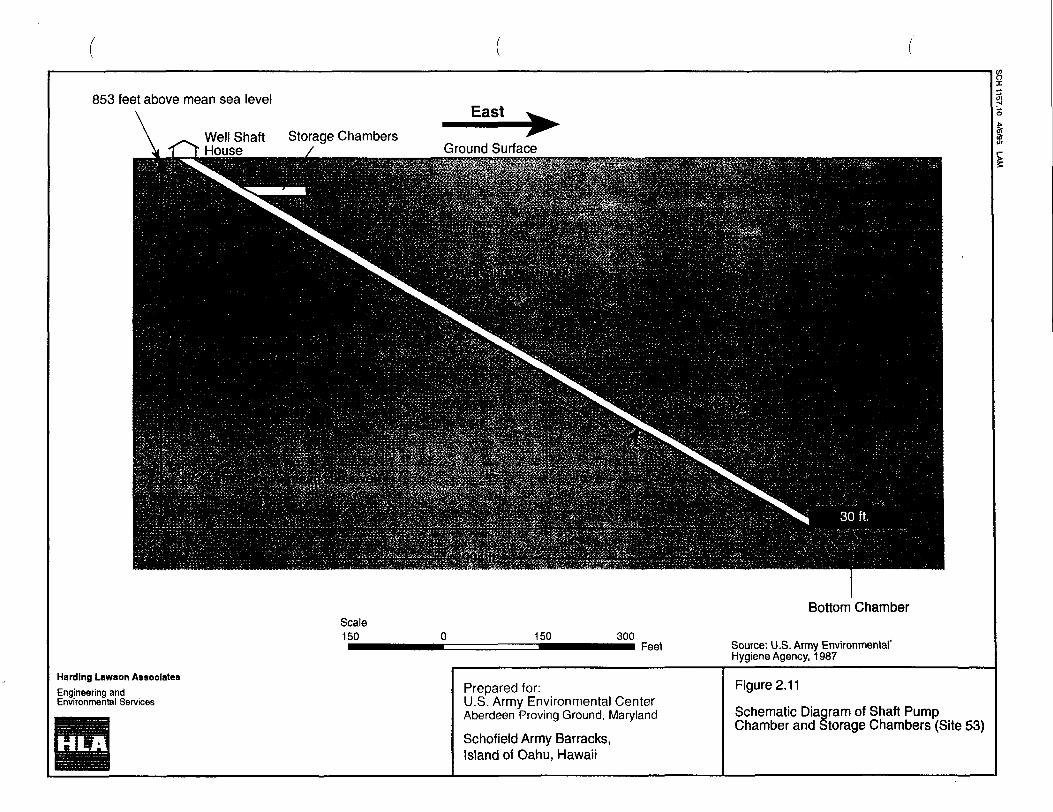
853 feet above mean sea levelEast•••1M
Ground SurfaceWell Shaft Storage ChambersHouse
053
Scale150 150 300
Feet
Bottom Chamber
Source: U.S. Army Environmental'Hygiene Agency, 1987
Harding Lawson Associates
Engineering andEnvironmental Services
Prepared for:U.S. Army Environmental CenterAberdeen Proving Ground, Maryland
Schofield Army Barracks,Island of Oahu, Hawaii
Figure 2.11
Schematic Diagram of Shaft PumpChamber and Storage Chambers (Site 53)
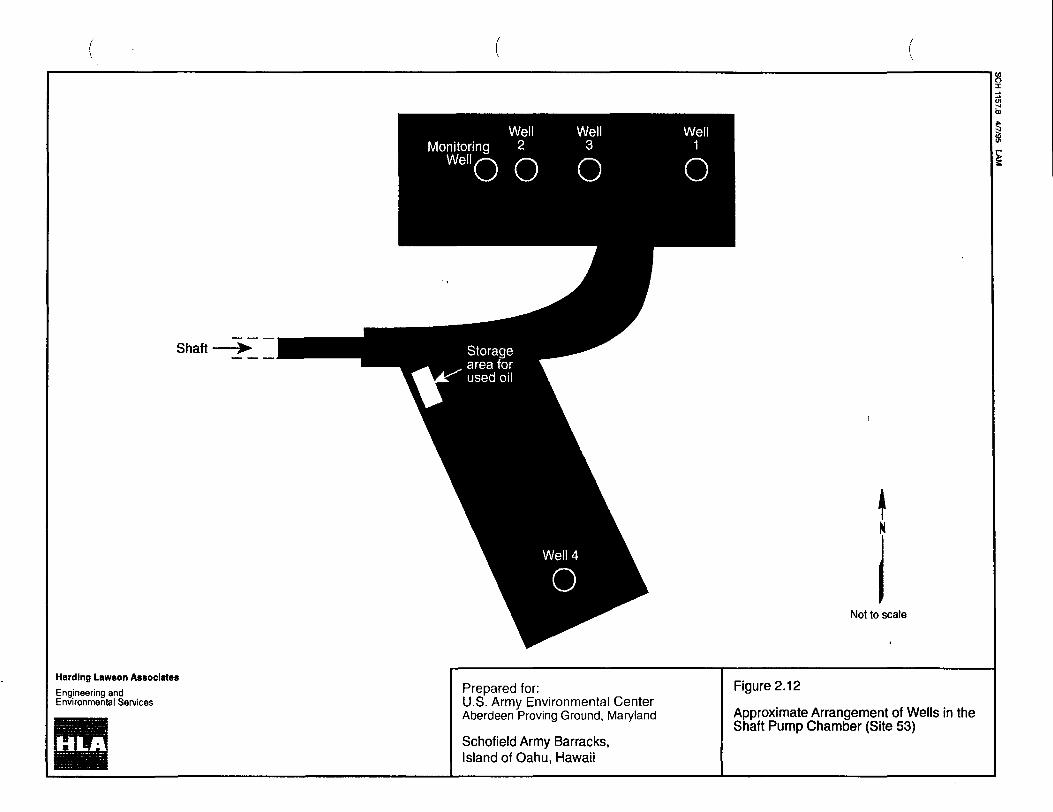
Shaft
Not to scale
Harding Lawson Associates
Engineering andEnvironmental Services
HLA
Prepared for:U.S. Army Environmental CenterAberdeen Proving Ground, Maryland
Schofield Army Barracks,Island of Oahu, Hawaii
Figure 2.12
Approximate Arrangement of Wells in theShaft Pump Chamber (Site 53)
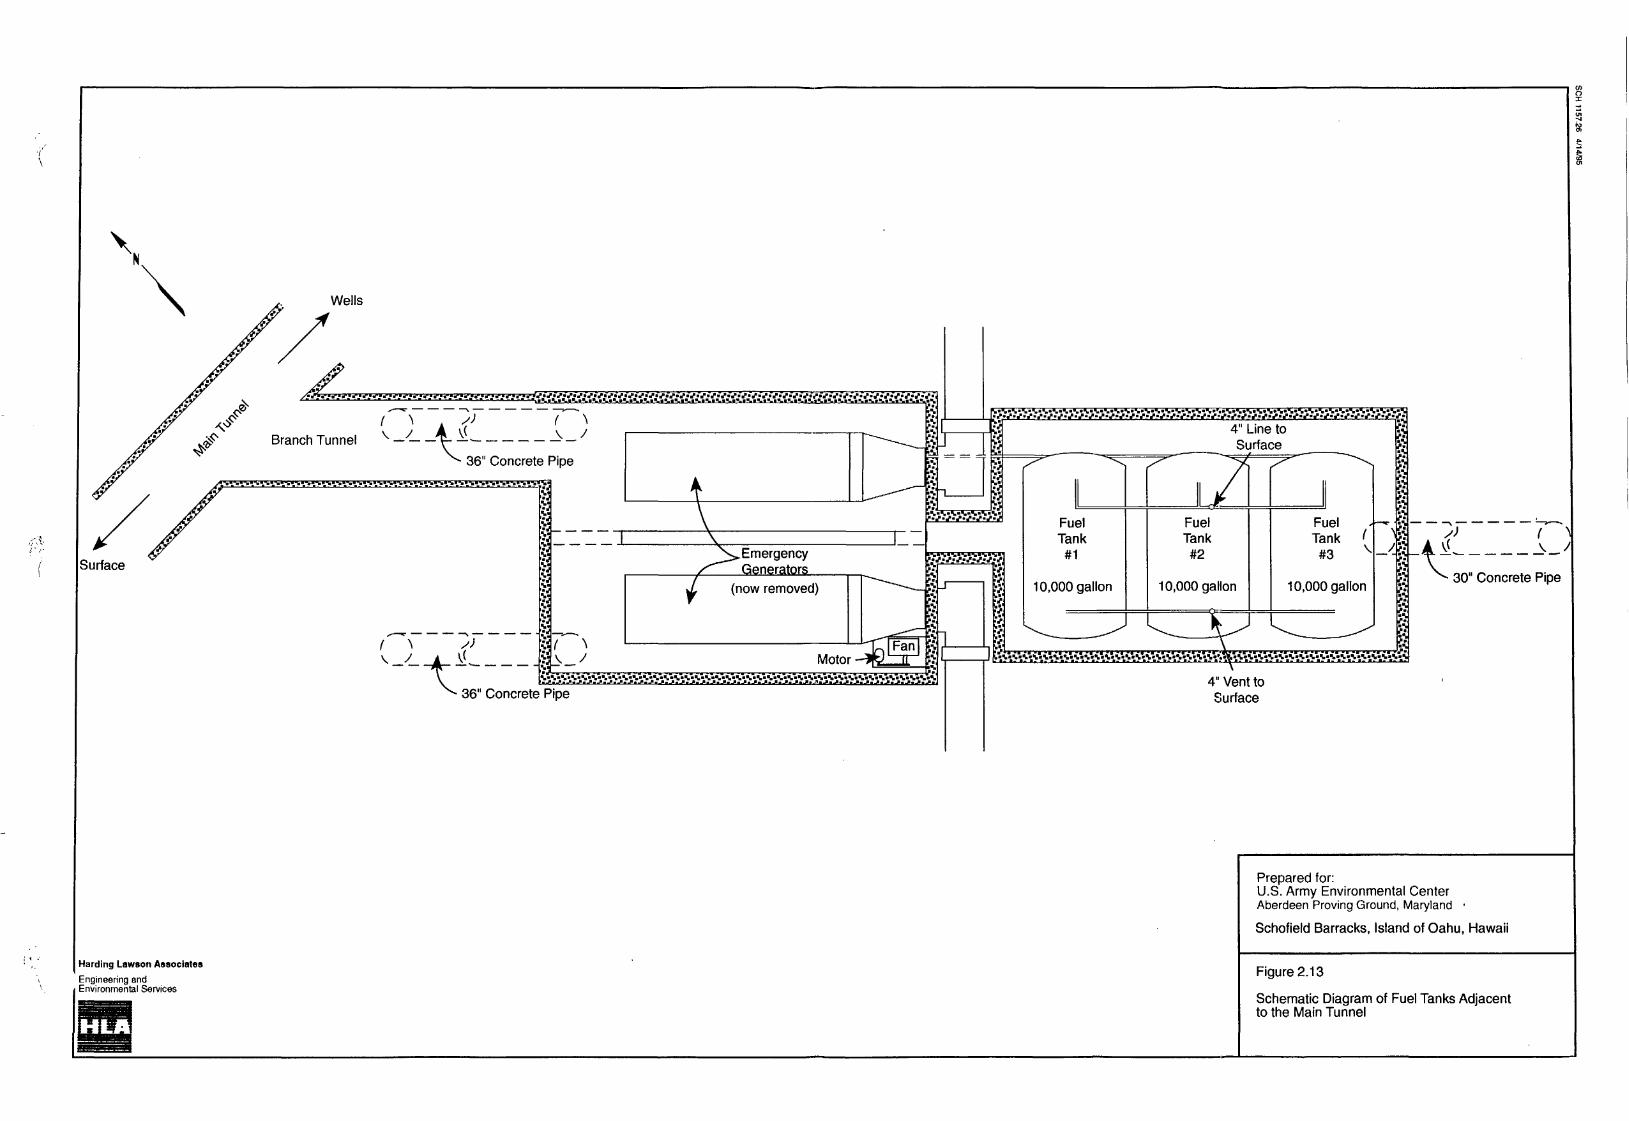
Surface
Harding Lawson Associates
Engineering andEnvironmental Services
Wells
Branch Tunnel V _/__A_ t f . \_yV^ 36" Concrete Pipe
<-^.—t
iGenerators
(now removed)
MotorijSjSj%'lVjS"l%j%jls^%^^y^Sj%^ jSjV \ s^^^SjS^s^^S';S^Si»Si 'S»%'S'S^»S'S'S
36" Concrete Pipe
30" Concrete Pipe
Prepared for:U.S. Army Environmental CenterAberdeen Proving Ground, Maryland •
Schofield Barracks, Island of Oahu, Hawaii
Figure 2. 13
Schematic Diagram of Fuel Tanks Adjacentto the Main Tunnel
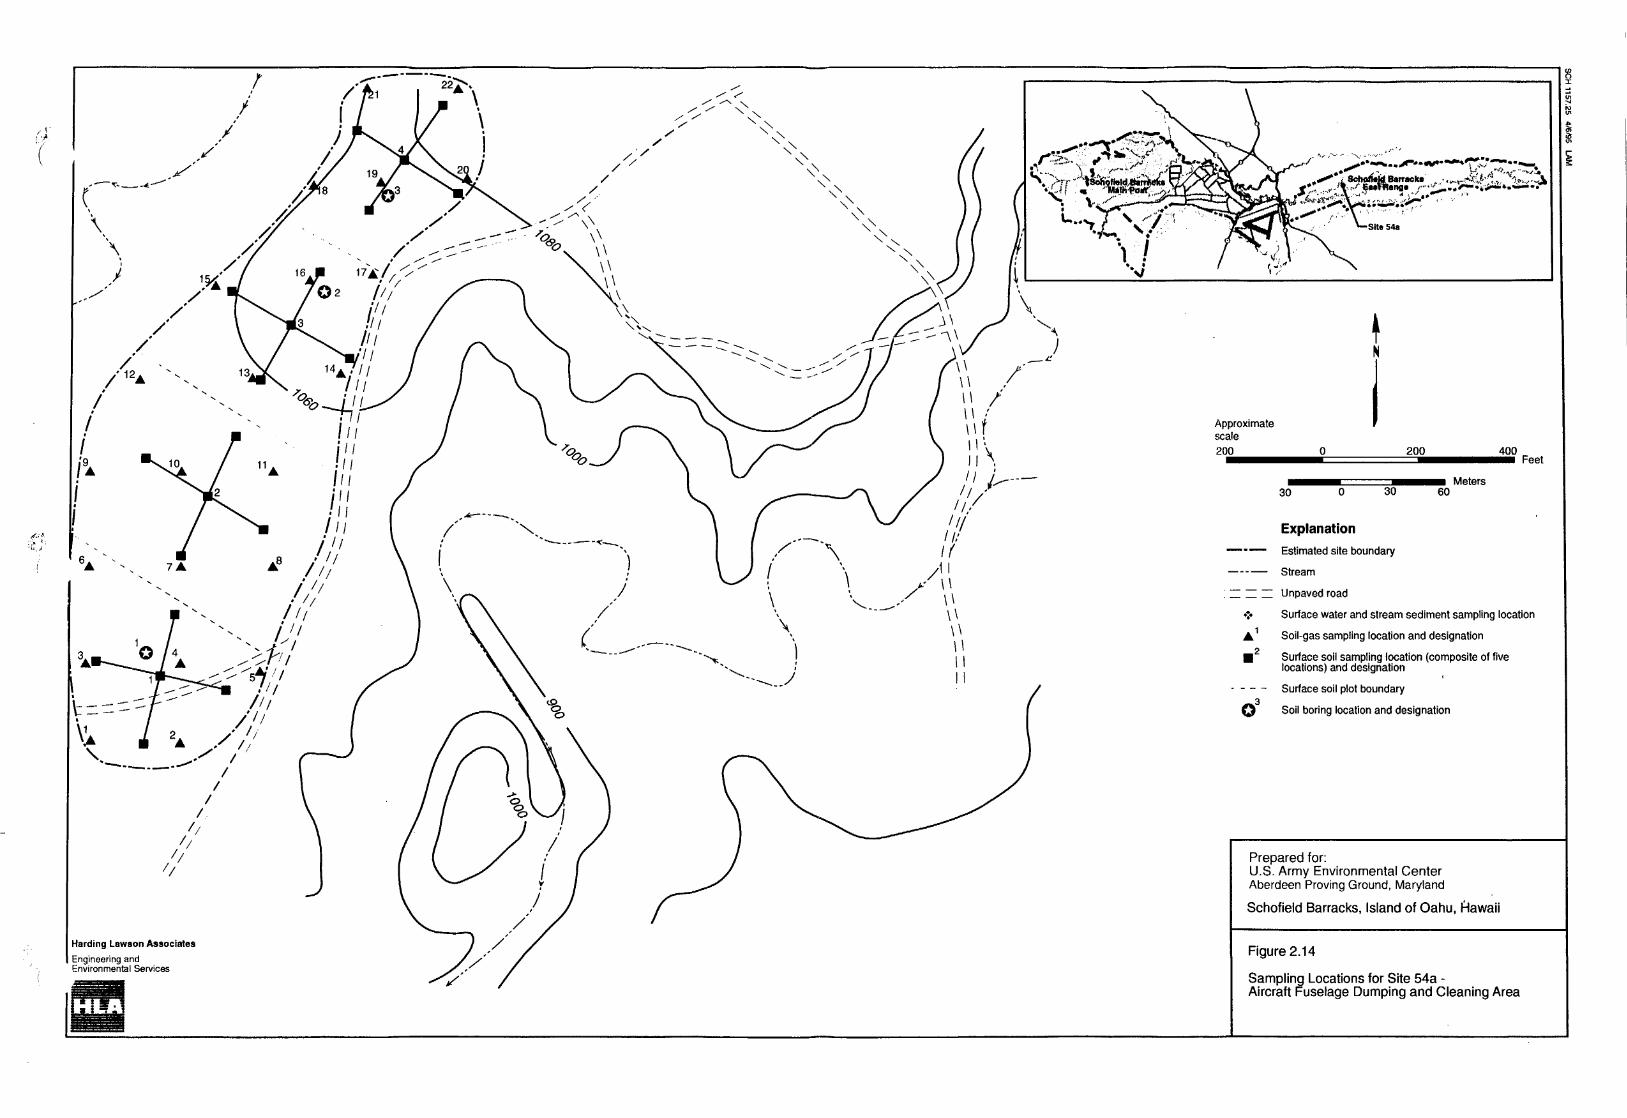
Engineering andEnvironmental Services
tii/jiWmms*9
200 400Feet
30 60Meters
Explanation
Estimated site boundary
Stream
; H ~ ~ Unpaved road
•> Surface water and stream sediment sampling location
A1 Soil-gas sampling location and designation2
• Surface soil sampling location (composite of fivelocations) and designation
Surface soil plot boundaryA3
Q Soil boring location and designation
Prepared for:U.S. Army Environmental CenterAberdeen Proving Ground, Maryland
Schofield Barracks, Island of Oahu, Hawaii
Figure 2.14
Sampling Locations for Site 54a -Aircraft Fuselage Dumping and Cleaning Area
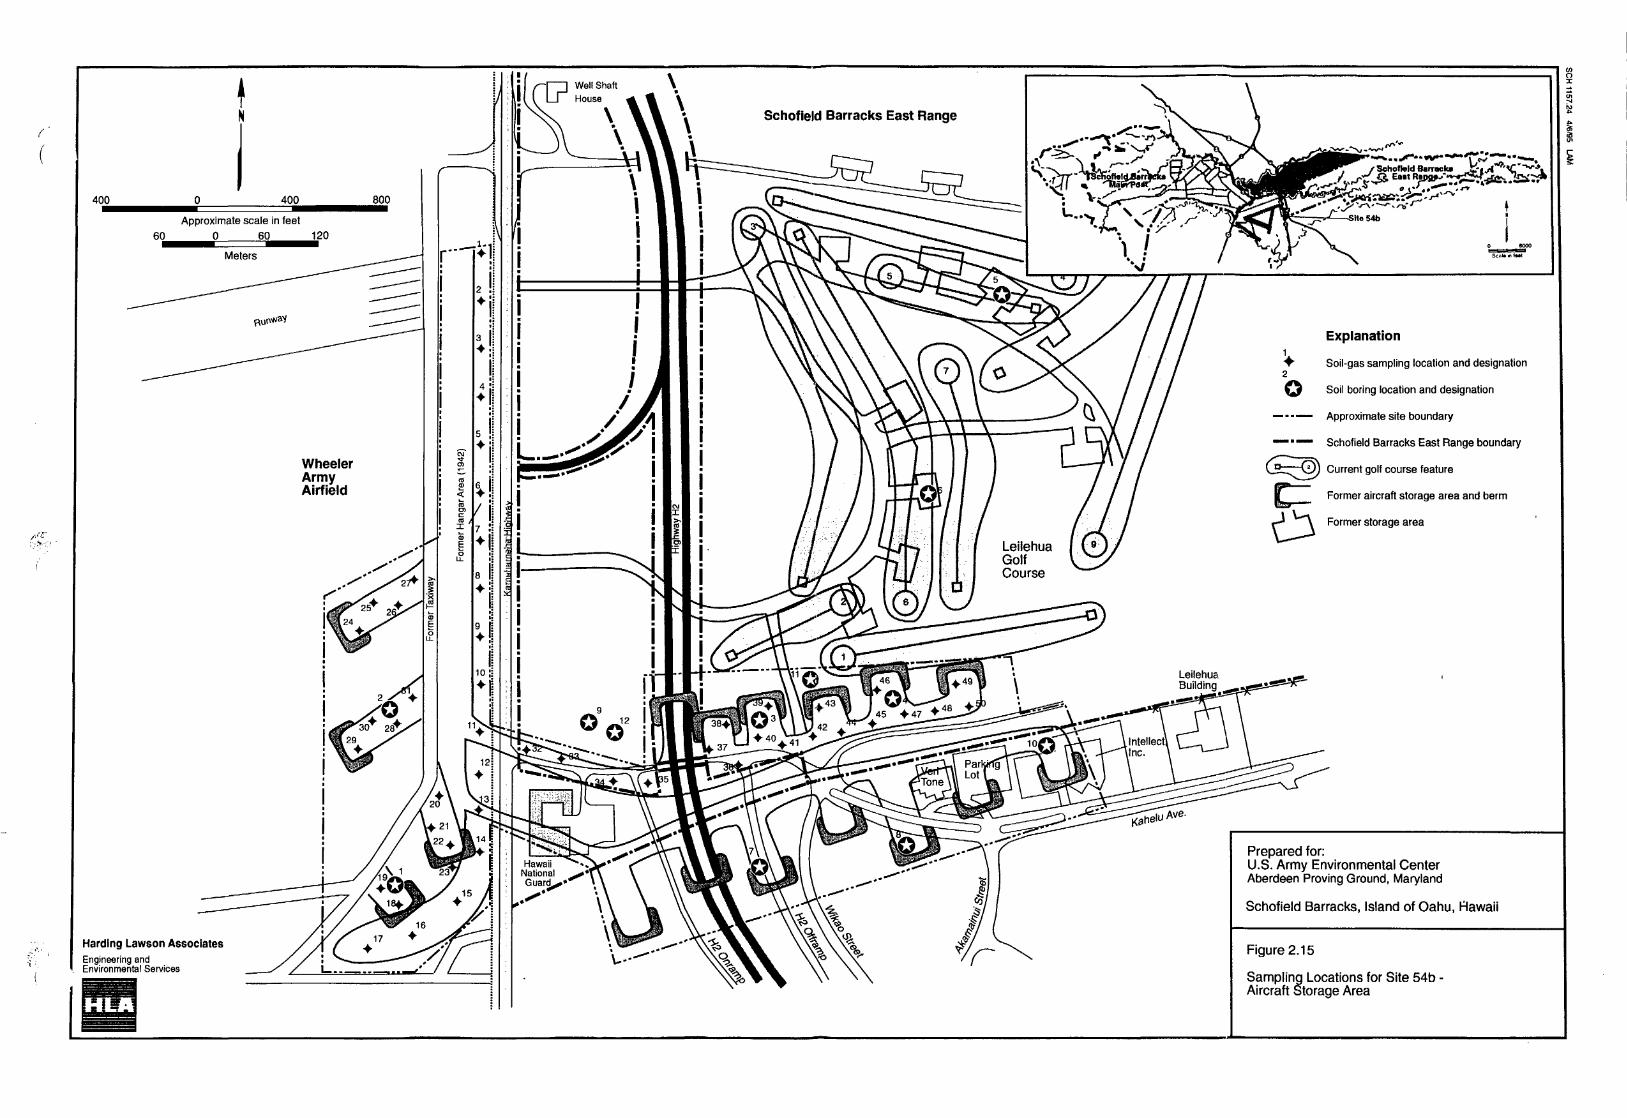
fSchofield Barracks East Range
400 400 800
Approximate scale in feet60 0 J30 120
Meters
flunky
./^ S
Harding Lawson AssociatesEngineering andEnvironmental Services
WheelerArmyAirfield
Explanation1+ Soil-gas sampling location and designation2^5 Soil boring location and designation
Approximate site boundary
••• • •""• Schofield Barracks East Range boundary*•—•——^H_ CD) Current golf course featuremIf Former aircraft storage area and bermE^ " *""
&Former storage area
Prepared for:U.S. Army Environmental CenterAberdeen Proving Ground, Maryland
Schofield Barracks, Island of Oahu, Hawaii
Figure 2.15
Sampling Locations for Site 54b -Aircraft Storage Area
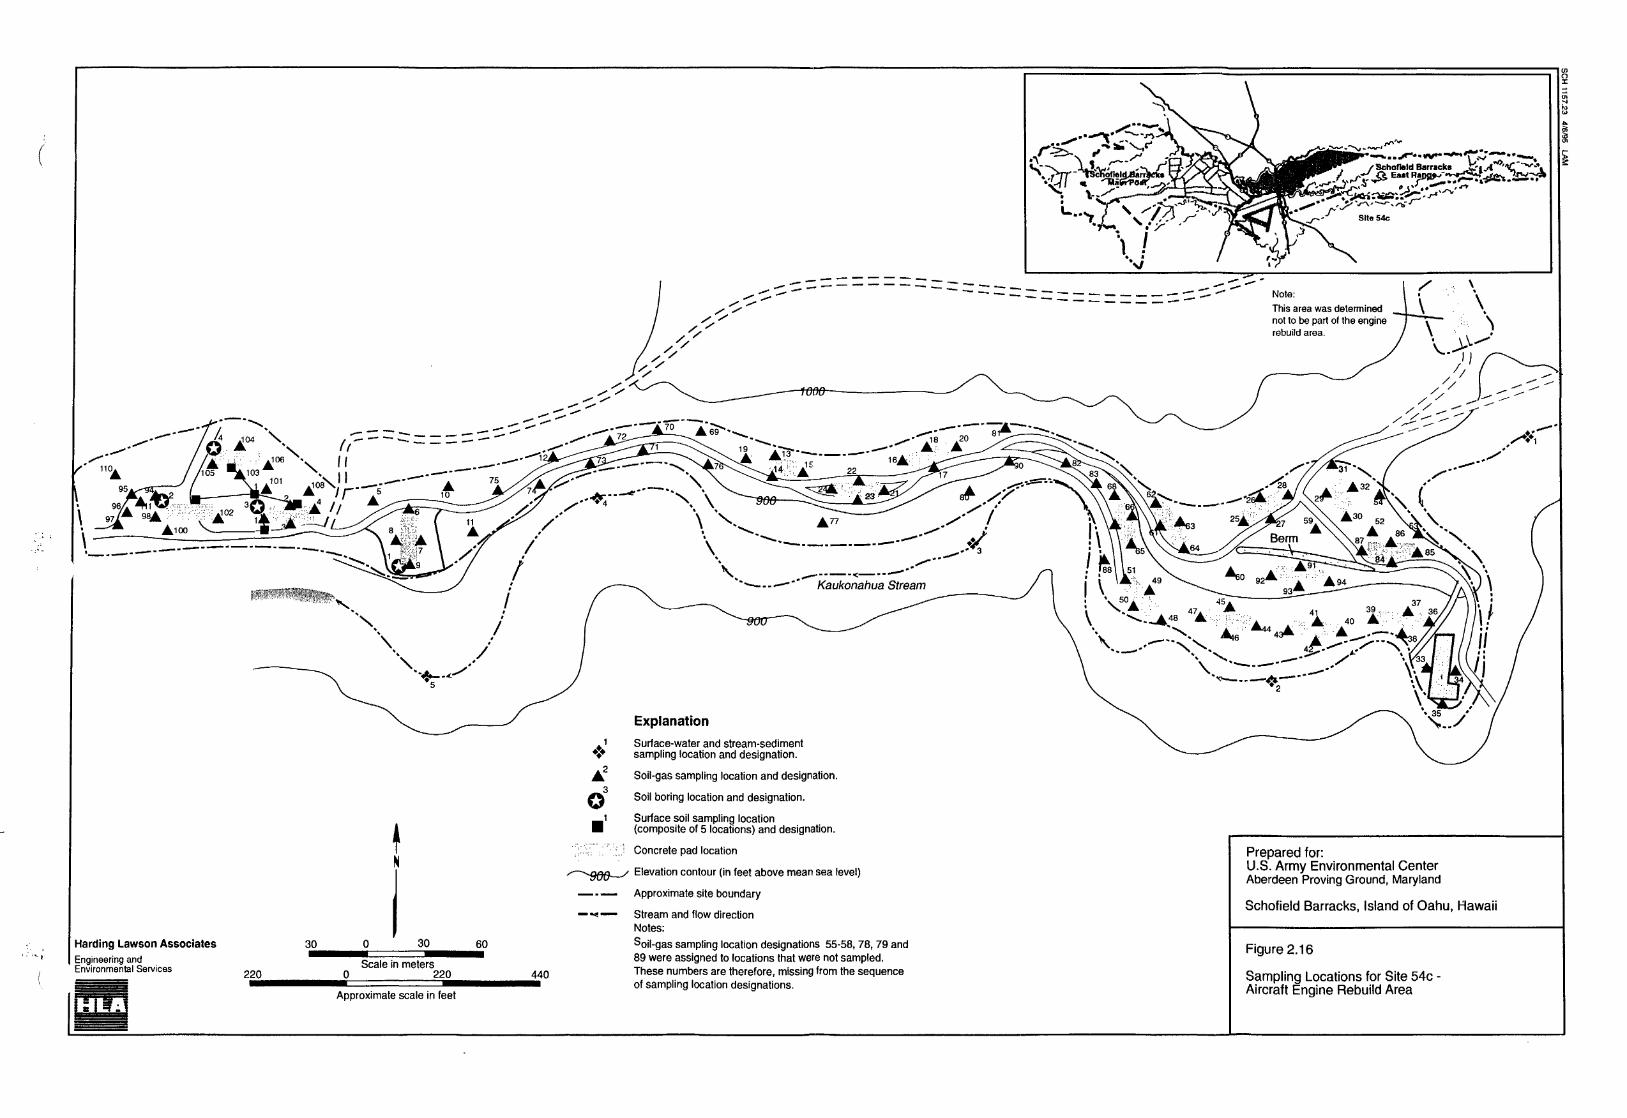
c Schoftold Barracks C-i <*"/>"\C~"'v*'
Kaukonanua Stream
Explanation
O
Harding Lawson AssociatesEngineering andEnvironmental Services
HLA
30
220
30
=•Scale in meters
60
220 440
Approximate scale in feet
Surface-water and stream-sedimentsampling location and designation.
Soil-gas sampling location and designation.
Soil boring location and designation.
Surface soil sampling location(composite of 5 locations) and designation.
Concrete pad location
Elevation contour (in feet above mean sea level)
Approximate site boundary
Stream and flow directionNotes:
^oil-gas sampling location designations 55-58, 78, 79 and89 were assigned to locations that were not sampled.These numbers are therefore, missing from the sequenceof sampling location designations.
Prepared for:U.S. Army Environmental CenterAberdeen Proving Ground, Maryland
Schofield Barracks, Island of Oahu, Hawaii
Figure 2.16
Sampling Locations for Site 54c -Aircraft Engine Rebuild Area
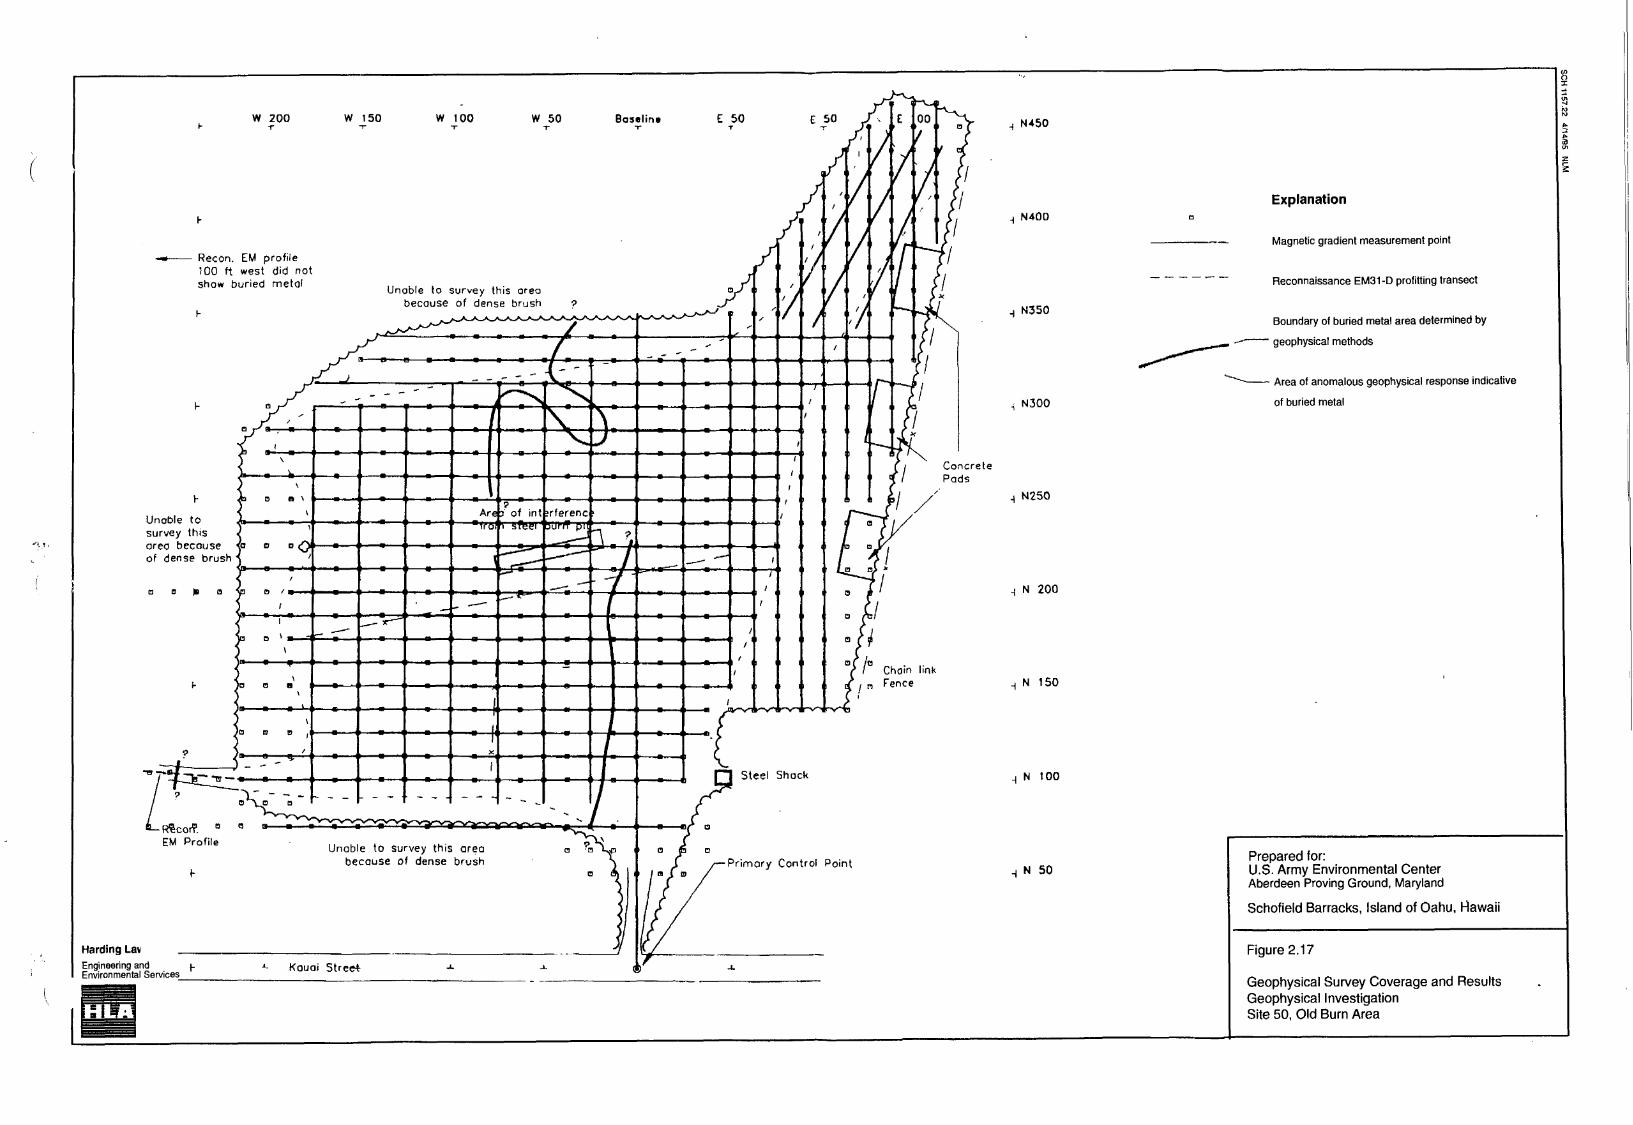
sW 200 W 150 W 100 W 50 Baseline E 50
Recon. EM profile100 ft west did notshow buried metol Unable to survey this area
because of dense brush ?
ConcretePads
Harding Lav
Engineering andEnvironmental Services
o o • o V B /
Unoble to survey this areabecause of dense brush
H N450
N40D
N350
, N300
N250
Unoble tosurvey thisareo becauseof dense brush
N 200
-I N 150
N 100
N 50
Explanation
Magnetic gradient measurement point
Reconnaissance EM31-D profitting transect
Boundary of buried metal area determined by
' geophysical methods
- Area of anomalous geophysical response indicative
of buried metal
Prepared for:U.S. Army Environmental CenterAberdeen Proving Ground, Maryland
Schofield Barracks, Island of Oahu, Hawaii
Figure 2.17
Geophysical Survey Coverage and ResultsGeophysical InvestigationSite 50, Old Burn Area
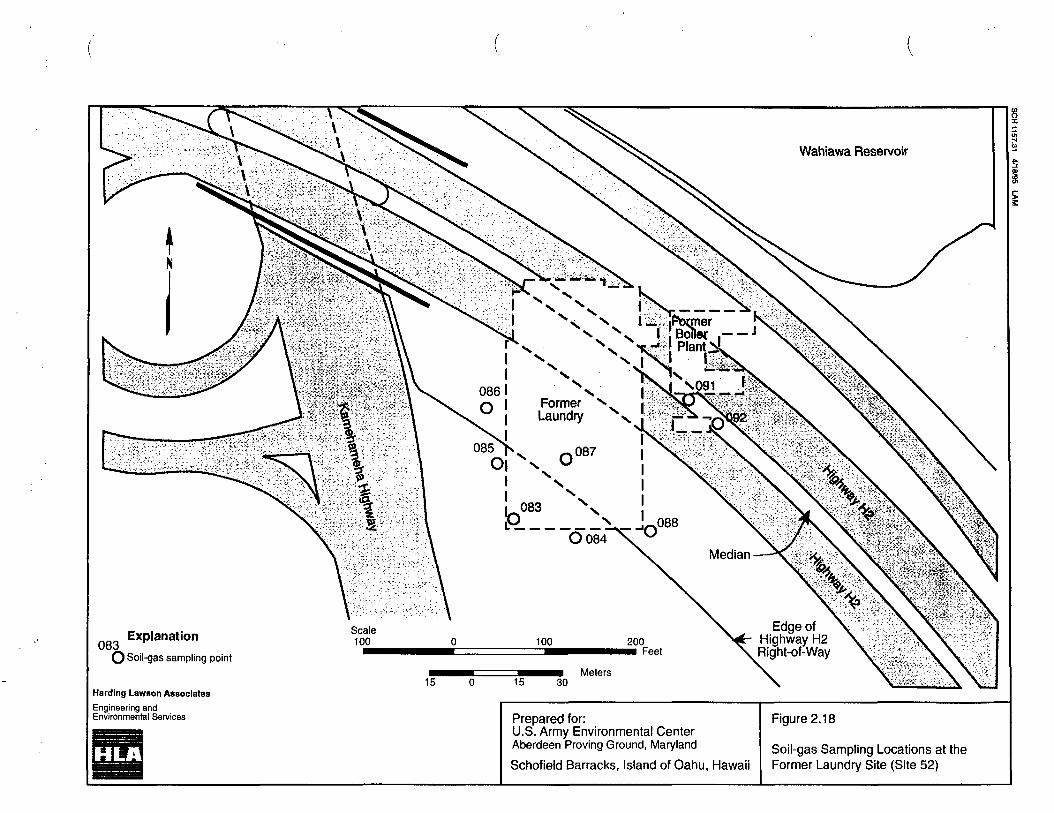
Edge ofHighway H2Right-of-Way
083 ExP'anation
O Soil-gas sampling point
Harding Lawson Associates
Engineering andEnvironmental Sen/ices
15 15 30
Prepared for:U.S. Army Environmental CenterAberdeen Proving Ground, Maryland
Schofield Barracks, Island of Oahu, Hawaii
Figure 2.18
Soil-gas Sampling Locations at theFormer Laundry Site (Site 52)
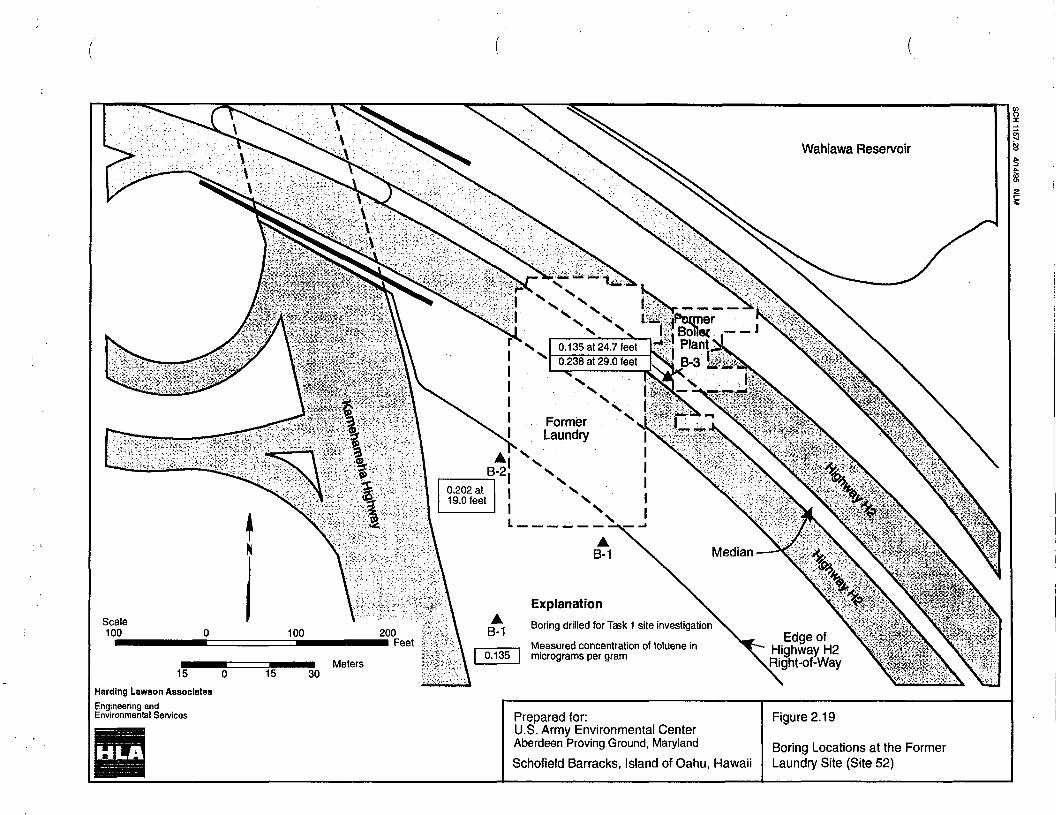
Wahiawa Reservoir
0.135 at 24.7 feet
0.238 at 29.0 feet
FormerLaundry
Boring drilled for Task 1 site investigationEdge of
Highway H2Right-of-Way
Measured concentration of toluene inmicrograms per gram
15 0
Harding Lawson Associates
Engineering andEnvironmental Services
15
HLA
Prepared for:U.S. Army Environmental CenterAberdeen Proving Ground, Maryland
Schofield Barracks, Island of Oahu, Hawaii
Figure 2.19
Boring Locations at the FormerLaundry Site (Site 52)
Appendix A
SYNOPSIS OF COMMUNITY RELATIONS ACTIVITIES
Appendix A
May 1985 - Schofield Barracks issued a press release regarding the detection of Trichloroethylene (TCE)in the Schofield Barracks Supply wells and the temporary switch to city and county water -supplies.
August 1990 - Schofield Barracks issued a press release regarding the placement of the installation on theNational Priorities List (NPL).
October 1990 - Schofield Barracks Public Affairs Office and Environmental Office addressed the WahiawaNeighborhood Board regarding Army plans to conduct investigations on Schofield Barracks to identifysources of TCE.
January 1992 - Schofield Barracks and U.S. Army Toxic and Hazardous Materials Agency (USATHAMA)submitted press releases requesting public involvement in locating the source(s) of TCE contamination inand around Schofield Barracks.
January 1992 - Schofield Barracks and USATHAMA conducted interviews with twenty local residents toassist in the development of a Community Relations Plan for the Schofield Barracks InstallationRestoration Program (IRP).
June 1992 - The Army finalized the Community Relations Plan for Schofield Barracks and placed copiesin the newly established information repositories located in the Milliard Public Library, the WahiawaPublic Library, The Hawaii Department of Health, and the Directorate of Public Works in Building 300 ofWheeler Army Airfield.
February 25, 1993 - Schofield Barracks and the Army Environmental Center (AEG) conducted a publicmeeting at the Hale Koa at Wahiawa District Park in Wahiawa to provide the public with an update onthe IRP and the results of the first phase of the investigations.
February 1993 - In conjunction with the public meeting, the Army published and distributed a fact sheetthat provided an update on the IRP and initial investigative results.
September 13 and 14, 1994 - Schofield Barracks and the AEG conducted public availability sessions atthe Hale Koa at Wahiawa District Park (September 13) and at the Schofield Barracks Post Library(September 14) to provide an update on the IRP.
September 13 and 14, 1994 - In conjunction with the public availability sessions, the Army solicitedinterest in the formation of a Restoration Advisory Board (RAB) comprised of local citizen representa-tives, Army representatives, and regulatory agency representatives that would oversee the conduct of theArmy's IRP at Schofield Barracks.
September 12 through 14, 1994 - The Army presented a poster display that summarized installationrestoration efforts and plans for Schofield Barracks at the 1st Hawaii National Technologies Conferencesponsored by the Hawaii Department of Health
September 1994 - In conjunction with the public availability session, the Army published and distributeda fact sheet that provided an update on the IRP and initial investigative results.
July 7 through August 6, 1995 - Schofield Barracks conducted a public review period for the ProposedPlan for Operable Unit 1.
July 18, 1995 - Schofield Barracks and the AEG conducted a public meeting to present the Operable Unit1 Proposed Plan and solicit public comments.
2250412.04.00 Harding Lawson Associates A-10927092995 ROD