Embed Size (px)
Citation preview
FORMULATION OF GIS BASED MASTER PLANSFOR AMRUT CITIES
Design and Standards
DRAFTAugust 2015
Town & Country Planning OrganisationMinistry of Urban Development
Government of India&
National Remote Sensing CentreDeptt. Of Space
Government of India

© Ministry of Urban Development
Table of Contents
Serial No. Contents Page No.
1. Introduction 12. Need for the revision of existing NUIS Design and
Standards2
2.1 Formulation of GIS based Master Plan for AMRUT Cities 23 Elements of Standards 3
3.1 Remote Sensing Image Standards 33.1.1 Raw Image Standards 33.1.2 Ground Control Points (GCPs) Standards required for
photogrammetric block adjustment and ortho-rectification of satellite data
4
3.1.3 Ortho-Rectification of Satellite Data Standards 53.2 Spatial Reference Standards 6
3.2.1 Co- ordinate System 63.2.2 Map sheet Frame for Hard copy Prints 7
3.3 Feature content - spatial and attribute data standards 73.3.1 Spatial Data Content Standards 73.3.2 Spatial Attribute Information 253.3.3 Accuracy Standards 32
3.4 GIS database standards 323.5 GIS database dissemination to ULBS for master plan
formulation43
3.6 Metadata standards 454 Indicative Format for Urban Data Collection 47
Formulation of GIS based Master Plan for AMRUT Cities – Design & Standards
LIST OF FIGURESFigure 1: World Map Series TemplateFigure 2: Bhuvan-NUIS based architecture for GIS database dissemination to ULBs in
compliance to OGC standardsLIST OF TABLESTable 1: Base LayerTable 2: Urban Land use LayerTable 3: Building Footprint Layer with UseTable 4: Water Supply Network LayerTable 5: Storm Water Drainage Network LayerTable 6: Sewerage Network LayerTable 7: Electricity Supply Network LayerTable 8: DEM LayerTable 9: Contour LayerTable 10: Cadastral LayerTable 11: Administrative Boundary LayerTable 12: Ground Control Points (GCPs) LayerTable 13: Attributes for Road LayerTable 14: Attributes for Rail LayerTable 15: Attributes for Bridges / FlyoversTable 16: Attributes for WaterbodiesTable 17: Attributes for Community ToiletTable 18: Attributes for Fire StationTable 19: Attributes for Garbage Collection PointsTable 20: Attributes for Landfill Sites and Dumping YardTable 21: Attributes for Cell TowersTable 22: Attributes for SlumsTable 23: Attributes for Bus StopsTable 24: Attributes for BuildingsTable 25: Attributes for Water Treatment PlantTable 26: Attributes for Water Pumping StationTable 27: Attributes for Water Supply NetworkTable 28: Attributes for Overhead TanksTable 29: Attributes for Storm water Drainage NetworkTable 30: Attributes for Sewerage NetworkTable 31: Attributes for Electrical Supply NetworkTable 32: Attributes for TransformersTable 33: Attributes for Street LightsTable 34: Attributes for Cadastral LayerTable 35: Attributes for Municipal Boundary LayerTable 36: Attributes for Ward Boundary LayerTable 37: Attributes for Tax Zone boundary Layer
Formulation of GIS based Master Plan for AMRUT Cities – Design & Standards
Table 38: Structure for Base and Urban Land use Polygon (Base_ULU_Poly)Table 39: Structure for Road Centre Line (Road_CLine)Table 40: Structure for Road Carriageway & Right of Way (Rd_CW_ROW_Line)Table 41: Structure for Rail Line (Rail_Line)Table 42: Structure for Bridges & Flyovers (Brid_Fly_Line)Table 43: Structure for Community Toilet (Community_toilet)Table 44: Structure for Fire Station (Fire_Station)Table 45: Structure for Garbage Collection Points / Dumper (Garb_Coll_Pnt)Table 49: Structure for Bus Stop (Bus_Stop_Pnt)Table 50: Structure for Tree (Tree)Table 51:Structure for Other Urban Land use Points (ULU_Pnt) Table 52: Structure for Buildings (Building_footprint)Table 53: Structure forWater Supply Network (Water_NW_Line)Table 54: Structure for Water Supply Network Points (Water_NW_Pnt)Table 55: Structure for Storm water Drainage Network (Str_Drain_NW_Line)Table 56: Structure for Storm water Drainage Network Points (Str_Drain_NW_Pnt)Table 57: Structure for Sewerage Network (Sew_NW_Line)Table 58: Structure for Sewerage NetworkPoints (Sew_NW_Pnt)Table 59: Structure for Electrical Supply Network (Elect_NW_Line)Table 60: Structure for Electrical Supply Network Points (Elect_NW_Pnt)Table 61: Structure for Contour layer (Contour_Line)Table 62: Structure for Cadastral Layer(Cadastre_Poly)Table 63: Structure for Administrative Boundary Layer(Admin_Bnd_Poly)Table 64: Structure for Ground Control Points(GCP_Pnt)
Formulation of GIS based Master Plan for AMRUT Cities – Design & Standards
LIST OF ANNEXURES
Annexure I: Constitution of Committee for Revision of NUIS Guidelines and Design StandardsAnnexure II: Brief DGPS survey methodAnnexure III: Indicative Format for Urban data collection
LIST OF APPENDIX
Appendix I: Guidelines for Filling the Format
AUTHORING TEAM
NRSC1. Dr. K. Venugopala Rao, Head, Urban Studies, NRSC2. Ms. S.V.L Bhavani, Scientist, NRSC3. Ms. J. Kamini, Scientist, NRSC
TCPO1. Shri K. K. Joadder, Chief Planner2. Shri Sompalle Surendra, Town & Country Planner3. Mohd Monis Khan, Town & Country Planner4. Ms. Anjali Pancholy, Associate Town & Country Planner5. Shri Vipin Kumar, Research Assistant6. Ms. Maitreyee Banerjee, Research Assistant
Formulation of GIS based Master Plan for AMRUT Cities – Design & Standards
1. INTRODUCTION
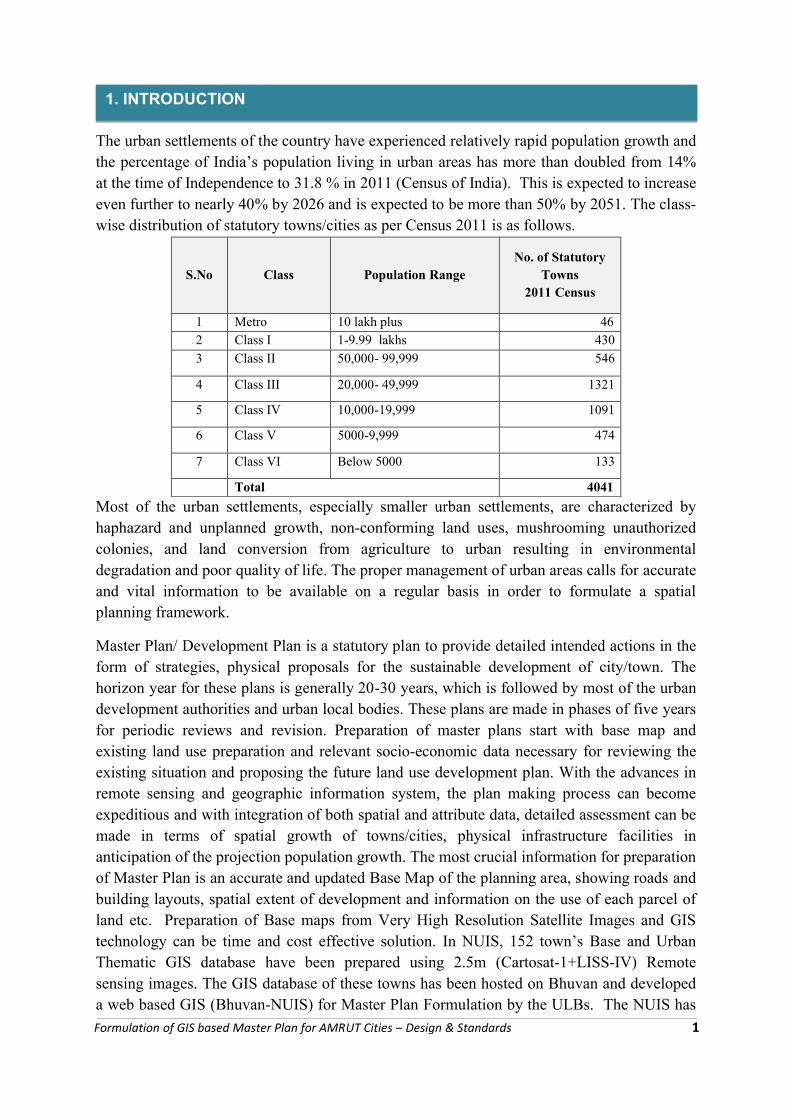
The urban settlements of the country have experienced relatively rapid population growth and the percentage of India’s population living in urban areas has more than doubled from 14% at the time of Independence to 31.8 % in 2011 (Census of India). This is expected to increase even further to nearly 40% by 2026 and is expected to be more than 50% by 2051. The class-wise distribution of statutory towns/cities as per Census 2011 is as follows.
S.No Class Population RangeNo. of Statutory
Towns2011 Census
1 Metro 10 lakh plus 462 Class I 1-9.99 lakhs 430
3 Class II 50,000- 99,999 546
4 Class III 20,000- 49,999 1321
5 Class IV 10,000-19,999 1091
6 Class V 5000-9,999 474
7 Class VI Below 5000 133
Total 4041
Most of the urban settlements, especially smaller urban settlements, are characterized by haphazard and unplanned growth, non-conforming land uses, mushrooming unauthorized colonies, and land conversion from agriculture to urban resulting in environmental degradation and poor quality of life. The proper management of urban areas calls for accurate and vital information to be available on a regular basis in order to formulate a spatial planning framework.
Master Plan/ Development Plan is a statutory plan to provide detailed intended actions in the form of strategies, physical proposals for the sustainable development of city/town. The horizon year for these plans is generally 20-30 years, which is followed by most of the urban development authorities and urban local bodies. These plans are made in phases of five years for periodic reviews and revision. Preparation of master plans start with base map and existing land use preparation and relevant socio-economic data necessary for reviewing the existing situation and proposing the future land use development plan. With the advances in remote sensing and geographic information system, the plan making process can become expeditious and with integration of both spatial and attribute data, detailed assessment can be made in terms of spatial growth of towns/cities, physical infrastructure facilities in anticipation of the projection population growth. The most crucial information for preparation of Master Plan is an accurate and updated Base Map of the planning area, showing roads and building layouts, spatial extent of development and information on the use of each parcel of land etc. Preparation of Base maps from Very High Resolution Satellite Images and GIS technology can be time and cost effective solution. In NUIS, 152 town’s Base and Urban Thematic GIS database have been prepared using 2.5m (Cartosat-1+LISS-IV) Remote sensing images. The GIS database of these towns has been hosted on Bhuvan and developed a web based GIS (Bhuvan-NUIS) for Master Plan Formulation by the ULBs. The NUIS has
Formulation of GIS based Master Plan for AMRUT Cities – Design & Standards 1
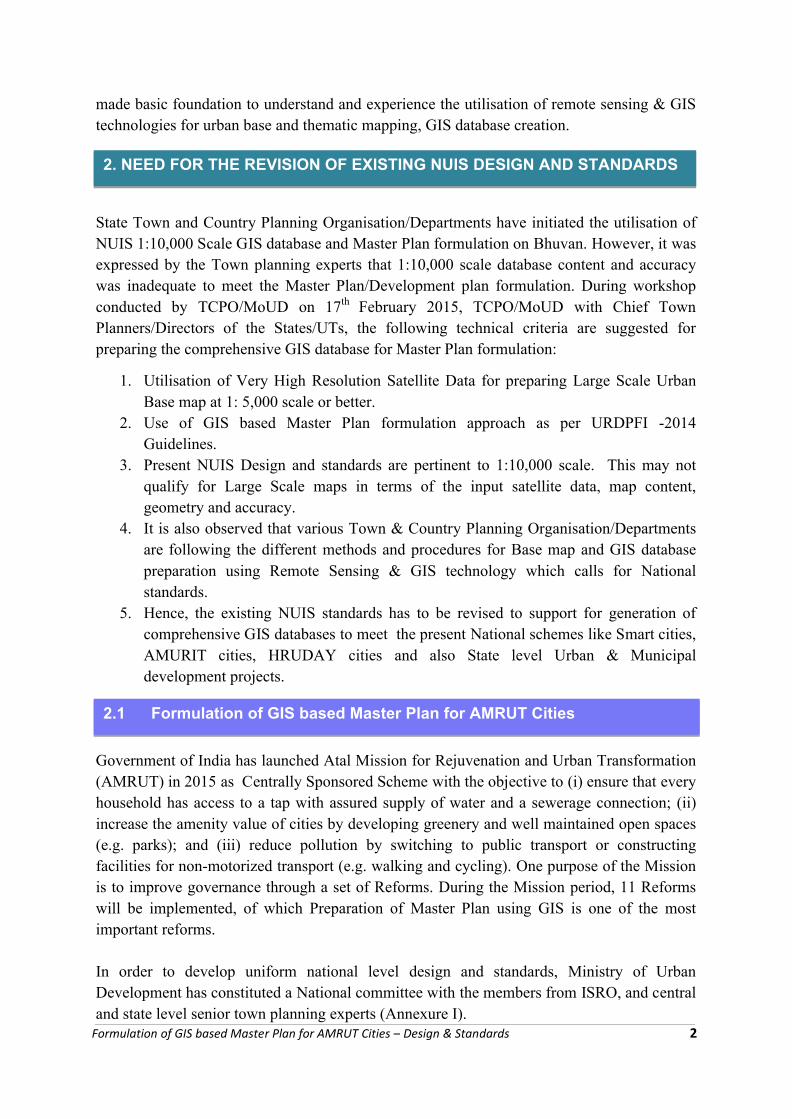
2. NEED FOR THE REVISION OF EXISTING NUIS DESIGN AND STANDARDS
2.1 Formulation of GIS based Master Plan for AMRUT Cities
made basic foundation to understand and experience the utilisation of remote sensing & GIS technologies for urban base and thematic mapping, GIS database creation.
State Town and Country Planning Organisation/Departments have initiated the utilisation of NUIS 1:10,000 Scale GIS database and Master Plan formulation on Bhuvan. However, it was expressed by the Town planning experts that 1:10,000 scale database content and accuracy was inadequate to meet the Master Plan/Development plan formulation. During workshop conducted by TCPO/MoUD on 17th February 2015, TCPO/MoUD with Chief Town Planners/Directors of the States/UTs, the following technical criteria are suggested for preparing the comprehensive GIS database for Master Plan formulation:
1. Utilisation of Very High Resolution Satellite Data for preparing Large Scale Urban Base map at 1: 5,000 scale or better.
2. Use of GIS based Master Plan formulation approach as per URDPFI -2014 Guidelines.
3. Present NUIS Design and standards are pertinent to 1:10,000 scale. This may not qualify for Large Scale maps in terms of the input satellite data, map content, geometry and accuracy.
4. It is also observed that various Town & Country Planning Organisation/Departments are following the different methods and procedures for Base map and GIS database preparation using Remote Sensing & GIS technology which calls for National standards.
5. Hence, the existing NUIS standards has to be revised to support for generation of comprehensive GIS databases to meet the present National schemes like Smart cities, AMURIT cities, HRUDAY cities and also State level Urban & Municipal development projects.
Government of India has launched Atal Mission for Rejuvenation and Urban Transformation (AMRUT) in 2015 as Centrally Sponsored Scheme with the objective to (i) ensure that every household has access to a tap with assured supply of water and a sewerage connection; (ii) increase the amenity value of cities by developing greenery and well maintained open spaces (e.g. parks); and (iii) reduce pollution by switching to public transport or constructing facilities for non-motorized transport (e.g. walking and cycling). One purpose of the Mission is to improve governance through a set of Reforms. During the Mission period, 11 Reforms will be implemented, of which Preparation of Master Plan using GIS is one of the most important reforms.
In order to develop uniform national level design and standards, Ministry of Urban Development has constituted a National committee with the members from ISRO, and central and state level senior town planning experts (Annexure I).
Formulation of GIS based Master Plan for AMRUT Cities – Design & Standards 2
3. ELEMENTS OF STANDARD
3.1 Remote Sensing Image Standards
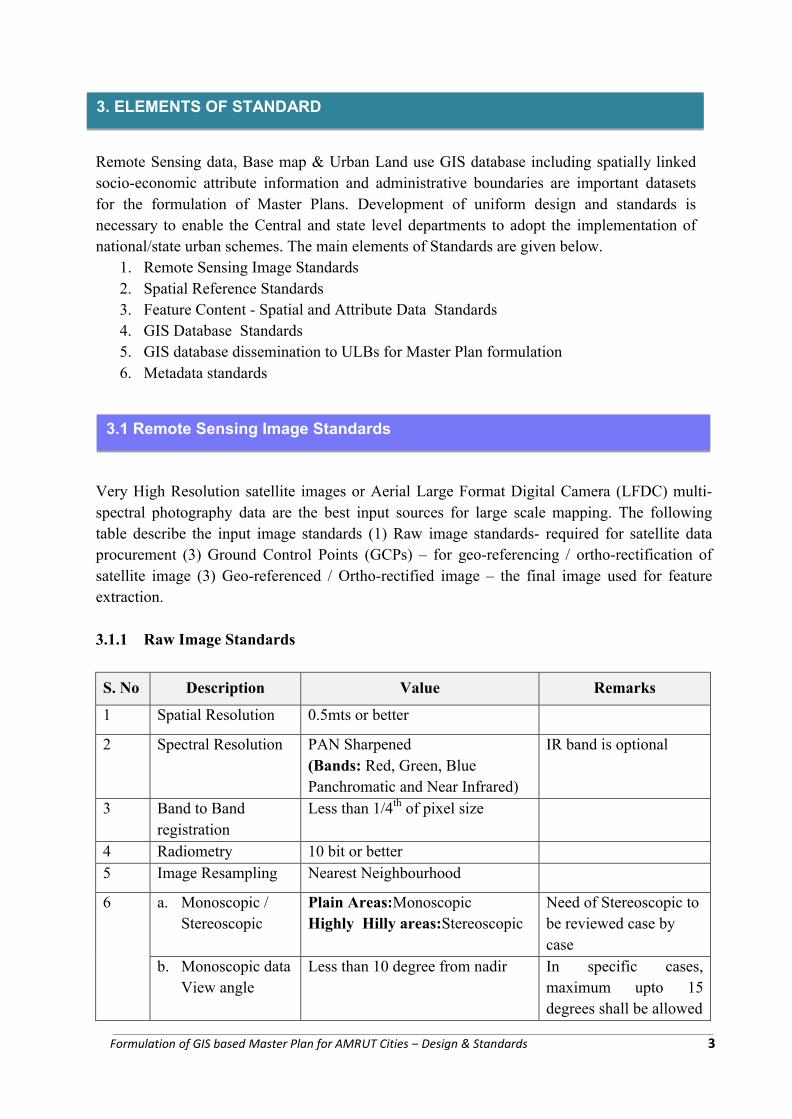
Remote Sensing data, Base map & Urban Land use GIS database including spatially linked socio-economic attribute information and administrative boundaries are important datasets for the formulation of Master Plans. Development of uniform design and standards is necessary to enable the Central and state level departments to adopt the implementation of national/state urban schemes. The main elements of Standards are given below.
1. Remote Sensing Image Standards2. Spatial Reference Standards3. Feature Content - Spatial and Attribute Data Standards4. GIS Database Standards5. GIS database dissemination to ULBs for Master Plan formulation6. Metadata standards
Very High Resolution satellite images or Aerial Large Format Digital Camera (LFDC) multi-spectral photography data are the best input sources for large scale mapping. The following table describe the input image standards (1) Raw image standards- required for satellite data procurement (3) Ground Control Points (GCPs) – for geo-referencing / ortho-rectification of satellite image (3) Geo-referenced / Ortho-rectified image – the final image used for feature extraction.
3.1.1 Raw Image Standards
S. No Description Value Remarks
1 Spatial Resolution 0.5mts or better
2 Spectral Resolution PAN Sharpened(Bands: Red, Green, Blue Panchromatic and Near Infrared)
IR band is optional
3 Band to Band registration
Less than 1/4th of pixel size
4 Radiometry 10 bit or better5 Image Resampling Nearest Neighbourhood
6 a. Monoscopic / Stereoscopic
Plain Areas:MonoscopicHighly Hilly areas:Stereoscopic
Need of Stereoscopic to be reviewed case by case
b. Monoscopic data View angle
Less than 10 degree from nadir In specific cases, maximum upto 15 degrees shall be allowed
Formulation of GIS based Master Plan for AMRUT Cities – Design & Standards 3
S. No Description Value Remarks
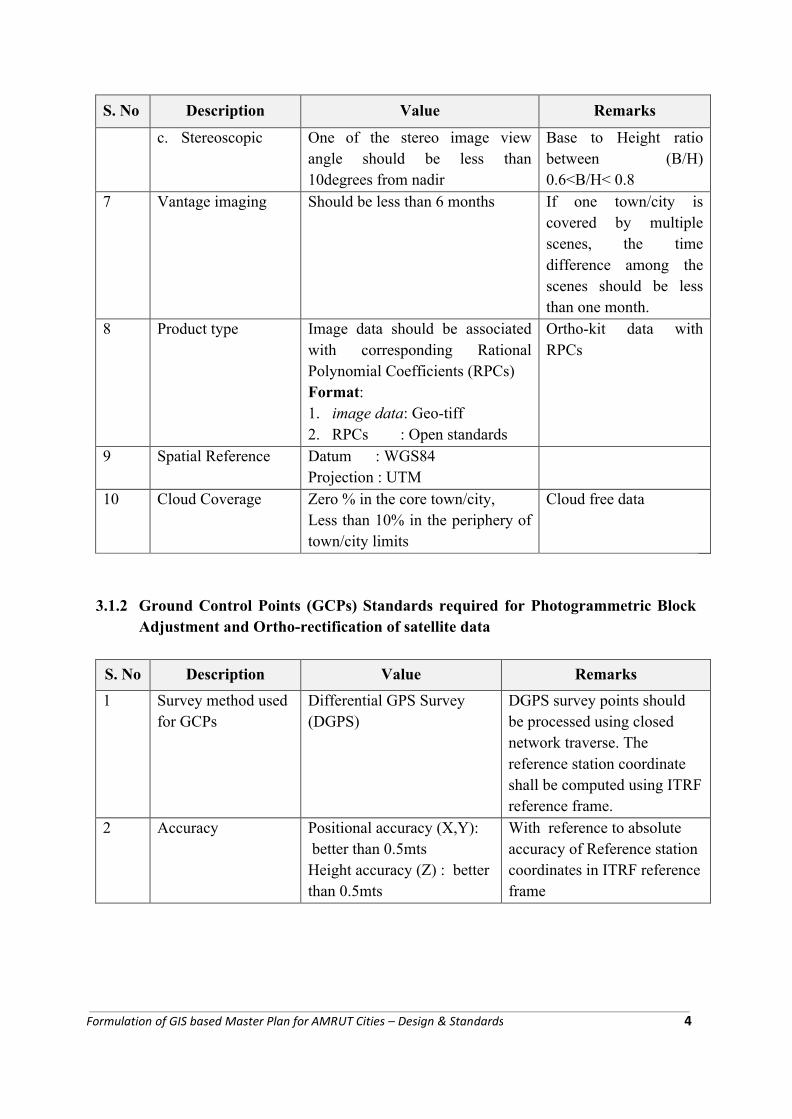
c. Stereoscopic One of the stereo image view angle should be less than 10degrees from nadir
Base to Height ratio between (B/H) 0.6<B/H< 0.8
7 Vantage imaging Should be less than 6 months If one town/city is covered by multiple scenes, the time difference among the scenes should be less than one month.
8 Product type Image data should be associated with corresponding Rational Polynomial Coefficients (RPCs) Format: 1. image data: Geo-tiff2. RPCs : Open standards
Ortho-kit data with RPCs
9 Spatial Reference Datum : WGS84Projection : UTM
10 Cloud Coverage Zero % in the core town/city,Less than 10% in the periphery of town/city limits
Cloud free data
3.1.2 Ground Control Points (GCPs) Standards required for Photogrammetric Block Adjustment and Ortho-rectification of satellite data
S. No Description Value Remarks
1 Survey method used for GCPs
Differential GPS Survey (DGPS)
DGPS survey points should be processed using closed network traverse. The reference station coordinate shall be computed using ITRF reference frame.
2 Accuracy Positional accuracy (X,Y):better than 0.5mtsHeight accuracy (Z) : better than 0.5mts
With reference to absolute accuracy of Reference station coordinates in ITRF reference frame
Formulation of GIS based Master Plan for AMRUT Cities – Design & Standards 4
S. No Description Value Remarks
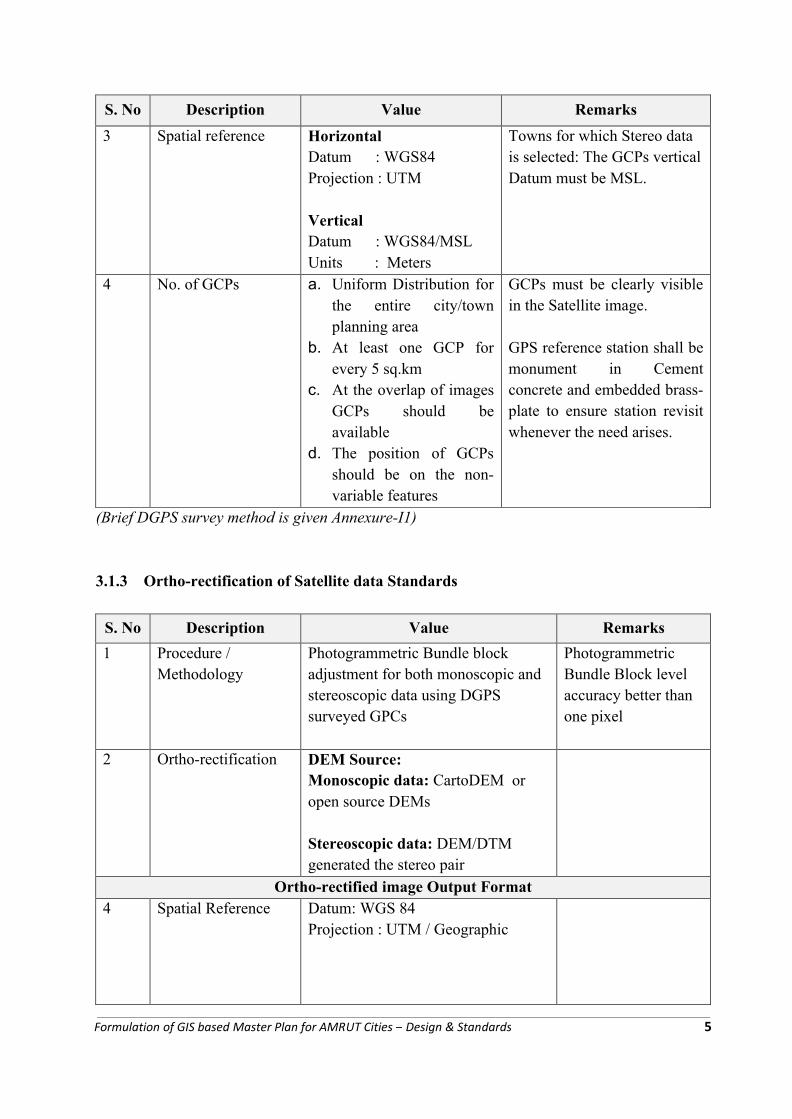
3 Spatial reference Horizontal Datum : WGS84Projection : UTM
Vertical Datum : WGS84/MSL Units : Meters
Towns for which Stereo data is selected: The GCPs vertical Datum must be MSL.
4 No. of GCPs a. Uniform Distribution for the entire city/town planning area
b. At least one GCP for every 5 sq.km
c. At the overlap of images GCPs should be available
d. The position of GCPs should be on the non-variable features
GCPs must be clearly visible in the Satellite image.
GPS reference station shall be monument in Cement concrete and embedded brass-plate to ensure station revisit whenever the need arises.
(Brief DGPS survey method is given Annexure-I1)
3.1.3 Ortho-rectification of Satellite data Standards
S. No Description Value Remarks
1 Procedure / Methodology
Photogrammetric Bundle block adjustment for both monoscopic and stereoscopic data using DGPS surveyed GPCs
Photogrammetric Bundle Block level accuracy better than one pixel
2 Ortho-rectification DEM Source:Monoscopic data: CartoDEM or open source DEMs
Stereoscopic data: DEM/DTM generated the stereo pair
Ortho-rectified image Output Format4 Spatial Reference Datum: WGS 84
Projection : UTM / Geographic
Formulation of GIS based Master Plan for AMRUT Cities – Design & Standards 5
3.2. Spatial Reference Standards
S. No Description Value Remarks
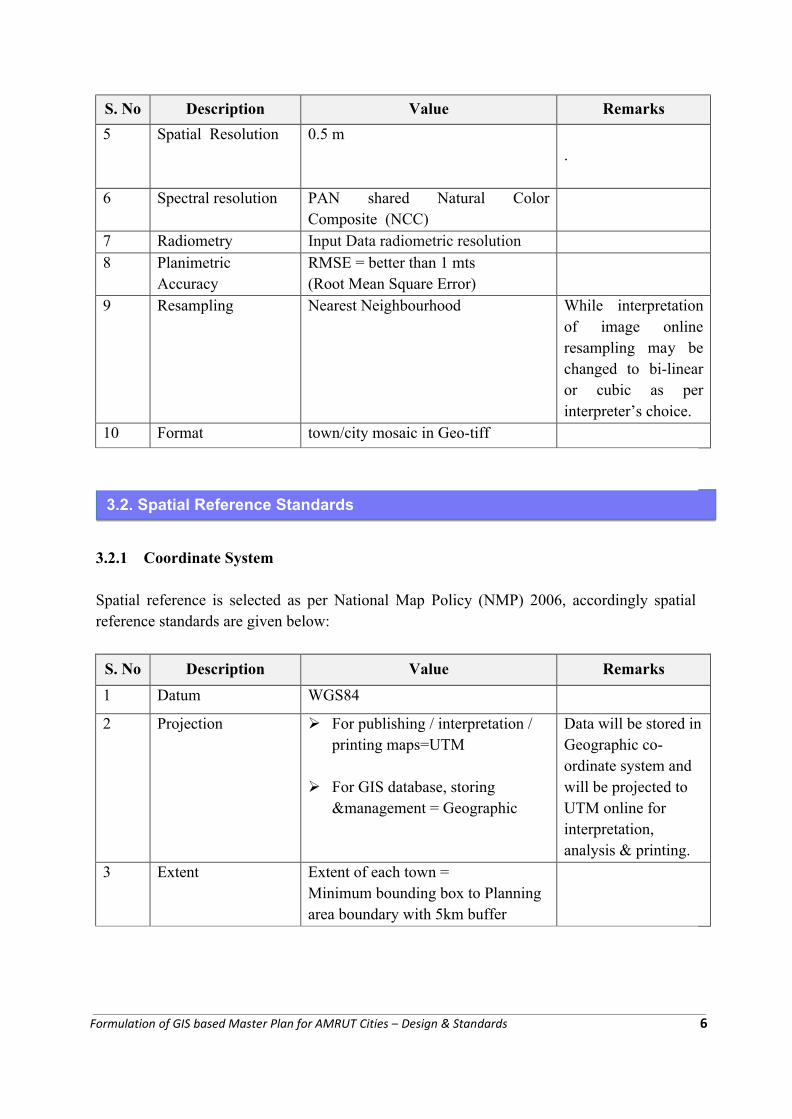
5 Spatial Resolution 0.5 m .
6 Spectral resolution PAN shared Natural Color Composite (NCC)
7 Radiometry Input Data radiometric resolution8 Planimetric
AccuracyRMSE = better than 1 mts(Root Mean Square Error)
9 Resampling Nearest Neighbourhood While interpretation of image online resampling may be changed to bi-linear or cubic as per interpreter’s choice.
10 Format town/city mosaic in Geo-tiff
3.2.1 Coordinate System
Spatial reference is selected as per National Map Policy (NMP) 2006, accordingly spatial reference standards are given below:
S. No Description Value Remarks
1 Datum WGS84
2 Projection ÿ For publishing / interpretation / printing maps=UTM
ÿ For GIS database, storing &management = Geographic
Data will be stored in Geographic co-ordinate system and will be projected to UTM online for interpretation, analysis & printing.
3 Extent Extent of each town = Minimum bounding box to Planning area boundary with 5km buffer
Formulation of GIS based Master Plan for AMRUT Cities – Design & Standards 6
3.2.2 Map Sheet Frame for Hardcopy Prints
With the advancements in GIS, the utilisation of hard copy maps is limited to the field work and field verification of data. The digital GIS environment has been used for spatial and attribute data analysis and GIS based Master plan formulation. The proposed 1:4,000 scale under this scheme is not compatible to National Scheme of Map series. In view of this, it is proposed to use the existing National Map Scheme which was developed and adopted in NUIS.
Whenever required hard copy maps can be printed for visualisation purpose at different scale for example at 1: 10,000 for town/city map; 1:2,000 or 1:1,000 for field verification and data collection purpose. The World Map Series Template is given in Figure 1.
To enable the compatibility of cadastral map scales, it is proposed to adopt State specific cadastral map sheet series at 1:4,000 scale, 1:8000 scale or any other specific scale. The extent of the Map sheet, Map sheet number and size shall be according to the scale adopted by the respective State / UT.
After the detailed deliberations and interactions with Central and State Town Planning departments and experts, it was proposed that 1:4000 scale is ideal for formulation of Master Plan/Development Plans. The spatial features are extracted from high resolution images at 1:4000 scale and are classified based on attribute data collected from field. Further, it is also proposed to improve the feature content from the line departments data as well as additional attribute information from the field as required for the Master Plan /Development Plan formulation. This section gives the details on Base and Urban Thematic spatial data Standards and Attribute information, commensurate to 1:4000 scale as given below:
3.3.1 Spatial Data Content Standards3.3.2 Attribute Data Content Standards3.3.3 Accuracy Standards
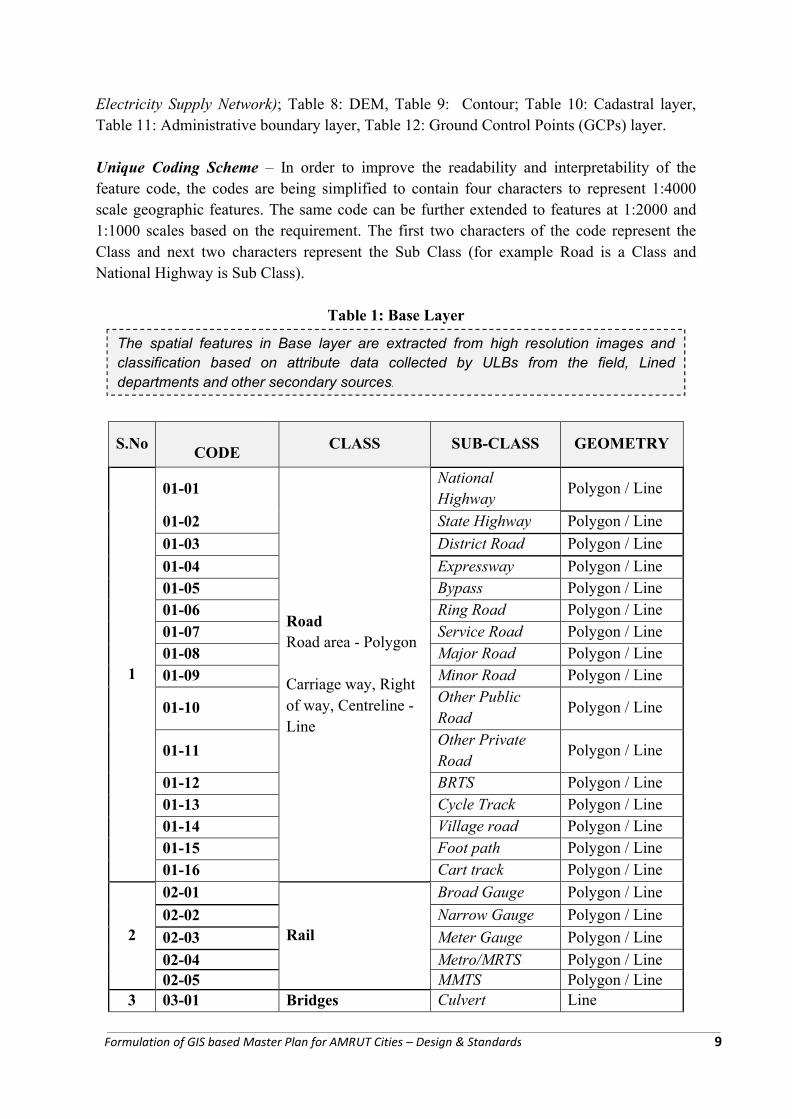
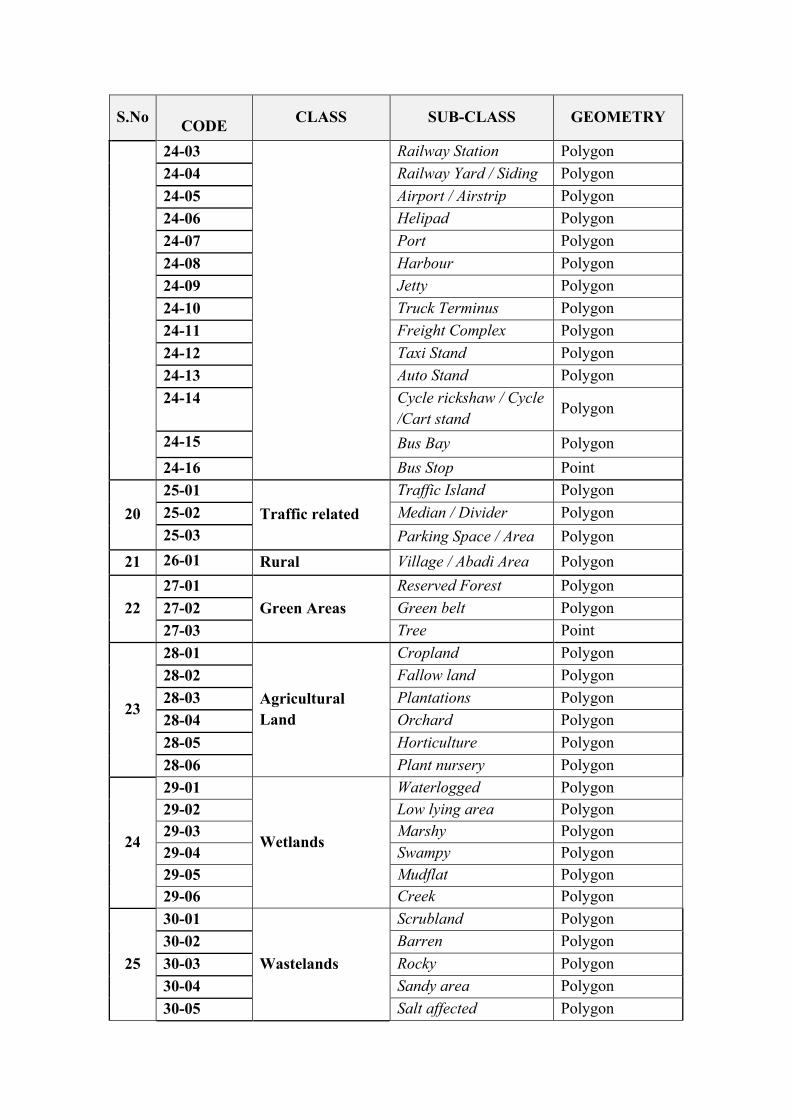
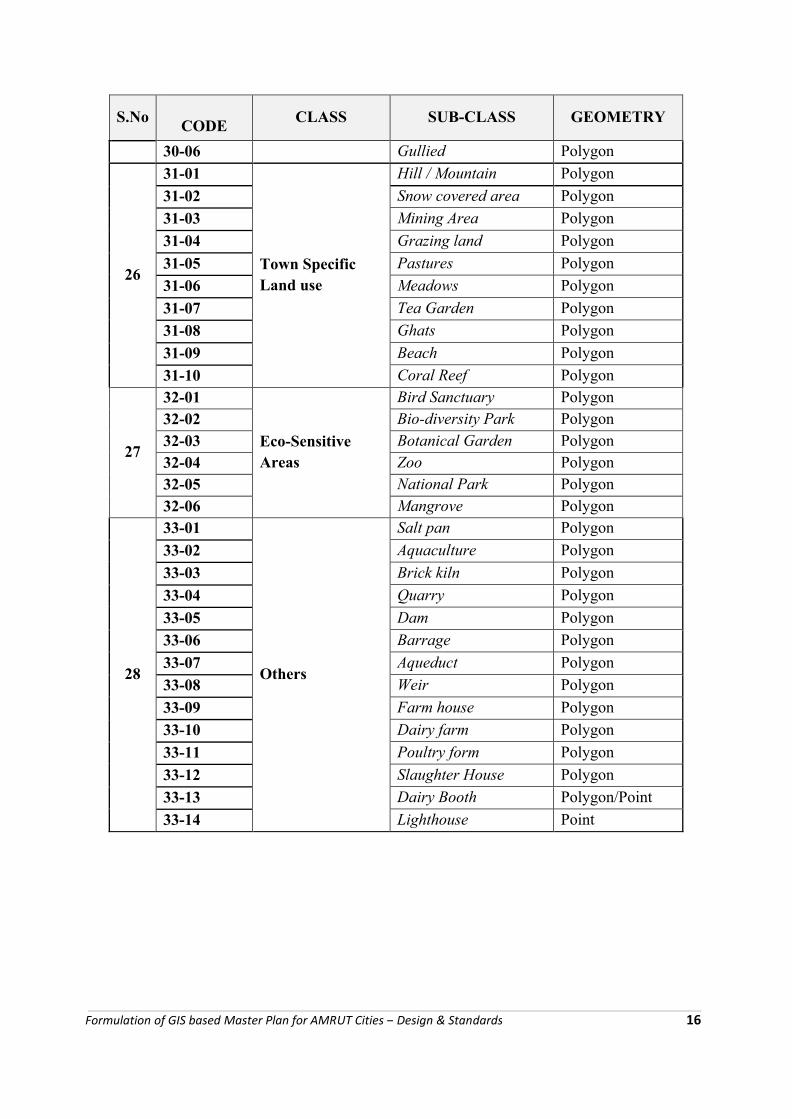
3.3.1 Spatial Data Content StandardsThe spatial data content is broadly divided into Base, Urban Land use, Utilities, DEM, Contour, Cadastral, Administrative boundaries and Ground Control Points (GCPs) as is given in the following tables: –
Table 1: Base Layer (5 major Base Layer Classes with 42 Sub classes); Table 2: Urban Landuse Layer(28 major Base and Urban Landuse Classes with 202 Sub classes); Table 3: Building Footprint Layer with use (22 major Classes and 142 Sub classes); Table 4 - 7: Utility Layers (Water Supply Network, Storm water Drainage Network, Sewage Network and
3.3. Feature Content - Spatial and Attribute Data Standards
Formulation of GIS based Master Plan for AMRUT Cities – Design & Standards 7
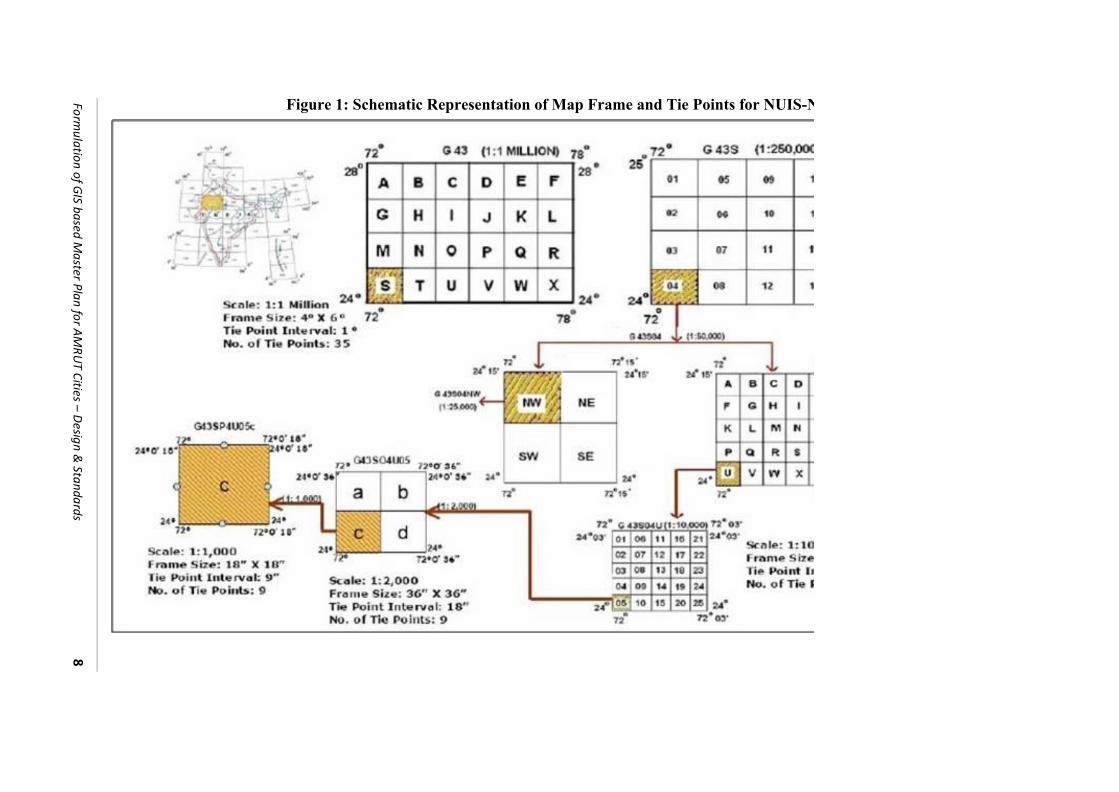
Figure 1: Schematic Representation of Map Frame and Tie Points for NUIS-NSFFormulation of G
IS based Master Plan for AM
RUT Cities –
Design &
Standards8
The spatial features in Base layer are extracted from high resolution images and classification based on attribute data collected by ULBs from the field, Lined departments and other secondary sources.
Electricity Supply Network); Table 8: DEM, Table 9: Contour; Table 10: Cadastral layer, Table 11: Administrative boundary layer, Table 12: Ground Control Points (GCPs) layer.
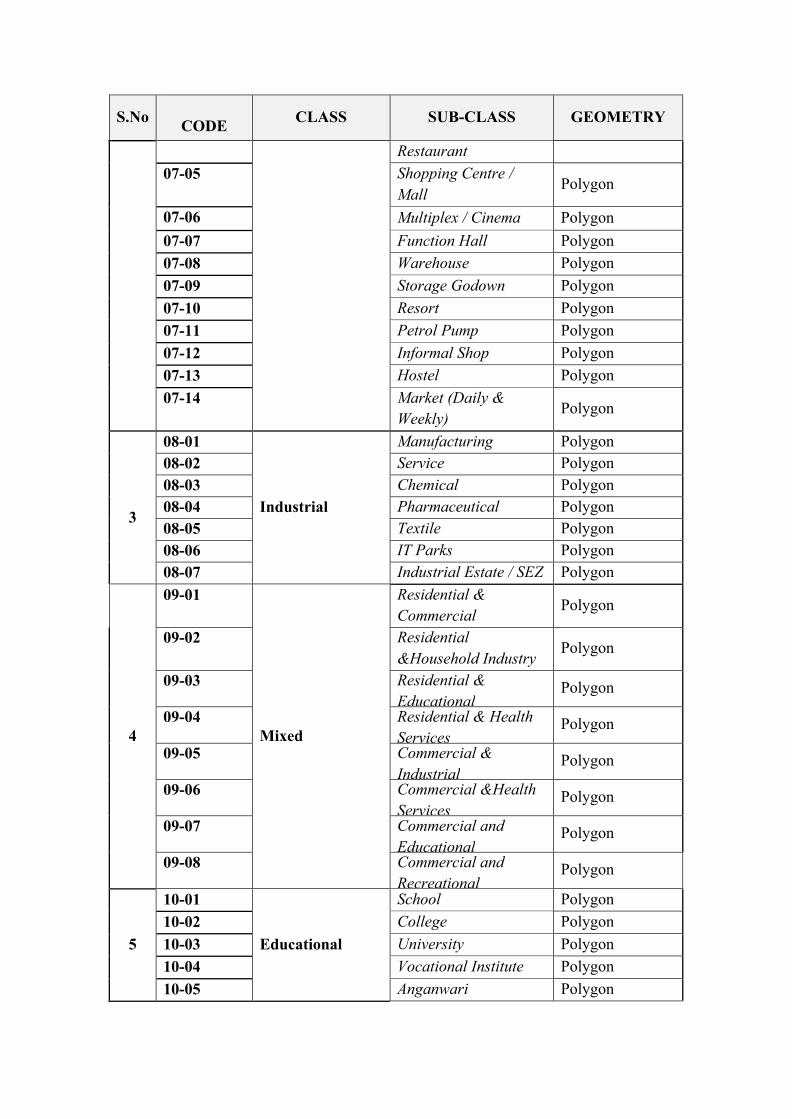
Unique Coding Scheme – In order to improve the readability and interpretability of the feature code, the codes are being simplified to contain four characters to represent 1:4000 scale geographic features. The same code can be further extended to features at 1:2000 and 1:1000 scales based on the requirement. The first two characters of the code represent the Class and next two characters represent the Sub Class (for example Road is a Class and National Highway is Sub Class).
Table 1: Base Layer
S.NoCODE
CLASS SUB-CLASS GEOMETRY
1
01-01
RoadRoad area - Polygon
Carriage way, Right of way, Centreline -Line
National Highway
Polygon / Line
01-02 State Highway Polygon / Line
01-03 District Road Polygon / Line
01-04 Expressway Polygon / Line01-05 Bypass Polygon / Line01-06 Ring Road Polygon / Line
01-07 Service Road Polygon / Line01-08 Major Road Polygon / Line
01-09 Minor Road Polygon / Line
01-10Other Public Road
Polygon / Line
01-11Other Private Road
Polygon / Line
01-12 BRTS Polygon / Line
01-13 Cycle Track Polygon / Line01-14 Village road Polygon / Line01-15 Foot path Polygon / Line
01-16 Cart track Polygon / Line
2
02-01
Rail
Broad Gauge Polygon / Line
02-02 Narrow Gauge Polygon / Line
02-03 Meter Gauge Polygon / Line
02-04 Metro/MRTS Polygon / Line02-05 MMTS Polygon / Line
3 03-01 Bridges Culvert Line
Formulation of GIS based Master Plan for AMRUT Cities – Design & Standards 9
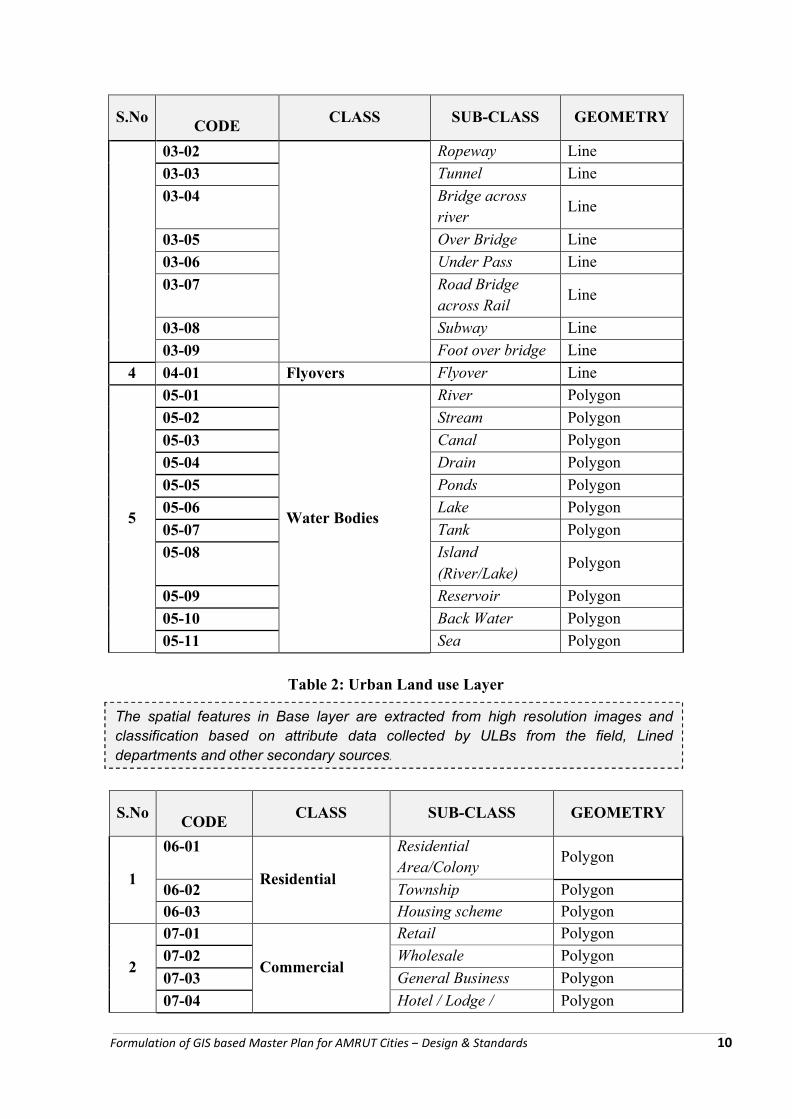
The spatial features in Base layer are extracted from high resolution images and classification based on attribute data collected by ULBs from the field, Lined departments and other secondary sources.
S.NoCODE
CLASS SUB-CLASS GEOMETRY
03-02 Ropeway Line
03-03 Tunnel Line
03-04 Bridge across river
Line
03-05 Over Bridge Line
03-06 Under Pass Line
03-07 Road Bridge across Rail
Line
03-08 Subway Line
03-09 Foot over bridge Line
4 04-01 Flyovers Flyover Line
5
05-01
Water Bodies
River Polygon
05-02 Stream Polygon
05-03 Canal Polygon
05-04 Drain Polygon
05-05 Ponds Polygon
05-06 Lake Polygon
05-07 Tank Polygon
05-08 Island (River/Lake)
Polygon
05-09 Reservoir Polygon
05-10 Back Water Polygon
05-11 Sea Polygon
Table 2: Urban Land use Layer
S.NoCODE
CLASS SUB-CLASS GEOMETRY
1
06-01
Residential
Residential Area/Colony
Polygon
06-02 Township Polygon06-03 Housing scheme Polygon
2
07-01
Commercial
Retail Polygon
07-02 Wholesale Polygon
07-03 General Business Polygon
07-04 Hotel / Lodge / Polygon
Formulation of GIS based Master Plan for AMRUT Cities – Design & Standards 10
S.NoCODE
CLASS SUB-CLASS GEOMETRY
Restaurant
07-05 Shopping Centre / Mall
Polygon
07-06 Multiplex / Cinema Polygon
07-07 Function Hall Polygon
07-08 Warehouse Polygon
07-09 Storage Godown Polygon
07-10 Resort Polygon
07-11 Petrol Pump Polygon
07-12 Informal Shop Polygon
07-13 Hostel Polygon
07-14 Market (Daily & Weekly)
Polygon
3
08-01
Industrial
Manufacturing Polygon08-02 Service Polygon
08-03 Chemical Polygon08-04 Pharmaceutical Polygon08-05 Textile Polygon
08-06 IT Parks Polygon
08-07 Industrial Estate / SEZ Polygon
4
09-01
Mixed
Residential & Commercial
Polygon
09-02 Residential &Household Industry
Polygon
09-03 Residential & Educational
Polygon
09-04 Residential & Health Services
Polygon
09-05 Commercial & Industrial
Polygon
09-06 Commercial &Health Services
Polygon
09-07 Commercial and Educational
Polygon
09-08 Commercial and Recreational
Polygon
5
10-01
Educational
School Polygon
10-02 College Polygon
10-03 University Polygon
10-04 Vocational Institute Polygon
10-05 Anganwari Polygon
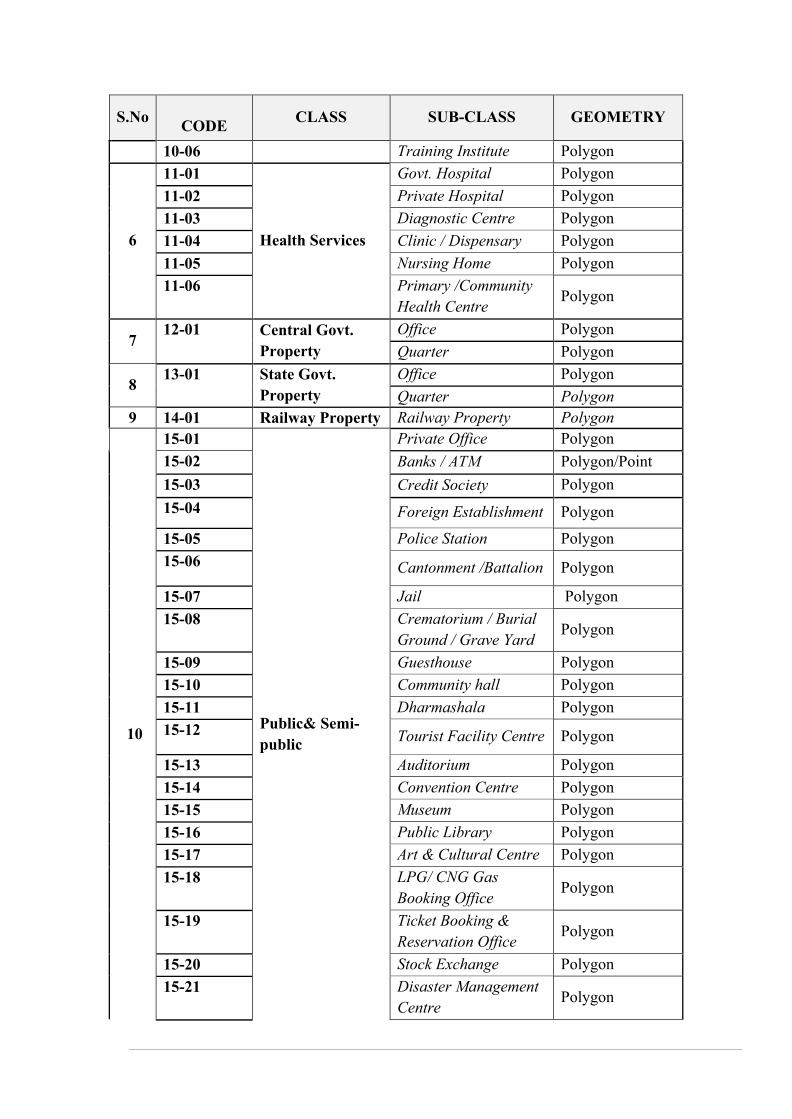
S.NoCODE
CLASS SUB-CLASS GEOMETRY
10-06 Training Institute Polygon
6
11-01
Health Services
Govt. Hospital Polygon
11-02 Private Hospital Polygon
11-03 Diagnostic Centre Polygon
11-04 Clinic / Dispensary Polygon
11-05 Nursing Home Polygon
11-06 Primary /Community Health Centre
Polygon
712-01 Central Govt.
PropertyOffice Polygon
Quarter Polygon
813-01 State Govt.
PropertyOffice Polygon
Quarter Polygon9 14-01 Railway Property Railway Property Polygon
10
15-01
Public& Semi-public
Private Office Polygon
15-02 Banks / ATM Polygon/Point
15-03 Credit Society Polygon
15-04 Foreign Establishment Polygon
15-05 Police Station Polygon
15-06 Cantonment /Battalion Polygon
15-07 Jail Polygon
15-08 Crematorium / Burial Ground / Grave Yard
Polygon
15-09 Guesthouse Polygon
15-10 Community hall Polygon
15-11 Dharmashala Polygon
15-12 Tourist Facility Centre Polygon
15-13 Auditorium Polygon
15-14 Convention Centre Polygon
15-15 Museum Polygon
15-16 Public Library Polygon
15-17 Art & Cultural Centre Polygon
15-18 LPG/ CNG Gas Booking Office
Polygon
15-19 Ticket Booking & Reservation Office
Polygon
15-20 Stock Exchange Polygon
15-21 Disaster Management Centre
Polygon
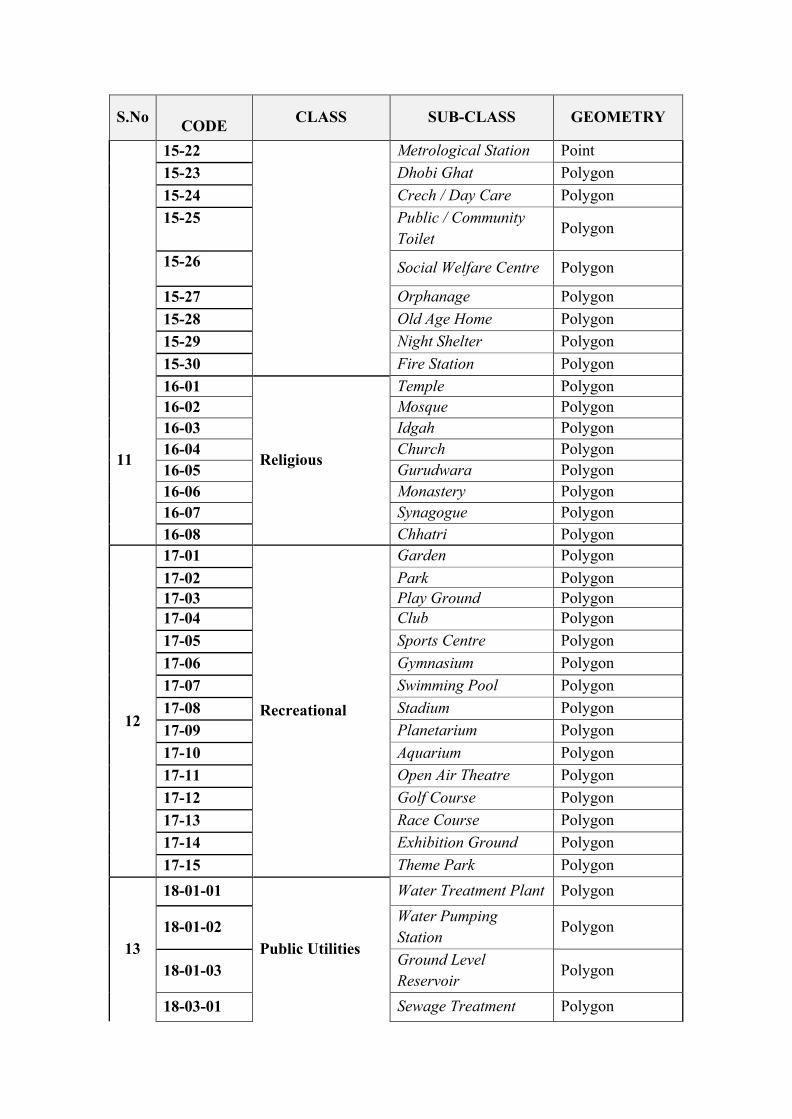
S.NoCODE
CLASS SUB-CLASS GEOMETRY
15-22 Metrological Station Point
15-23 Dhobi Ghat Polygon
15-24 Crech / Day Care Polygon
15-25 Public / Community Toilet
Polygon
15-26 Social Welfare Centre Polygon
15-27 Orphanage Polygon
15-28 Old Age Home Polygon
15-29 Night Shelter Polygon
15-30 Fire Station Polygon
11
16-01
Religious
Temple Polygon16-02 Mosque Polygon16-03 Idgah Polygon16-04 Church Polygon16-05 Gurudwara Polygon16-06 Monastery Polygon16-07 Synagogue Polygon
16-08 Chhatri Polygon
12
17-01
Recreational
Garden Polygon
17-02 Park Polygon17-03 Play Ground Polygon17-04 Club Polygon
17-05 Sports Centre Polygon
17-06 Gymnasium Polygon
17-07 Swimming Pool Polygon
17-08 Stadium Polygon
17-09 Planetarium Polygon
17-10 Aquarium Polygon
17-11 Open Air Theatre Polygon
17-12 Golf Course Polygon
17-13 Race Course Polygon
17-14 Exhibition Ground Polygon
17-15 Theme Park Polygon
13
18-01-01
Public Utilities
Water Treatment Plant Polygon
18-01-02Water Pumping Station
Polygon
18-01-03Ground Level Reservoir
Polygon
18-03-01 Sewage Treatment Polygon
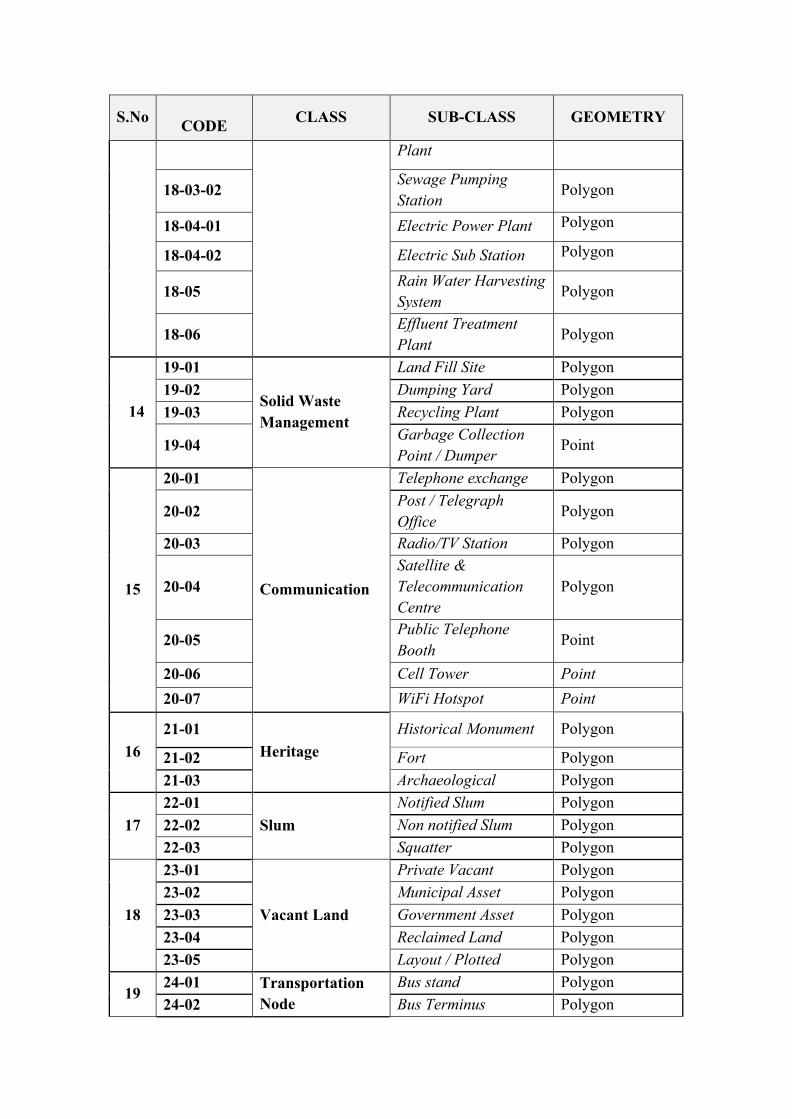
S.NoCODE
CLASS SUB-CLASS GEOMETRY
Plant
18-03-02Sewage Pumping Station
Polygon
18-04-01 Electric Power Plant Polygon
18-04-02 Electric Sub Station Polygon
18-05Rain Water Harvesting System
Polygon
18-06Effluent Treatment Plant
Polygon
14
19-01
Solid Waste Management
Land Fill Site Polygon
19-02 Dumping Yard Polygon
19-03 Recycling Plant Polygon
19-04Garbage Collection Point / Dumper
Point
15
20-01
Communication
Telephone exchange Polygon
20-02Post / Telegraph Office
Polygon
20-03 Radio/TV Station Polygon
20-04Satellite & Telecommunication Centre
Polygon
20-05Public Telephone Booth
Point
20-06 Cell Tower Point
20-07 WiFi Hotspot Point
16
21-01
Heritage
Historical Monument Polygon
21-02 Fort Polygon
21-03 Archaeological Polygon
17
22-01
Slum
Notified Slum Polygon
22-02 Non notified Slum Polygon
22-03 Squatter Polygon
18
23-01
Vacant Land
Private Vacant Polygon
23-02 Municipal Asset Polygon
23-03 Government Asset Polygon
23-04 Reclaimed Land Polygon
23-05 Layout / Plotted Polygon
1924-01 Transportation
NodeBus stand Polygon
24-02 Bus Terminus Polygon
S.NoCODE
CLASS SUB-CLASS GEOMETRY
24-03 Railway Station Polygon
24-04 Railway Yard / Siding Polygon
24-05 Airport / Airstrip Polygon
24-06 Helipad Polygon
24-07 Port Polygon
24-08 Harbour Polygon
24-09 Jetty Polygon
24-10 Truck Terminus Polygon
24-11 Freight Complex Polygon
24-12 Taxi Stand Polygon
24-13 Auto Stand Polygon
24-14 Cycle rickshaw / Cycle /Cart stand
Polygon
24-15 Bus Bay Polygon
24-16 Bus Stop Point
20
25-01
Traffic related
Traffic Island Polygon
25-02 Median / Divider Polygon
25-03 Parking Space / Area Polygon
21 26-01 Rural Village / Abadi Area Polygon
22
27-01
Green Areas
Reserved Forest Polygon
27-02 Green belt Polygon
27-03 Tree Point
23
28-01
Agricultural Land
Cropland Polygon
28-02 Fallow land Polygon
28-03 Plantations Polygon
28-04 Orchard Polygon
28-05 Horticulture Polygon
28-06 Plant nursery Polygon
24
29-01
Wetlands
Waterlogged Polygon
29-02 Low lying area Polygon29-03 Marshy Polygon29-04 Swampy Polygon
29-05 Mudflat Polygon29-06 Creek Polygon
25
30-01
Wastelands
Scrubland Polygon
30-02 Barren Polygon
30-03 Rocky Polygon
30-04 Sandy area Polygon
30-05 Salt affected Polygon
S.NoCODE
CLASS SUB-CLASS GEOMETRY
30-06 Gullied Polygon
26
31-01
Town Specific Land use
Hill / Mountain Polygon
31-02 Snow covered area Polygon
31-03 Mining Area Polygon
31-04 Grazing land Polygon
31-05 Pastures Polygon
31-06 Meadows Polygon
31-07 Tea Garden Polygon
31-08 Ghats Polygon
31-09 Beach Polygon
31-10 Coral Reef Polygon
27
32-01
Eco-Sensitive Areas
Bird Sanctuary Polygon32-02 Bio-diversity Park Polygon
32-03 Botanical Garden Polygon32-04 Zoo Polygon32-05 National Park Polygon
32-06 Mangrove Polygon
28
33-01
Others
Salt pan Polygon
33-02 Aquaculture Polygon
33-03 Brick kiln Polygon
33-04 Quarry Polygon
33-05 Dam Polygon
33-06 Barrage Polygon
33-07 Aqueduct Polygon
33-08 Weir Polygon
33-09 Farm house Polygon
33-10 Dairy farm Polygon
33-11 Poultry form Polygon
33-12 Slaughter House Polygon
33-13 Dairy Booth Polygon/Point
33-14 Lighthouse Point
Formulation of GIS based Master Plan for AMRUT Cities – Design & Standards 16
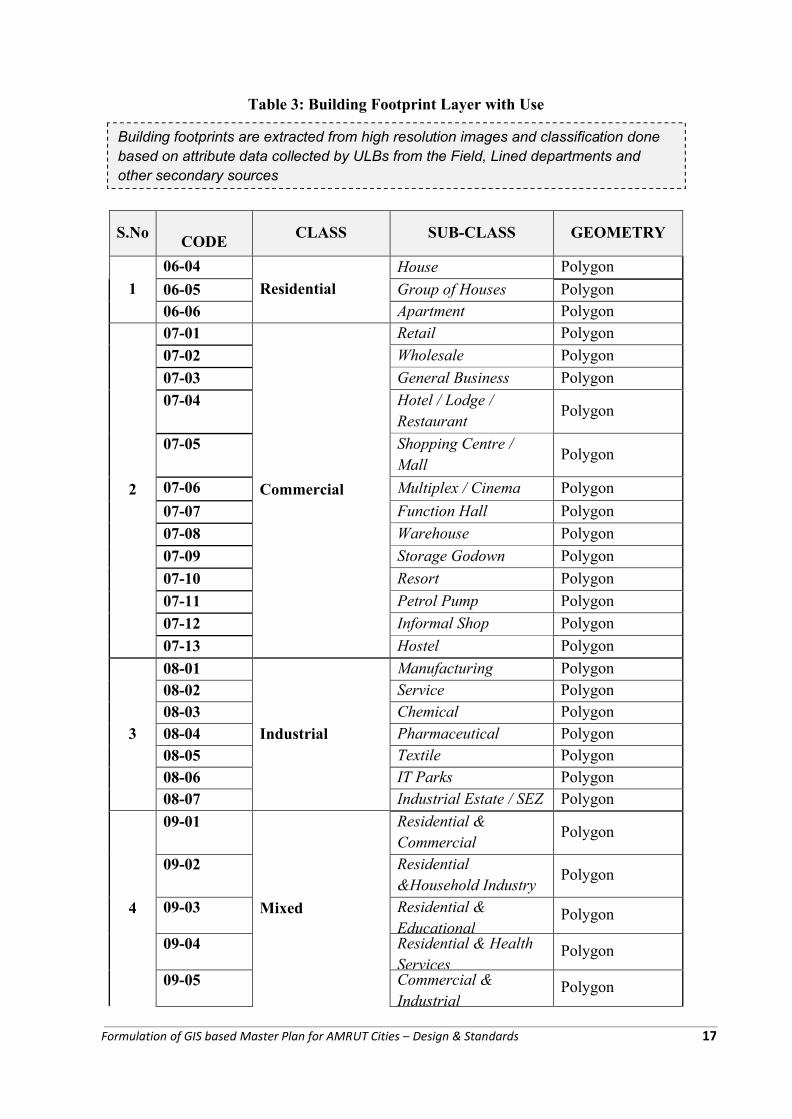
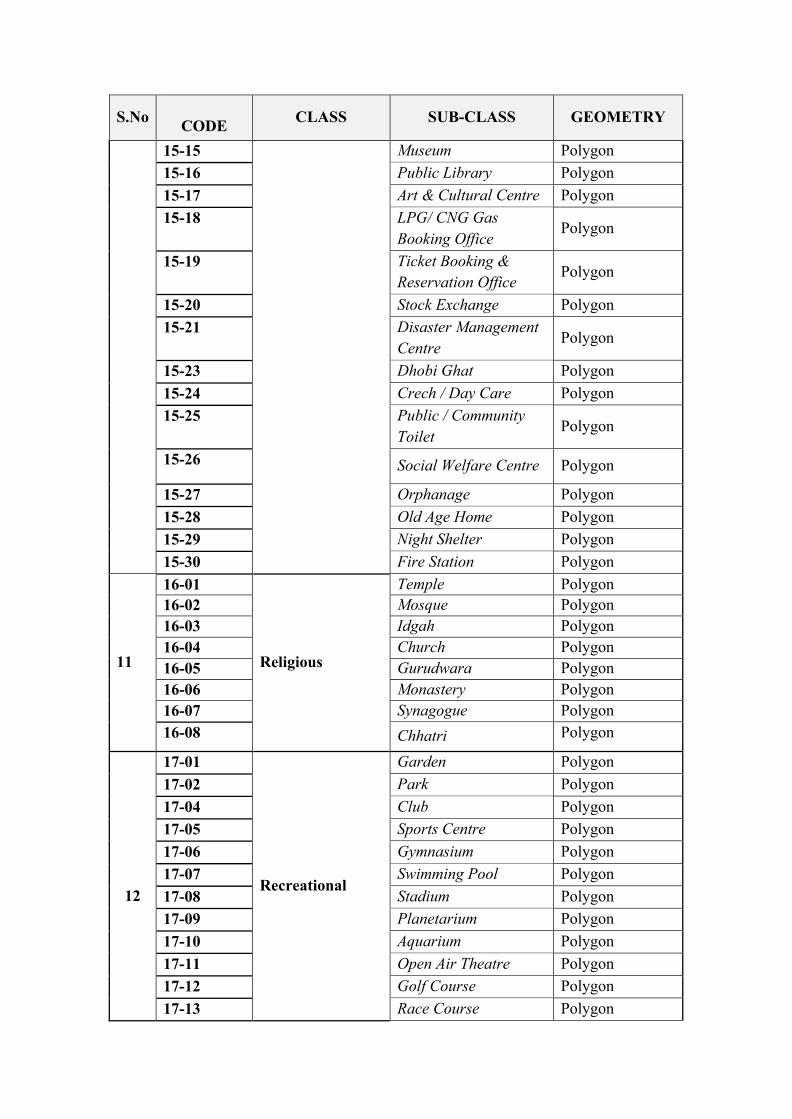
Building footprints are extracted from high resolution images and classification done based on attribute data collected by ULBs from the Field, Lined departments and other secondary sources
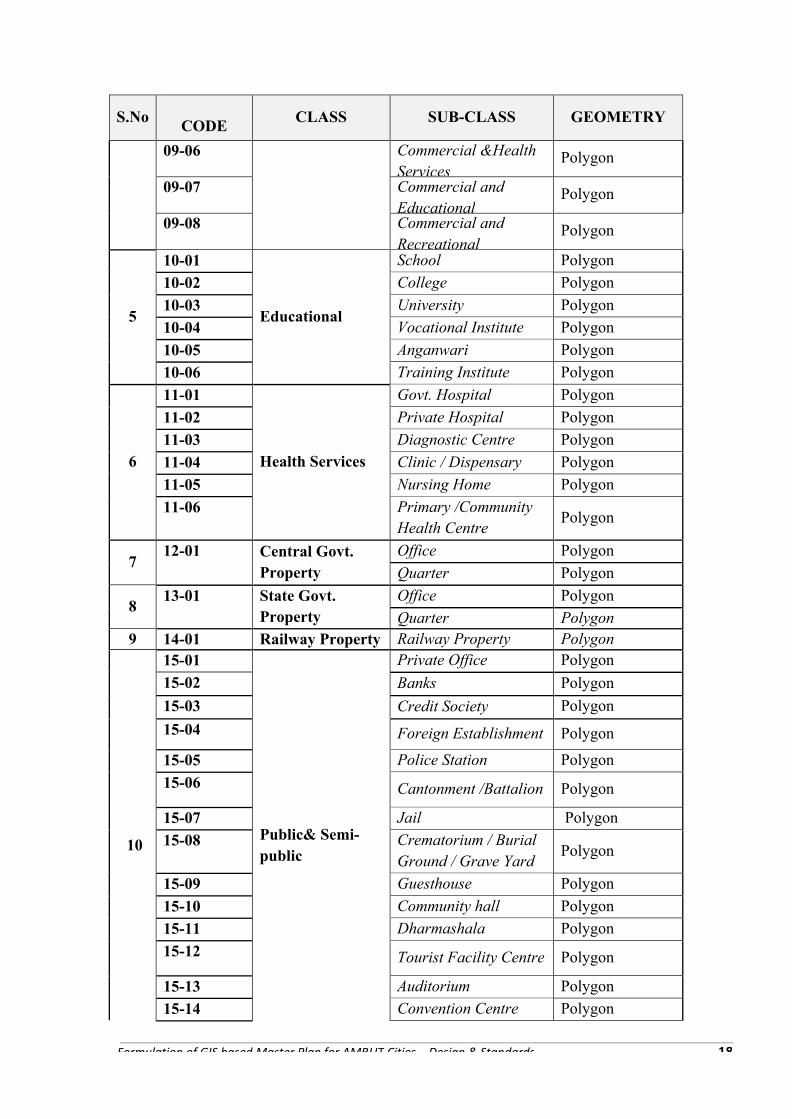
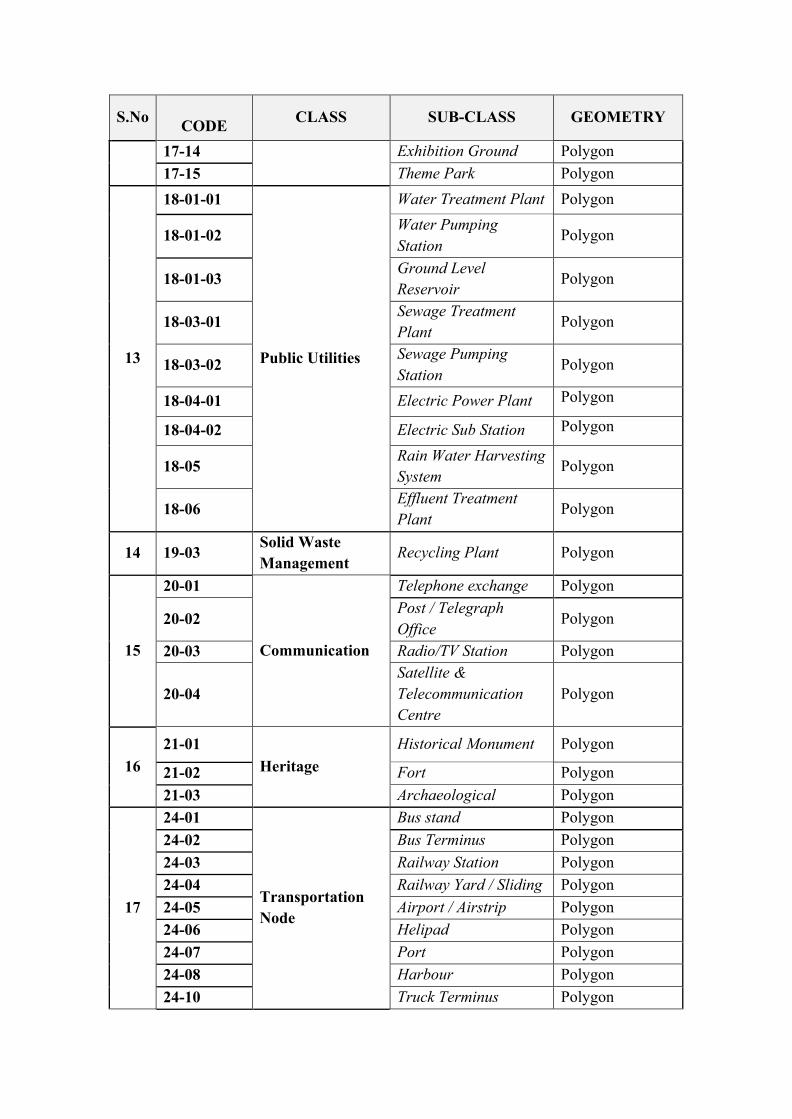
Table 3: Building Footprint Layer with Use
S.NoCODE
CLASS SUB-CLASS GEOMETRY
1
06-04
ResidentialHouse Polygon
06-05 Group of Houses Polygon06-06 Apartment Polygon
2
07-01
Commercial
Retail Polygon
07-02 Wholesale Polygon
07-03 General Business Polygon
07-04 Hotel / Lodge / Restaurant
Polygon
07-05 Shopping Centre / Mall
Polygon
07-06 Multiplex / Cinema Polygon
07-07 Function Hall Polygon
07-08 Warehouse Polygon
07-09 Storage Godown Polygon
07-10 Resort Polygon
07-11 Petrol Pump Polygon
07-12 Informal Shop Polygon
07-13 Hostel Polygon
3
08-01
Industrial
Manufacturing Polygon08-02 Service Polygon08-03 Chemical Polygon
08-04 Pharmaceutical Polygon08-05 Textile Polygon
08-06 IT Parks Polygon08-07 Industrial Estate / SEZ Polygon
4
09-01
Mixed
Residential & Commercial
Polygon
09-02 Residential &Household Industry
Polygon
09-03 Residential & Educational
Polygon
09-04 Residential & Health Services
Polygon
09-05 Commercial & Industrial
Polygon
Formulation of GIS based Master Plan for AMRUT Cities – Design & Standards 17
S.NoCODE
CLASS SUB-CLASS GEOMETRY
09-06 Commercial &Health Services
Polygon
09-07 Commercial and Educational
Polygon
09-08 Commercial and Recreational
Polygon
5
10-01
Educational
School Polygon
10-02 College Polygon
10-03 University Polygon
10-04 Vocational Institute Polygon
10-05 Anganwari Polygon
10-06 Training Institute Polygon
6
11-01
Health Services
Govt. Hospital Polygon
11-02 Private Hospital Polygon
11-03 Diagnostic Centre Polygon
11-04 Clinic / Dispensary Polygon
11-05 Nursing Home Polygon
11-06 Primary /Community Health Centre
Polygon
712-01 Central Govt.
Property
Office Polygon
Quarter Polygon
813-01 State Govt.
PropertyOffice Polygon
Quarter Polygon9 14-01 Railway Property Railway Property Polygon
10
15-01
Public& Semi-public
Private Office Polygon
15-02 Banks Polygon
15-03 Credit Society Polygon
15-04 Foreign Establishment Polygon
15-05 Police Station Polygon
15-06 Cantonment /Battalion Polygon
15-07 Jail Polygon
15-08 Crematorium / Burial Ground / Grave Yard
Polygon
15-09 Guesthouse Polygon
15-10 Community hall Polygon
15-11 Dharmashala Polygon
15-12 Tourist Facility Centre Polygon
15-13 Auditorium Polygon
15-14 Convention Centre Polygon
Formulation of GIS based Master Plan for AMRUT Cities Design & Standards 18
S.NoCODE
CLASS SUB-CLASS GEOMETRY
15-15 Museum Polygon
15-16 Public Library Polygon
15-17 Art & Cultural Centre Polygon
15-18 LPG/ CNG Gas Booking Office
Polygon
15-19 Ticket Booking & Reservation Office
Polygon
15-20 Stock Exchange Polygon
15-21 Disaster Management Centre
Polygon
15-23 Dhobi Ghat Polygon
15-24 Crech / Day Care Polygon
15-25 Public / Community Toilet
Polygon
15-26 Social Welfare Centre Polygon
15-27 Orphanage Polygon
15-28 Old Age Home Polygon
15-29 Night Shelter Polygon
15-30 Fire Station Polygon
11
16-01
Religious
Temple Polygon16-02 Mosque Polygon16-03 Idgah Polygon16-04 Church Polygon16-05 Gurudwara Polygon16-06 Monastery Polygon16-07 Synagogue Polygon
16-08 Chhatri Polygon
12
17-01
Recreational
Garden Polygon
17-02 Park Polygon
17-04 Club Polygon
17-05 Sports Centre Polygon
17-06 Gymnasium Polygon
17-07 Swimming Pool Polygon
17-08 Stadium Polygon
17-09 Planetarium Polygon
17-10 Aquarium Polygon
17-11 Open Air Theatre Polygon
17-12 Golf Course Polygon
17-13 Race Course Polygon
S.NoCODE
CLASS SUB-CLASS GEOMETRY
17-14 Exhibition Ground Polygon
17-15 Theme Park Polygon
13
18-01-01
Public Utilities
Water Treatment Plant Polygon
18-01-02Water Pumping Station
Polygon
18-01-03Ground Level Reservoir
Polygon
18-03-01Sewage Treatment Plant
Polygon
18-03-02Sewage Pumping Station
Polygon
18-04-01 Electric Power Plant Polygon
18-04-02 Electric Sub Station Polygon
18-05Rain Water Harvesting System
Polygon
18-06Effluent Treatment Plant
Polygon
14 19-03Solid Waste Management
Recycling Plant Polygon
15
20-01
Communication
Telephone exchange Polygon
20-02Post / Telegraph Office
Polygon
20-03 Radio/TV Station Polygon
20-04Satellite & Telecommunication Centre
Polygon
16
21-01
Heritage
Historical Monument Polygon
21-02 Fort Polygon
21-03 Archaeological Polygon
17
24-01
Transportation Node
Bus stand Polygon
24-02 Bus Terminus Polygon
24-03 Railway Station Polygon
24-04 Railway Yard / Sliding Polygon
24-05 Airport / Airstrip Polygon
24-06 Helipad Polygon
24-07 Port Polygon
24-08 Harbour Polygon
24-10 Truck Terminus Polygon
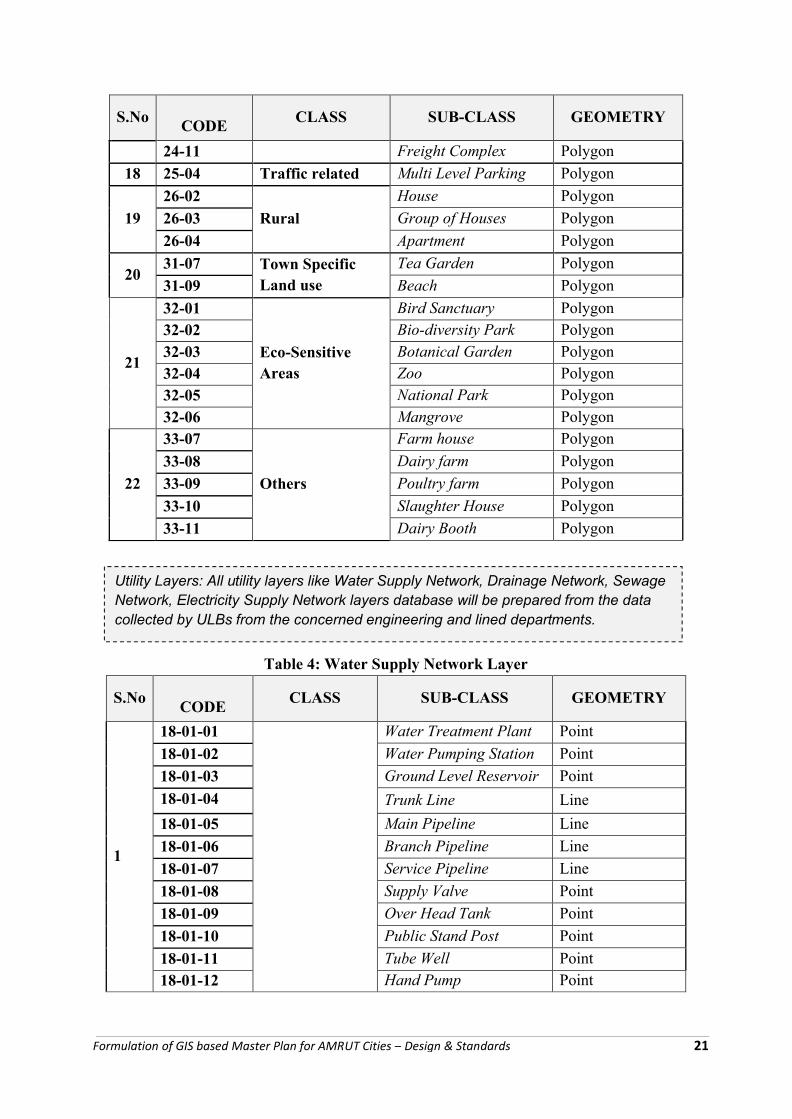
Utility Layers: All utility layers like Water Supply Network, Drainage Network, Sewage Network, Electricity Supply Network layers database will be prepared from the data collected by ULBs from the concerned engineering and lined departments.
S.NoCODE
CLASS SUB-CLASS GEOMETRY
24-11 Freight Complex Polygon
18 25-04 Traffic related Multi Level Parking Polygon
19
26-02
Rural
House Polygon
26-03 Group of Houses Polygon
26-04 Apartment Polygon
2031-07 Town Specific
Land useTea Garden Polygon
31-09 Beach Polygon
21
32-01
Eco-Sensitive Areas
Bird Sanctuary Polygon32-02 Bio-diversity Park Polygon
32-03 Botanical Garden Polygon32-04 Zoo Polygon32-05 National Park Polygon
32-06 Mangrove Polygon
22
33-07
Others
Farm house Polygon
33-08 Dairy farm Polygon
33-09 Poultry farm Polygon
33-10 Slaughter House Polygon
33-11 Dairy Booth Polygon
Table 4: Water Supply Network Layer
S.NoCODE
CLASS SUB-CLASS GEOMETRY
1
18-01-01 Water Treatment Plant Point
18-01-02 Water Pumping Station Point
18-01-03 Ground Level Reservoir Point
18-01-04 Trunk Line Line
18-01-05 Main Pipeline Line
18-01-06 Branch Pipeline Line
18-01-07 Service Pipeline Line
18-01-08 Supply Valve Point
18-01-09 Over Head Tank Point
18-01-10 Public Stand Post Point
18-01-11 Tube Well Point18-01-12 Hand Pump Point
Formulation of GIS based Master Plan for AMRUT Cities – Design & Standards 21
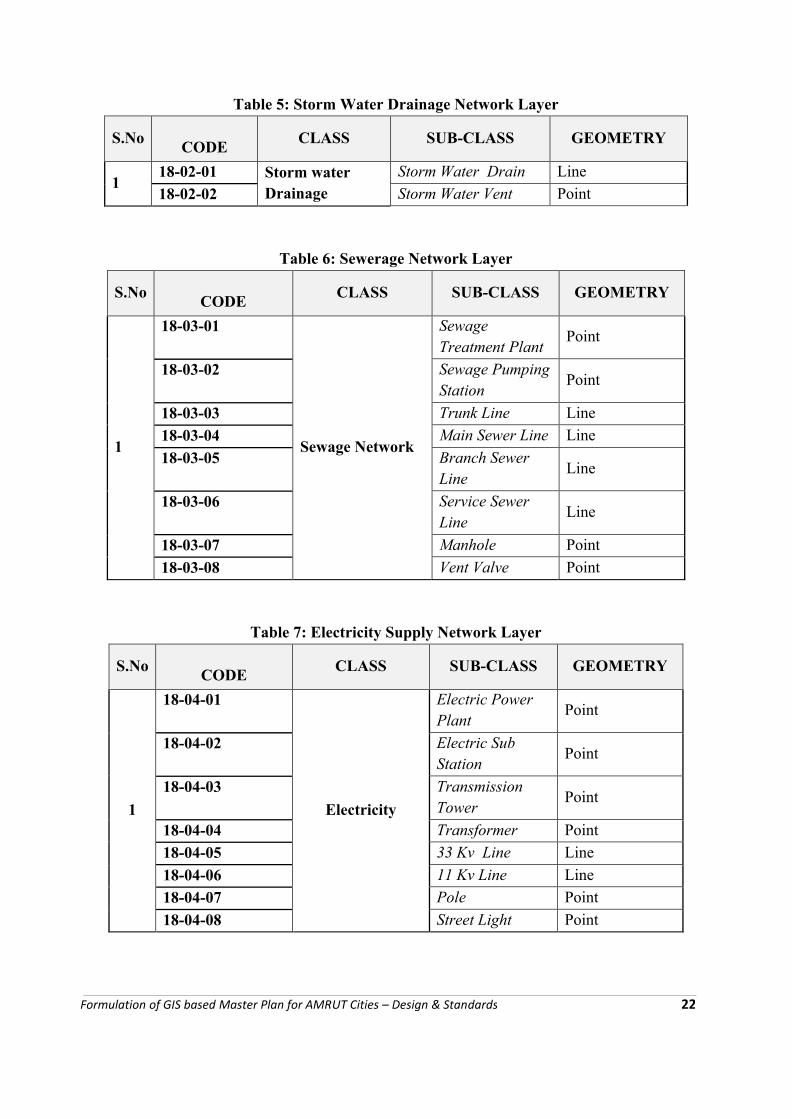
Table 5: Storm Water Drainage Network Layer
S.NoCODE
CLASS SUB-CLASS GEOMETRY
118-02-01 Storm water
DrainageStorm Water Drain Line
18-02-02 Storm Water Vent Point
Table 6: Sewerage Network Layer
S.NoCODE
CLASS SUB-CLASS GEOMETRY
1
18-03-01
Sewage Network
Sewage Treatment Plant
Point
18-03-02 Sewage Pumping Station
Point
18-03-03 Trunk Line Line
18-03-04 Main Sewer Line Line
18-03-05 Branch Sewer Line
Line
18-03-06 Service Sewer Line
Line
18-03-07 Manhole Point
18-03-08 Vent Valve Point
Table 7: Electricity Supply Network Layer
S.NoCODE
CLASS SUB-CLASS GEOMETRY
1
18-04-01
Electricity
Electric Power Plant
Point
18-04-02 Electric Sub Station
Point
18-04-03 Transmission Tower
Point
18-04-04 Transformer Point
18-04-05 33 Kv Line Line
18-04-06 11 Kv Line Line
18-04-07 Pole Point
18-04-08 Street Light Point
Formulation of GIS based Master Plan for AMRUT Cities – Design & Standards 22
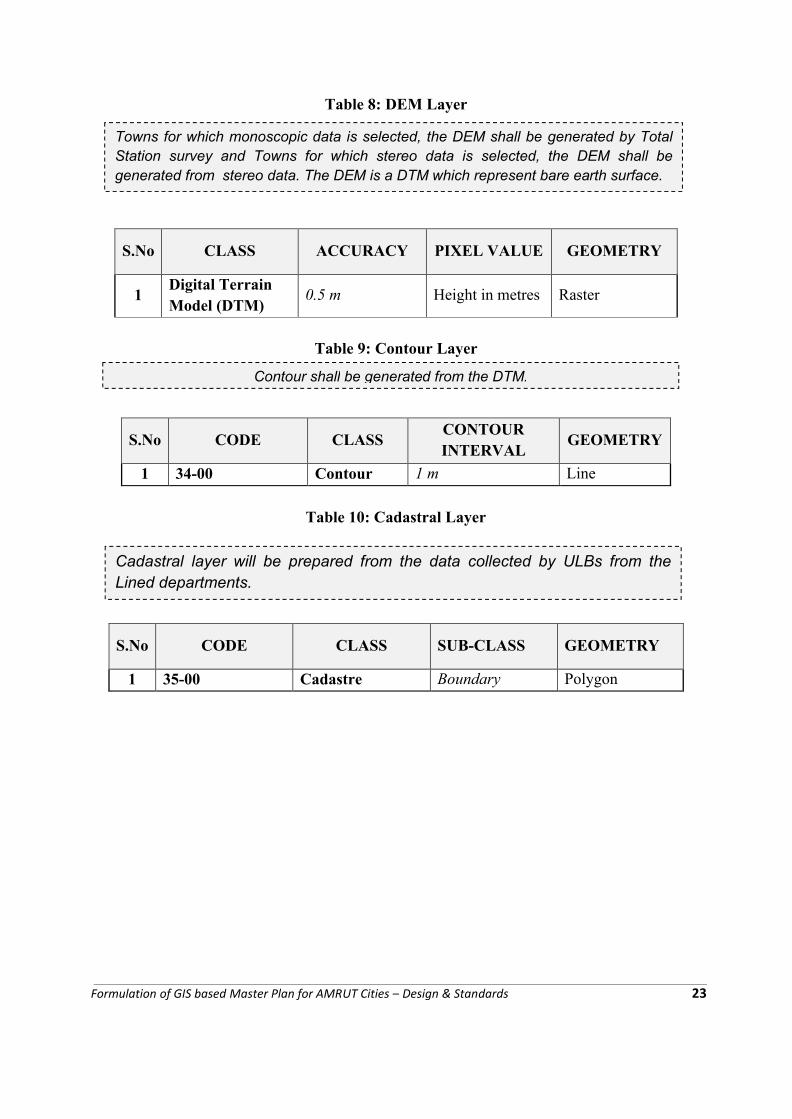
Towns for which monoscopic data is selected, the DEM shall be generated by Total Station survey and Towns for which stereo data is selected, the DEM shall be generated from stereo data. The DEM is a DTM which represent bare earth surface.
Table 8: DEM Layer
S.No CLASS ACCURACY PIXEL VALUE GEOMETRY
1Digital Terrain Model (DTM)
0.5 m Height in metres Raster
Table 9: Contour Layer
S.No CODE CLASSCONTOUR INTERVAL
GEOMETRY
1 34-00 Contour 1 m Line
Table 10: Cadastral Layer
S.No CODE CLASS SUB-CLASS GEOMETRY
1 35-00 Cadastre Boundary Polygon
Contour shall be generated from the DTM.
Cadastral layer will be prepared from the data collected by ULBs from the Lined departments.
Formulation of GIS based Master Plan for AMRUT Cities – Design & Standards 23
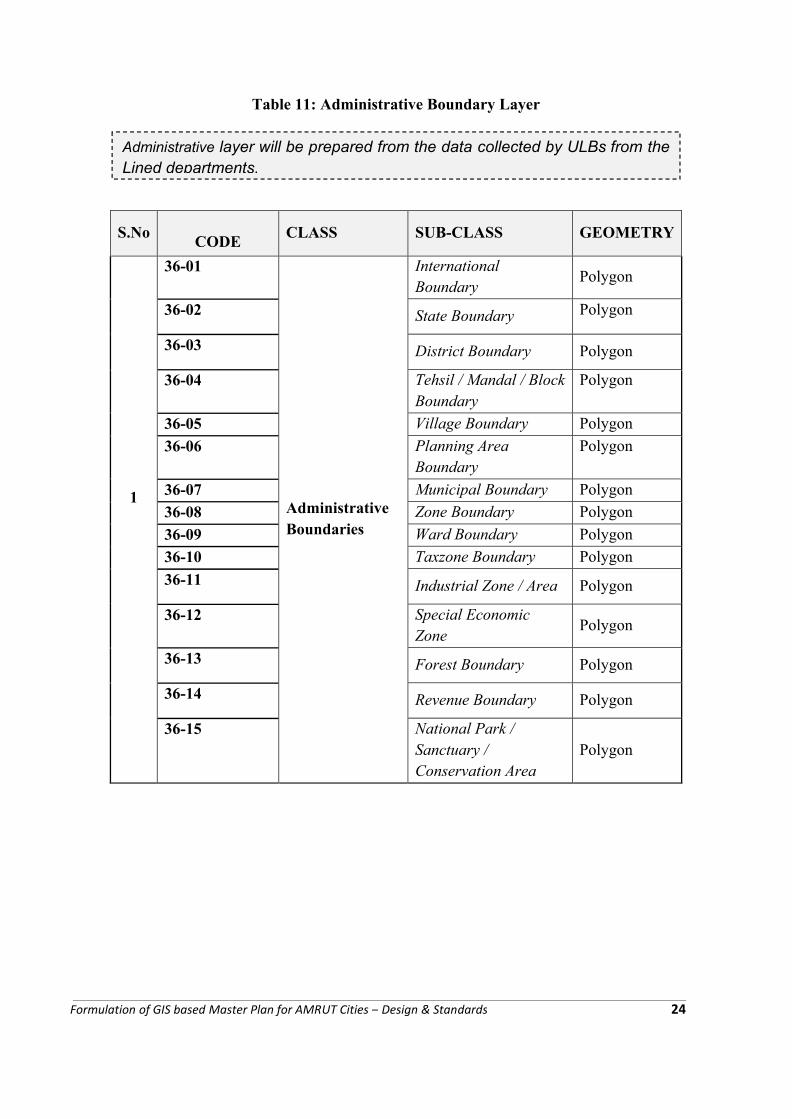
Table 11: Administrative Boundary Layer
S.NoCODE
CLASS SUB-CLASS GEOMETRY
1
36-01
Administrative Boundaries
International Boundary
Polygon
36-02 State Boundary Polygon
36-03 District Boundary Polygon
36-04 Tehsil / Mandal / Block Boundary
Polygon
36-05 Village Boundary Polygon
36-06 Planning Area Boundary
Polygon
36-07 Municipal Boundary Polygon
36-08 Zone Boundary Polygon
36-09 Ward Boundary Polygon
36-10 Taxzone Boundary Polygon
36-11 Industrial Zone / Area Polygon
36-12 Special Economic Zone
Polygon
36-13 Forest Boundary Polygon
36-14 Revenue Boundary Polygon
36-15 National Park / Sanctuary / Conservation Area
Polygon
Administrative layer will be prepared from the data collected by ULBs from the Lined departments.
Formulation of GIS based Master Plan for AMRUT Cities – Design & Standards 24
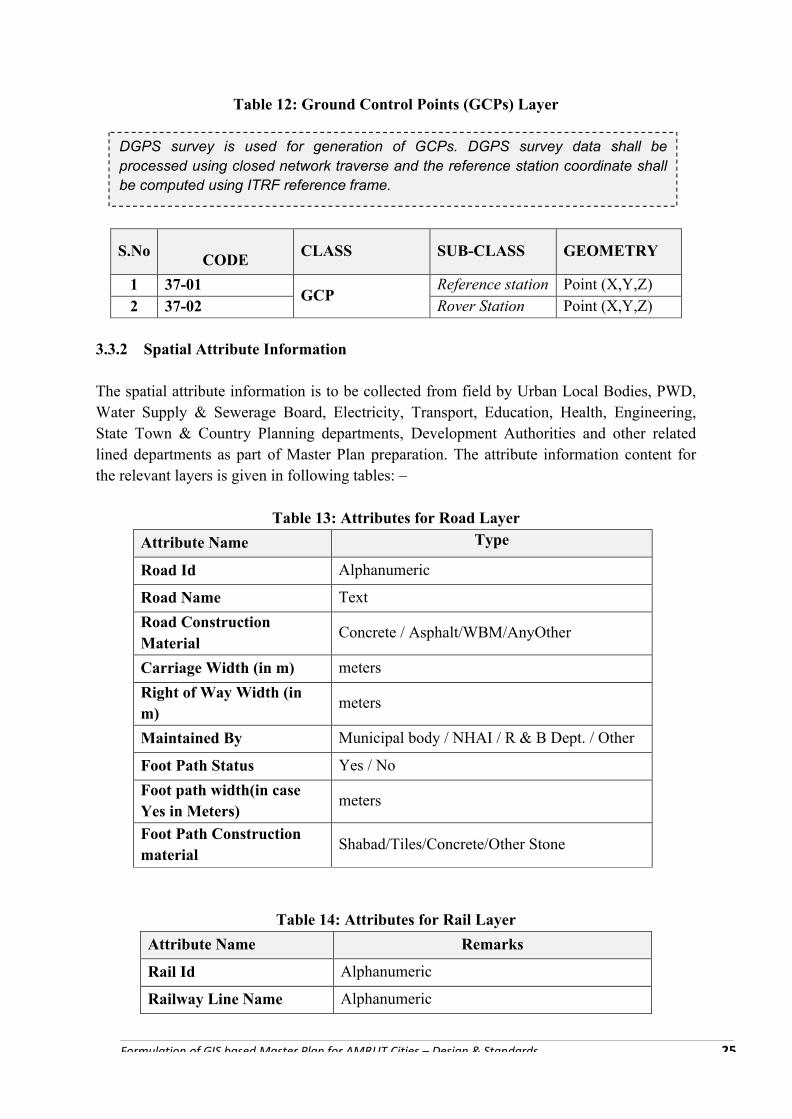
Table 12: Ground Control Points (GCPs) Layer
S.NoCODE
CLASS SUB-CLASS GEOMETRY
1 37-01GCP
Reference station Point (X,Y,Z)2 37-02 Rover Station Point (X,Y,Z)
3.3.2 Spatial Attribute Information
The spatial attribute information is to be collected from field by Urban Local Bodies, PWD, Water Supply & Sewerage Board, Electricity, Transport, Education, Health, Engineering, State Town & Country Planning departments, Development Authorities and other related lined departments as part of Master Plan preparation. The attribute information content for the relevant layers is given in following tables: –
Table 13: Attributes for Road Layer
Attribute Name Type
Road Id Alphanumeric
Road Name Text
Road Construction Material
Concrete / Asphalt/WBM/AnyOther
Carriage Width (in m) meters
Right of Way Width (in m)
meters
Maintained By Municipal body / NHAI / R & B Dept. / Other
Foot Path Status Yes / No
Foot path width(in case Yes in Meters)
meters
Foot Path Construction material
Shabad/Tiles/Concrete/Other Stone
Table 14: Attributes for Rail Layer
Attribute Name Remarks
Rail Id Alphanumeric
Railway Line Name Alphanumeric
DGPS survey is used for generation of GCPs. DGPS survey data shall be processed using closed network traverse and the reference station coordinate shall be computed using ITRF reference frame.
Formulation of GIS based Master Plan for AMRUT Cities – Design & Standards 25
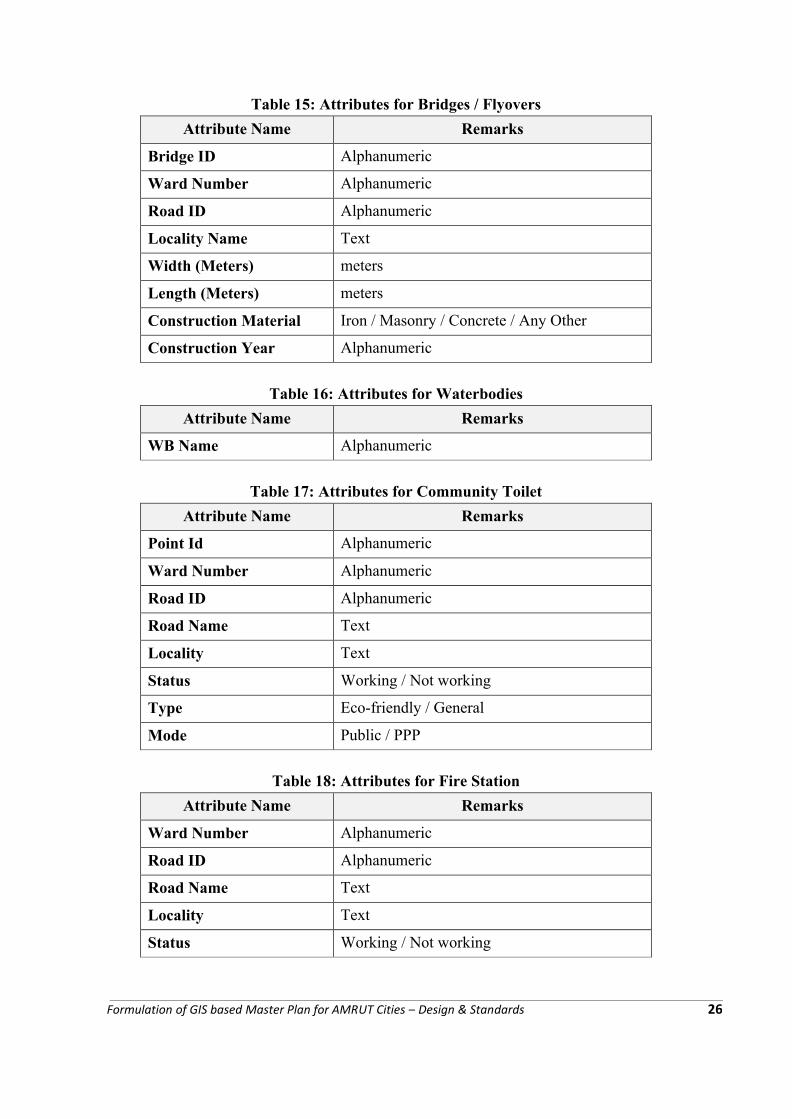
Table 15: Attributes for Bridges / Flyovers
Attribute Name Remarks
Bridge ID Alphanumeric
Ward Number Alphanumeric
Road ID Alphanumeric
Locality Name Text
Width (Meters) meters
Length (Meters) meters
Construction Material Iron / Masonry / Concrete / Any Other
Construction Year Alphanumeric
Table 16: Attributes for Waterbodies
Attribute Name Remarks
WB Name Alphanumeric
Table 17: Attributes for Community Toilet
Attribute Name Remarks
Point Id Alphanumeric
Ward Number Alphanumeric
Road ID Alphanumeric
Road Name Text
Locality Text
Status Working / Not working
Type Eco-friendly / General
Mode Public / PPP
Table 18: Attributes for Fire Station
Attribute Name Remarks
Ward Number Alphanumeric
Road ID Alphanumeric
Road Name Text
Locality Text
Status Working / Not working
Formulation of GIS based Master Plan for AMRUT Cities – Design & Standards 26
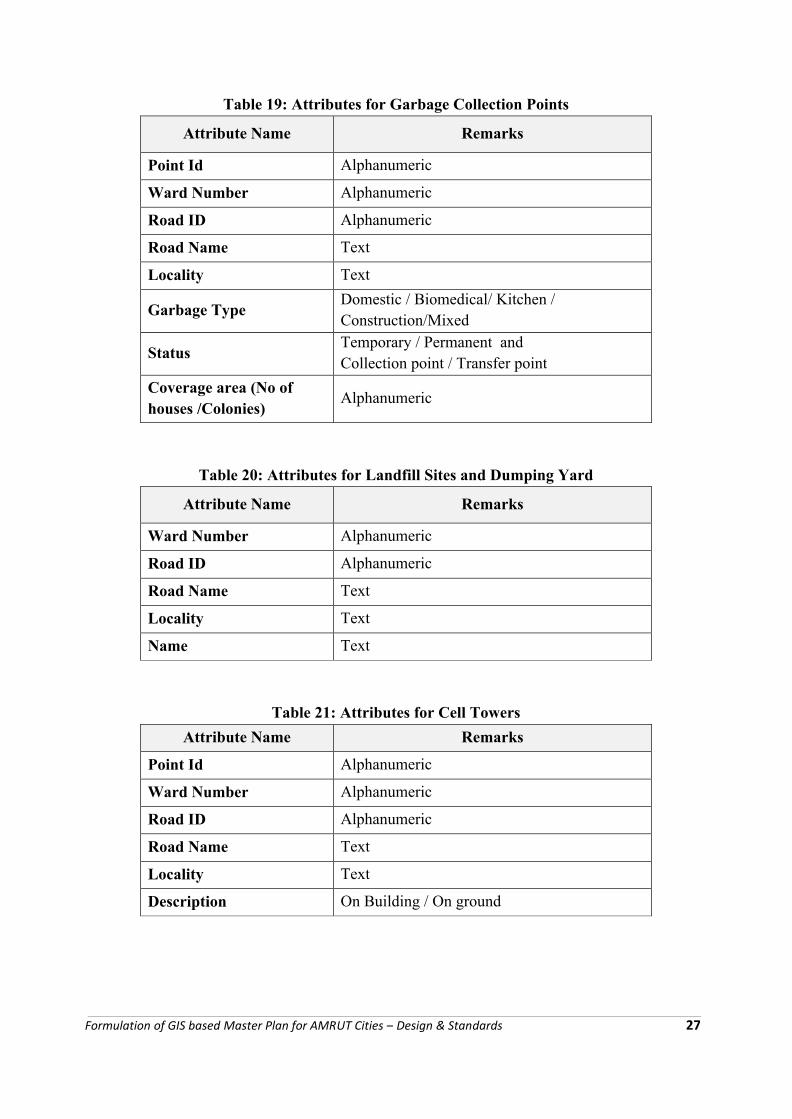
Table 19: Attributes for Garbage Collection Points
Attribute Name Remarks
Point Id Alphanumeric
Ward Number Alphanumeric
Road ID Alphanumeric
Road Name Text
Locality Text
Garbage TypeDomestic / Biomedical/ Kitchen / Construction/Mixed
StatusTemporary / Permanent andCollection point / Transfer point
Coverage area (No of houses /Colonies)
Alphanumeric
Table 20: Attributes for Landfill Sites and Dumping Yard
Attribute Name Remarks
Ward Number Alphanumeric
Road ID Alphanumeric
Road Name Text
Locality Text
Name Text
Table 21: Attributes for Cell Towers
Attribute Name Remarks
Point Id Alphanumeric
Ward Number Alphanumeric
Road ID Alphanumeric
Road Name Text
Locality Text
Description On Building / On ground
Formulation of GIS based Master Plan for AMRUT Cities – Design & Standards 27
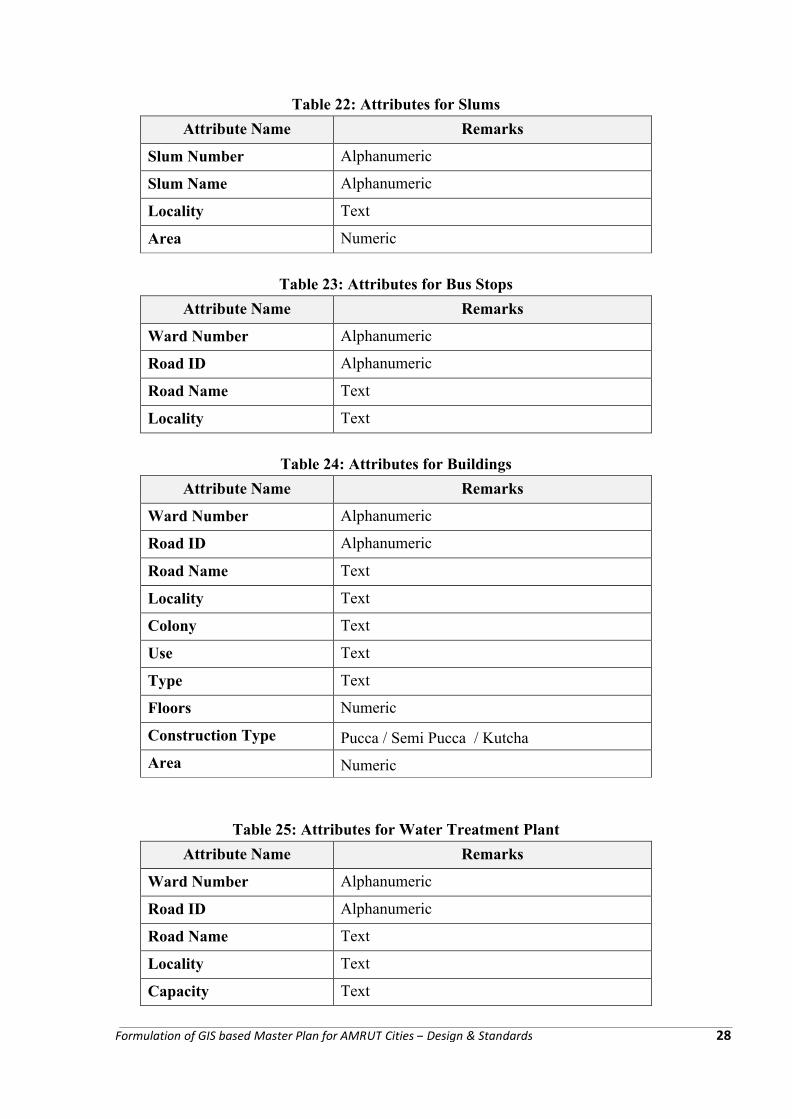
Table 22: Attributes for Slums
Attribute Name Remarks
Slum Number Alphanumeric
Slum Name Alphanumeric
Locality Text
Area Numeric
Table 23: Attributes for Bus Stops
Attribute Name Remarks
Ward Number Alphanumeric
Road ID Alphanumeric
Road Name Text
Locality Text
Table 24: Attributes for Buildings
Attribute Name Remarks
Ward Number Alphanumeric
Road ID Alphanumeric
Road Name Text
Locality Text
Colony Text
Use Text
Type Text
Floors Numeric
Construction Type Pucca / Semi Pucca / Kutcha
Area Numeric
Table 25: Attributes for Water Treatment Plant
Attribute Name Remarks
Ward Number Alphanumeric
Road ID Alphanumeric
Road Name Text
Locality Text
Capacity Text
Formulation of GIS based Master Plan for AMRUT Cities – Design & Standards 28
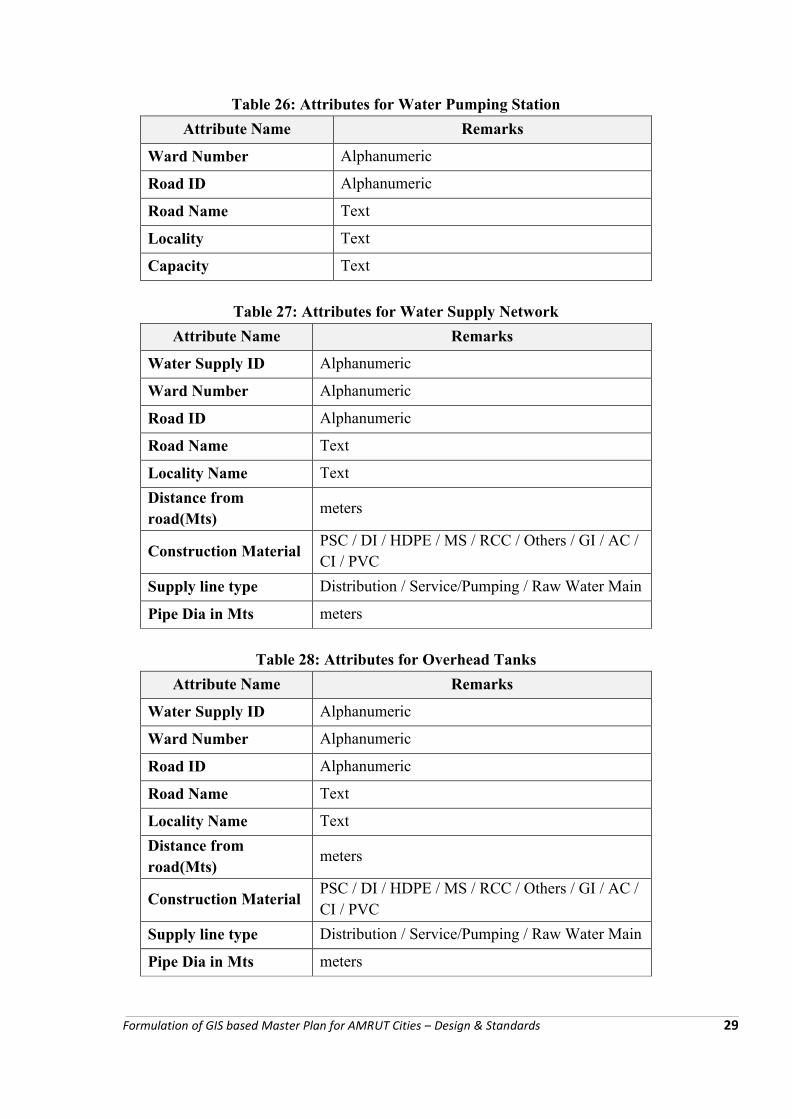
Table 26: Attributes for Water Pumping Station
Attribute Name Remarks
Ward Number Alphanumeric
Road ID Alphanumeric
Road Name Text
Locality Text
Capacity Text
Table 27: Attributes for Water Supply Network
Attribute Name Remarks
Water Supply ID Alphanumeric
Ward Number Alphanumeric
Road ID Alphanumeric
Road Name Text
Locality Name Text
Distance from road(Mts)
meters
Construction MaterialPSC / DI / HDPE / MS / RCC / Others / GI / AC / CI / PVC
Supply line type Distribution / Service/Pumping / Raw Water Main
Pipe Dia in Mts meters
Table 28: Attributes for Overhead Tanks
Attribute Name Remarks
Water Supply ID Alphanumeric
Ward Number Alphanumeric
Road ID Alphanumeric
Road Name Text
Locality Name Text
Distance from road(Mts)
meters
Construction MaterialPSC / DI / HDPE / MS / RCC / Others / GI / AC / CI / PVC
Supply line type Distribution / Service/Pumping / Raw Water Main
Pipe Dia in Mts meters
Formulation of GIS based Master Plan for AMRUT Cities – Design & Standards 29
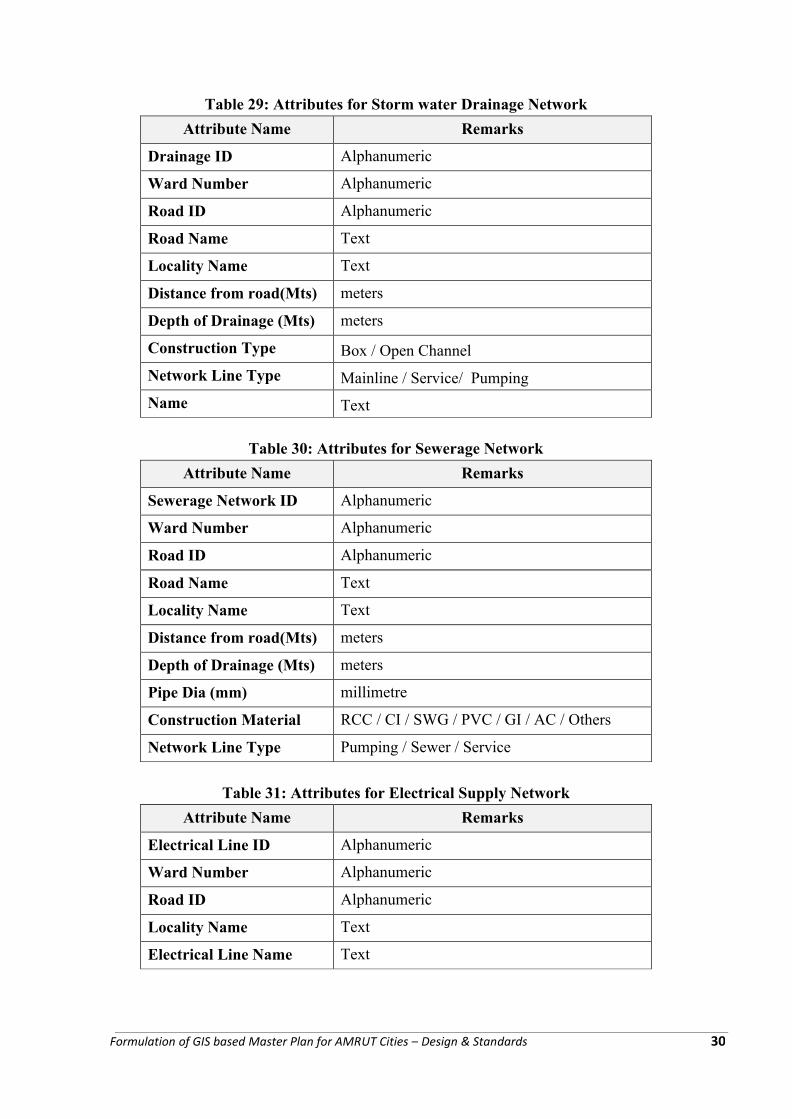
Table 29: Attributes for Storm water Drainage Network
Attribute Name Remarks
Drainage ID Alphanumeric
Ward Number Alphanumeric
Road ID Alphanumeric
Road Name Text
Locality Name Text
Distance from road(Mts) meters
Depth of Drainage (Mts) meters
Construction Type Box / Open Channel
Network Line Type Mainline / Service/ Pumping
Name Text
Table 30: Attributes for Sewerage Network
Attribute Name Remarks
Sewerage Network ID Alphanumeric
Ward Number Alphanumeric
Road ID Alphanumeric
Road Name Text
Locality Name Text
Distance from road(Mts) meters
Depth of Drainage (Mts) meters
Pipe Dia (mm) millimetre
Construction Material RCC / CI / SWG / PVC / GI / AC / Others
Network Line Type Pumping / Sewer / Service
Table 31: Attributes for Electrical Supply Network
Attribute Name Remarks
Electrical Line ID Alphanumeric
Ward Number Alphanumeric
Road ID Alphanumeric
Locality Name Text
Electrical Line Name Text
Formulation of GIS based Master Plan for AMRUT Cities – Design & Standards 30
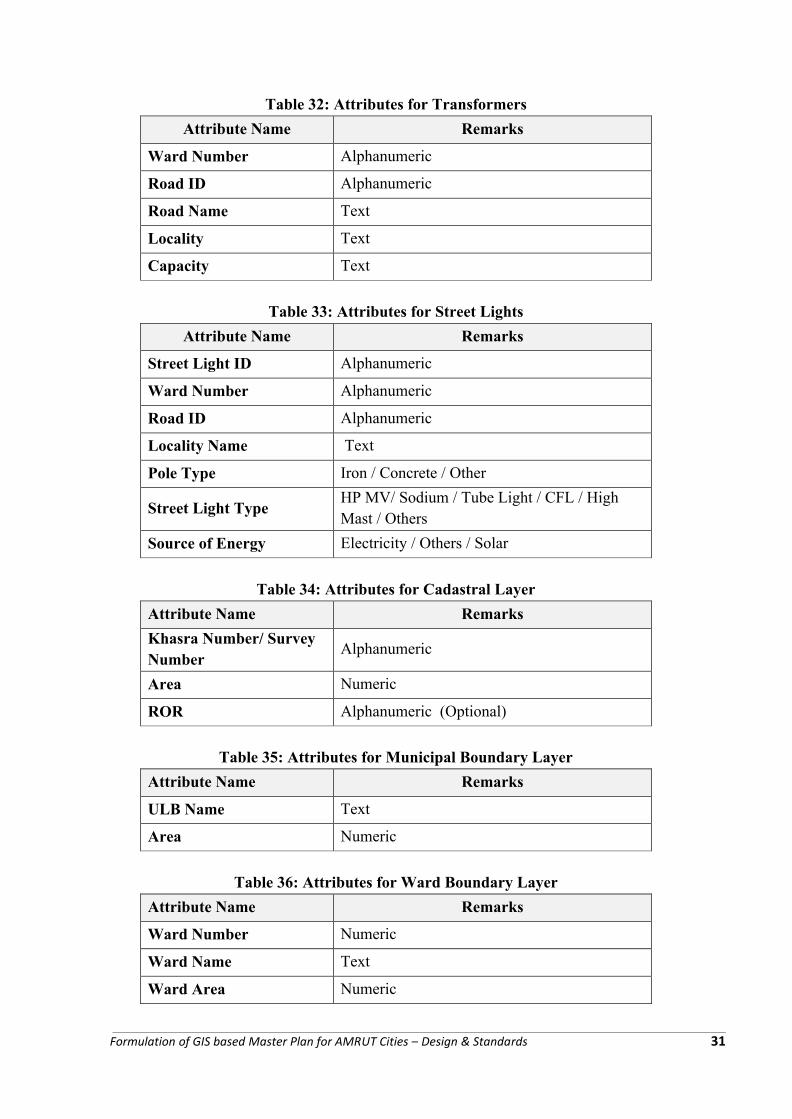
Table 32: Attributes for Transformers
Attribute Name Remarks
Ward Number Alphanumeric
Road ID Alphanumeric
Road Name Text
Locality Text
Capacity Text
Table 33: Attributes for Street Lights
Attribute Name Remarks
Street Light ID Alphanumeric
Ward Number Alphanumeric
Road ID Alphanumeric
Locality Name Text
Pole Type Iron / Concrete / Other
Street Light TypeHP MV/ Sodium / Tube Light / CFL / High Mast / Others
Source of Energy Electricity / Others / Solar
Table 34: Attributes for Cadastral Layer
Attribute Name Remarks
Khasra Number/ Survey Number
Alphanumeric
Area Numeric
ROR Alphanumeric (Optional)
Table 35: Attributes for Municipal Boundary Layer
Attribute Name Remarks
ULB Name Text
Area Numeric
Table 36: Attributes for Ward Boundary Layer
Attribute Name Remarks
Ward Number Numeric
Ward Name Text
Ward Area Numeric
Formulation of GIS based Master Plan for AMRUT Cities – Design & Standards 31
The Planimetric accuracy defined for 1:4000 is 1m (0.25mm of the scale).
The Thematic accuracy shall be defined as 90% accuracy at 90% confidence/probability.
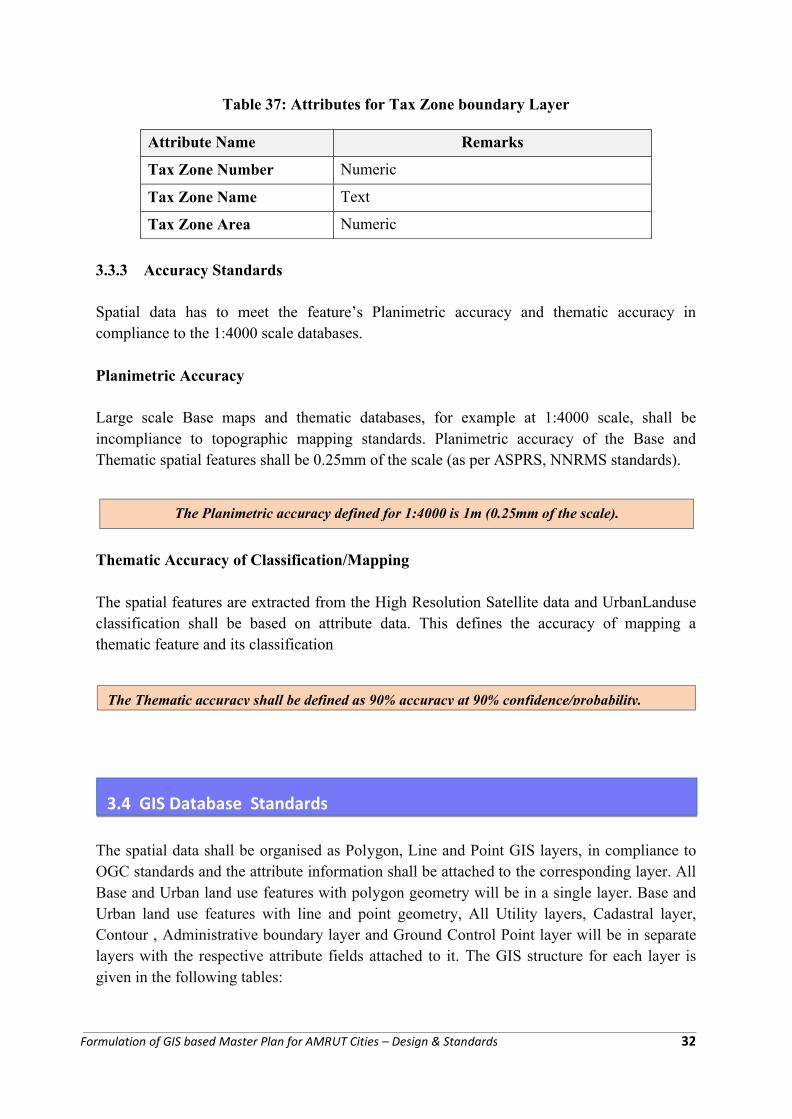
Table 37: Attributes for Tax Zone boundary Layer
Attribute Name Remarks
Tax Zone Number Numeric
Tax Zone Name Text
Tax Zone Area Numeric
3.3.3 Accuracy Standards
Spatial data has to meet the feature’s Planimetric accuracy and thematic accuracy in compliance to the 1:4000 scale databases.
Planimetric Accuracy
Large scale Base maps and thematic databases, for example at 1:4000 scale, shall be incompliance to topographic mapping standards. Planimetric accuracy of the Base and Thematic spatial features shall be 0.25mm of the scale (as per ASPRS, NNRMS standards).
Thematic Accuracy of Classification/Mapping
The spatial features are extracted from the High Resolution Satellite data and UrbanLanduse classification shall be based on attribute data. This defines the accuracy of mapping a thematic feature and its classification
The spatial data shall be organised as Polygon, Line and Point GIS layers, in compliance to OGC standards and the attribute information shall be attached to the corresponding layer. All Base and Urban land use features with polygon geometry will be in a single layer. Base and Urban land use features with line and point geometry, All Utility layers, Cadastral layer, Contour , Administrative boundary layer and Ground Control Point layer will be in separate layers with the respective attribute fields attached to it. The GIS structure for each layer is given in the following tables:
3.4 GIS Database Standards
Formulation of GIS based Master Plan for AMRUT Cities – Design & Standards 32
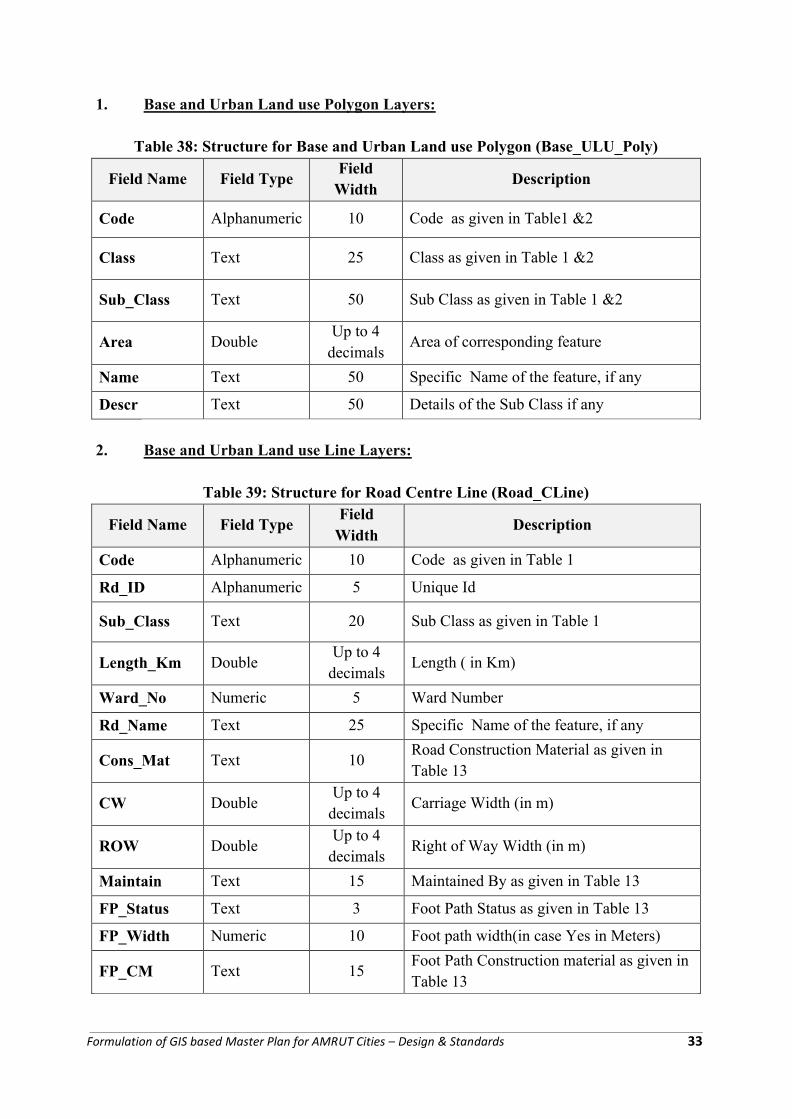
1. Base and Urban Land use Polygon Layers:
Table 38: Structure for Base and Urban Land use Polygon (Base_ULU_Poly)
Field Name Field TypeField
WidthDescription
Code Alphanumeric 10 Code as given in Table1 &2
Class Text 25 Class as given in Table 1 &2
Sub_Class Text 50 Sub Class as given in Table 1 &2
Area DoubleUp to 4
decimalsArea of corresponding feature
Name Text 50 Specific Name of the feature, if any
Descr Text 50 Details of the Sub Class if any
2. Base and Urban Land use Line Layers:
Table 39: Structure for Road Centre Line (Road_CLine)
Field Name Field TypeField
WidthDescription
Code Alphanumeric 10 Code as given in Table 1
Rd_ID Alphanumeric 5 Unique Id
Sub_Class Text 20 Sub Class as given in Table 1
Length_Km DoubleUp to 4
decimalsLength ( in Km)
Ward_No Numeric 5 Ward Number
Rd_Name Text 25 Specific Name of the feature, if any
Cons_Mat Text 10Road Construction Material as given in Table 13
CW DoubleUp to 4
decimalsCarriage Width (in m)
ROW DoubleUp to 4
decimalsRight of Way Width (in m)
Maintain Text 15 Maintained By as given in Table 13
FP_Status Text 3 Foot Path Status as given in Table 13
FP_Width Numeric 10 Foot path width(in case Yes in Meters)
FP_CM Text 15Foot Path Construction material as given in Table 13
Formulation of GIS based Master Plan for AMRUT Cities – Design & Standards 33
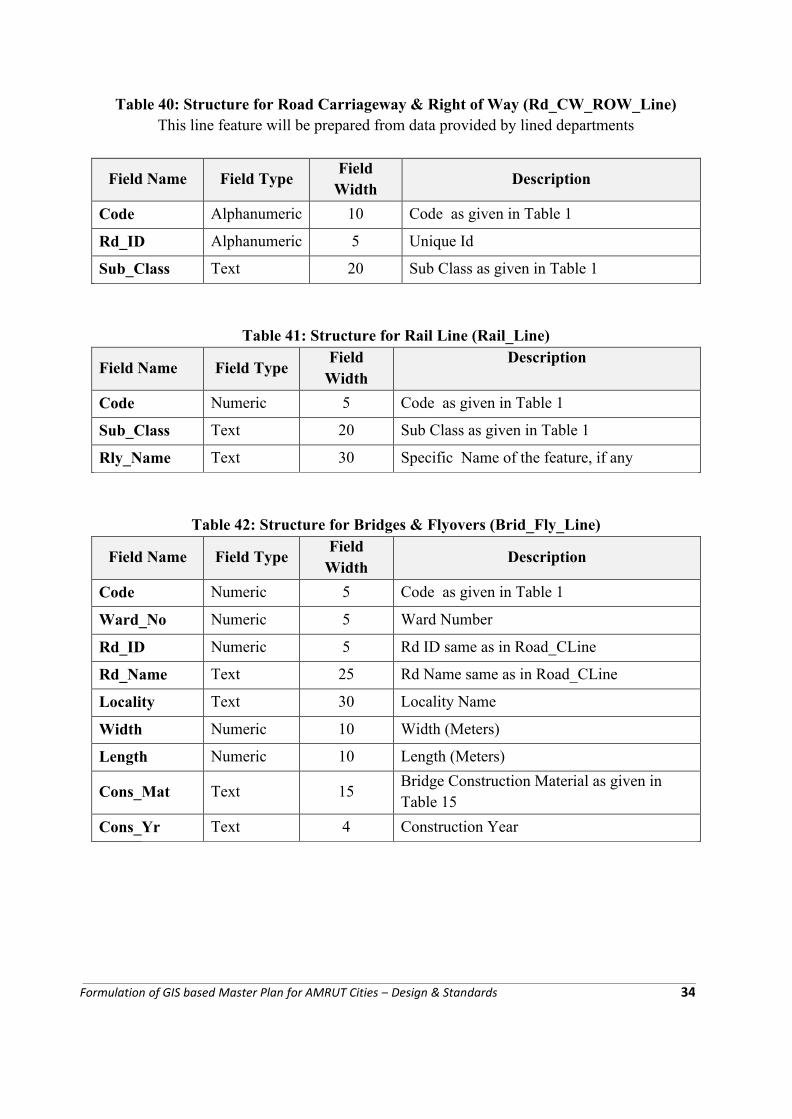
Table 40: Structure for Road Carriageway & Right of Way (Rd_CW_ROW_Line)This line feature will be prepared from data provided by lined departments
Field Name Field TypeField
WidthDescription
Code Alphanumeric 10 Code as given in Table 1
Rd_ID Alphanumeric 5 Unique Id
Sub_Class Text 20 Sub Class as given in Table 1
Table 41: Structure for Rail Line (Rail_Line)
Field Name Field TypeField
WidthDescription
Code Numeric 5 Code as given in Table 1
Sub_Class Text 20 Sub Class as given in Table 1
Rly_Name Text 30 Specific Name of the feature, if any
Table 42: Structure for Bridges & Flyovers (Brid_Fly_Line)
Field Name Field TypeField
WidthDescription
Code Numeric 5 Code as given in Table 1
Ward_No Numeric 5 Ward Number
Rd_ID Numeric 5 Rd ID same as in Road_CLine
Rd_Name Text 25 Rd Name same as in Road_CLine
Locality Text 30 Locality Name
Width Numeric 10 Width (Meters)
Length Numeric 10 Length (Meters)
Cons_Mat Text 15Bridge Construction Material as given in Table 15
Cons_Yr Text 4 Construction Year
Formulation of GIS based Master Plan for AMRUT Cities – Design & Standards 34
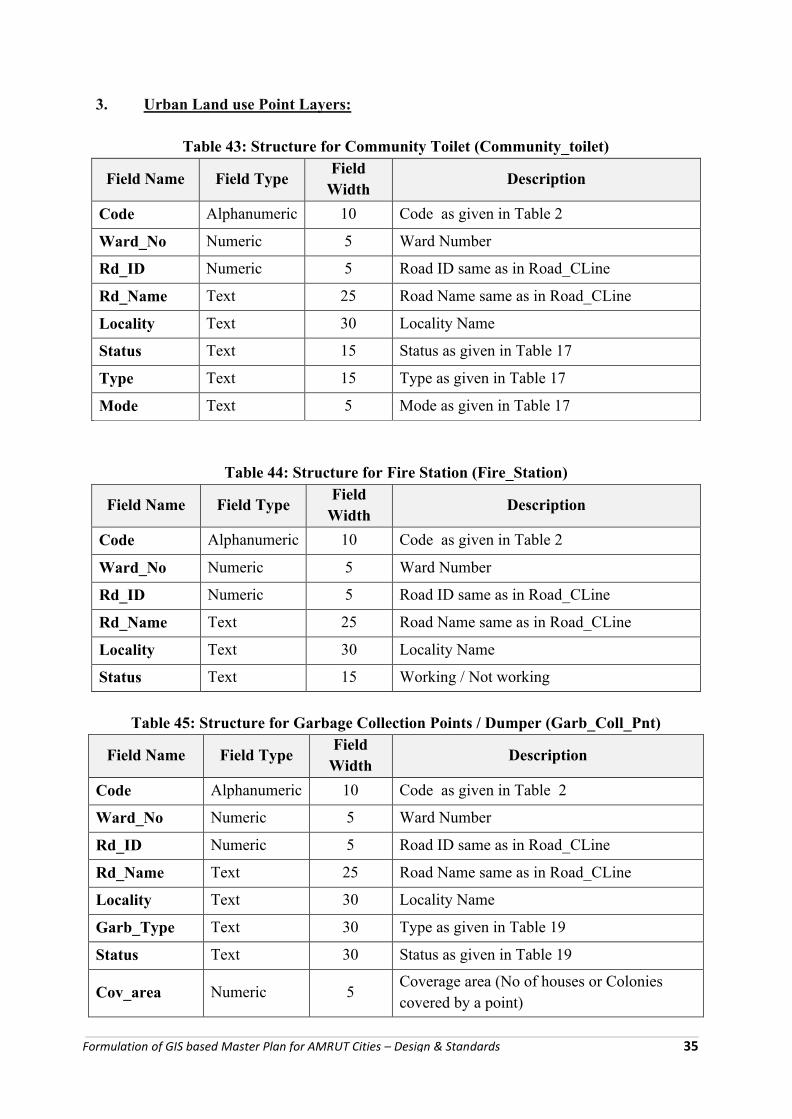
3. Urban Land use Point Layers:
Table 43: Structure for Community Toilet (Community_toilet)
Field Name Field TypeField
WidthDescription
Code Alphanumeric 10 Code as given in Table 2
Ward_No Numeric 5 Ward Number
Rd_ID Numeric 5 Road ID same as in Road_CLine
Rd_Name Text 25 Road Name same as in Road_CLine
Locality Text 30 Locality Name
Status Text 15 Status as given in Table 17
Type Text 15 Type as given in Table 17
Mode Text 5 Mode as given in Table 17
Table 44: Structure for Fire Station (Fire_Station)
Field Name Field TypeField
WidthDescription
Code Alphanumeric 10 Code as given in Table 2
Ward_No Numeric 5 Ward Number
Rd_ID Numeric 5 Road ID same as in Road_CLine
Rd_Name Text 25 Road Name same as in Road_CLine
Locality Text 30 Locality Name
Status Text 15 Working / Not working
Table 45: Structure for Garbage Collection Points / Dumper (Garb_Coll_Pnt)
Field Name Field TypeField
WidthDescription
Code Alphanumeric 10 Code as given in Table 2
Ward_No Numeric 5 Ward Number
Rd_ID Numeric 5 Road ID same as in Road_CLine
Rd_Name Text 25 Road Name same as in Road_CLine
Locality Text 30 Locality Name
Garb_Type Text 30 Type as given in Table 19
Status Text 30 Status as given in Table 19
Cov_area Numeric 5Coverage area (No of houses or Colonies covered by a point)
Formulation of GIS based Master Plan for AMRUT Cities – Design & Standards 35
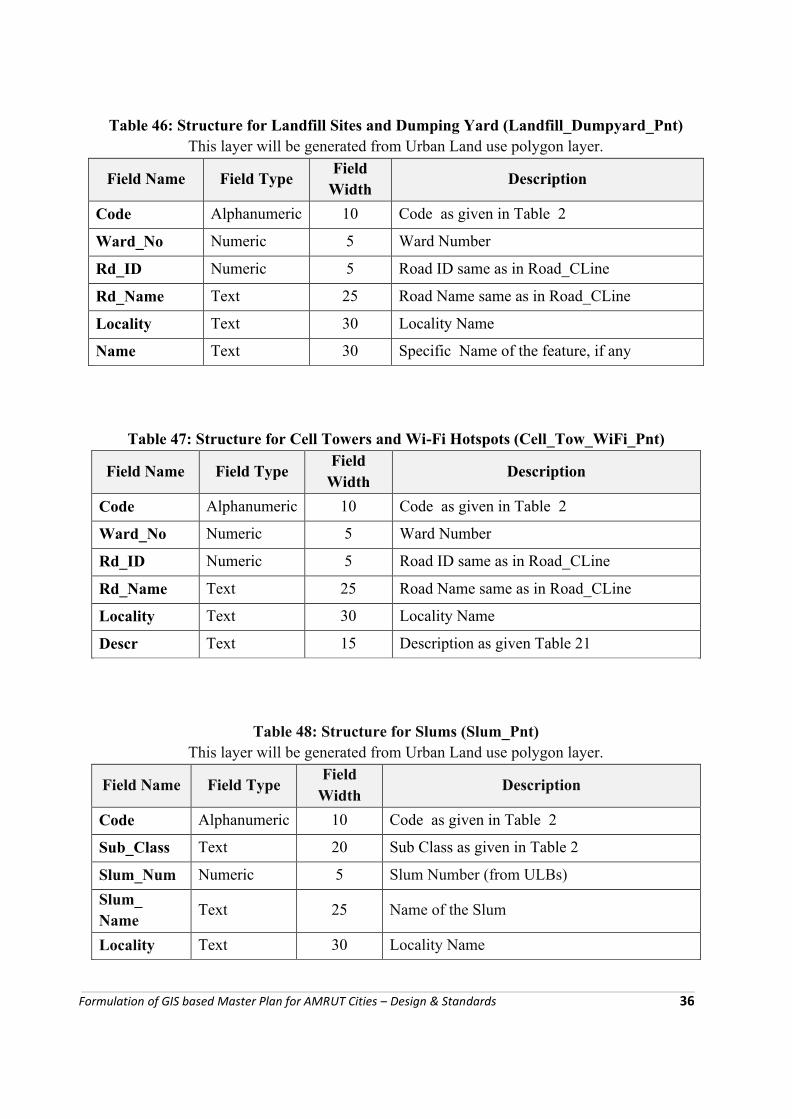
Table 46: Structure for Landfill Sites and Dumping Yard (Landfill_Dumpyard_Pnt)This layer will be generated from Urban Land use polygon layer.
Field Name Field TypeField
WidthDescription
Code Alphanumeric 10 Code as given in Table 2
Ward_No Numeric 5 Ward Number
Rd_ID Numeric 5 Road ID same as in Road_CLine
Rd_Name Text 25 Road Name same as in Road_CLine
Locality Text 30 Locality Name
Name Text 30 Specific Name of the feature, if any
Table 47: Structure for Cell Towers and Wi-Fi Hotspots (Cell_Tow_WiFi_Pnt)
Field Name Field TypeField
WidthDescription
Code Alphanumeric 10 Code as given in Table 2
Ward_No Numeric 5 Ward Number
Rd_ID Numeric 5 Road ID same as in Road_CLine
Rd_Name Text 25 Road Name same as in Road_CLine
Locality Text 30 Locality Name
Descr Text 15 Description as given Table 21
Table 48: Structure for Slums (Slum_Pnt)This layer will be generated from Urban Land use polygon layer.
Field Name Field TypeField
WidthDescription
Code Alphanumeric 10 Code as given in Table 2
Sub_Class Text 20 Sub Class as given in Table 2
Slum_Num Numeric 5 Slum Number (from ULBs)
Slum_ Name
Text 25 Name of the Slum
Locality Text 30 Locality Name
Formulation of GIS based Master Plan for AMRUT Cities – Design & Standards 36
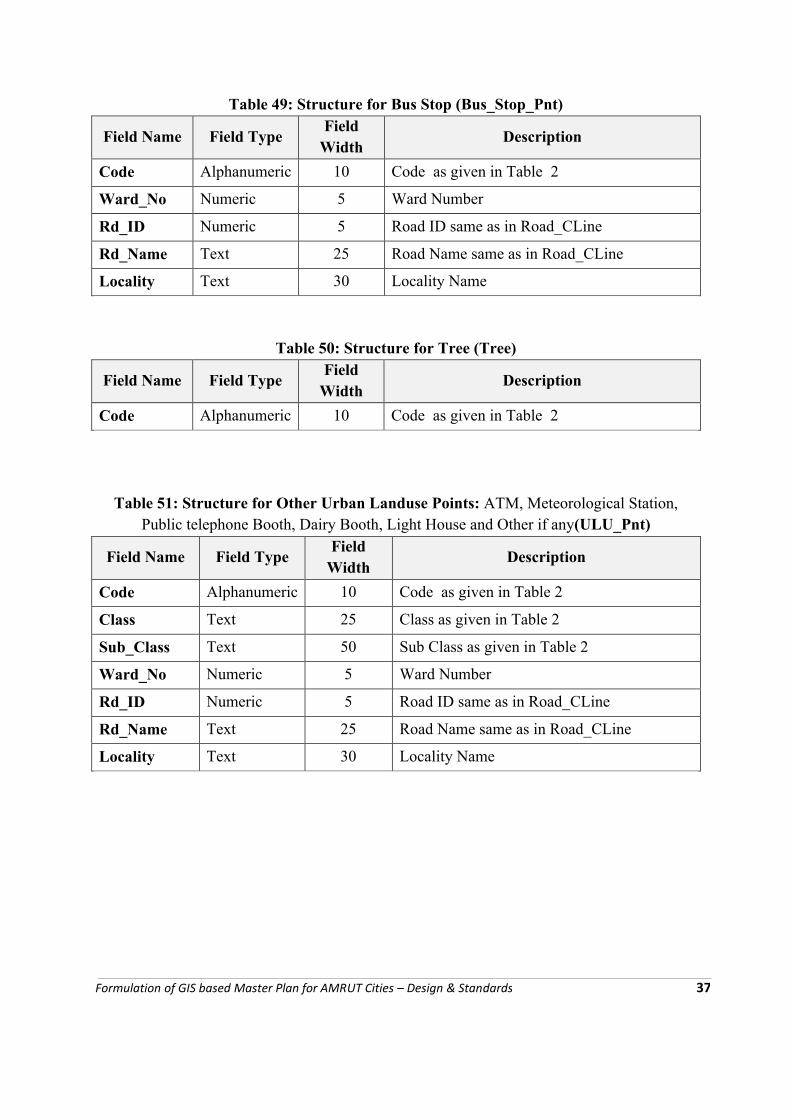
Table 49: Structure for Bus Stop (Bus_Stop_Pnt)
Field Name Field TypeField
WidthDescription
Code Alphanumeric 10 Code as given in Table 2
Ward_No Numeric 5 Ward Number
Rd_ID Numeric 5 Road ID same as in Road_CLine
Rd_Name Text 25 Road Name same as in Road_CLine
Locality Text 30 Locality Name
Table 50: Structure for Tree (Tree)
Field Name Field TypeField
WidthDescription
Code Alphanumeric 10 Code as given in Table 2
Table 51: Structure for Other Urban Landuse Points: ATM, Meteorological Station, Public telephone Booth, Dairy Booth, Light House and Other if any(ULU_Pnt)
Field Name Field TypeField
WidthDescription
Code Alphanumeric 10 Code as given in Table 2
Class Text 25 Class as given in Table 2
Sub_Class Text 50 Sub Class as given in Table 2
Ward_No Numeric 5 Ward Number
Rd_ID Numeric 5 Road ID same as in Road_CLine
Rd_Name Text 25 Road Name same as in Road_CLine
Locality Text 30 Locality Name
Formulation of GIS based Master Plan for AMRUT Cities – Design & Standards 37
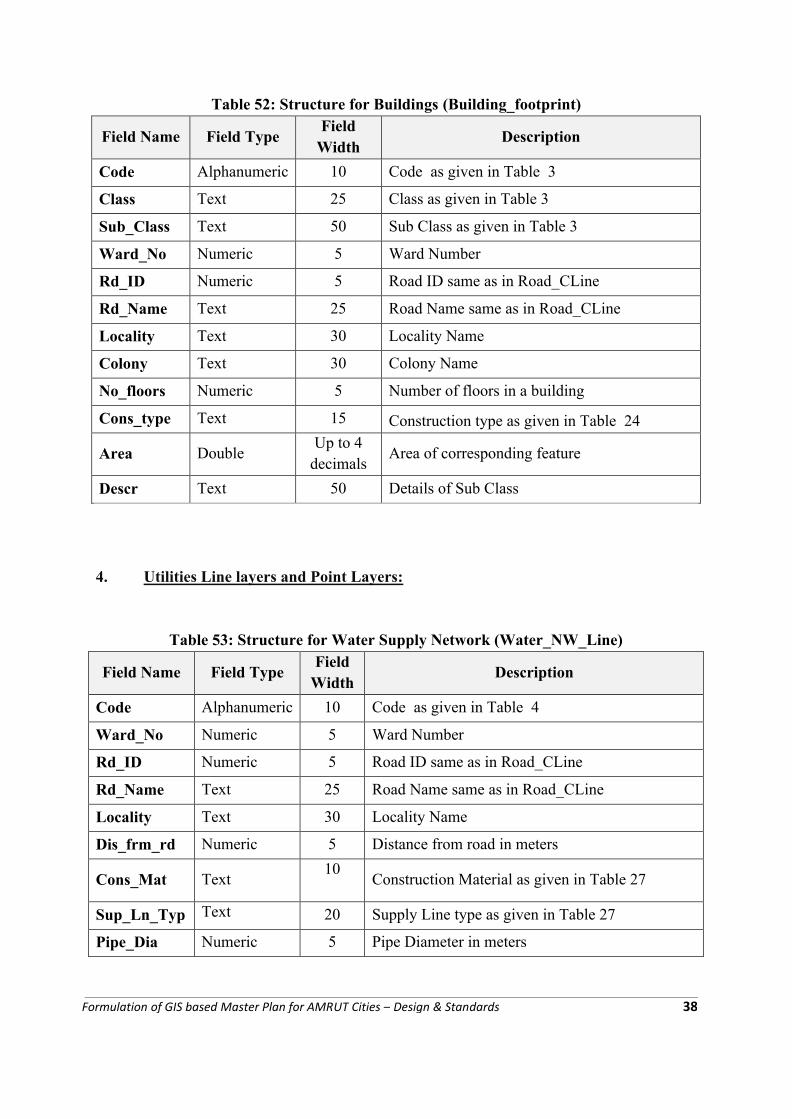
Table 52: Structure for Buildings (Building_footprint)
Field Name Field TypeField
WidthDescription
Code Alphanumeric 10 Code as given in Table 3
Class Text 25 Class as given in Table 3
Sub_Class Text 50 Sub Class as given in Table 3
Ward_No Numeric 5 Ward Number
Rd_ID Numeric 5 Road ID same as in Road_CLine
Rd_Name Text 25 Road Name same as in Road_CLine
Locality Text 30 Locality Name
Colony Text 30 Colony Name
No_floors Numeric 5 Number of floors in a building
Cons_type Text 15 Construction type as given in Table 24
Area DoubleUp to 4
decimalsArea of corresponding feature
Descr Text 50 Details of Sub Class
4. Utilities Line layers and Point Layers:
Table 53: Structure for Water Supply Network (Water_NW_Line)
Field Name Field TypeField
WidthDescription
Code Alphanumeric 10 Code as given in Table 4
Ward_No Numeric 5 Ward Number
Rd_ID Numeric 5 Road ID same as in Road_CLine
Rd_Name Text 25 Road Name same as in Road_CLine
Locality Text 30 Locality Name
Dis_frm_rd Numeric 5 Distance from road in meters
Cons_Mat Text10
Construction Material as given in Table 27
Sup_Ln_Typ Text 20 Supply Line type as given in Table 27
Pipe_Dia Numeric 5 Pipe Diameter in meters
Formulation of GIS based Master Plan for AMRUT Cities – Design & Standards 38
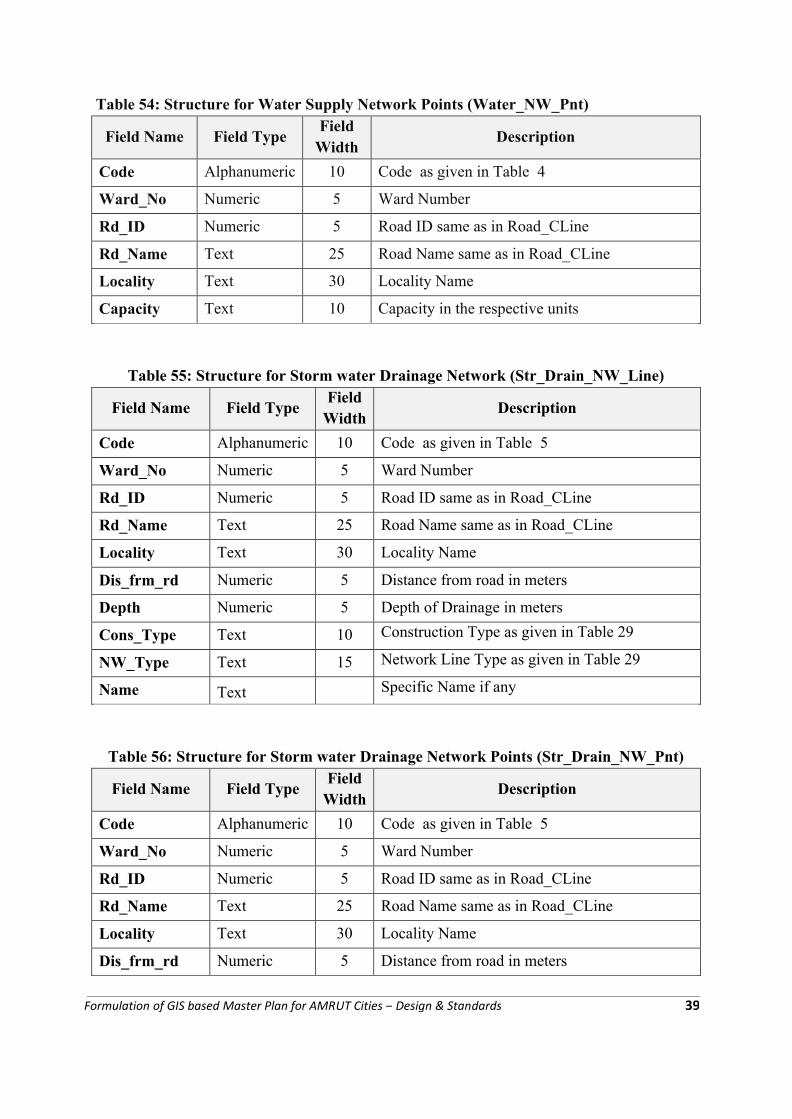
Table 54: Structure for Water Supply Network Points (Water_NW_Pnt)
Field Name Field TypeField
WidthDescription
Code Alphanumeric 10 Code as given in Table 4
Ward_No Numeric 5 Ward Number
Rd_ID Numeric 5 Road ID same as in Road_CLine
Rd_Name Text 25 Road Name same as in Road_CLine
Locality Text 30 Locality Name
Capacity Text 10 Capacity in the respective units
Table 55: Structure for Storm water Drainage Network (Str_Drain_NW_Line)
Field Name Field TypeField
WidthDescription
Code Alphanumeric 10 Code as given in Table 5
Ward_No Numeric 5 Ward Number
Rd_ID Numeric 5 Road ID same as in Road_CLine
Rd_Name Text 25 Road Name same as in Road_CLine
Locality Text 30 Locality Name
Dis_frm_rd Numeric 5 Distance from road in meters
Depth Numeric 5 Depth of Drainage in meters
Cons_Type Text 10 Construction Type as given in Table 29
NW_Type Text 15 Network Line Type as given in Table 29
Name Text Specific Name if any
Table 56: Structure for Storm water Drainage Network Points (Str_Drain_NW_Pnt)
Field Name Field TypeField
WidthDescription
Code Alphanumeric 10 Code as given in Table 5
Ward_No Numeric 5 Ward Number
Rd_ID Numeric 5 Road ID same as in Road_CLine
Rd_Name Text 25 Road Name same as in Road_CLine
Locality Text 30 Locality Name
Dis_frm_rd Numeric 5 Distance from road in meters
Formulation of GIS based Master Plan for AMRUT Cities – Design & Standards 39
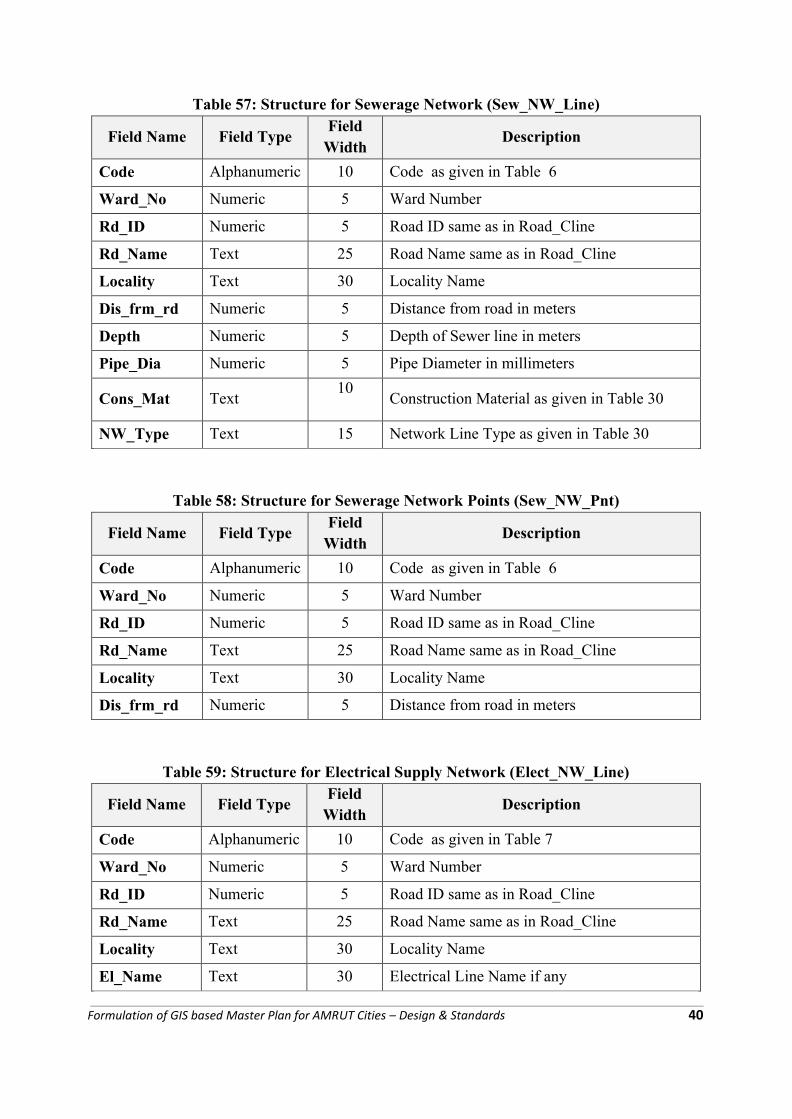
Table 57: Structure for Sewerage Network (Sew_NW_Line)
Field Name Field TypeField
WidthDescription
Code Alphanumeric 10 Code as given in Table 6
Ward_No Numeric 5 Ward Number
Rd_ID Numeric 5 Road ID same as in Road_Cline
Rd_Name Text 25 Road Name same as in Road_Cline
Locality Text 30 Locality Name
Dis_frm_rd Numeric 5 Distance from road in meters
Depth Numeric 5 Depth of Sewer line in meters
Pipe_Dia Numeric 5 Pipe Diameter in millimeters
Cons_Mat Text10
Construction Material as given in Table 30
NW_Type Text 15 Network Line Type as given in Table 30
Table 58: Structure for Sewerage Network Points (Sew_NW_Pnt)
Field Name Field TypeField
WidthDescription
Code Alphanumeric 10 Code as given in Table 6
Ward_No Numeric 5 Ward Number
Rd_ID Numeric 5 Road ID same as in Road_Cline
Rd_Name Text 25 Road Name same as in Road_Cline
Locality Text 30 Locality Name
Dis_frm_rd Numeric 5 Distance from road in meters
Table 59: Structure for Electrical Supply Network (Elect_NW_Line)
Field Name Field TypeField
WidthDescription
Code Alphanumeric 10 Code as given in Table 7
Ward_No Numeric 5 Ward Number
Rd_ID Numeric 5 Road ID same as in Road_Cline
Rd_Name Text 25 Road Name same as in Road_Cline
Locality Text 30 Locality Name
El_Name Text 30 Electrical Line Name if any
Formulation of GIS based Master Plan for AMRUT Cities – Design & Standards 40
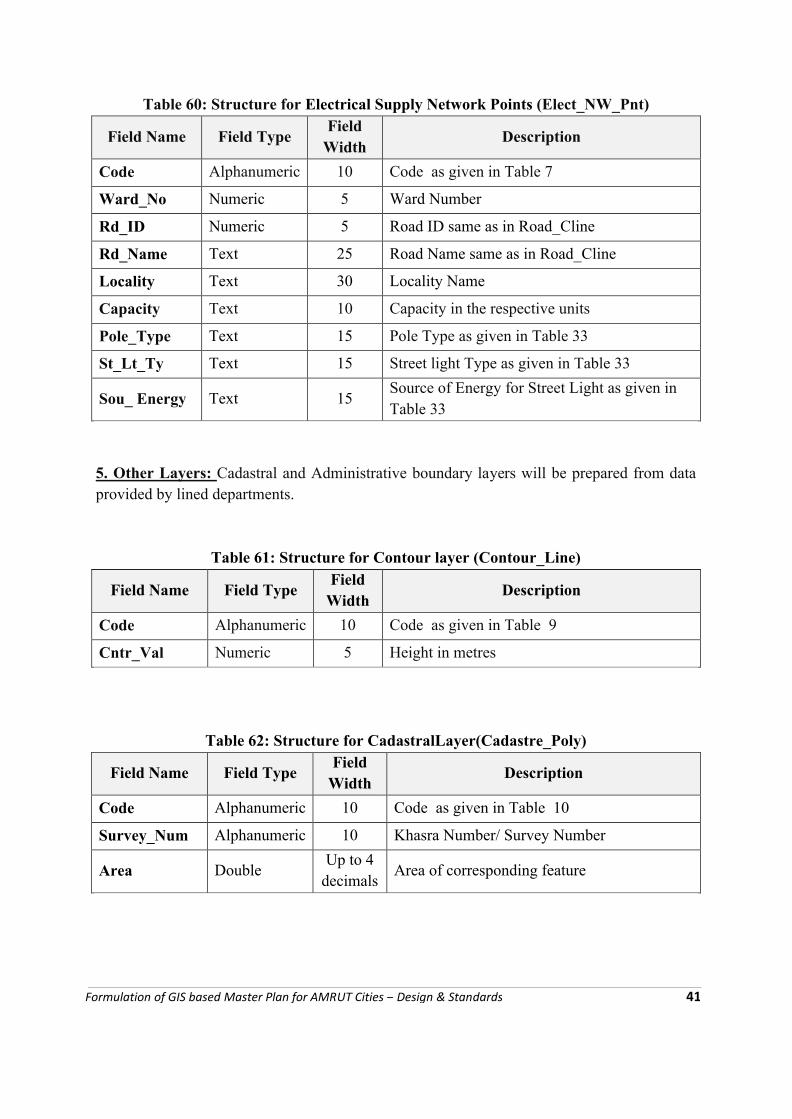
Table 60: Structure for Electrical Supply Network Points (Elect_NW_Pnt)
Field Name Field TypeField
WidthDescription
Code Alphanumeric 10 Code as given in Table 7
Ward_No Numeric 5 Ward Number
Rd_ID Numeric 5 Road ID same as in Road_Cline
Rd_Name Text 25 Road Name same as in Road_Cline
Locality Text 30 Locality Name
Capacity Text 10 Capacity in the respective units
Pole_Type Text 15 Pole Type as given in Table 33
St_Lt_Ty Text 15 Street light Type as given in Table 33
Sou_ Energy Text 15Source of Energy for Street Light as given in Table 33
5. Other Layers: Cadastral and Administrative boundary layers will be prepared from data provided by lined departments.
Table 61: Structure for Contour layer (Contour_Line)
Field Name Field TypeField
WidthDescription
Code Alphanumeric 10 Code as given in Table 9
Cntr_Val Numeric 5 Height in metres
Table 62: Structure for CadastralLayer(Cadastre_Poly)
Field Name Field TypeField
WidthDescription
Code Alphanumeric 10 Code as given in Table 10
Survey_Num Alphanumeric 10 Khasra Number/ Survey Number
Area DoubleUp to 4
decimalsArea of corresponding feature
Formulation of GIS based Master Plan for AMRUT Cities – Design & Standards 41
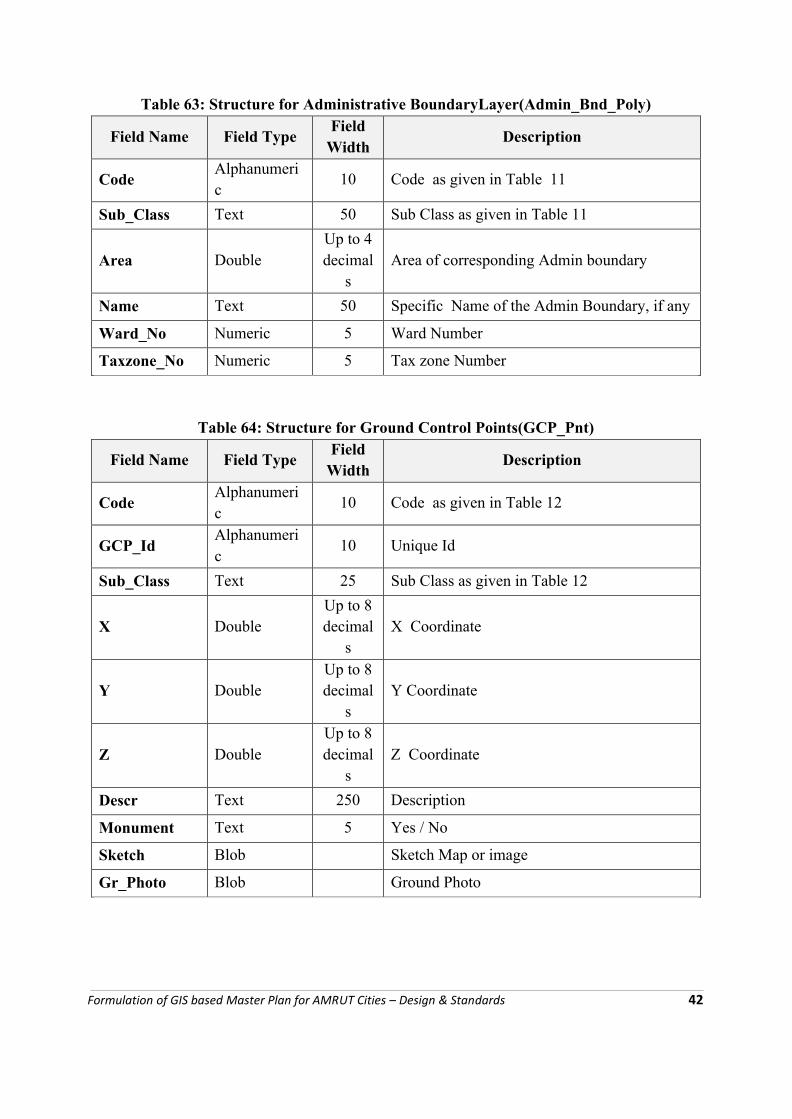
Table 63: Structure for Administrative BoundaryLayer(Admin_Bnd_Poly)
Field Name Field TypeField
WidthDescription
CodeAlphanumeric
10 Code as given in Table 11
Sub_Class Text 50 Sub Class as given in Table 11
Area DoubleUp to 4 decimal
sArea of corresponding Admin boundary
Name Text 50 Specific Name of the Admin Boundary, if any
Ward_No Numeric 5 Ward Number
Taxzone_No Numeric 5 Tax zone Number
Table 64: Structure for Ground Control Points(GCP_Pnt)
Field Name Field TypeField
WidthDescription
CodeAlphanumeric
10 Code as given in Table 12
GCP_IdAlphanumeric
10 Unique Id
Sub_Class Text 25 Sub Class as given in Table 12
X DoubleUp to 8 decimal
sX Coordinate
Y DoubleUp to 8 decimal
sY Coordinate
Z DoubleUp to 8 decimal
sZ Coordinate
Descr Text 250 Description
Monument Text 5 Yes / No
Sketch Blob Sketch Map or image
Gr_Photo Blob Ground Photo
Formulation of GIS based Master Plan for AMRUT Cities – Design & Standards 42
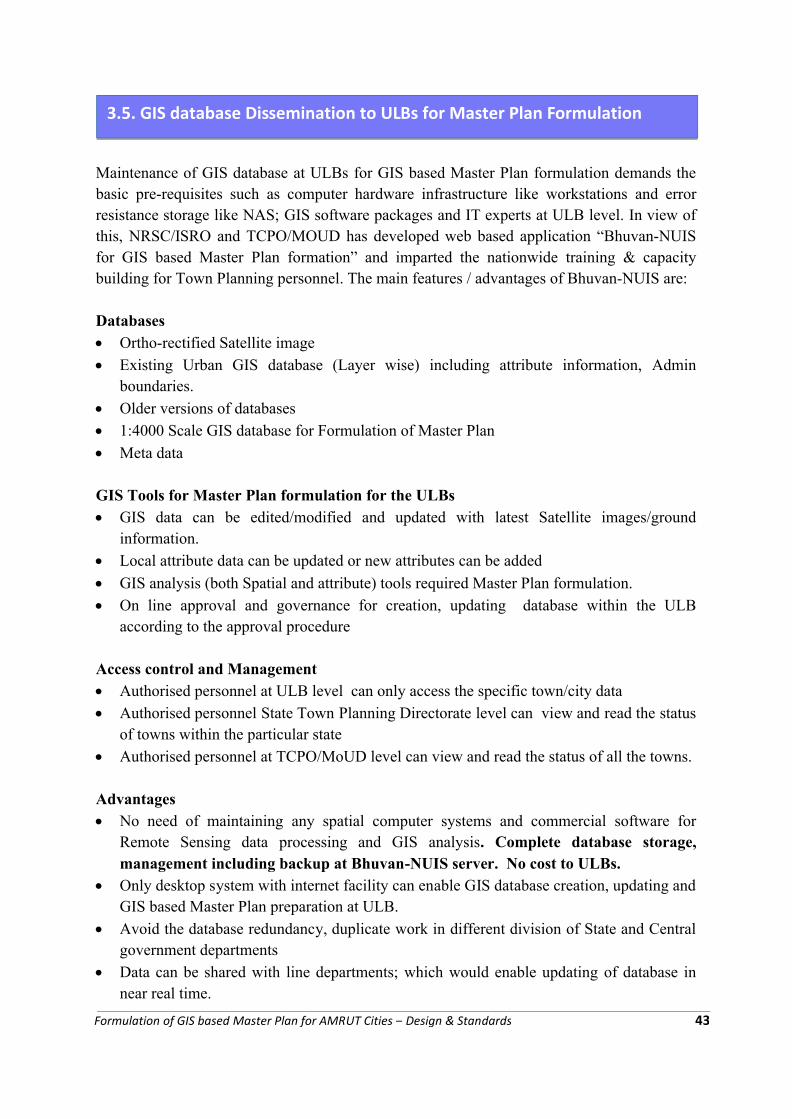
Maintenance of GIS database at ULBs for GIS based Master Plan formulation demands the basic pre-requisites such as computer hardware infrastructure like workstations and error resistance storage like NAS; GIS software packages and IT experts at ULB level. In view of this, NRSC/ISRO and TCPO/MOUD has developed web based application “Bhuvan-NUISfor GIS based Master Plan formation” and imparted the nationwide training & capacity building for Town Planning personnel. The main features / advantages of Bhuvan-NUIS are:
Databases∑ Ortho-rectified Satellite image
∑ Existing Urban GIS database (Layer wise) including attribute information, Admin boundaries.
∑ Older versions of databases
∑ 1:4000 Scale GIS database for Formulation of Master Plan
∑ Meta data
GIS Tools for Master Plan formulation for the ULBs∑ GIS data can be edited/modified and updated with latest Satellite images/ground
information.
∑ Local attribute data can be updated or new attributes can be added
∑ GIS analysis (both Spatial and attribute) tools required Master Plan formulation.
∑ On line approval and governance for creation, updating database within the ULB according to the approval procedure
Access control and Management∑ Authorised personnel at ULB level can only access the specific town/city data
∑ Authorised personnel State Town Planning Directorate level can view and read the status of towns within the particular state
∑ Authorised personnel at TCPO/MoUD level can view and read the status of all the towns.
Advantages∑ No need of maintaining any spatial computer systems and commercial software for
Remote Sensing data processing and GIS analysis. Complete database storage, management including backup at Bhuvan-NUIS server. No cost to ULBs.
∑ Only desktop system with internet facility can enable GIS database creation, updating and GIS based Master Plan preparation at ULB.
∑ Avoid the database redundancy, duplicate work in different division of State and Central government departments
∑ Data can be shared with line departments; which would enable updating of database in near real time.
3.5. GIS database Dissemination to ULBs for Master Plan Formulation
Formulation of GIS based Master Plan for AMRUT Cities – Design & Standards 43
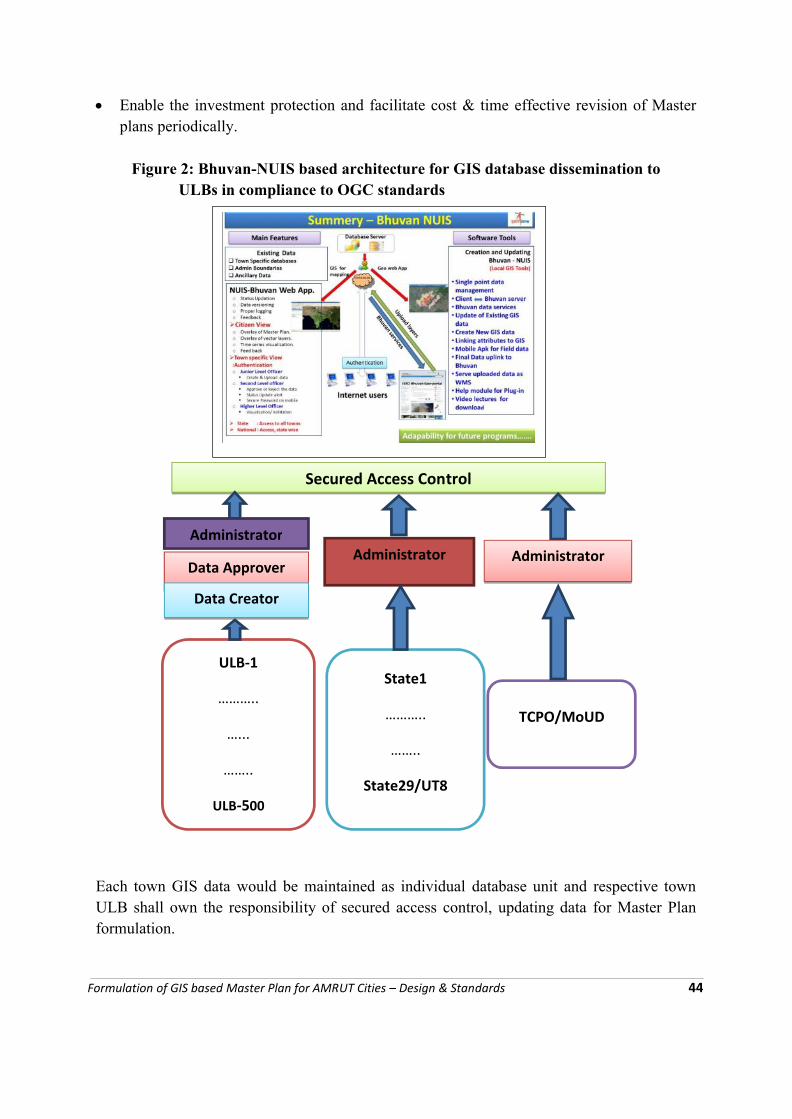
∑ Enable the investment protection and facilitate cost & time effective revision of Master plans periodically.
Figure 2: Bhuvan-NUIS based architecture for GIS database dissemination toULBs in compliance to OGC standards
Each town GIS data would be maintained as individual database unit and respective town ULB shall own the responsibility of secured access control, updating data for Master Plan formulation.
Secured Access Control
TCPO/MoUD
Administrator
State1
………..
……..
State29/UT8
AdministratorAdministrator
Data Approver
Data Creator
ULB-1
………..
…...
……..
ULB-500
Formulation of GIS based Master Plan for AMRUT Cities – Design & Standards 44
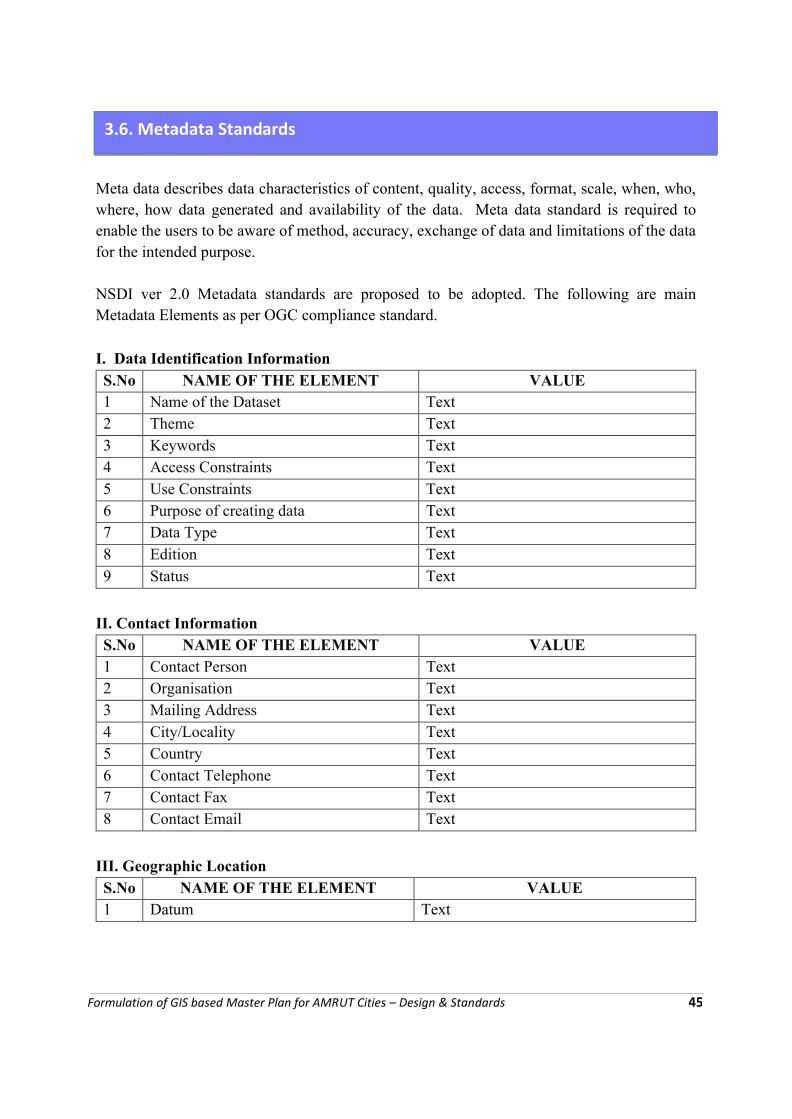
Meta data describes data characteristics of content, quality, access, format, scale, when, who,where, how data generated and availability of the data. Meta data standard is required to enable the users to be aware of method, accuracy, exchange of data and limitations of the data for the intended purpose.
NSDI ver 2.0 Metadata standards are proposed to be adopted. The following are main Metadata Elements as per OGC compliance standard.
I. Data Identification Information S.No NAME OF THE ELEMENT VALUE1 Name of the Dataset Text2 Theme Text3 Keywords Text4 Access Constraints Text5 Use Constraints Text6 Purpose of creating data Text7 Data Type Text8 Edition Text9 Status Text
II. Contact Information S.No NAME OF THE ELEMENT VALUE1 Contact Person Text2 Organisation Text3 Mailing Address Text4 City/Locality Text5 Country Text6 Contact Telephone Text7 Contact Fax Text8 Contact Email Text
III. Geographic Location S.No NAME OF THE ELEMENT VALUE1 Datum Text
3.6. Metadata Standards
Formulation of GIS based Master Plan for AMRUT Cities – Design & Standards 45
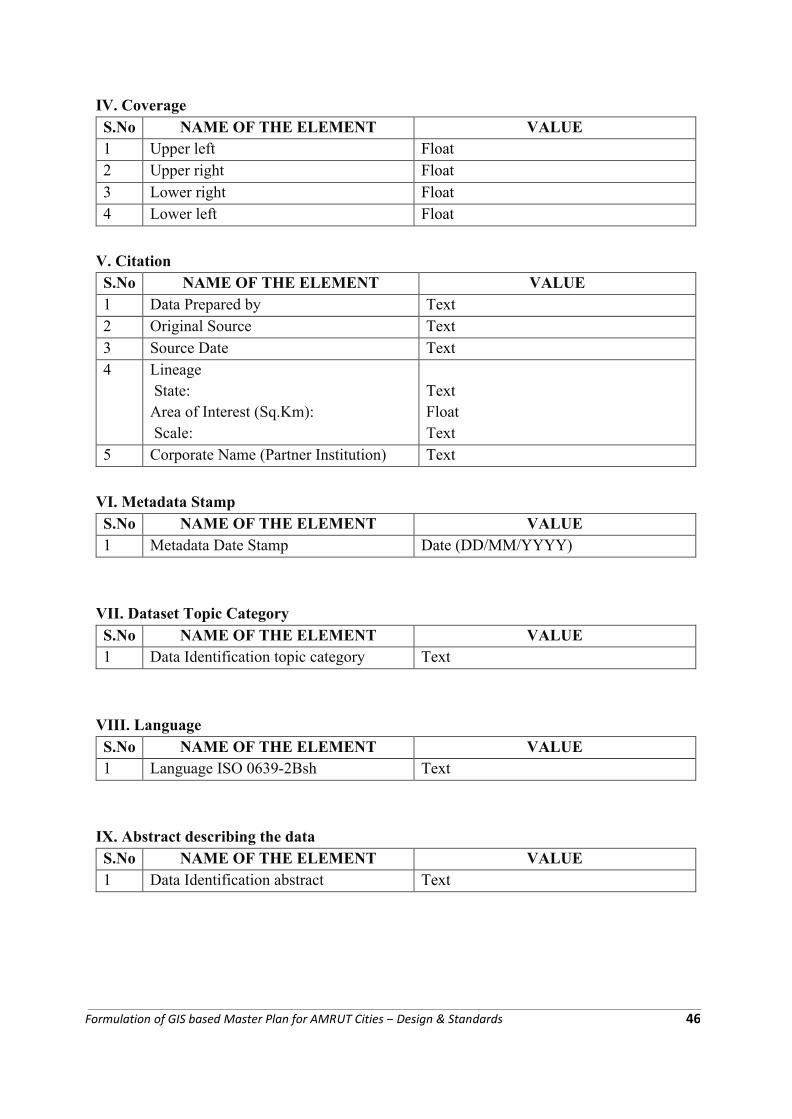
IV. CoverageS.No NAME OF THE ELEMENT VALUE1 Upper left Float2 Upper right Float3 Lower right Float4 Lower left Float
V. CitationS.No NAME OF THE ELEMENT VALUE1 Data Prepared by Text2 Original Source Text3 Source Date Text4 Lineage
State: Area of Interest (Sq.Km): Scale:
TextFloatText
5 Corporate Name (Partner Institution) Text
VI. Metadata StampS.No NAME OF THE ELEMENT VALUE1 Metadata Date Stamp Date (DD/MM/YYYY)
VII. Dataset Topic CategoryS.No NAME OF THE ELEMENT VALUE1 Data Identification topic category Text
VIII. LanguageS.No NAME OF THE ELEMENT VALUE1 Language ISO 0639-2Bsh Text
IX. Abstract describing the dataS.No NAME OF THE ELEMENT VALUE1 Data Identification abstract Text
Formulation of GIS based Master Plan for AMRUT Cities – Design & Standards 46
4. INDICATIVE FORMAT FOR URBAN DATA COLLECTION
Master Plan formulation requires a variety of data at different stages of the planning process as a diagnostic tool for the health of the city, assessment of existing conditions in a settlement, spatial variations within the city, time series information, etc. as well as analysis and projections for future requirements in respect of various activities. While primary data collection involves time-consuming surveys, most socio-economic data may be obtained from published or un-published secondary sources. In order to streamline the process and diminish delays in the plan preparation process, a standardized data collection format has been provided as an effort to simplify and speed up the process. Most of data collection can be taken up as a separate research/ survey before plan formulation to provide processed data inputs.
This format for urban data collection at town/ward level consists of 25 tables which cover key areas such as demography, physical & locational aspects, physical and social infrastructure, environment, housing and slums, governance, etc. which are vital for study of existing situation and framing of proposals for master plan formulation.
The format is an indicative format. Town planning is a State subject and a great variety of legislations exist which specify requirements for master/ development plan formulation, and different State Town Planning Acts may specify different requirements of data to be collected. Further, since the cities vary in size from megapolitan to Class VI cities, with a great variety of topographic settings, functional specializations, etc., the data requirement for plan formulation cannot be uniform. Therefore, the format may be modified suitably by the State Nodal Agencies as per their requirement depending on size and other characteristics of the urban settlement.
The indicative format for urban data collection is given at Annexure-III. Guidelines to fill the proforma are at Appendix-1.
Formulation of GIS based Master Plan for AMRUT Cities – Design & Standards 47

Annexure I
Formulation of GIS based Master Plan for AMRUT Cities – Design & Standards 48
Formulation of GIS based Master Plan for AMRUT Cities – Design & Standards 49
Annexure IIDGPS Survey for GPS points for
Geo-referencing / ortho-rectification of Satellite Image
ESTABLISHING GEODETIC REFERENCE FRAME FOR ULBS USING GNSS TECHNIQUES
GPS provides accurate and uniform reference frame for the geospatial data. DGPS techniques are required for geo-referencing of high resolution image data which essentially needs positional accuracy that matches the spatial resolution.
The satellite image shall cover the entire ULB area and sufficient no of GCPs shall be planned to geo-referenced the satellite image data as well as to check the accuracy parameters of the corrected image datasets with the aid of check points.
The GCP configuration and density of the GCPs are key parameters to be implemented suitably to achieve high quality data product after for geo-referencing process. Spatial distribution of the GCPs over the study area and type of features that are being selected as GCPs, play an important role in this process.
The DGPS survey procedure involves:
o Establishment of Monumented Reference station
o Data collection and processing procedures
o Upkeep of the reference station for future surveys
A permanent station shall be established which can be used as a reference station for the GPS surveys. A location, preferably in the central part of the ULB area, which is clear to sky without obstructions like tree canopy, high-raised building, HT electrical lines, shall be identified, either on ground or on the top of a building for constructing the reference station.
A cement concrete structure of 2 ft x 2 ft x 2ft shall be made and a brass plate marked with dot and circle shall be embedded on the top of the monument. A survey-grade dual frequency GPS receiver shall be operated with Tripod in static mode at this reference monument for a period of 3 consecutive days with a minimum of 12 hrs per day with 15 sec epoch rate and the 3 days data shall be processed with Single Point Positioning or Precise Point Positioning technique to derive the geodetic coordinates of the reference station in ITRF reference frame.
Establishing reference station coordinates in ITRF reference frame serves multiple benefits to the geospatial data in terms of maintaining uniform reference frame in future updates and also to use other datasets in GIS environment. ITRF reference frame can be implemented in two ways either linking the reference station to a IGS station nearby or processing using Precise Point Positioning technique using IGS data precise ephemeris and clock files. The derived Reference station geodetic coordinate shall be recorded properly and is documented in the records for future use by the ULB authorities.
Each GCP shall be identified with suitable permanent feature which is seen on the ground as well as on the image data. The location where GPS is being operated shall be clear to sky
Formulation of GIS based Master Plan for AMRUT Cities – Design & Standards 50
without obstruction to track GPS signals. Geodetic survey grade GPS receivers shall be employed to collect the data. Base station and rover stations shall be operated at 15 sec epoch rate and observation period of min. 1 hr shall be adopted for base line length of 10 kms. Baseline distances of 10 km -20 km shall be observed with min. of 2 hrs time period.
Survey parameters like Receiver and Antenna make and model no., Antenna height, Observation time session, GDOP value, epoch time, Making of Sketches, filed photographs in all direction shall be documented properly on the field log sheet for every GCP location. Geometric Dilution of Precision (GDOP) shall be monitored and recorded, and should not exceed 2.5 nominally.
Observations shall be made using dual-frequency GPS receivers and L1/L2 geodetic ground plane antennas tripods with bubble levels shall be used to minimize setup errors. Post processing of the data shall be carried out on daily basis using broadcast ephemeris and post-processing software. Validity checks shall be documented with analysis of base line vector solutions and loop closure errors. All the data produced shall pass ambiguity resolved vector solutions and loop closure exceeding one part per million relative positioning accuracy.
GPS antenna shall be mounted on tripod during survey for reference station as well at GCP location during data collection. The GCP location shall be marked with paint to ensure relocation at later data and it shall be post-pointed on the image. A detailed description of the GCP location shall be written in the field log sheet with a neat sketch.
Data quality parameters like cycle slips, no of satellite tracked, observed GDOP values shall be checked soon after the survey to ensure good quality of the data collected at reference station as well as at rover stations before data processing.
Data processing shall be carried out with baseline processing for each session and network adjustment for all the sessions and ensure that loop closure accuracy results shall be better than 1 on 50000 which is the geodetic standard for static surveys. The final adjusted coordinates shall be in Geographic coordinate system and also in WGS-84 coordinate system and UTM projection.
A project report shall be submitted with the details about GCP planning diagram, GPS equipment details and manuals, reference station details and its geodetic coordinate in ITRF latest epoch, data collection parameters, field photographs of all the locations, processing results, GCP network diagram and list of adjusted coordinates.
************
Formulation of GIS based Master Plan for AMRUT Cities – Design & Standards 51
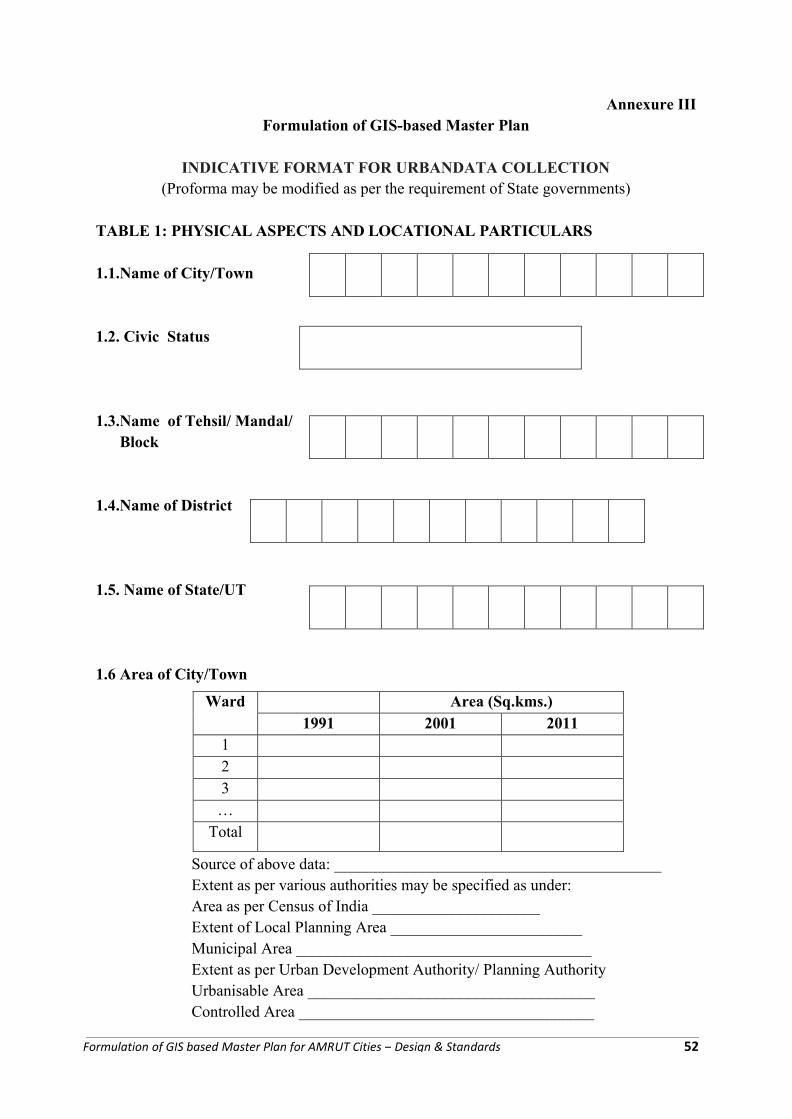
Annexure IIIFormulation of GIS-based Master Plan
INDICATIVE FORMAT FOR URBANDATA COLLECTION (Proforma may be modified as per the requirement of State governments)
TABLE 1: PHYSICAL ASPECTS AND LOCATIONAL PARTICULARS
1.1.Name of City/Town
1.2. Civic Status
1.3.Name of Tehsil/ Mandal/ Block
1.4.Name of District
1.5. Name of State/UT
1.6 Area of City/Town
Source of above data: _________________________________________Extent as per various authorities may be specified as under: Area as per Census of India _____________________Extent of Local Planning Area ________________________Municipal Area _____________________________________Extent as per Urban Development Authority/ Planning Authority Urbanisable Area ____________________________________Controlled Area _____________________________________
Ward Area (Sq.kms.)1991 2001 2011
123…
Total
Formulation of GIS based Master Plan for AMRUT Cities – Design & Standards 52
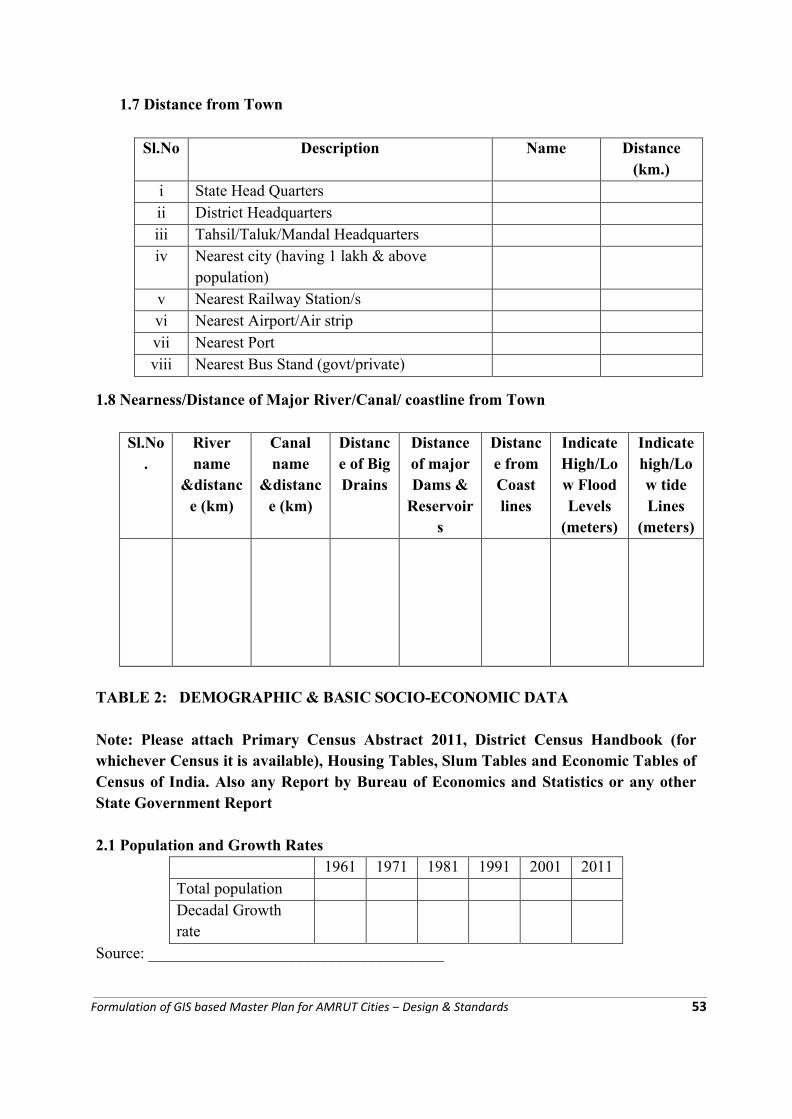
1.7 Distance from Town
1.8 Nearness/Distance of Major River/Canal/ coastline from Town
Sl.No.
River name
&distance (km)
Canal name
&distance (km)
Distance of Big Drains
Distance of major Dams &
Reservoirs
Distance from Coast lines
Indicate High/Low Flood Levels
(meters)
Indicate high/Low tide Lines
(meters)
TABLE 2: DEMOGRAPHIC & BASIC SOCIO-ECONOMIC DATA
Note: Please attach Primary Census Abstract 2011, District Census Handbook (for whichever Census it is available), Housing Tables, Slum Tables and Economic Tables of Census of India. Also any Report by Bureau of Economics and Statistics or any other State Government Report
2.1 Population and Growth Rates1961 1971 1981 1991 2001 2011
Total populationDecadal Growth rate
Source: _____________________________________
Sl.No Description Name Distance (km.)
i State Head Quartersii District Headquartersiii Tahsil/Taluk/Mandal Headquartersiv Nearest city (having 1 lakh & above
population)v Nearest Railway Station/svi Nearest Airport/Air stripvii Nearest Portviii Nearest Bus Stand (govt/private)
Formulation of GIS based Master Plan for AMRUT Cities – Design & Standards 53
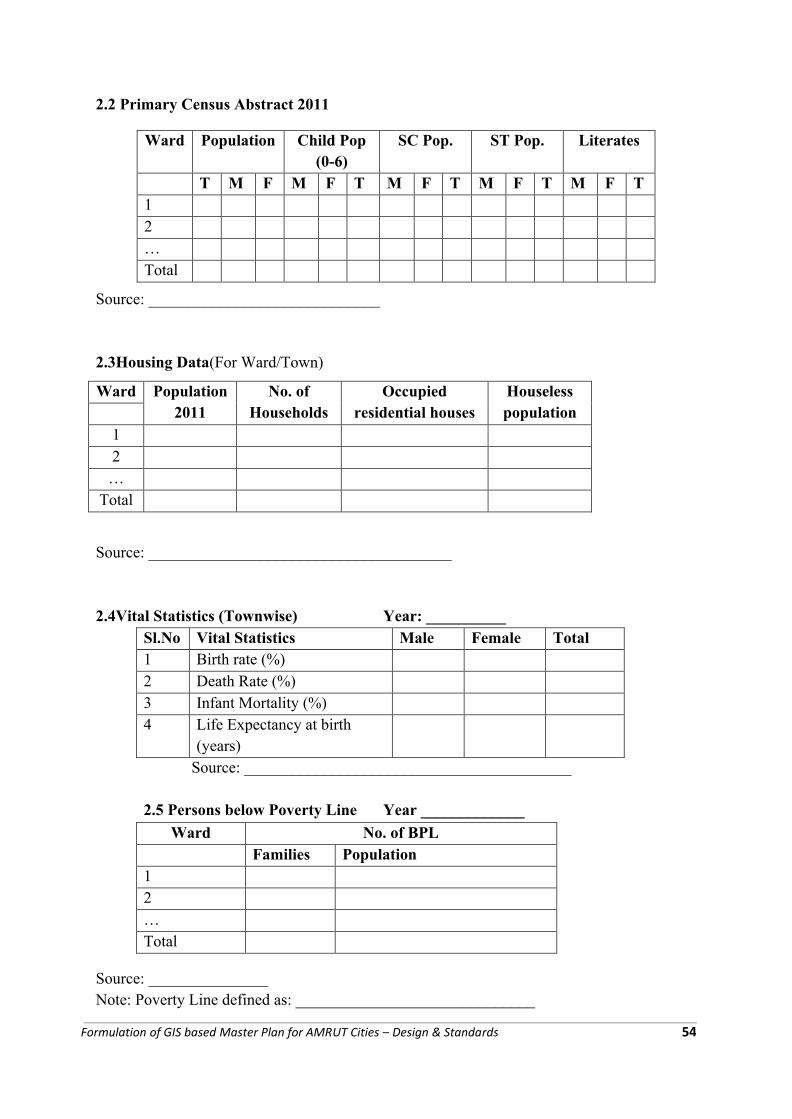
2.2 Primary Census Abstract 2011
Source: _____________________________
2.3Housing Data(For Ward/Town)
Source: ______________________________________
2.4Vital Statistics (Townwise) Year: __________Sl.No Vital Statistics Male Female Total1 Birth rate (%)2 Death Rate (%)3 Infant Mortality (%)4 Life Expectancy at birth
(years)Source: _________________________________________
2.5 Persons below Poverty Line Year _____________
Source: _______________Note: Poverty Line defined as: ______________________________
Ward Population Child Pop (0-6)
SC Pop. ST Pop. Literates
T M F M F T M F T M F T M F T12…Total
Ward Population2011
No. ofHouseholds
Occupied residential houses
Houseless population
12…
Total
Ward No. of BPLFamilies Population
12…Total
Formulation of GIS based Master Plan for AMRUT Cities – Design & Standards 54
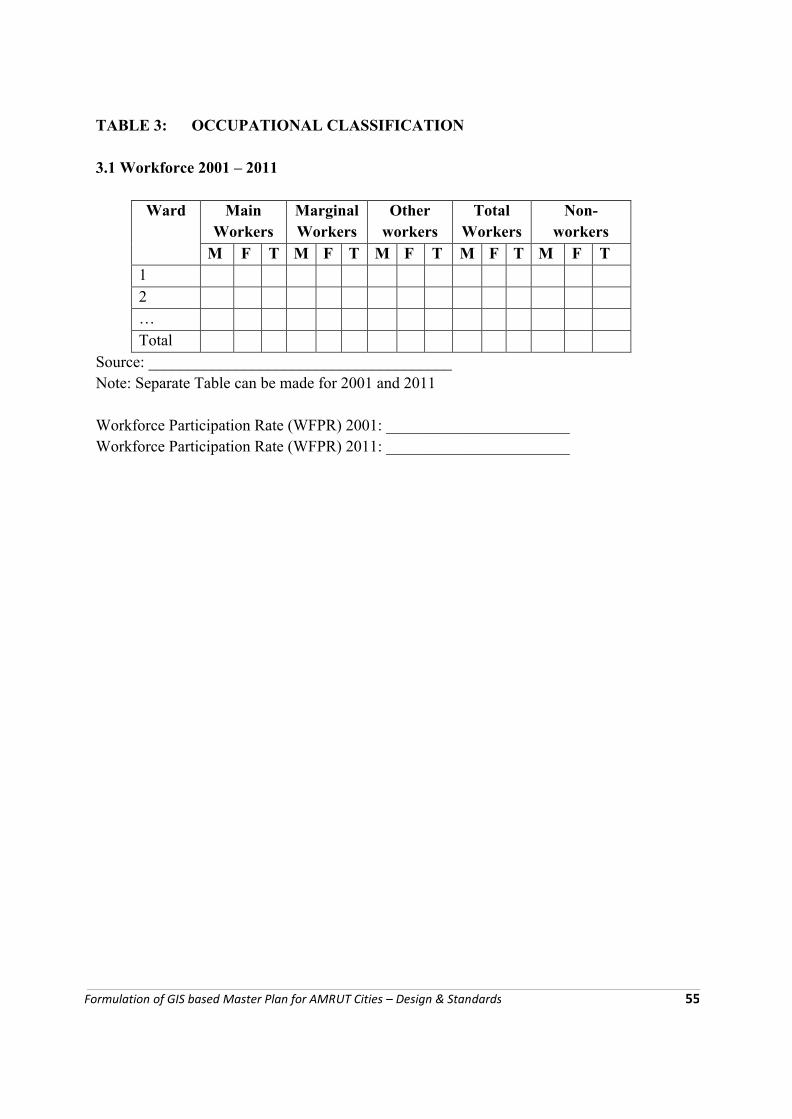
TABLE 3: OCCUPATIONAL CLASSIFICATION
3.1 Workforce 2001 – 2011
Ward MainWorkers
Marginal Workers
Other workers
Total Workers
Non-workers
M F T M F T M F T M F T M F T12…Total
Source: ______________________________________Note: Separate Table can be made for 2001 and 2011
Workforce Participation Rate (WFPR) 2001: _______________________Workforce Participation Rate (WFPR) 2011: _______________________
Formulation of GIS based Master Plan for AMRUT Cities – Design & Standards 55
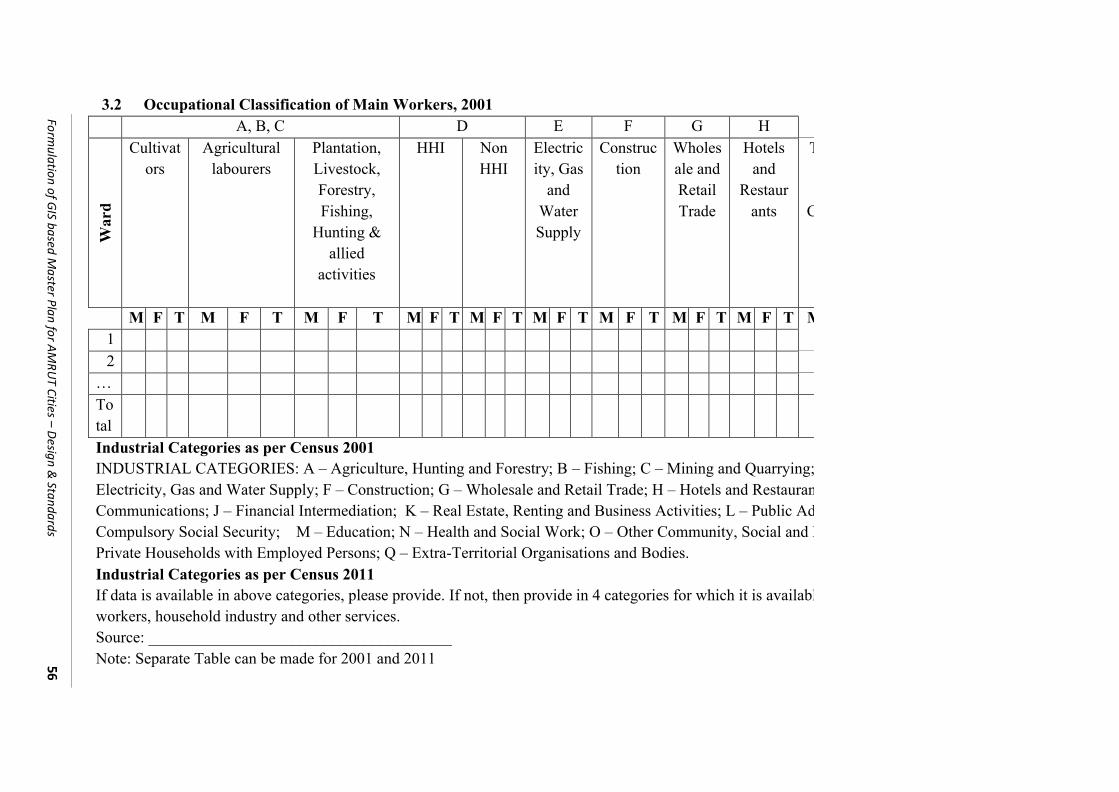
3.2 Occupational Classification of Main Workers, 2001A, B, C D E F G H
War
d
Cultivators
Agricultural labourers
Plantation, Livestock, Forestry, Fishing,
Hunting & allied
activities
HHI Non HHI
Electricity, Gas
and Water Supply
Construction
Wholesale and Retail Trade
Hotels and
Restaurants
Transport,
Communic
M F T M F T M F T M F T M F T M F T M F T M F T M F T M12
…TotalIndustrial Categories as per Census 2001INDUSTRIAL CATEGORIES: A – Agriculture, Hunting and Forestry; B – Fishing; C – Mining and Quarrying; D Electricity, Gas and Water Supply; F – Construction; G – Wholesale and Retail Trade; H – Hotels and Restaurants; I Communications; J – Financial Intermediation; K – Real Estate, Renting and Business Activities; L – Public Administration and Defence, Compulsory Social Security; M – Education; N – Health and Social Work; O – Other Community, Social and Personal Service Activities; P Private Households with Employed Persons; Q – Extra-Territorial Organisations and Bodies.Industrial Categories as per Census 2011If data is available in above categories, please provide. If not, then provide in 4 categories for which it is available: cultivators, agricultural workers, household industry and other services.Source: ______________________________________Note: Separate Table can be made for 2001 and 2011
Formulation of G
IS based Master Plan for AM
RUT Cities –
Design &
Standards56
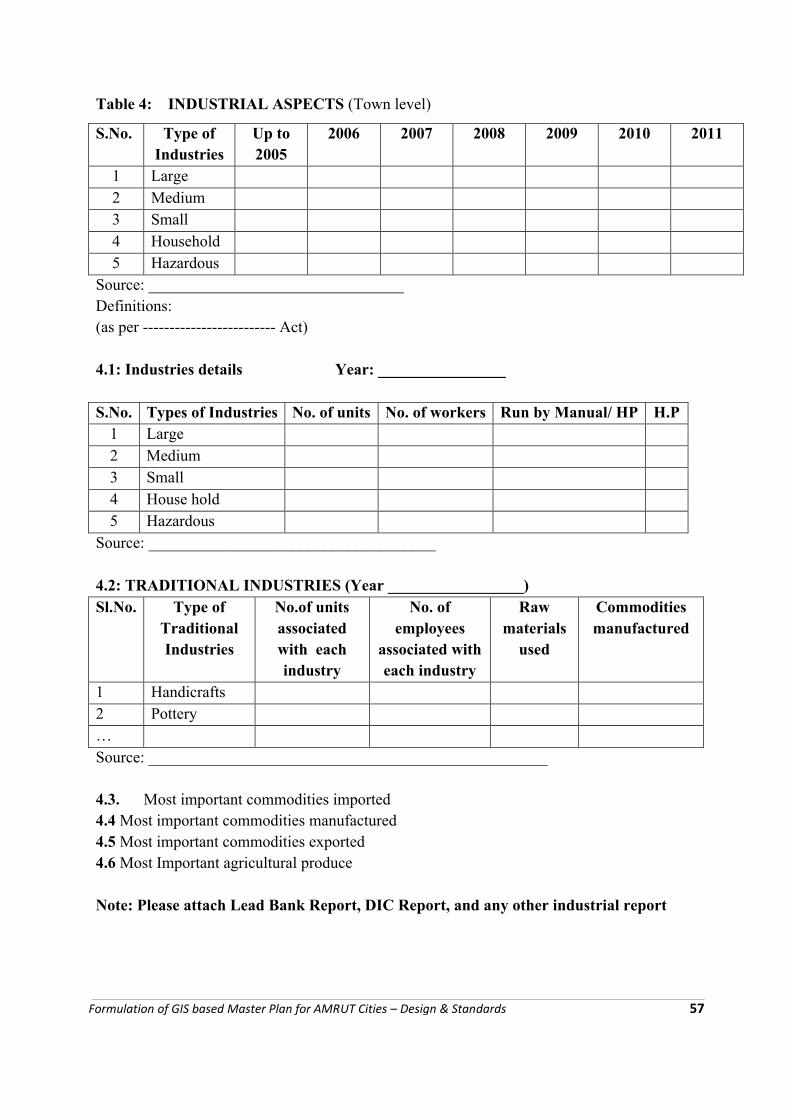
Table 4: INDUSTRIAL ASPECTS (Town level)
Source: ________________________________Definitions:(as per ------------------------- Act)
4.1: Industries details Year: ________________
S.No. Types of Industries No. of units No. of workers Run by Manual/ HP H.P1 Large2 Medium3 Small4 House hold5 Hazardous
Source: ____________________________________
4.2: TRADITIONAL INDUSTRIES (Year _________________)Sl.No. Type of
Traditional Industries
No.of units associated with each industry
No. of employees
associated with each industry
Raw materials
used
Commodities manufactured
1 Handicrafts2 Pottery…Source: __________________________________________________
4.3. Most important commodities imported4.4 Most important commodities manufactured4.5 Most important commodities exported4.6 Most Important agricultural produce
Note: Please attach Lead Bank Report, DIC Report, and any other industrial report
S.No. Type of Industries
Up to 2005
2006 2007 2008 2009 2010 2011
1 Large2 Medium3 Small4 Household5 Hazardous
Formulation of GIS based Master Plan for AMRUT Cities – Design & Standards 57
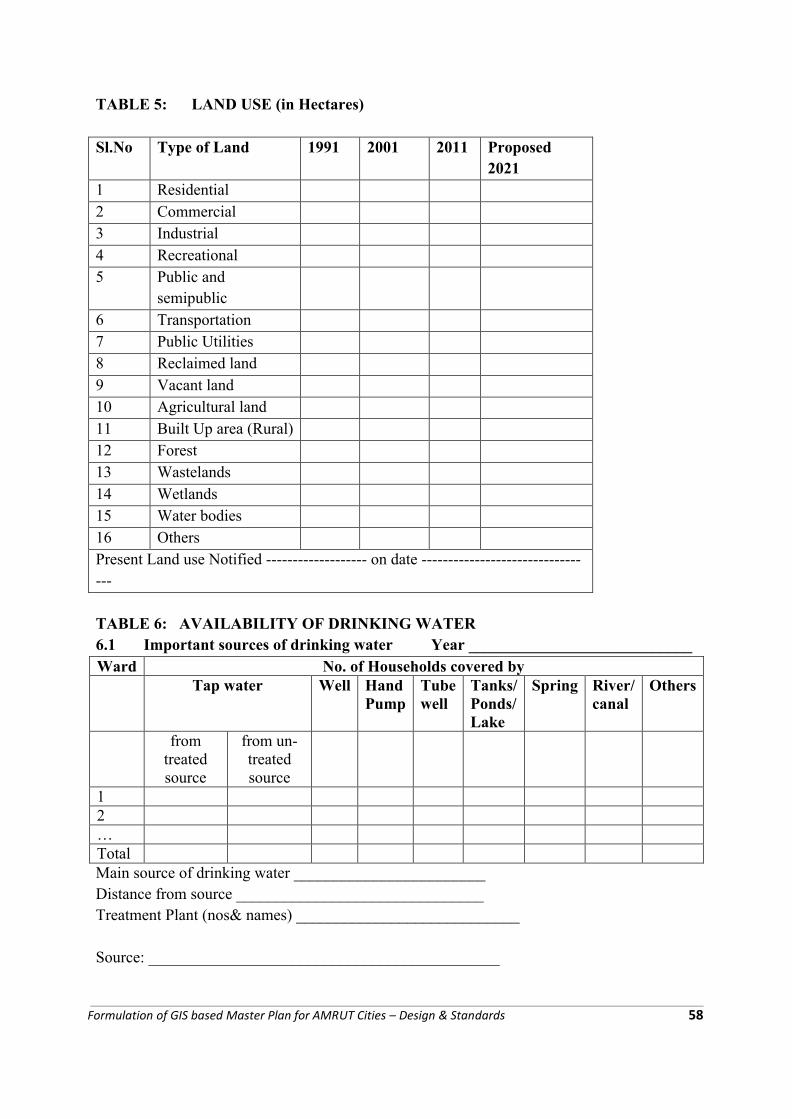
TABLE 5: LAND USE (in Hectares)
Sl.No Type of Land 1991 2001 2011 Proposed 2021
1 Residential2 Commercial3 Industrial4 Recreational5 Public and
semipublic6 Transportation7 Public Utilities 8 Reclaimed land9 Vacant land10 Agricultural land11 Built Up area (Rural)12 Forest13 Wastelands14 Wetlands15 Water bodies16 OthersPresent Land use Notified ------------------- on date ---------------------------------
TABLE 6: AVAILABILITY OF DRINKING WATER6.1 Important sources of drinking water Year ____________________________Ward No. of Households covered by
Tap water Well Hand Pump
Tube well
Tanks/Ponds/ Lake
Spring River/ canal
Others
from treated source
from un-treated source
12…TotalMain source of drinking water ________________________Distance from source _______________________________Treatment Plant (nos& names) ____________________________
Source: ____________________________________________
Formulation of GIS based Master Plan for AMRUT Cities – Design & Standards 58
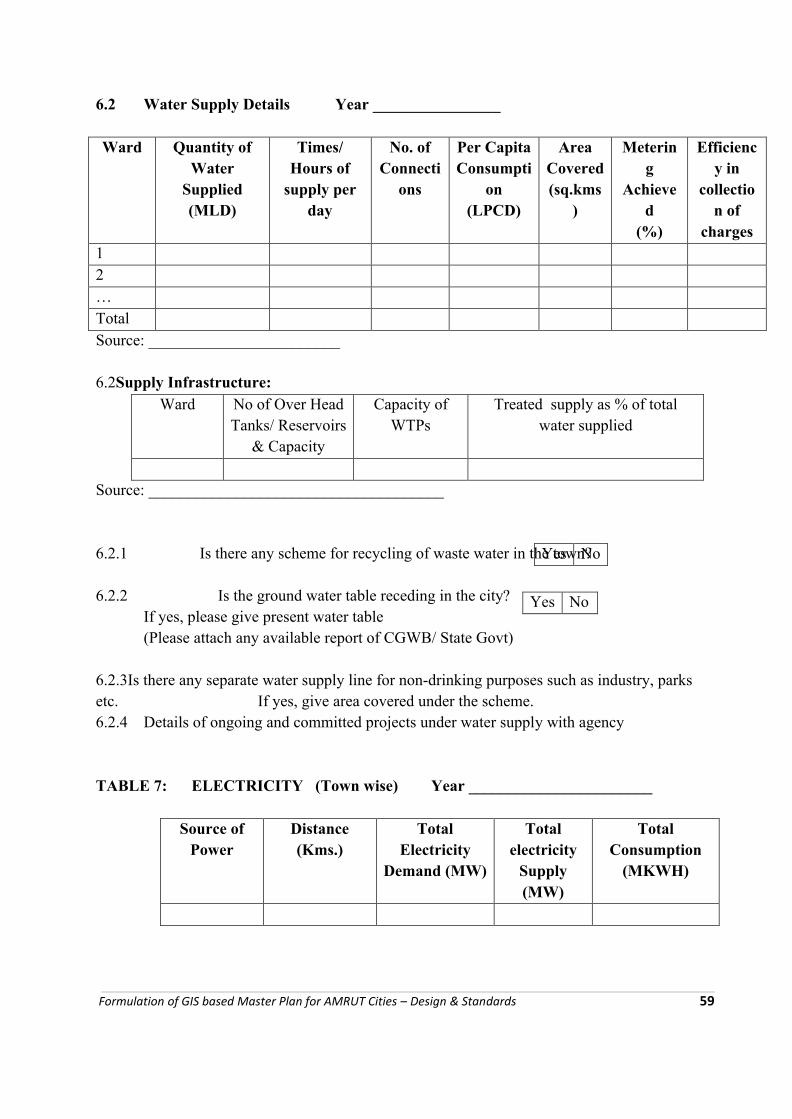
6.2 Water Supply Details Year ________________
Ward Quantity of Water
Supplied(MLD)
Times/ Hours of
supply per day
No. of Connecti
ons
Per Capita Consumpti
on(LPCD)
Area Covered (sq.kms
)
Metering
Achieved
(%)
Efficiency in
collection of
charges12…Total Source: ________________________
6.2Supply Infrastructure:Ward No of Over Head
Tanks/ Reservoirs & Capacity
Capacity of WTPs
Treated supply as % of total water supplied
Source: _____________________________________
6.2.1 Is there any scheme for recycling of waste water in the town?
6.2.2 Is the ground water table receding in the city?If yes, please give present water table(Please attach any available report of CGWB/ State Govt)
6.2.3Is there any separate water supply line for non-drinking purposes such as industry, parks etc. If yes, give area covered under the scheme.6.2.4 Details of ongoing and committed projects under water supply with agency
TABLE 7: ELECTRICITY (Town wise) Year _______________________
Source of Power
Distance(Kms.)
Total Electricity
Demand (MW)
Total electricity
Supply (MW)
Total Consumption
(MKWH)
Yes No
Yes No
Formulation of GIS based Master Plan for AMRUT Cities – Design & Standards 59
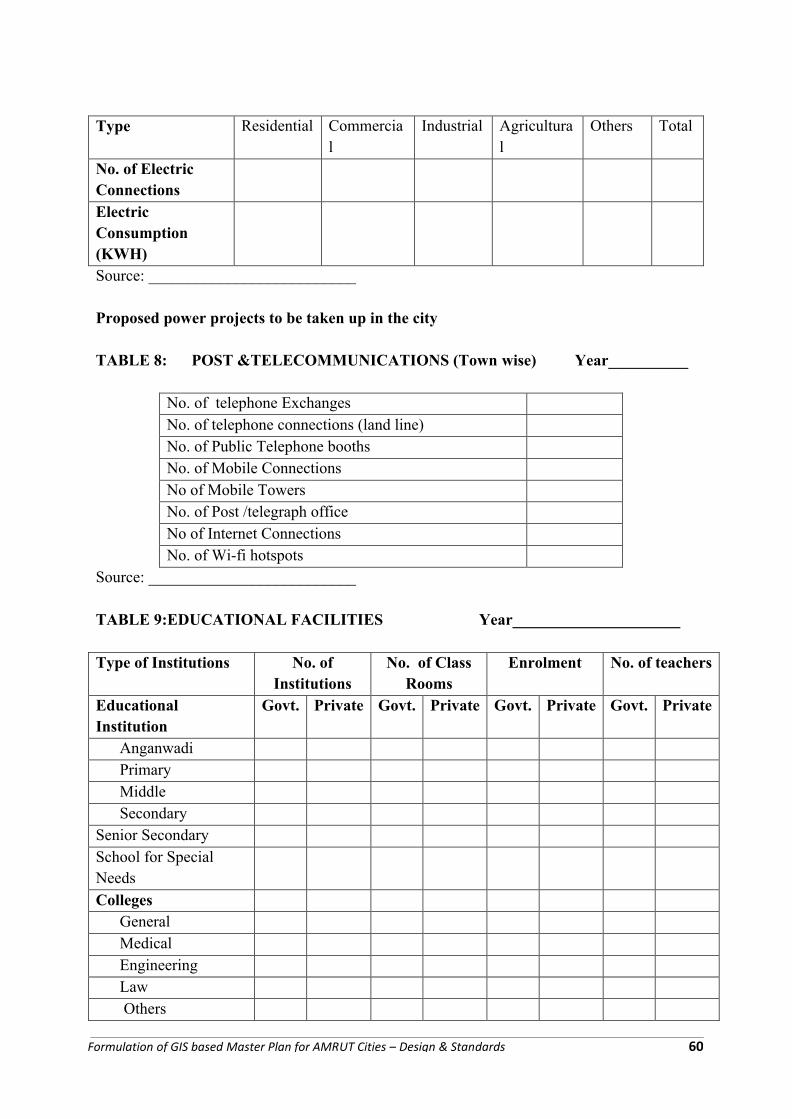
Type Residential Commercial
Industrial Agricultural
Others Total
No. of Electric ConnectionsElectric Consumption (KWH)Source: __________________________
Proposed power projects to be taken up in the city
TABLE 8: POST &TELECOMMUNICATIONS (Town wise) Year__________
No. of telephone ExchangesNo. of telephone connections (land line)No. of Public Telephone boothsNo. of Mobile Connections No of Mobile TowersNo. of Post /telegraph officeNo of Internet ConnectionsNo. of Wi-fi hotspots
Source: __________________________
TABLE 9:EDUCATIONAL FACILITIES Year_____________________
Type of Institutions No. of Institutions
No. of Class Rooms
Enrolment No. of teachers
EducationalInstitution
Govt. Private Govt. Private Govt. Private Govt. Private
AnganwadiPrimaryMiddleSecondary
Senior SecondarySchool for Special Needs
CollegesGeneral Medical EngineeringLawOthers
Formulation of GIS based Master Plan for AMRUT Cities – Design & Standards 60
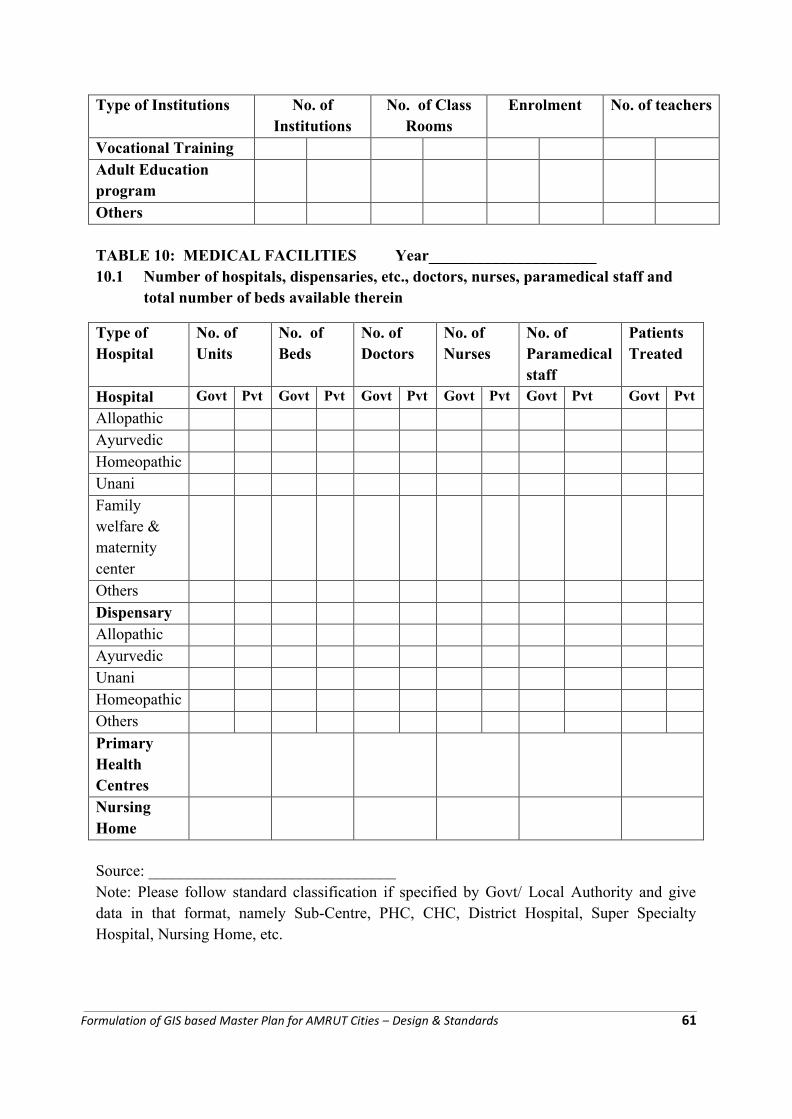
Type of Institutions No. of Institutions
No. of Class Rooms
Enrolment No. of teachers
Vocational Training Adult Education programOthers
TABLE 10: MEDICAL FACILITIES Year_____________________10.1 Number of hospitals, dispensaries, etc., doctors, nurses, paramedical staff and
total number of beds available therein
Source: _______________________________Note: Please follow standard classification if specified by Govt/ Local Authority and give data in that format, namely Sub-Centre, PHC, CHC, District Hospital, Super Specialty Hospital, Nursing Home, etc.
Type of Hospital
No. of Units
No. of Beds
No. of Doctors
No. of Nurses
No. of Paramedical staff
Patients Treated
Hospital Govt Pvt Govt Pvt Govt Pvt Govt Pvt Govt Pvt Govt Pvt
AllopathicAyurvedicHomeopathicUnaniFamily welfare & maternity centerOthersDispensaryAllopathicAyurvedicUnaniHomeopathicOthers
Primary Health CentresNursing Home
Formulation of GIS based Master Plan for AMRUT Cities – Design & Standards 61
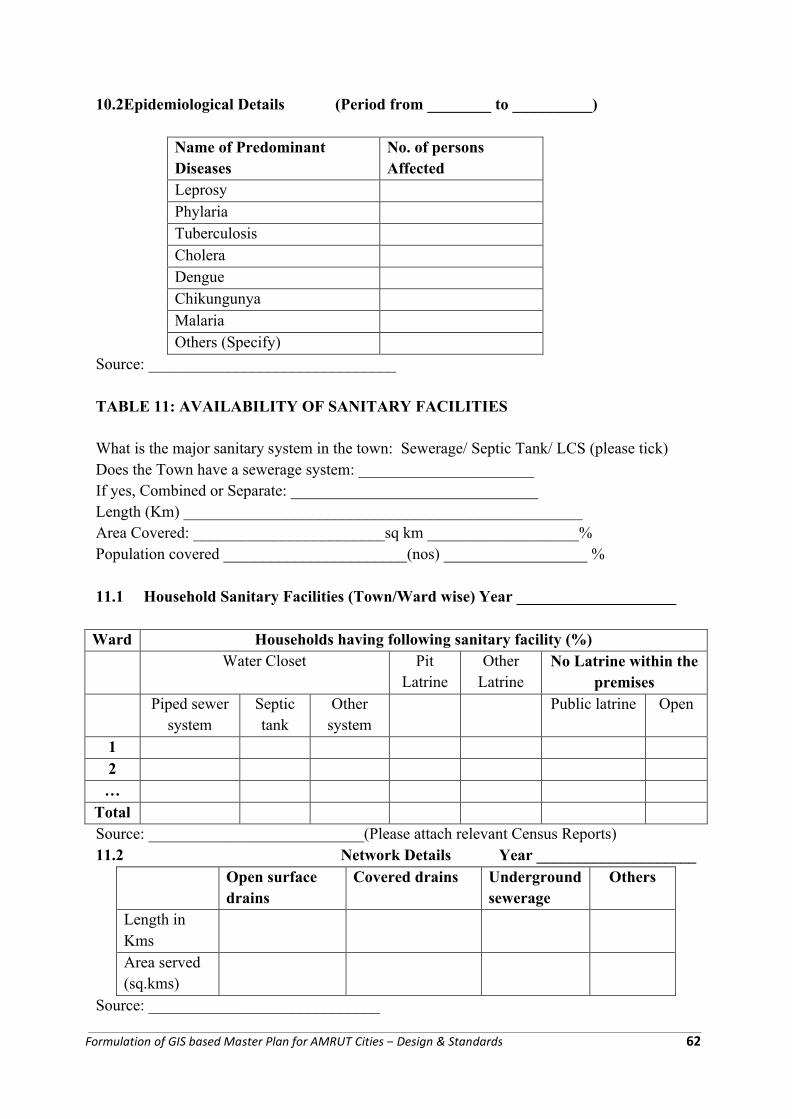
10.2Epidemiological Details (Period from ________ to __________)
Name of Predominant Diseases
No. of persons Affected
LeprosyPhylariaTuberculosisCholeraDengueChikungunyaMalariaOthers (Specify)
Source: _______________________________
TABLE 11: AVAILABILITY OF SANITARY FACILITIES
What is the major sanitary system in the town: Sewerage/ Septic Tank/ LCS (please tick)Does the Town have a sewerage system: ______________________If yes, Combined or Separate: _______________________________Length (Km) __________________________________________________Area Covered: ________________________sq km ___________________%Population covered _______________________(nos) __________________ %
11.1 Household Sanitary Facilities (Town/Ward wise) Year ____________________
Ward Households having following sanitary facility (%)Water Closet Pit
LatrineOther
LatrineNo Latrine within the
premisesPiped sewer
systemSeptic tank
Other system
Public latrine Open
12…
TotalSource: ___________________________(Please attach relevant Census Reports)11.2 Network Details Year ____________________
Open surface drains
Covered drains Underground sewerage
Others
Length in KmsArea served (sq.kms)
Source: _____________________________
Formulation of GIS based Master Plan for AMRUT Cities – Design & Standards 62
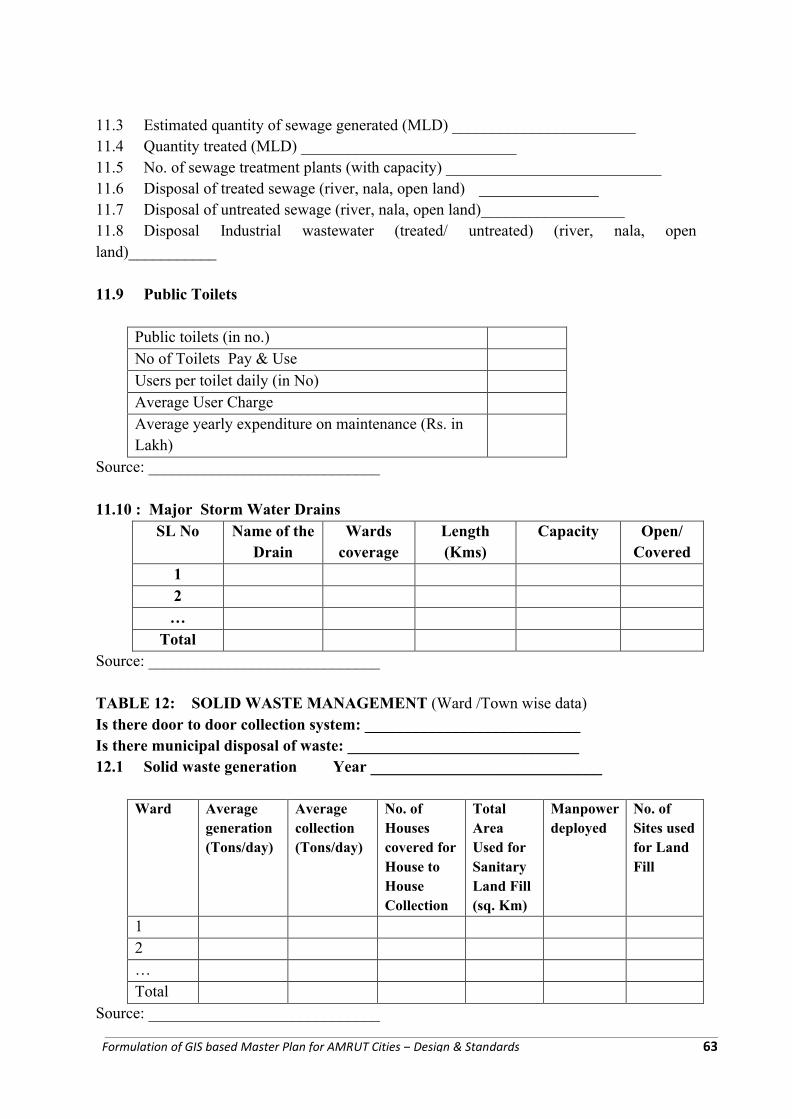
11.3 Estimated quantity of sewage generated (MLD) _______________________11.4 Quantity treated (MLD) ___________________________11.5 No. of sewage treatment plants (with capacity) ___________________________11.6 Disposal of treated sewage (river, nala, open land) _______________11.7 Disposal of untreated sewage (river, nala, open land)__________________11.8 Disposal Industrial wastewater (treated/ untreated) (river, nala, open land)___________
11.9 Public Toilets
Public toilets (in no.)No of Toilets Pay & Use Users per toilet daily (in No)Average User ChargeAverage yearly expenditure on maintenance (Rs. in Lakh)
Source: _____________________________
11.10 : Major Storm Water Drains SL No Name of the
DrainWards
coverageLength (Kms)
Capacity Open/ Covered
12…
TotalSource: _____________________________
TABLE 12: SOLID WASTE MANAGEMENT (Ward /Town wise data)Is there door to door collection system: ___________________________Is there municipal disposal of waste: _____________________________12.1 Solid waste generation Year _____________________________
Ward Average generation (Tons/day)
Average collection (Tons/day)
No. of Houses covered for House to House Collection
Total Area Used for Sanitary Land Fill (sq. Km)
Manpower deployed
No. of Sites used for Land Fill
12…Total
Source: _____________________________
Formulation of GIS based Master Plan for AMRUT Cities – Design & Standards 63
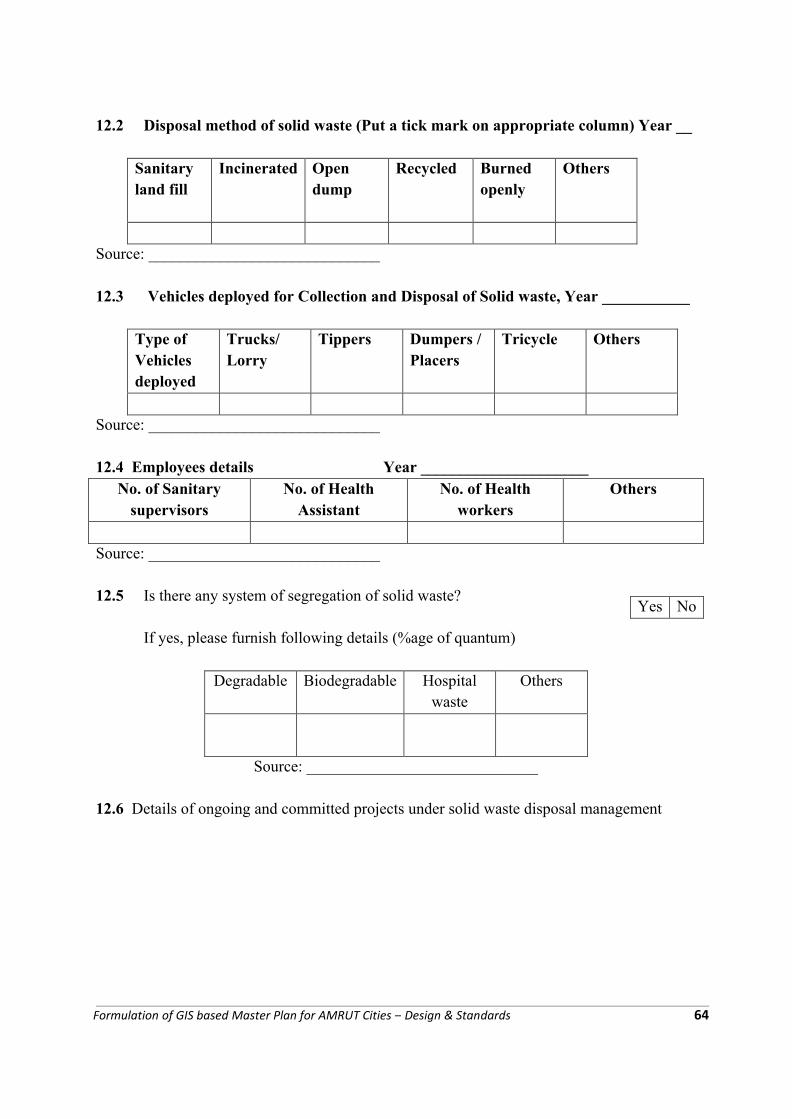
12.2 Disposal method of solid waste (Put a tick mark on appropriate column) Year __
Sanitary land fill
Incinerated Open dump
Recycled Burned openly
Others
Source: _____________________________
12.3 Vehicles deployed for Collection and Disposal of Solid waste, Year ___________
Type of Vehicles deployed
Trucks/ Lorry
Tippers Dumpers / Placers
Tricycle Others
Source: _____________________________
12.4 Employees details Year _____________________No. of Sanitary
supervisorsNo. of Health
AssistantNo. of Health
workersOthers
Source: _____________________________
12.5 Is there any system of segregation of solid waste?
If yes, please furnish following details (%age of quantum)
Degradable Biodegradable Hospital waste
Others
Source: _____________________________
12.6 Details of ongoing and committed projects under solid waste disposal management
Yes No
Formulation of GIS based Master Plan for AMRUT Cities – Design & Standards 64
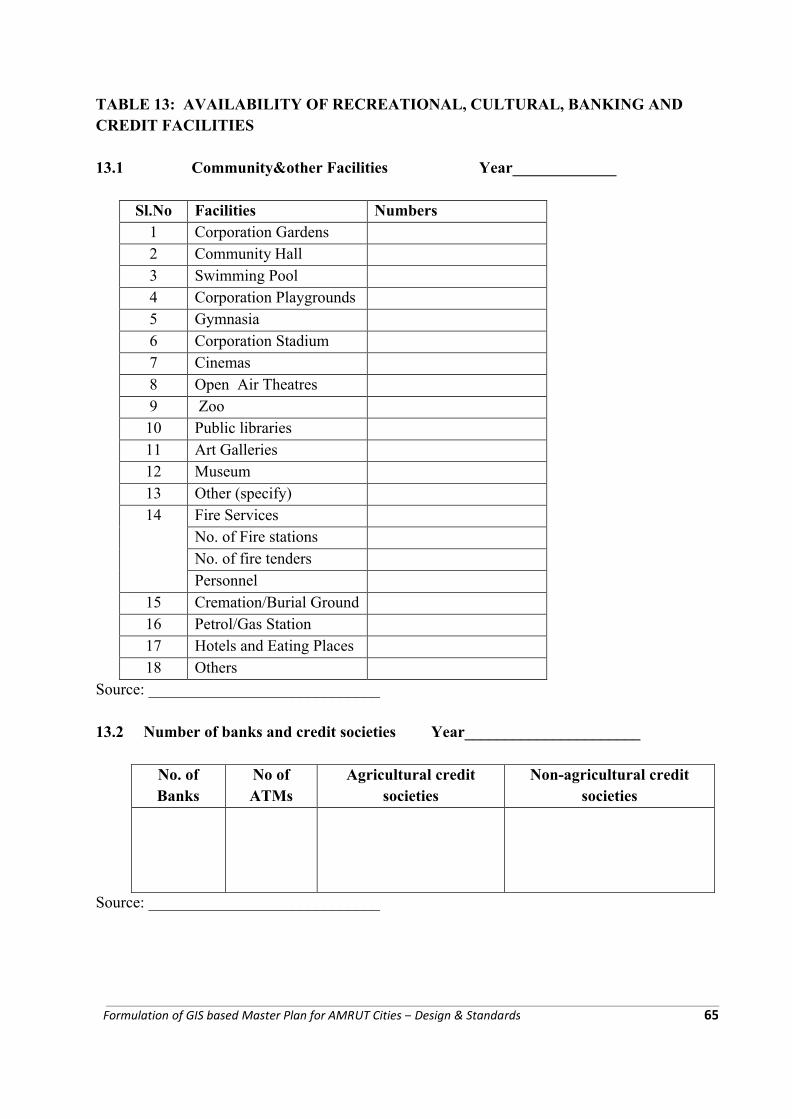
TABLE 13: AVAILABILITY OF RECREATIONAL, CULTURAL, BANKING AND CREDIT FACILITIES
13.1 Community&other Facilities Year_____________
Sl.No Facilities Numbers1 Corporation Gardens2 Community Hall3 Swimming Pool 4 Corporation Playgrounds 5 Gymnasia6 Corporation Stadium7 Cinemas8 Open Air Theatres 9 Zoo10 Public libraries 11 Art Galleries12 Museum 13 Other (specify)14 Fire Services
No. of Fire stationsNo. of fire tendersPersonnel
15 Cremation/Burial Ground16 Petrol/Gas Station17 Hotels and Eating Places18 Others
Source: _____________________________
13.2 Number of banks and credit societies Year______________________
No. of Banks
No of ATMs
Agricultural credit societies
Non-agricultural credit societies
Source: _____________________________
Formulation of GIS based Master Plan for AMRUT Cities – Design & Standards 65
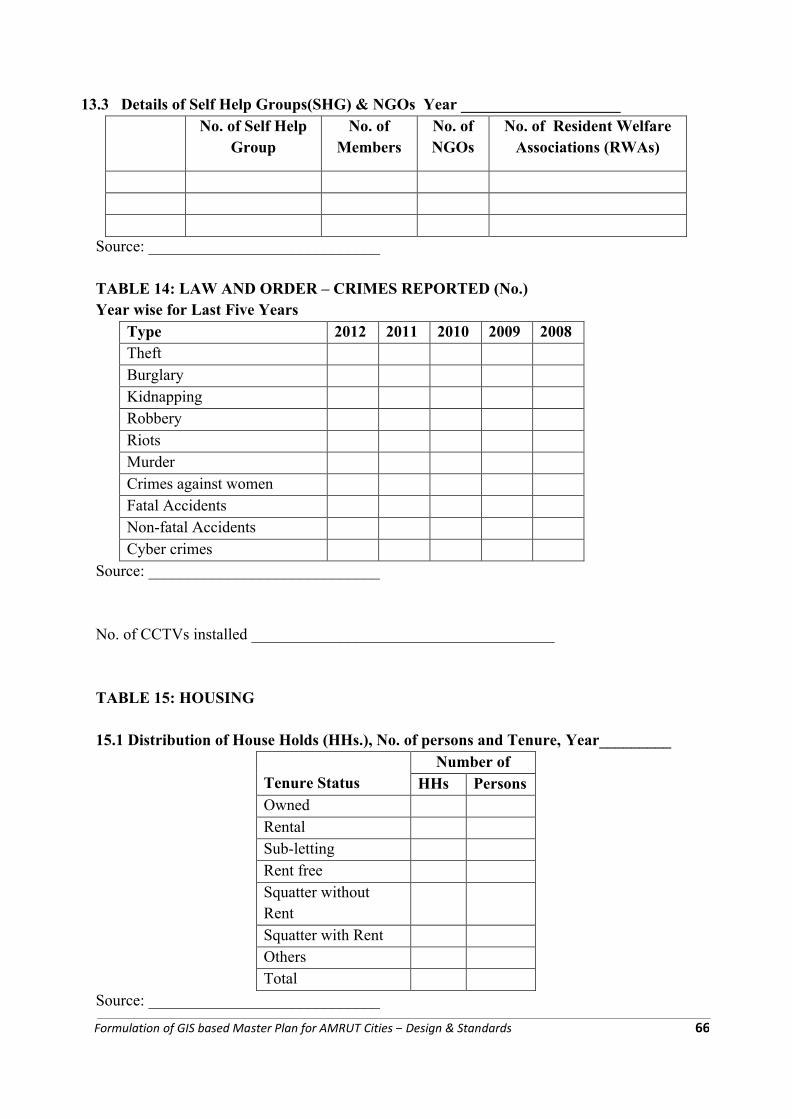
13.3 Details of Self Help Groups(SHG) & NGOs Year ____________________No. of Self Help
GroupNo. of
MembersNo. of NGOs
No. of Resident Welfare Associations (RWAs)
Source: _____________________________
TABLE 14: LAW AND ORDER – CRIMES REPORTED (No.)Year wise for Last Five Years
Type 2012 2011 2010 2009 2008Theft BurglaryKidnappingRobbery RiotsMurder Crimes against women Fatal AccidentsNon-fatal AccidentsCyber crimes
Source: _____________________________
No. of CCTVs installed ______________________________________
TABLE 15: HOUSING
15.1 Distribution of House Holds (HHs.), No. of persons and Tenure, Year_________
Tenure StatusNumber of
HHs PersonsOwnedRental Sub-lettingRent freeSquatter without RentSquatter with RentOthersTotal
Source: _____________________________
Formulation of GIS based Master Plan for AMRUT Cities – Design & Standards 66
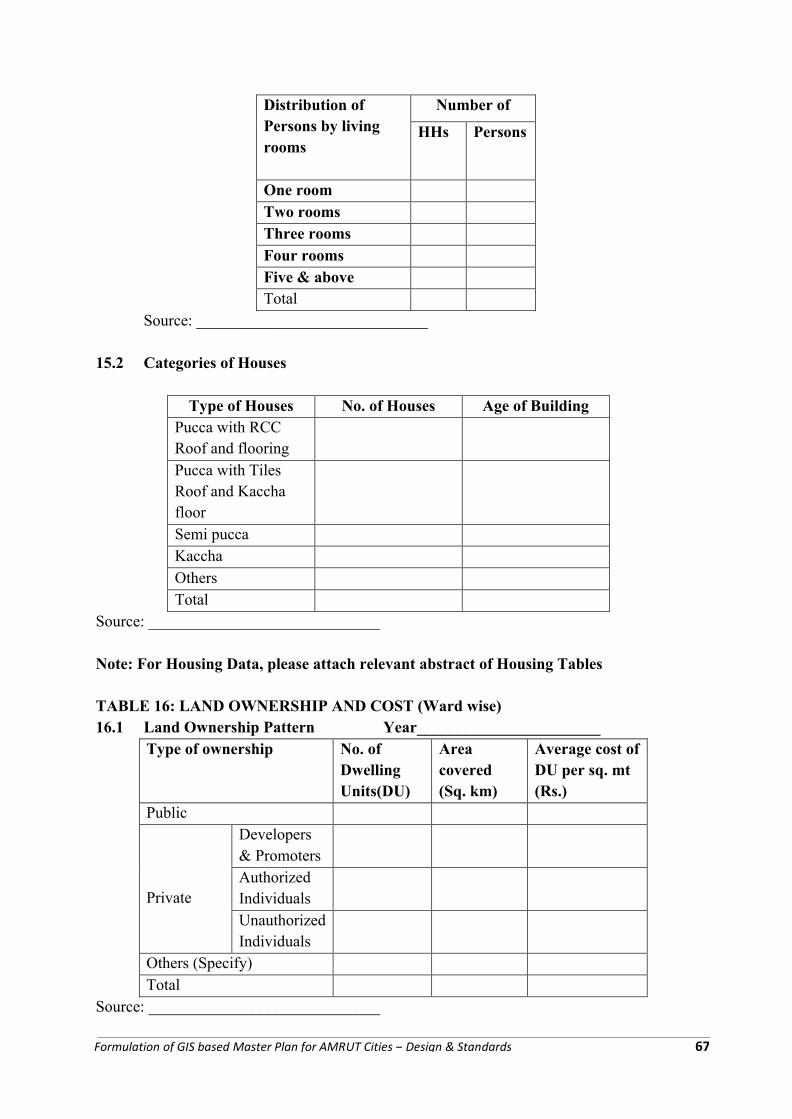
Distribution of Persons by living rooms
Number of
HHs Persons
One roomTwo roomsThree roomsFour roomsFive & aboveTotal
Source: _____________________________
15.2 Categories of Houses
Type of Houses No. of Houses Age of BuildingPucca with RCC Roof and flooring Pucca with Tiles Roof and Kaccha floor Semi puccaKacchaOthersTotal
Source: _____________________________
Note: For Housing Data, please attach relevant abstract of Housing Tables
TABLE 16: LAND OWNERSHIP AND COST (Ward wise)16.1 Land Ownership Pattern Year_______________________
Type of ownership No. of Dwelling Units(DU)
Area covered (Sq. km)
Average cost of DU per sq. mt (Rs.)
Public
Private
Developers & PromotersAuthorized IndividualsUnauthorized Individuals
Others (Specify)Total
Source: _____________________________
Formulation of GIS based Master Plan for AMRUT Cities – Design & Standards 67
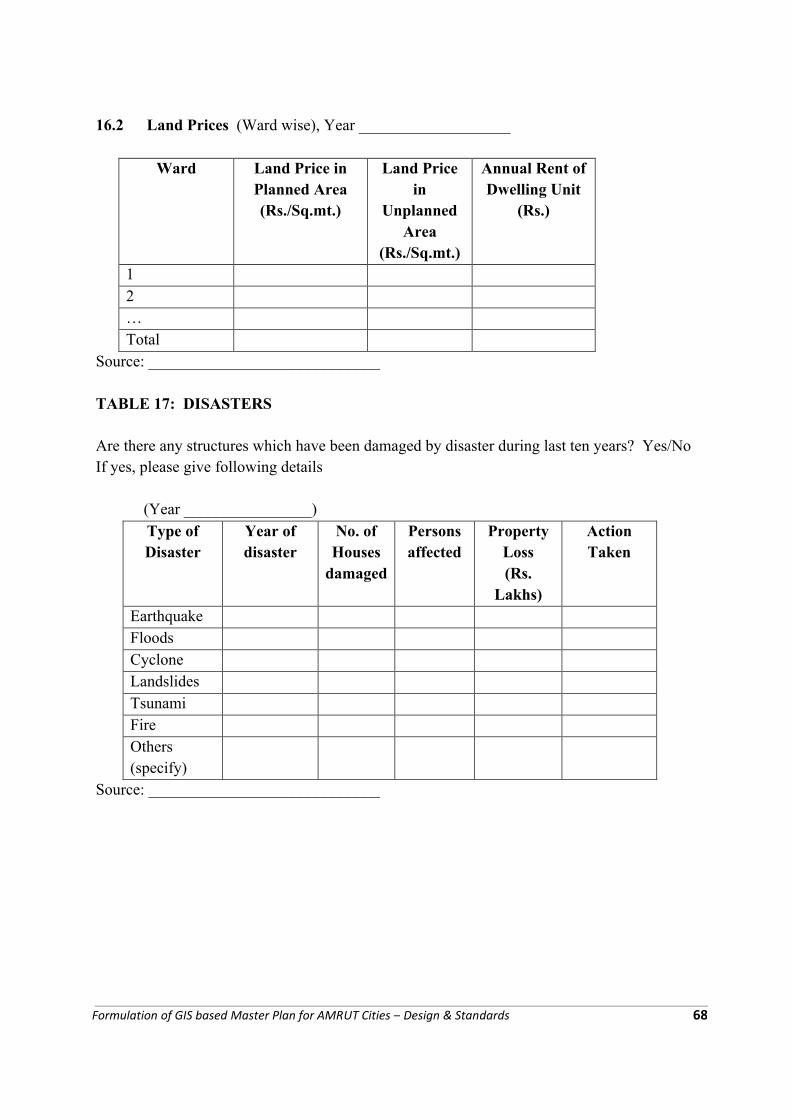
16.2 Land Prices (Ward wise), Year ___________________
Ward Land Price in Planned Area (Rs./Sq.mt.)
Land Price in
Unplanned Area
(Rs./Sq.mt.)
Annual Rent of Dwelling Unit
(Rs.)
12…Total
Source: _____________________________
TABLE 17: DISASTERS
Are there any structures which have been damaged by disaster during last ten years? Yes/No If yes, please give following details
(Year ________________)Type of Disaster
Year of disaster
No. of Houses
damaged
Persons affected
Property Loss(Rs.
Lakhs)
Action Taken
EarthquakeFloodsCycloneLandslidesTsunamiFireOthers (specify)
Source: _____________________________
Formulation of GIS based Master Plan for AMRUT Cities – Design & Standards 68
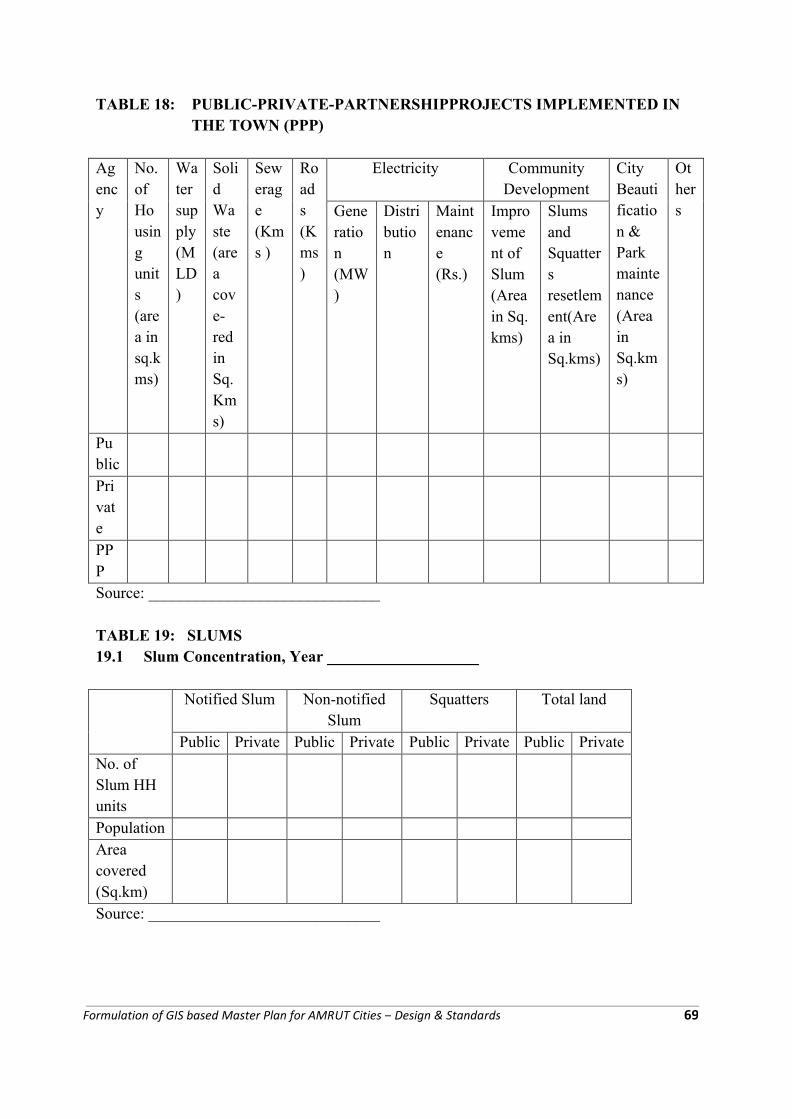
TABLE 18: PUBLIC-PRIVATE-PARTNERSHIPPROJECTS IMPLEMENTED IN THE TOWN (PPP)
Agency
No. of Housing units (area in sq.kms)
Water supply (MLD)
Solid Waste (area cove-red in Sq.Kms)
Sewerage (Kms )
Roads (Kms )
Electricity Community Development
City Beautification & Park maintenance (Area in Sq.kms)
OthersGene
ration (MW)
Distribution
Maintenance (Rs.)
Improvement of Slum (Area in Sq. kms)
Slums and Squatters resetlement(Area in Sq.kms)
PublicPrivatePPPSource: _____________________________
TABLE 19: SLUMS 19.1 Slum Concentration, Year ___________________
Notified Slum Non-notified Slum
Squatters Total land
Public Private Public Private Public Private Public PrivateNo. of Slum HH unitsPopulationArea covered (Sq.km)Source: _____________________________
Formulation of GIS based Master Plan for AMRUT Cities – Design & Standards 69
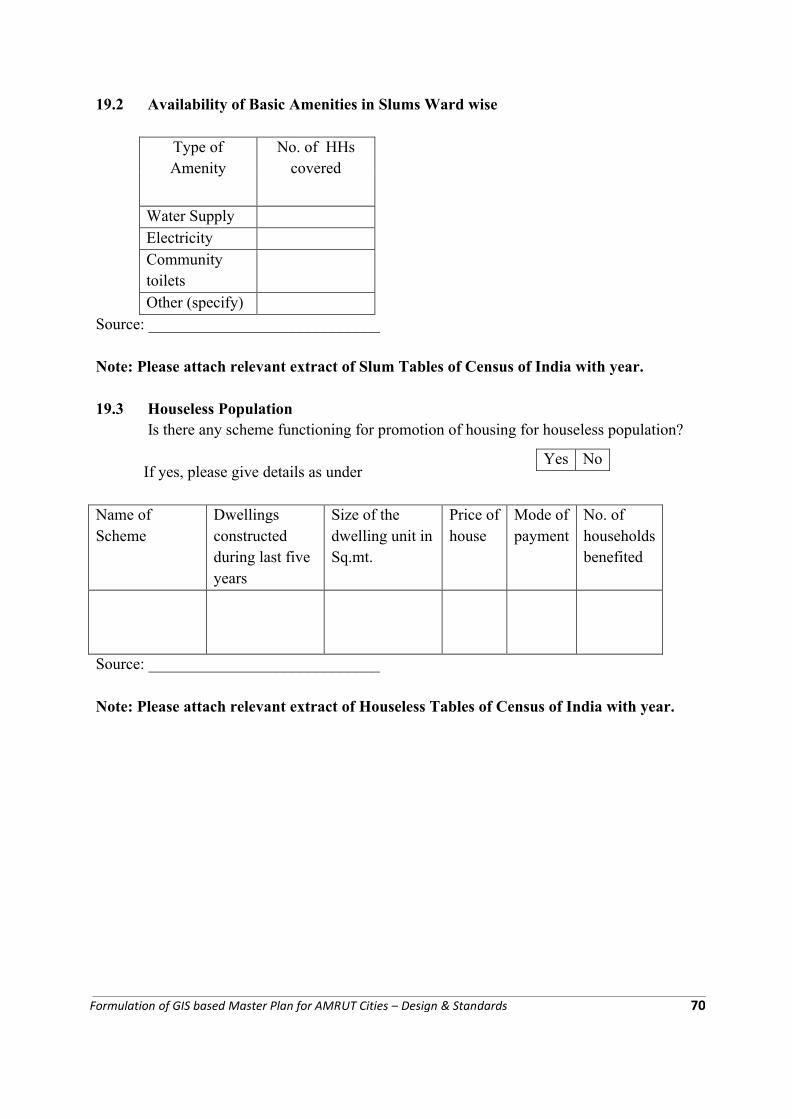
19.2 Availability of Basic Amenities in Slums Ward wise
Type of Amenity
No. of HHs covered
Water SupplyElectricityCommunity toiletsOther (specify)
Source: _____________________________
Note: Please attach relevant extract of Slum Tables of Census of India with year.
19.3 Houseless PopulationIs there any scheme functioning for promotion of housing for houseless population?
If yes, please give details as under
Name of Scheme
Dwellings constructed during last five years
Size of the dwelling unit in Sq.mt.
Price of house
Mode of payment
No. of householdsbenefited
Source: _____________________________
Note: Please attach relevant extract of Houseless Tables of Census of India with year.
Yes No
Formulation of GIS based Master Plan for AMRUT Cities – Design & Standards 70
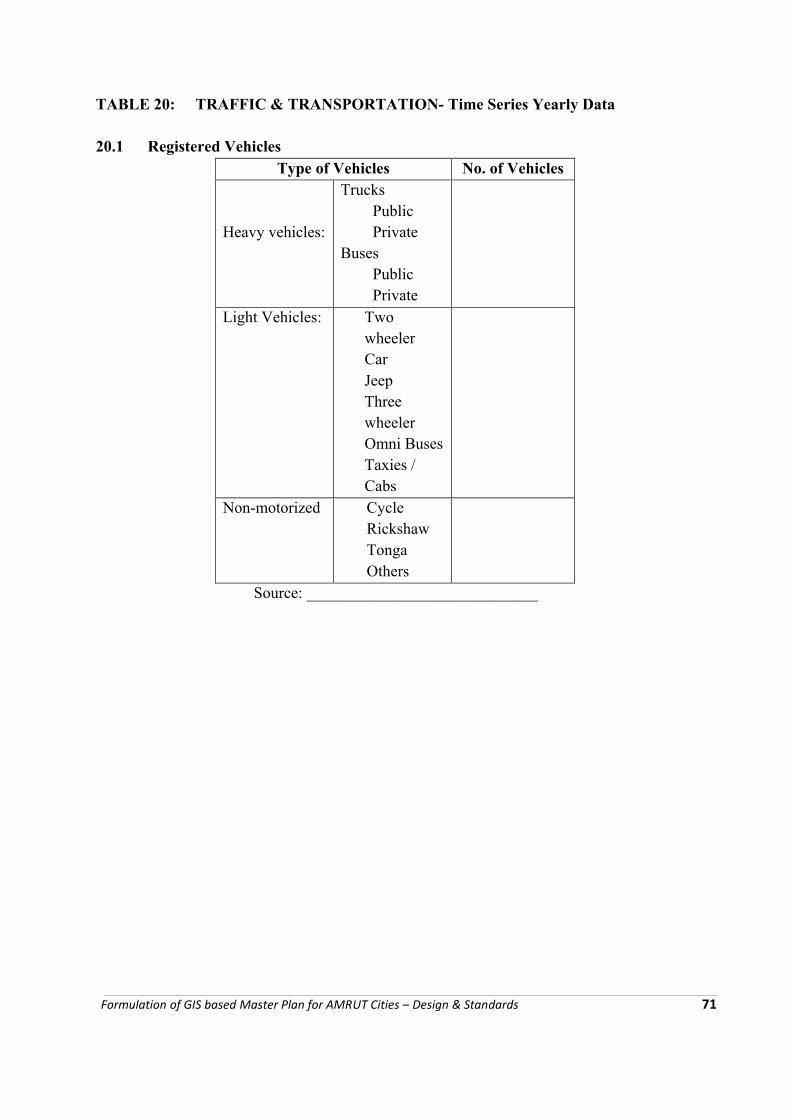
TABLE 20: TRAFFIC & TRANSPORTATION- Time Series Yearly Data
20.1 Registered VehiclesType of Vehicles No. of Vehicles
Heavy vehicles:
TrucksPublicPrivate
BusesPublicPrivate
Light Vehicles: Two wheelerCarJeepThree wheelerOmni BusesTaxies / Cabs
Non-motorized CycleRickshawTongaOthers
Source: _____________________________
Formulation of GIS based Master Plan for AMRUT Cities – Design & Standards 71
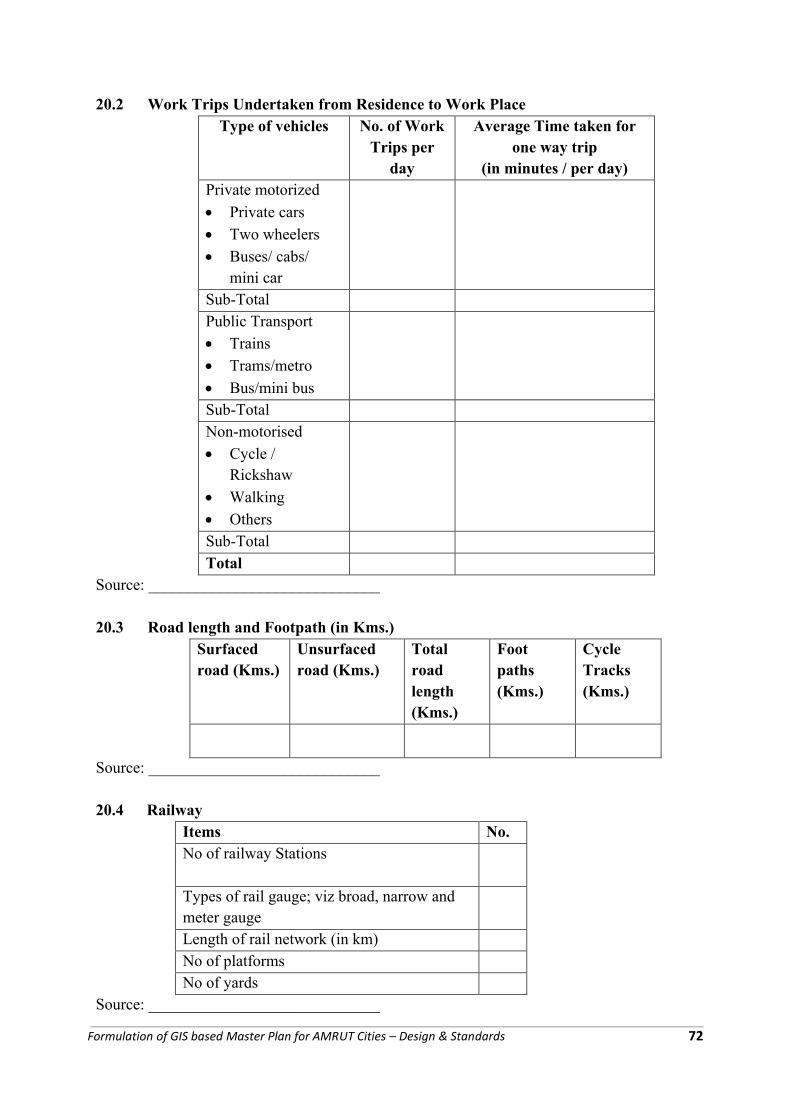
20.2 Work Trips Undertaken from Residence to Work PlaceType of vehicles No. of Work
Trips per day
Average Time taken for one way trip
(in minutes / per day)Private motorized
∑ Private cars
∑ Two wheelers
∑ Buses/ cabs/ mini car
Sub-TotalPublic Transport
∑ Trains
∑ Trams/metro
∑ Bus/mini busSub-TotalNon-motorised
∑ Cycle / Rickshaw
∑ Walking
∑ OthersSub-TotalTotal
Source: _____________________________
20.3 Road length and Footpath (in Kms.)Surfaced road (Kms.)
Unsurfaced road (Kms.)
Total road length (Kms.)
Foot paths (Kms.)
Cycle Tracks (Kms.)
Source: _____________________________
20.4 RailwayItems No.No of railway Stations
Types of rail gauge; viz broad, narrow and meter gaugeLength of rail network (in km)No of platformsNo of yards
Source: _____________________________
Formulation of GIS based Master Plan for AMRUT Cities – Design & Standards 72
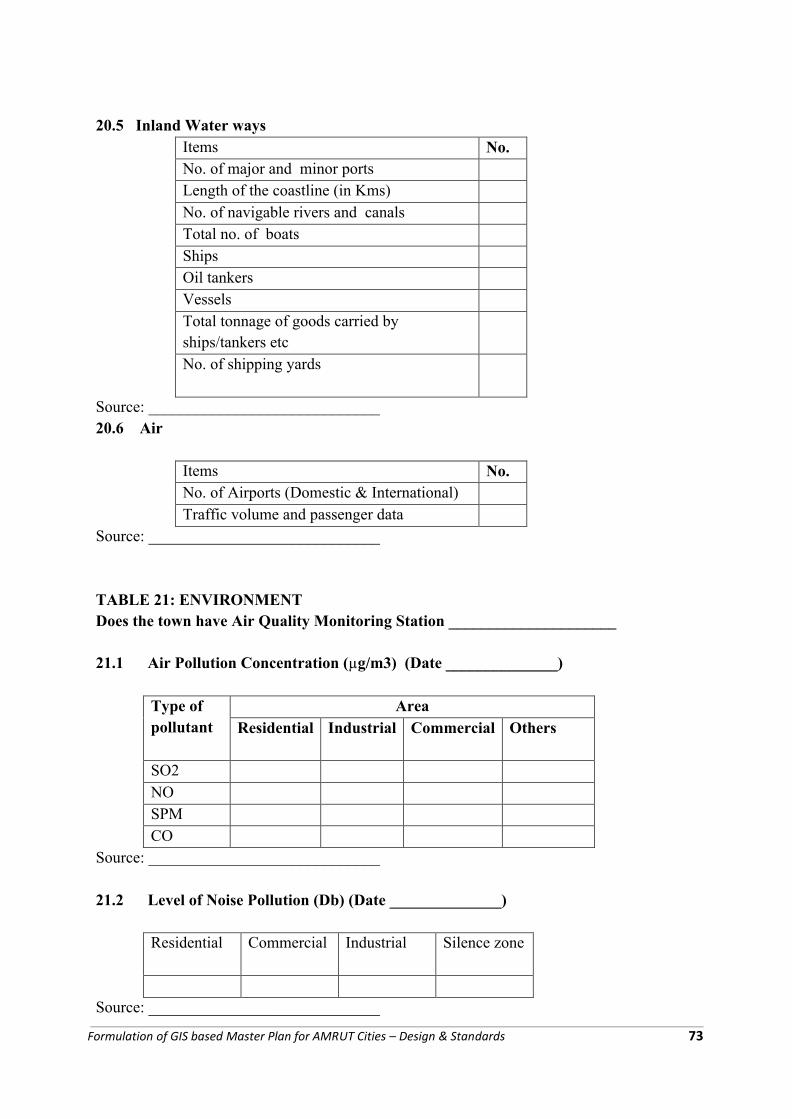
20.5 Inland Water waysItems No.No. of major and minor portsLength of the coastline (in Kms)No. of navigable rivers and canalsTotal no. of boatsShipsOil tankersVessels Total tonnage of goods carried by ships/tankers etcNo. of shipping yards
Source: _____________________________20.6 Air
Items No.No. of Airports (Domestic & International)Traffic volume and passenger data
Source: _____________________________
TABLE 21: ENVIRONMENTDoes the town have Air Quality Monitoring Station _____________________
21.1 Air Pollution Concentration (µg/m3) (Date ______________)
Type of pollutant
AreaResidential Industrial Commercial Others
SO2NOSPMCO
Source: _____________________________
21.2 Level of Noise Pollution (Db) (Date ______________)
Residential Commercial Industrial Silence zone
Source: _____________________________
Formulation of GIS based Master Plan for AMRUT Cities – Design & Standards 73
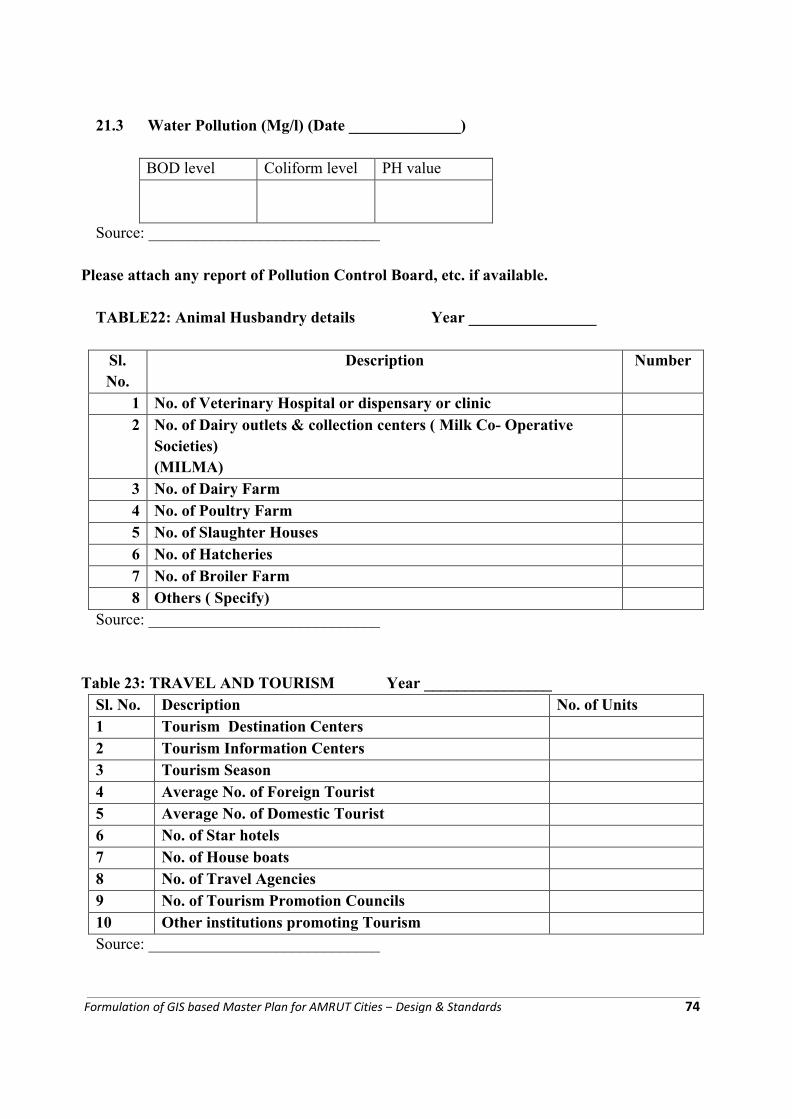
21.3 Water Pollution (Mg/l) (Date ______________)
BOD level Coliform level PH value
Source: _____________________________
Please attach any report of Pollution Control Board, etc. if available.
TABLE22: Animal Husbandry details Year ________________
Sl. No.
Description Number
1 No. of Veterinary Hospital or dispensary or clinic2 No. of Dairy outlets & collection centers ( Milk Co- Operative
Societies)(MILMA)
3 No. of Dairy Farm4 No. of Poultry Farm5 No. of Slaughter Houses6 No. of Hatcheries7 No. of Broiler Farm 8 Others ( Specify)
Source: _____________________________
Table 23: TRAVEL AND TOURISM Year ________________Sl. No. Description No. of Units1 Tourism Destination Centers2 Tourism Information Centers3 Tourism Season4 Average No. of Foreign Tourist5 Average No. of Domestic Tourist6 No. of Star hotels7 No. of House boats8 No. of Travel Agencies9 No. of Tourism Promotion Councils10 Other institutions promoting TourismSource: _____________________________
Formulation of GIS based Master Plan for AMRUT Cities – Design & Standards 74
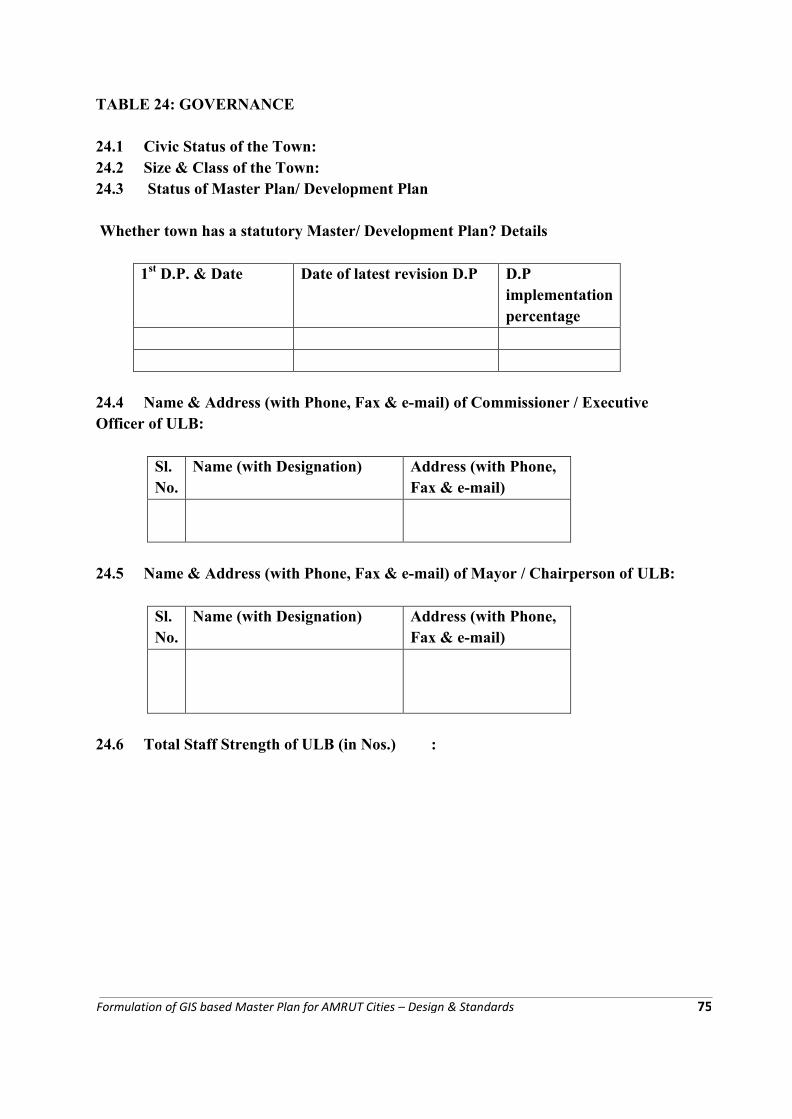
TABLE 24: GOVERNANCE
24.1 Civic Status of the Town:24.2 Size & Class of the Town:24.3 Status of Master Plan/ Development Plan
Whether town has a statutory Master/ Development Plan? Details
1st D.P. & Date Date of latest revision D.P D.P implementation percentage
24.4 Name & Address (with Phone, Fax & e-mail) of Commissioner / Executive Officer of ULB:
Sl. No.
Name (with Designation) Address (with Phone, Fax & e-mail)
24.5 Name & Address (with Phone, Fax & e-mail) of Mayor / Chairperson of ULB:
Sl. No.
Name (with Designation) Address (with Phone, Fax & e-mail)
24.6 Total Staff Strength of ULB (in Nos.) :
Formulation of GIS based Master Plan for AMRUT Cities – Design & Standards 75
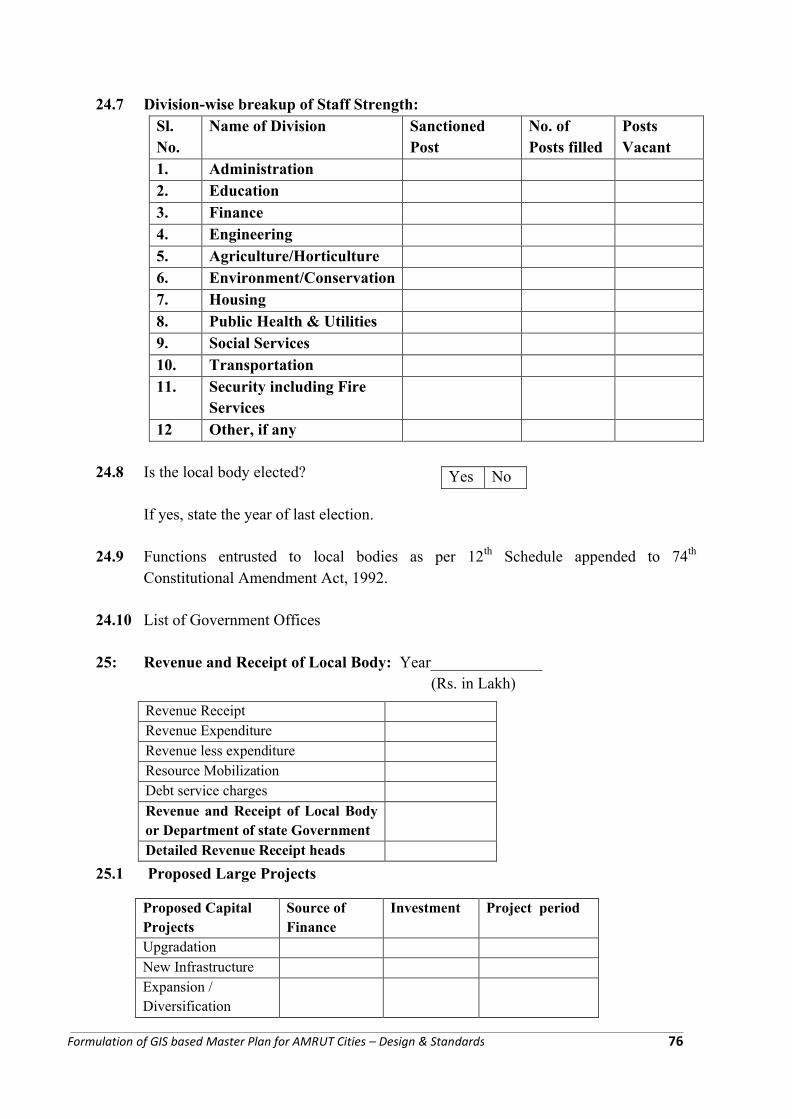
24.7 Division-wise breakup of Staff Strength:Sl. No.
Name of Division Sanctioned Post
No. of Posts filled
Posts Vacant
1. Administration2. Education3. Finance4. Engineering5. Agriculture/Horticulture6. Environment/Conservation7. Housing8. Public Health & Utilities9. Social Services10. Transportation11. Security including Fire
Services12 Other, if any
24.8 Is the local body elected?
If yes, state the year of last election.
24.9 Functions entrusted to local bodies as per 12th Schedule appended to 74th
Constitutional Amendment Act, 1992.
24.10 List of Government Offices
25: Revenue and Receipt of Local Body: Year______________(Rs. in Lakh)
25.1 Proposed Large Projects
Proposed Capital Projects
Source of Finance
Investment Project period
UpgradationNew InfrastructureExpansion / Diversification
Yes No
Revenue ReceiptRevenue ExpenditureRevenue less expenditureResource Mobilization Debt service charges
Revenue and Receipt of Local Body or Department of state GovernmentDetailed Revenue Receipt heads
Formulation of GIS based Master Plan for AMRUT Cities – Design & Standards 76
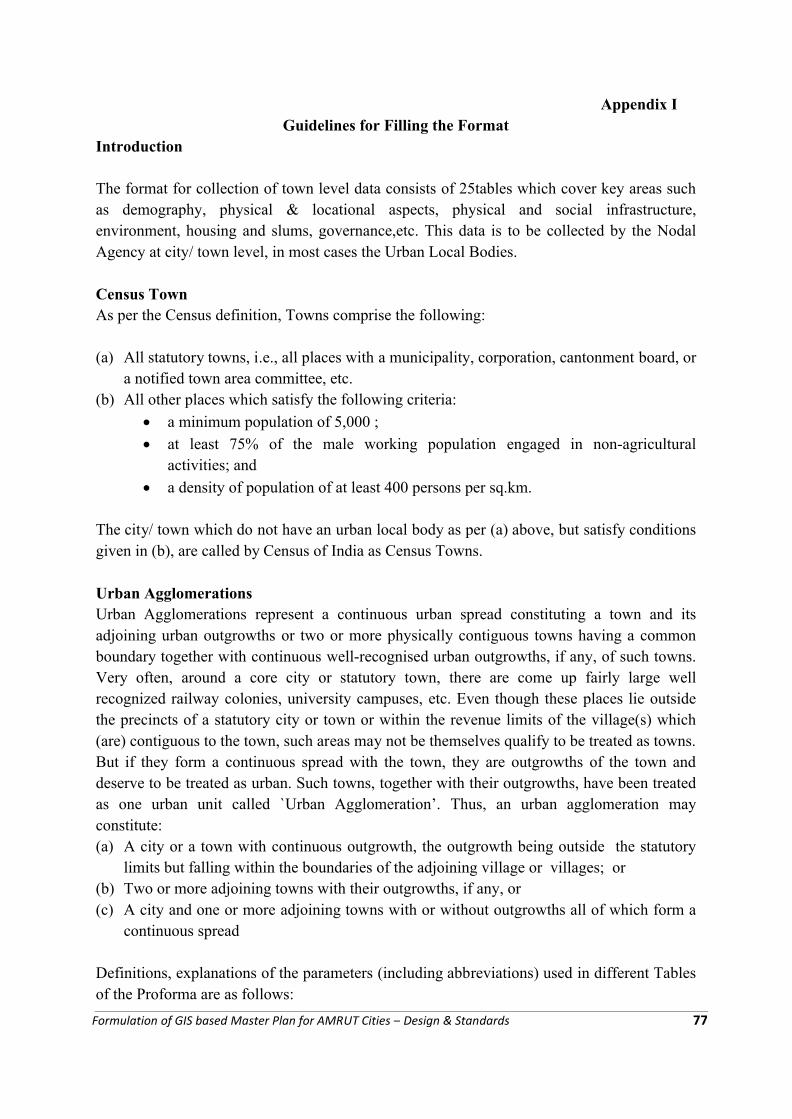
Appendix IGuidelines for Filling the Format
Introduction
The format for collection of town level data consists of 25tables which cover key areas such as demography, physical & locational aspects, physical and social infrastructure, environment, housing and slums, governance,etc. This data is to be collected by the Nodal Agency at city/ town level, in most cases the Urban Local Bodies.
Census TownAs per the Census definition, Towns comprise the following:
(a) All statutory towns, i.e., all places with a municipality, corporation, cantonment board, or a notified town area committee, etc.
(b) All other places which satisfy the following criteria:
∑ a minimum population of 5,000 ;
∑ at least 75% of the male working population engaged in non-agricultural activities; and
∑ a density of population of at least 400 persons per sq.km.
The city/ town which do not have an urban local body as per (a) above, but satisfy conditions given in (b), are called by Census of India as Census Towns.
Urban AgglomerationsUrban Agglomerations represent a continuous urban spread constituting a town and its adjoining urban outgrowths or two or more physically contiguous towns having a common boundary together with continuous well-recognised urban outgrowths, if any, of such towns. Very often, around a core city or statutory town, there are come up fairly large well recognized railway colonies, university campuses, etc. Even though these places lie outside the precincts of a statutory city or town or within the revenue limits of the village(s) which (are) contiguous to the town, such areas may not be themselves qualify to be treated as towns. But if they form a continuous spread with the town, they are outgrowths of the town and deserve to be treated as urban. Such towns, together with their outgrowths, have been treated as one urban unit called `Urban Agglomeration’. Thus, an urban agglomeration may constitute:(a) A city or a town with continuous outgrowth, the outgrowth being outside the statutory
limits but falling within the boundaries of the adjoining village or villages; or (b) Two or more adjoining towns with their outgrowths, if any, or (c) A city and one or more adjoining towns with or without outgrowths all of which form a
continuous spread
Definitions, explanations of the parameters (including abbreviations) used in different Tables of the Proforma are as follows:
Formulation of GIS based Master Plan for AMRUT Cities – Design & Standards 77
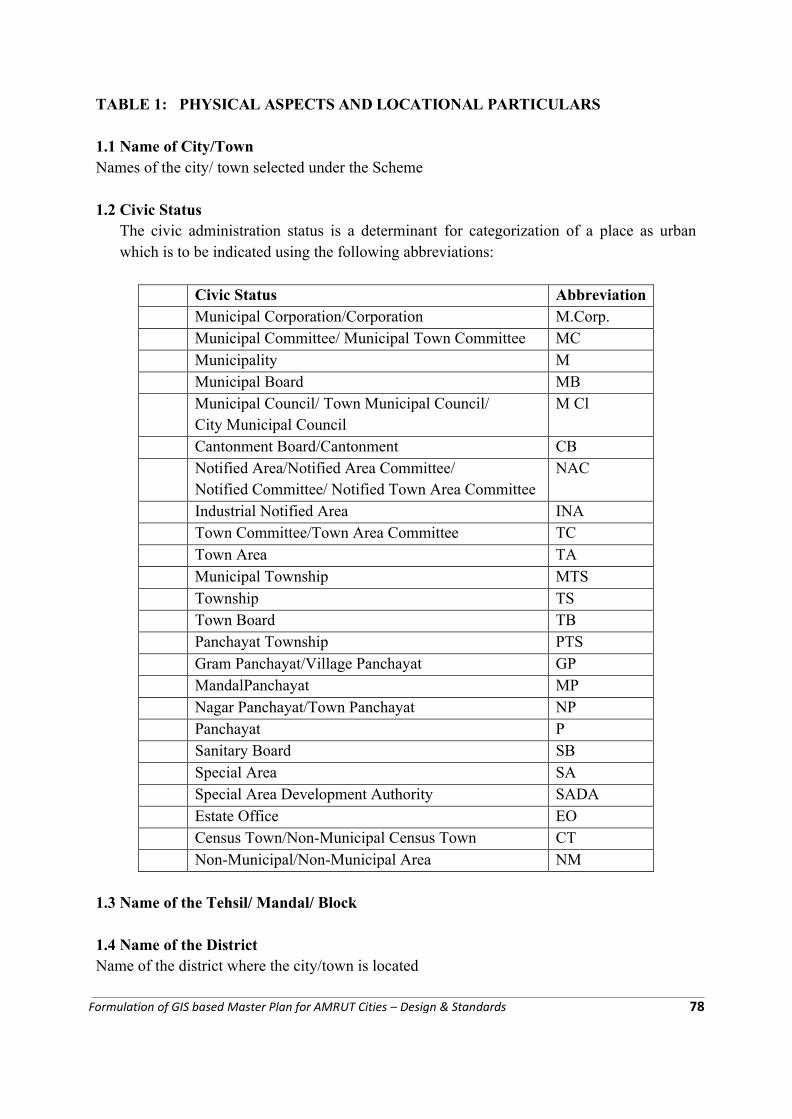
TABLE 1: PHYSICAL ASPECTS AND LOCATIONAL PARTICULARS
1.1 Name of City/TownNames of the city/ town selected under the Scheme
1.2 Civic Status The civic administration status is a determinant for categorization of a place as urban which is to be indicated using the following abbreviations:
Civic Status AbbreviationMunicipal Corporation/Corporation M.Corp.Municipal Committee/ Municipal Town Committee MCMunicipality MMunicipal Board MBMunicipal Council/ Town Municipal Council/ City Municipal Council
M Cl
Cantonment Board/Cantonment CBNotified Area/Notified Area Committee/Notified Committee/ Notified Town Area Committee
NAC
Industrial Notified Area INATown Committee/Town Area Committee TCTown Area TAMunicipal Township MTSTownship TSTown Board TBPanchayat Township PTSGram Panchayat/Village Panchayat GPMandalPanchayat MPNagar Panchayat/Town Panchayat NPPanchayat PSanitary Board SBSpecial Area SASpecial Area Development Authority SADAEstate Office EOCensus Town/Non-Municipal Census Town CTNon-Municipal/Non-Municipal Area NM
1.3 Name of the Tehsil/ Mandal/ Block
1.4 Name of the DistrictName of the district where the city/town is located
Formulation of GIS based Master Plan for AMRUT Cities – Design & Standards 78
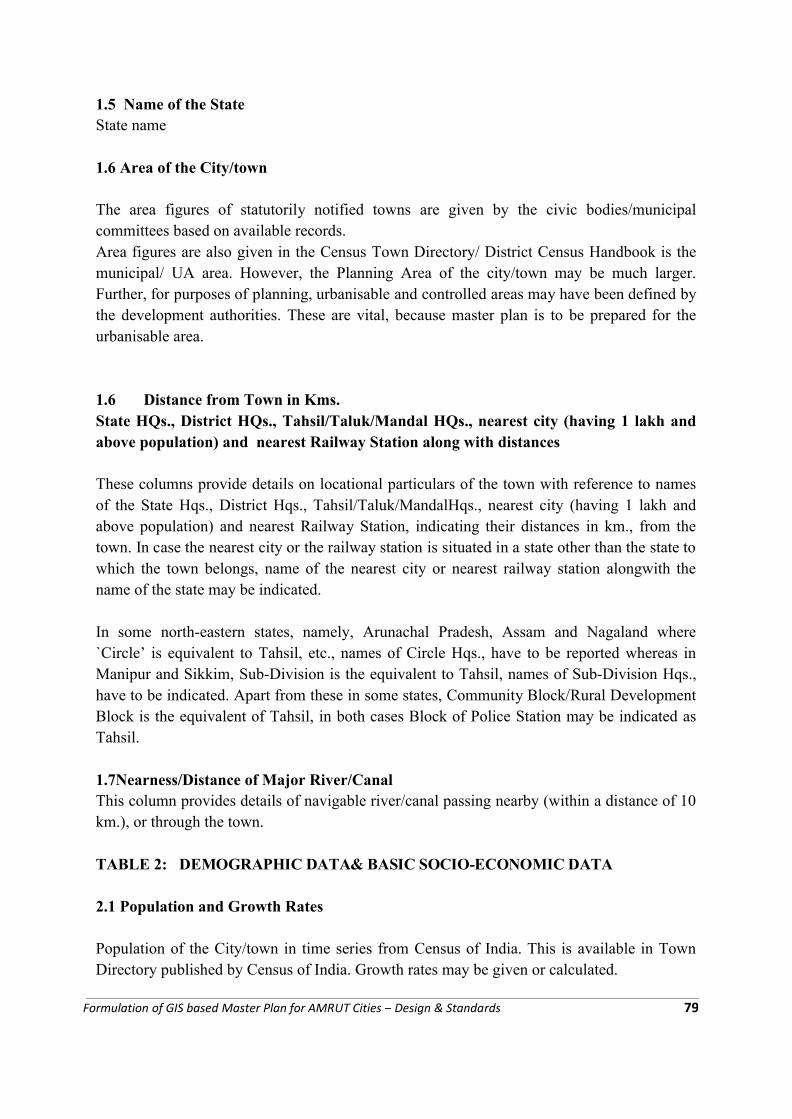
1.5 Name of the State State name
1.6 Area of the City/town
The area figures of statutorily notified towns are given by the civic bodies/municipal committees based on available records.Area figures are also given in the Census Town Directory/ District Census Handbook is the municipal/ UA area. However, the Planning Area of the city/town may be much larger. Further, for purposes of planning, urbanisable and controlled areas may have been defined by the development authorities. These are vital, because master plan is to be prepared for the urbanisable area.
1.6 Distance from Town in Kms. State HQs., District HQs., Tahsil/Taluk/Mandal HQs., nearest city (having 1 lakh and above population) and nearest Railway Station along with distances
These columns provide details on locational particulars of the town with reference to names of the State Hqs., District Hqs., Tahsil/Taluk/MandalHqs., nearest city (having 1 lakh and above population) and nearest Railway Station, indicating their distances in km., from the town. In case the nearest city or the railway station is situated in a state other than the state to which the town belongs, name of the nearest city or nearest railway station alongwith the name of the state may be indicated.
In some north-eastern states, namely, Arunachal Pradesh, Assam and Nagaland where `Circle’ is equivalent to Tahsil, etc., names of Circle Hqs., have to be reported whereas in Manipur and Sikkim, Sub-Division is the equivalent to Tahsil, names of Sub-Division Hqs., have to be indicated. Apart from these in some states, Community Block/Rural Development Block is the equivalent of Tahsil, in both cases Block of Police Station may be indicated as Tahsil.
1.7Nearness/Distance of Major River/CanalThis column provides details of navigable river/canal passing nearby (within a distance of 10 km.), or through the town.
TABLE 2: DEMOGRAPHIC DATA& BASIC SOCIO-ECONOMIC DATA
2.1 Population and Growth Rates
Population of the City/town in time series from Census of India. This is available in Town Directory published by Census of India. Growth rates may be given or calculated.
Formulation of GIS based Master Plan for AMRUT Cities – Design & Standards 79
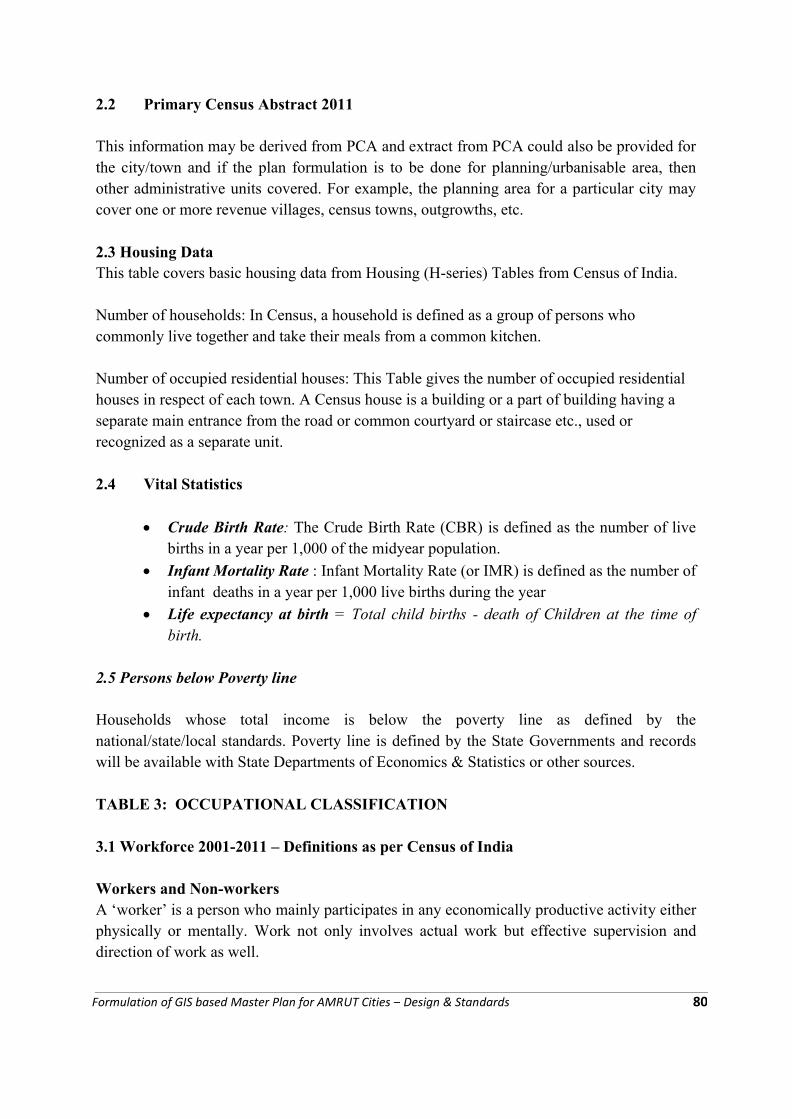
2.2 Primary Census Abstract 2011
This information may be derived from PCA and extract from PCA could also be provided for the city/town and if the plan formulation is to be done for planning/urbanisable area, then other administrative units covered. For example, the planning area for a particular city may cover one or more revenue villages, census towns, outgrowths, etc.
2.3 Housing Data This table covers basic housing data from Housing (H-series) Tables from Census of India.
Number of households: In Census, a household is defined as a group of persons who commonly live together and take their meals from a common kitchen.
Number of occupied residential houses: This Table gives the number of occupied residential houses in respect of each town. A Census house is a building or a part of building having a separate main entrance from the road or common courtyard or staircase etc., used or recognized as a separate unit.
2.4 Vital Statistics
∑ Crude Birth Rate: The Crude Birth Rate (CBR) is defined as the number of live births in a year per 1,000 of the midyear population.
∑ Infant Mortality Rate : Infant Mortality Rate (or IMR) is defined as the number of infant deaths in a year per 1,000 live births during the year
∑ Life expectancy at birth = Total child births - death of Children at the time of birth.
2.5 Persons below Poverty line
Households whose total income is below the poverty line as defined by the national/state/local standards. Poverty line is defined by the State Governments and records will be available with State Departments of Economics & Statistics or other sources.
TABLE 3: OCCUPATIONAL CLASSIFICATION
3.1 Workforce 2001-2011 – Definitions as per Census of India
Workers and Non-workersA ‘worker’ is a person who mainly participates in any economically productive activity either physically or mentally. Work not only involves actual work but effective supervision and direction of work as well.
Formulation of GIS based Master Plan for AMRUT Cities – Design & Standards 80
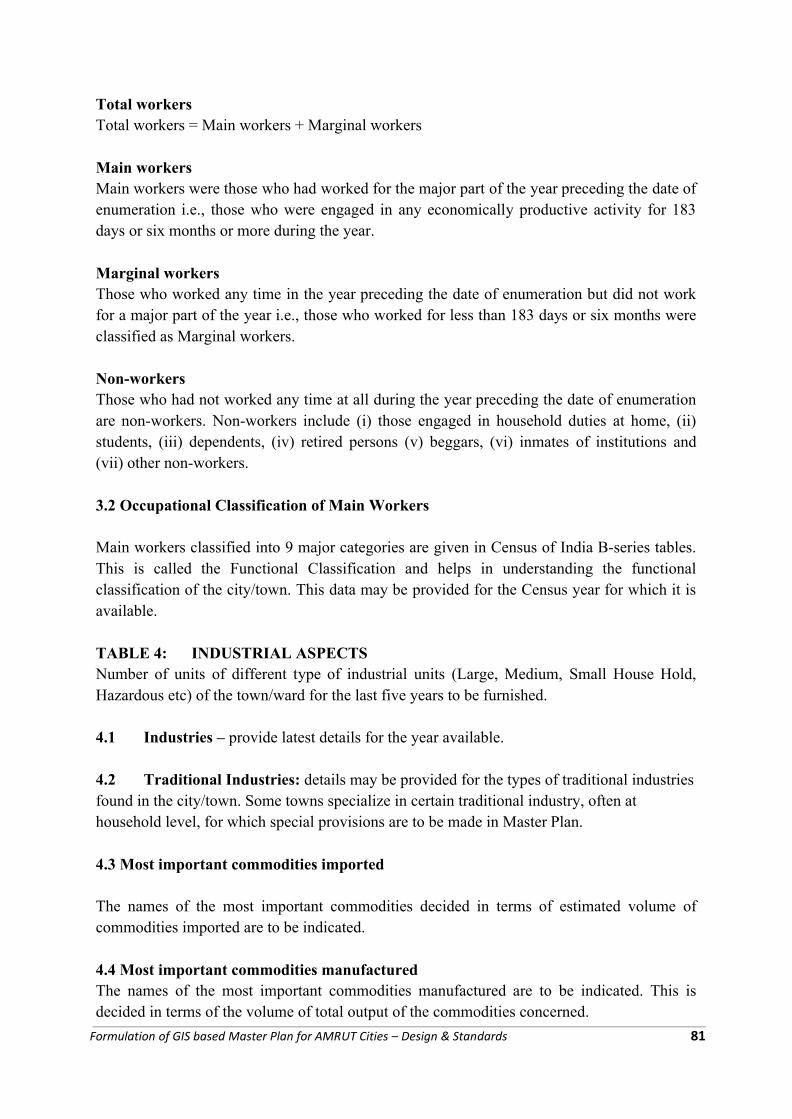
Total workersTotal workers = Main workers + Marginal workers
Main workersMain workers were those who had worked for the major part of the year preceding the date of enumeration i.e., those who were engaged in any economically productive activity for 183 days or six months or more during the year.
Marginal workersThose who worked any time in the year preceding the date of enumeration but did not work for a major part of the year i.e., those who worked for less than 183 days or six months were classified as Marginal workers.
Non-workersThose who had not worked any time at all during the year preceding the date of enumeration are non-workers. Non-workers include (i) those engaged in household duties at home, (ii) students, (iii) dependents, (iv) retired persons (v) beggars, (vi) inmates of institutions and (vii) other non-workers.
3.2 Occupational Classification of Main Workers
Main workers classified into 9 major categories are given in Census of India B-series tables. This is called the Functional Classification and helps in understanding the functional classification of the city/town. This data may be provided for the Census year for which it is available.
TABLE 4: INDUSTRIAL ASPECTSNumber of units of different type of industrial units (Large, Medium, Small House Hold, Hazardous etc) of the town/ward for the last five years to be furnished.
4.1 Industries – provide latest details for the year available.
4.2 Traditional Industries: details may be provided for the types of traditional industries found in the city/town. Some towns specialize in certain traditional industry, often at household level, for which special provisions are to be made in Master Plan.
4.3 Most important commodities imported
The names of the most important commodities decided in terms of estimated volume of commodities imported are to be indicated.
4.4 Most important commodities manufacturedThe names of the most important commodities manufactured are to be indicated. This is decided in terms of the volume of total output of the commodities concerned.
Formulation of GIS based Master Plan for AMRUT Cities – Design & Standards 81
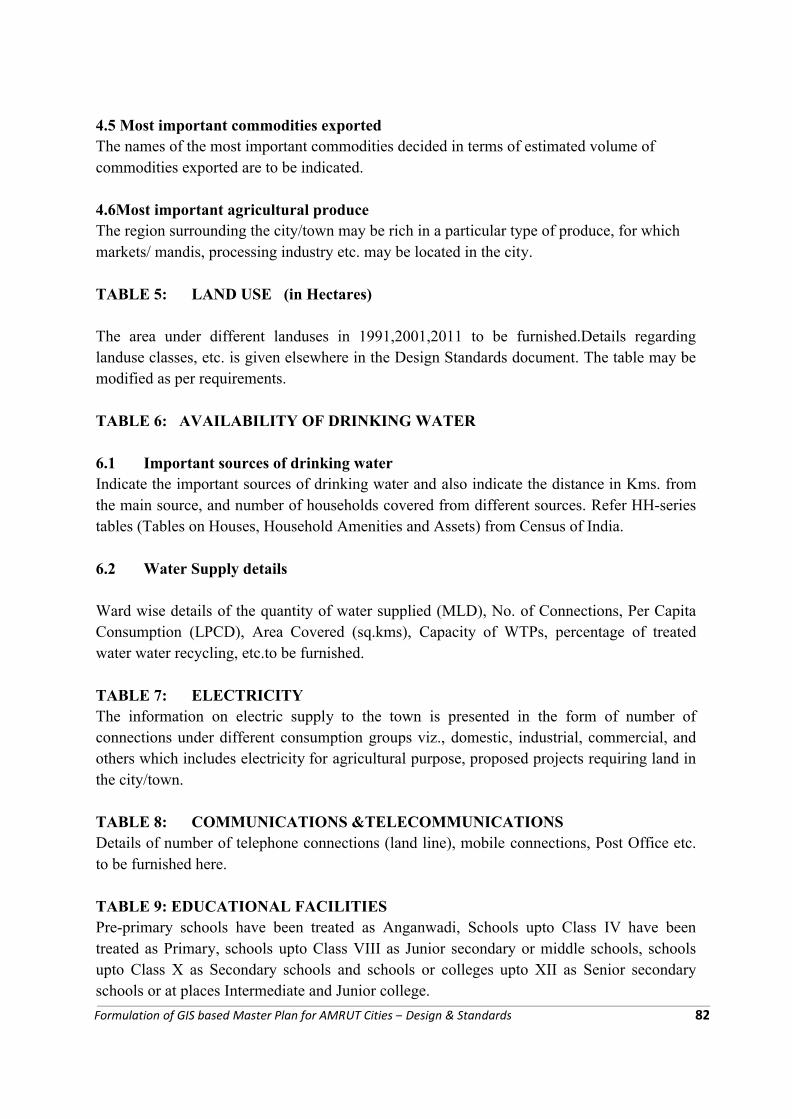
4.5 Most important commodities exportedThe names of the most important commodities decided in terms of estimated volume of commodities exported are to be indicated.
4.6Most important agricultural produceThe region surrounding the city/town may be rich in a particular type of produce, for which markets/ mandis, processing industry etc. may be located in the city.
TABLE 5: LAND USE (in Hectares)
The area under different landuses in 1991,2001,2011 to be furnished.Details regarding landuse classes, etc. is given elsewhere in the Design Standards document. The table may be modified as per requirements.
TABLE 6: AVAILABILITY OF DRINKING WATER
6.1 Important sources of drinking waterIndicate the important sources of drinking water and also indicate the distance in Kms. from the main source, and number of households covered from different sources. Refer HH-series tables (Tables on Houses, Household Amenities and Assets) from Census of India.
6.2 Water Supply details
Ward wise details of the quantity of water supplied (MLD), No. of Connections, Per Capita Consumption (LPCD), Area Covered (sq.kms), Capacity of WTPs, percentage of treated water water recycling, etc.to be furnished.
TABLE 7: ELECTRICITY The information on electric supply to the town is presented in the form of number of connections under different consumption groups viz., domestic, industrial, commercial, and others which includes electricity for agricultural purpose, proposed projects requiring land in the city/town.
TABLE 8: COMMUNICATIONS &TELECOMMUNICATIONSDetails of number of telephone connections (land line), mobile connections, Post Office etc. to be furnished here.
TABLE 9: EDUCATIONAL FACILITIESPre-primary schools have been treated as Anganwadi, Schools upto Class IV have been treated as Primary, schools upto Class VIII as Junior secondary or middle schools, schools upto Class X as Secondary schools and schools or colleges upto XII as Senior secondary schools or at places Intermediate and Junior college.
Formulation of GIS based Master Plan for AMRUT Cities – Design & Standards 82
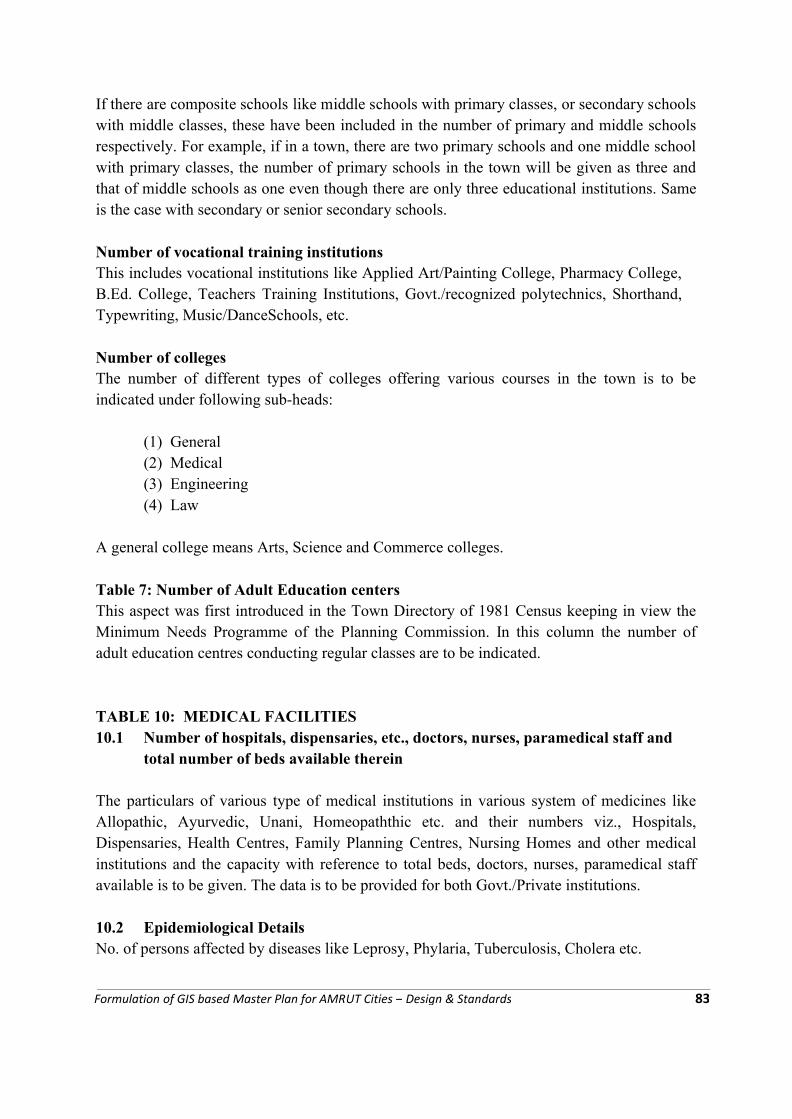
If there are composite schools like middle schools with primary classes, or secondary schools with middle classes, these have been included in the number of primary and middle schools respectively. For example, if in a town, there are two primary schools and one middle school with primary classes, the number of primary schools in the town will be given as three and that of middle schools as one even though there are only three educational institutions. Same is the case with secondary or senior secondary schools.
Number of vocational training institutionsThis includes vocational institutions like Applied Art/Painting College, Pharmacy College, B.Ed. College, Teachers Training Institutions, Govt./recognized polytechnics, Shorthand, Typewriting, Music/DanceSchools, etc.
Number of collegesThe number of different types of colleges offering various courses in the town is to be indicated under following sub-heads:
(1) General(2) Medical(3) Engineering(4) Law
A general college means Arts, Science and Commerce colleges.
Table 7: Number of Adult Education centersThis aspect was first introduced in the Town Directory of 1981 Census keeping in view the Minimum Needs Programme of the Planning Commission. In this column the number of adult education centres conducting regular classes are to be indicated.
TABLE 10: MEDICAL FACILITIES 10.1 Number of hospitals, dispensaries, etc., doctors, nurses, paramedical staff and
total number of beds available therein
The particulars of various type of medical institutions in various system of medicines like Allopathic, Ayurvedic, Unani, Homeopaththic etc. and their numbers viz., Hospitals, Dispensaries, Health Centres, Family Planning Centres, Nursing Homes and other medical institutions and the capacity with reference to total beds, doctors, nurses, paramedical staff available is to be given. The data is to be provided for both Govt./Private institutions.
10.2 Epidemiological DetailsNo. of persons affected by diseases like Leprosy, Phylaria, Tuberculosis, Cholera etc.
Formulation of GIS based Master Plan for AMRUT Cities – Design & Standards 83
TABLE 11: AVAILABILITY OF SANITARY FACILITIES
The sanitation facilities in a city/town could be based on septic tanks or sewerage system or low cost sanitation. Studies have shown that proper sewerage systems cover less than 20% of Indian Cities. Therefore, the correct data has to be filled in here so that planning could be undertaken accordingly.
Sewerage SystemSewerage system implies the network of mains and branches of underground conduits for the conveyance of sewage to the point of disposal. Sewers that carry only household and industrial wastage are called separate sewers; those that carry storm water from roofs, streets and other surfaces are known as storm water drains, while those carrying both sewage and storm water are called combined sewers. However, towns which are not provided with such underground sewerage system normally have open surface drain, covered drains, etc.
11.2 Network DetailsThe details about the sewerage/ drainage network to be provided.
11.3-11.8 Details of sewage generation, treatment and disposal
11.9 Public Toilets
11.10 Major Storm Water Drains
TABLE 12: SOLID WASTE MANAGEMENTThere are three major steps involved in the management of solid waste viz. collection, transportation and disposal. Disposal of solid waste is generally done through land filling.
Municipal solid waste includes commercial and residential waste generated by a communityCollection means collection and removal of solid waste from different collection pointsDisposal means final disposal of solid waste;
Recycling means the process by which waste is transformed into new products in such a manner that the original products lose their identity;
Land fill: Means disposal of solid waste by spreading it in layers over a lined surface or land, compacting it to the smallest volume and covering it by impervious soil layer at the end of the day or more frequently. A landfill is operated to prevent leachate for contaminating ground water and maintaining ambient air quality;
Incineration: Incineration is a process of controlled combustion for burning of waste and residue, containing material, Carbon dioxide, water vapour, ash and non-combustible end products.
Formulation of GIS based Master Plan for AMRUT Cities – Design & Standards 84
Biodegradable substance means a substance that can be degraded by micro-organisms.
Hospital Waste: Waste generating from the hospitals is called hospital waste
TABLE 13: AVAILABILITY OF RECREATIONAL, CULTURAL, BANKING AND CREDIT FACILITIES
13.1 Community Facilities
The particulars of recreational facilities such as stadia, museum, cinema halls and auditoria/drama/community halls and their number in the town are to be recorded. The availability of cultural facilities in the form of the number of public libraries and reading rooms, if any, available in the town is to be indicated. If firefighting facility is not available in the town, the name of the nearest place where this facility is available is to be indicated and the distance of the same is given in column.
13.2 Number of banksand credit societies
BanksNumber of banks, commercial as well as co-operative functioning in the town has to be indicated. It gives the number of banks both the head as well as branch offices of banks in each town, which actually transact banking business. The head or branch offices not actually transacting any banking business are not to be taken into account.
Credit SocietiesThe information on Agricultural Credit Societies and Non-Agricultural Credit Societies are to be furnished.
The agricultural credit societies include service, multipurpose, agricultural produce, marketing cooperative societies, etc. The non-agricultural credit societies include consumer cooperative societies and also credit co-operative societies of certain categories of persons like teachers, postal-workers, etc.
TABLE 14: LAW AND ORDER / CRIMES TABLE 15: HOUSING
TABLE 16: LAND OWNERSHIP AND COST
16.3 Mortgage to credit ratio for housing (Rs. in Lakh)
Mortgage / loansPercentage of dwellings purchased during the past year that are covered by mortgage and percentage of dwellings that are covered by non-mortgage.
Formulation of GIS based Master Plan for AMRUT Cities – Design & Standards 85
TABLE 17: DISASTERS
TABLE 18: PUBLIC PRIVATE PARTNERSHIP PROJECTS IMPLEMENTED IN THE TOWN (PPP)
TABLE 19: SLUMS All the inhabitants of the areas, which have been notified as slums by the state governments under any legal provisions or even recognized by them, are to be accordingly considered as slum population. Besides areas in cities/towns, which satisfy the usual criteria for declaring an area as slum have also been included.As per Census of India, the slum areas broadly consist of:-
1. All specified areas notified as 'Slum' by State/Local Government and UT Administration under any Act;
2. All areas recognized as 'Slum' by State/Local Government and UT Administration which may not have been formally notified as slum under any Act;
3. A compact area of at least 300 population or about 60-70 households of poorly built congested tenements, in unhygienic environment usually with inadequate infrastructure and lacking in proper sanitary and drinking water facilities.
Houseless Population: As per Census of India 2011, households which do not live in buildings or Census houses but live in the open or roadside, pavements, in hume-pipes, under fly-overs and staircases, or in the open in places of worship, mandaps, railway platforms, etc., are to be treated as Houseless households
TABLE 20: TRAFFIC & TRANSPORTATION
20.3 Road length and Footpath (in Km.)The road length to be shown in these columns pertains to Surfaced i.e., Pucca and Un-surfaced i.e., Kutcha roads and its total road length.
TABLE 21: ENVIRONMENTEnvironmental pollutant means any solid, liquid or gaseous substance present in such concentration as may be or tend to be, injurious to environment and environmental pollution means the presence in the environment of any environmental pollutant.
20.1 Air pollution Air pollution is the excessive concentration of foreign matter in the air, which adversely affects the well being of the individual or cause damage to property. The important air contaminants are SO2, NO, Suspended Particulate Matter (SPM), CO. Air pollutants are measures in µg/m3.
Sulfur dioxide (SO2):SO2 is an irritant colourless gas, which affects the mucous membranes when inhaled. Exposure at low level can cause increased upper respiratory symptoms such as cough, sore throat and affects lung function.
Formulation of GIS based Master Plan for AMRUT Cities – Design & Standards 86
Oxides of Nitrogen (NO): Of the seven oxides of nitrogen known to exist in the ambient air, Nitrogen dioxide is the main oxides affecting human health. Oxides of nitrogen are released in all the types of combustion as they are formed by the oxidation of atmospheric nitrogen at high temperature. Exposure to excessive NO2
affects the defense mechanism of human body.
Suspended Particulate Matters (SPM): Particulate is a term given to the minute particle of solid or semi solid material dispersed in the atmosphere. SPM presence in the air cause respiratory diseases.
Carbon Monoxide (CO): Carbon monoxide is a colourless, odourless gas with relatively poor solubility in water. CO emission is due to incomplete combustion of fuel of vehicles. CO affects the central nervous system and also responsible for heart attacks and a high mortality rate.
20.2 Noise Pollution: Noise is an unwanted sound without agreeable musical quality. Noise levels are measured in decibels. One decibel is the threshold of hearing.
20.3 Water pollution: Water pollution is any physical or chemical change in water that can adversely affect organisms
Biochemical oxygen demand, or BOD The amount of organic material that can decompose in the sewage is measured by the biochemical oxygen demand. BOD is the amount of oxygen required by micro-organisms to decompose the organic substances in sewage. Therefore, the more organic material there is in the sewage, the higher the BOD. Dissolved oxygen is an important factor that determines the quality of water in lakes and rivers. The higher the concentration of dissolved oxygen, the better the water quality. BOD level measured in mg/l.
Coliform level: Coliform level is an important index to measure pollution by human waste. Water pollution due to human excreta is caused mainly by the lack of proper municipal sewerage.
pH Value: A number used to express degrees of acidity or alkalinity in solution.
TABLE 22: ANIMAL HUSBANDARY DETAILS
Animal husbandry continues to be an important activity in most Indian cities/ towns, most often found in urban villages and peri-urban areas. Details are essential for master plan formulation.
Formulation of GIS based Master Plan for AMRUT Cities – Design & Standards 87
TABLE 23: TRAVEL & TOURISMAspects related to travel and tourism closely affect demand for facilities, demand for land and economic activity generated such as hotels, parking, eateries, water demand, electricity demand, etc.
TABLE 24: GOVERNANCE
Civic Status of town: see para 1.2.
Status of Master/ Development Plan:Many cities/ towns will have at least some kind of pre-existing plan document.The details such as date of sanction of the Ist Plan, plan revision are to be furnished.
Revenue and Receipt of Local Body (Rs in Lakh)The actual revenue receipt and revenue expenditure figures of the administrative body governing the town are to be filled. Data is to be presented not only in respect of statutory bodies but also in respect of non-statutory bodies managing the civic administration of the towns if they have separate budgets and accounts of their own pertaining to the town.
City ProductTotal product of the city as defined in national accounts procedures. It may either be taken as the total income or value-added (wages plus business surplus plus taxes plus imports), or the total final demand (consumption plus investment plus exports).
City Product = (GNP) x (number of households in the city) x (average household income in the city) (Total national household income, from national accounts)
Formulation of GIS based Master Plan for AMRUT Cities – Design & Standards 88
REFERENCES
1. NNRMS Standards: A National Standard for EO images, Thematic & Cartographic Maps, GIS Databases and Spatial Outputs,July 2005, ISRO: NNRMS: TR: 112: 2005 committee report.
2. NUIS Design & Standards, July 2006, TCPO / MoUD, New Delhi.
3. Urban And Regional Development Plans Formulation And Implementation (URDPFI) Guidelines, January 2015, MoUD, New Delhi.
4. Andhra Pradesh Municipal Development Project (APMDP), Terms of Reference, 2013, Govt. of AP.
5. For more details on AMRUT may visit Mission website http://amrut.gov.in/
Formulation of GIS based Master Plan for AMRUT Cities – Design & Standards