Embed Size (px)
Citation preview
I ¢co-ue;.a .. _ _ (:otqmvCIIIN410 __" _ -
| MOLTEN SALTi, THERMAL ENIERGYSTORAGESYSTEMS
c_:._E S_'5:_S Final Fepo[t (IBstitut_ of
has lecnr.o!o_y) i&9 _ HC ._C7/_F AO"CCdi ".'$ "}nclas
G3/_ 16812
h_,ctmm_ mJ nm._
[sl,,I,li c. MI_. Jdm F.Dice ¢
U_I G. Mwlm_,_d .:
_M._ ................
i InstituteofGasTechnologyIITCenter. 3424 8. State Str.t _ _
i Chicago, Illinois 6(At16 --_'_
i "i, Date Pubttllld -- Mloh 1978 _-_
I UNITEDSTATESDEPARTMENTOFENERGY
UnderContr_t No.EY-76-C-02-288tl :
1978016675
https://ntrs.nasa.gov/search.jsp?R=19780016675 2018-07-07T15:18:19+00:00Z
I COO-2888-3 Dist. Category 'JC-94aNASA CR136419
MOLTEN SALTTHERMAL ENERGY STORAGE SYSTEMS
ln
Project 8981 Final Report
Hansrai C. Maru, John F. DulleaAlan Kardas. and Larry Paul
[] ContributorsLeonardG. Mariancwski
H Estela OngViii SampathVincent M. Huang
_] Jerome C. Wolak
Prepared by
Institute of Gas Technology
H liT Center, 3424 S. State Stre,_tChicago, Illinois 60616
tI Date Published -- March 1978
IPrepared for the
I UNITED STATES DEPARTMENT OF ENERGY
I Under Contract No. EY-76-C-02-2888
q
1978016675-002
3/78 8981
TABLE OF CONTENTS
ABSTRACT paj__
SU_IARY 2
DETAILED DESCRIPTION OF TECHNICAL PROGRESS
Task 1. Salt Selection
Introduct ion 4
I Selection Criteria 6
Thermal Properties 6
I Physical Properties 7
i Cost, Containment, Safety, aml Stability 7Eutectic Vs. Noneutectic Mixtures g
I Change in Heltlng Point as a Function of Composition 8
Compatibility Wlth Volume-Change Additives and
I Conduct ivlty Promoters 9Candidate Salts 9
I Task 2. Heat-Transfer Analysis and System Design12
Introduction 12
I Background and i'astNork 14
i _aslc Equations in Phase-Change Heat Transfer 14Transient Solutions 16
I Periodic Solutions 19
Temperature Response of a Storage Unit 20
I Experimental Verification of Simplifying Assumptions 22
I The No-Thermal-Gradient Assumption: First Part of theCooling Half-Cycle (Cooling the Liquid) 22
Use of an "Apparent" cp: Second Part of the Cooling
I Half-Cycle (The Phase Change) 27
Third Part of the Cooling Half-Cycle (Cooling the Solid
I Phase) 27
I ill ,I N S T I T U T E O F G A $ T E C H N 0 I,. 0 G Y
= _ _,1 ..... --_-_....-4_"_-- _ -- iDa im_
1978016675-003
3/78 8q81
L%BLE OF CONILNIS, Cont. :=Ai
Design of the En tintcring-Scale (8-t':,.'hrth) - /
Experimentai St,,r,,ge U'_it 27 _'___
Verification of ,_tcr._-.)p..,.¢i,,ji t'=,._pertics of I.,KCO, 31 -=_ _.
Investigat;__n of Co_du_tivit; i_nhan_ement 'n,! Volume-Change _(_Control ._dditives 32 v.JL.
Investigati,,n of Conductivity-Pr',;e_o,er Additives 35 IIInvesttgatio:, of Volut, e-Citange Control Additives 40
Construction Materials 46 i!
Corrosion Data 46il
Corrosion Mechanisms and Thermodynamics 49 li
Exper imental Observat ions 49 i)task 3. Construct, Operate, and Evaluate the Perforr_,nce of the
Engineerlng-Scale (8-kWhrth) qystem 52
System Construction 52
System Operation and Data Collection 52 7_
Performance Evaluation 56
Criteria for Performance Evaluation 56 ._
Evaluation of LiKC03 Without Conductivxty Enhancement 57
- ItUnit 1 Performance- tteat Flux and Efficiency 59
Unit I Stability and Cyclabillty 75
Unit 2 Performance -- Heat Flux and Efficiency 7_
Unit 2 Stability and Cyclabtlity 83 fl
Evaluation of LiKC03 With a Finned Tube 86 .qUnit 30perat ion- Finned-Tube Heat Exchanger Design 86 U
Unit 3 Performance -- tleat Flux and Efficiency 88
Unit 3 Stability and Cyclabllity 94
ORIGINALPAGE Ib Itv OF POOR QUALITY
tN ST IV U T E 0 _ G*S T E C.NOt. O0 V m
q9780q 6675-004
i tl ;8 8_1
TABLE OF C_S, _nt.
L_sk _. ('_re Experimental Performa_e o. Engineering-_alem
Syst_ With Its Pr_icted Performa_e98
Introducti_-n 9_
Solidification of LiKe3 _lone; _vement of the _lid-LtquidInterface _ring Syst_ Disc_rge 98
Use of the Heat-Transfer Model in _rge-_ale Syst_ Design I05
lntr_u_tion 105
TES yst_ for Steam _'pgrading 1_
_ Task 5. Sua_ary, Conclusions, a_ Reco_e_ations 112
Conclusions 112
Reco_e_ations fo_ Further ResearchlI2
N_ENt'I_RE I15
_;F_CE_ CIT_ 118
-I
III i N S T I T U T E O F G A $ T E C H N 0 L O G Y
1978016675-005

LIST OF FIG_fltF.S --
1 Thermal Storage System_ for S'_ft Pover Application _.
Work Efficiency Using Heat Available at Temperature !1T and Rejecting Beat at IOOOF $
3 Cost Vs. Volume for Storage qf IOs gtJ 11
4 Thermal Conductivity Vs. Beat Capacity for Chloride
and Carbonate Salt lttxtures 13
S Advance of the Freezing Frout at x = a 16db
6 Solidification of a Cylindrical Nelt Fro.. Within 18 B
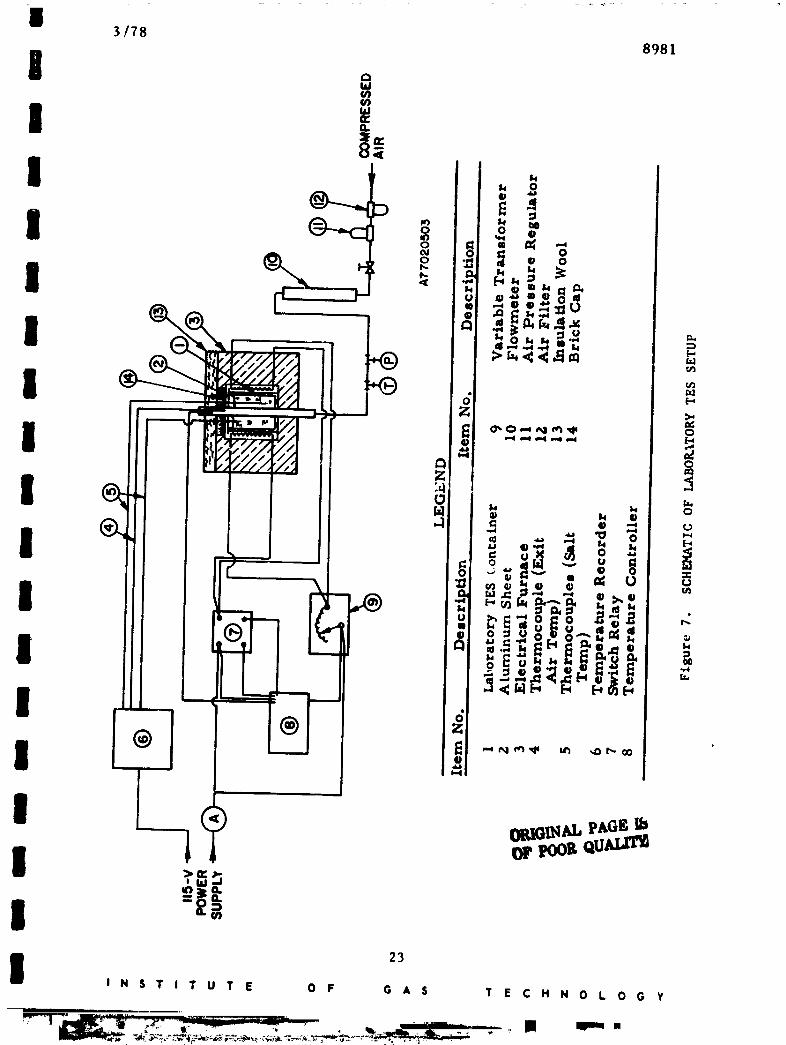
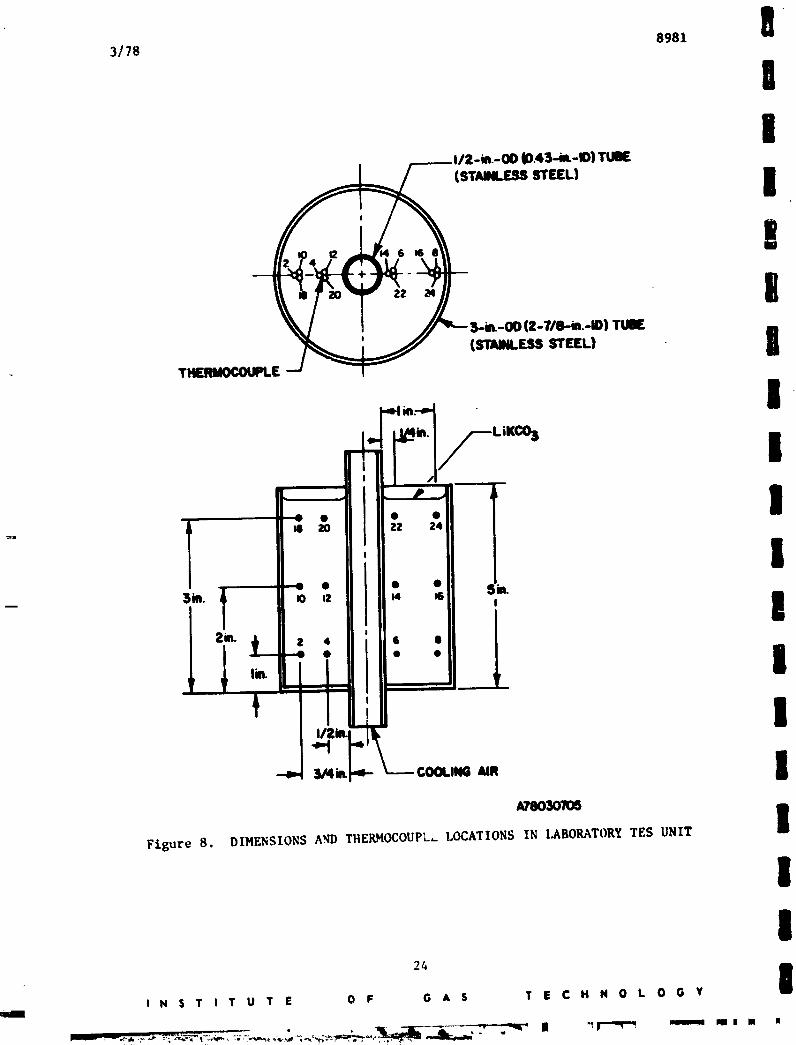
7 Schematic of Laboratory TES Setup 23 H8 Dimensions and Thermocouple Locations in Laboratory U
TES Unit 24n
9 Cooling ELates in a Laboratory TL_ Unit 25 U
10 Engineering-Scale Thermal Energy Storage Unit 79U
11 DTA Traces of NechanicaI and Fused Nlxtures of LtEG)_ 33
12 DTA Traces of Thermally Cycled Lil_O 3 34 I
A
13 Effect of Therml Conductivity Famhancers 3981
14 Capacity Variation With Composition of LiYJ_Ot-L/AIO 2Composite Storage Nedlmu 42
15 Calculated Settling Rate of LLAIO2 in Nolt_ LIKCO3 Iat 525"C 44
16 Observed Sedimentation of LIAIO a in Molten Li_Cg)_ at I530"C 45
17 Netallosrmph of Type 304 SS in the Meniscus RegionExposed at 530"C for 1250 hours 50 M
18 Engineering-Scale Unit Mounted in Testing Station 53H
19 Schematic Diagram of the Engineering-Scale ThermlEnergy Storage System 54 I
20 Solidified Salt Surface of TES Container No. 1 After I
10 Cycles 60 I
vtt
N S T I T U T E 0 P G A S T E C H N O L O G Y I
1978016675-006
3178 8981
Llb_I OF FIC_RF_, Cont.
_ t_ure ._o. ____J__
21 Temperature Profile in the Salt at Ilalf Depth Duringthe First Cycle 61
22 Temperature Profile In the Salt at Half Depth Duringthe Tenth Cycle 63
23 Temperature Profile in the Salt st Ralf Depth Duringthe Twentieth Cycle 64
24 Schemttlc Energy In_;t Profile During Clutrgtng andllolding of s,,_ Engineering-Scale TES System 67
25 Beat Loss During a 2_-hour Owerattng Period forLarger TES Units 69
26 Performance of Unit 1 71
27 Influence of SaIt Thickness on Heat Flux 73
28 Operation at and Above Design Temperature 7&
29 Unit 1 Stabilization 7630 Performance Comparison Between Units 1 and 2; Air
Temperatures Neasured at A and A' 79
31 Effect of Undercharge on Heat Flux 81
32 Salt Response Durln8 Charging 84 '
33 Vertical Temperature Profile as a Function of Time
at a Sidradial Plane 8534 Unit 2 Stability With Cycling 87
35 Finned-Tube Heat Exchanger Located in the Engineering-Scale TES Unit 88
36 Effect of ._ins on Temperature at the Salt-Side Heat-Transfer Surface 89
37 Salt Temperature Profile at Half Depth During Dis-charging With a Finned-Tube Heat Exchanger 91 _,
38 Salt Temperature Profile at Half Depth During Dis-
chargin,_; LIKCO3 &lone 92 _
39 Effect of Fins on Solidification Ra_e 93
ORIGINAl.PAGglbvii OP POORJAIJ
I N S T I T U T E O P G A S T E C H N O L O G Y
1978C)16675-C)C)7
]/7S $981
I LIST OF FICURE5 Coat.
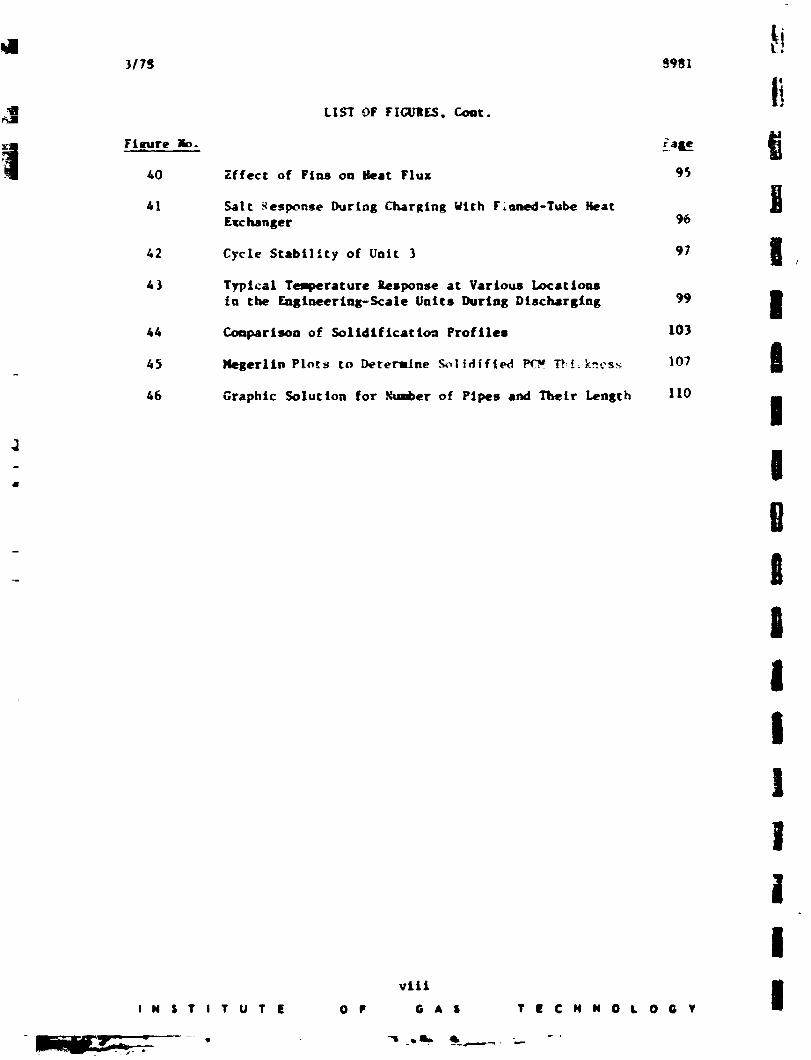
._ Fiaure io. _alie40 Zffect of Fins oa lfeat Flux 95
41 Salt ._esponse Durins Charging With F;un_d-Tube Heat NE_changer 96
/.2 Cycle Stability of Unit 3 97 I ,'
43 Typical Temperature Response at Various Locations
in the EnSineering-Scale Units Durins Discharglng 99 I
44 Cocq_rison of Solidification Profiles 103
45 Negerlin Plots to Determine Solidified _ T_.,i_kncs_ 107 f
46 Graphic Solution for ._umber of Pipes and Their Length II0
I
m
Bii!!1
||
Iviii II N S T I T U T E 0 P G A S T E C H N O L O G Y
1978016675-008
M
i )!78 8981LIST OF' .,-_BX.i_
I Table Ko. Pajie
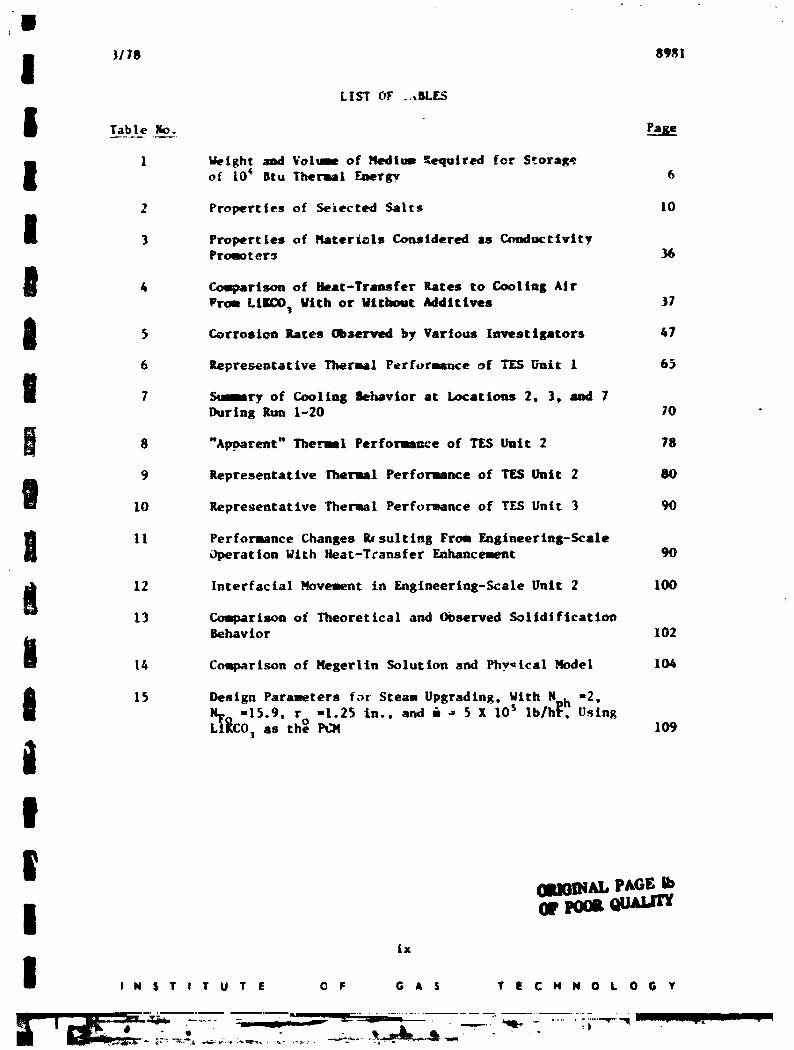
I 1 Weight a_l Volume of Nedium _equir_d for S_orageof 10 _ Btu l_ertml Energy. 6
2 Properties of Setected Salts 10
I 3 Properties of Nateri_ls Considered as ConductivityProsoter_ 36
I 4 Cou_ri_oQ of _at-Tramsfer Lares to Cooling Air
Vm LIFO; With or githout Additives 31
I Corrosion Rates by Imst Igators5 Observed Various 47
6 gepre_ntative Thermal Perforsmnce of TKS Unit 1 65
I 7 $uIIry of Cooling _vior at Locations 2, 3, and 7
During gun 1-20 70
_. 8 "Apparent" Thermal Performance of TES Unit 2 78
9 Representative Thermal Performance of TES Unit 2 80
W I0 Representative Thermal Performance of TES Unit 3 90
II Performance Changes lia suiting From Engineering-ScaleOperation With lteat-Tcansfer Enhancement 90
12 lnterfacial Movement in Engineering-Scale Unit 2 10013 Comparison of Theoretical and Observed Solidification
Behavior 102
t 14 Comparison of Megerlin Solution and Physical N_lel 104
t 15 Design Parameters for Steam Upgrading, With N.k =2,N_.. =15.9, r =1.25 in., and • = 5 X I0 Ib/h_, Using
L_CO, as th ° Pt_ 109
II|
ORIOINAbp6g
ix
I I N S T I T U TIE O F G A $ T E C H N O L O G Y
• "--,'-'.... _
]9780]6675-009
I31711 ml
1i
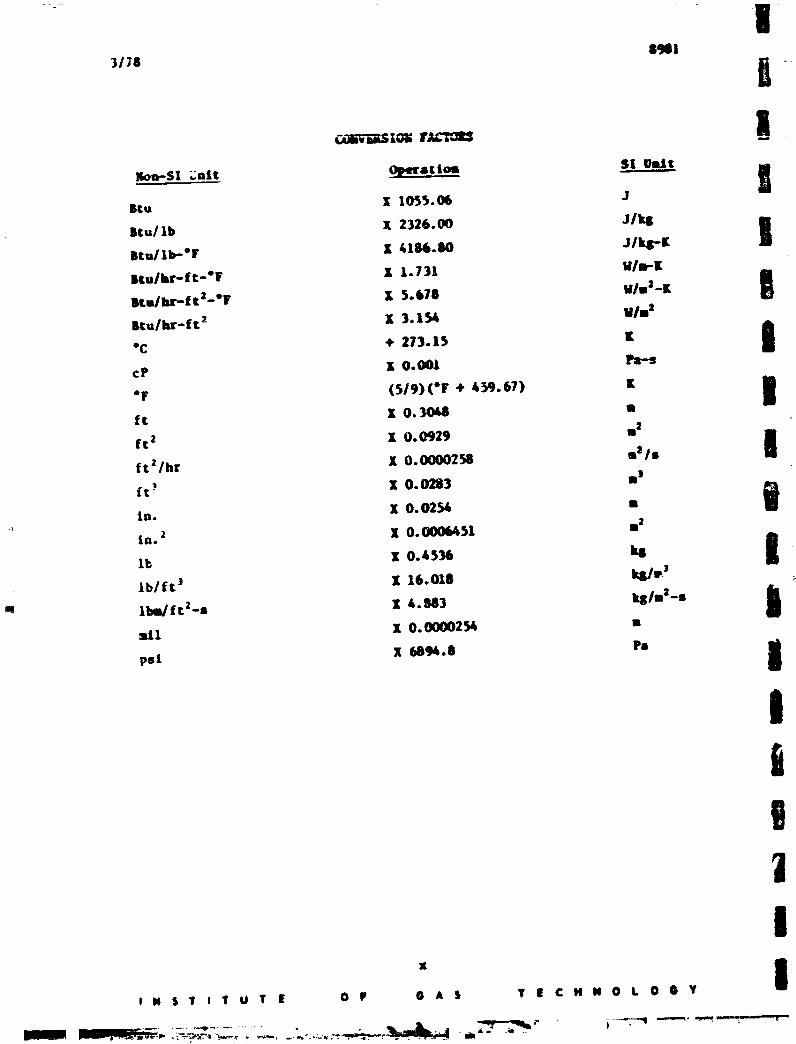
Mon-Sl _nlt Ol_ra¢l,U S__IUmit 18Stu X 1055.06 J
Itu/lb I 2326.00 J/ks I
Btu/lb-'F I h186.80 JII_-E i
|tu/hr-ft°eF • 1.731 W/m-E
Btu/hr-ftz-°i v • 5.618 M/m2-E B
Btulhr-ft 2 X 3.15_ Mlmz
"C + 273.15 It 8m
cP • 0.001 h-s
oF ($/9)(*F + 439.67) ItIIft • O.30d_ m
ft z • 0.04329 m2 m
ft2lhr • 0.0000258 m_l s U
ft _ • 0.0283 m)d_
in. • O. 02.% m Ilu
in. 2 • O. 000_51 m2
11_ X 0.4536 ks i
lb/ft _ X 16.018 kl/uJIll
m lbm/ftLs X 4. M3 kS/roLeerail • O.00002_ •
psi X 6894.8 Pa i
!t
IX
II
'.ST,T.T_ OV O*S VOC..OLOOV lJ

i)171 E_
$3_0¢ (1+50° to 18000F) Is the lm of 1aunt lit of _ boo bemi emamlmed
i for ,;_++T 30 _ 8mlli mml ult mixture's, llkali _ ad_m"_ mattrmctl_ u pbme-ebmtm _tof81_ neteflAIm in tld8 Umpefa_un rmqle keemm_
of tl_lr reLMi_ly klsb MOfml8 mity _ lke_lml aml_livily, idef_+
i _,, +mJ,_-+uim_rlc eslm_tee upm _t_. "...o,8__. i pod ,,,,a,,,,,,,.4_
I _ _ _ of 1+8 Itu/lb, cbmm femr 1be8tm_.
.
cTclJ_ cl_rlm/_ kebsvlor of ldmm_t45_ md --_ ..... ::: _-+--!,,
I um _ a_l _ u_tthpndlt_ b_ m • _ beet-tlamofef mJdel th, L ell dluelOpld dUl4ll tllil Jarolrll- _._ tltlrlll Illrf_
I of i o"__ unit remmtnmd ve_ stable duriml l_dD0 boyle of _lic +oper_lom. Smmerml mmmo of _ boot couducti_m t-brNIb the mlld omlt
mere __. N _ fmrlb_ lmmotiltJea blve beon Idemliflod.
!!I
1
! ,I!
!I
! 'I N S T I T U T E O F G A S T IE ¢ I'1N 0 L 0 G Y
+++..__.n+._.__+ ....._...++...........+-_.++=,._.o,,_ _ m,tm e.,- -
1978016675-011
I31;8 8911
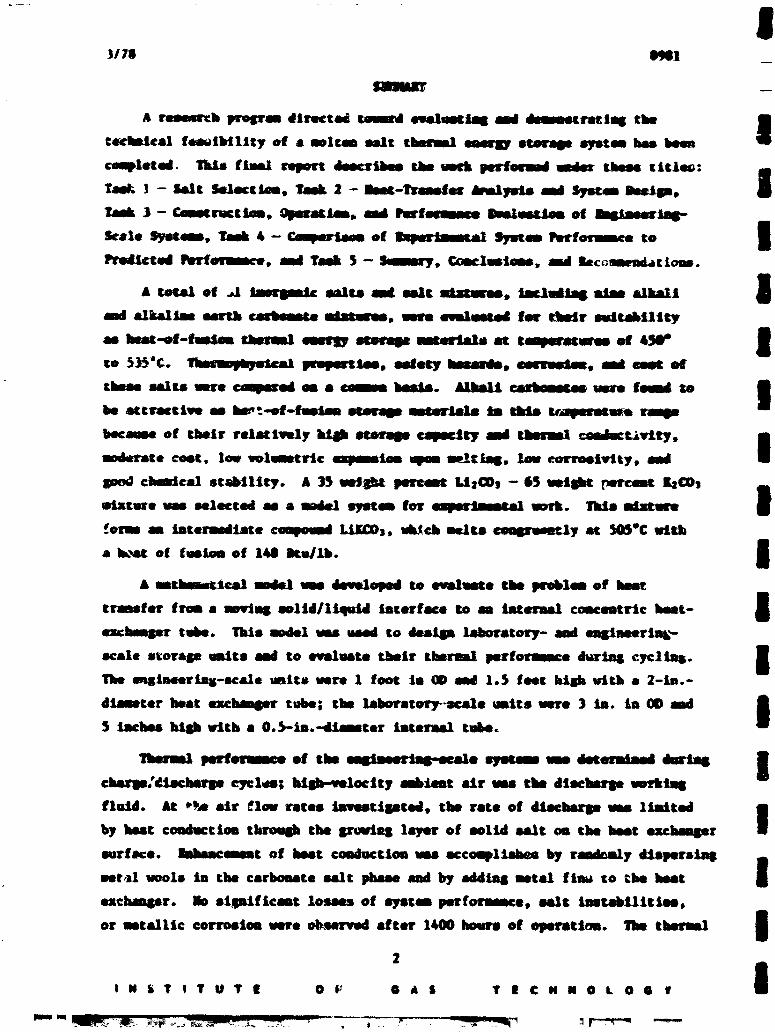
& nmmwcb Imqffn dirsct_ _ _l_ sml _tratl_ tim
Ce¢taf_al feeeibility of a mitre salt tbernsl _ stotlOt eystn hso beet
completd. _ final report deocrtbeo the sock perfosuod under tbe_ zitle_: nO
Tas_ ! - Salt Sel_tJem, Task 2 - 8Mt-l_emsfar apmlysis sad Syswm kalp,
task 3 - ¢sostructl_m. _tem, sad J_tfsemsaee halus_iem of hIlmmrimri
Syetmm. Tsok 6 - _ of I_NmtnsmeA1 System Perfotumco to Ikale
Prmt_ted Perfotu_ce, sad Tmdk 5 -- SasrT, C_m_usio_, smJ t-c_umml_tioum.dm_
A toc_ ef _1 JsorImk salts rout solt mistral, laeludia8 8Jsa _ I
md al_LJas sortb uIImaa_ mJstu8_, usre mmlast_ fe_ timJr mdtebUity
be_-of-fusloe tbmmml eee8_ 8ter_8 mterialo at _ of 650 e !II
to 5_'¢. Y_sglsFs_sl pmpm_lso, sdet7 hesado, sonsoSoI, i met
tbue salts utre ceeqmnd on • _ hesls. _ carhesotso uere feud zo JJI
bKamoe of their reLstl_tly _ ot_taWo cspsclty md _ caad_t_vitT, imanderate cut. low _lumstric em_atem upem top, tile. law corrmdvity, stud
pod chemical stddlity. A 35 wIJI_t percent LIzCO1 - J5 ueiIbt _ r_c01 a
mixture i selected as a sodel system for 8mpartm88u_ work. Ttds sdmLm_ I
forum am lmtermsdiste campoumd _3, vk_cb melts e_mIrusI_y at 5050C wlIJh
a b_at of fcoiom of 14_ ku/lb. I
i mstbematical mile1 I __ to __e tim premiere of besti
trsnsfer from s novin8 solid/liquid lazerfsco to so internal comcemtrtc beat- ie_bsmSIr tube. Tbte rode1 uss used to desl_ lahe_atm_- and en81n_trin_-
scale s_ota_t umtts aid to ev81uate their thm_ml p_rfotmm_e durtm8 cycltm_. Ib mMLImeoria_-sc_e rafts umre I foot Jl_ GO Ind h$ feet ki/_ with 8 2-1m.-
dlter heat e_c_ tube; the laborstorT-_le umtts vere 3 in. in (30 _nd I5 inches _ _lth • 0.5-in.-_tisoter internal tube.
_mmn_ of the ---: ....... _-_-=Is _ vso __ _g
cbIrp:_LichIrp _7c1_; bJIb-5_o¢lty i_mst air t tim dlKbIrIe vorkin8
fluid. At *_ air ._1_ rates lnvestipted, the rite of discbarIS ms limited J|by hut conduction through the 8rm_n8 layer of solid salt om the boat oxchsmser
surface. Bnb_cemsmt of best conduction ms sccoIplisb_ by rld_ly dispersLme I
8et,_t uools in the carbonate 881t plume and 1)y _ddin8 sotal fin_ to £he boat I
exchdm_r. No sisntficemt iosoes of system petrie, o81t lnst_bllitiso.
mtallic corrosion um_e _ 8fret 1_00 hours of opermticm. Tim tborual Uor
2 II N 16 lr I T U T I 0 V g A S lr | c H N 0 L 0 IIlr I
-- i II,LL_ _L- "......
197801667-012
I3t78 8981
|tesplmse of the experimental storage units asreed very -Jell _rlth the pre-
I dlcClons o_ the he_t-tr._nsfer eode_.It Is rec_ed that future InvesClptlons focus on the areas of
I oF_/J/xatioa of salt composition, heat-transfer sode.'Ing studies, h_at-cmsdm_t/_m ealmncwmnt, loas-tera testtns of larser _mtcs, and intesrated
i syst_s destp.
!i!N!!!
!
!!!!
!! 'IN ST I T O T | O F I & S T E C H N O L O G Y
at
........ ,197B0'_66"
|3/78 8981
!DETAILED DESCRIPTION OF TFC_NICAL PROGRESS
i Task i. Salt Selection
IntroductionR
Storage of thermal energy at temperatures above 315°C (600aF) may be
desirable for a number of applications, such as --l
a. Conventional base-load power plantsi
b. Solar Thermal Power Systems I
c. Cyclic- or batch-type industrial pro¢ _sses
d. Vehicular propulsion using heat engines. _" I
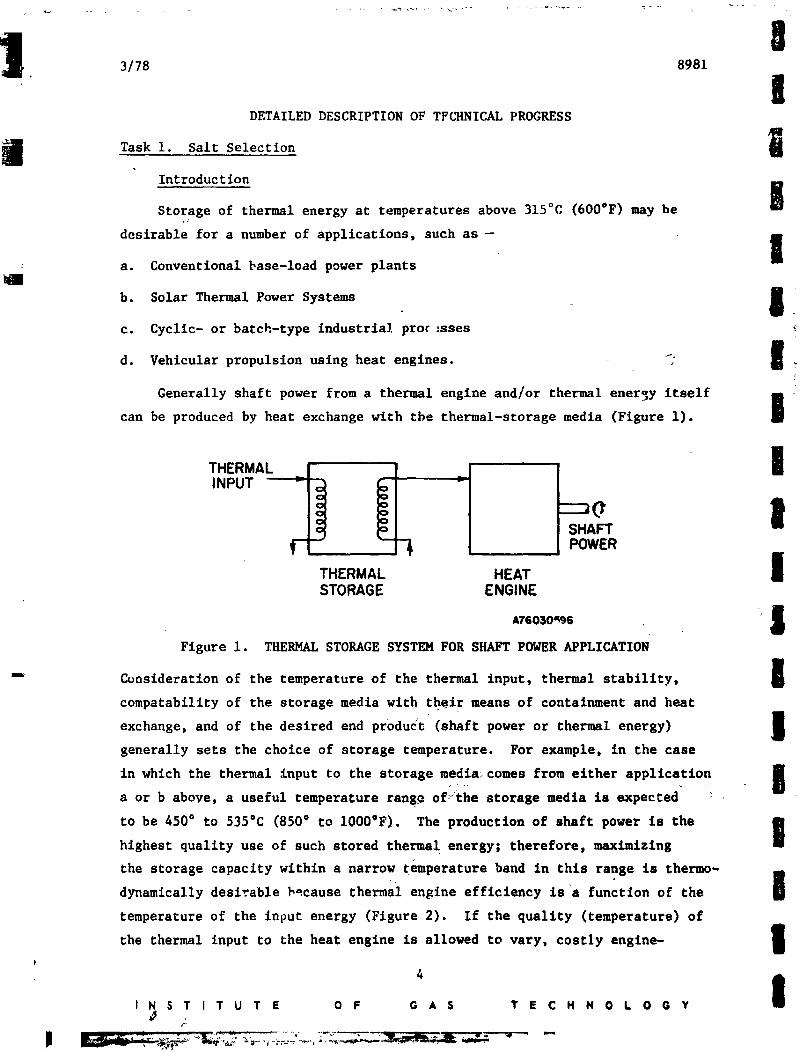
Generally shaft power from a thermal engine and/or thermal energy itself
$can be produced by heat exchange with the thermal-storage media (Figure i).
INPUT
SHAFTPOWER
THERMAL HEAT ISTORAGE ENGINE
A76030_96 I
Figure i. THERMAL STORAGE SYSTEM FOR SHAFT POWERAPPLICATION
Consideration of the temperature of the thermal input, thermal stability, I
comparability of the storage media wlth their means of containment and heat
and of the desired end pr0du6t (shaft power or thermal energy) Iexchange,
generally sets the choice of storage temperature. For example, in the case
in which the thermal input to the storage media_comes from either application iIB
a or b above, a useful temperature tango of/the storage media is expected :
to be 450 ° to 535°C (8500 to 1000°F). The production of shaft power is thelhighest quality use of such stored therma I energy; therefore, maximizing
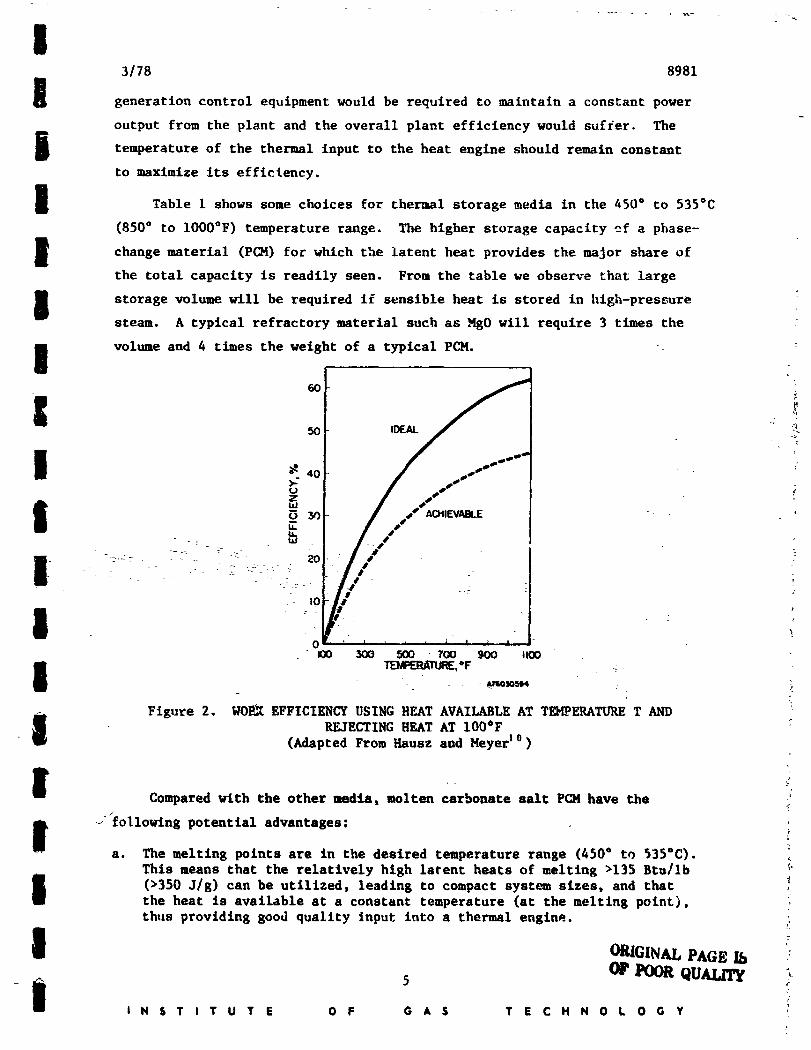
the storage capacity within a narrow temperature band In this range is thermo-
dynamically desirable b_cause thermal engine efficiency is a function of the
temperature of the input energy (Figure 2). If the quallty (temperature) of
the thermal input to the heat engine is allowed to vary, costly engine- I
' !I N S T I T U T E O F G A S T E C H N O L O G Y
1978016675-014
!3/78 8981
I generation control equipment would be required to maintain a constant power
output from the plant and the overall plant efficiency would suffer. The
i temperature of the thermal input to the heat engine should remain constant
to maximize its efficiency.
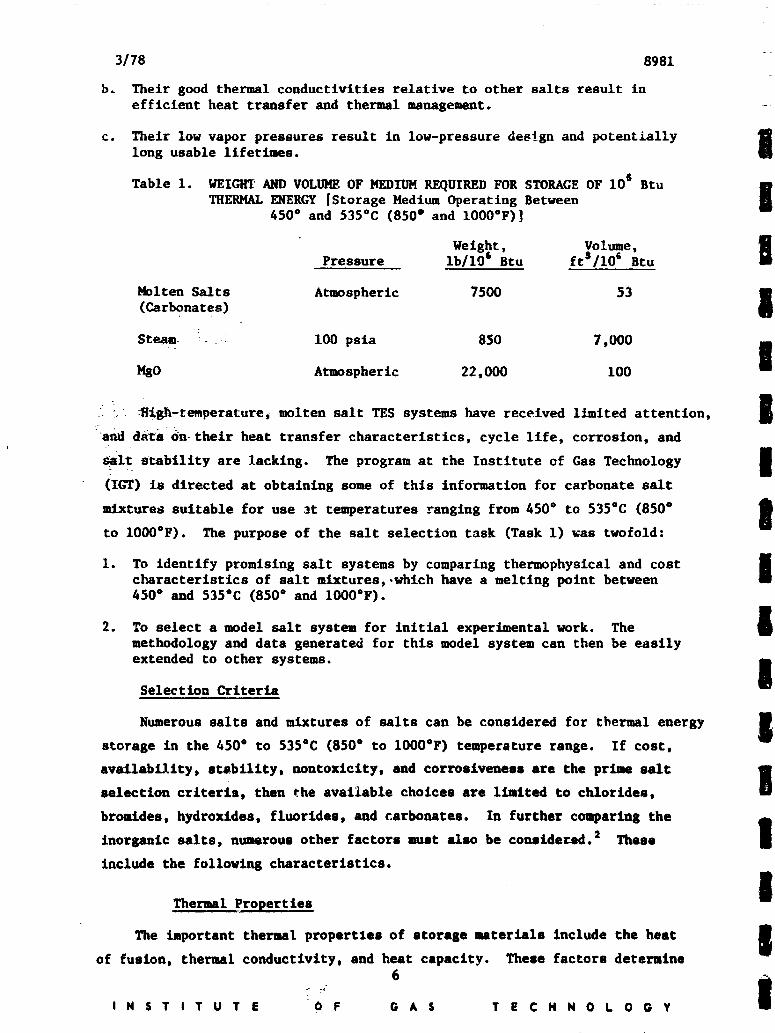
I Table I shows some choices for thermal storage media in the 450 ° to 535°C
(850° to IO00°F) temperature range. The higher storage capacity of a phase-
I material (PCM) for which the latent heat the share ofchange provides _Jor
the total capacity is readily seen. From the table we observe that large
I storage volume will be required if sensible heat is stored in hlgh-pressuresteam. A typlcal refractory material such as MgO will require 3 times the
I volume and 4 times the weight of a typical PCH.
,? ,_
50 IDEA _\_
40 soS _
E J ./,,/- .-
- = IAJ .
l --/ .-.- IO
0 +" , , = , _ t _ i.
Ioo YX) 500 --7oo 900 .oo
Figure 2. WO_ EFFICIENCY USING HEAT AVAILABLE AT TE_ERAI_RE T AND
i REJECTING HEAT AT 100°F(Adapted From Eausz and Meyer I0)
Compared with the other media, molten carbonate salt PCN have the +'
I following potential advantages:a. The melting points are in the desired temperature range (450° to 535"C) "_• i
This means that the relatively hish latent heats of melting >135 Btu/Ib _"
I (>350 J/g) can be utilized, leading to compact system sizes, and thatthe heat is available at a constant temperature (at the melting point),thus providing good quality input into a thermal engine.
! ,OR4GINALPAGE :OF POOR QUAla ry
)I N 5 T I T U T E O F G A S T E C H N O L O G Y '
1978016675-015
3/78 8981
b. Their good thermal conducttvtties relative to other salts result Inefficient heat transfer and thermal nmuageJ_.nt.
c. Their low vapor pressures restclt in low-pressure des!an and potentially Slong usable lifetimes. m
Table 1. WEIGHTANDVOLUNE,OF NEDIIMREQUIRED FOR STORAGEOF 10 s Btu mTHERHALENERGY [Storage Medium Operating Between |
450 ° and 535°C (850 e and 1000°F)]
Weight, Volume, lPressure lb/lO s Btu fts/lO _ Btu
Molten Salts Atmospheric 7500 53 m(Carbonates) gSteam I00 psia 850 7,000
!NgO Atmospheric 22,000 100
" " _Htgh-temperature, molten salt TES systems have received 14mited attention,
=and daCe on= their heat transfer characteristics, cycle life, corrosion, and
Salt stability are lacking. The program at the Institute of Gas Technology I
(ICT) is directed at obtaining some of this information for carbonate saltmm
mixtures suitable for use at temperatures ranging from 450 ° to 535"C (850 ° t
to IO00°F). The purpose of the salt selection task (Task I) was twofold:
I. To identify promising salt systems by comparing thermophyslcal and cost Icharacteristics of salt mlxtures,._d_Ich have a meltlng point between D
450 ° and S3S°C (850 ° and 1000°F).
2. To select amodel salt system for initial experimentalwork. The #methodology and data generated for this model system can then be easily
extended to other systems. RmSelection Criteria
Numerous salts and mixtures of salts can be considered for thermal energy IqM
storage in the 450 ° to 535°C (850 ° to 1000°F) temperature range. If coat,
availab/_ity, 8tabillty, nontoxicity, and corrosiveness are the prime saltBselection criteria, then the available choices are limited to chlorides,
bromides, hydroxides, fluorides, and carbonates. In further comparing the am
inorganic salts, numerous other factors must also be cons/dered. 2 These I
include the followins characteristics.
Thermal Properties I
The important thermal properties of storage materials include the heat Iue
of fusion, thermal conductivity, and heat capacity. These factors determine
.. :: 6|I N S T I T U T E O F G A S T E C H N O L O G Y
1978016675-016
!3178 8981
I the suitability of a material for heat-of-fusion thermal energy storage on
the basis of its storage capacity and heat-transfer characteristics. The
j heat of fusion determines the storage capacity of a material. The thermal
conductivity of its liquid and solid phases will determine the charging and
I discharging rates obLair_ble, and _ri11 affect the complexity (and cost) of theheat-exchanger design. Naterials with high heats of fusion and thermal
J conductivities will be desirable as they represent high-capacity systems thatcan be charged and discharged rapidly without the need for complex and costly
heat-exchange systems. High heat capacities, although of secondary importance,are also desirable because they are indicative of storage capacity above the
heat-of-fuslon and reserve capabilities of the system.
B Physical Properties
l Storag_-materlal physical properties of interest are density, volumechange with temperature (volumetric expansion), volume change on fusion,
I viscosity of the liquid phase, and vapor pressure. Density and heat of fusiondetermine the energy storage density. Volumetric thermal expansion must be
f considered when designing the container to compensate for the storage-materlalvolume change in heating from ambient to the operating temper_' _re range.
Host materials increase in volume upon fusion. If these volume changes are
I large, difficulties in containment may arise or voids may form in the storage
material during solidification. This can have detrimental effects on the
I, conducting properties, causing losses in efficiency, charging rates, andpossibly capacity. Viscosity of the liquid phase near the melting temperature
i is important because of its effect on convective currents. These currents,brought about by temperature variations in the PCM, aid in heat transfer and
i in the homogenization of the storage material. The vapor pressure reflectsthe stability of the storage material and affects the design of the contain-
ment vessel _s well as the losses that might result from a leak in the vessel.
I Ideally, the heat-of-fuslon storage material will have a high energy density,
little volumetric t mrmal expansion or volume change when fused, and low
I viscosity and vapor pressure in the working temperature range.
Costt Containment t Safety e and Stability
I The storage material cost, although only a small part of the overall
system cost, must be considered because of its effect on the economic feasi-
I bility a system, toxicity compatibility storageof The and of the material
7
I I N S T I T U T E 0 F G A S T E C H N O L O G Y
_ ..=mm
1978016675-017
3/78 8981
with the heat-transfer medium must also be considered because possible system
failures may release Rtorage _tertals into surrounding areas or bring storage I
and heat-transfer materials into contact. Toxic fumes or violent cheaical I
reactions resulting from such system failures can produce harmful effects on
life and the environment. Containment of storage materials becomes a problem I
because of the possible corrosiveness of molten storage _ate_ials aud t_,_
volume changes accompanying temperature changes and fusion. If any of these Ii
clmracteristics occur to a great extent, complex containment designs may be
required. Storage materials that show little corrosive activity when used nwith low-cost containment materials are desirable to maximize the life of a
storage system. Lifetimes of 20 to 30 years will be required if storage m
systems are to function economically In commercial systems. This lifetime I
requirement necessitates good stability of thermal and physical properties
in a storage material. !
Eutectic Vs. Noneutectic Nixturesm
Noneutecttc compositions melt tncongruently, i.e., the solid forms a I
liquid and another solid of a different composition. This effect may be
advantageous in that the second solid phase formed in the liquid could act I
as a nucleating agent during solidification of the liquid, preventing super-
cooling effects. However, because of different compositions, the solid and 1
liquid will also have different densities; this may result in separation by
settling of the solid, producing a wide composition variation throughout the IJ
storage medium. This problem could be alleviated by some type of agitation,
but that would only lead _o increased system costs. Eutectlc compositions
melt congruently, and consequently, thls problem would not be encountered if
one were used.m
Change in Heltin 8 Point as a Function of Composition
A change In the melting temperature of a salt mixture as a function of lm
its composition within the system is also of primary laportance. Compositions
within a storage-_atertal system umy vary as a result of corrosion reactions
|or selective vaporization losses. If the melting temperature increases
sufficiently, fusion emy not be obtainable with the heat source for which the m
storage _ystemwas designed to operate. In this case, storage capacity would U
be decreased significantly, and the system would actually be converted to a
sensible-heat storage system. I
8
I N $ T I T U T E 0 F G A $ T E C H N 0 L 0 O Y I
1978016675-018
!3/78 8981
I Compatibility With Volume-Chanse Additives and Conductivity Promoters
I Thermal conductivlties and volume changes occurring during operation areimportant considerations in determining the practicality of using a salt as
i a PCM. Although these properties are characteristic of the salts, they maybe modified in the storage system by the addition of inert materials to the
salts. Because metals have relatively high thermal conductivities, the addition
I of metallic screens, wires, rods, or tubes to the salt could enhance its
overall heat-transfer properties, although some of its capacity would be lost.
I The volume change that occurswhen the total storage medium is fused may becontrolled by the addition of a vol-me-change control additive to the salt.
I Compatibility of the PCH with such additives should also be considered whenselecting the heat-of-fuslon sterage materials.
Candidate Salts
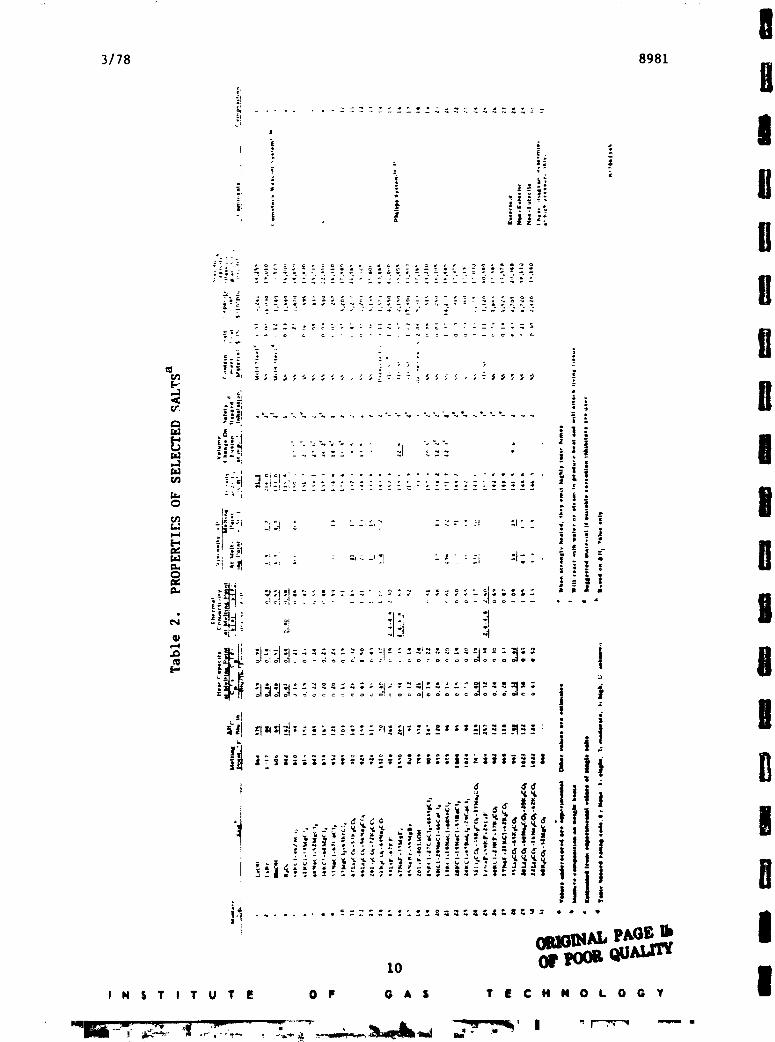
Hixtures of 31 candidate salts are presented in Table 2 with the experi-
B mental estimated values of relevant theiror properties to applicability as
heat-of-fuslon TES materlals. These salts were selected for consideration
I because their melting points fall in or near the 450* to 5350C (850* to lO00*F)range and they do not display any particular difficulties in handling, contain-
I ment, stability, or availability. Some salts that can be used for thermalenergy storage at temperatures either well below or above the range of prt,mry
interest have also been included for comparative purposes. The materials
I under consideration include single salts and binary and ternary salt mixtures
of both eutectlc and noneutectlc compositions. Quaternary systems were not
I investigated due to the lack of pertinent thermal behavior data and suitableprocedures for estimating the properties needed for evaluation.
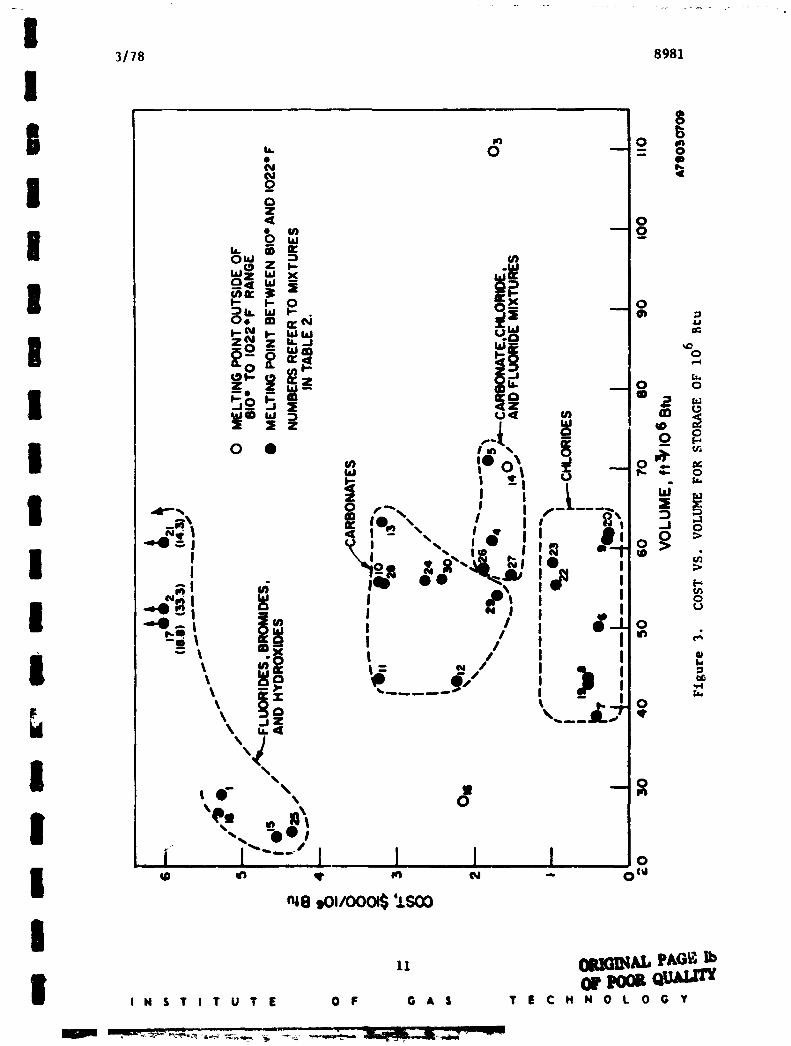
I Coet (S/10 s Btu) as a function of volume (ftt/lO I Btu) of the salts
presented in Table 2 is shown graphically in Figure 3. The practicality of
I using high-capacity, hlgh-cost salts for large-scale applications isva T
questlonable because of the importance of salt cost in determining the degree
I to which a TES system can be economically competitive with alternative energystorage systems. The highest cost salts are composed ot bromides, fluorides,
I hydroxides, or some chlorides (mixtures 1, 2, 15, 18, 21, and 25). The lowestcost salts are composed entirely of mixtures of alkali and alkaline earth
chloride salts (mixtures 6 through 9, 19, 20, 22, and 2_), whereas moderate-
i to-high cost salts are composed of carbonate salt mixtures (nos. 11 through
14, 24, 28, 29, and gO), mixtures of carbonates, and some chloride and fluoride
| 9_I N S T i T U T E O F G A S T E C H N O L O G Y
mm _ _ ,,,, m L
1978016675-019
I3178 8981 I
I _
1[i = . •
lU.
Iv. _V-:_
_=|]
H0 I'_- " _ I
' " ilil 1"_: _I_P
-_=_-++!_.__.,"__i:,:+l_l=_.+_=-_-_o,:_°°_ ....................-._-,-++i:o_:_-++: _oi I
........ , ° i _• g_! • _ Ii I_|t _l_-J: ! _ _ _ E _ = _ _: _t; _ _-_ : = :'1_ -'-_ _ :
I -
|
_'|<.............. _ t!! !
omo'm._..,,,,J.r_+"+"°'sI
INSTITUTE OF G A S TECHNOLOGY •
1978016675-020
I 3/78 8981
!
I b_ "Oo m _
_,N_ _- e:_
_'o- g
o. _I _ _ _¢
I ,
, i:_, s ,4.o\ -I --" _ ' 'I I
I _% 0tiP- \ _ --_
I '". ":_",_ I ! ! I o
Iu __ PAG_
I N S T I T U T E O F G A S T E C H N O L O G Y
197801667,5-021
!3/78 8981
!salts (mixtures 5, 10, 26, and 27). Several of these low-to-moderate cost
salts emit highly toxic ftmms when heated (mixtures 5, 6, 8, 19, 20, 22, 23,g2b, and 2?), presenting potential safety hazards that would restrict their
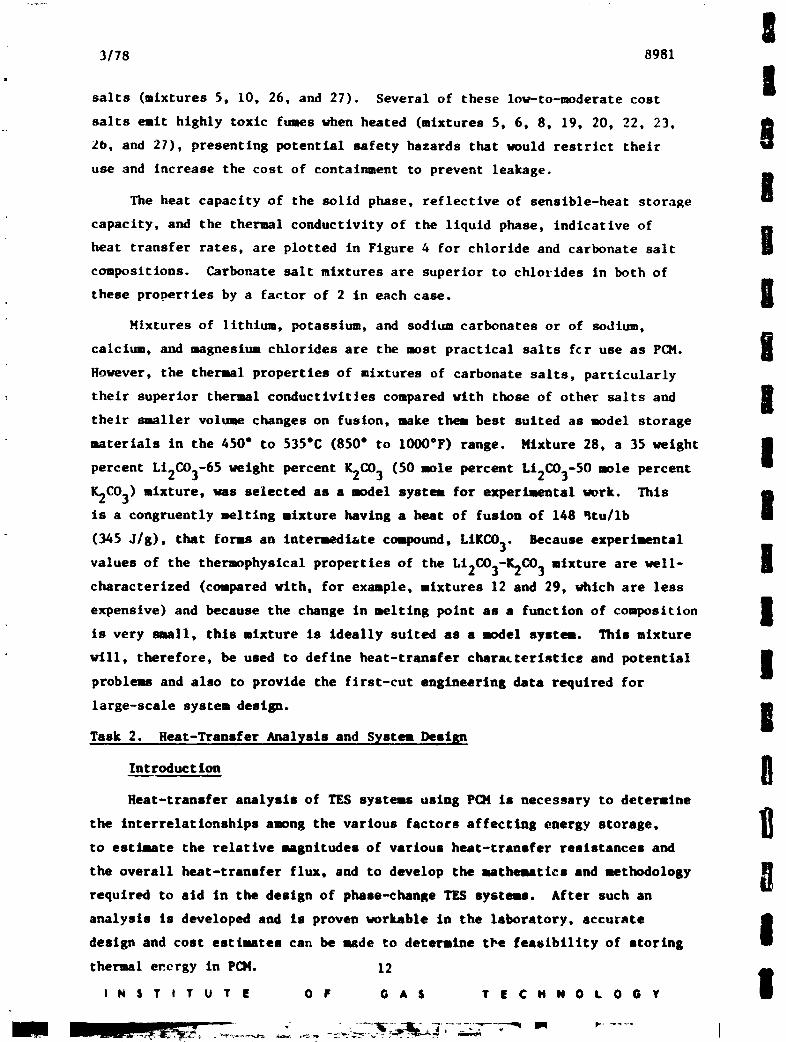
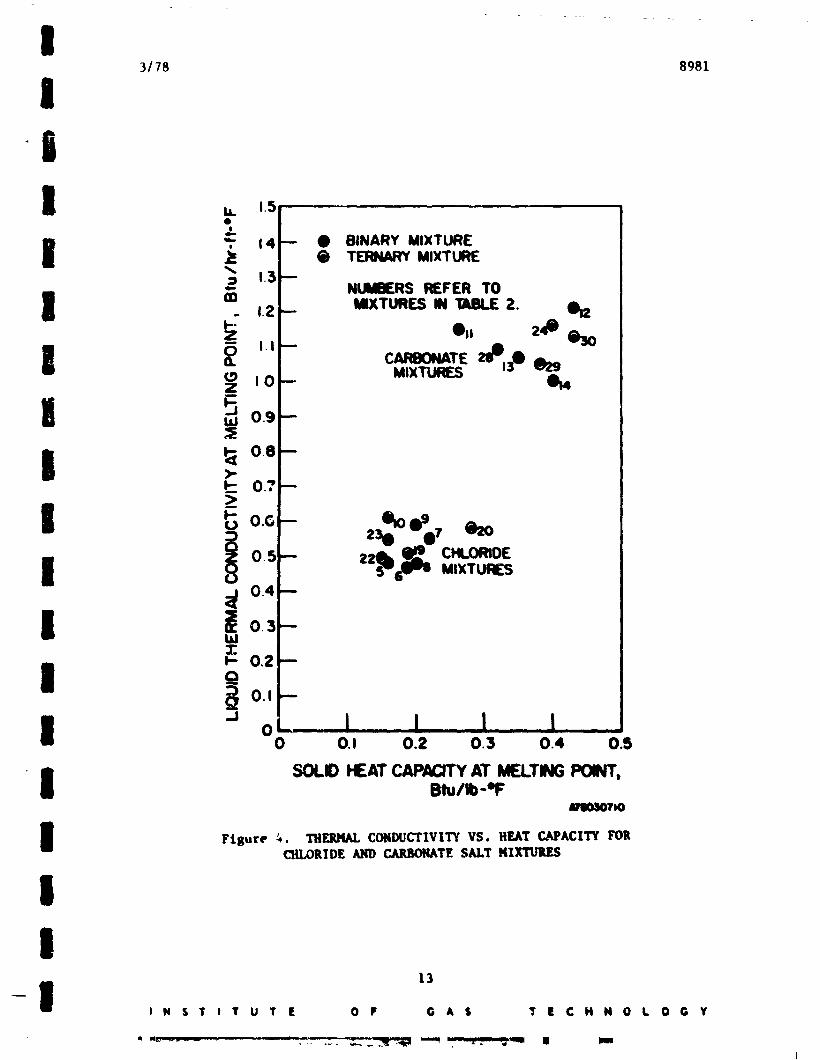
use and increase the cost of contaimaent to prevent leakage. BThe heat capacity of the solid phase, reflective of sensible-heat storage a
capacity, and the thermal conductivity of the liquid phase, indicative of gheat transfer rates, are plotted in Figure 4 for chloride and carbonate salt
compositions. Carbonate salt mixtures are superior to chlorides in both ofm
these properties by a factor of 2 in each case. i
Mtxtures of ltthtma, potassium, and sodium carbonates or of sodium,
calcium, ami -agnestum chlorides are the most practical salts fcr use as PeN. I
However, the thermal properties of mixtures of carbonate salts, particularly
their superior thermal comiuctivittes compared _rtth those of other salts and I
m
their smaller volume changes on fusion, sake the,, best suited as model storage
saterials in the 450" to 535"C (850" to IO00"F) range, lCtxture 28, a 35 weight Im
percent Li2CO3-65 weight percent K2CO3 (50 sale percent Lt2CO3-50 mole percent
K2CO3) mlxture, was selected as a model system for experimental work. Thisis a congruently meltlng mixture having a heat of fusion of 148 _tu/lb |
(345 J/g), that forms an Intermedi&te compound, LIKCO3. Because experi-,ental II
values of the thermophyslcal properties of the LI2CO3-K2CO 3 mixture are well- I
characterized (compared _rlth, for exmaple, mixtures 12 and 29, which are less
expensive) and because the change in melting point as a function of composition I
m
is very small, this mixture Is ideally suited as a model system. This mixture
_111, therefore, be used to define heat-transfer characteristlc_ and potential Im
problems and also to provide the first-cut engineering data required for
large-scale system design.i
Task 2. Heat-Transfer Analysls and System Design
Intreduct ion
Heat-transfer analysls of TES systems using PO/ is necessary to determine
interrelationships among the various factors affecting energy storage,the
M
to estiaate the relative magnitudes of various heat-transfer resistances and
the overall heat-transfer flux, and to develop the a_athmtlcs and methodology
required to aid in the deslgn of phase-change TES systems. After such an
analysis is developed and is proven workable in the laboratory, accurateJdesign and cost estimates can be made to determlne the feasibility of storing
thermal energy In PCH. 12 III N S T I T U T E O F G A S T E C H N O L O G Y I
q0780qGG75-022
I3/78 8981
!l
| u. ,s
I _. 14 : BINARY MIXTURETERNARY MIXTURE
2 i.3 NUMBERS REFER TOm
O,, 24@@so
II_- .
I i °-° ,'-%,__o-_'_,J M,XT_S
0.4
I !o._0.2
I _o.,I o , ' ' o!,o., 0.2 0.3 .s
I SOLE) HEAT CAPACITYAT MELTINGPOINT,Btu/Ib-°Fa_OaOTIO
Figure _. THFJAH_COIUXTCTIVITYVS. BEAT CAPACITY FOR
CIII_RIDEAND _TE SALT Kl_
II
13
I I N $ T I T U T E 0 F O A $ T | C H N O L 0 G ¥
1978016675-023
!3178 8981
N
A heat=transfer analysis ,,fa PC_ storage system presents two major
complexities. First, heat is stored in a PCM in both its latent and sensible
forms, and the sol!d-llquld interface moves durin_ the transfer of heat.
Secondly, because of the regenerative nature of the storage system, a cyclic
solution has to be considered. Due tu these comp]exities, only a limited I
number of approximate solutions have been obtained in the past. We have used
these solutions, with suitable modifications, to develop a heat-transfer II
model. In the fo]lowing sections, we will disc,ss a) the background and a
brief t'eview of past work, b) observed interr_lati_,:tshipsarm_n_ variabl_,s I
of interest, c) experimental verification of s_me approximations, and d) the
design of an experimental unlt using the approximate solutions and the heat-
transfer model developed from them.
Background and Past Work I
Basic E.quations in Phast'._-C,'rian__e Heat Transfer
A regenerative heat-storage and retrieval system is comprised of a finite I
mass of storage material and possibly two working fluids. One of these flaids
supplies some of its heat content to storage, and the o_her fl,tid transfers EI
the stored thermal energy from ti_cTES system, in our ease, the storage
material undergoes a phase change, so that both the liquid and solid phasesiare present in the unit and the solld-liquid interface moves during heat
transfer. Because the heat capacitie:" and conductIvities of the two phases I
are different and the boundary between the two phases iq not fixed In space, I
the mathermat[cal analysis of herr transfer requires _imultaneous eo, slderatlon
of both phases with an appropriate boundary condition+ Thus, heat flow t,L the IW
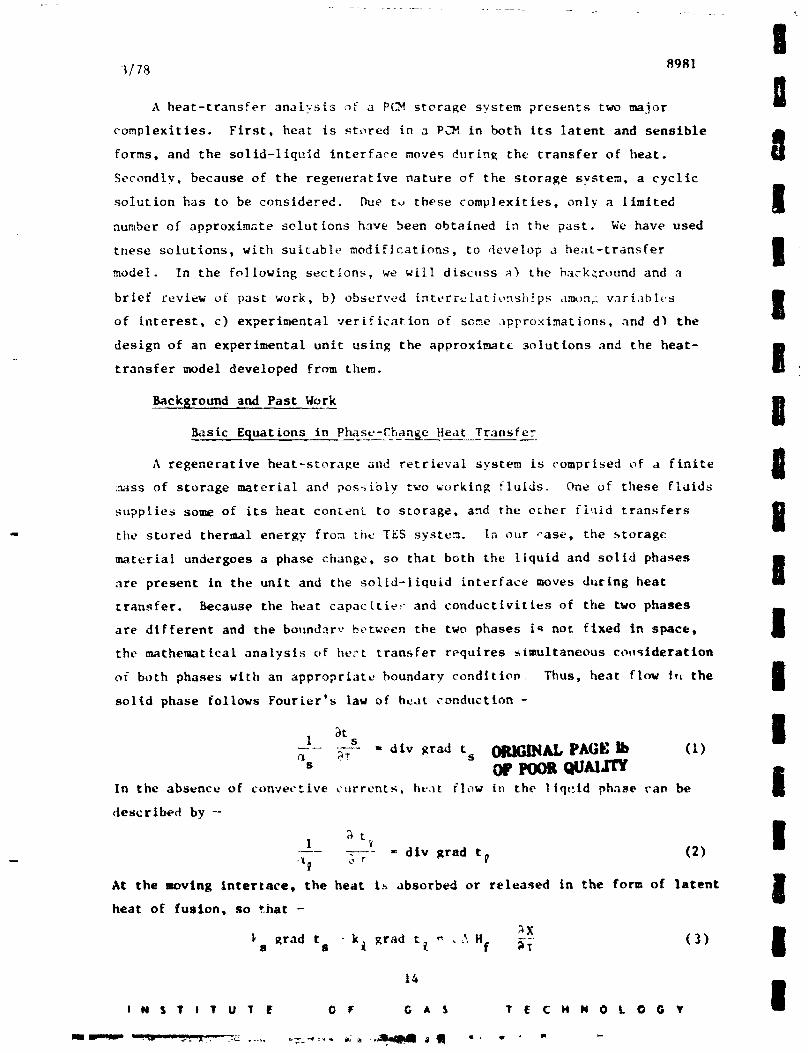
solid phase follows Fourier's law of heat conduction -
1 _t s Ia ._r = d iv grad t s 0RIOINAb PAG£ W (1)s Or POOg AUrP/ I
|In the absence of convective current._, heat flow in the l tqt-ld phase can be
described by--
I bt_ I.... div _rad t (2)._ _, _ P
At the moving interlace, the heat is absorbed or released in the form of latent i
heat of fusion, so _hat -
_rad t kl grad t_ _ Hf _X Is s , + (3)
iI N $ T I T U T E O F O A $ T E C H N 0 L 0 G V I
1978016675-024
I3/78 8981
I " t." t (A)r'8 • it
The heat transferred to the working fluld Is K/yen by-
Otf- - (5)I (Cp)f of
I s_tch ts coupled by the telatf_a-
k grail t - V (t v- t t) (6)
I at the _tll of the heat-transfer conduit, Solutions oF the system ofEquations 1, 2, and 6 exist only for a few selected geometries, trlth additional
| -simplifications introduced to make the solu_tou procebs tractable.
Additional complexities are involved because of the periodic nature of
I the If tha_ fluM is used /n the sadKorage-retrteval c_cle. hoatia3
cooling helf-cycle8, the tn]et temperature, tf, _, can be repremmted bY •
I periodic funct/on, such as-- - • cos (7)tf, /_ 1/2 |thot + tcold + (thot - tcold,
I where -
I tho t = smxtsmmtemperature of the _t stream
tcold = 8tntsmm temperature of the cold stream
I w - frequency.
For n rote 8criers1 case, 8 Fourier Berths mmadnlL the Individual hermmutcs of
I gquatton 7 cam be used to coutruct the actual temperature variat_ tn if, 18"
Yen mmLLabJe anslFical soluttems ca be clans/lid /n tun cateBorfdm:
I 1) transient (umJcyclic) soluttmm thet annum am hilt/ally muLfom tm4per-
otm_ profLte sad 2) cyclic solutions that e_comt for tim rsbmmtative _mture
I of the stotsp ,_stm.
The trmmleat 8olutious ore mmful for exlmrimental studies becamm
I a) the Imat-tt_msfer coefficients cn he detondm_ or verified by record_
the tLnm-depm_ent temperature beimvtor of the votk/n 8 flu/do and b) hnat/n$
I the enetl_-storal_ uaterla18 past tbP plume choose into tim liquid phaseremllts in ,tartia8 the _l_liflcat_ bslf-c)_lu at alqFrox:l_mtely m_tfm
I tmq_raturen. We have found exper_tallT, sad the _ IItSIIIci,l_tytheory 818o imjnentn, thet 8 _eqM_rature 8faddist _a the lSq_dd phaoe of tbo
15
I I N S T I T U T E O F G A S T E C N N O L 0 @ Y
1978016675-025
3/78 8981
reference salt car,_ot be maintained In a layer that is more than a fraction
of an inch thick. This means that the solldlflcatlon halZ-cycle can be ms
_ _-__,___e_-_.n_lT*.Ical]y _Ing cran_le.L .uiutions for several geometrical B
con f igurat lone.am
Periodic solutlons are important for storage system desilp_, but solutions i
involving phase changes are tmknowm in the literature. Useful Inforaatlon can
be obtained, hmmver, using the aval/able solutlons for reseneratlve heat Ii
transfer Iv senslble-heat storase mster/als.
l_ranstant Solutions I
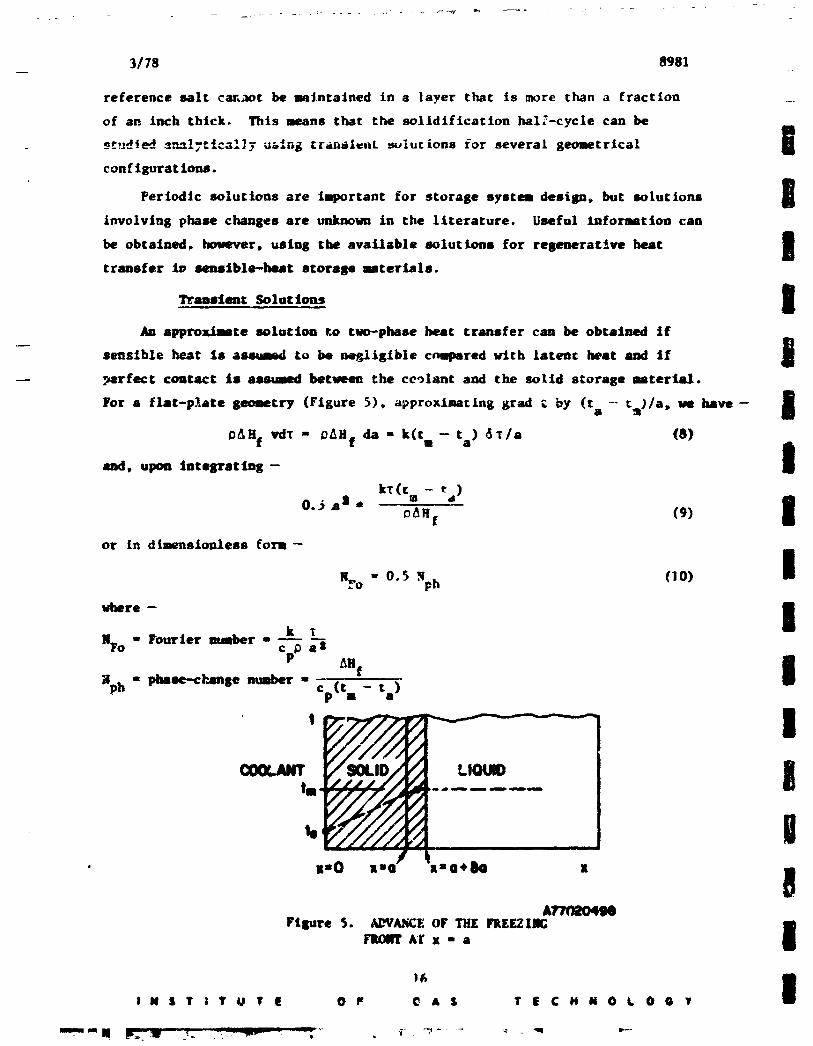
An approx/mJte solution to two-phase beat transfer can be obtained if lm
sensible heat is assua_d to be ae_ligtble c_q_red vith laten¢ heat and if I:_rfect coutact is assumed between the ceolant and the soUd storage lmter/al.
Yor a flat-plate geometry (Figure 5), approxlaatlng grad g by (t a -- c)/a, we have- I
0AHf volt = e_af da = k(t m- ta) 6T/a (8) aadd, upon tntegrat/ng- m
kT(c - r ),. , • uS d
or in d lmensionless form-
Nyo = 0.5 Nph (l 0) I
where -
5 IP _Hf e
_iL - phese-cF_m8e number = _--T-_ Jv- _pt_ n - La7
I
g• !
F/sure $. AZ'VA,qCEOF THE FREEZING
i_tolrr At" x - a i
" |I N S T ; T U TiE O F C- A S T E C H N 0 L 0 G ¥
1978016675-026
i 317S 8981
IIn a hollow cyllmler vtth it - r/ro, where r Is the _.dius of the coolingO
I tube, a sffilsr analysls leads to-
I I _ I in cool/_s from outside; I 2 1 In cooling from inside. Branlette -t al.2
I used these approz/mJte solutlons to cmq_re heat fluxes among dlf.,erentcosta/mast conftsurattons and inferred that an annular arrangement (working
fluid inside) _mld provide the best heat fluxes. The assumptions involved
I * 0 and g*,,are not generaL1. A checkts the Imp_t lmlsn¢_, namely Cp
apinst a solution (to be discussed below) that does not resort to theso
I sssm_t_oes showed that as calculated from Equation 11, was off by a%0,factor of 2 to $ for values of Nph betwmm 0.5 and 10, using NBI = Oro/k s = 1.
I tie do not recommaJ us/n s these approximations in designing t storage unit.
An analytical solution for finite heat capacity, Cp, and AH with a
I flat-p]Latm Seosmtry _ma presented by Neunann, _ vim assumed that a) the PCHm tnttXtlly at tha s_ttin$ potn=_ tm, b) there was no temperature gradient
I in the lY.qu/d phase; _d c) the. surface at x = 0 was subsequently held att a < tlb. & wire realistic model mat include a finite heat-transfer coefft-
U - + _ . No asmmpttons should be madp. on the nature of the temperature
prefile in the solid phase; i.e., a ftn/te sensible heat of the solid phase
I should be included. Such an analysis v_s perfonmed by He&erlin. 22 In his
s_ tiou, the tine-depemlen¢ trLa/ functions appear as coefficients in a
I pore series expanslon of th_ depth coordinate.
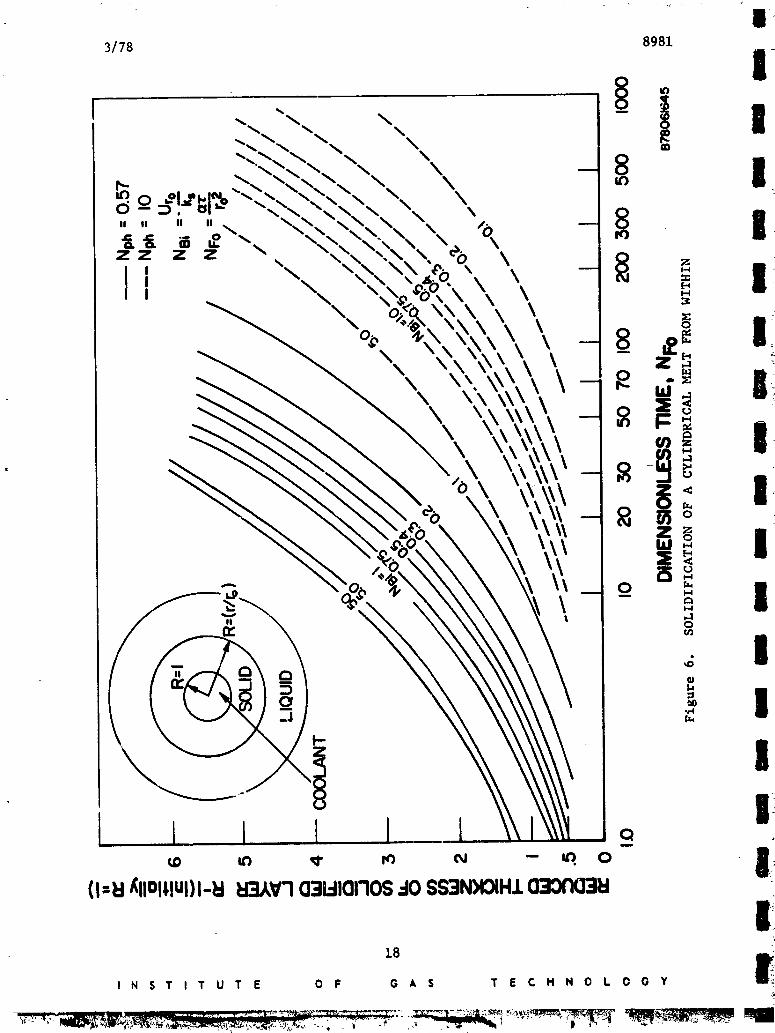
Iquaticm 12 8ives the d/mensLonless time needed to solidify the molten
I mteri_t from rS - I rt = It:to
ORIGINAL PAGE Ib
a OF POORQUAJII
'%" ........ + '1.r* ( " r* �2)'-r* �l)
Solved for the sol/dtfted layer thickness R, which is messure_ in terms of the
I iatermml radius to, Equation 12 yields the thickness of the solld-ph_se layeras a function of tiara. Tim illusLrattve results obtained by nuaerical evalu-
i ation of the integral tn Equation 12 a: , shown in Figure 6. The family ofcurves vlth plume number _h " 0.$7 describes the solid-layer thickness of
J N S T i T U T I 0 P G A S T E C H N O L O G Y
1978016675-027
3/78 8981
J the reference material cooled with room-temperature air. t Phase-change numberHph = 10 refers to the same umtertal, except that the coolant runs about
H 25°C _.older than the melting temperature of the salt.These curves can be used to calculate various parameters, such as tlme
required to solidify a given core of PCH, effect of heat-transfer coefficient,
I coolant temperature, and conductivity promoters. For example, if the coolant
air is only approximately 25°C cooler than the melting point of the PO4
! -(Nph = 10), the time required for solidifying a given layer of salt would bep
approximately 10 times longer than that required if room-temperature air were
I used (Mph = 0.57). On the other hand if time is kept fixed at NFo m 10 forexample, the thickness of the layer r* should be reduced bY half. S_Llarly,
_ the effect of the relative resistance of heat transfer on the hp_at-transfer-g fluid side and the storage-mediom side can be determined by observing the
I effect of the Blot number (HBi = Uro/ks) on the thickness of the solidifiedlayer. As can be observed from Figure 6 for _h = 10 and a fixed thickness of
a given PCH, an increase in NBi from O. 5 to 5 results in a twofold decrease
in the time required, T. This suggests that the heat-transfer resistance in
the solid storage material Is limiting for gBi > 5. For NBi ; 0.5 (the value
I expected in our engineering-scale unit)the heat-transfer resistance in thet
PCH still appears to be the major factor, although the contribution of heat
I transfer on the heat-transfer-medium side is also significant. If the con-ductility, k, of the PCH is doubled, that is, if NBt = 0.25, the value of T
i required to solidify a layer of R = 6 decreases to 757. of the original value.Periodic Solutions
I As mentioned earlier, no periodic solutions are available for phase-change heat transfer. Therefore, we can consider a simple periodic solution
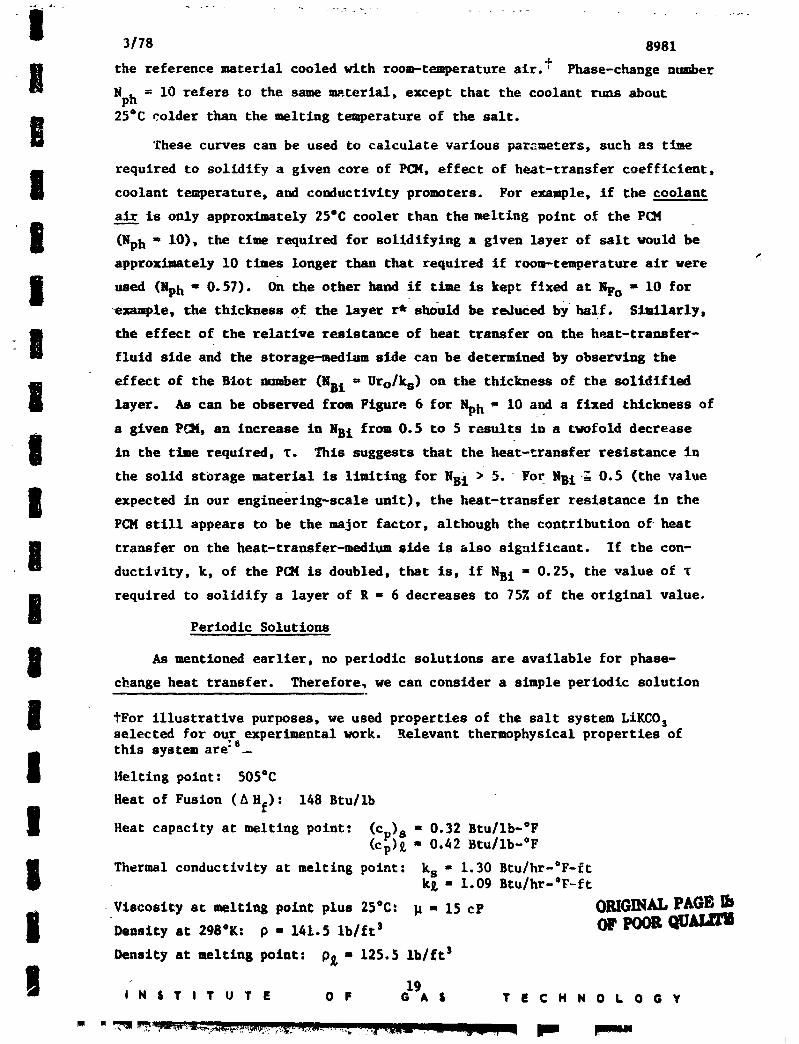
I tFor illustrative purposes, we used properties of the salt system LiKCO_selected for our experimental work. Relevant thermophysical properties ofthis system are:s
I l_elting point : 505°C
Heat of Fusion (A Hi): 148 Btu/lb
I Heat capacity at melting point: (cD) s = 0.32 Btu/Ib-°F
(c_)_ = 0.42 Btu/ib-°F
I Thermal conductivity at melting point: k s = 1.30 Btu/hr-°F-ftk£ = 1.09 Stu/hr-°F-ft
Viscosity at melting point plus 25%: _ = 15 cP ORIGINALPAGE _b
i Density at 298"K: p = 141.5 lb/ft sOFPOORqUALn
Density at meltin B point: p£ = 125.5 lb/gt )
I N S T I T U T E O F G A S T E C H N O L O G Y
1978016675-029
3/78 8981 i
for a flat-plate, sensible-heat system, and then introduce a concept of8"apparent sensible heat" to account for latent heat and sensible heat
simultaneously. DFor flat-plate geometry, Equation i can be _itten as -
at _2t gyf = a (13)
For a cyclic variation in the working-fluid temperature, the temperature in O
tllePCH is given as --
t(x, T) = Ao exp [-x(l + i) K] exp (i_) (14) H
The thermal diffuslvity _ = k/cpp can be modified by assuming the apparent
Cp of a fictitious solid, which can be obtained as follows: IIIW
Heat released per unit mass, Q, by a PCH between temperatures tm and
ta, having a heat capacity (Cp)s, and latent hear _Hf, is given as -- Hel
Q = (Cp) s (t m - t a) + AHf (15)
and for the fictitious solid with heat capacity (Cp)app, Q is given as - I
Q = (Cp)ap p (t m - t a) (16) gFrom these two equations -- I
ARf
(Cp)ap p = (Cp) s [ 1 + (Cp) s (t m _ ta)] (17) I
or, in terms of Nph -- g
(Cp)ap p = (Cp) s (1 + Nph) (18)
Note that the value of (Cp)ap p is dependent on At = t m - t a and is not purely
a property of the PCH. Also, because during cooldown the entire mass of PCH
does no. attain temperature ta, either an average temperaturP or Lhe ter_perature
of the working fluid can be used. _en Nph >> 1 -
AHf ,.
(Cp)app : (Cp)s • Nph = tm - ta (19)
Temperature Response of a Storage Unit
To estimate the temperature response of a storage unit undergoing cyclic
operation, we used the periodic solution of Equation 14. The following values
are calculated for our storage system:
(Cp)app - 0.60 Btu/lb-°F (assumed; based on comparison with Neumann'ssolution)
20
INSTITUTE OF GAS TECHNOLOGY
" "r _ -_'_- 4 _i .... _":_'l'" _-__o_,'_-_.,,,_.. ,,-_-_--,_ ,., :_,,, =_;::.., _c-_: _,_t:i_'._ - 4'"_-:,_!,._:,......._,_":'.,' ..'":_-_ -_7.,,-=_b_ _,,_,'" -
1978016675-030
3/78 8981
I TO ffi total period = 24 hours for a daily cyclea ffi 0.0J53 ftZ/hr
app
I K = 3 ft -_
= 2.1 ft
I Phase velocity - _u = 0.0875 ft/hr = 1 in./hr
This means that, in terms of order of magnitude only, the designer of a
I periodic energy storage system (daily cycle) utilizing LIKCOm as a storage
material and operating between the _elting point (505"C) and ambient temperature
I (22"C) should think in terns of 2-foot-long thetemperature waves penetrating
material with the speed of about 1 in./hr. Note, however, that for any
I harmonic oscillation (for example, a sine-wave input), the amplitude of theincoming wave will be damped by exp (--27) = 0.0019 over a single wavelength.
I With such damping, choosing the thickness of the material as great as a wholewavelength would appear to represent underutilization and therefore waste.
Thus, we would like to determine an optimum thickness or distance between the
I heat-exchange surfaces.
In working with a slab of finite thickness 2a, it is convenient to define
I a dimensionless frequency H-
M can also be expressed in terms of a Fourier number based on the slab half-
I thickness, a, and the total period --TO
ST
OF POO&QUALTherefore, H ffi .,_;_-_ . (22)
I NF°
The temperature response of a slab to a cyclic heat input is usually
i expressed in terms of the parameter M. The relevant solutions are available
in literature, but their numerical evaluation is laborious _, I c. Relevant
I solutions for the of a storage medium under periodictemperature response
variation in a heat-transfer fluid are presented elsewhere, _° but an interest-
I Ing observation can be made regarding the optimum thickness for maximumstorage. Although very little heat can bo stored in a thin slab ("a" or H
I small for a fixed period, _o ), a semi-infinite body with its surface temper-ature varying harmonically can store, at most, 2/_ (or 0.798) of the maximum.
Groeber s observed that the heat stored during a half-cycle goes through s
| 2,I N S T I T U T E O F G A S T E C H N O L O G Y
'M ,_ )
1978016675-031
3178 8981t
L
_aximum of 0.911 at M = 1.2 and decreases for Y _ 1.2 until the limit of
0.798 is reached for practically all values of _; > 3. This suggests that. _] i
in the absence of other overriding cocsiderations, the designer of a storag_ _device with a flat-plate matrix might start at M = 1.2. However, tradeoffs P
u Lbetwee_ various competing parameters and economics should be considered.
Experimental Verification of simpllfi_L__ Assumptlon_ _ t
A 5-1n.-tall, 3-in.-dlam laboratory model with a ]/2-1n.-OD interior well a
was used to study solidification half-cycles with the model salt. For exact B
dimensions, constructions details, and thermocouple placement, see Figures 7atom
and 8. This study confirmed t_o assumptions developed and used in the analy-
tical treatment of the heat storage problem with a phase change: 1) Assume
that there is no thermal gradient in the liquid phase, so that in a cyclic oper- E "
atlon the solidification half-cycle always b_,glns with a uniform temperature
distribution, permitting the use of transient ('*slngleblow") solurlons, and
2) use an "apparent" c for system design. Both assumptions appear to beP
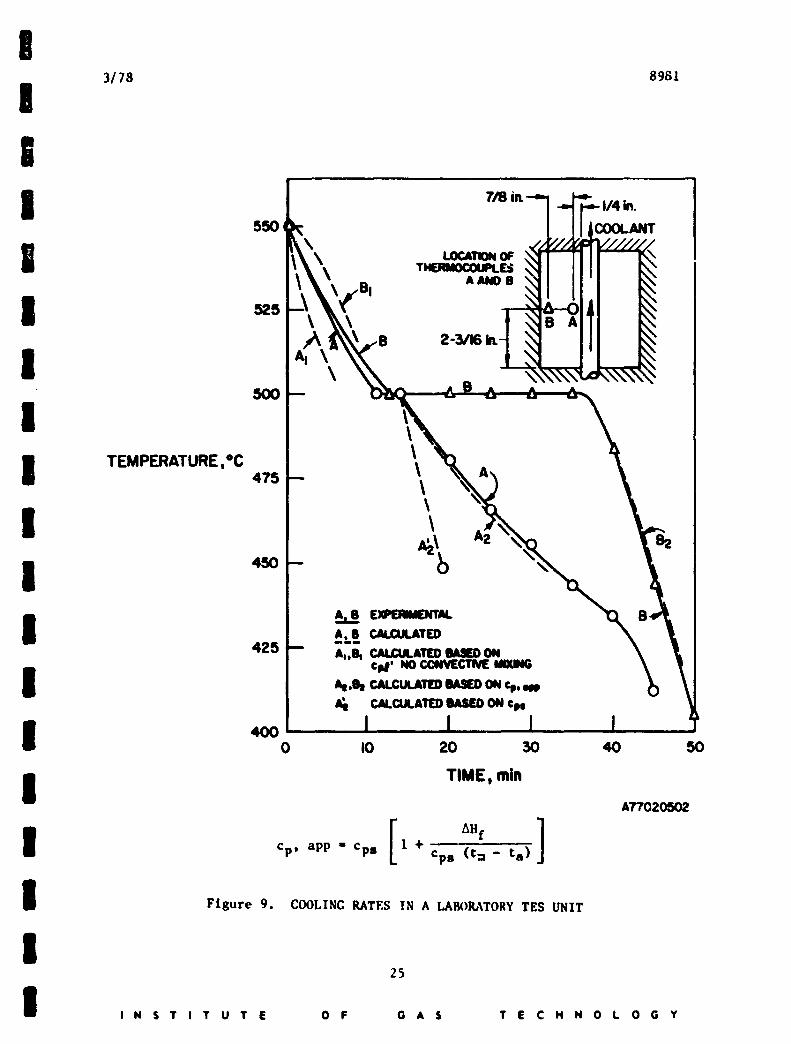
confirmed by the test results shewn in Figure 9.m
The No-Thermal-Gradient Assumption: First Part of the Cooling
Half-Cycle(Cooling the Liquid) tThe model syster (LiKCO3) was heated to about 50°C above the melting point. 8
Cooling begins with the liquid phast uniformly at 550_C. The coollng was a
provided by 22°C air passing through the 0.43-1n.-ID internal well at 50 ft/s. I_7
Use of the Dlttus-Boelter equation" for turbulent forced convection inside
tubes in the form N
0,8 _ 0.2
h = 0.20 (125) G (0.43/12) (23) j
where G is the mass velocity, G = pv = 0.0742 (50) = 3.71 Ib:nlftZ-s, and
constant 125 is a temperature-dependent factor involving air conductivity and mt.$ |viscosity (k/_ ), gives a value for the heat-transfer coefficient of 13.9
Btu/hr-ft2-°F. Several trial-and-error calculations of the exit air tempera- I!
lures based on the relationship between the increase of the enthalpy of air
and the ileat transferred from the hot charge along the interior well length z,
• dt gCpm_z = hp (_w " t) (24)
or, integrated, i
texit " tw - exp [ - h_.z] (25)t a - tw Cpm a
22m
I N S T I T U T E O F G A S T E C H N O L O G Y I
1978016675-032
1978016675-035
|3/78 8981
g
lead to corrected values of h = 13 for the heat-transfer coefficient and I
65.6°C (150"F) - talr for the bulk nlr temperature. The knovledse of _alr and i
of the surface coefficient, h0 allc_s us to calculate the temperature In the l
liquid phase using standard solutions for conduction heat transfer with boundaryi
conditions of the third kind. A solutlon '_ of these equations for bollov I
cyllnders assuming a finite conductivity of the material (i.e., no =/xlng)
yields curves (At and BI, Figure 9) that fall to reproduce the experimenta __ IQ
results (curves A, B).
The assumption of perfect internal mixing and nc temperature gradient
leads to a coollng rate of
_ d.t_t= _ hpz (t - 156) = -8"F/mln (= 5"C/mln) (26)dT 60 Cp m
which reproduces the experlmental coo_.Ing rate of about 5"Clmln, and, on In-
tegratlon to t = 150 + 872 ezp (-0.0116 T), where T is In minutes, matches
the experimental tlme-temperature curves A and B quite accurately. This
suggests vigorous convective (buoyancy driven) mixing In the llquld phase In
a cell of the slze used here.
In fact, the Raylelgh number NRa = _ measures the ratio of
buoyant to thermal forces In a fluld. Nitb the kinematic viscosity of the
liquid estimated at _ = 0.17 ft21hr and the thermal dlffuslvlty a{ = 0.0183
ft21hr, the Prandtl number _la _ 9 (tom,parable to that of water at room
temperature). Taking At ~ 50"C (=900F), the coefficient of volume expansion,
0®-0
13 = oAt : 1.4 X IO-"'R -I (27)
Since the significant dimension L _ 1112, the gayXelgh number Is then of the
order of I06. Thls Is several orders of magnltude higher than the stablllty
criterion (Spa ~ 103). s
LTo approach the condition of stability, the width of the liquid-fllled gap
would have to be reduced by a factor of I0, to about 1110 inch. Subsequent
experiments on solldifylng the model storage system (LIKCO3) In a honeycomb
matrix of about l14-1n, mesh showed some temperature gradient between thermo-
couples A and B but not to the extent predicted by the nonconvectlon solutlon
curves AI and B].
muo,u,z6 OVPOORQU'"
iNSTITUTe OF OA S TECHNOLOGY
1978016675-036
I3/78 8981
I Use of an "Apparent" Cn: Second Part of the Cooling Half-Cycle(The Phase C_n.._.n_
l Figure q s.t_9,w_ a brief (about 2.5-min) isothermkal time lag at 500°C for
thermocouple A and a 22-mln time lag for thermocouple B. Hegerlln's solut!on
I (Equation 12, Figure 5) for Nph = 0.57 and NBi = 0.2 predicts longer solidi-
fication times, 4.7 and 28 min, respectively. This solution, however, is
I written for an infinitely long cylinder with the heat sink at ti_e inter£orwell only. ldlen heat losses from the outer lateral surface and from the top
I and bottom are added to the central well loss anti the cooling cares are re-calculated on that basis, the isothermal lag times become 2.7 mln for thermo-
i couple A and 20 min for thermocouple B.Third Part of the Cooling Ha!f_-Cycle (C, otlng the Solid Phase)
I Thermocouple A begins to indicate solid phase at its location after 12.5minutes of cooling (Figure 9). The apparent Cp over a temperature range of
I 505 ° to 4450C (941 ° to 8330F) is 0.32 + 1_8/IO8 = 1.69. Used in the analyticalsolution for the hollow cylinder, it results in the curve A-, which closely
I follows the experimental curve A over this range. The use of Cp = 0.32, i.e.,of the sensible heat alone, results in Curve A':, which does not agree with the
experimental data.
I Thermocouple B is so close to the outer wall that by the time its position
has changed from the liquid to the solid phase, the whole mass is solid; there
I Is no evolution of the lare.c heat, and Cps = 0.32 used in the analytical
solution adequately describes the behavior of thermocouple B (curve branch B2,
I Figure 9).
Design of the Engineering-Scale (8-kNhrth) Experimental Storage Unit
I The engineering-scale units were designed with the overall goals of the
i work in mind: 1) to verify the PCH cooling behavior predicted by the analyticalsolutions, particularly the movement of the solid-liquid interface as a function
of discharge time, because of the commercial TES design parameters that can be
I determined from it (such as heat exchanger spacing), and 2) to accurately
determine energy discharge rates, their improvement, and system efficienctes,
m I all of which play a significant rote in determining the feasibility of storing
thernml energy in Pill.
I27
I I N $ T I T U T E 0 F G A $ T E C H N 0 L 0 G Y
I
1978016675-037
!3/78 8961
Based on the considerations discussed in the previous sectlons, psrtlcuLsr-
-_ ly the results of Bra_lette et 81.,2 and the experinc, ntal results from theI
laboratory unity we have selected dt_d.mula:'arrauKement for the experimental E
storage unit. Thls arrangement can be scaled up. A commercial sized unit vlth
a multihexagoual cell arrangement can be visualized. In eddlclon, thls arrange- Ig
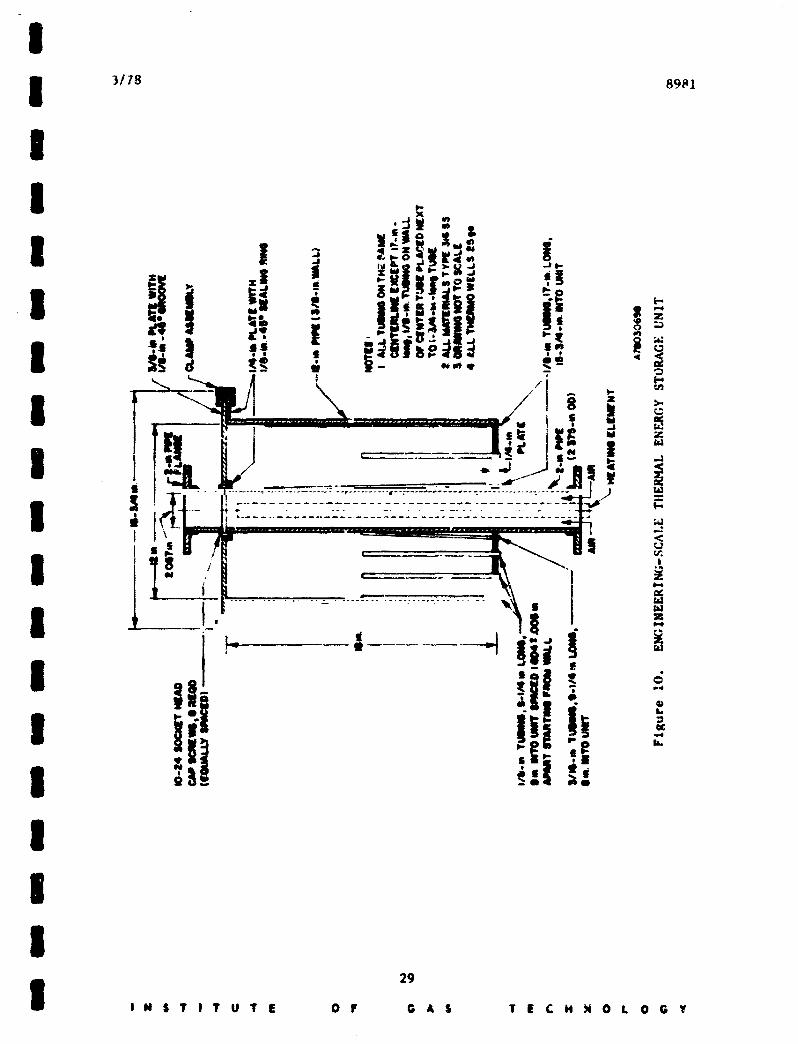
menr Is the slmplest experlmentally. The final unlt desip is shown In Figure 10.
The Internal radius of th_ central well used for charging and dlschargJug wasMchosen to be I Inch so that the well could accommodate an electric heatlng
elmsent large enough Co sustain the pover levels and temperatures requlr_d to m
charge the unlt in a r_ssouable tlle period (10-14 hours at ~ 1 kWe) wh//e main- F
cainlng an annular area large enough to generate a fully developed turbulent
flow of the cooLInt air vtthout requiring hLsh pressures. This radium Is al_o
convenient for co_mrlns observed performance to predicted performnce (r e = 1).
Electric hearth8 was selected because it allows easy recordins o£ the char81n8
energy and, t_,_fore, accurate detenttnatlon of the storage efficiency. =_
of the heating rod used is 0.75 ln., lesvlu8 an annular IThe diameterIg
cross-sections1 area in the well of 2.7 ln. 2 (0.0187 ft2). Fans were selected
to move the coolant alr at the rate of 4600 ftS/hr, representlns a velocity of BQ
(4600 ft3/hr) (0.0187 ftz) -z (3600 s/hr) -l = 70 ft/s. The corresponding
Bayuolds number Is- Ig
v..dd= (70)(1.25)NRe " v (f2)(16.36 X 10"_) = 4h,570 (28) 81
indicating fuUy turbulent f'.ov. The heat-transfer coefficient under thmle U_
conditions can be deteralned by calculating the Nusselt number- _iMhd o.e
Nlqu = _-- = 0.023 NRe = 120.5 (29)
Therefore -- -f I-
h " (NNu)(kf)/d I
= (120.5)(0.015)/(1.83/12) (30)
-11.9 Btulhr-ftz-'V I i
The correspondtn8 giot number is-
._ (11"9) - 0.75 (31) I" (12)(1.3)
I N S T I T U T E O F G 4 S TIE C H N 0 I. 0 G Y _
1978016675-038
II 3/78 8981
I
I t tI,zJ_),e._w,_
i ,, _ , i "| !I _.. .. ._ l__.,=.,,._!_,.,_ _ _._ . 5t_lI_ 3,$1 lI - w Im
---- | /'T
I t_ _ I l;_ _|.= "I I_I BI . .... _._I_ 1,.. I
I __!.,'- , " ,"_!.1.I ,81.. 'I| _.
III
29
I I N S T I T U T E O F G A S T § C H N 0 L 0 G ¥
1978016675-039
3/78 8981
The analytical solution for a phase-change mmber - O. j7 (calculated
from the properties of the model salt); and an NBI = 0.75 (Figure 6) wasused to detern/ne the coutaln_r outer radius, allovlng complete solidiffcation
in a 6 to 8-hour period. A 6-hour discharge period represents a Fourier
number of -
(0.0287)(6_ . 25 (32)NFo = _ = (i/12)_
From Figure 6 for "qFo = 25, MBl = 0.75, and _ph = 0.57, a layer of saltapproximately 4.2 in. thick (N-l) can be solidified in a 6-hour period. This
represents an outer container radium of 4.2 + I = 5.2 in. Similarly, an 8-hour
discharge time repremmts a Fourier number of 33, a sa!t thickness of 4.7 in.,
m_J a coutaIJ_er outer r_dlus of 5.7 in. (ll._-In. dims). On the basis of
these values anJ the a_allabillty of construction materlais, a I2-in. container
dtJmter vas selected (Schmdu/e 40 12-Jn.-dL_ pipe). Ic _ desired to have
1 ft 3 of salt in the container at room temperature, whtch would then fill the ms
conta/ner to a height of 15.9 in. Allowing a lOZ salt velume In,.cesse with Etemperature r/.se te 941"F (discussed in the next section), the molten salt
vould fill the container to a heIsht of 17.5 in. (dlsreKardlns the expansion
of the contd/ner). Therefore, a container heIK_t of 18 in. (at room temper-
ature) va8 selected, t:sgTan thern_ouples were located in the salt by inserting 1/8-In. stain-
1e88 stem_l tubtq (closed at out end) through the container bottom. Eightg
of the theruocouplas vere located in the same radial plane, five of these
theruocouples at half depth (=8 in. frcn the container bottom), out locatedmat the host-transfer 8m_face, and one each at radial positions (R--I) of
1.6, 2.4, 3.2, end 4.8 in. These thermocoupies were used to determine the m
movcuent of the solld-llquid interface trLth time for comparison vith the Bi
Interfa,ce movement predicted by the dmalytlcSl solutions. The three other
thermocouples vere used to study axial tHq_erature response an_, edge effects d _
not considered in the analytical solutions, Two other thermo<ouples located
in a perpendicular radial plane at (R-l) positions of 2.4 in. (one on each Iumr
slde of the heat excbmapr) and st v_rylng levels throughout the entire _alt
depth were used to atudy the _ial temperature response in detail. The
of ro083O
I N S T I T U T E 0 @ G A S T E C N l 0 L 0 O Y
1978016675-040
|3/78 8981
I temperature information generated by the thermocouples was used to approximat
the shape of the interface as the salt solidified. The containers were also
I equzpped to measure th_ height o== -'he=c!ten salt while In operation.
The insulation was selected from the following consi_ rations. Under
Ii steady-stateconditlons the temperature distribution in a cylinder is given by-
I d (r dtd-_ d-fr) = o (33)
Integrating twice and using the condition at the Insulatiun boundary
|-k_r = h2(t2 - t a) (34)
I leads to
tl -- t2 = h2r2 in r2 (35)
I t2 - t a kin s rl
i where the subscripts denote --I = outside radius, storage unit
• I 2 = outside radius, insulationa ffi ambient
I ins = insulation
I It is _eslred, for safety reasons, and to keep heat los_es low, to _eep the out-side Insulation face at 54°C (130°F) or below; then t_ = 505°C (941_F),
t2 = 54°C (130°F), ta = 22°C (72°F), h = 1.5 Btu/hr-ftZ-°F (combined radiation
I and free convection), and klns = 0.08 Btu/hr-ft-°F (mineral wool) leads to an
r2 of about 12.5 in., or an i__ulatlon thlckness (r2 - rl) of 6.5 in.
I Verification of ThermoPhYslcal Properties of LIKC03
The purpose of thls task was to determine or verify certain thermophyslcal
I properties of L1KCO_ critical to the performance of _hts salt as a PCM for
thermal energy storage. Values for the melting point and heat of fusion have
I been reported in the literature and verified by DTA, DSC, and electrical
conductivity measurements as a function of temperature. The melting point was
I found to be 505"C (reported value I_ of 504.5 + I°('),with a heat of fusion of15a.5 Btu/Ib (reported value I_ of 168 Btu/Ib). The volume change on fusion was
I determined from measured thermal expansion coefficients between room temperature31
I I N S T I T U T E 0 e G A S T E C H N 0 L 0 G Y
1978016675-041

|3/78 8981
and 475°C (887°F). A volumetric expansion of 4.5% was calculated from the i
expansion coefficients, _epresenting a solid density of 2.13 g/cm 3 at 505°C.
The density of liquid LiKCOa at 505°C was estimated from data of Speddlng 26 I
to be 2.01 g/cm J, and a volume change on fusion wae determined from these
densi_, differences to be 6%. Therefore, a 10.5% volume change should be iallowed for in containment design.
l
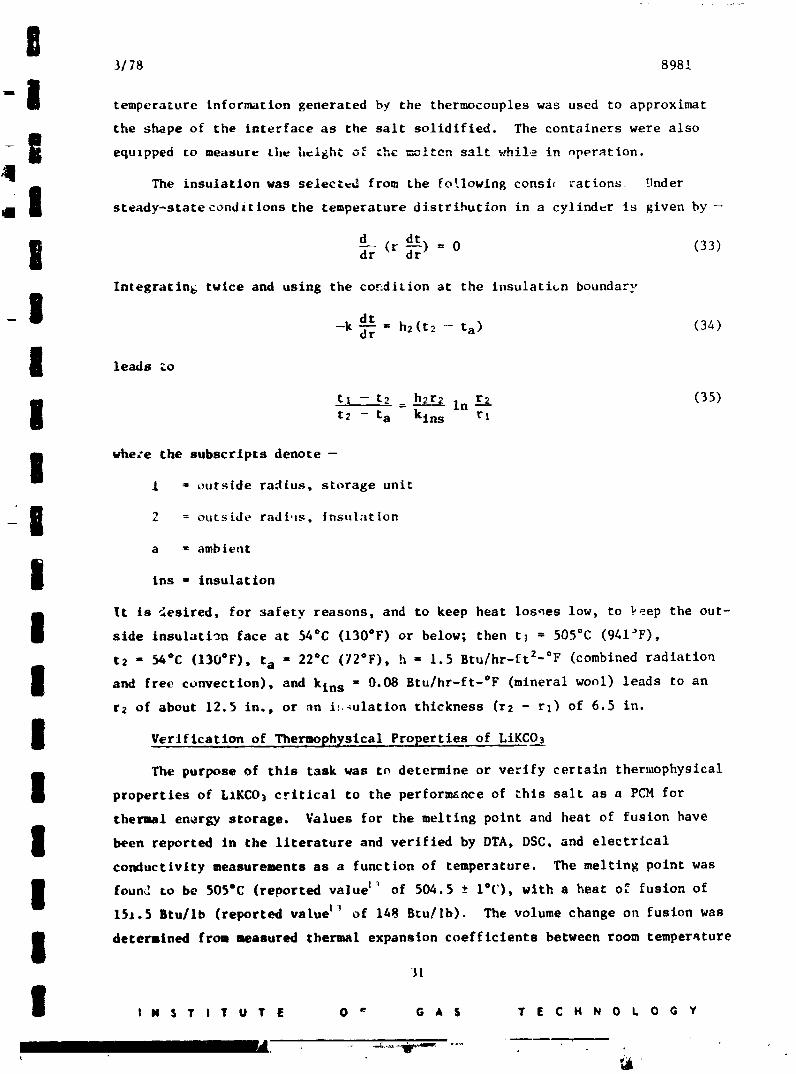
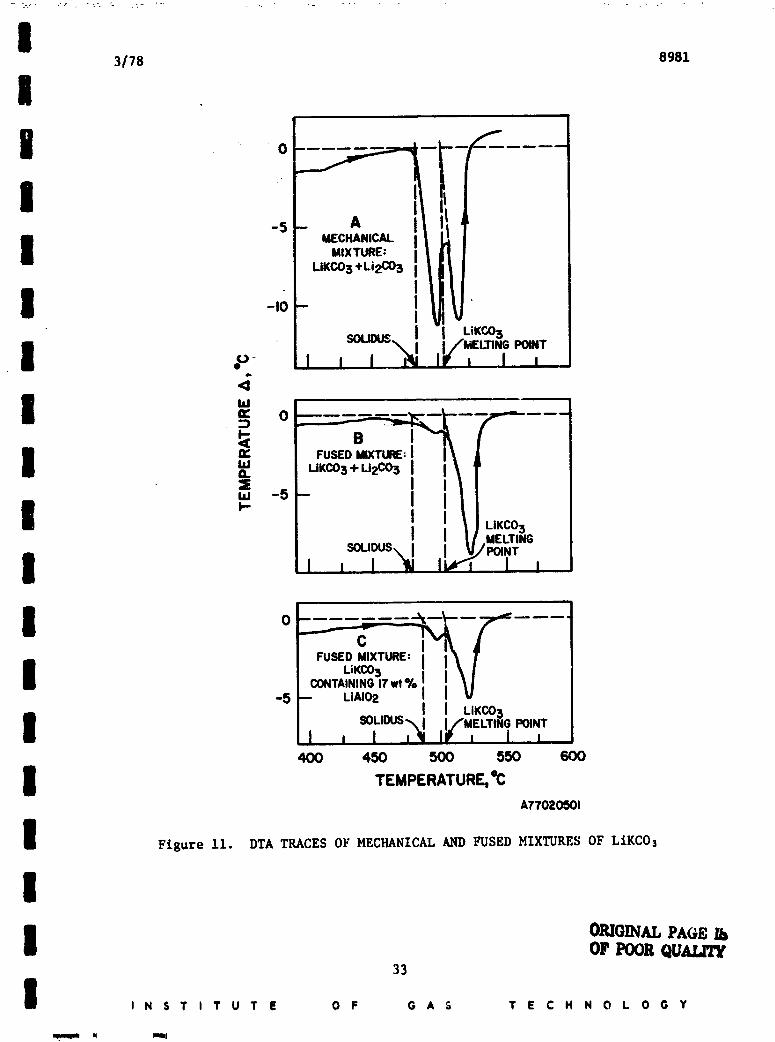
Supercooling (common in low-temperature systems) was not observed at icooling rates above 5°C/min, and thermal cycling (in the laboratory unit) and
corrosion products contained in the salt did not alter the fuslon-solidiflcation Ig
characteristics. It was also found that thermal cycling had a stabilizing
, effect on the LiKC03. When the initial salt was examined by DTA, two endo- i
|the_-mlc peaks were observed that represent the 485°C eutectlc temperature and
the melting point of LiKC03 (Figure Ii), indicating a composition slightly
rich in Li2C03. After thermal cycling (12 cycles), DTA studies could only l
detect the fusion of LiKC03 at _ 505°C (Figure 12), indicating that the excess
Li2C03 was selectively lost by vaporization, corrosive reactions with the l
m
container, or some other mechanism.
J
of Conductivity Enhancement and Volume-Chan_e Control Additives _minvestigation
m
Alkali metal carbonates have relatively higher thermal conductlvltles
L_ (~i Btu/hr-ft-°F) than the various inorganic salts considered. However, noting 8that the heat-transfer area required for a given quantity of heat depends
strongly on thermal conductivity (particularly in the solid region of the salt),u
the heat-transfer a_ea and the resulting cost of the storage system can be mln-
I IIimized if the conductivity of the salt medium can be improved. We therefore
investigated the use of high-conductlvity materials as conductivity promoters.
Considerations for the selection of suitable conductivity promoters include -- DB
i. Thermal conductivity and heat capacity
m
2. Compatibility with carbonates
3. Availability
-- 4. Suitability of fabrication in desirable forms --__i_ _AL_P_G_L,
5. Cost.
After the initial considerations, different materials in various shapes
were experimentally tested in our laboratory TES (3-in.-diam c_ntaJner) unit.i
32
1978016675-042
I 3/78 8981
!
, f___ A il ,!
, LII- _Vi "souaus I I UKC03
\ I i/_ pore
-_- I I
I _\SC"KC_-_.I i\
I SOLIDUS" 1 I I"KC03I , I ,_i400 450 500 55{) 600
I TEMPERATURE, "CA77020_OI
I Figure Ii. DTA TRACES OF MECHANICAL AND FUSED MIXTURES OF LIKCOs
II ORIGINALPAGEOF POORqU._
33
I I N S T I T U T E O F G A S T E C H N O L 0 G Y
,, ml I
1978016675-043
3/78 8981
JA_ASTCOOL,_G./%...SOU_'_nO"J --
!
14J
Nn, +15bJel
w B.SLOW COOLING,I- _"Clmin
+10 -- N
fl_so.o,,c,_,o_I+. - _Ll_'_5"c I
-- |. ISOLIDIFICATION I! MELTING
BEGINS I_ :/POINT-Jo I = I ;/, 1 t40O 450 500 55O 60O []TEMPERATURE,°C
AYl'O2OSO0
Figure 12. DTA TRACES OF THERMALLY CYCLED LIKCO3
I34
I N S T I T U T E O F G A S T E C t" N 0 L 0 G Y I
1978016675-044
i3/78 8981
I The fea_lbiltty of using L/A102 as a volume-control material to randomly
distribute voids resulting from volume changes as the LIKC03 solidifies was
I assessed by examining the storage capacity sacrificed by the addition of
LIAI02. determining the rate at which the L._AIOz particles settle from the
I carbonate-aluminate and examining the influence of LtA102 on the dis-paste,
cha.ge heat flux and system efficiency. The results of these studies are
I discussed below.
Investigation of Co,nd.uc.t.lvlty-Promoter Additives
I As prevlously discussed under "Transient Solutions," the heat-transfer
resistance in the PCH appears to be the major TES performance-limltlng factor.
I Thls effect, which results because the low thermal conductivity in the solldphase damps the heat flux through the solid PCH formed on the salt-slde heat-
I transfer surface, is the prJJeary drawback in using a paesive heat exchanger tnsuch a system. If the thermal conductivity of the solid PCM can be cost-
i effectively increased, performance improvements wlll result.The most attractive method of conductivity enhancement appears to be by
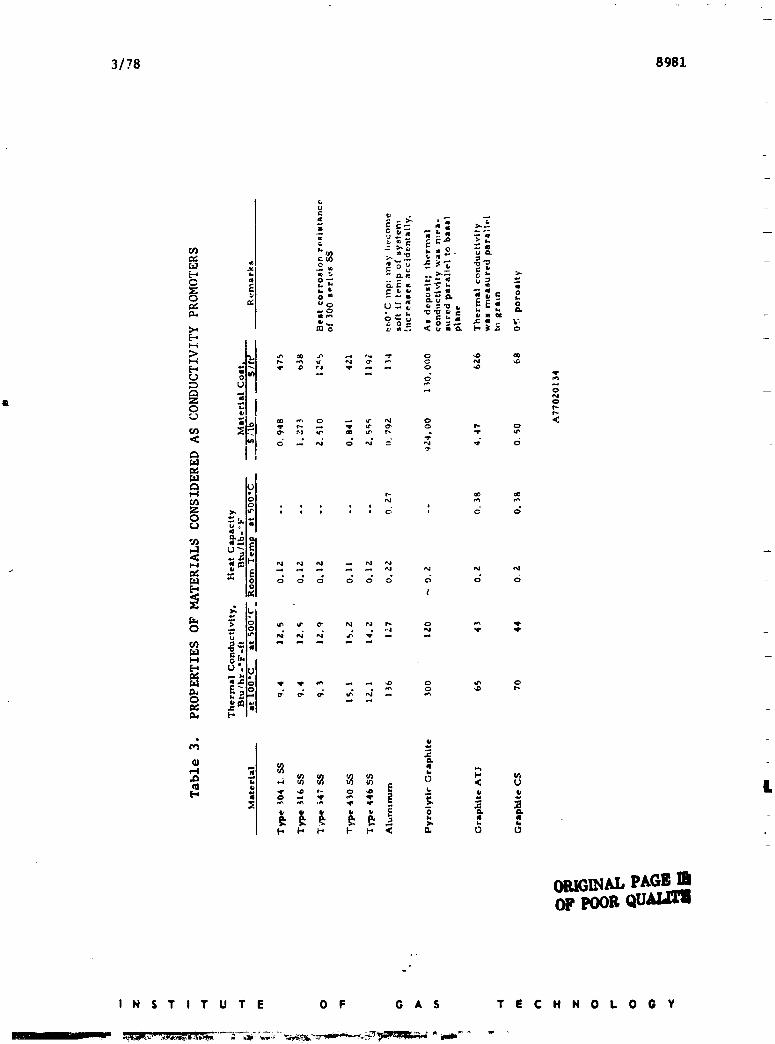
I the addition of higher conductivity materials to the salt In the form ofscreens, wool, foams, honeycomb matrix, or particles. Several _atertals were
considered for this application. Their relevant properties are summarized
I in Table 3. Some corrosion tests that were conducted with graphite showed
that this material may not be stable in the molten carbonate environment.
I Dispersed particles do not provide significant enhancement,heat-transfer
according to Siegel, 2s so they were not tested.
I To obtain relative IJaprovement heat-transfer rates with the additionin
of conductivity promoter, we tested some available materials in our laboratory
I TES system. Figures 7 and 8 show the constructional details, and the locationsof thermocouples In the system. A 3-in.-dlam, 5-1n.-iong stainless steel tube
I with the bottom end sealed, containing 800 g LIKCOs, was heated in an electricfurnace with a heat input of 9 A at 115 V (heating rate of approximately
i 5"C/min). After the carbonate reached the equilibrium temperature, the coolingair (50 it/s) was fed from the bottom of the 1/.'-in.-OD center tube. Testing
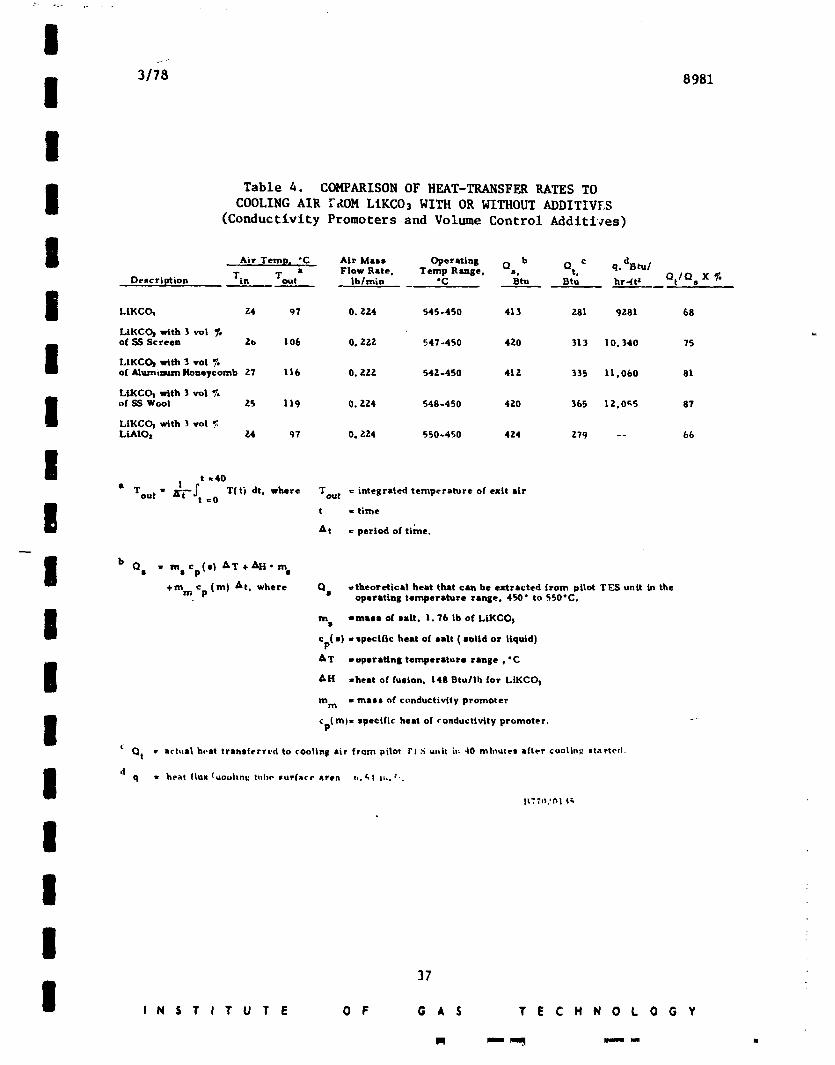
was conducted with LIKCOs alone and for LIKCOs with a) 3% by volume stalnless
I steel screen attached to the center cooling tube, b) 3% by volume aluminum
honeycomb matrix immersed in the salt, and c) 3% by volume stainless steel
I wool immersed in the salt. The results of these tests, summarized in Table 4,_5
I N S T I T U T E 0 F O A $ T E C H N 0 L 0 O Y
1 q m I p| MM_l_Imm " _ m r_, ._
1978016675-045
3/78 8981
ORIGINAl.,P_GEOFPOORqO_i_
I N S T I T U T E O F G A S T E C H N O L O G Y
1978016675-046
li
3/78 8981
ITable 4. COMPARISON OF HEAT-TRANSFER RATES TOCOOLING AIR _OM LtKC03 WITH OR WITHOUT ADDITIVF, S
(Conductivity Promoters and Volume Control Additives)
I Air Temp. "C Air Mass Operating O b cFlow Rate. Temp Range. s. (_t. q' dBtu/
Description Tin Tout a Ib/min "C Btu Btu hr..it z Ot/Q s X _.
LIKCO_ Z4 97 0. Z24 545-450 413 Zgl 9Z81 68
LiKCC_ with ] rot _.of ._3 Screen Zb 106 0. ZZ?. 547-450 410 313 10. 340 75
I LIKC_ with 3 rot %of Aluminum Honeycomb Z7 110 0.2;[2 54Z-450 41Z 335 ll.0b0 gl
LIKCCh vdth 3 vo| %
I of SS Wool Z5 119 0. ZZ4 548-450 420 365 1Z. 0_5 87LiKCC_ with 3 volLLAIOz 24 q7 0. ;'24 550-450 4;[4 ;[79 -- bb
t -40
a Tout . _'I ft _0 T(t) dt. where Tou t = integrated temperature of exit air
t - timeAt _ period of time.
b Qs " msCp(S) AT msˆ(m) At. where Qs =theoretical heat that cam be extracted from pilot TES unit in the
operating temperature range. 450" to 550"C.
m s mmass of salt. !. 76 Ib of LiKCO)cp(s) .. specific heat of salt ( solid or liquid)
AT ,,operlUng temperature range. "C
AH -heat of fusion. 14gBtu/lb for LIKCO I
m m , mass of conductivity promoter
I Cp(m)- specific heat of conductivity promoter, r--"
C Qt r act,at h.'st trsnsferrt.d to coolint_ sir frem pilot I'I S u, it i.: 40 rot, urea sft_.r coolinP started.
I d q - heat t'|tlx (_oohnv lilt)q- l_uefa(-r sre8 ,.&| I;..:'.
I!!
37
I "INSTITUTE OF GAS TECHNOLOGY
m _m. mm m-J, -, •
1978016675-047

3/78 8981
show that although stainless steel has a low thermal conductivity its
conductiivty-enhancing effect is good if used as a wool. We then obtained
a relatively fine aluminum wool and tested it at concentrations of 3, I0,
=, and 14 volume percent.
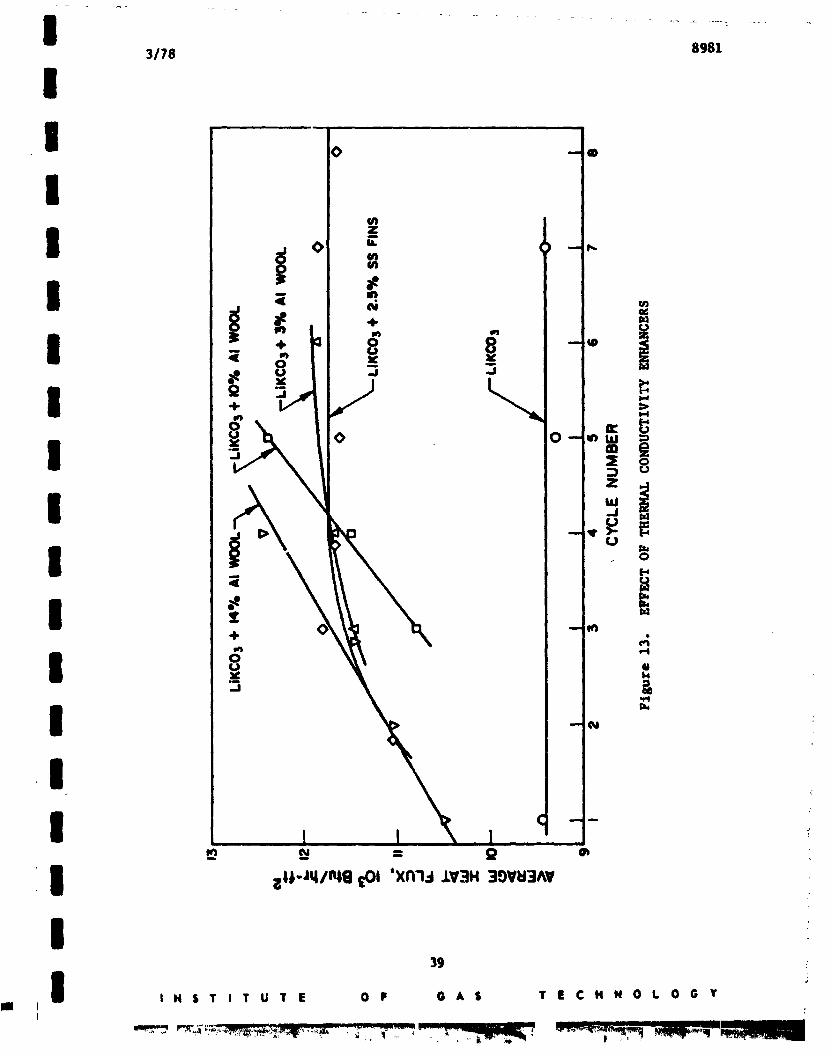
The results of these tests are shown in Figure 13. The LIKCO3 alone shows
a uniform heat flux with cycling, whereas the units containing the aluminum
wool show an initially higher heat flux, which increases further with contlnued
cycling. As a result of this behavior, a quantitative dependence of the output
heat flux on the conductivity-promoter concentration could not be established.
Further cycling of the units that contain 10% and 14% al,mlnum wool is expected
to result in steady-state performance (no further change of the heat flux with
cycling), as seen in the unit containing only 3% aluminum wool. When all of
the containers are operating under this equilibrated condition, the appropriate
relationship can be derived. The additional cycling, however, has not ! een
performable because of mechanical problems.
The primary observation to be made, therefore, is that at each concentration
of aluminum wool, an increase in the output heat flux was immediately attained
and it continued to improve with cycling.
Two possible expanatlons for the dependence of the output heat flux on
cycling are --
1. More intimate contact between the frozen salt and the aluminum wool re-
sulttng from slight corrosive reactions on the aluminum (possibly theformation of a thin LtA102 surface layer), and
2. A radial movement of the aluminum wool toward the heat exchange surface,resulting from the contraction of the salt as it solidifies.
It is difficult at this time to ascertain which of these mechanisms nmy be
controlling and what contribution each makes toward the observed behavior.
However, there is evidence for each, and the lesser depend,rice of heat flux on
cycling observed in the salt containing the least amount of aluminum wool would
support either.
One of the primary difficulties in using a wool-type conductivity promoter
is obtaining good contact with the heat exchange surface. Therefore, an alter-
native means of improving the salt conductivity by ensuring good contact between
the conductivity promoter and the heat-transfer surface was also tested. A
ORIGIN AL PAGE
38 OFpOOR QUALI
I N $ T I T U T E 0 F G A $ T E C H N O L O G Y
1978016675-048
n3/78 8981
finned-tube heat exchanger was tabrlcated and tested on the laboratory-scale _ i!
unit. The eight fins, which were welded to the heat-transfer surface to ensure i
good contact, dlsplaced ~2.5% of the salt volume and extended midway into the " I
salt. The results obtained from this unit are also shown In Figure 13. The
maximum heat flux obtained Is about the same as that with 3 volume percentl@
alumlnumwool. This results shows that a hlgh-conductlvlty material distributed
evenly through the salt in random orientation Is as effective as a lower-Uconductivity material with a more intimate contact. However, the fabrication
costs are a great deal higher for a flnned-tube heat exchanBer. The aluminum
wool is, therefore, as effective in enhancing conductivity, but is more cost
effective, and appears to be the most promising conductlvity-enhancement concept.
Investigation of Volume-Chanse Control Additives
The containment of a PCH used as a TES medium is complicated by the
differences in thermal expansion between the containment material and the
PCH and by the volume change accompanying fusion of the PCM. Differences in
; thermophyslcal behavior between sto_age and containment materials can lead to
_ more complex containment design, increased containment cost, and lower volumetricINto
storage capacity (based on container size). Each of these effects can decrease H
both the practicality and efficiency of TES that utilizes the heat of fusion of
a PCH. The thermophyslcal properties of a PCH alone cannot be modified or Elicontrolled. However, they can be substantlally reduced by creating a composite
storage material containing both the PCN and an inert volume-control material,gThis latter material is characterized by its stability, thermal expansion, and
particle size and morphology. The material is selected so that its thermal m
§expansion is considerably lower than that of the PCH, thereby producing a
composite thermal expansion lower than that of the PCH alone.i
Furthermore, the particle slze distribution and morphology must be such
that loosely packed particles form a tight, continuous capillary network. f-
When the PCH is molten, all of the void space within the volume-control matrix I!
is filled with the liquid. As the PCM solidlfles and undergoes the accompanyingJ_
contraction, the capillary network serves to localize the resulting IIvolumetric
voids on a microscopic scale, within the capillaries. The net eff. rt is to
distribute the void space (resulting from the PCM volume change on solldifica-
tlon) throughout the composite storage medium. Therefore, on a macroscopic
scale, the volume change accompanying a phase change and the void space jm
40
I N S T I T U T E O F G A S T E C H N O L O G Y I
1978016675-050
3178 8981
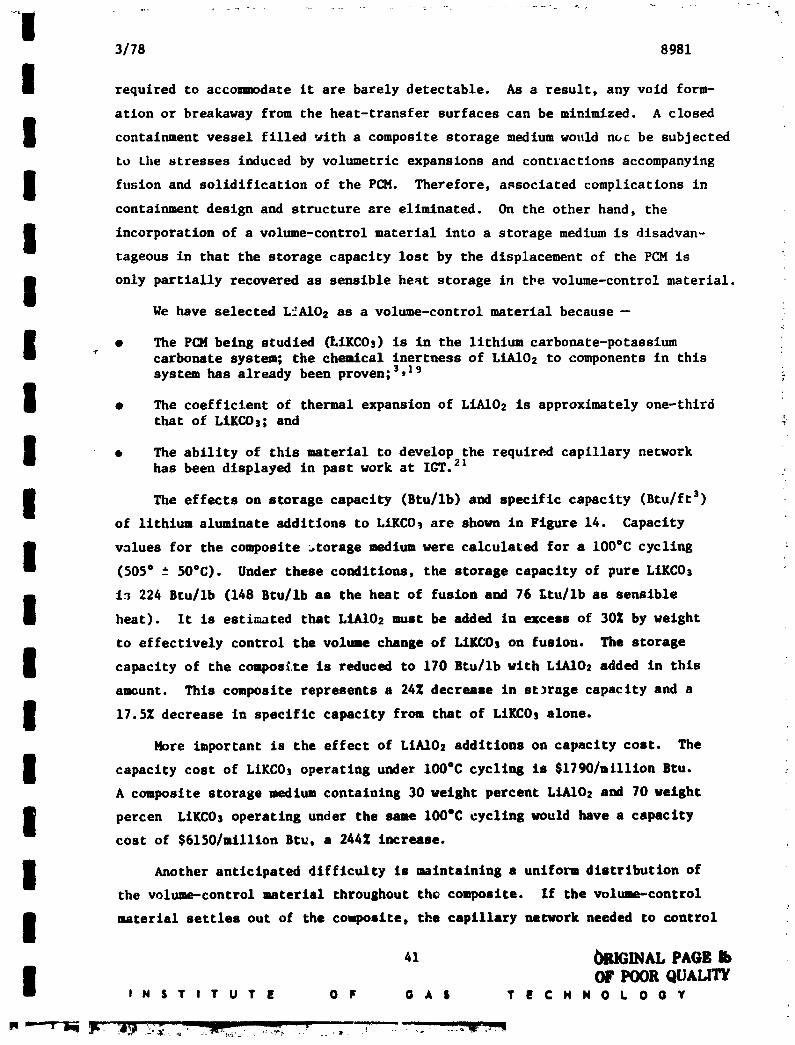
I required to accommodate it are barely detectable. As a result, any void form-
ation or breakaway from the heat-transfer surfaces can be minlmlzed. A closed
I containment vessel filled with a composite storage medium would n_c be subjected
Lo the stresses induc*ed by volumetric expanslons and contractions accompanying
I fusion and solldlficatlon of the PCH. Therefore, aRsoclated compllcatlons incontainment design and structure ere eliminated. On the other hand, the
I incorporation of a volume-control material into a storage medium is disadvan-tageous in that the storage capacity lost by the dlsplacement of the PCH is
I only partially recovered as senslble heat storage In the volume-control materlal.We have selected L'AIO2 as a volume-control material because --
I • The PCM being studied (LIKCOs) is In the llthlum carbonate-potassium: carbonate system; the chemlcal inertness of LIA102 to components In thls :system has already been proven; 3,19
I • The coefficient of thermal expansion of LIAIO2 Is approxlmately one-thlrdthat of LIKCO3; and 4
I • The ablllty of this material to develop the required caplllary networkhas been displayed in past work at ICT. 21 /
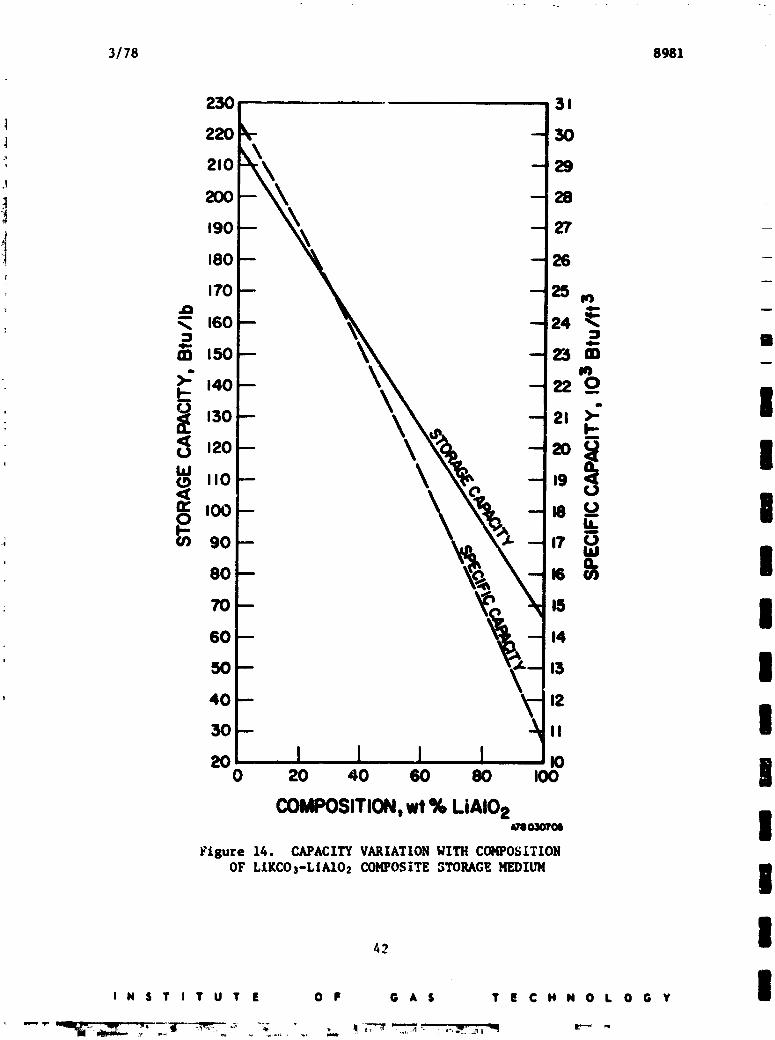
I The effects on storage capacity (Btu/Ib) and specific capacity (Btu/ft 3)of lithium alu_nate additions to LIKCO_ are shown In Figure 14. Capacity
I values for the composite _torage medium were calculated for a 100"C cycling(505" -" 50°C). Under these conditions, the storage capacity of pure LIKCOs
1_ 224 Btu/lb (148 Btu/Ib as the heat of fusion and 76 Ltu/lb as sensible
I heat). It Is estimated that LIAI02 must be added In excess of 30Z by weight
to effectively control the volune change of LIKCO3 on fualon. The storage
I capaclty of the composite Is reduced to 170 Btu/lb with LIA102 e_ded in thls
anount. This composite represents a 24Z decrease In storage capacity and a
I 17.5% decrease in specific capacity from that of LIKCOs alone.
Hore important Is the effect of LIAIO2 additions on capacity cost. The
I of under 100"C is $1790/_illton Btu.capacity cost LIKC03 operating cycling
A composite storaKe medium containing 30 weight percent L/A102 end 70 weight
I percen LiKC03 operating under the sane 100"C cycling would have a capacitycost of $61S0/mtllton Btu, a 244Z increase.
I Another anticipated difficulty Is maintaining a uniform distribution ofthe volume-control naterlal throughout the composite. If the volume-control
I materlal settles out of the composite, the capillary network needed to control
41 /GINAL PAGEJb
I OF POORQUALIFYI N S T I T U T E O P G A S T E C H N O L O G Y
1978016675-051
3/78 8981
250 3 I
_ 220 30: 210 29.-1
190 27+! 180 26/
• 170 25 m
-_ 160 24 _,
m 150 25m
>: ,40 2z_130 21
\ ,laJ(.D I10 19
'<,,-,oo \ • _" I2_; itn 90 17
,o + _ I: 70 15 _
60 14
50 13 i
:t "!+,a |
_°;2o2o__ !COMPOSITION, wt% LiAIO2
J_O0301'OI i
Figure 14. CAPACITYVARIATION WITH COH]PO$iTION
OF LIKCOs-LiA102 COI_OSiTE 5TORAC£NEDIUN I
I N S T ! T U T E O F G A S T E C H N O L O G Y I
1978016675-052
I3/78 8981
I the volume change accompanylng fusion of the POI 18 destroyed. As the additive
saterla] settles, the volumetrlc changes of the composite increase wlth cycllng.
I This say cause undealrable voids and a safety hazard if the design for storase
- container expa_u_ion _,ssumes thac the conposlte contains a_ even distribution
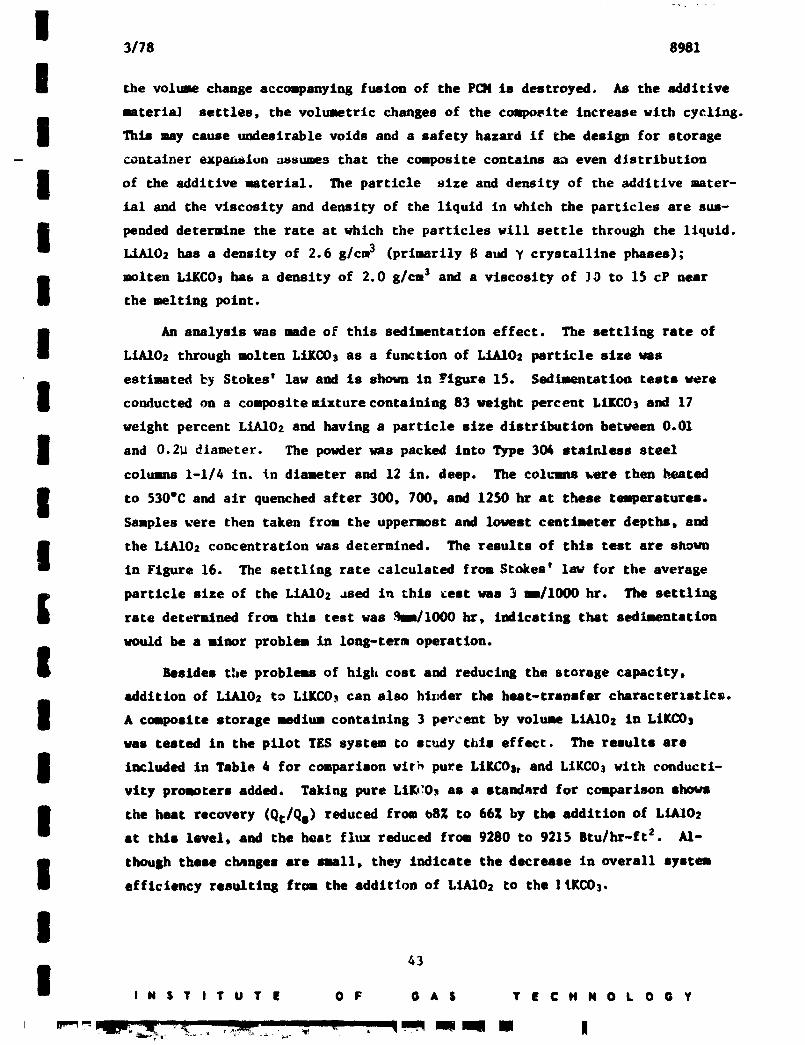
I of the additive saterlal. The particle size and density of the additive mater-lal and the viscosity and density of the liquid in which the particles are sus-
I pended determine the rate at which the particles will settle through the liquid.LiA102 has a density of 2.6 8/cm 3 (prin_rily B aud y crystalline phases);
molten LiKCO3 has a density of 2.0 g/ca 3 and a viscosity of J0 to 15 cP near
I the melting point.
I An analysis was made of this sedimentation effect. The settling rate ofL/A102 through molten LiKC03 as a function of L/A102 particle size ms
estimated by Stokes' law and is shown in Figure 15. Sed/Menr_tlon teats were
I conducted on a composite _txture containing 83 weight percent LiRCO3 and 17
weight percent L/A102 and having a particle size distribution between 0.01
I and The powder was packed into Type 304 stalnless0.2_ diameter. steel
columns 1-1/4 in. tn diameter and 12 in. deep. The colulmus _ere then heated
I to 530"C and air quenched after 300, 700, and 1250 hr at these temperatures.Sanple8 were then taken from the uppermost and lowest centimeter depths, and
I the LIAIO2 concentration was determlned. The results of thl8 test are sho_min Figure 16. The settllng rate calculated from Stokes' lay for the average
partlcle size of the L/A102 Jsed in this test was 3 mm/1000 hr. The settlln8rate deteralned frou this test was .qm/lO00 hr, indicating that sedimentation
would be a alaor problem in long-term operation.
I Besides the problems of hlgl, cost and reducln8 the storage capacity,
addition of L/A102 to LJXCO_ can also hl,;der the heat-transfer cheracterlstlcs.
I A composite storage mmdlms containing 3 percent by volume L/AIOz in LIKCOs
was teated in the pilot TES system to 8c_dy this effect. The results are
I included in Table 4 for comparison wlth Li&COs, and LiKCO3 wlth conductl-pure
vlty promoters added. Taking pure Li_'O_ as a standard for comparlson shows
I the heat recovery (qt/qs) reduced from _SZ to 66Z by the addition of L/A102at this level, and the heat flux reduced from 9280 to 9215 Btu/hr-ft 2. Al-
l thoush these chenges are small, they indicate the decrease in overall systemefficiency resulting from the addition of L/AIO_ to the I IKCO3.
I43
I I N S T I T U T E O F G A S T E C H N O L O G Y
1978016675-053
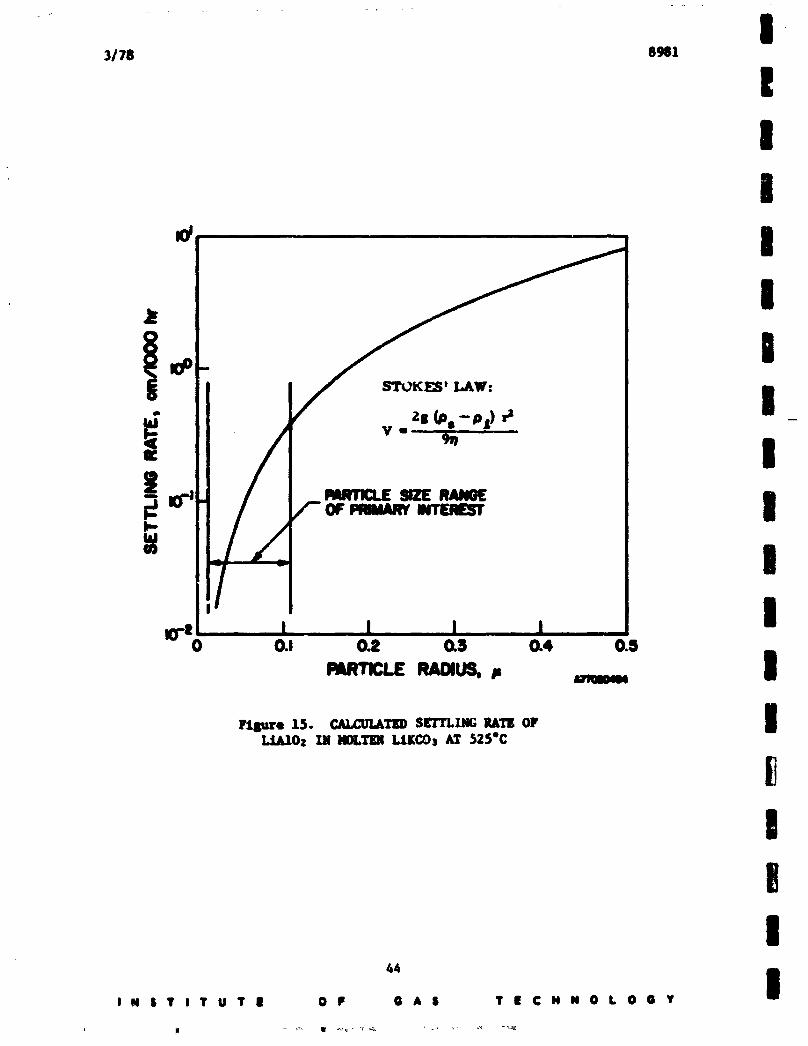
!II
I N S T I T U T E 0 P G A S T E C H N O L O G Y
1978016675-054
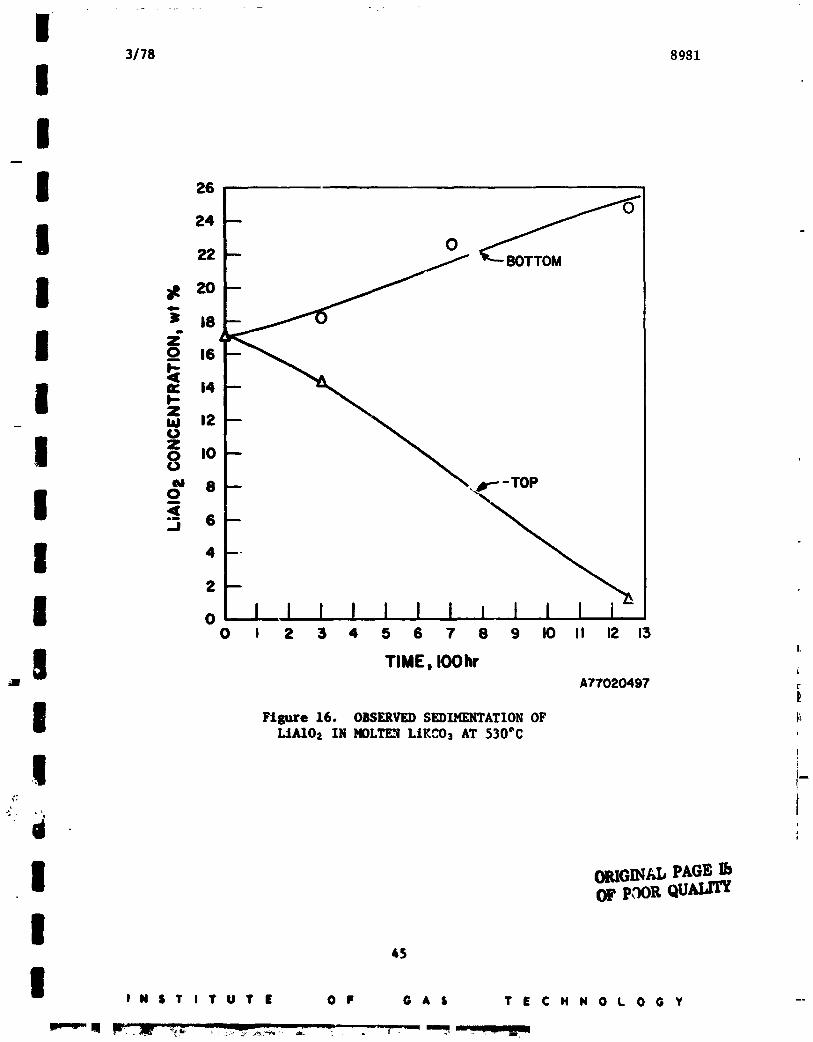
r
3/78 8981
II
14
_1 g ,,I
0 8 ,win"-"-TOP
I _ 6 --II
I 4 --2 --
| o I I I I I I I0 I 2 3 4 5 6 7 8 9 I0 II 12 13
I.
I TIME, IOOhrm AT7020497 r
I FIKure OBSERVEDSEDIHENTATION16. OF
LtAIO= IN NOLTE_LiKCOm AT 530eCi
I ii
i 'ii
I ORIGIN/JJ PAGElborpoor QU_n_
I45
I I N S T I T U T E O F O A $ T E C H N O L O G Y
1978016675-055
i3/78 8981
a
The decrease in storage capacity and system efficiency and the increase i
in capacity cost resulting from L_AIO2 additions represent disadvantages of n
the use of LiAI02 as a volume-control addltlve. Because the volume change of
LiKCOs in our system is < 10%, the benefits to De derived from volume-change
control additive may be less important than the accompanying disadvantages. N
However, if a high-volume-change system such as chlorides is used, the volume-
control additive may become important, i
Construction Materials
The heat exchanger conduits, the construction materials for -ontainment
of the salt, and the conductivity promoters must withstand the corrosive attack
of the salt. As we briefly described in our Task I Report o11 Salt Selection, I_ I
carbonates are relatlvely less corrosive than chlorides, fluorides, sulfates,
and phosphates. Molten carbonates are used in fuel cells, t9 gasification ofg
coal, I cleanup of sulfur-containing gases, 7 and other applications. A
reasenable amount of corrosion data on molten carbonates iF, therefore, avail-
aable. Although specific data for our PCM, LiKCOs, is scarce, data on other
alkall-metal carbonate mixtures have been reported; and we believe that the m
corrosion beha_-ior of LiKCOs would be similar to that of the other alkali- I
metal carbonates.
Corrosion Data I
Janz and coworkers I_,Is studied corrosion of Types 304 and 347 stainless Qsteels in the Li2COs-Na2COs-K2CO3 ternary eutectic under submerged conditions. S
From their experiments, the authors concluded that both Types 304 and 347
iare passlvated under submerged conditions in an oxidizing environment. A
corrosion of ]0 mils/yr was reported for Type 347 stainless steel in static
tests at 730°C. (See Table 5.) !
Davis and KinnJ_rugh 6 studied corrosion by the Li2COs-Na2COs eutectic
mixture under fully and partially submerged conditions, and reported a greater
corrosion attack under partially submerged conditions. This observation is
important for our TES system because a partially submerged condition is likely
to occur at _he liquld-gas interface at the top of the liquid LIKCOs.
Differences in the activity of the oxidizing species in the meniscus area
Band in the bulk liquid are responsible for the higher degree of corrosion.
Experimental verification of the expected greater corrosion will be discussed ig
46
am
I N S 7 I T U 7 E O F G A S T E C H N O L O G Y I
1978016675-056
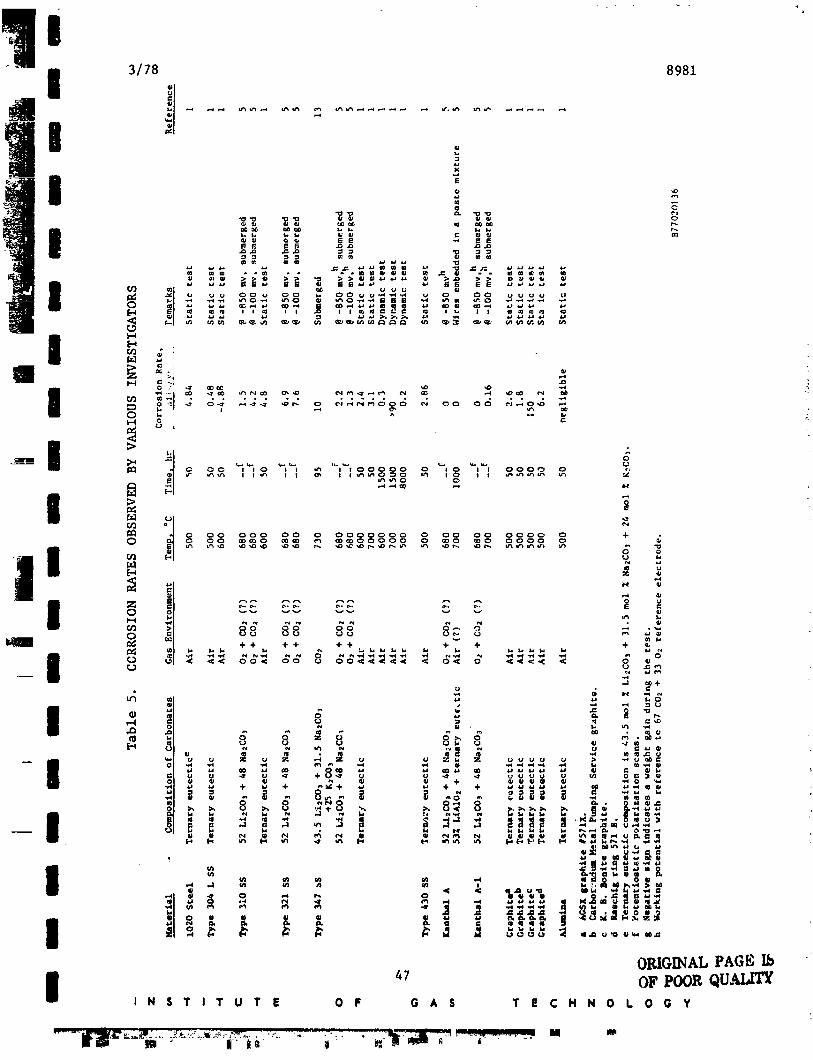
I 3/78 . 8981,-4
/u =q! "
m m "_
[-t
_ _1 ................o _; ' ^ - _.
| _ _'il °u" u'%0 0
o _ 8§ °°° °° °°_o _°° +_ g
,-. _-. _..,. ,.. ,.. 2.. ,.
_ = ++ ++ ++_. += + ,.,_ + ="o u 5_
M 4,,,,_ ,,,q -_ ,am 0
ORIGINAL PAGE Ib
i _7 OF _00_ QU._//I_INSTITUTE OF GAS TECHNOLOGY
m q .... L_ .. n
1978016675-057
!3/78 8981
in the following section. Davis and Kltmlbrugh also noted that ferro- I
aluminum alloys, such as Kanthal A, Kanthal AI_ and Hoskins 815 were more
resistant than the 300-series stainless steels, s (See Table 5.) i
Atomlcs International I has employed molten carbonates for sulfur removal
and as reaction media for lqsltu combustJon. They have carried out detailed i
studies of corrosion by carbonates under static and dynamic conditions; their
melts consisted of the ternary eutectlc by itself as well as with additions I
i
i
of 20Z sulfide or 20Z sulflte melts. Some results of their 50-hour static
tests and 1500-hour dynamic corrosion tests at 500°C are summarized in ig
Table 5. The Atomlcs International report con_alns additional data for various
alloys and ceramic materials. Their results suggest that -- ml
1. Up to 600°C, Type 347 stalnless steel appears to be satisfactory for
containing ternary carbonates in the presence or absence of sulfur
compounds. A 1-year dynamic test at 500°C showed a corrosion of only i0.2 _11s/yr fo_ :his stainless steel.
2. At higher temperatures, contal_ent of these melts requires high- ichromium alloys, ceramics, cermets, or a frozen skull of the salt. |
Corrosion data on various grades of graphites has also been reported
|by Atoedcs Internatlonal (Table 5). The corrosion rate obtained from 50-
hour exposure tests varied from 20 to 150 mils/yr. Graphite Is attractive
as a conductivity promoter because of its high conductivity, but its i
corrosion behavior for different grades of interest needs to beinvestlgated.m
Aluminum is also a possible candidate for a conductivity promoter be- i
cause it possesses a high conductivity and can also be considered as a
construction material. Aluminum is resistant to carbonates at temperatures 12 i
up to 600°C; at the Institute of Gas Technology, we have operated molten
carbonate fuel cells at 500° to 600°C using aluminum hardware. 12 Noting Im
that the melting point of aluminum is 6600C, the corrosion resistance of
aluminum appears remarkable. This is possible because of the formation of
a protective alumina layer on the surface, which in turn reacts with carbon-
ates to form a highly protective layer of lithium aluminate. _ iThe TES unit should be designed for periodic (daily) cycles, so data
on corrosion of materials under thermal-cycling conditions will be required, m
UAtomics lnternatloual also studied the effect of thermal cycles on corrosion
rates. If the passlvated films separa_ from the substrate during thermal
I N S T I T U T E O F G A S T E C H N O L O G Y I
m
1978016675-058
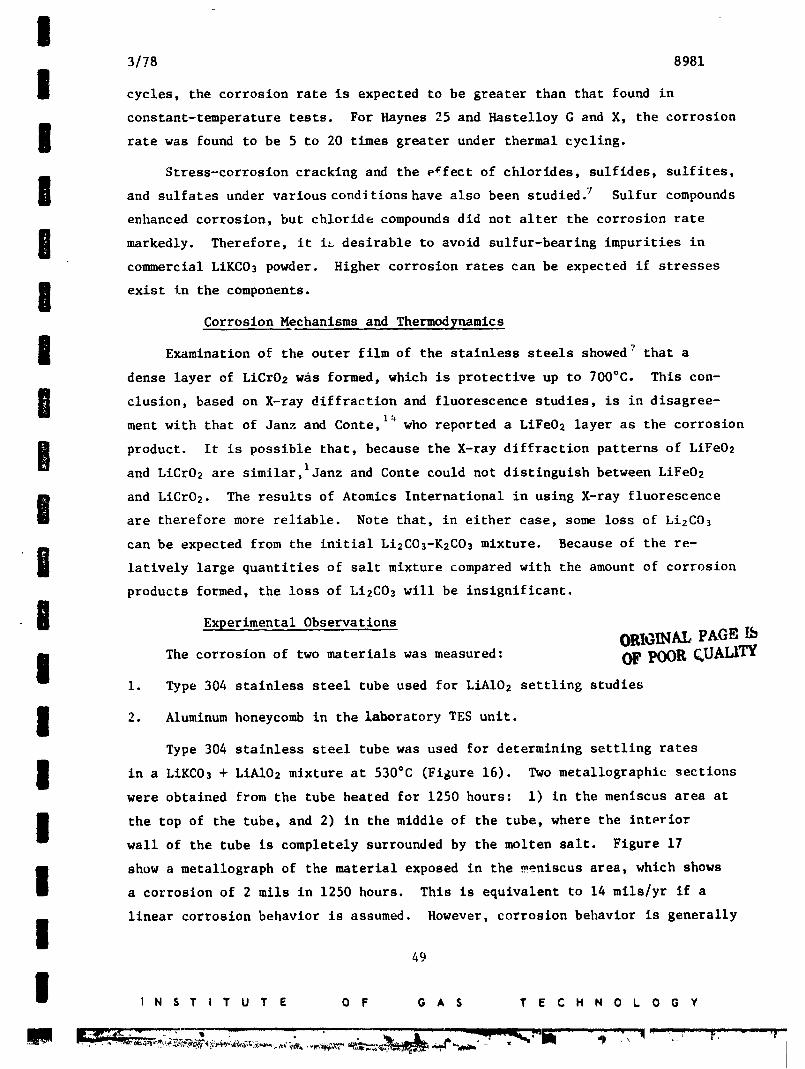
I3/78 8981
I cycles, the corrosion rate is expected to be greater than that found in
constant-temperature tests. For Haynes 25 and Hastelloy G and X, the corrosion
I rate was found to be 5 to 20 times greater under thermal cycling.
Stress-corroslon cracking and the effect of chlorides, sulfides, sulfites,
i and sulfates under various conditions have also been studledJ Sulfur compounds
enhanced corrosion, but chloride compounds did not alter the corrosion rate
i markedly. Therefore, it i_ desirable to avoid sulfur-bearing impurities incommercial LiKCO3 powder. Higher corrosion rates can be expected if stresses
I exist %n the components.
Corrosion Mechanisms and Thermodynamics
I Examination of the outer film of the stainless steels showed 7 that a
dense layer of LiCrO2 was formed, which is protective up to 700°C. This con-
I clusion, based on X-ray diffraction and fluorescence studies, is in disagree-ment with that of Janz and Conte, who reported a LiFe02 layer as the corrosion
I product. It is possible that, because the X-ray diffraction patterns of LiFeO2and LiCr02 are slmilar,IJanz and Conte could not distinguish between LiFeO2
I and LiCr02. The results of Atomics International in using X-ray fluorescenceare therefore more reliable. Note that, in either case, some loss of Li2C03
can be expected from the initial Li2CO_-K2CO3 mixture. Because of the re-
i latively large quantities of salt mixture compared with the amount of corrosion
products formed, the loss of Li2C03 will be insignificant.
_T I Experimental Observations
ORIGINAL PAGE
I The corrosion of two materials was measured: O_ POOR _UAI_TYi. Type 304 stainless steel tube used for LiAI02 settling studies
I 2. Aluminum honeycomb in the laboratory TES unit.
Type 304 stainless steel tube was used for determining settling rates
I in a LiKC03 + LiAI02 mlxture at 530°C (Figure 16). Two metallographic sectionswere obtained from the tube heated for 1250 hours: I) in the meniscus area at
I the top of the tube, and 2) in the middle of the tube, where the interiorwall of the tube is completely surrounded by the molten salt. Figure 17
I show a metallograph of the material exposed in the _eniscus area, which showsa corrosion of 2 mils in 1250 hours. This is equivalent to 14 mils/yr if a
linear corrosion behavior is assumed. However, corrosion behavior is generally
!49
I I N S T I T U T E O F G A S T E C H N O L O G Y
1978016675-059
_, |
' 3/78 8981 I
|H|
. |
l
|
5'_
IP7805J615
Figure 17. METALLOGRAPH OF TYPE 304 SS IN THE
MENISCUS REGION EXPOSED AT 530°C FOR 1250 HOURS (180 X)
U- 50 I
I N S T I T U T E O F G A S T E C H N O_L 0 G Y I
1978016675-060
II 3/78 8981
_lg parabolic [corrosion = (time)lh]; thus a long-term corrosion rate m.ch lower
J than 14 mils/yr can be expected. Compared with the observed corrosion in themeniscus area, the corrosion in the interior region was negligible. The
observations confirm the differences in corrosion rates reported by Davis and
I Kinnibrugh _'for submerged and partially submerged conditions.i
i Corrosion of aluminum honeycomb used as a conductivity promoter wasobserved in a terminated laboratory TES test that underwent 5 cycles between
550°C and room temperature. Because the total exposure time was less than
I I00 hours, the results are only tentative and cannot be extrapolated to predict
long-term corrosion. However, an average corrosion of approximately 0.I mll
I was measured.
In summary, 300-series stainless steels (e.g., Types 304 and 3_7) appear
I satisfactory under submergc_ greater amountconditions. A somewhat of
corrosion was observed on Type 304 stainless steel in the meniscus region,
I but additional tests are necessary to obtain long-term corrosion rates in thisr,gion, Aluminum is an acceptable material, provided it is used in temperature
I ranges compatible with the desired mechanical properties.
IIIIII
I %,I
I N S T I T U T E O F G A $ T E C H N O L O G Y
1978016675-061
|3/78 8981
D
Task 3. Construct_ Operate I and Evaluate the Performance of the Engineering-
Scale (8-kWhrth) System
System Construction
Based on the design considerations discussed in conjunction with Figure I0, D
J3 englneering-scale units were constructed of 316 stainless steel. A cross
section of one of the units is shown in Figure 18. The container is a
Schedule 40 12-in.-diam pipe 18 in. long. The annular central tube, used for I
heating and cooling purposes, is a Schedule 40 2-in.-diam pipe approximately
_m 24 in. long with welded flanges on both ends. The bottom of the container is I
a I/4-1n.-thick circular plate. Hell-arc welding was used to secure and seal
the bottom plate to both pipes. The thermocouple wells were initially install_d mm
by drilling I/8-in. holes in the container bottom at the appropriate locations,
inserting the 1/8-in. tubes to the proper height, and welding around theiriibase. However, this method was later found unsatisfactory due to leaks
developing around the welds, and the method was modified. Direct welding of m
the thermocouple wells was avoided by using butt-weld tube fittings (GYROLOK), I
which were found to perform satisfactorily. The container lid and outer
machined from 3/8-1n. plate stock. Sealing of the center Isealing ring werew_
tube was accompllsh_d with a flange tightened by eight machine screws. The
outer tube was sealed with a two-bolt compression-type flange. Aluminum gaskets i
were used on both flange arrangements. Standard 2-in. HSS slip-on flangesi
were used to connect the unit to the TES system. A schematic of the T_SBsystem, comprised of the TES unit, an air blower, the heating element, the
instrumentation, and the controls, is shown in Figure 19. m
A three-statlon test stand was constructed, with cooling air supplied
through 2-in.-diam piping manifolded to each station from a single source, m
|Air flow was adjusted and regulated by a limiting orifice control valve placed
in each of the coolant lines. The units were insulated with 7 in. of J-H
Cerafelt mineral fiber. The insulation was applled in I/2-1n.-thick layers. I
Aluminum foil was placed between the layers to'reduce radiation losses.
System Operation and Data Collection
The units were filled with approximately 130 Ib of salt before mountlng
and insulation. _11tn2 _.,_ accomplished by a two-step procedure. First, J
the container was filled with powdered LiKCO s, placed in an oven, heated to a
5800C in an air/COt atmosphere, held at temperature for 16 hours and then I
cooled. This step was repeated three times, filling approximately 80g of the
|iI N S T I T U T E O F G A S T E C H N O L 0 G Y
1978016675-062
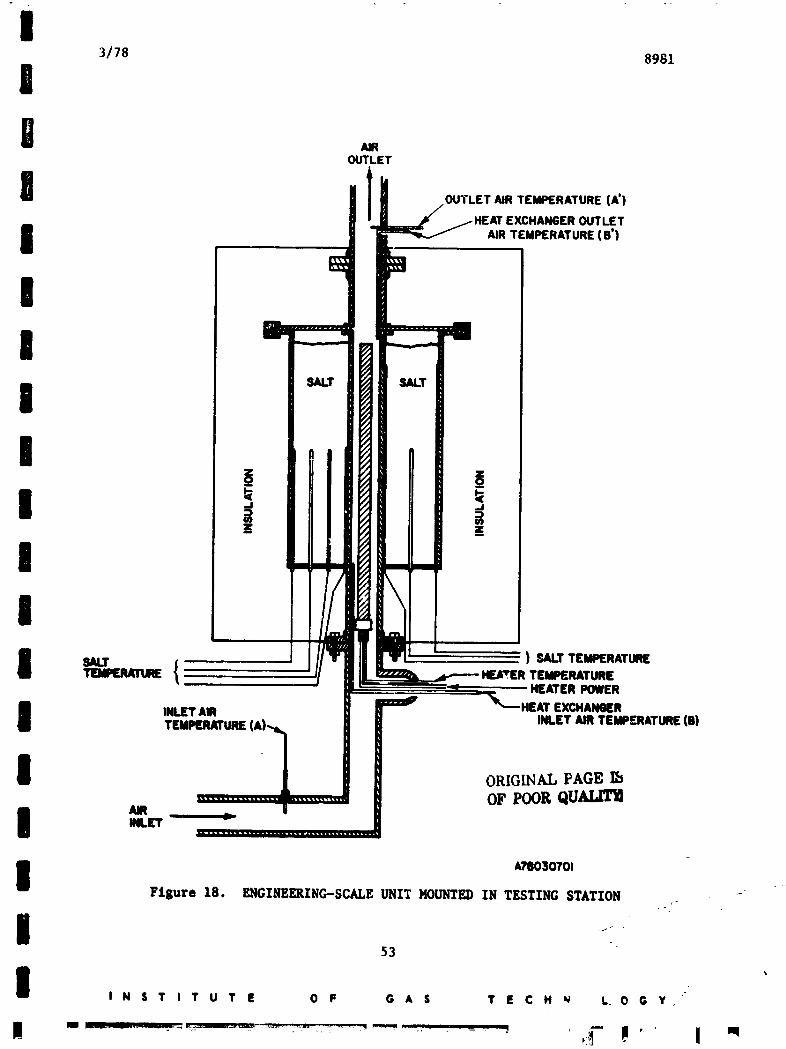
u3/78 8981
|
l_ HEATEXCHANGEROUTLETi AIR TEMPERATURE{O')
!!I
!I
i SALT { SALTTEMPERATURETEMPERA11JRE TEMPERATUREHEATERPOWER
I INLETAIR HEATEXCHANGERTEMPERATURE, INLET AIR TEMPERATURE(D)
i ORIGINAL PAGE IbOF POOR QU.'aI_[II_
i A78030701Figure 18. ENGINEERING-SCALE UNIT MOUNTED IN TESTING STATION -
53
I 'I N S T I T U T E O F G A $ T E C H _ L_ 0 G Y
1978016675-063
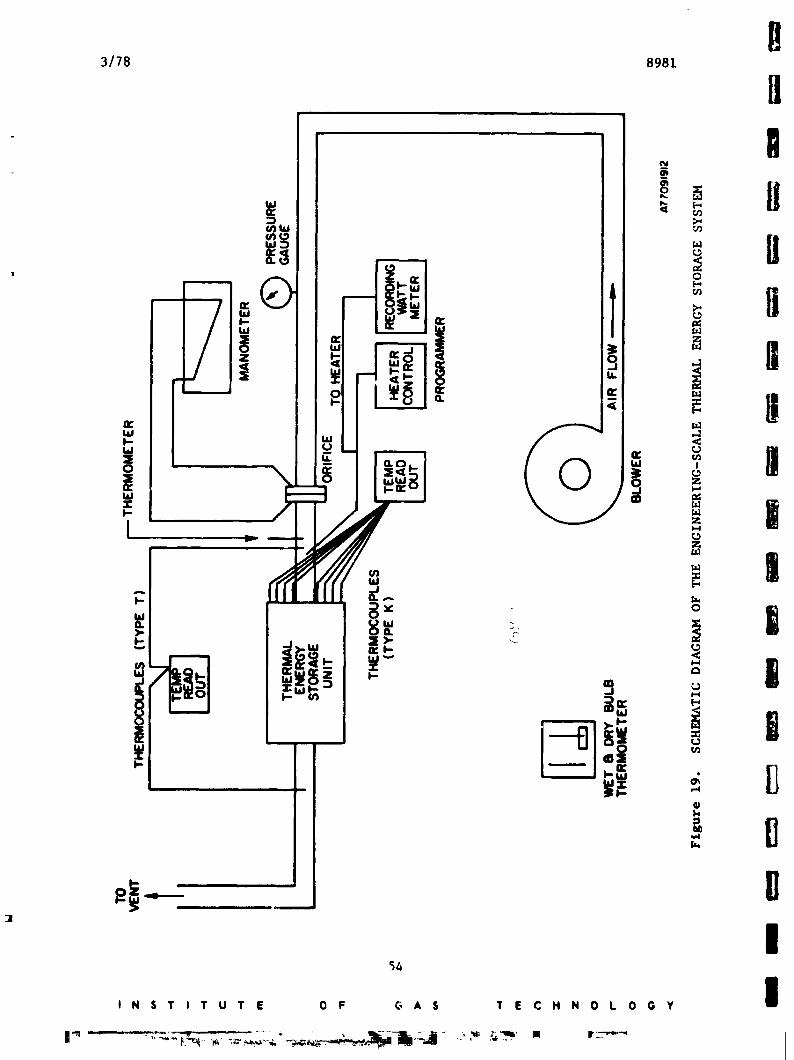
n3/78 8981
' n
_. .
i '° U
_-- __ Ii]
!54
,.s'r,'ruTe oF **s TEc..oLoov I"4
1978016675-064
I3/78 8981
I container volume. The remaining salt was added by melting it in alumlna
crucibles, which were subsequently emptied into the container. The fllled
I container was heated to 580°C and then cooled to roomtemperature.
The units were operated under varying cycle periods (a cycle consisting
I charge, holdlng time, discharge). The units were charged wlth aof and
3/4-in.-dlam H-T firerod fixed In the center of the central tube. The he_tlng
I rate was controlled with a programmable controller, and the power inputmeasured wlth a tlme-base recording wattmeter. The units were heated to 530°C
I and held at thls temperature for varying times depending on the cycle period.The units were discharged with ambient air. Flow rates were determined
I using an orifice meter, lncllned manometer, and an upstream statlc-pressuretap. Humidity of the air was measured by means of wet- and dry-bulb
i temperatures. The initial condition for a discharge run was for all thermo-couples at salt mld-level to reach 530°C. At the termination of the holding
period, power to the heating element was cut, alr-temperature thermocouples
I were inserted where required, md al- flow was directed to the station under
operation. Air temperatures were recorded continuously on a two-pen strip-
I chart recorder, and salt weze recordedtemperatures on a 24-polnt strlp-chart
recorder throughout the cycle. Air flow rates were checked and recorded
I perlodlcally throughout the discharge run and adjusted when necessary tomaintain a constant mass flow rate of ~160 kg/hr (=350 lblhr).
I The discharge run was ended when the slowest-coollng thermocouple atsalt mid-level reached a temperature of 482"C. Nhen this condition was
I reached, air flow was shut off, air-temperature thermocouples removed, andcharging begun.
I The charging sub-cycle was controlled from a thermocouple located on thesalt-sidv heat-transfer surface at salt mid-level. The charging program was
i designed to bring this location to the holding temperature, 5300C, In underan hour and therafter maintain this temperature throughout the charging period.
A constant-temperature heat source, similar to that expected in commercial
i application, could therefore be simulated, allowing qualitative evaluation of
! •Temperature profiles through the salt obtained during ahakedown runs indicated
that total solidification was achieved at a slightly higher temperature,
I 493°C, at the slowest cooling location.
55 ORIGINALPAGE Ib
m oF PoorQUAIZrVI N $ T I T U T.E O F G A S T E C H N O L O G Y
m [] R N • m,m _ ,,,,,,............ _ -_-'_'_ _ _.._:_,_._._- ____, =_---7--_, Imm •
1978016675-065
3/78 8981
charging performance. The heater temperature was also recorded during charging
in orde: to estimate the heat flux required to maintain this steady-state
condition. Compazison with other temperature and flow requirements could then I
be made if alternate heat sources (such as high-temperature, high-pressure
steam) were used for charging. N
Performance Evaluation
Criteria for Performance Evaluatlon i
Several factors must be considered in evaluatlng the performance of a ss
TES system, each of which has a slgniflc_nt influence on the engineering and
economic feaslbillty of latent-heat energy storage. Although standards for
performance evaluatlon have been established for lower-temperature systems ]I I
(primarily for solar energy applications), standards are not yet available
for high-temperature systems such as that being investigated here. As aw
result, th_ evaluation must be based on the factors must influential on the
performance of a system in a specific application (such as utility load-levellng). ImTherefore, we have selected the following parameters to evaluate the performance
of the TES system being studied:M
• Average discharge heat flux over a discharge run.
• Variation in the discharge heat flux with time during a discharge run. i
• Heat extraction efficiency -- the percentage of the heat available to the
transfer fluid for a given AT and salt mass that is extracted by the
/ transfer fluid.
S@ Storage efficiency -- the percentage of the charging energy recovered by the
transfer fluidduring a discharge run. I
• System stability -- variations in system and materlals behavior resulting
from thermal cycling. I
• Cyclabillty, the capability of the system to be charged and discharged in
the time period required as dictated by the anticipated duty cycles. 0W
Although other factors related to system performance have been considered
and will be discussed brlefly, those mentioned above will provide a strong BM
base for TES feasibility assessment and relative evaluation of design modifi-
cations (such as conductivity enha1_cement or alternate heat exchanger designs). •
|Analysis and evatuation of system performance will be concentrated primarily
on the discharge mode, because the discharge performance appears to be the
!56
I N S T I T U T E O F O A S T E C H N O L O G Y I
"a __ ".__-_._ -'"._-X'CW-.-_ ; __._L_ ! r-,--
1978016675-066
I3/78 8981
ms
I determinant when the feaslblllty of colmercial Implementatlon is considered.
This concluslon is dra_m because the greatest barrier toward cost-effectlve
I system designs hinges on the abillty to extract the stored energy in a time
period which, for most TF_ applications of prlmary interest, will be slgnlfl-
I cantly shorter than the time avallable for charging. Because the chargingtimes are comparatively long and the Inltlal formation of _he hlgher-conductlvlty
B llquid phase occurs closest to the heat source during charging, the thermalm
conductivity of the solid salt (which Is rate contro11Ing during discharging)
i is a less significant factor durlng charging.Evaluatlon of Llg_O 3 Without Conductivity Enhancement (EnRineerln_
I Two englneerlng-scale TES units were operated _rlth LIKCO3 as the P(_
trlthout any conductivity or heat exchange enhancement. The primary goals in
I operating these units vere --
i a. To establish and verify baseline performance characteristics for relativeevaluation of alternate PCH, conductivlty-promotlon, and heat exchangerconcepts.
I b. To provide experimental verification of the mathematlca/ heat-transfermodels developed in Task 2.
I c. To provide first-cut engineering data required for the design of prototypeTES hardware.
The two units were operated for a combined total of 50 cycles representing
I over 2500 hours of operating time. Both units displayed comparable and
reproducible performance, and their coolluS behavior was in close agreement
I with that observed in the laboratory/ TE_ _ystem and predicted _y the heat-transfer model.
I Heat fluxes vere calculated from experimental data with the equation -
q = &cp At/A (36)
I where- ORIGL_AL PAGE Ib
q - heat flux, kJlhr-m2 (Btu/_r-f_) OF _OOR QU_
I _ = air mass flow rats, ks/hr (Ib/hr)
i c = heat capacity of the alr, kJ/kg-'C (Btu/Ib-'F)P
At - alr-temparature differential (tou t -- tin), "C ('F)
I a :)A - heat-transfer area, m (ft
57
I I N $ • I T U • E O F O A S T | C H N O L O O Y
I I 1 "
1978016675-067
3/78 8981
The calculated heat flux is therefore directly proportional to the air-
temperature differential. The locations at which the air temperature was
measured in Unit 1 are shown in Figure 18 as A and A'. The temperature- I
measurement locations included B and B t in Unit 2, because the heat-transfer
area used Co calculate =he heat flux in both units was defined as the portion im
of the central cooling tube in direct contact with the salt, I.e., length BB'.
Average heat fluxes were calculated to be of the order 6000 Btu/hr-ft:, using 8
air-temperature measurements taken at A and A w. Similar calculations using
air temperatures measured at B and B' in Unit 2 resulted in average heat
fluxe_ of 4000 Btu/hr-f_ .
The difference in heat fluxes determined from air-temperature neasurements
made at A and A' and B and B t could result from several factors:
a. Heat transfer occurring in the extended portions of the coollng tube. Theheat available for transfer in these regions Is that which Is stored assenslble heat in the !nsulatlon, or that which can be drawn from the unitby conduction through the container walls, top, and bottom. The thermalconductlvlties of the insulation and steel, and the cross-sectlonal areasof the unit walls and cooling tube could allow enough he,at to be trans-ferred to the extended portions of the cooling tube to account for abouttwo-thlrds of the observed heat flux difference.
b. Different radiation effects on thermocouples. Temperature differentialsmeasured between B and B' are not influenced by radiation, because thermo-couples at these locatlons are affected equally by radiant heating.However, a there,.couple located at A' would indicate a temperature higherthan the actual air temperature, due to radiant heating, whereas a thermo-couple located at A would not be affected by radiation, because It isshielded by the coolant piping. Therefore, higher temperature differentialwould be measured between A and A t.
c. Inlet air temperature at B Is measured with a Type K thermocouple(Chromel-Alumel). Type T thermocouples (copper-constantan), are used atA, A*, and B* and are more accurate at lower temperatures. A Type Kthermocouple had to be used at B because It remains in position duringheating. A Type T thermocouple is not used because of the high temperaturesreached (700°C) in the cooling tube during the heating period. Thermo- 7couples located at A* and B' are not subjected to this heat becausethey are removed during the heating period.
Although each of the last two factors may only make a small difference in
the temperatures recorded at the dlfferent locations, their combined effect
could make a substantial difference In the calculated heat flux. This sensi-
tivity of heat flux is a result of the TES unit design. The heat-transfer
area in the heat excha.,_er portion of the _ooling tube (B B') is s_ll (. I ft_),
_ ORIGINAL PAGE IbOF POOP.QUALITY
I N S T I T U T E O F G A $ T E C H N O L O G Y
1978016675-068
3/78 8981
which results in a small air-temperature differential at the air flow rates
being used. Temperature differences of 1°C measured between A and B, and B'
I and A' combined can result In up to a 20g difference In the calculated heat
flux during the latter stages of the cooling sub-cycle. Thi_ effect is less
pronounced (3Z to 5Z) during the early stages of the cool_ng sub-cycle whenthe At Is large, but compounded over the entire cooling period It can result
in substantial differences in the heat flux calculation.Performance evaluatlonof Unit i is based on air-temperature measurements
I m_de only at locations A and A'. Efficiency and heat flu-_ _s thereforedetermined by heat tr_mfer occurring in both the heat exchanger (of primary
interest) and in the extended portions of the cooling tube,The calculated heat flux will be based on the heat exchanger area (BB'),
because the temperature distribution along the cooling tube sections away fromthe heat exchanger is not known. As a result, the heat flux reported for
Unit 1 _r111 be an apparent value and not the actual flux occurring in the h_at
exchanger. The actual heat flm_ could not be determined for Unlt i because
the appropriate alr temperature _formation was not avallable. However, both
E the apparent and actual heat fluxes were determined in Unit 2, allowing
verification of the performance observed in Unit 1 and providing accurate
heat-transfer information for the TES system.
Unit I Performance -- Heat Flux and Efficiency
I The first engineering TES unlt contained 130 lb of LIKCO 3 and ,as cycled
20 times. After the twentieth cycle, the unit was cooled to room temperature,
the insulation removed, and the unlt inspected. The outside surface of the
conta£_er was oxidized In the typical fashion consistent wlth heating stainless
steel to about 538"C i. air, but no evidence of salt loss by creepage wasvisible. Slight vapor loss was apparent as indicated by discoloration of the
I insulation at the Junction of the sealing flanges. The unlt was only partiallysealed_rltb an aluminum gasket, and the low vapor losses observed show a2h
significant advantage of thls system over systems using fluorides ' asphase-chanseumterials, where hermetic sealing Is required to prevent moisture
absorption and vapor losses. A leak was also detected In the container bottom.
I The exact location of the leak could not b_ determtn,_, but is strongly
suspected to have occurred in the weid around the thermocouple t'ell located
n_ar the cooling tube. Lpprox_ate!y 3.5 lb of salt was lost from the container
59
I N S T I T U T E O F G a S T E C H N O L O G Y
1978016675-069
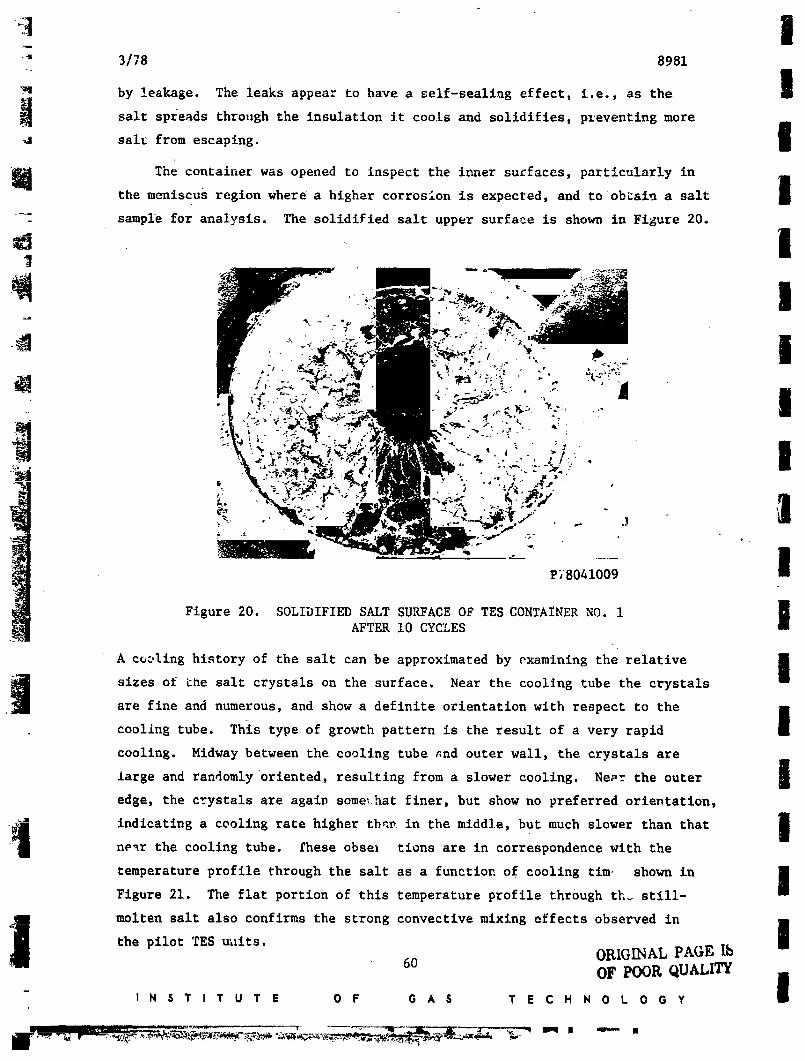
_I
_' 3/78 8981
|by leakage. The leaks appear to have a self-sealing effect, i.e., as the
_I salt spreads through the insulation It cools and solidifies, preventing more I
salt from escaping. I
B The container was opened to inspect the inner sucfaces, particularly in m
|the meniscus region where a higher corrosion is expected, and to obtain a salt
-C sample for analysis. The solidified salt upper surface is shown in Figure 20.
|' " "_&"" E
- ir,' _b
" |
" |P78041009
Figure 20. SOLIDIFIED SALT SURFACE OF TES CONTAINER NO. I BAFTER i0 CYCLES i
A coellng history of the salt can be approximated by examining the relative|
sizes of the salt crystals on the surface. Near the cooling tube the crystalsare fine and numerous, and show a definite orientation with respect to the m
cooling tube. Thls type of growth pattern is the result of a very rapid I
cooling. Midway between the cooling tube _nd outer wall, the crystals are
large and randomly oriented, resulting from a slower cooling. Near the outer
edge, the crystals are agaln some_.hat finer, but show no preferred orlentatlon,
indicating a cooling rate higher thnn in the middle, but much slower than that I
1 near the cooling tube. £hese obsm tions are in correspondence with the
temperature profile through the salt as a function of cooling tim, shown in im
Figure 21. The flat portion of thl8 temperature profile through th_ still-
i molten salt also confirms the strong convective mixing effects observed in
|the pilot TES uuits.
60 ORIGINAL PAG_ IbOF POOR QUALITY
- !INSTITUTE OF GAS TECHNOLOGY
1978016675-070
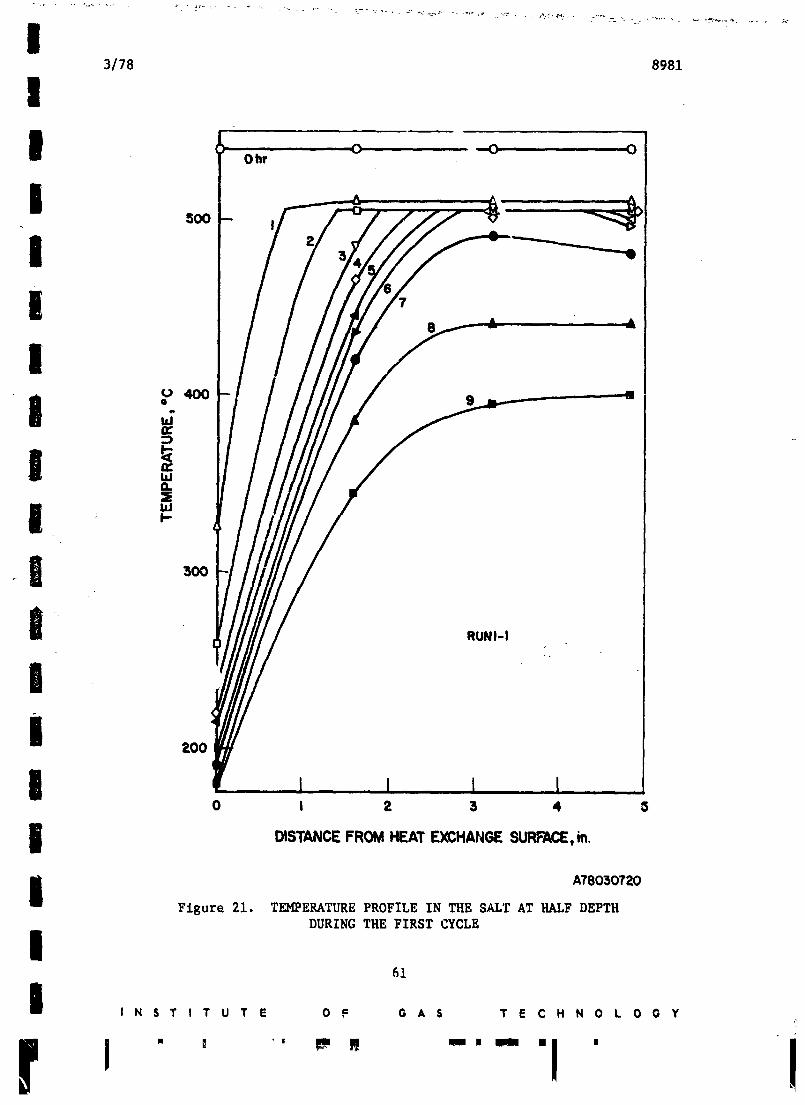
I3/78 8981
II Ohr --C 0
!| . _.
!
:3
Wa.
P
RUNI-I
i 200
I 0 I 2 3 4
i DISTANCEFROMHEATEXCHANGESURFACE,in,
i A78030720Figure 21. TEMPERATURE PROFILE IN THE SALT AT HALF DEPTH
DURING THE FIRST CYCLE
!61
I I N S T I T U T E O F G A S T E C H N O L O G Y
r ' ' "" "-'l I
1978016675-071
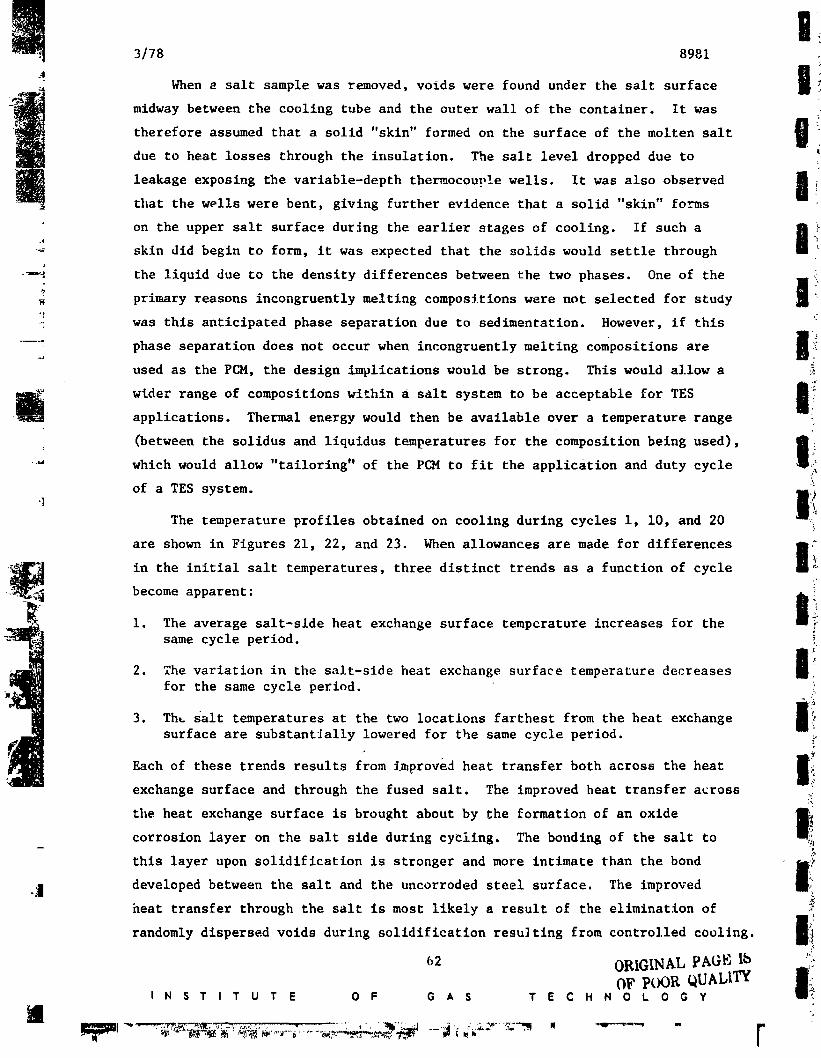
m |3/78 8981
_ When a salt sample was removed, voids were found under the salt surface
i_ midway between the cooling tube and the outer wall of the container. It was
therefore assumed that a solid "skin" formed on the surface of the molten salt IJw,
due to heat losses through the insulation. The salt level dropped due to 4
leakage exposing the varlable-depth thermocoun!e wells. It was also observed II
that the wells were bent, giving further evidence that a solid "skin" forms
on the upper salt surface during the earlier stages of cooling. If such a _ _
' skin did begin to form, it was expected that the solids would settle through []J
_'_ the liquid due to the density differences between the two phases. One of the II_
gprimary reasons incongruently melting compositions were not selected for study"!
-: was this anticipated phase separation due to sedimentation. However, if this ":
phase separation does not occur when incongruently melting compositions are I!
used as the PCM, the design implications would be strong. This would allow a ,$
ili I!_a applications. Thermal energy would then be available over a temperature range
(between the solidus and liquidus temperatures for the composition being used), li
which would allow "tailoring" of the PCM to fit the application and duty cycle _
of a TES system.
The temperature profiles obtained on cooling during cycles I, i0, and 20
are shown in Figures 21, 22, and 23. When allowances are made for differences _
..... in the initial salt temperatures, three distinct trends as a function of cycle _
__ becomeapparent: iiI. The average salt-slde heat exchange surface temperature increases for thesame cycle period.
2. The variation in the salt-side heat exchange surface temperature decreases I_for the same cycle period.
surface are substant_ally lowered for the same cycle period. "_.
Each of these trends results from l_proved heat transfer both across the heat
exchange surface and through the fused salt. The Improved heat transfer across y
tileheat exchange surface is brought about by _he formation of an oxide
corrosion layer on the salt side during cycling. The bonding of the salt to i_-- -_
this layer upon solidification is stronger and more intimate than the bond _
I._ developed between the salt and the uncorroded steel surface. The improved
heat transfer through the salt is most likely a result of the elimination of ,_
randomly dispersed voids during solidification resulting from controlled cooling. I_
52 ORIGINAL PAGE lb _'_P(XDRQUALITY IiiOF
IN $ T IT U T E 0 F G AS T E C H N O L 0 G Y
m
q9780q 8875-072
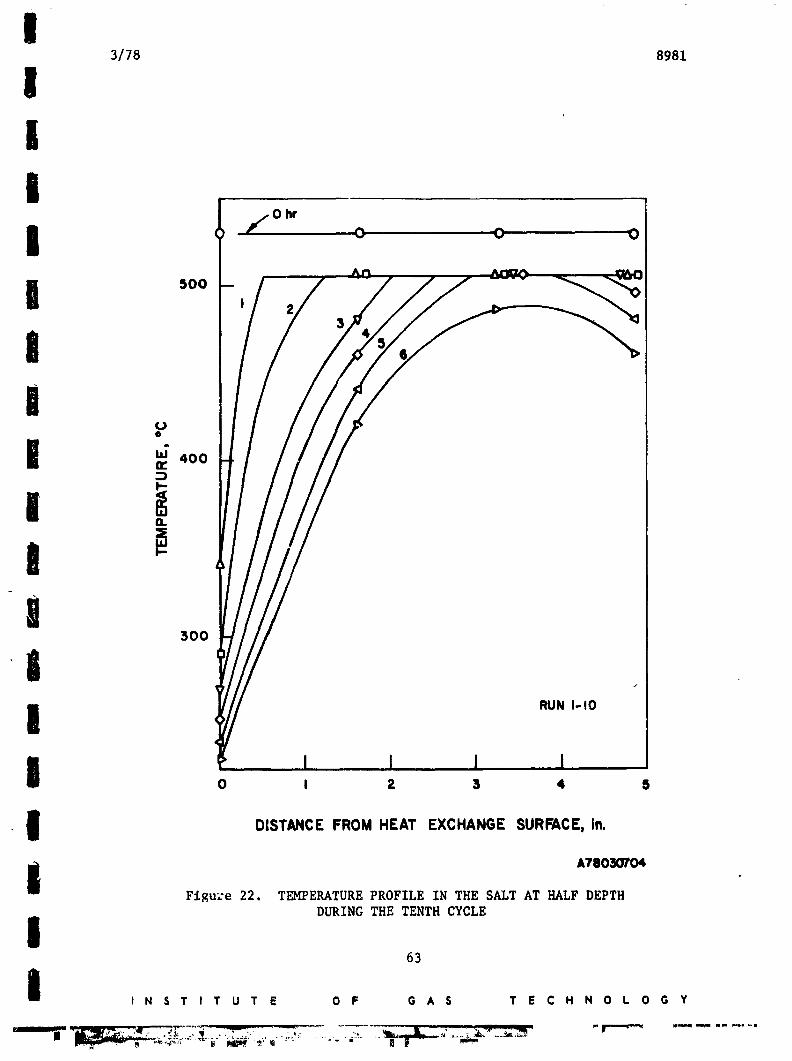
i3/78 8981
!!i
| f ,,.o_. o o oI 500
3
|l
_. 400
B300
lJ
i RUN I-!0
! '0 I 2 3 4 5
I DISTANCE FROM HEAT EXCHANGE SURFACE, in.
A?eO30r04
i Figu_'e 22. TEHPERATUREPROFILE IN THE SALT AT HALFDEPTH
I DURING THE TENTHCYCLE63
I N S T I T U T E 0 F G A S T E C H N 0 L 0 O Y
""I" __;:;;_._.-_ _ . __, _, _.rl--_, _" _ _ ........
1978016675-07:3
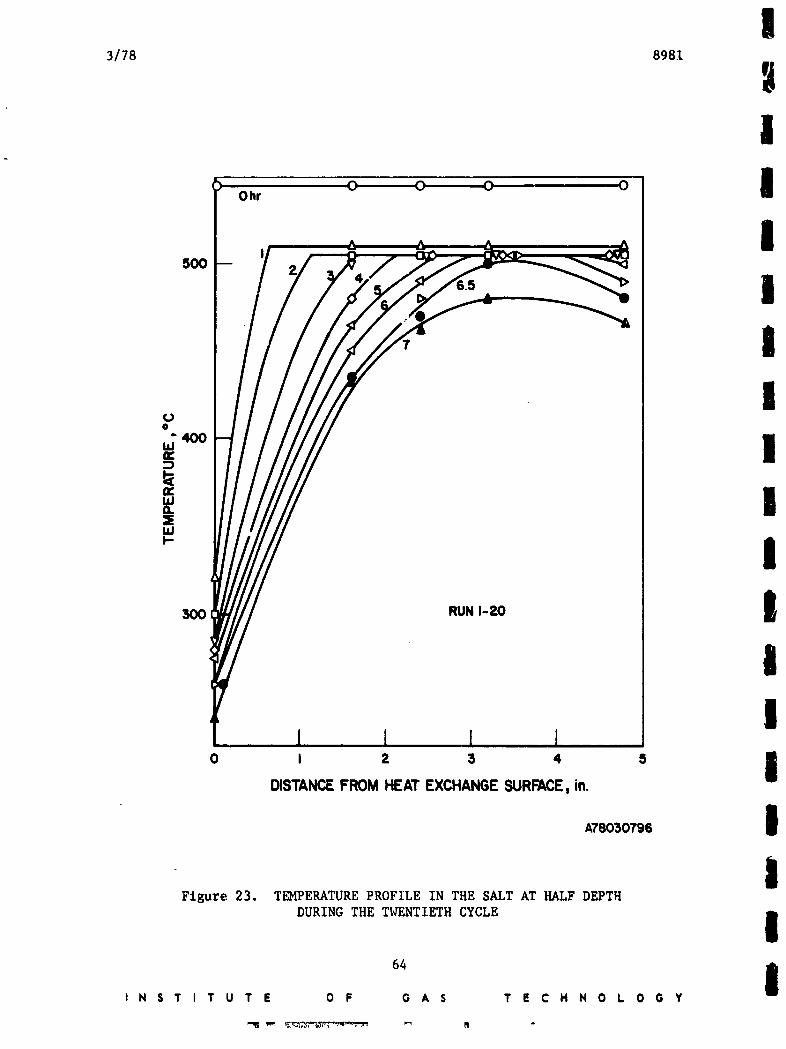
I3/78 8981
!0 0 0 IOhr
.oo !!!
WO.
W
I300 RUN I-ZO I
II
I I I I0 I 2 3 4 5 I
DISTANCE.FROMHEAT EXCHANGESURFACE,in.
A78030796 I
iFigure 23. TEHPERATUREPROFILE IN THE SALT AT HALF DEPTH
DURING THE TWENTIETH CYCLE I
I N S T I T U T E O F G A S T E C H N O L O G Y
1978016675-074
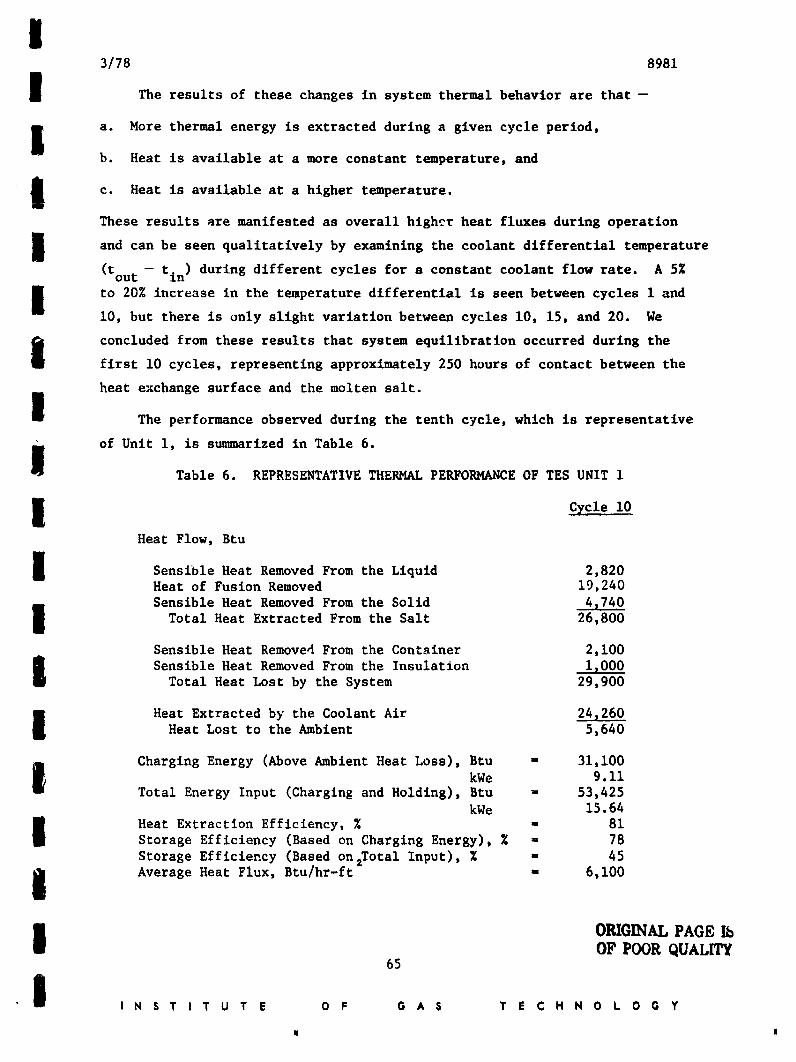
!3/78 8981
I The results of these changes in system thermal behavior are that --
i a. More thermal energy is extracted during a given cycle period,b. Heat is available at a more constant temperature, and
t c. Heat is available at a higher temperature.
These results are manifested as overall higher heat fluxes during operation
I and can be seen qualitatively by examining the coolant differential temperature
(tout --tin) during different cycles for a constant coolant flow rate. A 5%
I to 20% increase in the temperature differential is seen between cycles I and10, but there is only slight variation between cycles I0, 15, and 20. We
I concluded from these results that system equilibration occurred during thefirst i0 cycles, representing approximately 250 hours of contact between the
heat exchange surface and the molten salt.
l The performance observed during the tenth cycle, which is representative
i of Unit I, is summarized in Table 6.Table 6. REPRESENTATIVE THERMAL PERFORMANCE OF TES UNIT i
I Cycle I0
Heat Flow, Btu
I Sensible Heat Removed From the Liquid 2,820Heat of Fusion Removed 19,240
Sensible Heat Removed From the Solid 4z740
I Total Heat Extracted From the Salt 26,800
Sensible Heat Removed From the Container 2,100
I Sensible Heat Removed From the Insulation i_000Total Heat Lost by the System 29,900
I Heat Extracted by the Coolant Air 24,260Heat Lost to the Ambient 5,640
Charging Energy (Above Ambient Heat Loss), Btu - 31,i00
I kWe 9.11Total Energy Input (Charging and Holding), Btu = 53,425
kWe 15.64
I Heat Extraction Efficiency, % - 81Storage Efficiency (Based on Charging Energy), % = 78
Storage Efficiency (Based on,Total Input), % - 45
I Average Heat Flux, Btu/hr-ft - 6,100
I ORIGINALPAGE IbOF POORQUALITXV65
I I N S T I T U T E 0 F G A S T E C H N 0 L O G Y
II I
1978016675-075
|3/78 8981
The heat lost to the ambient during discharge corresponds closely to the I
power drawn during the holding period of the charging sub-cycle (time duringI
which the molten salt is held at a constant temperature, 530"C). This input #
power demand results from heat loss from the charged unit. Distributing the
heat loss (5640 Btu) evenly over the discharge period (5 hr, 20 mln) yields l
an electrlcal equivalent of 310 watts. The observed power drawn during the
holding period varied between 325 and 350 watts. I
The storage efficiency here is determined from two values of the energy
input to the system. The first, termed the charging energy, consists of all II
energy input above the ambient heat loss level as determined by the power
drawn during the holding period. This is shown schematically in Figure 24 as _gthe shaded portion under the power input curve. The second, termed the total
energy input, consists of the charging energy and the heat loss during both
the charging and holding periods. This is shown in Figure 24 as the total
area under the power input curve (shaded area + crosshatched area). The
storage efficiency based on the charging energy is 78%, whereas that based on I
the total energy input is only 45g. The efficiency based on the total energy
input is of primary interest for commercial units, but the value derived here l
on that basis is not a valid approximation applicable to larger units. This
results from the container size and geometry, and the cycle characteristics,las discussed below.
To evaluate the efficiency of the engineerlng-scale unit on the basis 1I
of total energy input is misleading because the ratio of the total surface
area of the insulated unit to the volume of the unit is very large. Theieffect of scale and container geometry on the efficiency can readily be seen
from the heat loss information generated from thls unit. The observed heat l
loss to the ambient during the 5.33-hr discharge period totaled 5640 Btu. The I2
total surface area of the insulated container is 25.5 ft . This leads to a
heat loss rate of 42 Btu/hr-ft 2. Assuming this loss rate to remain constant I
for the insulation and thickness used, regardless of container size, leads to
a total los_ during a 24-hr operating period of - Il
2
ENERGY LOSS - (42 Btu/hr-ft )(24 hr) (A) (37)_J
where A - total surface area of the insulated container, l
!66
mI N S T I T U T E 0 F O A S T E C H N 0 L 0 O _ i
1978016675-076
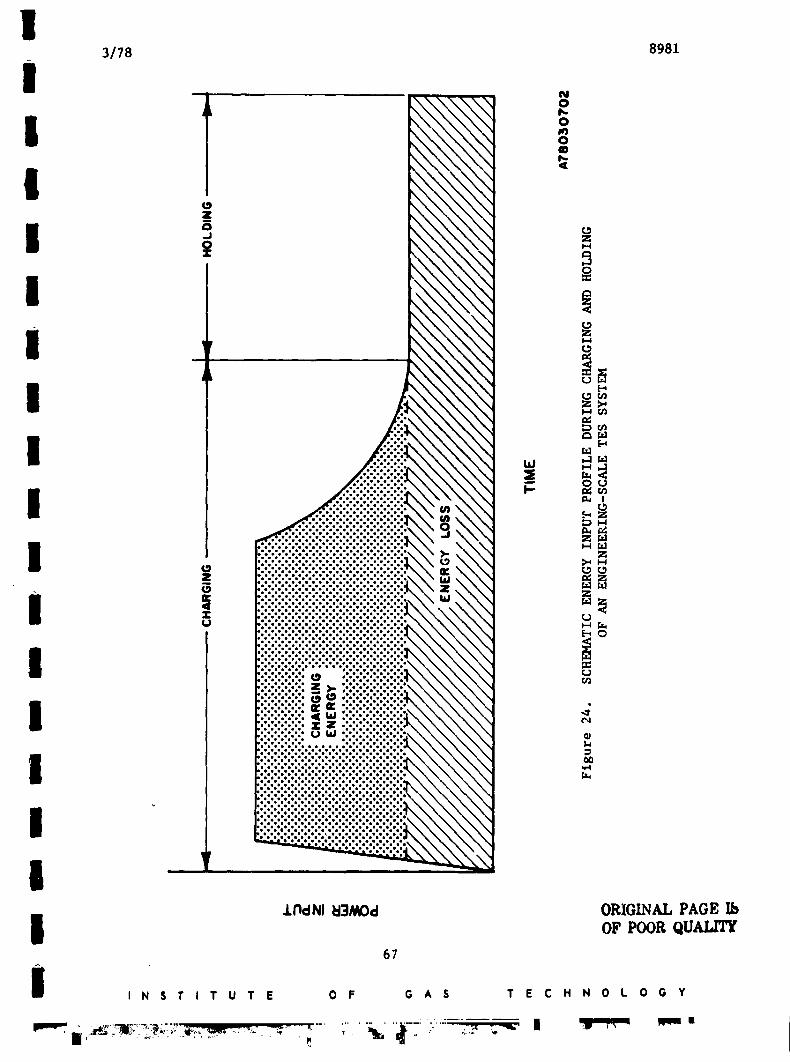
a3/78 8981
am
The capacity of a storage unit can be determined from the volume of the PCM, N
its density, and its heat of fusion by the equation -m
CAPACITY = PodHfV s (38) I
where -- i
Do = density of the PCM
= heat of fusion of the PCM NAHf
V - volume of salt
" NIf it is further assumed that some fraction, fs' of the container volume, Vc,
is occupied by the molten PCM, and the remaining volume by heat exchangers m
and/or void space, Equation 38 becomes -- N
CAPACITY - VcOodHff s (39) |The heat loss can then be determined as a percentage of the storage capacity
by taking the ratio of Equation 37 to Equation 39: DENERGY LOSS
% LOSS - X i00
CAPACITY (40)
(42 Btu/hr-ft_)(24 hr) N= (Vc)(Oo)(AHf)fs (A) X I00 U
Substituting appropriate values for the experimental PCM (LiKCOa; 098gF []
128.2 ib/f_ , AHf - 148 Btu/ib), Equation 40 becomes --E
NZ LOSS = (_'--_)( ) (41)s c
It can be readily seen from Equation 41 that for any given fs' the Z loss l
during a 24-hr period is directly proportional to the ratio of the surface area N
to the container volume. The value of V for the engineering-scale TES unitss
is 0.83 with Vc " 1.18 ft_ and A - 25.5 tt . The ratio of (A/Vc) - 21.6, and
C5.3the Z loss = .0.8y(21.6) - 138%.
The effects of scale on the heat loss are shown in Figure 25. For this Kdiagram, the heat loss during a 24-hr operating period was determined from
Equation 41 for storage units with a height-to-radlus ratio equal to that ofU
the englneerlng-scale unit tested here, but with varying radii and with
V = 0.75. Doubling the size of the container (l-ft radius, 3-ft height) Is Bdecreases the proportion of capacity lost to about 40%. In the capacity rangr
of commercial interst (i-I00 MWhrth), this value is reduced to below 10%. I68
II N $ T I T U T E O F G A S T E C H N 0 t O G Y
_-_ I_ _r mnimm[[m -_. _ i _ ,. _ ....... A _ [_, .. .... _ . ,I,I
1978016675-078
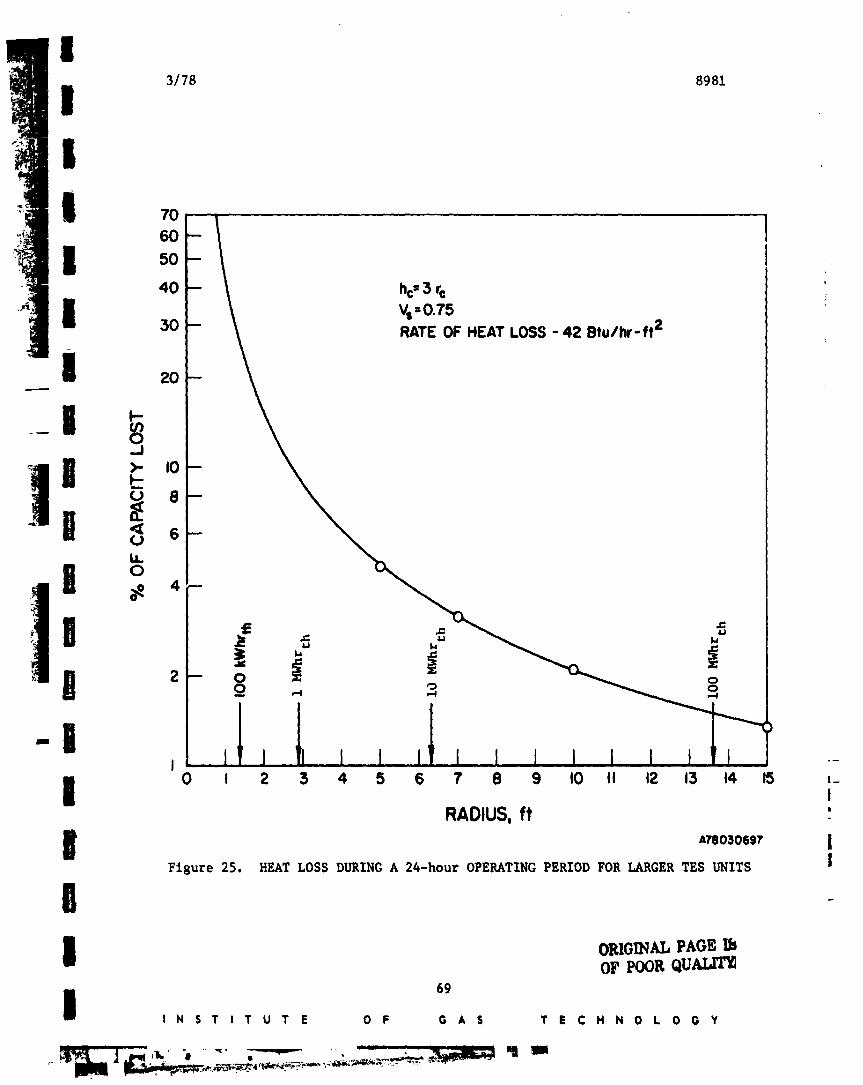
I
I 3/'78 8981
Ii 7O-
60-
I 50-40 - hc= 3 re
V==0.75I 30 - RATEOF HEATLOSS- 42 Btu/hr-ft 2
I 20--
i, i ,°-8--
tlL
!1 °
I-|
i 0 I 2 3 4 5 6 7 8 9 10 II 12 13 14 15 i_IRADIUS,ft
I Am030697 |Figure 25. HEAT LOSS DURING A 24-hour OPERATING PERIOD FOR LARGER TES UNITS |
B
I ORIGINALPAGE IbOF POORQUAI,J_69
I I N S T I T U T E O F G A S T E C H N O L O G Y
1978016675-079
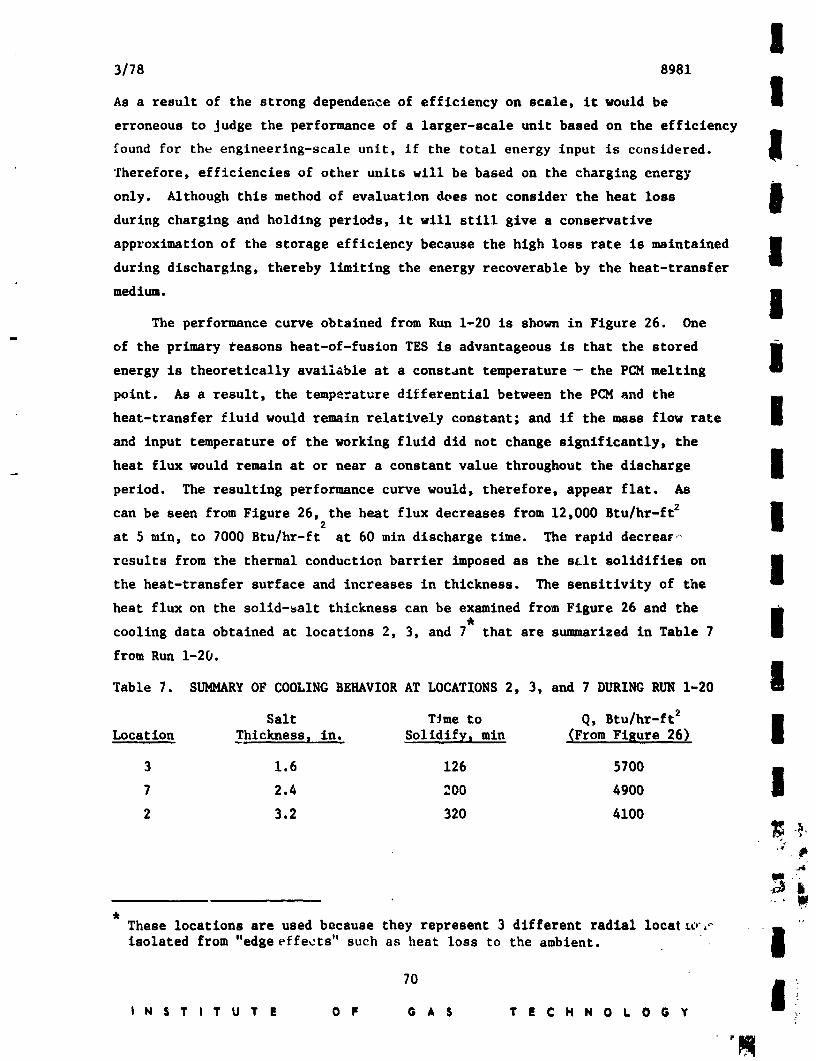
I3/78 8981
a
As a result of the strong dependence of efficiency on scale, it would be I
erroneous to Judge the performance of a larger-scale unit based on the efficiency m
found for the engineering-scale unit, if the total energy input is considered. !
Therefore, efficiencies of other units will be based on the charging energy
only. Although this method of evaluation does not consider the heat loss Iqm
during charging and holdlng periods, it will still give a conservative
approximation of the storage efficiency because the high loss rate is maintained ll
during discharging, thereby limiting the energy recoverable by the heat-transfer
medium, iThe performance curve obtained from Run 1-20 is shown in Figure 26. One
of the primary reasons heat-of-fusion TES is advantageous is that the storedIIenergy is theoretically available at a constant temperature -- the POMmelLing
point. As a result, the temperature differential between the PCM and the mheat-transfer fluld would remain relatlvely constant; and if the mass flow rate l
and input temperature of the working fluid did not change significantly, the
heat flux would remain at or near a constant value throughout the discharge i
period. The resulting performance curve would, therefore, appear flat. As
can be seen from Figure 26, the heat flux decreases from 12,000 Btu/hr-ft z R2 I
at 5 min, to 7000 Btu/hr-ft at 60 min discharge time. The rapid decreaE.-
results from the thermal conduction barrier imposed as the s_It solidifies on
the heat-transfer surface and increases in thickness. The sensitivity of the
heat flux on the solld-salt thickness can be examined from Figure 26 and the m
|cooling data obtained at locations 2, 3, and 7 that are summarized in Table 7
from Run 1-20.II
Table 7. SUt_La.RYOF COOLING BEHAVIOR AT LOCATIONS 2, 3, and 7 DURING RUN 1-20 a
Salt TJme to Q, Btu/hr-ft2 B
Location Thlckness_ in. Solidify, mln (From Figure 26) |3 1.6 126 5700 m7 2.4 200 4900
2 3.2 320 4100
/.
These locations are used because they represent 3 different radial locatt_",_ m '"
isolated from "edge effects" such as heat loss to the ambient. I
70
i N S T i T U T E O F G A S T E C H N O L O G Y _
'ml
1978016675-080
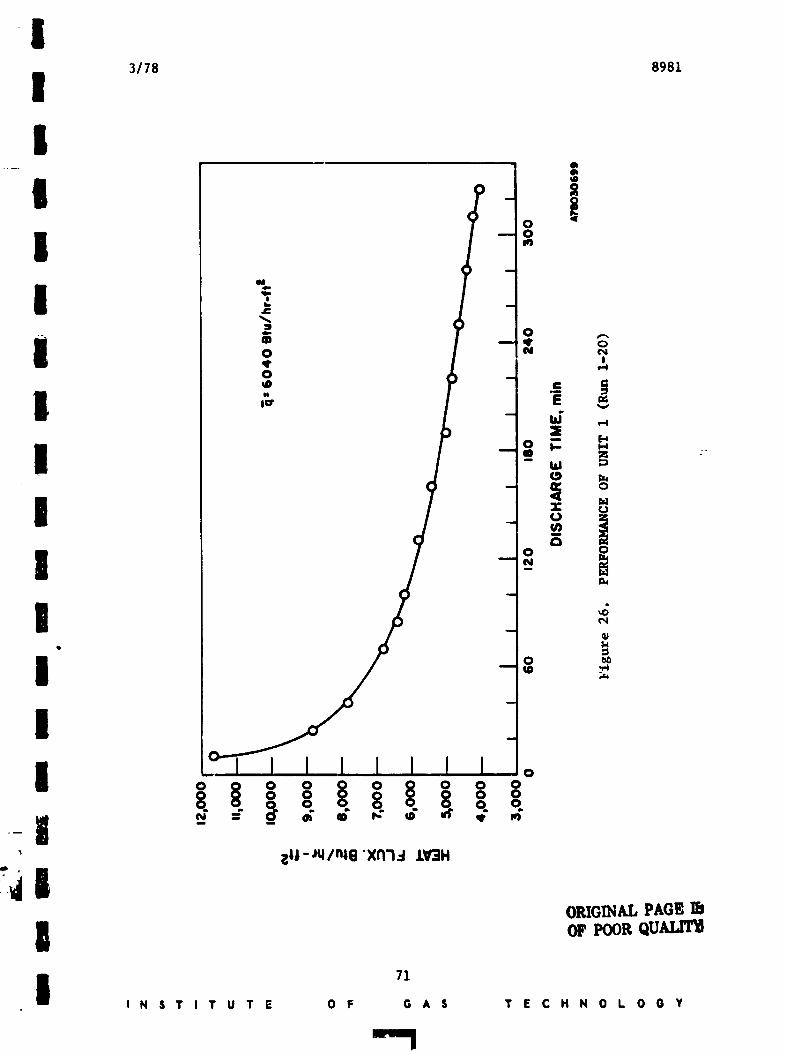
II 3/78 8981
!
i i
o!
- _
| o _
I
i 71I N S T I T U T E O F G A S T E C H N 0 L 0 O Y
1978016675-081
I3/78 8981
ml
The heat flux is shown in Figure 27 as a function of solid-salt thickness, I
and shows a llnear relatlonship. The slope of th_ line shows a decrease in Is
the heat flux of 1000 Btu/hr-ft 2 per inch solid salt. Although the zelattcnship I
holds true after two hours of cooling, it does not appear accurate during the
earlier stages of discharging. Extrapolating to time = 0 would indicate a l
heat flux of 7300 Btu/hr-ft 2 The observed value, wblch is > 12,000 Btu/hr-ft 2M
indicates an even higher sensitivity during the initial coolxng period• These Ig
results indicate strongly the need for conductivity enhancement or the develop-
merit of active heat exchangers. If the performance curve cannot be flattened _
|by one of these methods• steady-state heat transfer can only be achieved by
varylng the working fluid flow rates or entering temperature, which would lead m
to mere complex and expensive system deslgn.
After establishlng basellz,e performanc characteristics• the first unit II
was operated above the design temperature to evaluate its influence on I
performance. Operating from a higher starting temperature may be advantageous
because of the further utilization of the sensible heat storage capacity of I
molten salt and the subsequent increase in system capacity. Broadening the
system operating temperature range without altering performance would also Immake the system more compatible with variations in the duty cycle or the
amount of energy available for storage. Run 1-15 was initiated from a startingMsalt temperature of 575°C, apprc :imately 45°C above the design temperature.
The storage capacity was increased by about 3400 Btu, or about 12.5%. The I[I
performance curve obtained is shown in Figure 28, with the performance curve
from Run 1-20 operated from the design temperature for conpar!son. Operating m
from the higher temperature resulted in an increase in the discharge heat flux i
during the first 85 minutes of discharging, after which the performance
appears nearly identlcal to that when the system is operated from the design I
temperature.
the first 85 minutes most of the heat removed is senslble; thereforeDuring
the solld-salt thickness increases only slightly due to latent heat removal.
As a result higher heat fluxes are obtained because of the larger drivingItl
for_e due to the higher temperature differential (between the sal_ and the
bedt exchange fluid) and a lower resistance due to a thinner solidified salt
iayer on the salt side of the heat exchanger tube.
72
I N S T I T U T E O F G A S T E C H N 0 L 0 0 Y E
l ' aim _,
1978016675-082
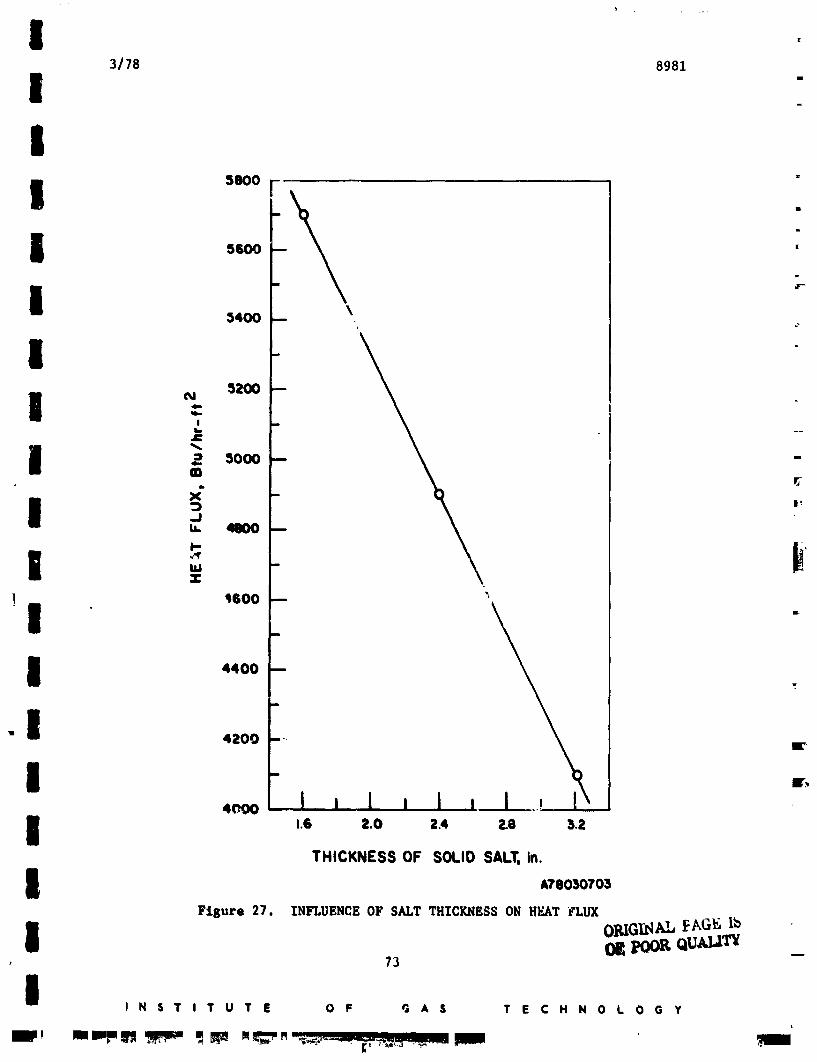
I [
3/78 8981 l1
I
I 560O •
\541111 _
.2
I -N 52I_ --! -
,g
! -:) 5000 -- -
mx"
I _ I_--I
II **IMZ
I *,600 --
II 4400 --
m
I 4200 --, IL-
l
4r_oo I , I I I , ....
THICKNESS OF SOLID SALT, in.
I A780_10703Figure 27. INFLUENCE OF SALT THICKNESS ON HEAT 'r'Lb_
I O]:I,IGI_IAL fAG_ tbo_ poor o_ _73
I I N S T I T U T E O F G A S T E C H N O L O G Y
1978016675-083
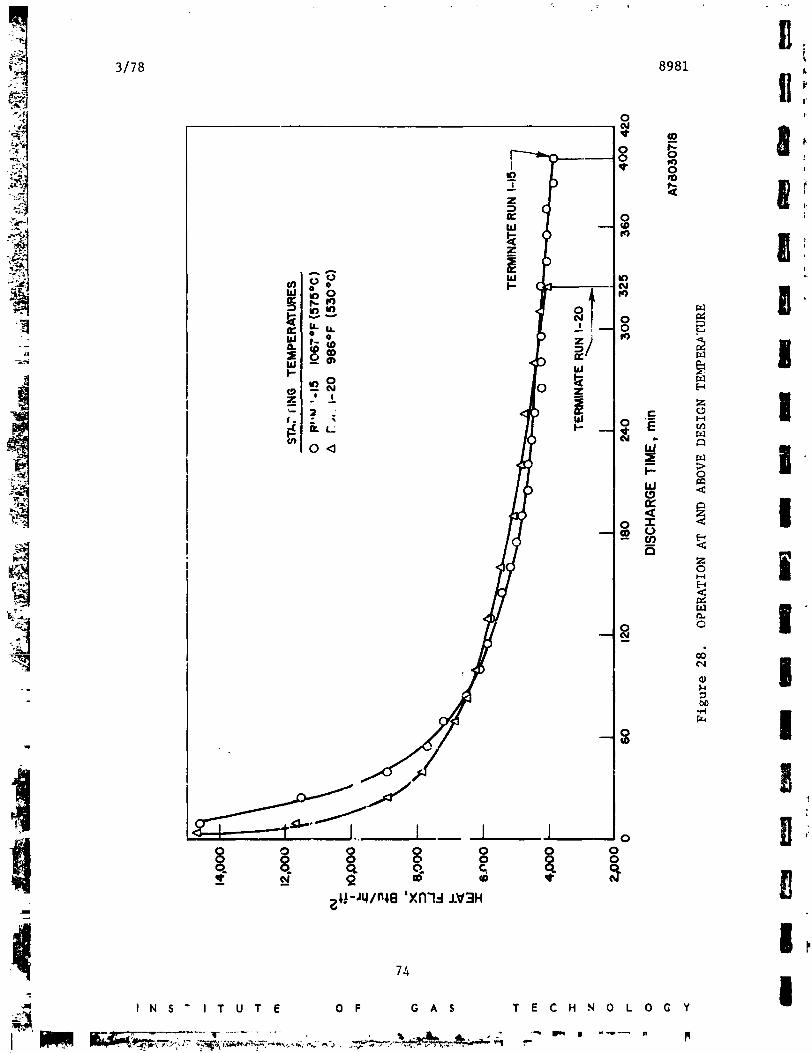
!3/78 8981
I This hypothesis seems to be supported by the duration of the enhanced
heat flux observed in Run 1-15. After 90 minutes of discharging, the molten
I salt has been cooled to a uniform temperature of 505°C, the melting point.
The heat flux enhancement disappears after about 85 minutes of discharging.
I The concept that sensible heat "displaces" latent heat and subsequently
inhibits interracial movement during cooling is also supported by these results.
l runs were terminated when nearly identical thermal conditions throughBoth
the salt were reached. As can be seen in Figure 28, an additional 75 minutes
a was required in Run 1-15. Since the same amount of energy was extracted inthe form of latent heat and sensible heat removed from the solid, the difference
l in discharge times results from the different quantities of sensible heatstored in the liquid phases. If this "excess" sensible heat delays the removal
of latent heat until the end of the cycle, it would be evidenced by a longer
i discharge time, which is calculable. The heat flux after 325 minutes of
discharging (the time required to discharge the unit, starting from the design
l 2 _temperature) is about 41C0 Btu/hr-ft , which corresponds to energy removal
at the rate of --
B (4100 Btu/hr-ft2)(0.72 ft2) = 2950 Btu/hr (42)
The additional 3400 Btu of excess sensible heat in the form of latent heat
I would require --
(3400 Btu)/(2950 Btu/hr) = 1.15 hr (43)or 69 min to be removed. This value agrees well with the 75 min observed.
ORIGINALPAGEUnit i Stability and Cyclability OF POOROUAI,flT
The first unit was in operation for a total of Ii00 hours; and although :
| -this is a short period with respect to desired system lifetimes (> 44,000 hr),
the performance stability observed is encouraging. The effect On the averageL
I discharge heat flux of passlng through the 20 cycles completed with this unitis shown in Figure 29. As observed in the laboratory unit (discussed under ,
I Task 2), the heat flux appears to increase during the initia'i cycling, butremains relativeAy constant after 7 cycles have been completed. This effect
most likely results from enhanced contact between the salt and the salt-side
I heat-transfer surface brought about hy slight oxidation of the neat-transfer
surface during oper,'_ion. After the completion of 7 cycles, the time required
I discharge unit also to an average of 5 hours and 40 minutes.to the stabilized
75
l I N S T I T U T E O F G A $ T E C H N 0 L 0 O Y
1978016675-085
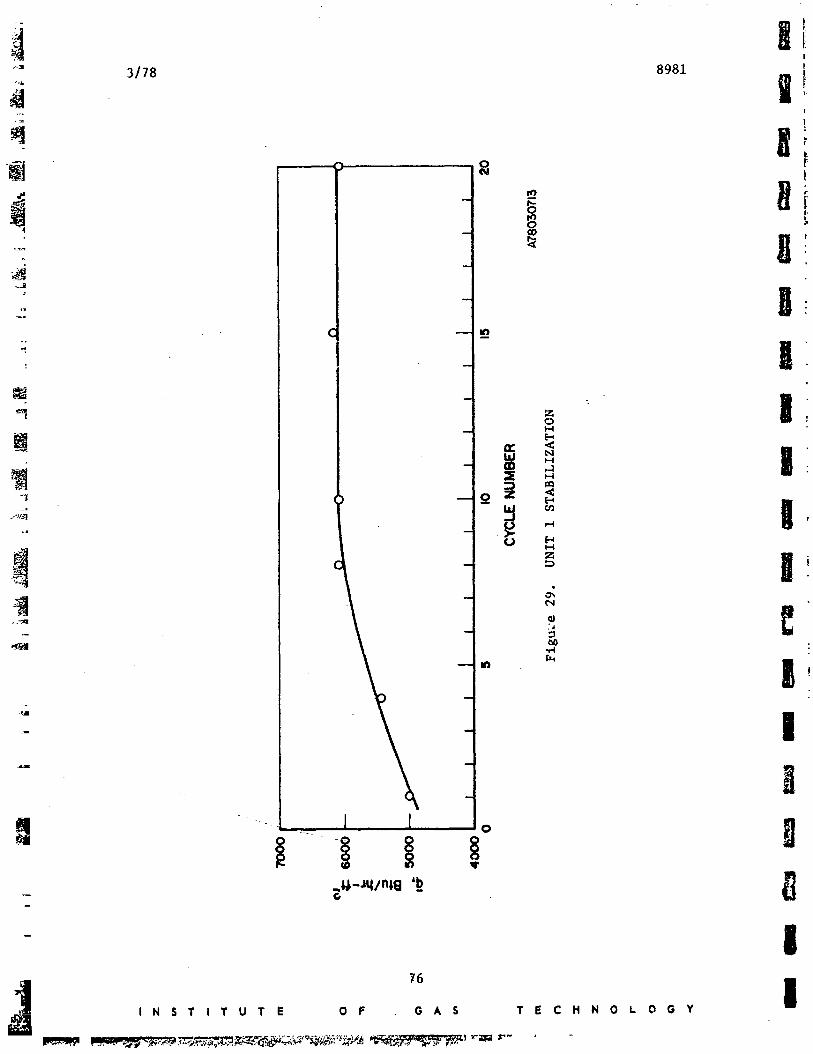
°.
,,._ |
J,,1 |
3/78 8981 _ I_
i,
J
C _ __
_ z0
N __ _ |"
U _I-..4
_ _
" |
- a
.o-Jqln_8 'b-- G
- I
t I N $ T I T U T E O F G A S T E C H N 0 k 0 G Y
1978016675-086
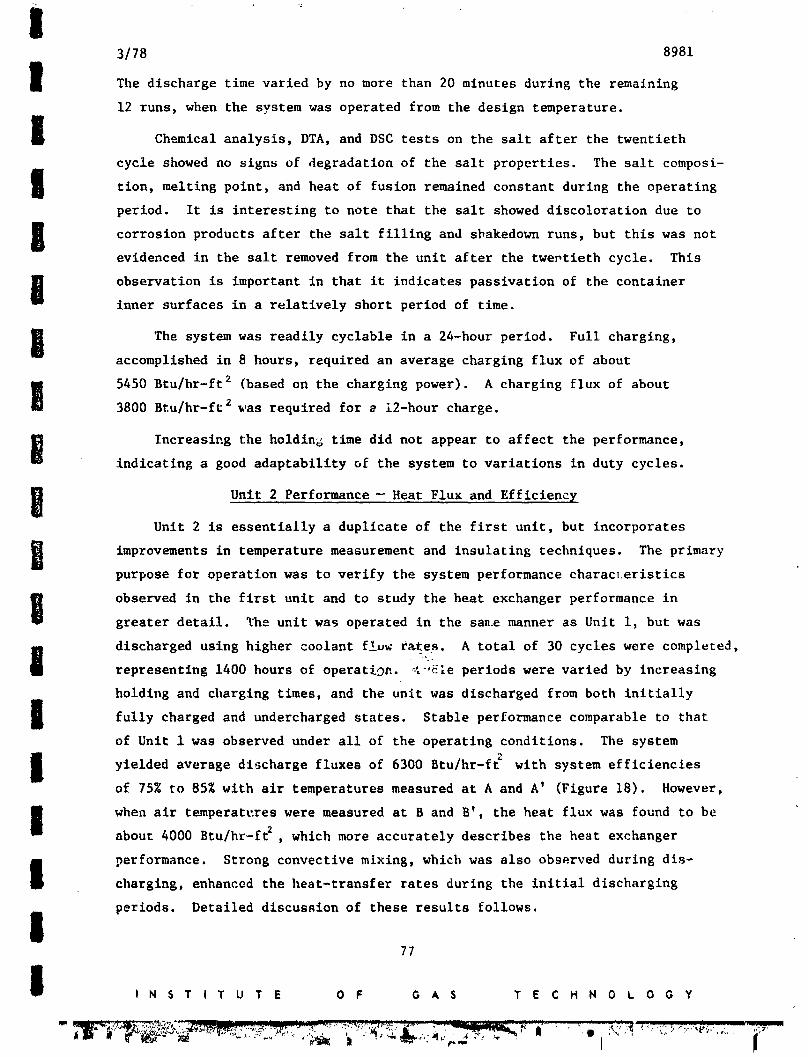
i3/78 8981
I The discharge time varied by no more than 20 minutes during the remaining
12 runs, when the system was operated from the design temperature.
I Chamlcal analysis, DTA, and DSC tests on the salt after the twentieth
cycle showed no signs of degradation of the salt properties. The salt composi-
I tion, melting point, and heat of fusion remained constant during the operating
period. It is interesting to note that the salt showed discoloration due to
I corrosion products after the salt filling and shakedown runs, but this was notevidenced in the salt removed from the unit after the twePtieth cycle. This
observation is important in that it indicates passivation of the containerinner surfaces in a relatively short period of time.
l The system was readily cyclable in a 24-hour period. Full charging,accomplished in 8 hours, required an average charging flux of about
i 5450 Btu/hr-ft 2 (based on the charging power). A charging flux of about3800 Btu/hr-ft 2 was required for _ 12-hour charge.
Increasing the holding time did not appear to affect the performance,indicating a good adaptability of the system to variations in duty cycles.
D Unit 2 Performance - Heat Flux and Efficiency
Unit 2 is essentially a duplicate of the first unit, but incorporates
improvements in temperature measurement and insulating techniques. The primarypurpose for operation was to verify the system performance characteristics
l observed in the first unit and to study the heat exchanger performance Ingreater detail. The unit was operated in the sa,.emanner as Unit i, but was
i discharged using higher coolant f!uw r_tes. A total of 30 cycles were completed,representing 1400 hours of operation. _-,_e periods were varied by increasing
holding and charging times, and the unit was discharged from both initially
I fully charged and undercharged states. Stable performance comparable to that
of Unit i was observed under all of the operating conditions. The system
I yielded average discharge fluxes of 6300 Btu/hr-f_ wlth system efficlenciesof 75% to 85% with air temperatures measured at A and A' (Figure 18). However,
I when alr temperatures were measured at B and B', the heat flux was found to beabout 4000 Btu/hr-f_ , which more accurately describes the heat exchanger
i performance. Strong convective mixing, which was also observed during dls-charging, enhanced the heat-transfer rates during the initial discharging
periods. Detailed discussion of these results follows.
!77
I i N S T i T U T E O F G A S T E C H N O L O G Y
i i _It.. _ . I _j ......
1g78018875-087
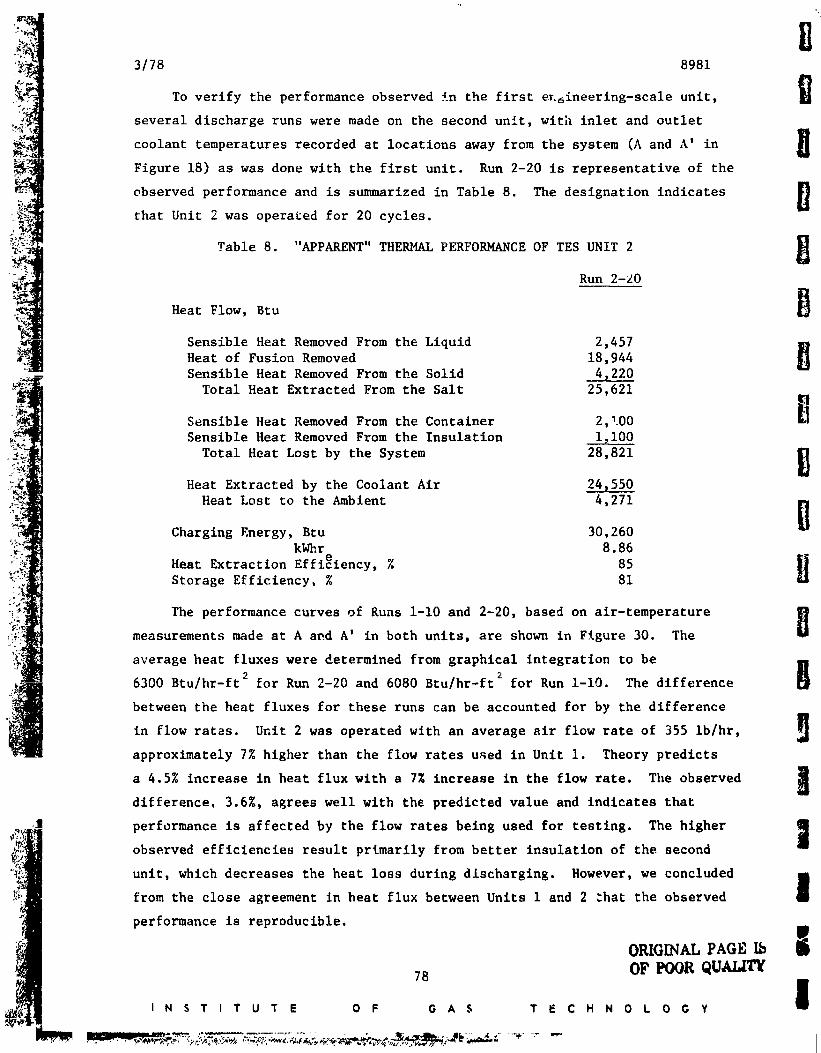
3/78 8981JmL
To verify the performance observed in the first eT.6ineering-scale unit,
several discharge runs were made on the second unit, with inlet and outlet
coolant temperatures recorded at locations away from the system (A and A' in
Figure 18) as was done with the first unit. Run 2-20 is representative of the
observed performance and is summarized in Table 8. The designation indicates ff
that Unit 2 was operated for 20 cycles.
Table 8. "APPARENT" THERMAL PERFORMANCE OF TES UNIT 2i
Run 2-20
Heat Flow, Btu B
Sensible Heat Removed From the Liquid 2,457Heat of Fusion Removed 18,944Sensible Heat Removed From the Solid 4,220
Total Heat Extracted From the Salt
Sensible Heat Removed From the Container 2,1.00
Sensible Heat Removed From the InsulationTotal Heat Lost by the System 28,821
i Heat Extracted by the Coolant Air 24,550
Heat Lost to the Ambient 4,271U
Charging Energy, Btu 30,260kWhr 8.86
Heat Extraction EffiCiency, % 85 ilStorage Efficiency, % 81
The performance curves of Runs i-I0 and 2-20, based on air-temperatureUmeasurements made at A and A' in both units, are shown in Figure 30. The
average heat fluxes were determined from graphical integration to be R
6300 Btu/hr-ft 2 for Run 2-20 and 6080 Btu/hr-ft e for Run i-i0. The difference Bbetween the heat fluxes for these runs can be accounted for by the difference
in flow rates. Unit 2 was operated with an average air flow rate of 355 ib/hr,
approximately 7% higher than the flow rates used In Unit I. Theory predicts
a 4.5% increase in heat flux with a 7% increase in the flow rate. The observed
difference, 3.6%, agrees well with the predicted value and indicates that
3 performance is affected by the flow rates being used for testing. The higher ID
observed efficiencies result primarily from better insulation of the second
unit, which decreases the heat loss during discharging. However, we concluded 1
|from the close agreement in heat flux between Units i and 2 _hat the observed
performance is reproducible.m
ORIGINAL PAGE •
78 OF POOR QUAIa'TY
.HsT.TuT, oF TC.,OLOC, I
1978016675-088
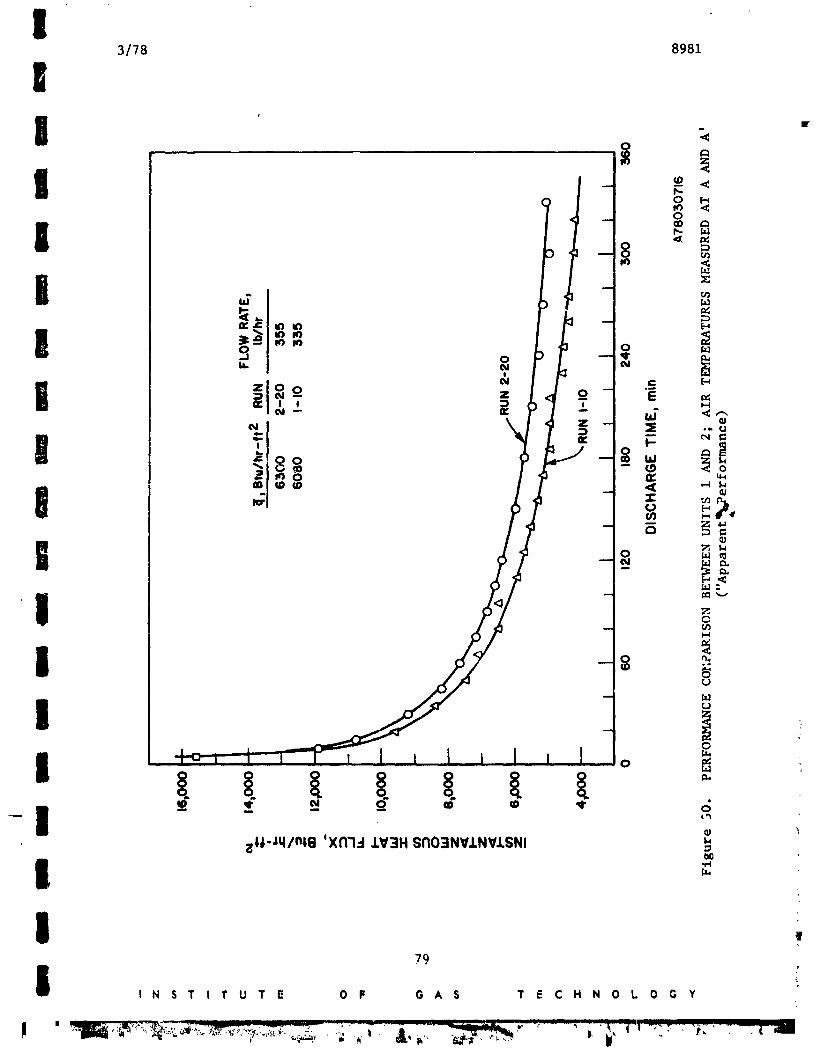
I3/78 8981
n
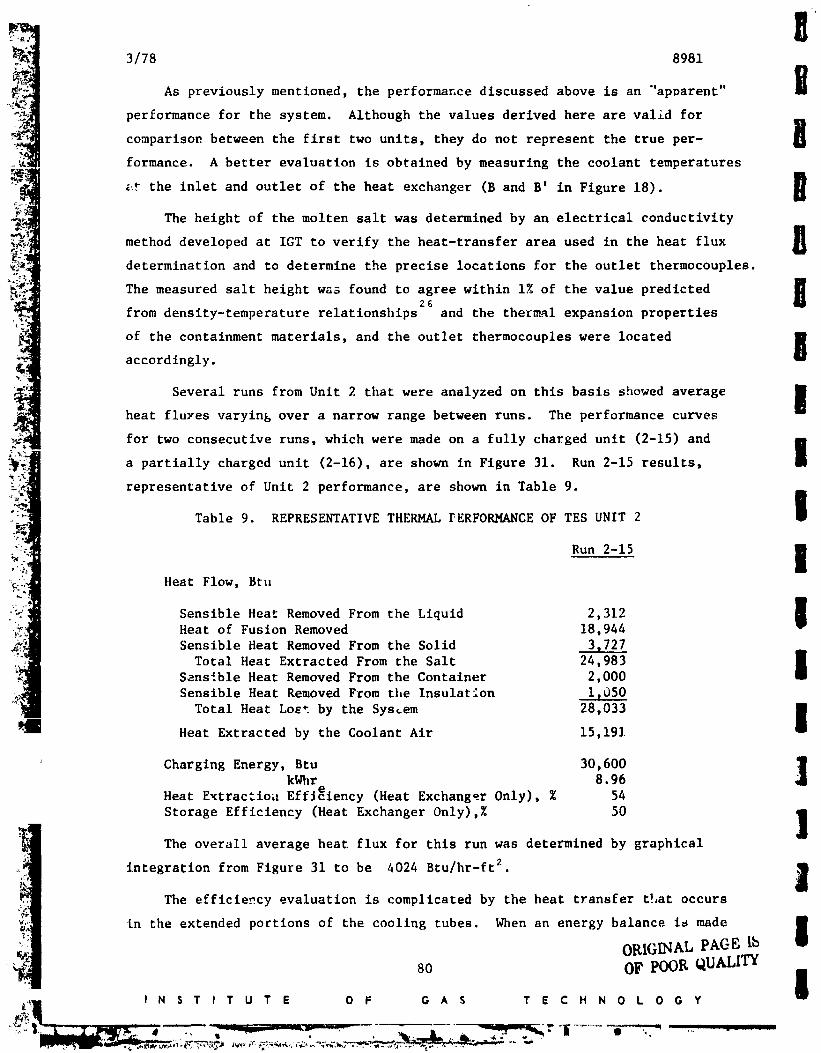
g3/78 8981
As previously mentioned, the performance discussed above is an "'apparent" H
performance for the system. Although the values derived here are valid for
comparison between the first two units, they do not represent the true per- O
formance. A better evaluation _s obtained by measuring the coolant temperaturesm
_ the inlet and outlet of the heat exchanger (B and B' in Figure 18). g
The height of the molten salt was determined by an electrical conductivity
method developed at IGT to verify the heat-transfer area used in the heat flux H
determination and to determine the precise locations for the outlet thermocouples.
The measured salt height wa3 found to agree within 1% of the value predicted H26 J
from denslty-temperature relationships and the thermal expansion properties
of the containment materials, and the outlet thermocouples were locatedm
accordingly.
Several runs from Unit 2 that were analyzed on this basis showed average H6
heat flu_es varying over a narrow range between runs. The performance curves
_ for two consecutive runs, which were made on a fully charged unit (2-15) and H
!!_ a partially charged unit (2-16), are shown in Figure 31. Run 2-15 results, ,,
representative of Unit 2 performance, are shown in Table 9. iTable 9. REPRESENTATIVE THERMAL rERFORMANCE OF TES UNIT 2 J
Run 2-15 iHeat Flow, Btu
Sensible Heat Removed From the Liquid 2,312 HHeat of Fusion Removed 18,944
v
Sensible Heat Removed From the Solid 3,727
Total Heat Extracted From the Salt 24,983 •Sensible Heat Removed From the Container 2,000 g
Sensible Heat Removed From the Insulation 1,050
Total Heat Lo_t by the System 28,033 •
Heat Extracted by the Coolant Air 15,19]|
Charging Energy, Btu 30,600 1k_ir 8.96
Heat Extrac:io;l EffiCiency (Heat Exchanger Only), % 54
Storage Efficiency (Heat Exchanger Only),% 50 1&
The overall average heat flux for this run was determined by graphical
integration from Figure 31 to be 4024 Btu/hr-ft 2.g
The efficiency evaluation is complicated by the heat transfer tLat occurs
in the extended portions of the cooling tubes. When an energy balance is made Hg
OR|G[NAL PAGE Lb
80 OF POOR _UALITY |I N S T I T U T E O F G A $ T E C H N O L 0 G Y
]9780]6675-090
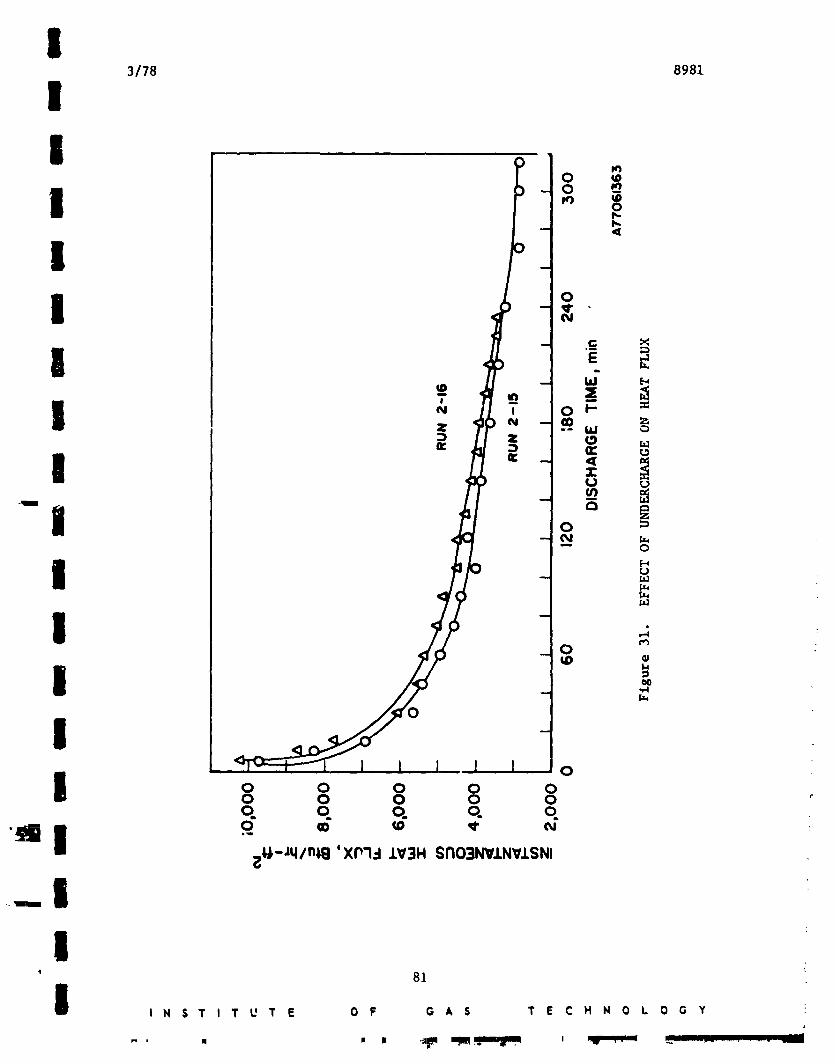
!3/78 8981
I
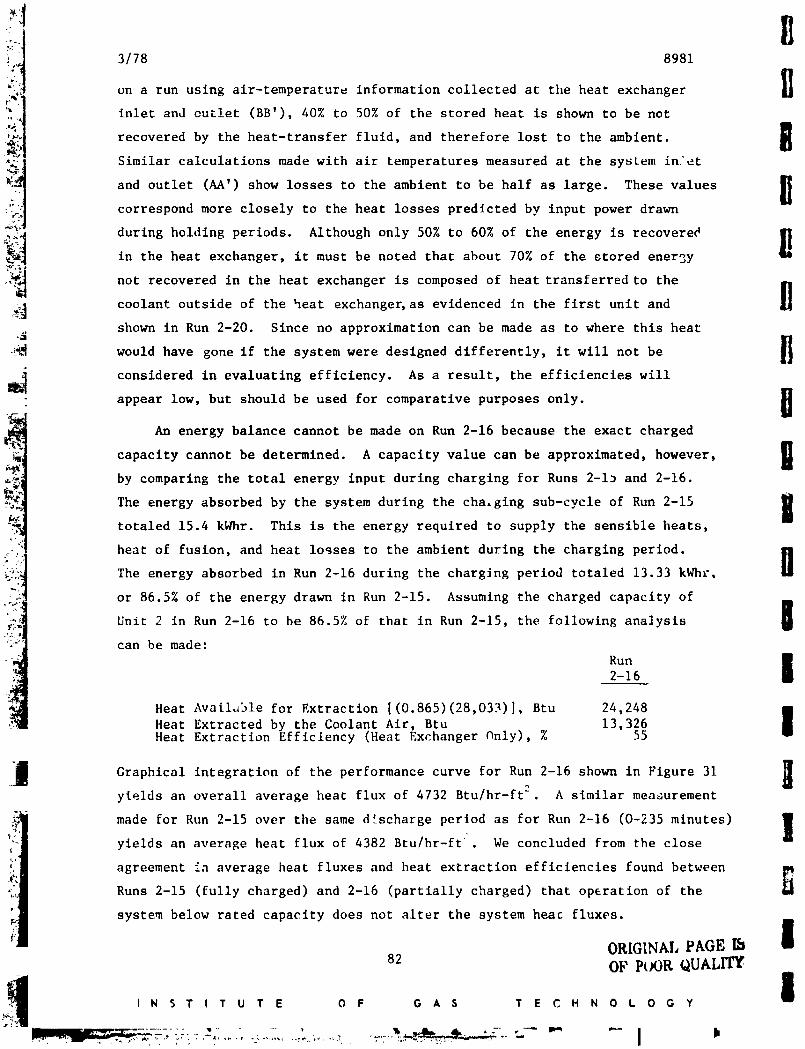
3/78 8981411
on a run using air-temperature information collected at the heat exchanger
ilil inlet and outlet (BB'), 40% to 50% of the stored heat is shown to be not ..Rrecovered by the heat-transfer fluid, and therefore lost to the ambient.
i__| Similar calculations made with air temperatures measured at the system in'et
and outlet (AA') show losses to the ambient to be half as large. These values
correspond more closely to the heat losses predicted by input power drawn
_ during holding periods. Although only 50% to 60% of the energy is recovered
in the heat exchanger, it must be noted that about 70% of the stored enerzy
i_' not recovered in the heat exchanger is composed of heat transferred to the _]u_4 U_I coolant outside of the heat exchanger, as evidenced in the first unit and
shown in Run 2-20. Since no approximation can be made as to where this heat
would have gone if the system were designed differently, it will not be
considered in evaluating efficiency. As a result, the efficiencles will im
appear low, but should be used for comparative purposes only.
An energy balance cannot be made on Run 2-16 because the exact charged
capacity cannot be determined. A capacity value can be approximated, however, Uire
by comparing the total energy input during charging for Runs 2-i_ and 2-16.
The energy absorbed by the system during the cha_ging sub-cycle of Run 2-15 ii
totaled 15.4 kWhr. This is the energy required to supply the sensible heats,
heat of fusion, and heat lo_ses to the ambient during the charging period.UThe energy absorbed in Run 2-16 during the charging period totaled 13.33 kWhr,
or 86.5% of the energy drawn in Run 2-15. Assuming the charged capacity of m
Unit 2 in Run 2-16 to he 86.5% of that in Run 2-15, the following analysis Q
can be made:
Run J2-16
Heat AvaiLable for Extraction [(0.865)(28,033)], Btu 24,248 •Heat Extracted by the Coolant Air, Btu 13,326 |Heat Extraction Efficiency (Heat Exchanger Only), % 55
-i_ Graphical integration of the performance curve for Run 2-16 shown in Figure 31 _yle]ds an overall average heat flux of 4732 Btu/hr-ft z. A similar measurement
made for Run 2-15 over the same discharge period as for Run 2-16 (0-235 minutes)l
yields an average heat flux of 4382 Btu/hr-ft '_. We concluded from the close
agreement in average heat fluxes and heat extraction efficiencies found between
Runs 2-15 (fully charged) and 2-16 (partially charged) that operation of the
system below rated capacity does not alter the system heac fluxes.
OR[GLNAL PAGE i%82 OF P_OR QUALrTM
_,_J I N S T I T U T E O F G A S T E C H N O L O G Y J
1978016675-092
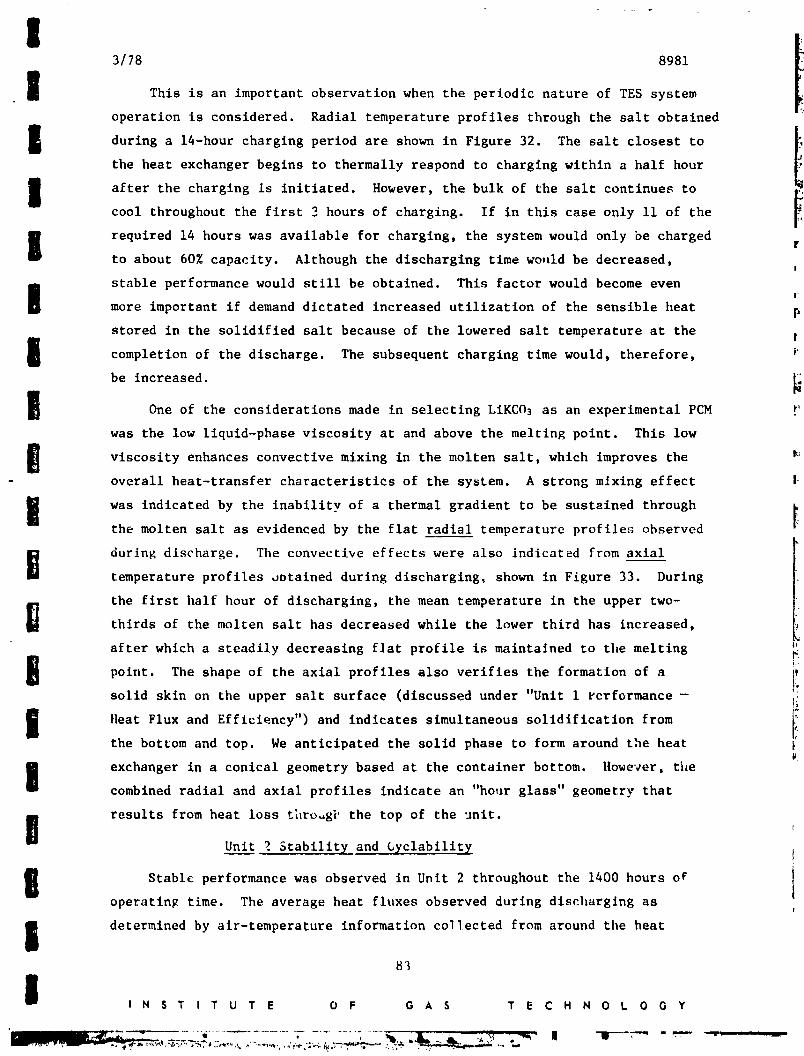
I 3/78 8981 II This is an important observation when the periodic nature of TES system
operation is considered. Radial temperature profiles through the salt obtained
I during a 14-hour charging period are shown in Figure 32. The salt closest to
lthe heat exchanger begins to thermally respond to charging within a half hour
I after the charging is initiated. However, the bulk of the salt continues tocool throughout the first 3 hours of charging. If in this case only ii of the
I required 14 hours was available for charging, the system would only be charged rto about 60% capacity. Although the discharging time wo,ld be decreased,
stable performance would still be obtained. This factor would become evenmore important if demand dictated increased utilization of the sensible heat
stored in the solidified salt because of the lowered salt temperature at the r
I completion of the discharge. The subsequent charging time would, therefore,
be increased.
l One of the considerations made in selecting LiKCO3 as an experimental PCM r,
was the low liquid-phase viscosity at and above the melting point. This low
viscosity enhances convective mixing in the molten salt, which improves theoverall heat-transfer characteristics of the system. A strong mixing effect I
l was indicated by the inability of a thermal gradient to be sustained throughthe molten salt as evidenced by the flat radial temperature profiles observed
during dlscharge. The convective effects were also indicated from axialtemperature profiles obtained during discharging, shown in Figure 33. During
the first half hour of discharging, the mean temperature in the upper two-
thirds of the molten salt has decreased while the lower third has increased,
after which a steadily decreasing flat profile is maintained to the melting _'E
point. The shape of the axial profiles also verifies the formation of a
solid skin on the upper salt surface (discussed under "Unit i _crformance - !_
Neat Flux and Efficiency") and indicates simultaneous solidification from Igm
the bottom and top. We anticipated the solid phase to form around the heat !
I exchanger in a conical geometry based at the container bottom. However, thecombined radial and axial profiles indicate an "hour glass" geometry that
j results from heat loss thro_gi' the top of the unit.Unit 2 Stability and Cyclability
Stable performance was observed in Unit 2 throughout the 1400 hours ofoperating time. The average heat fluxes observed during discharging as
I determined by alr-temperature information collected from around the heat
83
I I N S T I T U T E 0 F G A $ T E C H N 0 L 0 G Y
1978016675-093
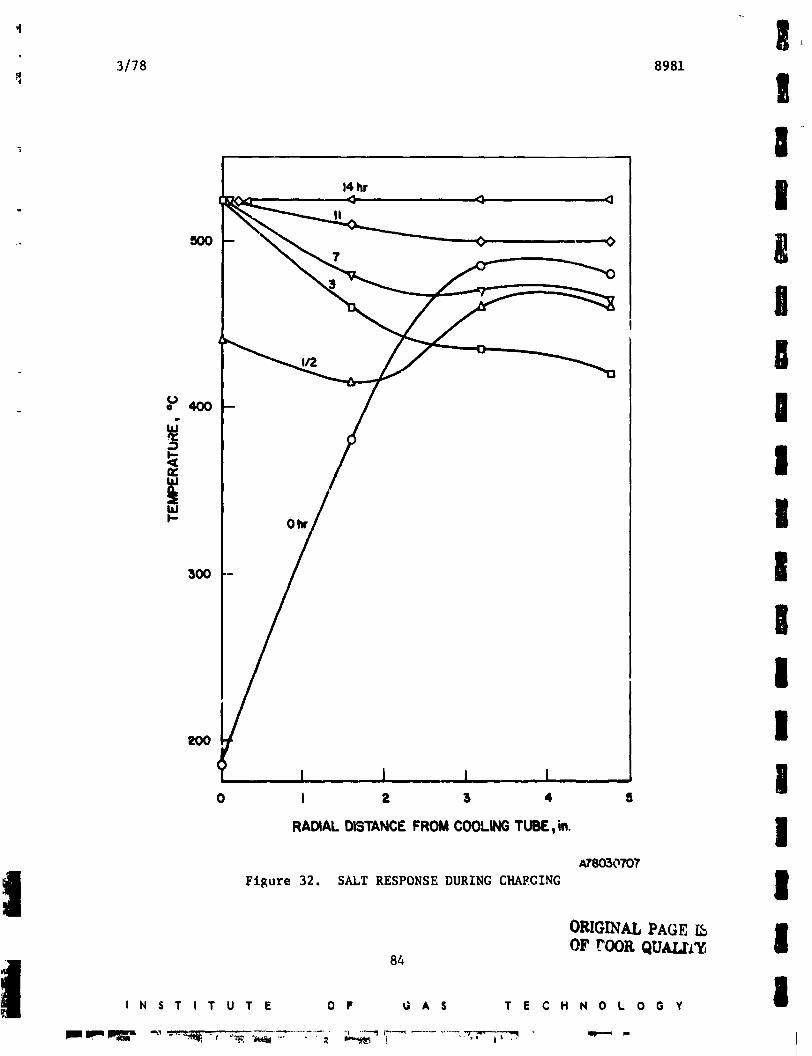
8981
3/78 I
|14hr i
7
In
I/2
_ _ |
F-
I300
III!
0 ! 2 3 4 g
RADIALOISTANCI_FROM COOLINGTUBE,in. I
ATW)30707
Figure 32. SALT RESPONSE DURING CHAF.CING i
I ORIGINALPAGE 1,5OF rOOK QUAI_ I
84
I , N $ T t T U T E O F G A S "T E C H N O L O G Y Iml
1978016675-094

85
i I N S T I T U T E ¢', F G A S T E C H N O L 0 G Y
-_- _._i_ _; 4 ,_ ......... _
1978016675-095
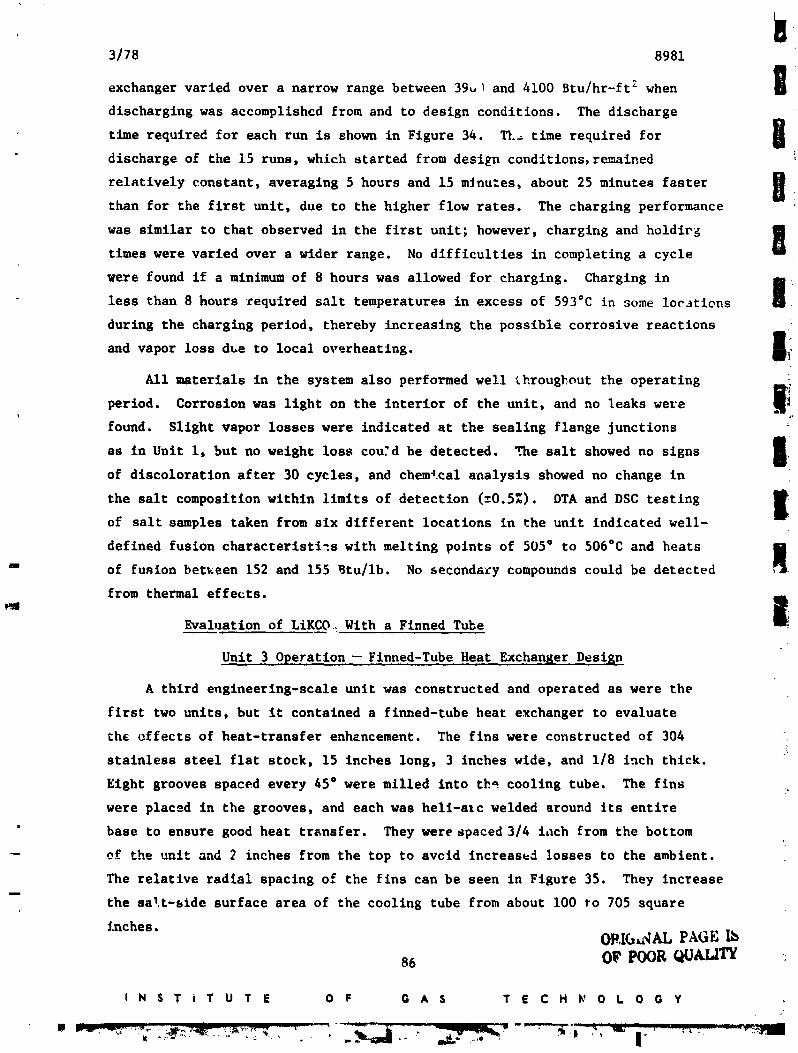
3/78 8981
exchanger varied over a narrow range between 39u_ and 4100 Btu/hr-ft _ when
discharging was accomplishcd from and to design conditions. The discharge1'I
time required for each run is shown in Figure 34. _._ time required for l
discharge of the 15 runs, which started from design conditions, remained
relatively constant, averaging 5 hours and 15 minutes, about 25 minutes fasteru
than for the first unit, due to the higher flow rates. The charging performance
was similar to that observed in the first unit; however, charging and holdi_ I
times were varied over a wider range. No difficulties in completing a cycle _]
were found if a minimum of 8 hours was allowed for charging. Charging in
Bless than 8 hours required salt temperatures in excess of 593°C in some locatlons
during the charging period, thereby increasing the possible corrosive reactions
and vapor loss due to local overheating, mf
All materials in the system also performed well lhroug_out the operating
period. Corrosion was light on the interior of the unit, and no leaks were li
found. Sllght vapor losses were indicated at the seallng flange Junctions
in Unit i, but no weight loss cou?d be detected. The salt showed no signs Iias
of discoloration after 30 cycles, and chemical analysis showed no change in
the salt composition within limits of detection (z0.5%). DTA and DSC testing lB
of salt samples taken from six different locations in the unit indicated well-
defined fusion characterlsti=s with melting points of 505" to 506°C and heats
of fusion betKeen 152 and 155 Btu/ib. No secondary compounds could be detected
from thermal effects.
Evaluation of LiKCO. With a Finned Tube
Unit 3 Operation- Finned-Tube Heat Exchanger Design
A third englneerlng-scale unit was constructed and operated as were the
first two units, but it contained a finned-tube heat exchanger to evaluate
the effects of heat-transfer enhancement. The fins were constructed of 304
stainless steel flat stock, 15 inches long, 3 inches wide, and 1/8 inch thick.
Eight grooves spaced every 45 ° were milled into th_ cooling tube. The fins
were placed in the grooves, and each was heli-atc welded sround its entire
• base to ensure good heat transfer. They were spaced 3/4 inch from the bottom
of the unit and 2 inches from the top to avcid increased losses to the ambient.
The relative radial spacing of the fins can be seen in Figure 35. They increase
the salt-side surface area of the cooling tube from about 100 to 705 square
inches.ORI_.qAL PAGE L_
86 O_ POOR QUALITY
I N S T i T U T E O F G A S T E C H k' O L 0 G Y
1978016675-096
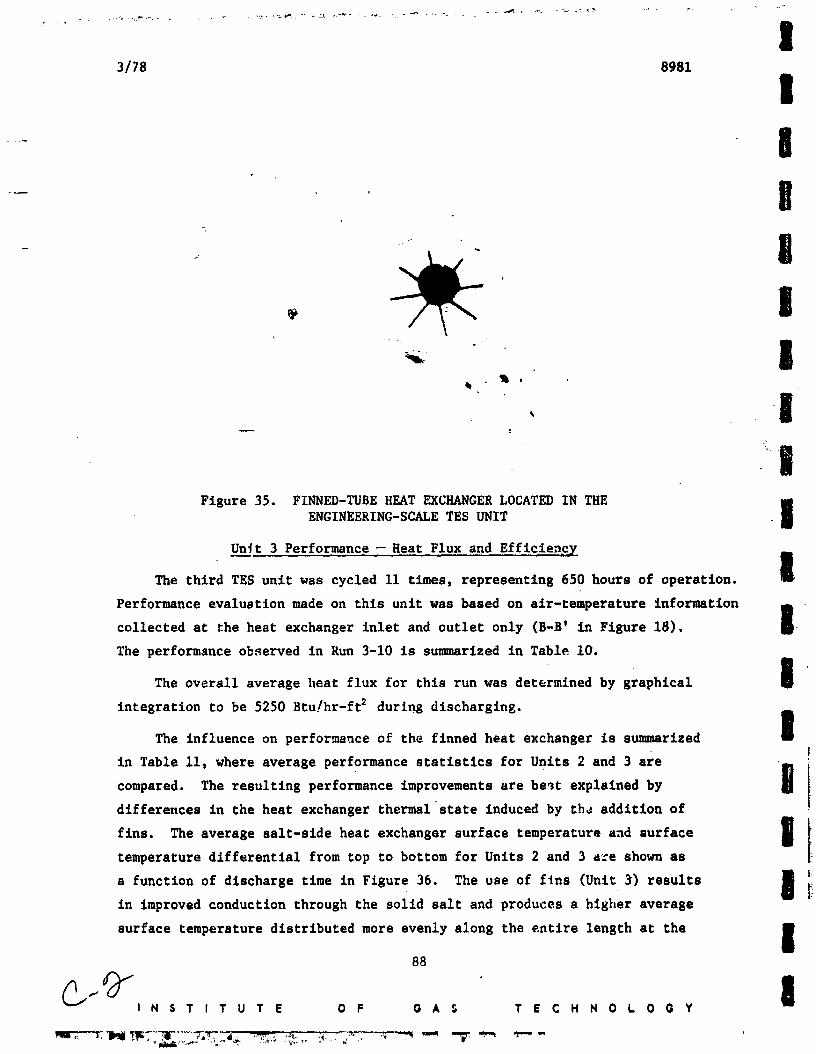
3/78 8981
I
gg
-- / m
. !
Im
Figure 35. FINNED-TUBE HEAT EXCHANGER LOCAT_ IN THE jENGINEERING-SCALE TES UNIT
Unit 3 Performance -- Heat Flux and Efficiency
The third TES unit was cycled ii times, representing 650 hours of operation, l
Performance evalustion made on this unit was based on alr-temperature information
collected at the heat exchanger inlet and outlet only (B-B' in Figure 18). I
The performance observed in Run 3-10 is sunlnarlzed in Table iO.
The overall average heat flux for this run was determined by graphical l
integration to be 5250 Btu/hr-ft 2 during discharging.
The influence on performance of the finned heat exchanger is summarized II
in Table i!, where average performance statistics for Units 2 and 3 are i
compared. The resulting performance improvements are be_t explained by i
idifferences in the heat exchanger thermal state induced by the addition of
fins. The average salt-slde heat exchanger surface temperature and surface g
temperature differential from top to bottom for Units 2 and 3 a_e shown as
a function of discharge time in Figure 36. The use of f_ns (Unit 3) results gin improved conduction through the solid salt and produces a higher average
surface temperature distributed more evenly along the entire length at the l88
INSTITUTE OF GAS TECHNOLOGY
1978016675-098

1978016675-099
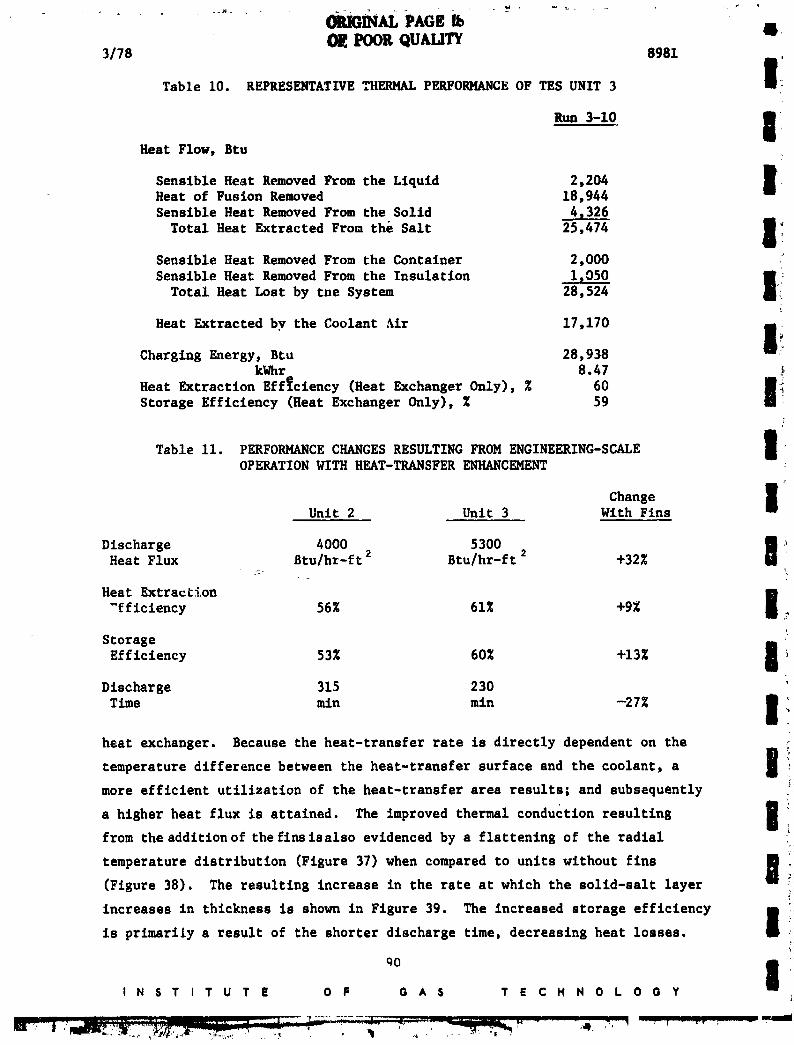
3/78 O_]POORQUALITY 8981I1"
Table I0. REPRESENTATIVE THERMALPERFORMANCEOF TES UNIT3 m:
Run3-10 IiHeat Flow, Btu
Senslble Heat Removed From the Liquid 2,204 IHeat of Fusion Removed 18,944
w
Sensible Heat Removed From the Solid 4,326
Total Heat Extracted From the Salt 25,474 I_
Sensible Heat Removed From the Container 2,000
Senslble Heat Removed From the Insulatlon 1,050 _j
Total Heat Lost by the System 28,524 i_
Heat Extracted by the Coolant Air 17,170 _
Charging Energy, Btu 28,938k_nr 8.47
Heat Extraction Efficiency (Heat Exchanger Only), Z 60 _Storage Efficiency (Heat Exchanger Only), Z 59 m _
_m
Table ii. PERFORMANCE CHANGES RESULTING FROM ENGINEERING-SCALE I _OPERATION WITH HEAT-TRANSFER ENHANCEMENT
w_
Change IUnit 2 Unit 3 With Fins
Discharge 4000 5300 _Heat Flux Btu/hr-ft 2 Btulhr-ft 2 +32Z Q
Heat Extraction I"fficlency 56g 61Z +9_
Storage m
Efficiency 53Z 60% +I3Z I _
Discharge 315 230
Time mln min --27g IN
heat exchanger. Because the heat-transfer rate is directly dependent on theIN
temperature difference between the heat-transfer surface and the coolant, a I
more efficient utilization of the heat-transfer area results; and subsequently
a higher heat flux is attained. The improved thermal conduction resulting I
from the addltlonof the flnslsalso evidenced by a flattening of the radial
temperature distribution (Figure 37) when compared to units without finse
(Figure 38). The resulting increase in the rate at which the solld-salt layer
increases in thickness is shown in Figure 39. The increased storage efficiency i "|is primarily a result of the shorter discharge time, decreasing heat losses.
,0 |I N S T I T U T E O F G A S T E C H N 0 L 0 O Y
m|ml ml _ q .... I I T I _
1978016675-100
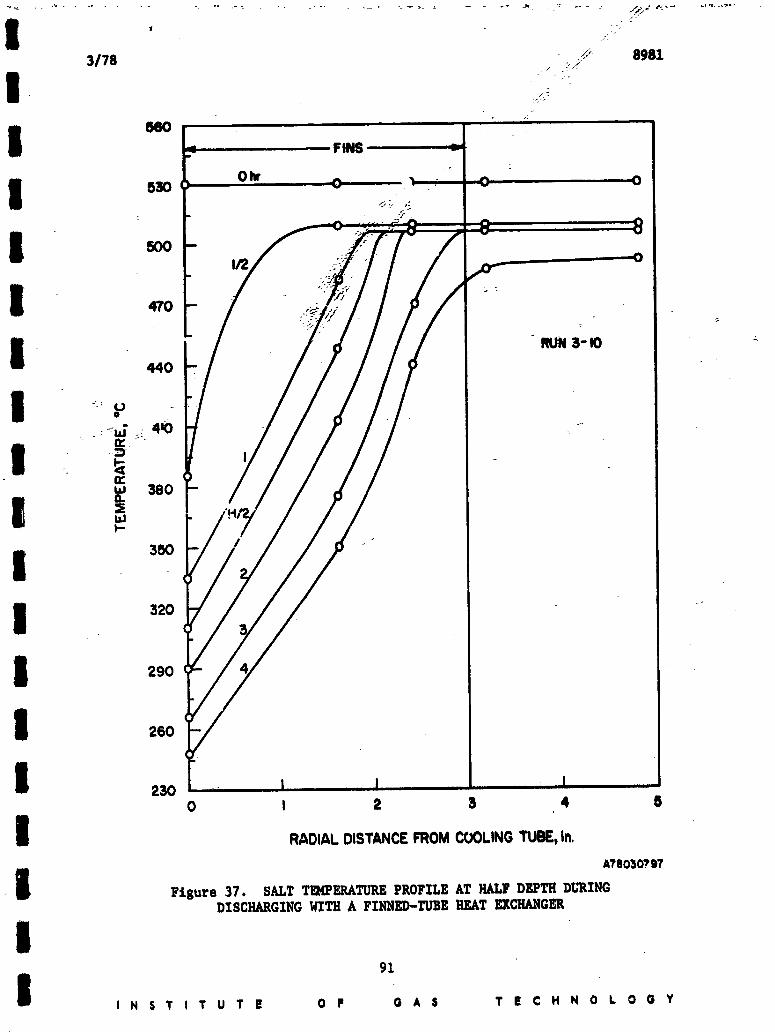
J_ 89813/78 ._._
I 880 ....... FINS _
I 630 Ohr _,j ; - 0,,, 0
e 8I 500-
470 -
I --RUN3-H) -_-440 - •
"-; (,1o
2
i 350 / "
I :320 _"
I 290
I 260
I 230 -0 I 2 3 4 8
I RADIAL DISTANCEFROM COOLINGTUBE,in,
A78030797
m Figure 37. SALT TMERATURE PROFILE AT HALF DEPTH DURINGDISCHARGING WITH A FINNED-TUBE HEAT EXCHANGER
191
I I N S T I T U T E O F 0 A S T E C H N O L O G Y
1978016675-101
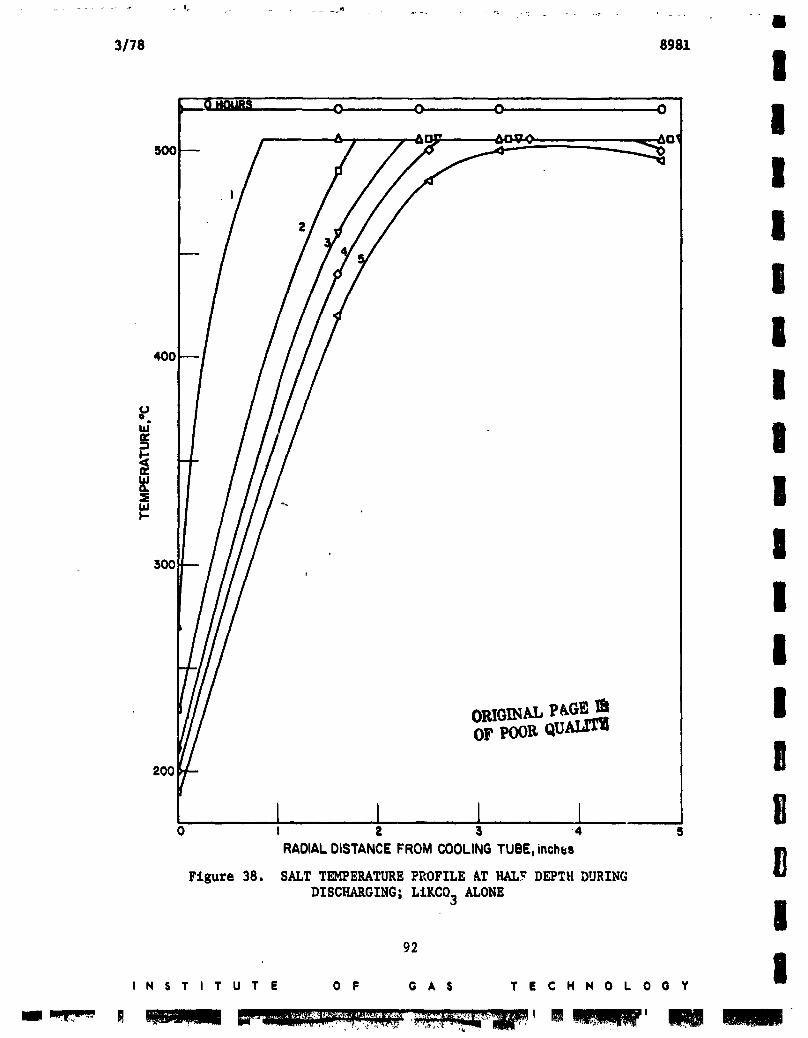
1978016675-102
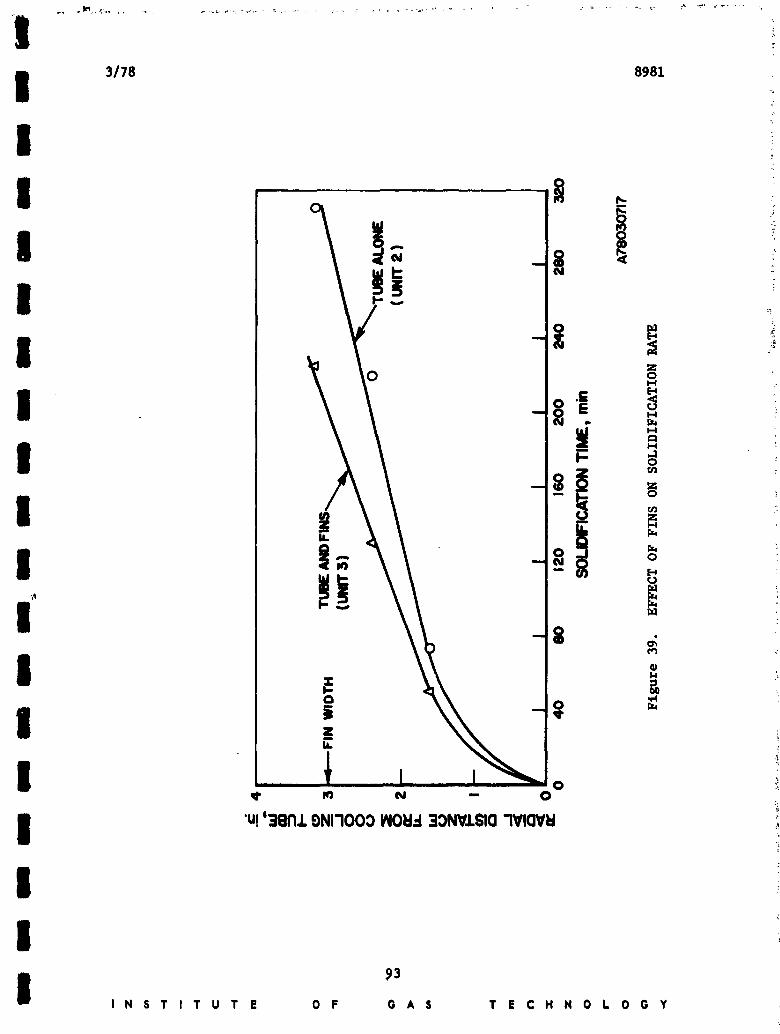
1978016675-103
|3/78 8981
El
The 32% improvement in the heat flux corresponds closely to the 25% im-
provement observed in the laboratory TES system (Figure 13 and discussion) when m
a finned-tube heat exchanger was used. As a comparison of the performance R
curves for Units 2 and 3, the averages of the last two runs made on each unit
in Yi_lre 40. The goal of conduction enhancement is to both Rare presented
increase and stabilize the heat flux during discharging. The performance in
Unit 3 indicates the heat flux improvement, but shows a more rapid change in Ri
the flux with time after the bulk of the molten salt has been cooled to the
melting point. This effect results from the diminishing influence of the
|dimensions and spacing of the fins as the solid salt increases in thickness, and
is intensified by the sborter discharge time: BThe influence of the fins is much less pronounced during charging. The
radial temperature distribution during charging is shown for Unit 3 in
|Figure 41. Comparison with temperature profiles observed without any conduction
enhancement (Figure 32) makes it evident that the fins improve the charging
characteristics only during the first 2 to 3 hours, or until enough molten B
salt has been formed to provide its own conduction enhancement. The net
result is a 7% decrease in the time required.for charging, i
Unit 3 Stability and Cyclabilitya
Because of the short operating time, a quantitative assessment of tho R
unit stability was not practical. However, a qualitative indication of the
system stability was found by the uniform discharge time per cycle shown in i
Figure 42. As previously discussed, both the charging and dlscharg_.ug times
were reduced by the use of the flnned-tube heat exchanger; and cycling in R
24 or 48-hour periods was achieved, although it required longer holdlng periods.
This unit was not disassembled after completing operation; therefore materials Biperformance was not established.
!!|
OP/G]NALP
OF POOP.QUALIt I
I N S T I T U T E O F G A S -_T E C H N O L O G Y
1978016675-104
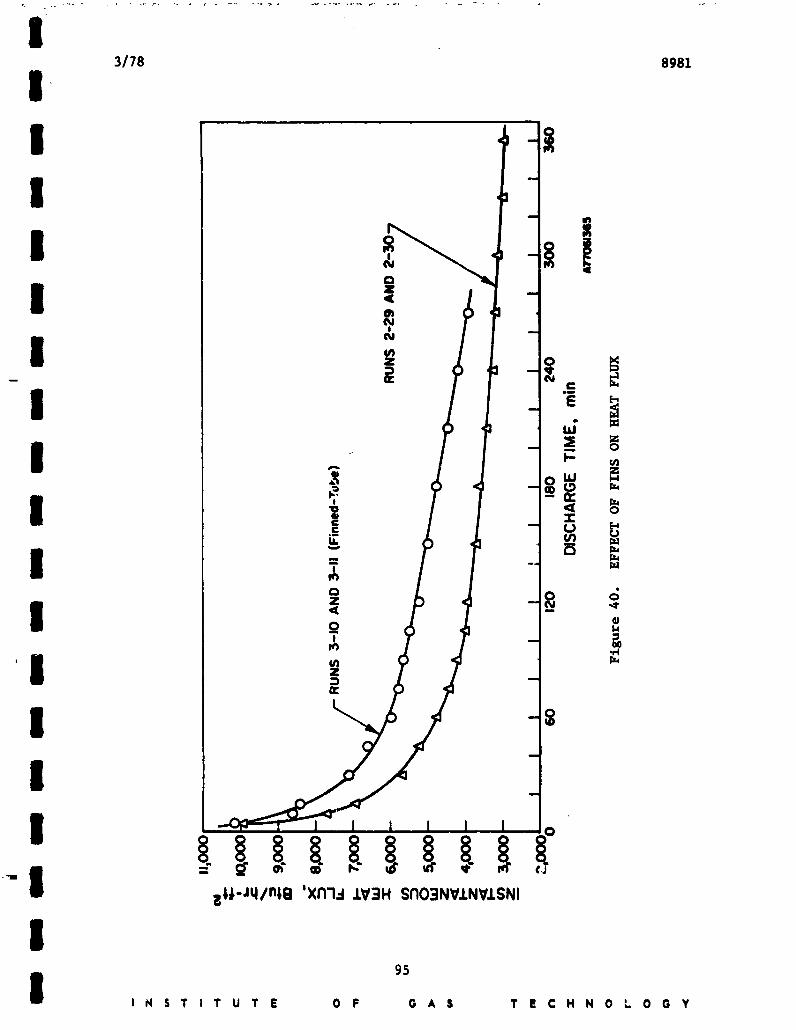
!3178 8981
III
! .N!
I ! _ oc U
Q
I "< --
Q _, _
I Z
I
I _l-lq/n4E 'Xtl'l.-I .LV:IH $rlO3NV.I.NVJ.SNI
I9S
I I N S T I T U T E G F G A S T E C H N O L O G Y
1978016675-105
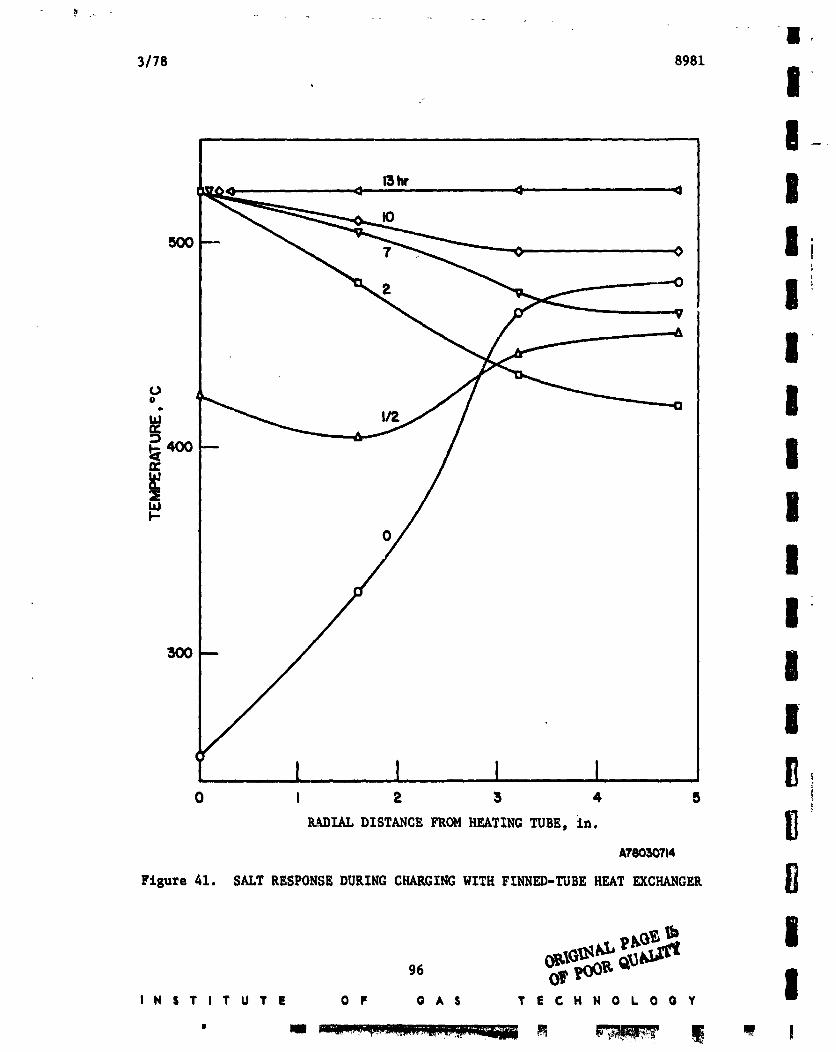
3/78 8981
. II,,
13hr IK)
[
|
I
I" Iwk-
0
II
_o II
0 I 2 3 4 5 fiI
RADL%L DISTANCE FROM HEATING TUBE, in.A78030714
Figure 41. SALT RESPONSE DURING CHARGING WITH FINNED-TUBE HEAT EXCHANGER
I.sT,TuTt oF o.s :ecx.o.ooY
1978016675-106
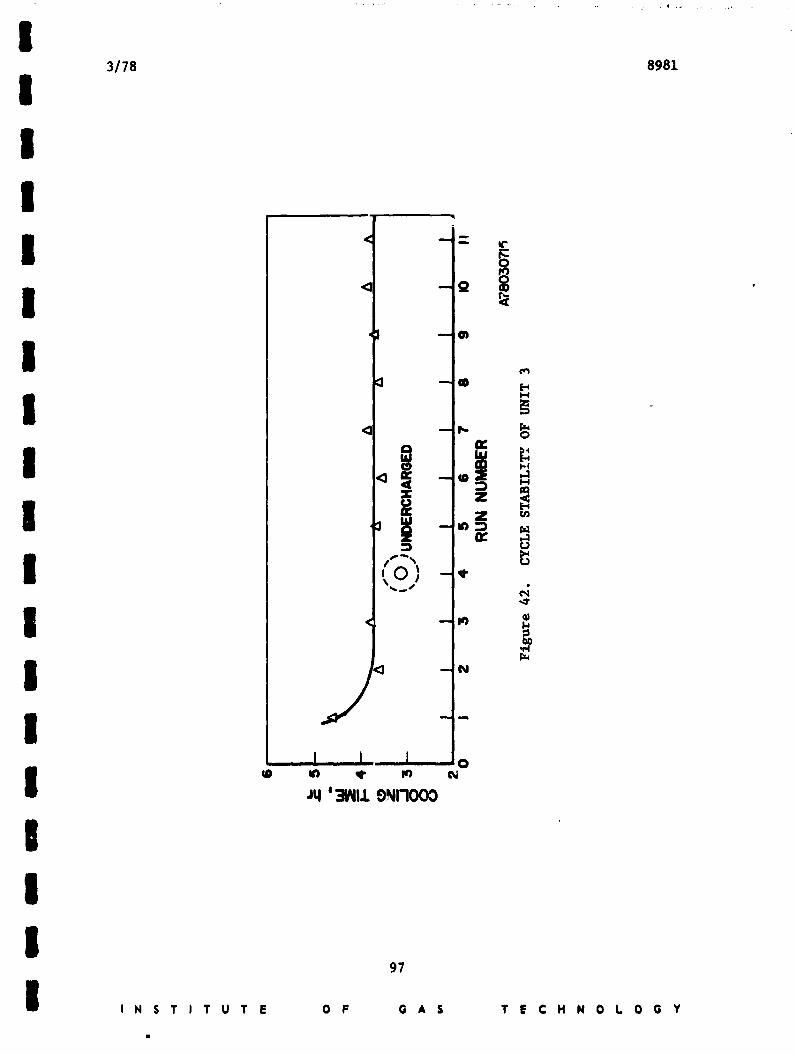
I3/78 8981
III
I " !iI < _ 'i
< o
o II ._°!
, I, I t
,lq '31_I11ONI7000
|II
97
I I N S T I T U T E O F G A S T E C H N O L O G Y
1978016675-107

d
3/78 8981
Task 4. Compare Experimental Performance of Englneerlng-Scale Syst_ Nith
Its Pred'icted Performance Ig
Introduction
One of the primary goals of this program was to develop a heat-tc_,_:,: I
model capable of predicting the thermal behavior of a TES system in ,enns of
its method of operation and the properties of the storage material. Because B
phase change is employed as the storage mechanism, a moving-boundary solution g
governed by heat-transfer characteristics was needed. Solutions of this type
derived by various investigators were examined for their thoroughness and
applicability to the problem at hand as'determined by the system under invest- Jigation _re. (See section covering Task 2.) One such solution of phase-
change heat flow proposed by Megerlin 22 was found to meet the criteria. In
his solution, Megerlin derived an equation giving the dimensionless velocity I
of a solid-liquid interface with respect to a heat-transfer surface in terms
of the system design with suitable constraints. We converted this solution to i
a more usable form to glve the dimenslonless time (NFo) needed to solidlfy a
molten material to a dimensionless thickness (R-l), and then evaluated it
numerically for the cond_tlons under which the experimental TES system was to
be operated. The experlmental system was designed to generate the information
required to verify Megerlln's solution in our form. The results of this effort
are discussed here.
Solidification of LIKCO_ Alone; Movement of the Solld-Liquld InterfaceDuring System Discharge
An annular arrangement was selected for the unit design for ease of
comparison with the theoretical model. Thermocouples were located at half
depth in the salt at various radial locatlons (0.25, 1.6, 2.4, 3.2, and 4.8
inches from the heat exchanger), and their response with time was recorded
during discharging. A typical discharge trace is shown with the unit design
in Figure 43. The time required for the freezing front to reach the location
of a thermocoup:.e was determined from the traces as the point where that
thermocoupla began to indicate a temperature below the melting point and sub-
sequently yielded a descending cooling curve characteristic of a solid being
cooled. The times required for the solid front to reach thermocouplea isolated
from edge effects (such as heat loss) are su_rized in Table 12 for several
standard runs made on UnJ_ 2. The averages of these times are summarized in
O GAL PAG98 OJ'Pooa
INSTITUTE OF GAS TECHNOLOGY
" "........... l! '........ ,'_.,.,,j_m_ ,_'y_e_"_'",_-
1978016675-108
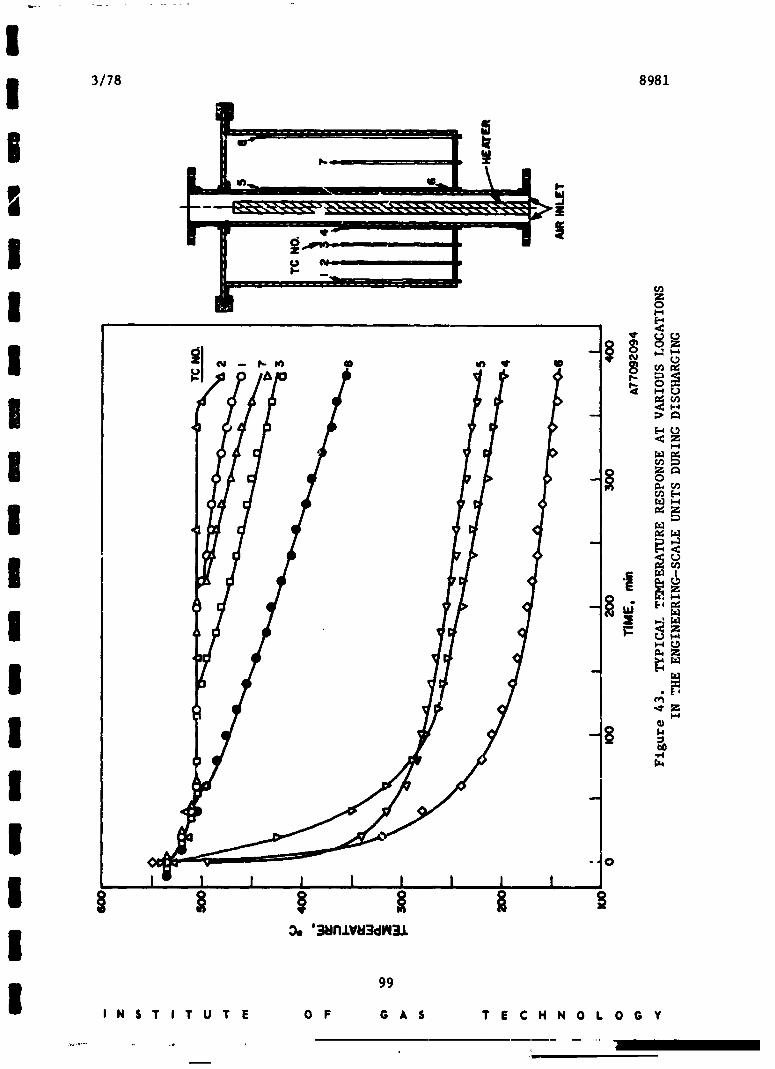
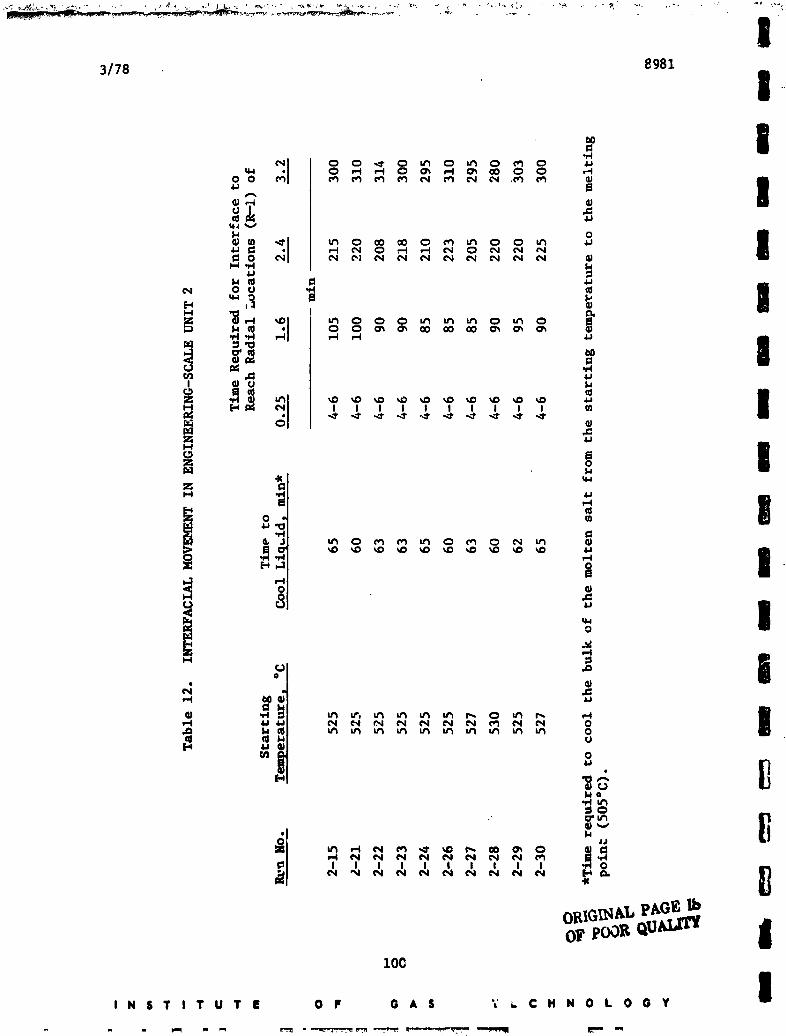
I3/78 8981 I
o_®.._ _ _ _ ,_ _ _ _ _,._ I
_° _1 _ II= 0 t_l ,_1 N r4 r_ r_ r_l N r4 r4
Ig
" ip _
_J
N ed e_l N e_l eNI N N
7 I I iI NI I I I I I @
o_ roar.o.U-_'r_loo
1
I N S T I T U T E O F G A $ 7 _. C H N 0 L 0 G Y I
1978016675-110
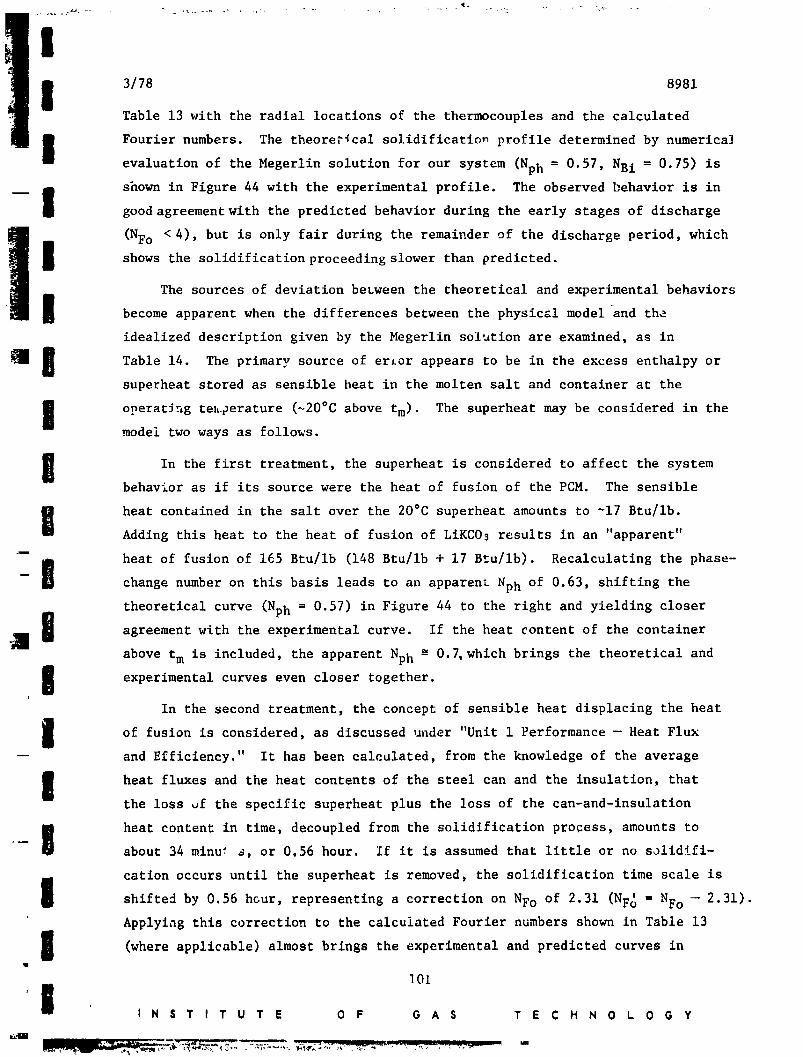
!I 3/78 8981
Table 13 with the radial locations of the thermocouples and the calculated
I Fourier numbers. The theoretical solidification profile determined by numericalevaluation of the Megerlin solution for our system (Nph = 0.57, NBi = 0.75) is
I shown in Figure 44 with the experimental profile. The observed behavior is ingood agreement with the predicted behavior during the early stages of discharge
(NFo < 4), but is only fair during the remainder of the discharge period, which
I shows the solidification proceeding slower than predicted.
The sources of deviation beLween the theoretical and experimental behaviors
I become apparent when the differences between the physical model and the
K
idealized description given by the Megerlin solution are examined, as in
i Table 14. The primary source of error appears to be in the excess enthalpy or
superheat stored as sensible heat in the molten salt and container at the
I operating tezLperature (~20°C above tm). The superheat may be considered in themodel two ways as follows.
I In the first treatment, the superheat is considered to affect the systembehavior as if its source were the heat of fusion of the PCM. The sensible
I heat contained in the salt over the 20°C superheat amounts to ~17 Btu/ib.Adding this heat to the heat of fusion of LiKCO3 results in an "apparent"
-- _ heat of fusion of 165 Btu/ib (148 Btu/ib + 17 Btu/ib). Recalculating the phase-
E change number on this basis leads to an apparent Nph of 0.63, shifting the
theoretical curve (Nph = 0.57) in Figure 44 to the right and yielding closerM
E agreement with the experimental curve. If the heat content of the container
above tm is included, the apparent Nph _ 0.7,which brings the theoretical and
I experimental curves even closer together.
In the second treatment, the concept of sensible heat displacing the heat
I of fusion is discussed under "Unit 1 Performance -- Heat Fluxconsidered, as
-- and Efficiency." It has been calculated, from the knowledge of the average
I heat fluxes and the heat contents of the steel can and the insulation, thatthe loss uf the specific superheat plus the loss of the can-and-lnsulatlon
I heat content in time, decoupled from the solidification process, amounts toabout 34 minu_ s, or 0.56 hour. If it is assumed that little or no solid±fi-
cation occurs until the superheat is removed, the solidification time scale is
I shifted by 0.56 h_ur, representing a correction on NFo of 2.31 (NF_ - NFo -- 2.31).
Applylag this correction to the calculated Fourier numbers shown in Table 13
I (where applicable) almost brings experimental predicted curvesthe and in
10t
I N S T I T U T E 0 F G A S T E C H N 0 L 0 G Y
I
1978016675-111
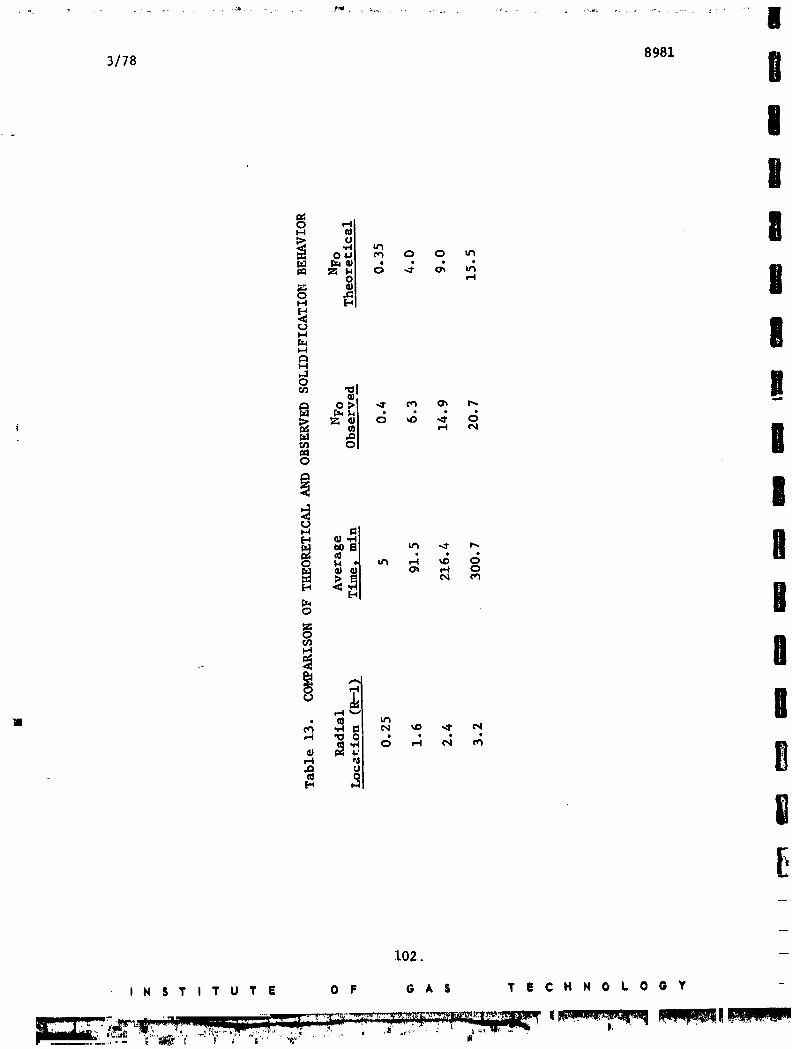
3/78 8981 g
II
102.
I N S T I T U T E O F G A S T E C H N O L O G Y
...._',,:,,:__- _, - ,_- ..... ,
1978016675-112

L- , = •
I3/78 8981
I
I
Table 14. COMPARISON OF MEGERLIN SOLUTION AND PHYSICAL MODEL ICondition Mathematical Description Physical Model
The Arrangement Cyllndrlcal, clrcular, Cyllndrlcal, Iaxlsymmetrlc circular, axlsymmetric
Internal Radius ro ro = 1 in. IExternal Radius Infinite Finite, r = 6 in.
Axial Dimension Infinite Finite, L = 18 in. I
Initial Temperature At meltin8 point tm Above meltln8 pt
Excess Enthalpy I
Above tm 0 (0.42)(40) = 17 Btu/lb
Misc Losses 0 Via insul, supports, etc. I
Heat Content of
Containers and Insul 0 12 Btu/°F for the can I22 Etu/°F insulation
IO_GINAL PAGE Ib
104 II N S T I T U T E O F G A S T E C H N 0 L 0 0 Y
.ram,,. , .ram,', ,_ . m mk m , n.mq_m • W T
1978016675-114
3/78 8981
Figure 44 togethar. Other variations, which, if corrected for, would tend to
I bring the curves even closer together are --a. The finite axial dimension of the physical model as opposed to the in-
finitely long analytical solution suggests that, at the radius nearest
I to the entry of the coolant, the freezing front would form faster. (Thecoolant enters at 49°C, is about 62"C in the middle at the thermocouplelevel, and leaves, on the average, at 77°C.)
I b. The convective currents in the liquid phase (left out of account completelyJ_
in the analytical model) would tend to slow down the solidification process.
I With these considerations in mind, the between the observed and _agreement
predicted behavior appears good throughout the entire solidification period.
| 'Use of the t!eat-Transfer Model in Large, Scale System Design :_
Introduction _
I The phase-change heat flow model developed by Megerlln _2 and evaluated at
IGT during the course of this project can be used in large-scale system design.
| ,In the IGT form, Megerlln's solution determines the extent of thickness around
a cylindrical internal well (tube) carrying a cooling fluid to which a PCMwill
solidify as a function of the time it has been cooled from its melting point, ,_
measured in terms of the radius o. the internal well. The model accounts for
I the flow and thermal properties _of the working fluid and the thermophyslcalp_'operties of the PCM (heat of fusion, heat capacity, melting point, thermal
I conductivity, and density). It yields the amount of a PCM that is solidifiedwith respect to the system design and mode of operation and, th-refore, in- _
directly gives a measure of the energy transferred from the storage material ._
! -to the working fluid under the same constraints.
I If the conceptual system is a large molten salt bath with a number of pipesrunning parallel to each other i_a well-formed matrix carrying the working
fluid through the salt bath, _he model will determine the pipe spacing, the
I number of pipes required, and their length (given the plbe radius) for a par- •
tlcular storage requirement. Consequently, the model relates the energy dis-
I charged from a system to the physical design of the system, allowing a balance%o be made between the energy required as determined by the working fluid
I conditions and the energy discharged that results from the system design.
!i 105I N $ T I 7 U T E 0 F G A $ T E C H N 0 t 0 G Y
1978016675-115
3/78 8981
TES System for Steam Upgrading
To show how the heat-transfer model may be used in system design, we will
apply it to a storage system in which hlgh-temperature, hlgh-pressure steam
is tb _ working fluid. In this system, LIKCO3 will be used as the PCM for the
purpose of superheating the steam at I000 psi from 550OF (288"C) to 900°F (482°C)
over a 6-hour period during which the steam flow will be 5.0 X lOs ibm/hr. The
enthalpy change in the steam is 249.2 Btu/Ibm (from the Steam Tables), so the
total system capacity must be --
(249.2 Btu/ibm)(5 X 10Slbm/hr)(6 hr) = 7.48 X 10⁸ Btu (44)
which represents --
(7.48 X IO s Btu)/(148 Btu/Ib) = 5.05 X l0 s ib (45)
of salt (heat of fusion only). The volume of salt that must be solidified
(using the room-temperature density for a first approximation) is -
(5.05 X 10⁶ ib)l(141 Ib/ft s) = 3.58 X 10 _ ft s (46)
This sets the "fixed volume" requirement that the heat-transfer model will be
applied to solving. The phase-change number determined for a mean steam
temperature of 725°F (385°0 is --
!A Hf (148 Btullb) - 2 (47)
Nph = =Cp(tm-t) (0.32 Btu/ib-OF) (941"F-725°F)
|The Megerlln plots for Nph ffi2 and a range of Blot numbers are shown in
Figure 45. iIn this example, we have chosen to use pipes with a 2.5-in. diameter, and
need to determine the number of pipes required, their spacing, and their length.
The Fourier number corresponding to a 1.25-In. (0.104-ft) radius and a 6-hr|
discharge time is --U
e T . (0.0287 ft2/hr)(6 hr1NFo " r-_o (0.104 ft)2 - 15.9 (48)
Given the pipe diameter, 2 ro, the Blot number NBi need only be specified now
to use the Megerlin plots in Figure 45 to determine r,,whlch will yield the f%
thickness of thesolidified salt (rI - ro) and the pipe spacing (2 rl). The
pipe length is determined from the fixed volume requirement:
L I = (3.58 X i0_ ftS)l(r_ - r_) nw (49) U
106 II N S T I T U T E O F G A S T E C H N O L O G Y
_._ _ .... . ,_. I , ,-_,--_,-- ,_ _ "..... _' , _,_''7 "_
1978016675-116
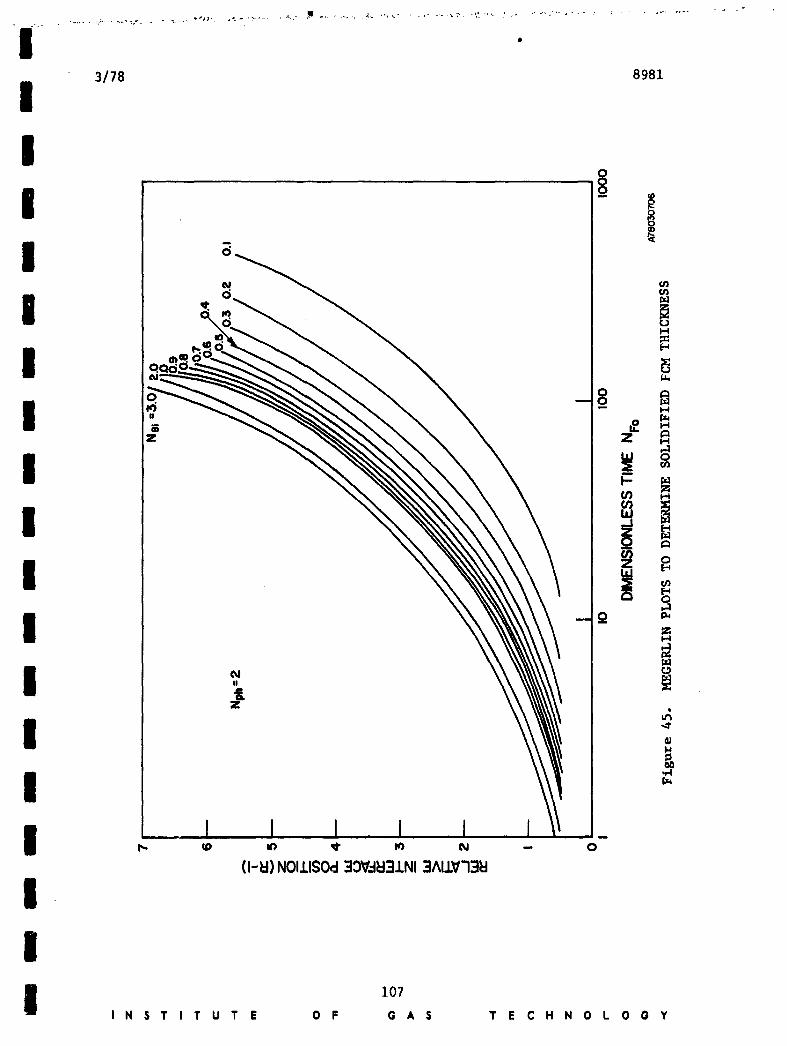
1978016675-117
m3/78 8981 __
The Biot number is given by --
NBi = hro/k s (50) I
so that an expression for the steam-side heat-transfer coefficient, h, must be _
derived. In this example, we will first assume fully turbulent flow In the _,
steam pipes that allows the use of the Nusselt equation- _i.
BNNu = 0.023 NRe °'e Npr °'2= -khd (51)
to derive the expression for h. Solving Equation 51 for h yields- li
2 _ P_h = 0.02 Npr °" k (_)0.8 n-0.8ro-l.e (52)
where n = number of pipes with radius ro. Substituting in Equation 52 the
appropriate properties for steam at 725°F (385oC) and i000 psi, and setting
_. ro = 1.25 in. and _ = 5 X l0s ibm/hr yields-
h = 5968/n °'s Btu/hr-ft2-OF (53)
It can be seen from Equation 53 that LI and rI are both dependent on the number
of steam pipes to be used (NBi = n-°-e , ro fixed). The pipe length, LI, can :_
be determined for any number of pipes by selecting n and calculating h from
Equation 53, determining NBI and using it to find rI from the Megerlin plots, !
then substituting rI and n into Equation 49 and solving for LI.
Now that we have calculated a pipe length consistent with a given number
of tubes, n, that are sufficient to remove the heat from the salt volume, we
must consider if sufficient heat-transfer surface is present to heat the steam
to the required outlet temperature. /-_d
If it is assumed that the PCM remains at its melting point, the enthalpy /
\,change in the steam as it progresses through the pipe is described by - _,
Cp dt h (tm t) - h (941"F-- t) (54)dL = --
Rearranging Equation 54, integrating, and evaluating, given that at
L = O, C " 5500F (288=C) and at L - L2, t = 900°F (482°C) leads to-
L2 . (2.255) _ Cp 'i_n_hd (55)
ORIGINALPAGE IbIo_ OF POOR QUAIX_
I N S T I T U T E O F G A S T E C H N O L O G Y
1978016675-118
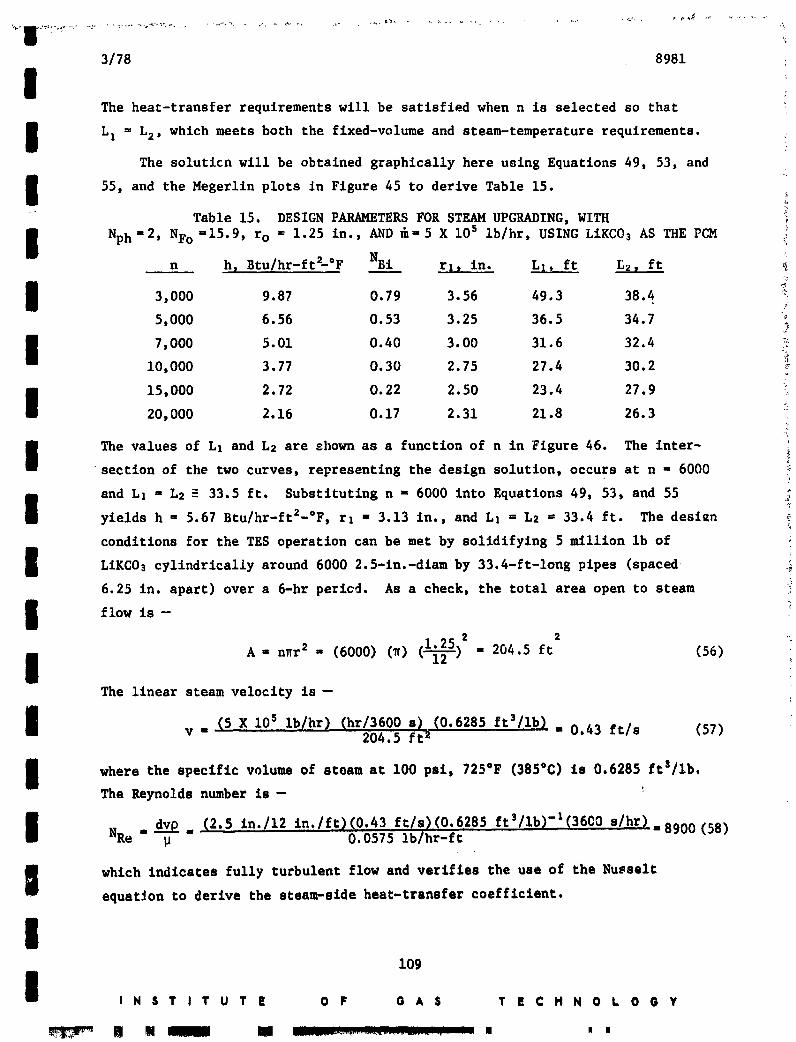
3/78 8981 •
The heat-transfer requirements will be satisfied when n is selected so that
I L 1 = L2, which meets both the fixed-volume and steam-temperature requirements. :
The soluttcn will be obtained graphically here using Equations 49, 53, and
I 55, and the Megerlln plots In Figure 45 to derive Table 15.
Table 15. DESIGN PARAMETERS FOR STEAM UPGRADING, WITH
I Nph =2, NFo =15.9, ro = 1.25 in., AND _= 5 X l0s ib/hr, USING LiKCO3 AS THE PCM _n h_ Btu/hr-ft_°F NB____i rlj in. _ Lz, ft
3,000 9.87 0.79 3.56 49.3 38.4 _/
5,000 6.56 O. 53 3.25 36.5 34.7 ?
I 7,000 5.01 0.40 3.00 31.6 32.410,000 3.77 0.30 2.75 27.4 30.2
I 15,000 2.72 0.22 2.50 23.4 27.920,000 2.16 0.17 2.31 21.8 26.3
I The values of Lx and L2 are shown as a function of n in Figure 46. The inter-section of the two curves, representing the design solution, occurs at n = 6000
I and L1 = L2 _ 33.5 ft. Substituting n - 6000 into Equations 49, 53, and 55yields h ffi 5.67 Btu/hr-ft2-°F, rx " 3.13 in., and LI = L2 ffi 33.4 ft. The design
conditions for the TES operation can be met by solidifying 5 million ib of
LiKC03 cylindrically around 6000 2.5-in.-dlam by 33.4-ft-long pipes (spaced
6.25 in. apart) over a 6-hr pericd. As a check, the total area open to steam
I flow is --
5)z = 204.5 ft2,__
A = n_r 2 = (6000) (_) _-12- (56)! •The linear steam velocity is --
I v - (5 X 10 s lb/hr) (hr/3600 s) (0.6285 ftS/lb) , 0.43 ft/s (57)204.5 ft 2
I where the specific volume of steam at i00 psi, 725°F (385"C) is 0.6285 ftS/Ib.The Reynolds number is -
I d_._= (2.5 in./12 in./ft)(0.43 ft/s)(0.6285 ftS/lb)'X(3600 s/hr).8900(58)NRe " _ 0.0575 Ib/hr-ft '
I which indicates fully turbulent flow and verifies the use of the Nusseltequation to derive the steam-side heat-transfer coefficient.
!109
I I N S T I T U T E O F G A S T E C H N O L O G Y
B R lllllmlmll Ill _!!i........ " ..................... .... m ' m
1978016675-119

I3/78 8981
I!
50 |4e
0 ENERGY REQUIREMENT 1II44 • STEAM REQUIREMENT
,. i.. 40
- |z"_" 3e£9
" Itd
-JbJ
-_ |o.34
_ 32
2e
I
24 3
2 4 6 II I0 IZ 14 II 18 20NUMBEROF 2.5-1n,-dklm STEAM PIPES X i0.3
A78030700
Figure 46. GRAPHIC SOLUTION FOR NUMBER OF PIPES AND THEIR LENGTH
I110
OB
I N S T I T U T E O F G A S T E C H N O L O G Y 1
1978016675-120
3/78 8981
Although the above provides the design o_ a TES system capable of meeting
I the performance requirements, it is not necessarily the optimum system design.The use of different steam pipe sizes and the effects of conduction enhance-
ment on the solidification process must be studied before an optimum perfoz_ance _.
I design could be established. Such optimization must aiso include the determt- _
nationof the cost-effectiveness o£ the possible designs, but is at present
beyond the scope of this project. The example presented here does, however,
show the importance of the heat-transfer model in determining key parameters _
I for any latent-heat TES system. ;
| "b-
! ,| -"
!I!IIIII
111
I I N S T I T U T E O F G A $ T E C H N O L O G Y
1978016675-121
L,, - -.... r, . .
I3/78 8981 ITask 5. Conclusions and Recommendations
Conclusions I
i. Salts
• Carbonates appear most attractive from thermal, chemical, and physical
m
properties; LIKC03 selected as model system.
• Chlorides appear most attractive from cost considerations. I
2. Heat-Transfer Modelingm
• Megerlin's solution gives good agreement between predlcted'and observed I
interfaclal location during heat removal phase from PCM.em
• Model can be used for determining key design parameters for large-scalesystems.
3. Inert Additives to Control Volume Change (LiAI02) I
• Small volume change observed with model system does not require their use.m
• Sedimentation doe• present a problem at concentrations of 20 volume percent. I
s Performance is affected; heat flux lower.m
• Inerts increase system cost substantially while lowering specific capacity.
4. Conduction Enhancement I
• Additions of stainless steel screen, fln_ and woo_ and aluminum wool
(3-14 volume percent) increase performance hv 25Z-32Z. lg
s Wools appear most attractive of the enhancement concepts tested, particu-
larly aluminum wool. •m
5. Containment
• Low corrosion of 304 and 316 SS with carbonates. I
• Carbonates show no creepage, little vapor lose.
• Aluminum appears stable in the carbonate environment. I
6. E_nglneerlnE Performancei
• Cycling easily accomplished within a 24-hour period.
• 8t.bleperfo._e throu.h1400hoursof oper•tio.. O&IO_eAO_ |oF l_o& Ou m
• Cycling has no •pparent influence on the salt properties.
!112 m
i N S T I T U T E O F G A S T E C H N O L O G Y I
1978016675-122
I
3/78 8981• Performance unaffected by degree of superheating.
• Performance was improved 30% by the addition of conductivity enhancementin the form of eight fins.
I • Conduction enhancement provides more efficient utilization of heat-transfer area.
• Established baseline average discharge heat fluxes for comparative testing:
I No Enhancement: 4000 Btu/hr-ft 2
I With Enhancement by Fins: 5300 Btu/hr-ft 2• Strong convective mixing effects identified.
I • Low coefficient of expansion and related volume change on fusion ofLIKC03 verified.
I @ Strong dependence of heat flux on solld-salt thickness.• Heat fluxes as high as 40,000Btu/hr-ft 2 observed, representing an upper
I performance limit.7. Overall Conclusion
I • Aika]i carbonates are suitable for high-temperature TES applicationsfrom a performance, thermal, and chemical behavior standpoint.
I • Economic feasibility can now be studied.Recommendations for Further Research
I I. Salt____._s
• Study of lower-cost salts (commercial grade)
I • Wider range of melting temperatures
I • Incongruent compositions2. Modeling Studies
I • More deCailed study of aupe_heating and convective mixing effects onsolidification and melting behavior.
I • M_del verification with different sizes and shapes of containers
• Model verification using a higher-temperature working fluid (higher Nph)
I • Model verification using an alternative PCM
!I 113I N S T I T U T E O F G A S T E C H N O L O G Y
1978016675-123

!3/78 8981
3. _nert Volume-Change Control Additives I
• No further study recommended at this time for carbonates I4. Conduction Enhancement
• Further investigation of SS or aluminum in various forms, prlm_ilywool or flxed-structure configurations
• Corrosion testing of promising materlals in different carbonate mixtures
5. Containment
• Long-term corrosion testing of current contalnment materials in several I
salt mixtures under cycling conditions
s Identification and/or development of lower-cost containment materials I
• Compatibility testing under thermal-cycllng conditions of other candidate
materials i
6. Performance Testing
s Use of hlgher-temperature working fluids I
• Alternate passive heat exchanger configurations (multiple type) to iestablish performance in a more "commercial" system deslgn
• Larger-scale testing cf systems designed from the heat-transfer model
|• Long-term endurance testing (>i0,000 hr)
• Long- and short-term teattngwith alternate PCM'e I• Long- and short-termtesting,_ithmost promising conductivity promoters
7. TES System Development I
• System studies to determine design constraint to be placed oa system_ in
various uses I
• Cost and energy-saving analysea for promising concepts and economic
feasibility I :
IIi
114 II N $ T I T U "'| O F G A $ T | C H N 0 b 0 O Y
1978016675-124
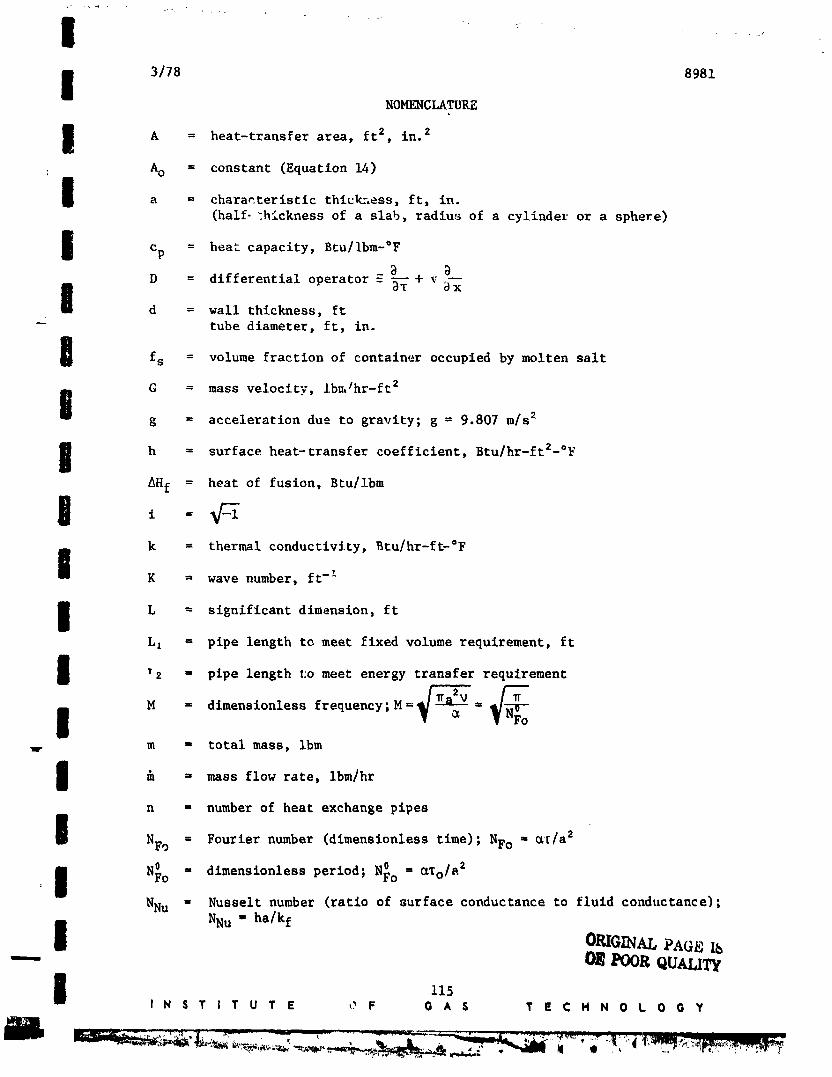
l - - - 4 =-
3/78 8981NOMENCLATURE
I A = heat-transfer area, ft2, in.2
A_ = constant (Equation 14)
I a = characteristic thickness, ft, in.
(half-:hickness of a slab, radius of a cylinder or a sphere)
Cp = heat capacity, Btu/ibm-°F
D = differential operator E _+ _ _x
I d = wall thickness, ft
-- tube diameter, ft, in.
I fs = volume fraction of container occupied by molten salt
G = mass velocity, Ibm/hr-ft 2
i g = acceleration due to gravity; g ffi9.807 m/s 2
i h = surface heat-transfer coefficient, Btu/hr-ftZ-°F
AHf = heat of fusion, Btu/lbm
k = thermal conductivity, Btu/hr-ft-°F
I K = wave number, ft-_
L = significant dimension, ft
L, ffipipe length to meet fixed volume requirement, ft
T2 = pipe length t:omeet energy transfer requirement
M = dimensionless frequency; M =_= _Fol.v m - total mass, Ibm
I _ = mass flow rate, ibm/hr
n ffi number of heat exchange pipes
I NFo = Fourier number (dimensionless time); NFo = _[/a 2
1 " dimensionless period; N_o = _Io/a 2NNu - Nusselt number (ratio of surface conductance to fluid conductance);
NNu = ha/kf
ORIGINAL PAGE IbPOORQUAUTy
I 115I N S T i T U T E O F G A S T E C H N O L O G Y
1978016675-125
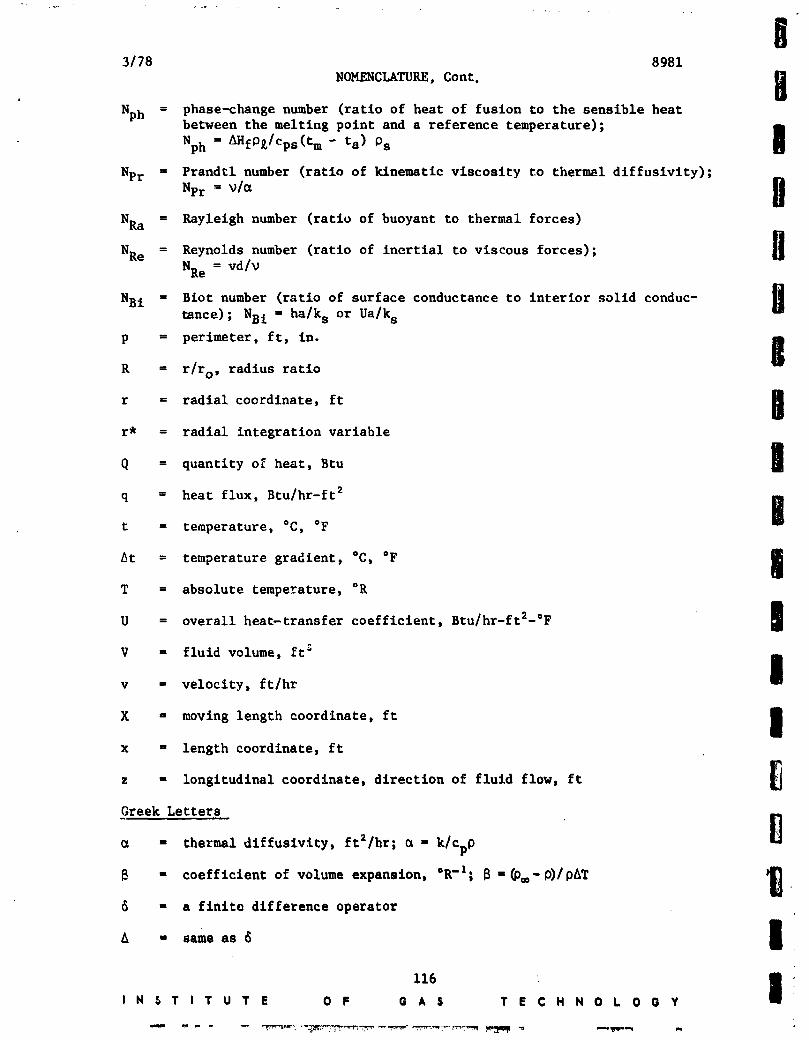
J3/78 8981
NOMENCLATURE, Cont.
Nph = phase-change number (ratio of heat of fusion to the sensible heat
betweenNph ffiAHfp_/Cps(tmthemelting_polntta)osand a reference temperature); I
Npr ffiPrandtl number (ratio of kinematic viscosity to thermal diffuslvlty);
Npr = _/_ H
NRa = Raylelgh number (ratio of buoyant to thermal forces)
NRe = Reynolds number (ratio of inertial to viscous forces); H
NRe = vd/_
NBi = Blot number (ratio of surface conductance to interior solid conduc-tance); NBi = ha/ks or Ua/ks
p = perimeter, ft, in. IR = r/to, radius ratio
r = radial coordinate, ft B
r* = radial integration variable
Q = quantity of heat, Btu I
q ffi heat flux, Btu/hr-ft 2 Bt = temperature, °C, °F
At = temperature gradient, °C, "F I
T = absolute temperature, °R
U = overall heat-transfer coefficient, Btu/hr-ft2-°F I
V = fluid volume, ft_
v = velocity, ft/hr I
X - moving length coordinate, ft I
x - length coordinate, ft
z - longitudinal coordinate, direction of fluid flow, ft
Greek Letters
= thermal dlffuslvlty, ft2/hr; _ = k/Cpp
B = coefficient of volume expansion, °R-l; B " _-_/pAT
6 - a finite difference operator
A = same as 6 I
116 " IINSTITUTE OF GAS TECHNOLOGY
1978016675-126
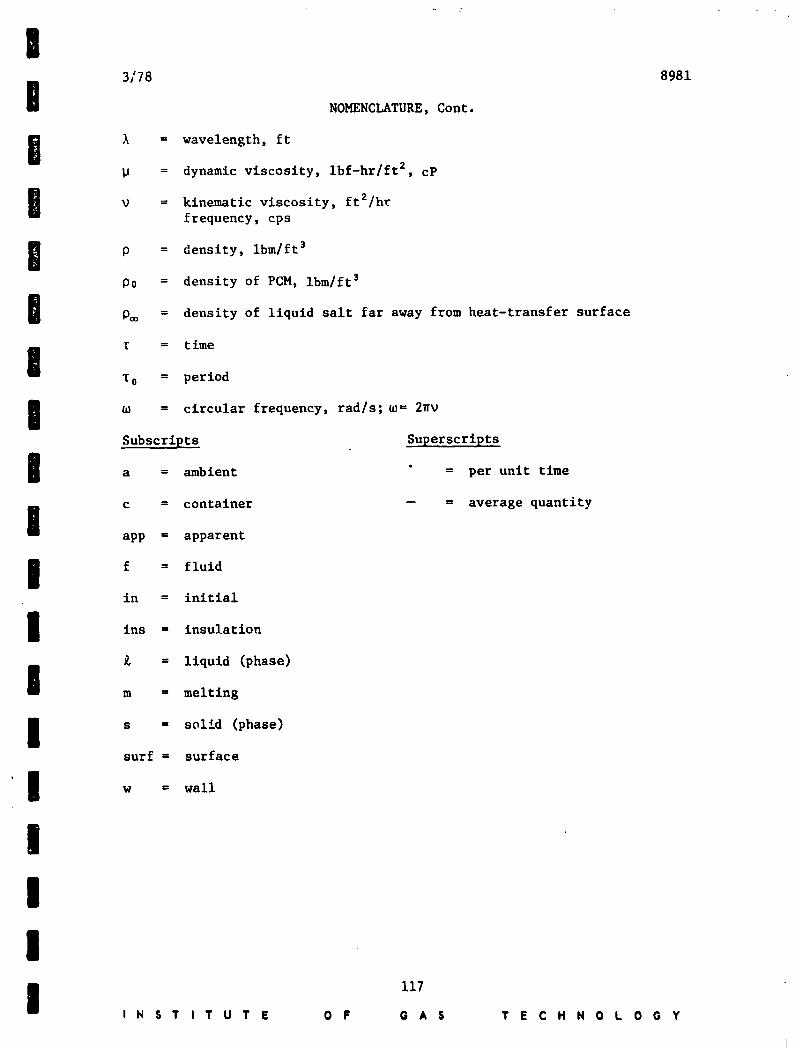
I3/78 8981
I NOMENCLATURE, Cont.
i _ = wavelength, ftp = dynamic viscosity, Ibf-hr/ft 2, cP
i _ = kinematic viscosity, ft2/hrfrequency, cps
i 0 = density, ibm/ft 3
P0 = density of PCM, ibm/ft 3
i O_ = density of liquid salt far away from heat-transfer surface
r = time
I TO ffiperiod
I _ = circular frequency, rad/s; _= 2_
Subscripts Superscripts
i a = ambient " = per unit time
c fficontainer -- = average quantity
l app = apparent
I f ffi fluidin = initial
I ins = insulation
£ = liquid (phase)
I m = melting
I s = solid (phase)surf = surface
I w = wall
IIII 117I N S T I T U T E 0 F O A S T E C H N 0 t 0 O Y
1978016675-127
.......• I
31,8 8,81 liREFERENCES CITED
I. Atomics International, "Development of a Molten Carbonate Process for I
Removal of Sulfur Dioxide From Power Plant Stack Gases," Progressg
Report No. 2 to U.S. Public Health Service Contract No. PH 86-67-128.
Canoga Park, Calif., 1968. I
2. Bramlette, T. T. et al., "Survey of Hlgh Temperature Thermal Energy
Storage," SAND 75-8063. Livermore, Calif.: Sandia Laboratories, 1976. Bm
3. _roers,G. H. J. and Van Ballegoy, H. J. J., "Phase Equllibria in Li-Na-KCarbonate-Aluminate Systems." Paper presented at the 3rd International II
Symposium on Fuel Cells, Brussels, June 1969. I
4. Carslaw, H. S. and Jaeger, J. C., Conduction of Heat in Sollds, 2nd Ed.,
282-91. London: Oxford University Press, 1959. I
5. Chandrasekhar, S., Hydrodynamic and Hydromagnetlc Stability. London:
Oxford University Press, 1961. II
6. Davis, H. J. and Kinnlbrugh, D. R., "Passivation Phenomena and Potentlo-
static Corrosion in Molten Alkali Metal Carbonates," J. Electrochem. Soc.
" - ii ! (3), 392-96 (1970). i
7. Grantham, L. F. and Ferry, P. B., "Corrosion in Alkali Carbonate Based
Melts," Abstract No. }91 in Extended Abstracts, Vol. 76-1, for the 149thMeetlng of the Electrochemical Society, Washington, D.C., May 2-7, 1976.
8. Groeber, H., Forschungsarb, Heft 300, V.D.I__, Berlin, 1928.m
9. Hatch, J. E. et al., "Graphical Presentation of Difference Solutions forTransient Radial Heat Conduction in Hollow Cylinders wlth Heat Transfer
at the Inner Radius and Finite Slabs wlth Heat Transfer at One Boundary," INASA TR R-56, 34, 1960. l
i0. Hausz, W. and Meyer, C. F., "Energy Conservation: Is the Heat Storage Well
the Key?" Public btilltlvs Fortnightly, 34-38 (1975) April 24. m
II. Hill, J., Streed, E., Kelly, G., Geist, J. and Kusuda, T., "Development of
Proposed Standards for Testing Solar Collectors and Thermal Storage Devices," |NBS Technlcal Note 89._99.Washington, D.C.: U.S. Department of Commerce/National Bureau of Standards, February 1976.
12. Institute of Gas Technology, "Development of Molten Carbonate Fuel Cells,"
Final Report, A.G.A. Project DC-4-1. Chicago, 1967.im
13. Janz, G. J., Lorenz, M. R., "Solid-Liquld Phase Equilibria for Mixturesof Lithium, Sodium, and Potassium Carbonates," J. Chem. Eng. Data 6 (3),
321-23 (1961) July. m14, Janz, G. J. and Conic, A., "Corrosion of Gold-Palladlum, Nickel and
Type-347 Stalnless Steel in Molten Alkali Carbonates," Corrosion 2__0,
237t-238t (1964). I
118 I| N $ T | T U T E 0 F G A $ T E C H N 0 t 0 G Y
1978016675 128
3178 8981
I REFERENCES CITED, Cont.
15. Janz, G. J. and Conte, A., "Potentlostatic Polarization Studies in FusedCarbonates, II. Stainless Steel," Electrochim Acta 9, 1279-87 (1964).
i 16. Kardas, A., "On a Problem in the Theory of the Unidirectional Regenerator,"Int. J. Heat Mass Transfer 9, 567-79 (1966).
17. Kreith, F., Principles of Heat Transfer, 347. Scranton, Pa.: Intern.
I Textbook Co., 1959.
18. Maru, H. C., Dullea, J. F. and Huang, V. M., "Molten Salt Thermal Energy
I Storage Systems: Salt Selection," Topical Report, ERDA ContractNo. E(II-I)-2888. Chicago: Institute of Gas Technology, August 1976.
19. Maru, H. C. et al., "Fuel Cell Research on Second-Generation Molten
Carbonate Vol. II: Characteristics of Carbonate Melts,"Systems,
Quarterly Progress Report, Arsonne National Laboratory ContractNo. 31-109-38-3552. Chicago: Institute of Gas Technology, July l-
i September 30, 1976.
20. Maru,-H. C., Kardas, A., Huang, V. M., Dullea, J. F., Paul, L. and
Marianowski, L. G., "Molten Sale Thermal Energy Storage Systems:System Design," Topical Report, ERDA Contract No. EY-76-C-02-2888.
Chicago: Institute of Gas Technology, February, 1977.
f 21. Mason, D. M. and Van Drunen, C. J., "Production of Beta-LithiumAluminate," U.S. Patent 3,998,939 (1976) December 21.
I 22. Megerlin, F., "Geometrically One-Dimensional Heat Conduction DuringMelting and Solidification," Forsch. Insenieurwes. 34 (2), 40-46(1968) (German text).
i 23. Meijer, R. J. and Spigt, C. I., "The Potential of the Phillips StirlingEngine for Pollution Reduction and Energy Conservation." Paper presented
at the 2nd Symposium on Low Pollution Power Systems Development,
I Organized by the Committee on the Challeng_s of Modern Society, NATO,Dusseldorf, Germany, November 4-8, 1974.
I 24. Schroder, J., "Thermal Energy Storage and Control." Paper No. 74-WA/OTD-I,presented at the 95th Winter Annual Meeting of _;heAmerican Society of
Mechanical Engineers, New York, November 17-22, 1974.
I 25. Siegel, R., "Solidification of Low Conductivity Material ContainingDispersed High Conductivity Particles," Int. J. Heat Mass Transfer 20,1087-89, 1977.
I 26. Spedding, P. L., "Densities and Molar Volumes of Molten Alkali Carbonate
Binary Mixtures," J. Electrochem. Soc. 117 (2), 177-83 (1970) February.
!I LS/DG
I 119INSTITUTE OF GAS TECHNOLOGY
1978016675-129