Embed Size (px)
Citation preview
INSTITUTE FOR PROSPECTIVE TECHNOLOGICAL STUDIESSEVILLEW.T.C., Isla de la Cartuja, s/n,E-41092 Sevilla
FEASIBILITY STUDY AIMING AT CREATING A
REGIONAL BIO-ENERGY TECHNOLOGICAL
SUPPORT CENTRE FOR THE DIFFUSION AND
TRANSFER OF R&D RESULTS
Authors:
P. MONCADA-PATERNÒ-CASTELLO, F. J. PEINADO, M. A. AGUADO,INSTITUTE FOR PROSPECTIVE TECHNOLOGICAL STUDIES (IPTS)
(European Commission - Joint Research Centre)
F. ROSILLO, D. O. HALL,KING’S COLLEGE LONDON (KCL), United Kingdom
J. ALONSO MARTÍNEZ, J. ALONSO GONZÁLEZ,UNION FENOSA INGENIERIA (UFISA), Spain
prepared for
EUROPEAN COMMISSIONDirectorate-General XIII,
Telecommunications, Information, and Exploitation of Research Results
EUR 18120 EN
JULY, 1998
EUROPEAN COMMISSIONJOINTRESEARCHCENTRE
Regional Biomass Technological Support Centre
2
© ECSC-EEC-EAEC, Brussels • Luxembourg, 1998
The orientation and contents of this report cannot be taken as indicating the position
of the European Commission or its services.
The European Commission retains copyright, but reproduction is authorised, except
for commercial purposes, provided the source is acknowledged: neither the European
Commission nor any person acting on behalf of the Commission is responsible for the
use which might be made of the following information.
Printed in Spain
Regional Biomass Technological Support Centre
3
Table of Contents
Executive Summary 5
Table Of Tables 9
Table Of Figures 10
0. INTRODUCTION 11
1. BIOMASS RESOURCES, PRESENT UTILISATION, AND R&DRESULTS. MONITORING AND ANALYSIS OF EXISTING BARRIERS 15
1.1. Spain 16
1.2. Castilla y León (CyL) 18
1.3. Soria 22
1.4. Overview of most relevant European R&D Results: Biomass Feedstocks 27
1.5. Overview of most relevant European R&D Results: Biomass Conversion Technologies 29
1.6. Overview of most Relevant European R&D Results: Biomass Energy End-Uses 33
1.7. Possible Barriers to the Implementation of Biomass Energy Schemes 35
2. DEFINITION AND PLANNING OF THE “REGIONAL BIO-ENERGYTECHNOLOGICAL SUPPORT CENTRE” 38
2.1. Survey of Renewable Energy Centres in Europe 40
2.2. Suggested Solutions for Overcoming the Existing Barriers 43
2.3. Designing of the BioCentre 462.3.1. Communication, Dissemination, and Diffusion activities 462.3.2. Technological Support Activities. 502.3.3. Exploitation activities 52
2.4. Resources needed for the specific activities 552.4.1. Manpower 562.4.2. Investment costs 582.4.3. Annual Operating Costs 59
2.5. Scenarios of investment and action plan 592.5.1. Low investment 602.5.2. Medium investment 622.5.3. High investment 632.5.4. Analysis of the relationship between the direct employment and the total costs for thedifferent investment scenarios 65
Regional Biomass Technological Support Centre
4
2.6. Relationship between the Centre and the CEDER 67
3. SOCIO-ECONOMIC AND ENVIRONMENTAL ANALYSIS 70
3.1. Hypothesis of biomass utilisation 71
3.2. Employment creation in biomass energy 73
3.3. Economic impact 773.3.1. Direct economic impact 793.3.2. Indirect economic impact 80
3.4. Environmental Impact 81
3.5. Impact in Community policies and in strategic Regional sectors 833.5.1. Energy 833.5.2. Environment 843.5.3. Employment, Regional Development, and Innovation 853.5.4. Agriculture 863.5.5. R&D 87
4. OPERATIONAL RECOMMENDATIONS TO BE IMPLEMENTED BY THEKEY ACTORS 88
4.1. National/Regional/Local authorities 88
4.2. Sectoral operators 89
4.3. European Commission 89
5. SUMMARY OF CONCLUSIONS 91
Bibliography 97
Acknowledgements 100
Contacts 101
Regional Biomass Technological Support Centre
5
EXECUTIVE SUMMARY
In the last decades the European Union has produced a considerable effort in
promoting the development of renewable energy systems because of their possible
environmental, social and economic benefits. Furthermore, in Europe, biomass energy
has the largest potential as compared to other renewable energy sources. However, the
promising results obtained by the research and development activities have not been
transferred to commercial activities as expected; the "diffusion and transfer" of
innovative technologies is still a task weakly accomplished in the European economic
and social system.
Many cultural, political, socio-economic, technological, and organisational
barriers hinder the rapid implementation of biomass energy in many parts of the
world. This is also the case of Castilla y León (CyL), a region in Central-West Spain
which comprises nine provinces including Soria, where this study has been specially
addressed to. Furthermore, it should be pointed out that biomass energy nowadays
often is not competitive with the present cost of conventional energy sources (e.g. oil)
often because the economic externalities are not taken into consideration.
The present study can represent a valuable reference- the object of which
having the appropriate characteristics (local/regional dimension, large biomass
resource availability, high quantity of energy imported for internal use, high un-
employment rate, low industrialisation, etc.)- to which recent European and National
renewable energy policies and programmes are addressed to.
Among other interesting findings, of particular interest is the fact that - rather
than the availability of technological and financial resources - technical assistance and
business & financial consulting resulted as the most effective technology diffusion
and transfer actions to be implemented by a regional bio-energy centre. The energy,
agricultural, industrial and employment benefits that derive from an increased
biomass energy penetration rate in the region claim for a coherent enhancement
between the Cohesion, R&D and Innovation policies of the European Union also
through the implementation of activities such as those proposed in this study.
Regional Biomass Technological Support Centre
6
In Spain, the national government is increasingly recognising the potential
benefits of biomass energy, and thus appropriated policies are being put in place to
support biomass energy schemes. The autonomous government of CyL is also
actively supporting biomass energy and is developing a favourable political
framework and implementation planning, e.g. through the “Plan Enérgetico Regional
de Castilla y León” .
A detailed analysis was carried out in this work to assess the potential, based
on the present biomass availability, and the current use of biomass energy in the
region. CyL resulted with a considerable potential for biomass energy (1.61 Mtoe
from residues and 1.69 Mtoe from energy crops) and a present utilisation that already
accounts for about 9% (i.e. 400 ktoe) of its primary energy consumption (see Biomass
Flow Charts 1.1. and 1.2. pp. 18 and 23). If all the potential was exploited, CyL could
entirely cover its primary energy consumption.
This study proposes that, to help overcome the barriers that hinder the
development of biomass energy in CyL, a Regional Bio-energy Technological
Support Centre (BioCentre) should be set up at the “Centro para el Desarrollo de
Energias Renovables” (CEDER), located in Lubia (province of Soria). This seems the
most appropriate location for the following reasons: i) the existence of an operating
centre (CEDER) which offers appropriate facilities; ii) existence of valuable
infrastructures which are currently under-utilised; iii) good biomass resource base-
Soria province is endowed with natural resources and large extensions of under-
utilised land; iv) considerable local interest in exploiting biomass energy; v)
significant financial efficiencies, e.g. the joint utilisation of the CEDER facilities and
expertise will reduce considerably the costs of establishing the centre; vi) potential
complementary benefits which could be derived from both institutions e.g. scientific
and technical know-how, etc.- the location of the new BioCentre at CEDER will
strengthen the potential for development of both institutions in the future; vii) strong
local support for the centre which could materialise through the commitment by the
socio-economic and political actors.
The study has identified various key activities to be possibly implemented by
the centre which have been grouped as follows (see pp. 41-48):
Regional Biomass Technological Support Centre
7
• Communication, dissemination, and diffusion
• Technological support
• Exploitation of research results.
These activities should act as a catalyst for a greater utilisation of existing
R&D and resources, and provide a further stimulus for greater use of biomass energy
in CyL.
Three main investment scenarios have been proposed to allow the BioCentre
to develop three different sets of activities. The annual costs range from 500 KECU to
1250 KECU, depending on the level of investment, although in the first years these
costs should be slightly lower (see section 2.5).
To estimate the potential socio-economic and environmental impacts, three
scenarios of biomass energy utilisation for Castilla y Leon in the year 2010 are
proposed, based on the regional bioenergy objectives proposed by the “Ente Regional
de la Energía” (EREN, 1997). These scenarios range from the installation of 20 MWe
+ 180 MWth to 85 MWe + 720 MWth of additional biomass energy generation
capacity (see pp. 62-63).
The potential impact on employment range from 1700 to 6700 direct jobs
created and from 500 to 4200 indirect additional jobs, depending on the level of
bioenergy penetration achieved (see section 3.2). In terms of potential economic
impact, the investment necessary to implement the additional bioenergy capacity
ranges from 64 MECU to 256 MECU. Agriculture will be the sector which benefits
the most since 28% of such investment will end up as added value in this sector (see
section 3.3). The construction of biomass energy plants would produce
environmental benefits since the avoided emissions of CO2, SO2, NOx and
particulates would be up to 1,500 Ktonnes, 26 Ktonnes, 5.3 Ktonnes, and 0.6 Ktonnes
respectively.
European and National policies on regional development (e.g. economic
growth, employment, environment, agriculture/forestry, energy, R&D and innovation)
would be significantly strengthened from an increase of biomass energy utilisation in
CyL.
Regional Biomass Technological Support Centre
8
It should be also pointed out that, based on the experience of similar centres in
Europe (surveyed within the activities of the study,-see section 2.1-), the success
strongly depends on local and regional awareness and the commitment by local
entrepreneurs, policy-makers and society towards the support of biomass energy
schemes.
In conclusion, the study’s findings indicate that the creation of such biomass
centre (i.e. the BioCentre) in the Soria province can foster the utilisation of innovative
biomass energy schemes by adopting the most appropriate R&D in the field of
bioenergy. Furthermore, it can be stated that the possible creation of the designed
BioCentre results in many positive impacts ranging from socio-economic
development and better utilisation of natural resources to greater regional
energy independence and cleaner environment.
Regional Biomass Technological Support Centre
9
Liste of Tables
Table 1.1. Electricity production in Spain using renewable energy (1994-5)
Table 1.2. Productivity and costs of energy crops
Table 1.3. Techno-economic data of three direct combustion hypothetical plants in
Castilla y Leon.
Table 1.4. Overall electrical efficiency and operating costs of different gasification
systems
Table 2.1. Main activities carried out by Regional Biomass Energy Centres of Similar
Characteristics to the Proposed BioCentre in Soria.
Table 2.2. Summary of section 2.2.
Table 2.3. Summary of the proposed activities for the BioCentre.
Table 2.4. Annual costs of the personnel, overheads excluded
Table 2.5. Personnel needed by activity, intensity of the activity and category of
personnel
Table 2.6. Investment costs required for each activity, or group of activities,
according to the intensity at which is carried out
Table 2.7. Low investment activities
Table 2.8. Personnel needed along the time for the low investment scenario
Table 2.9. Total annual costs for the low investment scenario
Table 2.10. Medium investment activities
Table 2.11. Manpower needed for the medium investment scenario
Table 2.12. Total annual costs for the medium investment scenario
Table 2.13. High investment scenario activities
Table 2.14. Manpower needed for the high investment scenario
Table 2.15. Total annual costs for the high investment scenario
Table 2.16. Comparison of manpower requirements
Table 2.17. Comparison of total annual costs
Table 2.18. Cost of conversion plants
Table 3.1. Provisional additional capacity of bioenergy proposed for the year 2005 in
Castilla y León
Table 3.2. Scenarios proposed of biomass utilisation for the year 2010 in Castilla y
Leon.
Table 3.3. Biomass resources needed to cover the proposed scenarios
Table 3.4. Jobs created for the construction and installation of a biomass plant
Table 3.5. Number of jobs needed for the construction and installation of the biomass
plants of the three scenarios.
Regional Biomass Technological Support Centre
10
Table 3.6. Direct employment at biomass power stations according to scale.
Table 3.7. Direct job creation for the operating and maintaining of the additional
biomass plants.
Table 3.8. Number of jobs created by multiplying effect for the 3 scenarios of
utilisation.
Table 3.9. Effects on the employment for the three different scenarios of utilisation.
Table 3.10. Sectoral share of the total jobs created when implementing the bioenergy
plants.
Table 3.11. Expected investments for implementing the additional bioenergy capacity
Table 3.12. Sectoral desegregation of the investments to create the BioCentre
Table 3.13. Effects on added value by sector of the investments for the creation of the
BioCentre
Table 3.14. Sectoral desegregation of the investment for implementing a biomass plant.
Table 3.15. Amount of money from the total investment that rebounds as added value in
the different sectors
Table 3.16. Emissions from coal combustion per GWh of electricity and GWh of heat
Table 3.17. Avoided emission for the proposed three scenarios of utilisation
Table of Figures
Chart 1.1. Biomass Energy Flow Chart for Castilla y León
Chart 1.2. Biomass Energy Flow Chart for Soria
Figure 1.3. Biomass conversion processes
Figure 1.4. Gas product from biomass.
Figure 1.5. Diagram showing an IGCC operating system.
Chart 2.1. Comparison of Manpower Requirements for the different Investment
Scenarios
Chart 2.2. Comparison of annual costs for the different investment scenarios
Chart 2.3. Facilities available at CEDER and the centre’s activities that could be
covered by them
Regional Biomass Technological Support Centre
11
0. Introduction
This study has been implemented with the support of the European
Commission (EC), Directorate-General (DG) XIII (Telecommunications, Information
Market and Exploitation of Research) and in the framework of the specific activities
of its Directorate D (Dissemination and exploitation of R&D results, technology
transfer and innovation), and Unit D.1 (Strategic aspects of innovation and
Exploitation of RTD results, and intellectual property). This action originated from a
specific request by DG XVI (Regional Policy and Cohesion) to DG XIII/D.1.
The implementation of the study was awarded to a consortium constituted by
the EC’s Joint Research Centre, Institute for Prospective Technological Studies
(IPTS), who acted as the co-ordinator, King’s College of London (KCL), and Unión
Fenosa Ingeniería (UFISA). The consortium presented an excellent mixture of
complementary competencies.
This activity is related to supporting the European decision-makers in the
management of technological change. The project also fits the convergent objectives
of several European Union policies, i.e. Regional Cohesion, R&D, innovation and
environment. Furthermore, this service, which relates well to the strategic activities of
IPTS, provides a valuable knowledge-basis for the implementation of actions at
regional/local level, attempting, in addition, to improve the understanding of the
impact of adopting new technologies, and their relationship in the socio-economic
context.
The study concerns the feasibility of mobilising resources for the diffusion and
transfer of biomass energy (bioenergy) R&D results in a region of Spain. The
approach used and the results obtained are a valuable reference, applicable to other
European regions, and in line with recent EU and national policies and programmes.
Biomass energy is experiencing a surge in interest in many parts of the world,
there are many reasons for this: greater recognition of its current role and future
potential contribution as a modern fuel in the world's energy supply; its availability,
versatility, and sustainability; a better understanding of its global and local
Regional Biomass Technological Support Centre
12
environmental benefits; perceived potential role in climate stabilisation; the existing
and potential development and entrepreneurial opportunities; technological advances
and knowledge which have recently accumulated on many aspects of biomass energy;
greater understanding of the possible conflict of food versus fuel, etc.
However, there are in place many cultural, political, technological,
organisational, and conflict of interest barriers which hinder a rapid implementation of
such biomass systems. In particular, the R&D effort in bioenergy by public and
private organisations is often dispersed and the best R&D results present difficulty to
be transferred from laboratory to commercial scale. This has been reflected in many
studies such as for example ECOTEC (1996).
This is the case of Castilla y León (CyL), a region in Spain which integrates
nine provinces including Soria.
The study aims at the following:
• identifying existing barriers in the exploitation of research results and
technology transfer in the bio-energy sector in the province of Soria in particular
and in Castilla y Leon in general
• proposing an implementation procedure for overcoming these barriers
based on the definition of a Regional Bio-energy Technological Support Centre
(thereafter as BioCentre) as an operative instrument to enable the mobilisation of
resources for the exploitation of research results and technology transfer
opportunities, and for the promotion of biomass issues into society, policy, and the
economy
• demonstrating technical and economic feasibility of the
implementation of a BioCentre for the study and the promotion of the use of the
Biomass as energy source in Soria (Objective 1 region in Spain)
• evaluating, from a global point of view, the positive or negative
potential contribution of bioenergy activities implemented in the studied area to
meet the objectives of European policies, and in particular those related to:
Regional Biomass Technological Support Centre
13
regional development (economic growth), employment, environment,
agriculture/forestry, energy, R&D and innovation.
Presently there is an operative R&D Centre in Soria that is considered as the
“core” of the centre defined in this study. Given that bioenergy systems have a strong
local/regional dimension, one of the aims of this study has been to implement an
appropriate methodological approach that can be applied to other specific EU regions
of similar characteristics of Castilla y Leon.
The report has been divided in four major chapters:
The first of them examines in detail the present production, utilisation and
potential use of biomass energy in CyL. This is reflected in the "Biomass Energy
Flow Chart" for CyL, in general, and Soria province in particular (see charts 1.1. and
1.2.), along with the collection and analysis of the information on the actual situation
of the studied region and present utilisation of biomass. Moreover, the identification
of most promising biomass energy R&D results, technologies and systems from EU
and National programmes/markets applicable in Soria/Castilla y León is carried out.
Finally, in this chapter, the existing barriers for the use of R&D results and in the
implementation of biomass systems in the region are identified.
The second chapter is the definition and planning of the Regional Bio-energy
Technological Support Centre; the major aim of this chapter is to efficiently define
the appropriate activities to be undertaken in the BioCentre and to elaborate an action
plan for its implementation. Three kind of activities have been proposed:
i) Communication, Diffusion and Dissemination
ii) Technological Support
iii) Exploitation of research results
In addition, an indication of the technical, organisational and economic
requirements is provided as well as a time schedule for implementing the proposed
centre.
Regional Biomass Technological Support Centre
14
Chapter three has the aim of analysing, from a global point of view, the
impact, positive or negative, at a regional level on the employment, the environment,
the economy, and the sectoral policies deriving from the implementation of the
Regional Bio-energy Technological Support Centre (BioCentre) and from its
activities, as defined in chapter 2. The impact, consequence of a larger use of biomass
as an energy source in the region, is studied using as a basis three scenarios of
biomass energy utilisation in Castilla y Leon, for the year 2010.
Chapter four contains the main operational recommendations to be
implemented by the key actors, mainly Local/Regional/National authorities, sectoral
operators and at a European level. These recommendations try to answer the question
of what type of activities are the best to adopt in order to help overcome the existing
biomass barriers and realise the benefits offered by a larger use of biomass in the
region.
Finally, the conclusions of the study are summarised in chapter 5 of this
document.
Regional Biomass Technological Support Centre
15
1. Biomass resources, present utilisation, and R&D results.Monitoring and analysis of existing barriers
The main objective of this chapter is a detail analysis of the existing biomass
R&D results, resources and present utilisation of biomass energy and to identify and
analyse the existing barriers to transfer R&D results into commercial applications in
CyL. It has been divided into six sections.
A general overview of the energy situation in Spain is provided in Section
1.1., particular attention is paid to renewable energy, including some energy policy
issues. The following section, 1.2., concentrates on the region of Castilla y Leon
(CyL) with particular attention to issues related to population, geography, climate,
hydrology, natural resources, energy potential, and current industrial uses of biomass.
Section 1.3. deals specifically with Soria province, more or less in the same order,
including some wider socio-economic and technical issues. Both sections include a
detailed analysis of the biomass energy potential which is illustrated in a “Biomass
Energy Flow Chart”. Each flowchart provides, the following information:
• total biomass production
• biomass theoretically available
• present biomass consumption (energy and non-energy uses)
• present biomass energy use
• producers and users of biomass energy.
Section 1.4. includes a brief analysis of the most promising biomass
feedstocks for CyL, e.g. natural resources, agroforestry residues and energy crops,
taking into account the climatic and soil conditions of the region along with the most
promising R&D results from biomass feedstocks, paying particular attention to
herbaceous crops, short rotation forestry, and agro-forestry residues, together with
industrial residues and MSW.
Biomass conversion technologies are summarised in section 1.5. including
direct combustion, gasification, pyrolysis, and hydrolysis technologies. Section 1.6.
Regional Biomass Technological Support Centre
16
analyses performances, economic issues, and current status at a commercial level of
different biomass energy systems, derived from the above mentioned technologies,
aiming at transforming biomass into more useful energy products, i.e.: heat,
electricity, and liquid fuel for transportation.
Finally, section 1.7. addresses the main barriers associated with the
introduction of biomass energy schemes in general and CyL and Soria province in
particular.
1.1. Spain
Spain is highly dependent on imported energy sources and thus specific
policies have been put in place over the years to reduce such dependency e.g. oil
substitution for domestic sources, energy efficiency, and the promotion of renewable
energy of which biomass is an important component. This is particularly the case for
CyL where indigenous energy resources are being actively promoted through specific
policies.
The general objectives of Spain’s energy policy for the 1990s are presented in
the Plan Energético Nacional 1991-2000 (PEN), whose main objectives include:
1. to guarantee energy supply
2. the diversification of energy supply sources
3. to reduce oil import dependency
4. to provide greater incentives for the utilisation of renewableenergy sources
5. to provide greater emphasis and support to environmentalaspects related to energy production and utilisation.
PEN introduced new policy thinking into the energy sector in Spain. Non-
conventional energy sources are currently receiving a more preferential treatment than
in previous programs, together with technical innovation, environment and other
matters related to consumers’ demand. A further policy change is the emphasis on
privatisation, in particular for electricity generation, which will gradually be
liberalised based on the new EU guidelines on electricity production and distribution.
Regional Biomass Technological Support Centre
17
The specific policy dealing with renewable energies is set out in the Programa
de Energias Renovables (PER), as part of the Plan de Ahorro y Eficiencia Energética
(PAEE). The plan forecasts an increase of about 43% in the use of renewable energy
sources for the period in question, representing an additional increase of 1.1
Mtoe/year by the year 2000 when all sources are taken into account. The total
investment was estimated at 334,000 Million PTAs. (2225 MECU) of which 70,000
Million PTAs will come from the public sector. Public and private investment in this
industry in 1995 represented about 22,000 MPTAs in which some 300 companies are
directly involved. The main aspects of PAEE are:
1. direct public support to renewables which could serve as anexample to the rest of the energy sector
2. diffusion and promotion of commercial applications
3. training of personnel
4. financial support from third parties
5. subsidies.
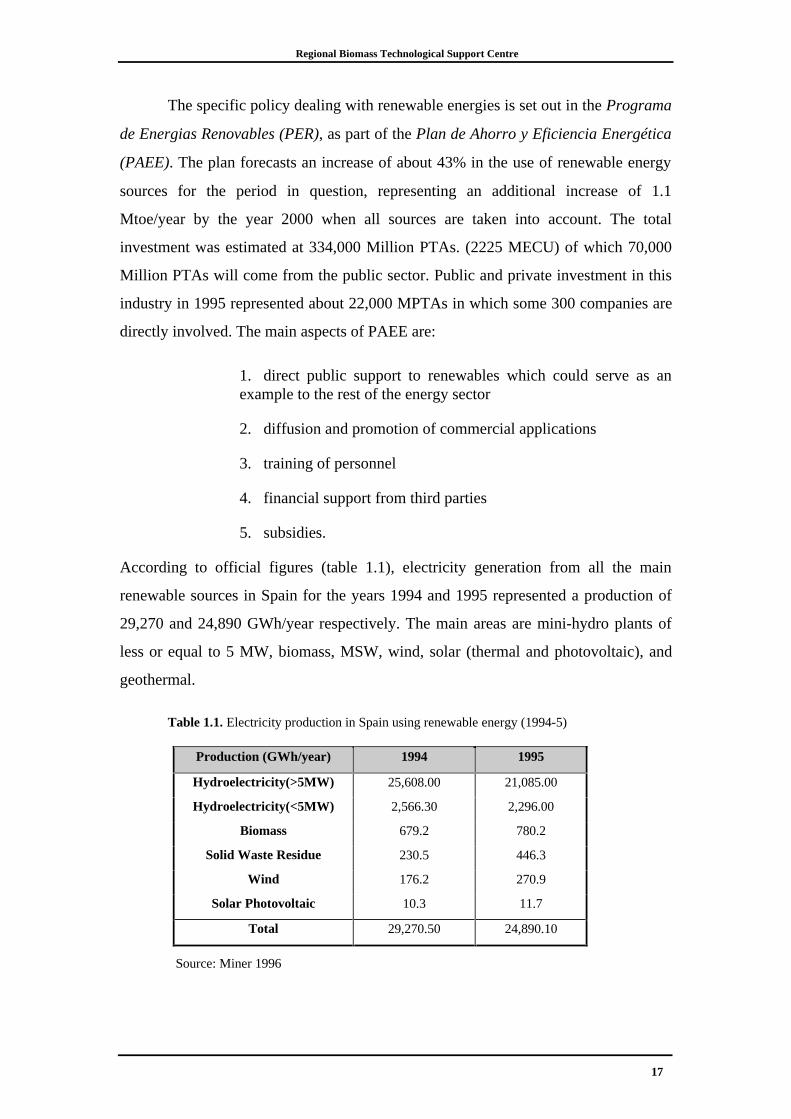
According to official figures (table 1.1), electricity generation from all the main
renewable sources in Spain for the years 1994 and 1995 represented a production of
29,270 and 24,890 GWh/year respectively. The main areas are mini-hydro plants of
less or equal to 5 MW, biomass, MSW, wind, solar (thermal and photovoltaic), and
geothermal.
Table 1.1. Electricity production in Spain using renewable energy (1994-5)
Production (GWh/year) 1994 1995
Hydroelectricity(>5MW) 25,608.00 21,085.00
Hydroelectricity(<5MW) 2,566.30 2,296.00
Biomass 679.2 780.2
Solid Waste Residue 230.5 446.3
Wind 176.2 270.9
Solar Photovoltaic 10.3 11.7
Total 29,270.50 24,890.10
Source: Miner 1996
Regional Biomass Technological Support Centre
18
1.2. Castilla y León (CyL)
The Autonomous region of Castilla y León, where the province of Soria is
located, is Spain's largest region with 94,224 Km2, representing about 19% of the
country's land area, comprising 9 provinces. CyL has a population of about 2.5
million with a density of 26.6 inhabitants per Km2, very low compared to a national
average of 78.5 inhabitants/ Km2. Population density varies considerably from 60
inhabitants/ Km2 in Valladolid province to 9 inhabitants/ Km2 in Soria. The birth rate
is also lower while its death rate is higher than the national average. In addition, there
is a strong emigration trend which has resulted in an overall population decline over
the past few decades.
Another important aspect in population trends is the rapid urbanisation and
population concentration in a few towns e.g. Valladolid, Burgos, Salamanca and
León, which represent approximately a third of the total population of the region. This
calls for new approaches to socio-economic development.
Despite adverse geographic and climatic conditions, CyL has a rich, varied
and complex natural vegetation due to the diversity of its territory. Agriculture,
livestock, forestry and mining have historically been the four key socio-economic
sectors of this region.
The agricultural participation of the GDP is much greater in CyL than the
national average e.g. 7.8% (1992) against 4.1% in Spain. However, the industrial
participation is also much greater averaging 26.6% compared to 22.8%, respectively.
Despite the modernisation drive of the past two decades, CyL still has an agrarian
character. Industrialisation arrived rather late and when it did it was mainly due to
investment from outside the region. In addition, the industrialisation process has been
highly concentrated in the provinces of Valladolid and León which represent over
60% of the total industry in CyL.
The region has a total area of 9.4 Mha of which about 42% is cultivated land,
17% is pasture land, 25% is forested land and others 16%. In 1994 the theoretical
primary energy potential of crops, 15.26 M tonnes, was estimated at 249 PJ. An
estimated 26.48 M tonne of forest residues were generated with an estimated energy
value equivalent to 378 PJ.
Regional Biomass Technological Support Centre
19
The possibility of obtaining energy from human and livestock residues on a
medium to large scale in the region is highly unlikely. However, in certain
circumstances and in areas where there is a high concentration of livestock farming,
this may be a viable alternative, albeit be in a small scale.
Forestry has played an important role in this region but unlike other parts of
Spain, where many forests were destroyed or badly damaged by the shipbuilding
industry, the forest of CyL were barely affected due to its distance and transport
difficulties to the shipyards. The greater pressure on these forests has been clearing for
agricultural and livestock expansion. Historically forest land has remained
approximately between 1.6 to 2.5 Mha.
Currently there are about 2.5 Mha of forested land of different types and this
still constitutes an important source of income for many people. In 1994 firewood
production was 364,943 tonnes, roundwood about 799,000 tonnes with a combined
energy value equivalent to 17.4 PJ; in addition, the residue potential has been
estimated at about 1.15 M tonnes (energy potential equivalent to about 17.3 PJ), from
a total of 2.18 M tonnes of wood extracted from the forests,.
The most important non-biomass sources of energy in CyL are coal, nuclear
and hydro power which in 1995 represented 3.20 Mtoe (69%), 1.03 Mtoe (22%) and
0.42 Mtoe (9%), respectively. About 413 Ktoe of biomass were consumed in 1994 of
which the domestic sector was responsible for about 73%, followed by industrial uses
with 26%. These sectors used 17.4 PJ equivalent from biomass compared to 27.4 PJ
from non-biomass sources. The main industrial users of biomass energy in CyL are,
as the rest of Spain, pulp and paper, food and beverages, wood and furniture,
ceramics, and cement industries.
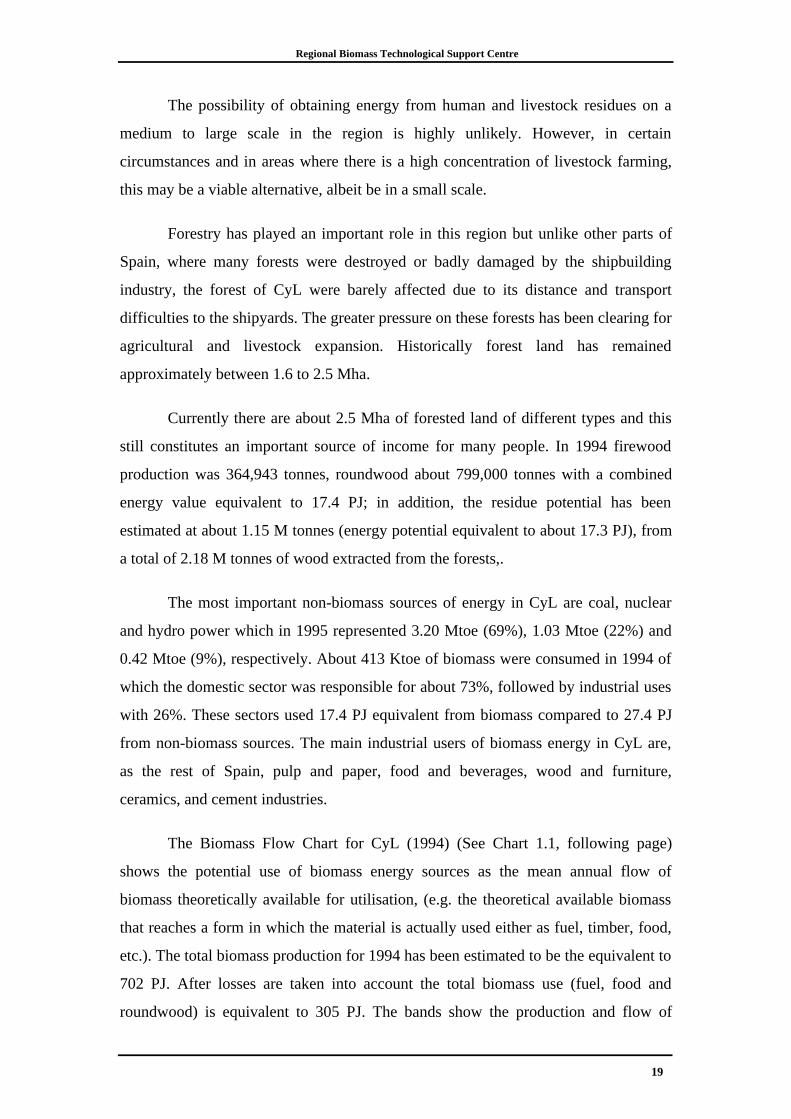
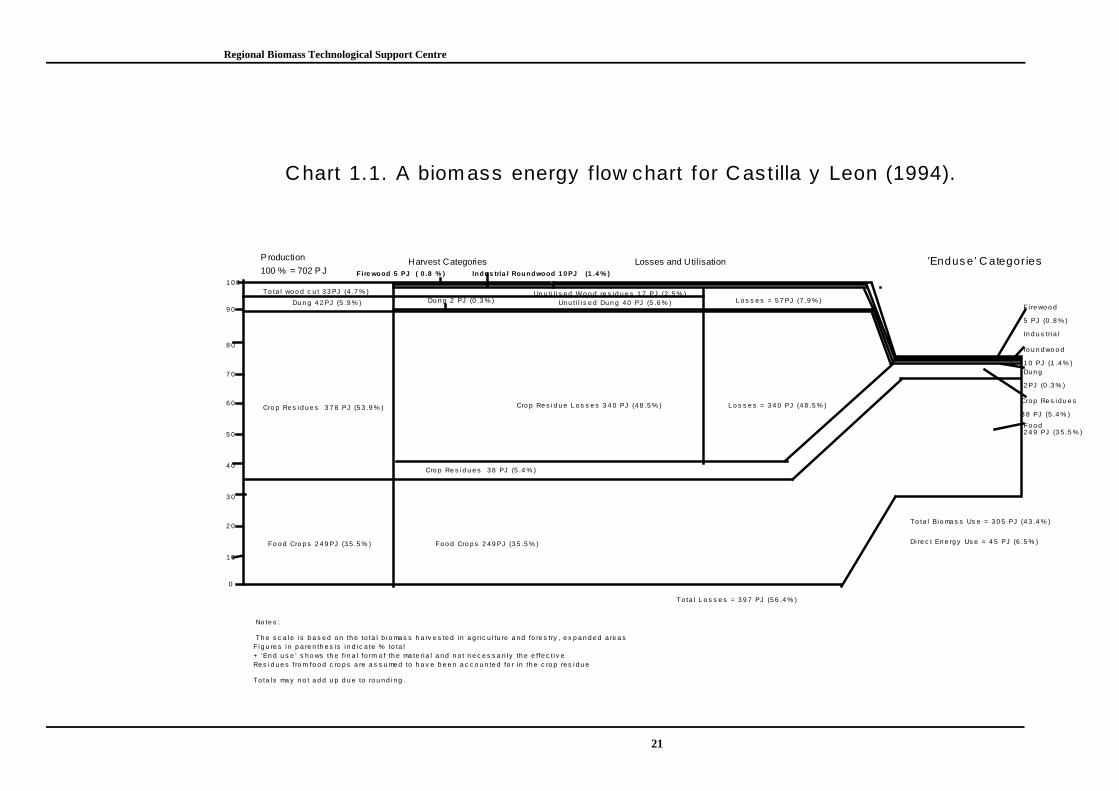
The Biomass Flow Chart for CyL (1994) (See Chart 1.1, following page)
shows the potential use of biomass energy sources as the mean annual flow of
biomass theoretically available for utilisation, (e.g. the theoretical available biomass
that reaches a form in which the material is actually used either as fuel, timber, food,
etc.). The total biomass production for 1994 has been estimated to be the equivalent to
702 PJ. After losses are taken into account the total biomass use (fuel, food and
roundwood) is equivalent to 305 PJ. The bands show the production and flow of
Regional Biomass Technological Support Centre
20
biomass use category from the point of production to the final use as a percentage of
the total biomass harvested, in an approximate scale.
The total biomass energy theoretically available from wood cut at present has
been estimated at 33 PJ. After losses (18 PJ) have been taken into account,
approximately 15 PJ are used now (5 PJ for firewood, and 10 PJ for industrial round
wood).
Biomass is a promising source of energy for this region particularly forest
residues which are still mostly wasted. Other residues from crops, livestock, fruit
trees, etc., have other alternative uses, e.g. some industry uses, animal feed and
bedding and thus it is perhaps unrealistic to regard them as a potential source of
energy in CyL. Nonetheless there may be circumstances in which its use as energy
source may be justified. The total estimated potential of crop residues available as an
energy source is equivalent to 340 PJ of the total.
Regional Biomass Technological Support Centre
21
No te s :
Th e s c a le i s b a s e d o n th e to ta l b i o ma s s h a rv e s te d i n a g ri c u l tu re a n d fo re s try , e x p a n d e d a re a s
+ ’En d u s e ’ s h o ws th e fi n a l fo rm o f th e ma te ri a l a n d n o t n e c e s s a ri l y th e e ffe c t i v ed i d PJ 1 0
F ig u re s i n p a re n th e s i s i n d i c a te % to ta l
P roduction
100 % = 702 P J
Re s i d u e s f ro m fo o d c ro p s a re a s s u me d to h a v e b e e n a c c o u n te d fo r i n th e c ro p re s i d u et
To ta l s ma y n o t a d d u p d u e to ro u n d i n g .
Harvest Categories Losses and Utilisation
To ta l wo o d c u t 3 3 PJ (4 .7 % )
Fire wood 5 PJ ( 0 .8 % ) Indus tria l Roundwood 1 0 PJ (1 .4 % )
Du n g 4 2 PJ (5 .9 % )
Cro p Re s i d u e s 3 7 8 PJ (5 3 .9 % )
Fo o d Cro p s 2 4 9 PJ (3 5 .5 % )
Du n g 2 PJ (0 .3 % )
Cro p Re s i d u e L o s s e s 3 4 0 PJ (4 8 .5 % ) L o s s e s = 3 4 0 PJ (4 8 .5 % )
L o s s e s = 5 7 PJ (7 .9 % )Un u ti l i s e d W o o d re s id u e s 1 7 PJ (2 .5 % )
Un u t i l i s e d Du n g 4 0 PJ (5 .6 % )
Fo o d Cro p s 2 4 9 PJ (3 5 .5 % )
Chart 1.1. A biom ass energy f low chart for Castilla y Leon (1994).
Fo o d2 4 9 PJ (3 5 .5 % )
F i re wo o d
5 PJ (0 .8 % )
In d u s tri a l
ro u n d wo o d
1 0 PJ (1 .4 % )Du n g
2 PJ (0 .3 % )
Cro p Re s i d u e s
3 8 PJ (5 .4 % )
0
4 0
7 0
1 0 0
9 0
3 0
2 0
6 0
5 0
1 0
Cro p Re s id u e s 3 8 PJ (5 .4 % )
8 0
Di re c t En e rg y Us e = 4 5 PJ (6 .5 % )
To ta l Bio ma s s Us e = 3 0 5 PJ (4 3 .4 % )
To ta l L o s s e s = 3 9 7 PJ (5 6 .4 % )
’Endus e’ C ategor ies
Regional Biomass Technological Support Centre
22
CyL, according to the National policy and realising the benefits that renewable
energies provide, has developed a favourable framework for renewable energy that is
captured in the Plan Energético Regional de CyL (PERCYL). This programme has
the objective of consuming some additional 117 Ktoe of energy from biomass in the
region by the year 2005 (the current consumption is of about 400 ktoe); 10,3 Ktoe
from them would be electricity (about 120 GWh). For the achievement of this
objective several action lines are being carried out, some of them are taken into
account to be carried out in the centre, as it will be pointed out hereafter:
1. Creating an adequate climate for the development of R&D
activities in the region (Universities, research centres, and companies)
2. Training technicians for the design, manufacturing, operating
and maintaining of installations
3. Quantification of existing resources
4. Promoting the creation of a market
5. Research of financing solutions
6. Promotion of a centre which channels the development of
renewable energies technologies. This is the “Ente Regional de la
Energía” (EREN)
7. Making possible the follow up of demonstration projects,
assessing their impacts and promoting the diffusion of the results.
It is worth noticing that the proposed centre could be promoted as a part of the
point 6 above mentioned. In summary, renewable energies in CyL, and in particular
biomass energy, appear to have a potential bright future due to a combination of
availability of natural resources and political support at the highest regional level.
1.3. Soria
Soria has a land area of 10,036 Km2 (1.03 Mha), and a population density of 9
inhabitants/ Km2. Soria has been described as Spain’s poorest, coldest, more isolated,
Regional Biomass Technological Support Centre
23
less populated and less industrialised province. Its territory is diverse comprising
different natural areas in which poor soil and adverse climatic conditions
predominate. The geography of the province is characterised by high mountain
ranges, which have historically acted as a major impediment to socio-economic
development.
Natural Resources. Although there has been significant changes in recent years
such as increased urbanisation, industrialisation, migration, etc., the economic base of
this province still continues to be largely based on three traditional sectors: i)
agriculture, ii) livestock, and iii) forestry, all of which are declining as a source of
wealth and employment generation. Currently the largest source of employment in the
province is the service sector. Almost 92.5% of the province’s land area could be
regarded as suitable either for agricultural, livestock or forestry.
Agriculture still predominates, consisting mostly of unirrigated cereal
production, cultivated on a rotation basis. The best lands are rotated with legumes but
the most frequent practice is called “cultivos de año y vez”, which consists of planting
one year followed by another fallow year. This means that in any one year only a
small proportion of the land is actually cultivated for cereals or any other crop e.g. in
1994 only about 4% of the land was actually dedicated to crop production.
Traditional agriculture was aimed at self-sustainability and soil fertilisation
was largely by organic means, e.g. by applying animal manure to the agricultural
fields. For this reason there was a strong relationship between agriculture and
livestock. Mechanisation and utilisation of chemical fertilisers have broken this
relationship and brought many social and economic changes to the Sorian
countryside. Agricultural production and productivity is still low even by regional
standards. In 1994 the province produced 635,579 tonnes of agricultural crops with an
estimated primary energy potential of 10.6 PJ. The energy potential from residues has
been estimated at 14.8 PJ from 975,599 tonnes and an utilisable energy potential
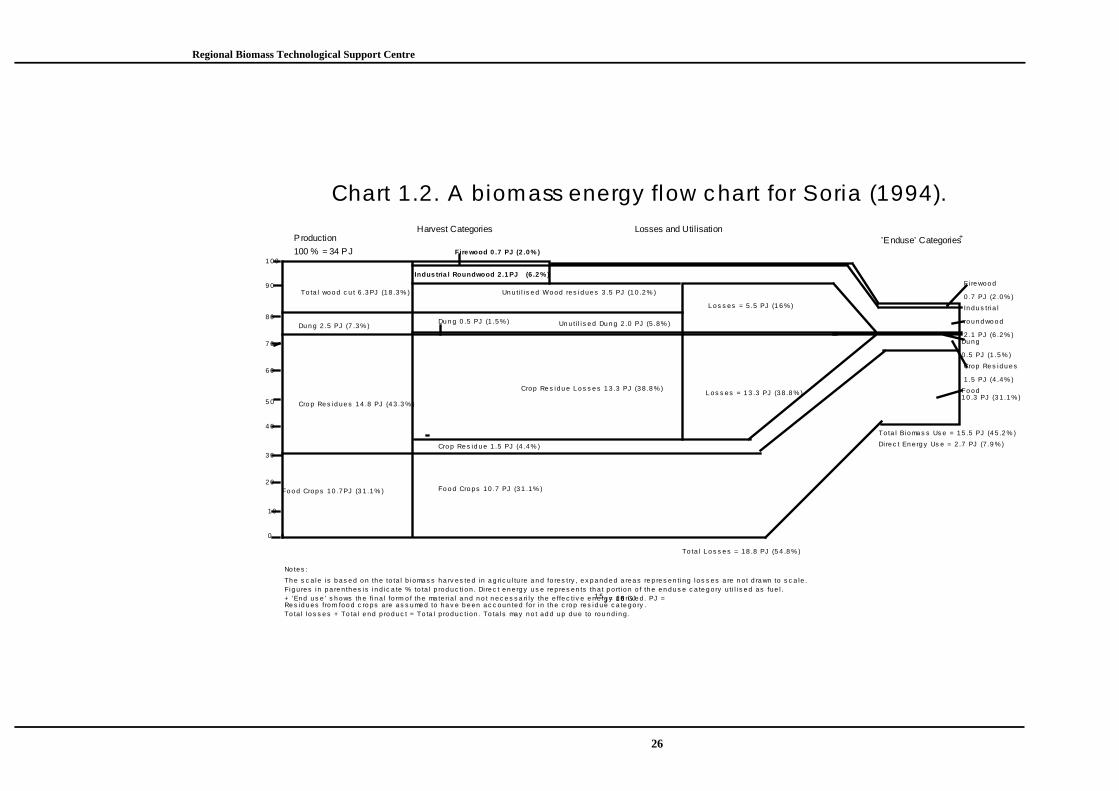
equivalent to 5.0 PJ. (See Chart 1.2)
Forestry is still an important activity for this province although it is now
declining. There have been important changes in the past but the total forested land
area has not changed dramatically. An important feature of the forested land has been
Regional Biomass Technological Support Centre
24
the interconnection with livestock production. Large areas of land were cultivated and
then abandoned because of low productivity and with time became secondary forests
and pasture lands, suitable only for animal grazing. Thus many of the Soria’s forests
can in fact be regarded as secondary or tertiary forests, with less than 20% canopy
cover.
More recently there has been a reduction of public/community owned forest
land in favour of the privately owned land. An important characteristic of the past
three decades has been an increase in afforestation activities stimulated by the
government (Ley de Montes de 1957) often for environmental and ecological reasons
rather than commercial e.g. some 44,300 ha by 1969. (IFN-2, 1994). Forest
production was estimated at 223,377 tonnes with an energy potential value equivalent
to 2.8 PJ. The estimated utilisable residue potential is 1.2 PJ.
During the past few decades there has been a profound transformation in the
way forests are being exploited in the Soria province. This is for a number of reasons,
including: i) changing population trends, in which emigration out of the province,
provincial towns and villages, are important features. Emigration and urbanisation,
together with low birth rate, mechanisation, etc., have depopulated the Sorian
countryside; ii) economic and social changes which have resulted in greater economic
diversification away from the traditional sectors e.g. service sector, iii) declining
economic value of agroforestry activities. For example, it is often argued the cost of
afforestation and management of Sorian forest exceeds its benefits and that if these
forests are to have a future other alternative uses are urgently needed e.g. recreational
and educational.
Only those people living in mountain villages are still largely dependent on
income generated from forestry activities. The decline in agriculture, livestock and
forestry activities are all helping to depopulate the countryside. The irony is that this
trend should facilitate the gradual expansion of the forests. This problem is further
exacerbated by its geography, and unequal land ownership which is dominated by a
large number of very small land holdings.
Energy consumption in the province of Soria is also low due to low population
density and low industrial level. An important characteristic is that Soria does not
Regional Biomass Technological Support Centre
25
have any electricity thermal power plants. Taking all sources together, Soria produced
in 1994 about 2.18 M tonnes of biomass equivalent to 34 PJ compared to 702 PJ for
CyL as a whole. The total biomass consumption was about 940,000 tonnes (15 PJ)
against 304.7 PJ for CyL. The biomass energy theoretically available for utilisation in
Soria is also illustrated in the Biomass Flow Chart (see chart 1.2.), e.g. 34 PJ in 1994
which includes wood cut, dung, crop residues and food crops. The total biomass use
(firewood, roundwood, dung, crop residues and food) is the equivalent to 15.5 PJ.
Total wood cut has been estimated to have an energy value of 6.3 PJ, and 2.1
PJ for roundwood. This is an important source of biomass energy in Soria, but more
data is still required to determine the standing stock of its forests. It is possible that in
certain circumstances crop residues, with estimated value equivalent to 14.8 PJ, and a
present use of 1.5 PJ, may become an important alternative source of biomass energy.
It is clear that there are considerable losses of biomass which offer good opportunities
for waste utilisation. Currently the bulk of these residues are burnt or let in the fields
to rot.
Regional Biomass Technological Support Centre
26
No tes :
Th e s c a le i s b as e d o n th e to ta l b i oma s s ha rv es te d i n a g ric u l tu re a n d fo res try , e x p a nd e d a rea s re p re s en ti ng l os s es a re n o t d ra wn to s c a le .
+ ’End us e ’ s h ows th e fi n a l fo rm o f th e ma te ri a l a n d n o t n e c e s s a ri ly the e ffe c ti v e e n e rg y d e riv e d . PJ =10
1 5J = 1 06 GJ
Fig u re s i n pa re n th es i s i n d ic a te % to ta l p rod u c ti o n . Di re c t e n e rg y u s e re p re s en ts th a t p o rti o n o f th e e n du s e c a te g o ry u ti l i s e d as fue l .
P roduction
100 % = 34 PJ
Re s id u es from foo d c ro ps a re as s ume d to ha v e b e en ac c ou n ted fo r i n th e c rop res id ue c a te go ry .To ta l l o s s e s + To ta l e nd p ro d uc t = To ta l p ro d uc ti on . To ta ls may no t ad d up du e to rou n d in g .
Harvest Categories Losses and Utilisation
To ta l woo d c u t 6 .3 PJ (18 .3% )
Fire wood 0 .7 PJ (2 .0% )
Indus tria l Roundwood 2 .1 PJ (6 .2 % )
Du n g 2 .5 PJ (7 .3% )
Cro p Re s id ue s 14 .8 PJ (4 3 .3 % )
Fo o d Crop s 10 .7PJ (3 1 .1% )
Du n g 0 .5 PJ (1 .5 % )
Crop Re s idu e L o s s e s 1 3 .3 PJ (3 8 .8 % )L os s es = 1 3 .3 PJ (3 8 .8 % )
L os s es = 5 .5 PJ (1 6 % )
Un u ti l i s e d Wo od res id ue s 3 .5 PJ (1 0 .2% )
Un u ti l i s e d Du n g 2 .0 PJ (5 .8% )
Fo o d Cro ps 10 .7 PJ (3 1 .1% )
Chart 1.2. A biomass energy flow chart for Soria (1994).
Fo odC1 0 .3 PJ (3 1 .1 % )
Fi re woo d
0 .7 PJ (2 .0% )
In du s tri a l
ro un d wo o d
2 .1 PJ (6 .2% )Du ng
0 .5 PJ (1 .5% )
Crop Re s idu e s
1 .5 PJ (4 .4% )
10
0
5 0
4 0
7 0
1 00
9 0
3 0Cro p Re s id u e 1 .5 PJ (4 .4% ) Dire c t En e rg y Us e = 2 .7 PJ (7 .9 % )
To ta l Bio ma s s Us e = 15 .5 PJ (4 5 .2 % )
’Enduse’ Categories+
To ta l L o s s e s = 18 .8 PJ (5 4 .8 % )
8 0
6 0
2 0
Regional Biomass Technological Support Centre
27
1.4. Overview of most relevant European R&D Results: Biomass Feedstocks
There is a wide range of materials that can be used as biomass resources; they
can be sorted within three groups according to their origin: natural, energy crops and
residues. However, only ecologically sustainable energy crops and utilisation of
biomass residues are hereafter considered (i.e. biomass residues and energy crops).
• Biomass residues:
Biomass residues are organic by-products of food, fibre, and forest production.
In the case of MSW (Municipal Solid Wastes) these residues also include other
organic and inorganic components. At present these residues are readily available
often at very low, zero, or even at negative cost, and excluding some specific
industries such as the pulp and paper industry, most residues are not used for energy
purposes.
Agricultural and forestry residues: The leaves and those parts of the
plant that are left on the floor after harvesting. Only 25-35% of these residues
are recoverable as the rest must be left on the ground to provide nutrients to
the soil and help prevent erosion. Cattle dung, and other animal manure, has
been used in many parts of the world for energy either to burn directly or to
produce biogas, but this option is only realistic for large cattle farms. Forestry
residues are those that are available after harvesting the forest or other
operations such as pruning. The same problems concerning fertilising and
erosion apply here; in addition, it must be pointed out that fire risks can be
reduced by removing the residues.
Industrial residues: They are generated when processing the raw
material at the industries (food-processing industry, forestry industry,
chemical industries). This form of biomass is the cheapest, and it would be
both economically and environmentally desirable to use these residues for
energy purposes. There are some examples of industries in CyL that make use
of their residues to produce energy.
Regional Biomass Technological Support Centre
28
Municipal Solid Wastes are the wastes generated by households,
commercial and institutional operations, and some industries; these include
waste paper, wood, yard wastes, plastics, metals and the unsorted MSW itself
such as organic wastes. Disposal of wastes has become a major problem for
cities. It is estimated that 1 kg of MSW is generated per person and day in
industrialised countries and from 0.5 to 0.7 kg/day per capita in developing
countries. There are several ways to treat these wastes: recycling, landfilling,
composting, thermochemical treatments (mainly incinerating, but also
gasifying and pyrolysing) and biological treatments.
• energy crops:
There are several characteristics highly desirable for energy crops, the main
aim being to achieve high yield at low cultivation costs. We take into consideration
the following classification:
Herbaceous energy crops (HEC): These are perennial crops with
usually high productivity, short growth cycles and diversity. HEC comprise
many varieties that can be harvested for their total aboveground cellulose
material, although as yet only a handful can be regarded as serious contenders
for biomass energy feedstocks. The productivity of herbaceous crops can vary
significantly but a major characteristic is their usually high yields.
The herbaceous energy crops that, acording to their characteristics,
seem to be the most appropriate for CyL have been identified in this study as
Cynara, Fibre Sorghum and Miscanthus. The productivity of these crops are
displayed in table 1.2.
Short rotation forestry (SRF): Forest energy plantations usually consist
of intensively managed crops of predominately coppiced hardwoods, grown
on cutting cycles of between 3 and 5 years and harvested solely for use as
source of energy. In most cases, tree planting requires such agricultural
practises as fertilisation, suppression of competition from weeds, and control
from diseases and fauna. Harvesting trees requires specialised equipment that
Regional Biomass Technological Support Centre
29
may be owned co-operatively by groups of energy crops farmers, provided by
contract harvesters or supplied by the conversion facility.
It seems that the SRF most suitable for CyL are Poplar and Eucalyptus
whose costs and productivity are displayed in table 1.2, together with those of
the herbaceous crops.
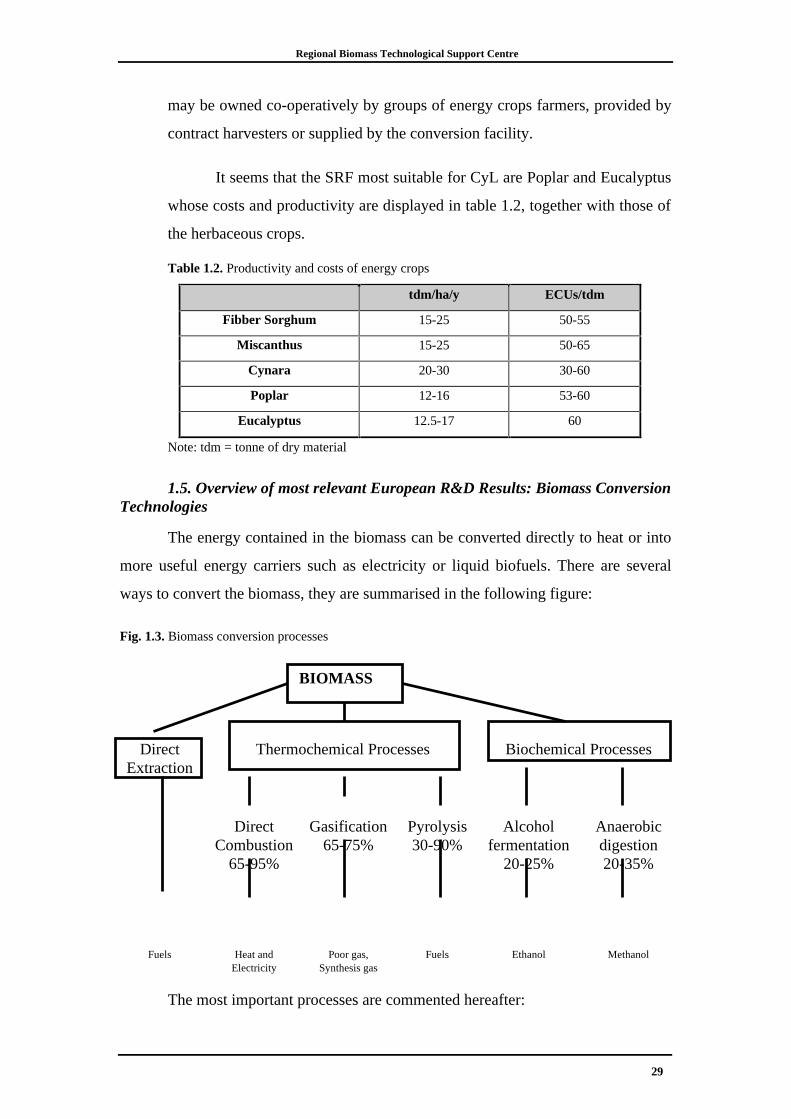
Table 1.2. Productivity and costs of energy crops
tdm/ha/y ECUs/tdm
Fibber Sorghum 15-25 50-55
Miscanthus 15-25 50-65
Cynara 20-30 30-60
Poplar 12-16 53-60
Eucalyptus 12.5-17 60
Note: tdm = tonne of dry material
1.5. Overview of most relevant European R&D Results: Biomass ConversionTechnologies
The energy contained in the biomass can be converted directly to heat or into
more useful energy carriers such as electricity or liquid biofuels. There are several
ways to convert the biomass, they are summarised in the following figure:
Fig. 1.3. Biomass conversion processes
BIOMASS
DirectExtraction
Thermochemical Processes Biochemical Processes
DirectCombustion
65-95%
Gasification65-75%
Pyrolysis30-90%
Alcoholfermentation
20-25%
Anaerobicdigestion20-35%
Fuels Heat andElectricity
Poor gas,Synthesis gas
Fuels Ethanol Methanol
The most important processes are commented hereafter:
Regional Biomass Technological Support Centre
30
• Direct combustion is the easiest and most traditional process of
obtaining energy from the biomass. It is very well established world wide,
especially in Developing Countries, and it is readily available commercially. The
combustion involves the total oxidation of the feed material with the aim of
releasing the maximum high grade heat as possible. MSW incineration is an
application of the combustion technology; incinerating seems to be the most
promising solution for the problem of MSW, especially now that the EC has
announced the complete ban of landfills by the year 2002. Growing importance is
being given in the last years to co-firing technologies; this is the burning of at
least two different fuels at the same time under controlled combustion conditions;
the most usual practice is burning coal and wood.
• Gasification is the process of transforming the solid feed into a gas,
this gas is combustible and certainly easier to use than the solid feed; gasification
is carried out by partial oxidation, this is the oxidation in the presence of a limited
amount of oxidising agent. The oxidising agent can be air, oxygen, steam or a
mixture of them.
Gasification itself has three sequential stages: i) Drying to evaporate
moisture, ii) Pyrolysis to give gas, vaporised tars or oils and a solid char residue,
iii) Gasification of the solid char, pyrolysis tars, and pyrolysis gases to give CO,
CO2, H2, and lesser quantities of hydrocarbon gases (see fig 1.4). A fourth stage of
the process should be added as the gas product has to be cleaned up in order to
reduce erosion, corrosion, and environmental problems in downstream equipment.
Regional Biomass Technological Support Centre
31
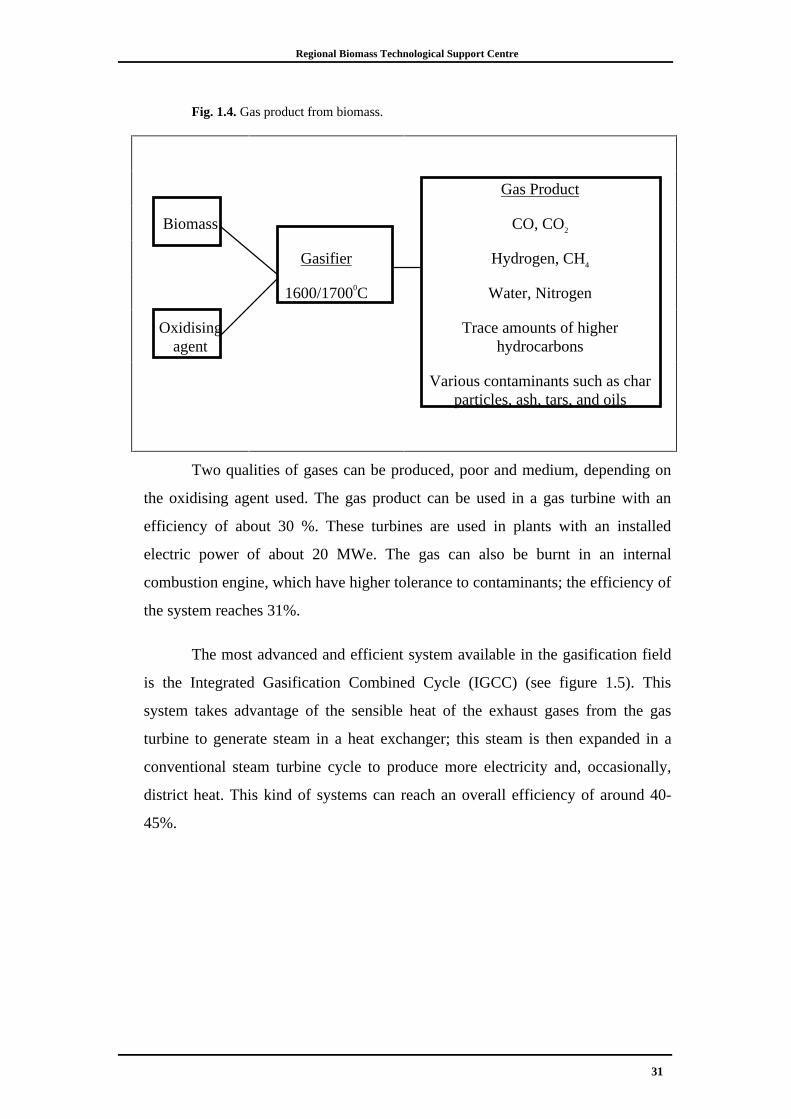
Fig. 1.4. Gas product from biomass.
Gas Product
Biomass CO, CO2
Gasifier Hydrogen, CH4
1600/17000C Water, Nitrogen
Oxidisingagent
Trace amounts of higherhydrocarbons
Various contaminants such as charparticles, ash, tars, and oils
Two qualities of gases can be produced, poor and medium, depending on
the oxidising agent used. The gas product can be used in a gas turbine with an
efficiency of about 30 %. These turbines are used in plants with an installed
electric power of about 20 MWe. The gas can also be burnt in an internal
combustion engine, which have higher tolerance to contaminants; the efficiency of
the system reaches 31%.
The most advanced and efficient system available in the gasification field
is the Integrated Gasification Combined Cycle (IGCC) (see figure 1.5). This
system takes advantage of the sensible heat of the exhaust gases from the gas
turbine to generate steam in a heat exchanger; this steam is then expanded in a
conventional steam turbine cycle to produce more electricity and, occasionally,
district heat. This kind of systems can reach an overall efficiency of around 40-
45%.
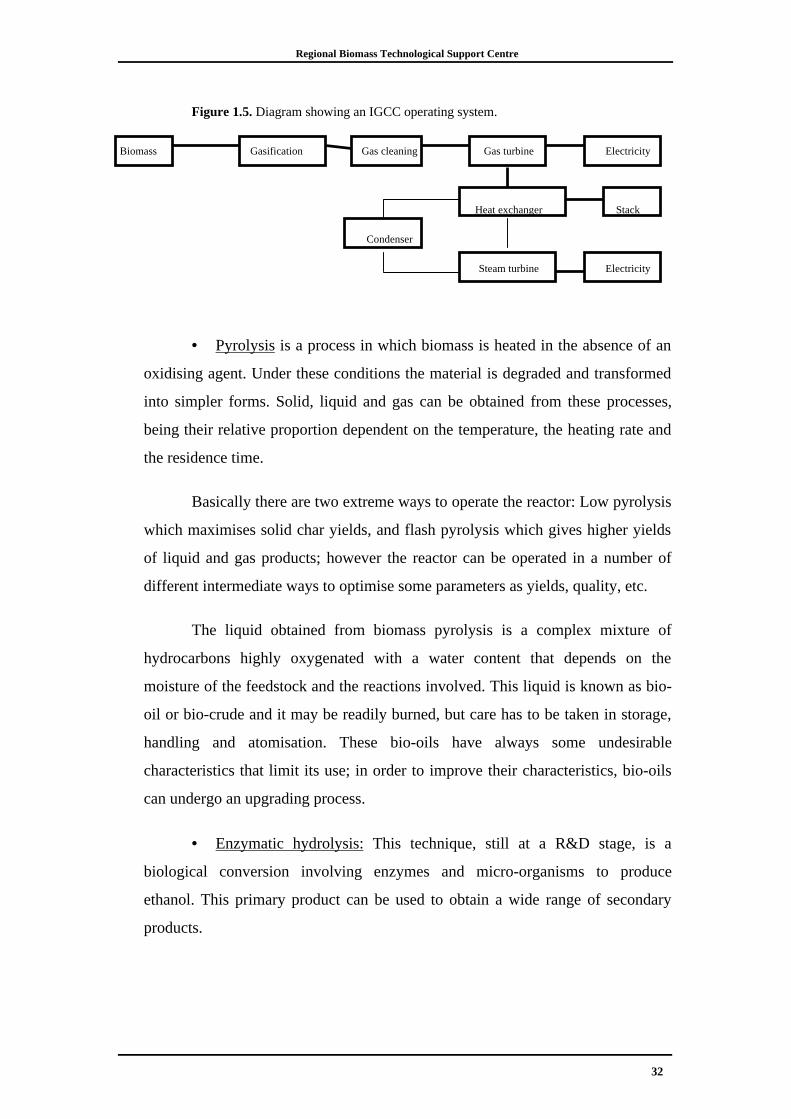
Regional Biomass Technological Support Centre
32
Figure 1.5. Diagram showing an IGCC operating system.
Biomass Gasification Gas cleaning Gas turbine Electricity
Heat exchanger Stack
Condenser
Steam turbine Electricity
• Pyrolysis is a process in which biomass is heated in the absence of an
oxidising agent. Under these conditions the material is degraded and transformed
into simpler forms. Solid, liquid and gas can be obtained from these processes,
being their relative proportion dependent on the temperature, the heating rate and
the residence time.
Basically there are two extreme ways to operate the reactor: Low pyrolysis
which maximises solid char yields, and flash pyrolysis which gives higher yields
of liquid and gas products; however the reactor can be operated in a number of
different intermediate ways to optimise some parameters as yields, quality, etc.
The liquid obtained from biomass pyrolysis is a complex mixture of
hydrocarbons highly oxygenated with a water content that depends on the
moisture of the feedstock and the reactions involved. This liquid is known as bio-
oil or bio-crude and it may be readily burned, but care has to be taken in storage,
handling and atomisation. These bio-oils have always some undesirable
characteristics that limit its use; in order to improve their characteristics, bio-oils
can undergo an upgrading process.
• Enzymatic hydrolysis: This technique, still at a R&D stage, is a
biological conversion involving enzymes and micro-organisms to produce
ethanol. This primary product can be used to obtain a wide range of secondary
products.
Regional Biomass Technological Support Centre
33
1.6. Overview of most Relevant European R&D Results: Biomass EnergyEnd-Uses
The conversion technologies above mentioned are devoted to transform
biomass into more useful energy products. These products can have the following
end-use function: heat, electric power and liquid fuels for transportation.
• Heat can be obtained by direct combustion of biomass as it is done in
the biomass district heating plants. This heat can be used in the domestic sector,
industrial and agriculture. The average size of the systems lies between 1-5 MW,
investment costs are around 1000$/kW. The district heating plant of Lofer
(Austria) is an example of a relatively large system (7 MW). Combustion of wood
has undergone substantial progress in the last decade in the field of domestic
appliances and large collective boilers with automatic feeders.
• Electric power can be obtained by different ways and it is often
coupled with heat co-generation. For example an important biomass-gasification
electricity-generation programme using a combined cycle has been launched in
Finland and has given rise to the THERMIE targeted projects in Denmark,
England and Italy. The aim is to construct three plants of between 8 and 20 MWe,
consuming 50 to 100,000 tonnes of wood per year, and by means of the combined
cycle reaching an electrical efficiency of between 40 and 50%.
• Liquid fuels for transportation can be obtained as well from biomass,
they can be sorted within two groups: alcohol’s, such as ethanol, ETBE, MTBE;
bio-diesel and upgraded pyrolytic oils. Alcoholic fermentation/distillation and
esterification of vegetable oils are both mature technologies while ethanol
production from ligno-cellulose and methanol and gas production from biomass
for fuel cells are still emerging technologies.
This study shows the technical and economic data of three hypothetical combustion
power plants placed in Castilla y Leon, with net electric capacity ranging 10-22 MWe;
net electricity efficiency was found to be 22-25% (table 1.3). The exploitation costs
were 75 ECUs/MWh for a plant of 10 MWe and 58 ECUs/MWh for a plant of 22
Regional Biomass Technological Support Centre
34
MWe. This technology has been implemented in large scale and can be regarded as a
mature technology.
Table 1.3. Techno-economic data of three direct combustion hypothetical plants in Castilla y Leon.
BOILER
CAPACITY:
Nominal (MW) 53,5 53,5 103,5
Thermal
efficiency*(%)
85 85 85
NET ELECTRIC
CAPACITY:
MWe 10 10 22
Net Electricity
efficiency (%)
22 22 25
NET THERMAL
CAPACITY
MWth 35,5 35,5 35,5
OPERATION
TIME
hours/year 7000 8070 7000
CAPACITY
FACTOR
% 90 90 90
ENERGY
PRODUCTION:
Electricity
(MWh/y)
63000 72630 138600
Thermal (TJ/y) 714,8 927,0 1496,8
Total (TJ/y) 1078,1 1398,2 2348,0
Total Expenses (ECUs /MWhe) 75 75 58
* Without losses in transport
Four gasification systems have been taking into account: Pressurised
Gasification Combined Cycle (PGCC), Atmospheric Gasification Combined
Cycle (AGCC), Pressurised Steam Injected Gas Turbine (PSIGT), Atmospheric
Gasification Diesel Power (AGDP). Table 1.4. shows efficiencies and operating
costs for plants with nominal capacities ranging 25 to 60 MWe. Many projects
have been developed and many others are currently under development.
Table 1.4. Overall electrical efficiency and operating costs of different gasification systems
Gasification System Overall Efficiency(Electricity)
Operating costsECU(96)/MWh
PGCC 45,1-42,9 51-54
AGCC 40,9-37,4 54-62
AGDP 33,9 72
PSIGT 34,9-28,9 62-66
Regional Biomass Technological Support Centre
35
Two pyrolysis systems have been analysed: Pyrolysis Diesel Power
(PYDP) and Pyrolysis with a Gas Turbine Combined Cycle (PYGTCC). The
efficiencies of PYGTCC (46,6-51%) were higher than those of PYDP (42,2%);
also the operating costs of PYGTCC (57-76 ECU(96)/MWh) were found to be
lower than those of PYDP (96-110 ECU(96)/MWh). In Europe there are two good
examples of commercial development of the fast pyrolysis process: The pilot plant
built by ENEL with Ensyn technology of a 650 kg/h transport bed reactor; and the
200 kg/h pilot plant of Union Fenosa sited on Meirama (Galicia, Spain).
1.7. Possible Barriers to the Implementation of Biomass Energy Schemes
A number of potential barriers have been identified which have been grouped
into six main categories, as follows:
1. Political and Legislative Barriers: In Spain there is no specific law dealing
with all aspects of biomass, a matter made worse by the many actors involved
resulting from Spain’s present political and administrative structure. There is
considerable political interest at national level to support REs. A good example is the
National Energy Plan and more specifically the Programa de Energias Renovables
which clearly sets the basis for supporting REs projects together with energy
efficiency, under the direct responsibility of IDAE (Instituto para la Diversificación y
Ahorro de la Energía). Despite the general political willingness to support REs, new
measures may still be necessary to improve collaboration between IDAE, the private
sector and the local communities.
The Autonomous Government of Castilla y Leon is a strong supporter of REs,
and has subsequently enacted the necessary legislation e.g. Law No. 23 16 de
February 1995. A further example are the Red de Centros Tecnológicos Asociados
(RCTA). However, it is not clear if the authorities responsible are willing to provide
the necessary economic and financial resources.
2. Social Barriers: Social acceptability and participation are important
elements for the success of biomass energy plants. Many consumers still regard
biomass energy as the poor man’s fuel, both in the developed and developing
Regional Biomass Technological Support Centre
36
countries. Much needs to be done at all levels to change this perception and to show
that bioenergy is a modern energy carrier requiring the application of advanced
technology. Consultation with all parties interested in biomass energy is currently
being conducted.
3. Economic/financial Barriers: This is one of the most important criteria.
Detailed costs analysis are essential. A major constraint for many biomass schemes is
the relatively high cost per unit of output because the small scale nature of most
biomass energy-based projects, high capital and initial investment, high costs of raw
material, low cost of competitive fuel, etc. A major difficulty for biomass schemes is
to find adequate funding because the financial community does not fully understand
what is being proposed. It is well documented that many biomass schemes, although
technically well prepared and costed, often overlook the financial implications. All
these factors have combined in discouraging many potential financial backers and
investors in biomass energy projects. In Spain the cash flow problems have been
particularly serious from an investment point of view because interest rates have
historically been high in comparison to other EU member countries, although this
situation is changing. A further obstacle specific to the Spanish conditions is the
subsidy paid to conventional sources particularly domestic coal.
4. Institutional Barriers: Bureaucratic obstacles can be a major problem
because of the poor understanding that such bureaucracies have about biomass, in
particular those in the conventional energy institutions due the different nature in
which they operate. Integrating new energy sources into the existing energy systems
have always required a long time span. Until quite recently almost all major energy
suppliers were state monopolies or large private corporations which have made it very
difficult for the small independent energy producer to enter the market. This situation
is changing rapidly in Spain where there is an increasing emphasis on privatisation
and open competition. In Soria a specific obstacle can be land ownership since there
is a large number of small farms which are too small for most biomass energy
projects. Setting up co-operatives may be a partial answer but experience shows that
this, sometimes, can be a complicated business.
Regional Biomass Technological Support Centre
37
5. Technical Barriers: Given the nature of biomass energy resources e.g. low
energy density, high transportation costs, the dispersed nature, etc., the total biomass
resource should be studied, in the region, in some detail. Accessibility problems due
to physical barriers, transportation systems, grid connection issues, availability of
equipment, skills, etc. needs still to be investigated in more detail. Soria province is
very mountainous making difficult to use forest residues, the most important potential
energy source. In addition, and in spite of the INF-2, much forest data is still needed
to determine real potential resources.
6. Environmental Barriers: All biomass energy schemes have environmental
costs and benefits which need to be quantified and compared with non-biomass
schemes. Public perception of biomass schemes is important and their views on
possible disruption to habitats, ecosystems, conservation areas, visual effects, etc.,
must be taken into consideration. The conditions in Soria point to far greater benefits
than costs. There are differing attitudes when dealing with biomass energy depending
on the type of resources used.
Energy forests/crops. Much data is still needed on the environmental
influences of large-scale plantations. It is recognised, however, that energy
forestry/crops can help to restore ecosystems which have been degraded. For example,
displacement of annual agricultural crops with perennial energy crops appears to be,
in almost all cases, capable of providing substantial environmental benefits such as
greater vegetative cover throughout the year, thereby increasing soil and watershed
protection, as well as improving wildlife.
Residues. The use of waste wood in its various forms presents opportunities to
address a number of economic, energy, and environmental factors. Energy can be
thought of as just one of the many outputs of forests. Forest managers, special interest
groups, and forest user groups advocate different kinds of forest management for
different values and outputs. Depending on their nature and intensity, forest
management practices can increase some forest resources while decreasing others e.g.
pulp in preference to charcoal.
Regional Biomass Technological Support Centre
38
2. Definition and Planning of the “Regional Bio-energyTechnological Support Centre”
The aim of this chapter of the report is to define the appropriate and efficient
activities for setting up a “Regional Bioenergy Technical Support Centre”
(BioCentre), to be located in Soria province, and to prepare an action plan for its
implementation to help overcome the existing barriers for biomass energy in the
region of Castilla y Leon. Therefore, this chapter provides a clear and efficient
operational tool to be implemented through activities of the BioCentre, as well as
indicates the technical, organisational, and economic requirements for the centre. A
time schedule for the implementation of the centre is also proposed.
Most of the activities are carried out in the centre because one of the obstacles
to the take up of biomass and the other renewable energy technologies is associated
with the absence of collaboration at regional and local levels. The existence of a
centralised agency or centre with the competence and the resources (financial and
human) for promoting and supporting potential projects will greatly facilitate a greater
utilisation of biomass energy. The BioCentre in Soria could run as an efficient local
operator to contribute to the dissemination and exploitation of biomass R&D results.
An alternative to the establishment of a fully-fledged energy agency at regional/local
level, would be the clear development of a department/section within existing
structures with the competence and resources to carry out the tasks similar to those of
an agency (ECOTEC, 1996). There are several examples of regional energy centres in
Europe from which important lessons can be drown; some of them have been taken as
examples in a survey.
Currently there exists an operative R&D centre in Soria, the “Centro para el
Desarrollo de Energias Renovables” (CEDER), that should constitute the basis of the
proposed centre defined in this study. The advantage of using the same existing
infrastructures at CEDER is twofold, as it would require far lower costs, and,
secondly, a synergy would be created with existing know-how that would be mutually
beneficial for both centres. The relationship between the CEDER and the proposed
centre is described in section 2.6.
Regional Biomass Technological Support Centre
39
Section 2.1. assesses a survey of a limited, but representative, Regional
Centres or Agencies of similar characteristics in Europe. This preliminary
“benchmarking” is an useful exercise in the identification of the best solutions, means
and tools to ensure that the activities of Soria’s BioCentre are successfully
implemented, and to avoid possible errors and risks, typical of start-up activities, and
the un-referred elaboration of strategic and managerial planning.
Section 2.2. identifies the main barriers that hinder a wider use of bio-energy
in the region are matches them with general strategies or solutions, to overcome these
barriers, which could contribute to the dissemination and exploitation of biomass as
energy source, throughout the activities of the BioCentre.
Specific activities to implement the solutions previously proposed are outlined
in section 2.3. these activities of definition of the centre include:
Section 2.3.1. considers the specific Communication, Dissemination and
Diffusion activities needed to develop and maintain relationships and communication
flows with the public authorities, local entrepreneurs, farming communities and the
European sources of RD&D information, as well as other International and National
Biomass Energy Networks. Recognising that training efforts are one of the best ways
to diffuse know-how among entrepreneurial, scientific, and public environments, the
establishment of thematic courses is taken into account and analysed as well in this
section.
Technological Support activities are pointed out in section 2.3.2. This includes
the identification of priority lines and the best type of biomass projects to be
promoted and supported by the BioCentre.
The identification of possible activities to favour the commercial exploitation
of RD&D results and the other commercial available know-how is presented in
section 2.3.3.
Section 2.4. deals with the resources, or means, and their characteristics
required by the centre to accomplish its role. Section 2.5. presents an action plan
consisting of three different investment scenarios and a time schedule for its
Regional Biomass Technological Support Centre
40
implementation. Finally, Section 2.6. describes the relationship between the proposed
centre and the CEDER.
2.1. Survey of Renewable Energy Centres in Europe
A survey of the most representative European Centres of similar
characteristics to the proposed one was carried out to identify the pros and cons of
such centres and their potential relevance, usefulness, pitfalls, and lessons that could
be learned in the implementation of the BioCentre at Soria.
Regional agencies for energy and environment are concerned with energy
management and the utilisation of natural resources and waste. In this way, and for a
sustainable development, they serve to protect the environment, the local economy
and national and regional development. The emphasis of their work is placed on the
rational use of energy and the development of local energy sources. Among them
there are many devoted to renewable energies and some of them are devoted almost
exclusively to biomass.
These agencies offer advice and technical assistance to local communities,
small and medium-sized companies and industries, the world of agriculture,
associations and individuals. They constitute a real force of opportunity for all socio-
economic actors in their region.
About 70 such centres were contacted of which only 9 replied to the request,
the list below shows the name of those organisations.
• Energieinstitut Voralberg
• Regional Agency Biomass Energy (Erbe)
• Association Suisse Pour L’energie Du Bois (Aseb)
• Regional Energy Agency Of Crete
• The Styrian Energy Agency
• Association Regionale Biomasse Normandie
• Okoplan
• Association Jurassienne pour la difussion des energies alternatives,AJENA
• Institut Technique Europeen du bois energie,ITEBE
Regional Biomass Technological Support Centre
41
• Irish Energy
The countries that are large users of biomass energy (Austria, Belgium,
Switzerland, France and Norway) showed the greatest willingness to reply to the
request of information. A common characteristic of these centres or agencies was their
specific role in promoting biomass energy. Their general objectives with regard to
biomass energy are summarised below.
Information dissemination. This regards one of the key activities and it is
carried out by means of publications, such as newsletters, information campaigns, a
web site, workshops, meetings, visits, etc.
Training and education, such activities consist of courses, seminars, etc. and
are carried out by some of the centres. These courses are both about general and
specific aspects of biomass energy.
Other general activities include advise about biomass energy issues, including
consulting and auditing, answering specific questions from potential users, etc.. In
addition, some of the centres give technical support or assistance to the setting up of
projects. Most of the centres, as well, have a supportive or authoritative role to
collaborate in defining the local or regional energy planning. This is important as it
allows the centre to give advice to the local/regional authorities of how best
implement policies that favour of biomass energy in the region.
Bioenergy databases receive support in some centres with the aim of
facilitating contacts among key actors. Creating and maintaining a relationship or a
communication channel among the policy and economic key-actors is also important,
particularly if such centres act as a liaison centre.
In general, most of the centres are fully or partially publicly-funded (e.g. EU,
national, regional/local authorities) and some of them carry out the management of
funds available for bioenergy projects, by special promotion programmes giving
financing help, and subventions. The research of financing solutions and financial
arrangements for potential projects is a very interesting activity as this is one of the
main barriers for project developers.
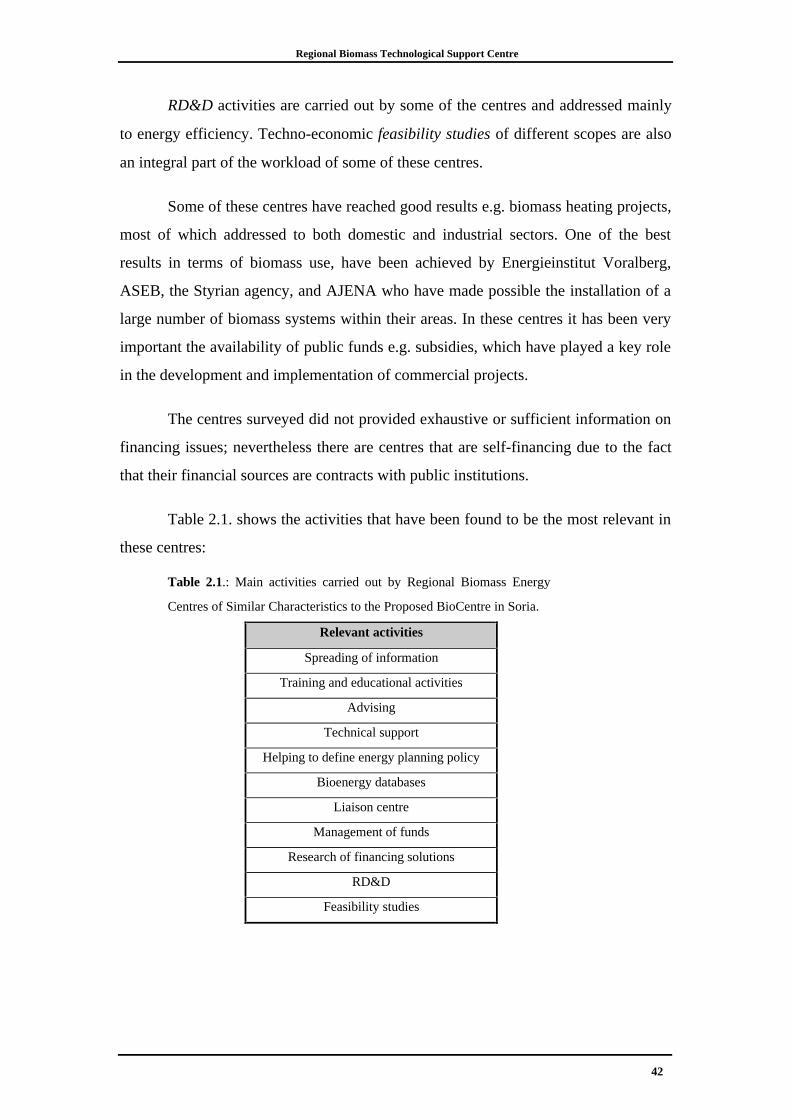
Regional Biomass Technological Support Centre
42
RD&D activities are carried out by some of the centres and addressed mainly
to energy efficiency. Techno-economic feasibility studies of different scopes are also
an integral part of the workload of some of these centres.
Some of these centres have reached good results e.g. biomass heating projects,
most of which addressed to both domestic and industrial sectors. One of the best
results in terms of biomass use, have been achieved by Energieinstitut Voralberg,
ASEB, the Styrian agency, and AJENA who have made possible the installation of a
large number of biomass systems within their areas. In these centres it has been very
important the availability of public funds e.g. subsidies, which have played a key role
in the development and implementation of commercial projects.
The centres surveyed did not provided exhaustive or sufficient information on
financing issues; nevertheless there are centres that are self-financing due to the fact
that their financial sources are contracts with public institutions.
Table 2.1. shows the activities that have been found to be the most relevant in
these centres:
Table 2.1.: Main activities carried out by Regional Biomass Energy
Centres of Similar Characteristics to the Proposed BioCentre in Soria.
Relevant activities
Spreading of information
Training and educational activities
Advising
Technical support
Helping to define energy planning policy
Bioenergy databases
Liaison centre
Management of funds
Research of financing solutions
RD&D
Feasibility studies
Regional Biomass Technological Support Centre
43
2.2. Suggested Solutions for Overcoming the Existing Barriers
The aim of this section is to identify the role that the centre may have to
overcome the barriers that hinder a wider implementation of biomass systems in the
region and thus a better exploitation of the available resources. These barriers have
already been described in chapter 1 of the project (pp. 31-33), but are briefly
mentioned here for comparison with proposed strategies.
Obviously, not all the barriers can be addressed from the centre as there are
some of them whose solution is out of the competencies of the centre. The following
section (2.3) regards the definition of specific activities to carry out these strategies.
The lack of information is one of the most important problems affecting all the
actors involved, as it raised during the visit in Soria. These actors who play a key role
in the development of bioenergy projects are:
• Regional and Local authorities, since they have to provide public
support for biomass energy also from an economic point of view,
• Industrialists and entrepreneurs, since they have to be convinced of
the economic advantages of biomass energy,
• Farming communities, since they also need to be convinced of the
opportunity of increasing their incomes through bioenergy,
• The financing sector, since they have to understand clearly the risks
and implications of such projects,
• Technicians , since they have to acquire know how on biomass energy
projects,
• The general public, since they have to acquire understanding of the
potential benefits deriving from bioenergy, both from the environmental and
economic viewpoint.
It is particularly important to establish communication channels between the
actors and to provide them with access to national and international information on
Regional Biomass Technological Support Centre
44
bioenergy related issues. To improve this situation the centre should carry out
communication and diffusion activities in order to provide all parties involved with
information on biomass energy. An information campaign is proposed to a targeted
audience for all the key actors, with specific information apart from general
awareness. It is important that information is precise and clear to avoid
misunderstandings.
Education is also essential when taking up a new system. Formation of
technicians, farmers, project developers, managers, entrepreneurs, etc. would be
necessary as they have to learn how to growth new crops, techniques, designs,
operating, maintaining, economic issues, etc.. A modular training programme
should be set up in the centre to allow a better understanding of biomass issues.
Social barriers are important as there are different points of view, approaches,
values, priorities and interests. Social acceptability and participation are essential for
the success of biomass energy plants; therefore a campaign of basic awareness
information and rising sensibility should be useful in order to get the social actors
involved in biomass schemes. For example, in order to get the backing of
environmental associations, they should be encouraged to participate in the activities,
evaluating the possible benefits and damages related to biomass energy.
Financial barriers are due to the technical risk and the high investment
(capital) costs. It is often a major difficulty to find adequate funding, even more, that
the financial community understands what is being proposed. A possible solution for
these problems could be an adequate campaign of rising awareness towards the local
authorities and economic actors. In addition the centre could provide the necessary
advice and information to potential project developers to assist them in the
preparation of the business plan to be submitted to a financial organisation in a
manner which sets out all the information a financier requires and is in a form they
can understand. This will enhance the possibility of projects been accepted.
The Local and Regional authorities can play a key role in overcoming existing
problems related to legislation or regulation. One problem is that often these
authorities are not familiar with renewable energies. The centre could be a recognised
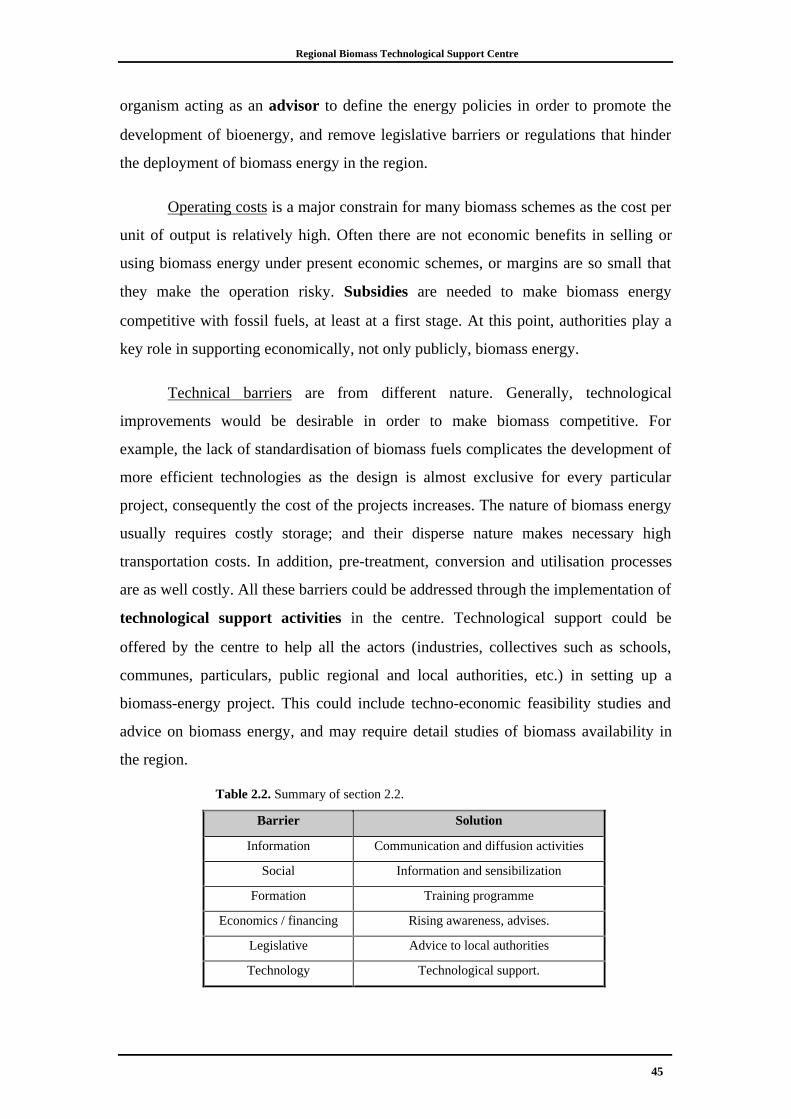
Regional Biomass Technological Support Centre
45
organism acting as an advisor to define the energy policies in order to promote the
development of bioenergy, and remove legislative barriers or regulations that hinder
the deployment of biomass energy in the region.
Operating costs is a major constrain for many biomass schemes as the cost per
unit of output is relatively high. Often there are not economic benefits in selling or
using biomass energy under present economic schemes, or margins are so small that
they make the operation risky. Subsidies are needed to make biomass energy
competitive with fossil fuels, at least at a first stage. At this point, authorities play a
key role in supporting economically, not only publicly, biomass energy.
Technical barriers are from different nature. Generally, technological
improvements would be desirable in order to make biomass competitive. For
example, the lack of standardisation of biomass fuels complicates the development of
more efficient technologies as the design is almost exclusive for every particular
project, consequently the cost of the projects increases. The nature of biomass energy
usually requires costly storage; and their disperse nature makes necessary high
transportation costs. In addition, pre-treatment, conversion and utilisation processes
are as well costly. All these barriers could be addressed through the implementation of
technological support activities in the centre. Technological support could be
offered by the centre to help all the actors (industries, collectives such as schools,
communes, particulars, public regional and local authorities, etc.) in setting up a
biomass-energy project. This could include techno-economic feasibility studies and
advice on biomass energy, and may require detail studies of biomass availability in
the region.
Table 2.2. Summary of section 2.2.
Barrier Solution
Information Communication and diffusion activities
Social Information and sensibilization
Formation Training programme
Economics / financing Rising awareness, advises.
Legislative Advice to local authorities
Technology Technological support.
Regional Biomass Technological Support Centre
46
2.3. Designing of the BioCentre
The proposed Centre should mainly act promoting the bridge of RD&D results
to commercial applications. The Centre’s role of helping the process of technology
transfer is considerably important since this is one of the priority issues for European
innovation and competitiveness, its importance is reflected in many EU policies, and
particularly those for industrial, regional development, co-operation, and RTD.
Considering, for example, that for the latter, the importance of technology transfer -
which is already stressed in the 4th EU RTD Framework Programme (1994-1998)-
has been reaffirmed and emphasised in the contents of the recent proposal presented
by the commission for the 5th RTD Framework Programme (1998-2002). In this
proposal, the beneficial links between technology transfer, innovation and SMEs is
even more evident than in the past. The promotion of REs through the diffusion and
transfer of R&D results is also strongly emphasised in the white paper on REs (EC,
26/11/97).
This study considers that CEDER would provide the centre with initial
scientific and technical facilities to enable the centre to provide support to potential
commercial projects. In Section 2.6. it is discussed a different scenario in which
CEDER would be unable to provide these facilities.
In this section specific activities for the implementation of the proposed
solutions are described. These have been grouped, according to their nature as
follows:
2.3.1. Communication, Dissemination, and Diffusion activities
This section deals with the identification of activities, to be carried out by the
centre, which are needed to develop and maintain relationships and communication
flows with the public authorities, local entrepreneurs, farmer communities, and the
European sources of RD&D information as well as other International and National
Biomass Energy Networks. The lack of information is one of the main barriers to
biomass energy development and use in Soria. The following activities are proposed:
Regional Biomass Technological Support Centre
47
• CDD 1. Liaison and information centre
Liaison centre between industry, business community, local authorities,
and individuals. The objective is to meet regularly to discuss how the
regional/local energy plan can be implemented through the activities of the other
market actors. In this way, a co-ordinated and cost effective strategy can be
developed which harness the power of the market actors in terms of making things
happen within local industry. In addition, other programmes can be set up to
exchange experiences in the field between different organisations, e.g. University
and Industry.
Technology monitoring. A technology monitoring service by which the
centre would be permanently updated about any emerging technology, new
processes, crops, techniques, executed projects, etc., in other words, the state-of-
the-art in biomass energy. The flow of information needed for this service would
be obtained from publications, electronic networks, etc. Therefore it will be
important to be presented in the mailing lists of all the relevant organisations. This
service would allow as well the access to specialised databases, expert advises,
etc..
Permanent information point where industrials as well as private bodies
or local communities can freely ask any information or advice about the use of
biomass as energy.
Technical visits to biomass plants, which would consist of visiting a
successful case study in order to convince the potential users of the economic and
technical feasibility of biomass plants. It can be learned a lot as well from failures
of biomass plants. This has been proven to help understand the nature of the
projects, their scale, risks involved, and the fact that they are “real” commercial
projects, not R&D facilities.
Personal visits to the key actors could help them realise biomass
opportunities and advice them in how to move forward in order to develop their
ideas.
Regional Biomass Technological Support Centre
48
• CDD 2. Dissemination
Several activities can be identified under this heading:
Workshops and seminars could be organised in the centre in order to
share information and to better know the needs and opportunities of potential
biomass users. These events will gather representatives of all the sectors and
experts from other regions. From these workshops, new strategies and specific
activities to implement them could arise.
A periodic bulletin could be published by the centre aiming at informing
potential users of emerging technologies, improvements in costs, projects under
development, etc. This bulletin could be distributed among a targeted audience,
for example those potential users of biomass. Previously, it is necessary to
identify all those who could be potential users. The publication could consist of
few pages identifying what is more important, and there could be an English
version to be sent to international organisations. Additional information about
how to move forward could also be provided. The publication of leaflets can be
also considered.
A web page of the centre on Internet could be created in order to let the
general public know any news related to biomass. This web page could include a
general presentation of the centre, the activities that they develop, general
information on biomass, links to the databases of the centre and of other
organisations, etc.. It would be periodically updated.
A publicity programme could, when possible, be implemented through a
local media campaign (e.g.: radio, press, etc.) to inform the general public about
the benefits of biomass and inform them on the existence of the centre. This
information should consist mainly of the following points: i) Renewable energy
use, ii) Environmental benefits, iii) Reduction of dependence on fossil fuels, iv)
Improvement of farmers economy, v) Social benefits (including employment).
The campaign could be, for example, by means of giving a brochure together with
the local newspaper, an advert on the local TV, or the broadcasting of a biomass
conference by the local radio.
Regional Biomass Technological Support Centre
49
Expositions and presence in events. Publicity by means of expositions at
local/regional University will help to raise awareness in the students community
on biomass issues. These expositions should inform, at a basic level, about
biomass issues and would help the students get involved in biomass energy
schemes. It would be interesting to be present in major events such as fairs, trade
expositions, etc. setting up a stand or similar in order to become more known.
These activities could be sponsored by industries, companies, and public
authorities.
• CDD 3. Training activities
The organisation of courses and technical seminars on biomass issues
addressed to industrials, farmers, technicians, etc. is essential to get a good degree
of diffusion. The following activities are proposed:
Thematic courses. These can be organised in the centre aiming at the
training of post-graduate students. The two main areas to be covered by these
courses are: i) basic principles, e.g.: technologies regarding cropping, harvesting,
collection, pre-treatments, conversion processes, and end-use energy systems. ii)
commercial opportunities from biomass energy, e.g.: financing, economics,
accounting, strategy, human resources management, marketing, etc. For example,
at present, CEDER has a 10 days course on biomass energy, e.g. opportunities and
applications of biomass energy, potential agricultural and industrial applications,
environmental and social impacts, etc..
Short courses. For the formation of industrials, farmers, technicians, etc..
The future centre could develop specific courses in biomass applied technologies
needed to implement R&D commercial activities (e.g. specific courses about
operating different biomass systems; gasification, pyrolysis, fluidised reactors,
etc.). The subjects of these courses can be determined within the same groups as
the thematic courses, i.e. biomass as a business and biomass as technology and
systems.
Regional Biomass Technological Support Centre
50
Exchange of personnel with other laboratories. It is important to provide
the personnel and the activities with a high scientific level, and to improve the
competitiveness of the centre; this can be achieved through a complete training of
its professionals in relevant laboratories in their scope of work.
Sharing access to the facilities. The centre could share the access to its
facilities with universities and other organisations, by mutual agreement of those
involved.
2.3.2. Technological Support Activities.
This section is to identify the possible technological support activities to be
undertaken in the centre. These activities are those aiming at answering questions but
that involve some tests and/or experiments. Technological support can be
commissioned by potential biomass users, developers, financiers, etc.. The main
objective of these projects is to provide the customers with answers to their particular
requests.
From another point of view, these activities have the objective of, firstly,
acting as a mobilising action as it shows the feasibility of the systems; and secondly it
is useful to provide the centre with the appropriate technological capacity.
The lines that have been taken into account for Technological Support
activities are:
• TS 1. Technological support for the adaptation of existing
technologies
This activity has the objective of adapting to the particular bioenergy
system requirements the existing available technologies. It can be quoted as
examples the search of the best solutions for the feeding system of an existing
boiler conventionally fuelled, or the determination of the profitability of using a
determined resource, etc.
Regional Biomass Technological Support Centre
51
• TS 2. Technological support for the adoption of new technologies
This activity has the aim of answering any potential user questions related
to emerging, or not yet available, technologies, in order to facilitate the adoption
of these new technologies.
Gasification, Bioethanol, and Pyrolysis are appearing as promising
technologies for conversion to be included in this activity. Furthermore, it is also
considered new harvesting, pre-treatment, drying, waste disposal, etc.
technologies. This could include the support of demonstration activities, at a pre-
commercial scale, of a given new technology.
• TS 3. Technological support for the adoption of biomass raw
materials
This activity would carry out complete tests of selected materials,
available in the region, aiming at determining optimal operating parameters,
energy consumption, etc.. This would include pre-treatment (chipping, drying,
briquetting, pelleting, etc.), the determination of the most adequate type of boiler
(e.g. the adaptation of the present commercially most used technology,
combustion), the best operating conditions for the particular biomass material and
the particular end-use, etc..
In connection with this line it is interesting to carry out some activities on
standardisation of biomass resources and combustion conditions. It is considered
that a centre of these characteristics should not be directly involved in research but
the centre could be supported in these activities by the CEDER.
For example, a research line of great importance at this moment is the
fluidised bed combustion; this line would investigate operating parameters,
optimal conditions for different types of biomass, efficiency, design
improvements, etc. in order to get higher energy production, lower costs and
minimal environmental impact. Standardisation would investigate both resources
and products, with, for example, the implementation of a briquettes index, the
Regional Biomass Technological Support Centre
52
tendency of ash fouling and slugging, etc.. The access to these backgrounds of
technology developments is essential to provide adequate technical support.
• TS 4. Technological support for the adoption of energy crops
The aim of this line is to demonstrate technical and economical feasibility
of energy crops, making trials of large crops in order to assess the behaviour of the
R&D results in the real life; this would include also the promotion of these crops
and the involvement of farmers by talking to them.
This activity would allow the centre to provide potential users with
answers regarding to questions such as what crop is best suited for the final end-
use required; what conditions are the most adequate to get high biomass
production and low cost, etc.
In relation to this line, and within the framework described in TS 3, it
could be considered the realisation of an activity of R&D on energy crops; this
would research, in limited areas of land, species not well known, as well as
growing techniques, designing of improved techniques of harvesting and storage,
and low environmental impact techniques, such as minimal amount of fertilisers
or herbicides, etc.
This services could be financed by the client who makes the request (co-
operatives of farmers, enterprises, companies, etc.), for example under a technological
support contract, and/or by European Community funds adequate to this purpose,
such as, for instance, the Thermie programme.
2.3.3. Exploitation activities
Within the activities to be carried out by the centre, exploitation actions
appear among the most important activities due to the fact that they deal with the
possible implementation at a commercial level of RD&D results on biomass use field.
It is proposed that the BioCentre in Soria carry out the following activities:
Regional Biomass Technological Support Centre
53
• EA 1. Quantification of resources
This service should be able to identify and quantify biomass resources in
determined areas and should include data on the biomass energy balance to
determine the possibilities of implementing commercial exploitation activities in
different zones of the region.
• EA 2. Characterisation of biomass resources
Determining chemical, physical and energy characteristics. Such analysis
will allow to develop and determine the more suitable solutions from a techno-
economic point of view, for the different types of biomass considered (e.g.
suitability of animal manure, agroforestry residues, energy crops, etc.).
• EA 3. Assessing programmes
The centre should be able to undertake specific assessing services for
public and private bodies and individuals. Consultant service should take into
account specific requirements of final users, as follows:
a) Public and residents’ associations. This area would be focused
on the implementation of biomass energy technology for buildings, district
heating systems as well as the development of specific programmes for the
promotion of biomass uses showing their techno-economic profitability.
For the public, the centre could include general consulting in biomass field
issues like the state-of-the-art of different technologies as well as the
potential of its use in the region in order to increase the knowledge of the
general public about this renewable energy source.
b) Entrepreneurs & SMEs. This program would be focused on
industrial activities related to wood transformation processes as well as
activities in the field of agriculture and livestock. In the industrial sector,
the centre would focus the studies on the use of wood residues generated in
the own processes (e.g. co-generation systems fuelled by wood and wood
residues). The centre should assist industries that want to develop these
Regional Biomass Technological Support Centre
54
energy schemes, helping them in finding the more suitable technologies to
be installed. Moreover the centre could include, when possible, the
implementation of co-operatives that can promote the use of the
agricultural residues generated at small scale (e.g. a network for collecting
these residues to be used in a large conversion plant).
c) Companies and large enterprises. Within this area, the centre
would assist large users of biomass feedstocks (e.g. utilities) in the area,
increasing the knowledge that these companies have about the local
environment trying to develop collaborative programs between them and
small producer of biomass.
d) Regional/local authorities. The centre should assist the
regional/local authorities to develop specific programmes and policies to
promote the use of biomass energy, including the application of new
technological developments.
The centre should propose to carry out feasibility studies in order to
evaluate the resources, potential profitability, and technical possibilities of their
projects. A feasibility study consists of:
1. Identifying energy needs
2. Quantifying and qualifying resources
3. Identifying the optimal technical way(s): resource, transportation,
preparation, storage, conversion technologies and applications
4. Putting in contact all biomass partners: boilers and grinders
manufacturers, local authorities, consultants, banks or third financing parties,
etc.
5. Estimating the economics and looking for financial solutions
6. Following up the projects
7. Advising and advertising.
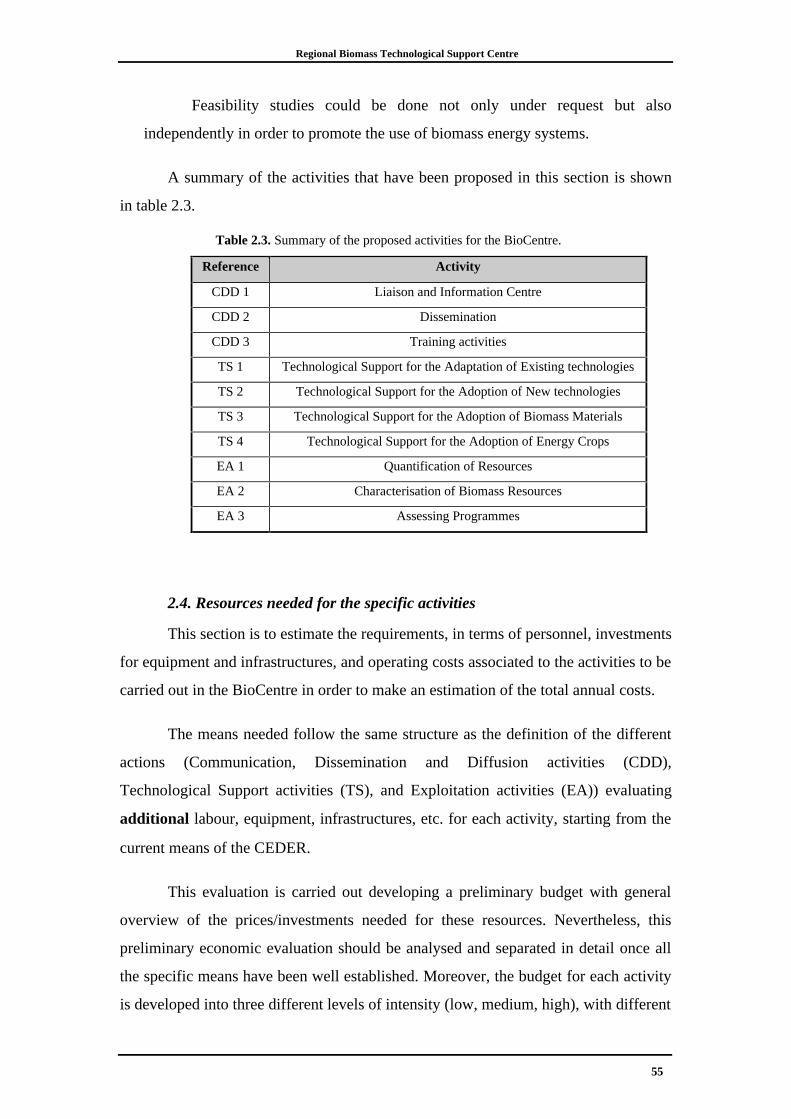
Regional Biomass Technological Support Centre
55
Feasibility studies could be done not only under request but also
independently in order to promote the use of biomass energy systems.
A summary of the activities that have been proposed in this section is shown
in table 2.3.
Table 2.3. Summary of the proposed activities for the BioCentre.
Reference Activity
CDD 1 Liaison and Information Centre
CDD 2 Dissemination
CDD 3 Training activities
TS 1 Technological Support for the Adaptation of Existing technologies
TS 2 Technological Support for the Adoption of New technologies
TS 3 Technological Support for the Adoption of Biomass Materials
TS 4 Technological Support for the Adoption of Energy Crops
EA 1 Quantification of Resources
EA 2 Characterisation of Biomass Resources
EA 3 Assessing Programmes
2.4. Resources needed for the specific activities
This section is to estimate the requirements, in terms of personnel, investments
for equipment and infrastructures, and operating costs associated to the activities to be
carried out in the BioCentre in order to make an estimation of the total annual costs.
The means needed follow the same structure as the definition of the different
actions (Communication, Dissemination and Diffusion activities (CDD),
Technological Support activities (TS), and Exploitation activities (EA)) evaluating
additional labour, equipment, infrastructures, etc. for each activity, starting from the
current means of the CEDER.
This evaluation is carried out developing a preliminary budget with general
overview of the prices/investments needed for these resources. Nevertheless, this
preliminary economic evaluation should be analysed and separated in detail once all
the specific means have been well established. Moreover, the budget for each activity
is developed into three different levels of intensity (low, medium, high), with different
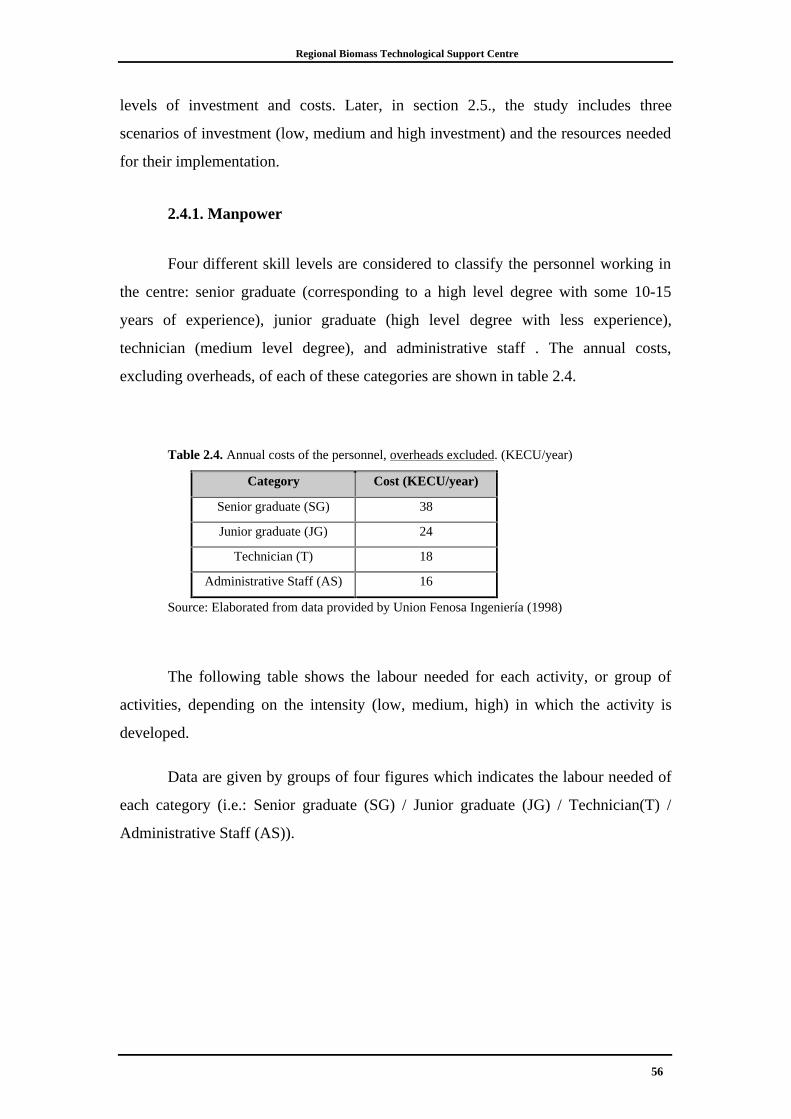
Regional Biomass Technological Support Centre
56
levels of investment and costs. Later, in section 2.5., the study includes three
scenarios of investment (low, medium and high investment) and the resources needed
for their implementation.
2.4.1. Manpower
Four different skill levels are considered to classify the personnel working in
the centre: senior graduate (corresponding to a high level degree with some 10-15
years of experience), junior graduate (high level degree with less experience),
technician (medium level degree), and administrative staff . The annual costs,
excluding overheads, of each of these categories are shown in table 2.4.
Table 2.4. Annual costs of the personnel, overheads excluded. (KECU/year)
Category Cost (KECU/year)
Senior graduate (SG) 38
Junior graduate (JG) 24
Technician (T) 18
Administrative Staff (AS) 16
Source: Elaborated from data provided by Union Fenosa Ingeniería (1998)
The following table shows the labour needed for each activity, or group of
activities, depending on the intensity (low, medium, high) in which the activity is
developed.
Data are given by groups of four figures which indicates the labour needed of
each category (i.e.: Senior graduate (SG) / Junior graduate (JG) / Technician(T) /
Administrative Staff (AS)).
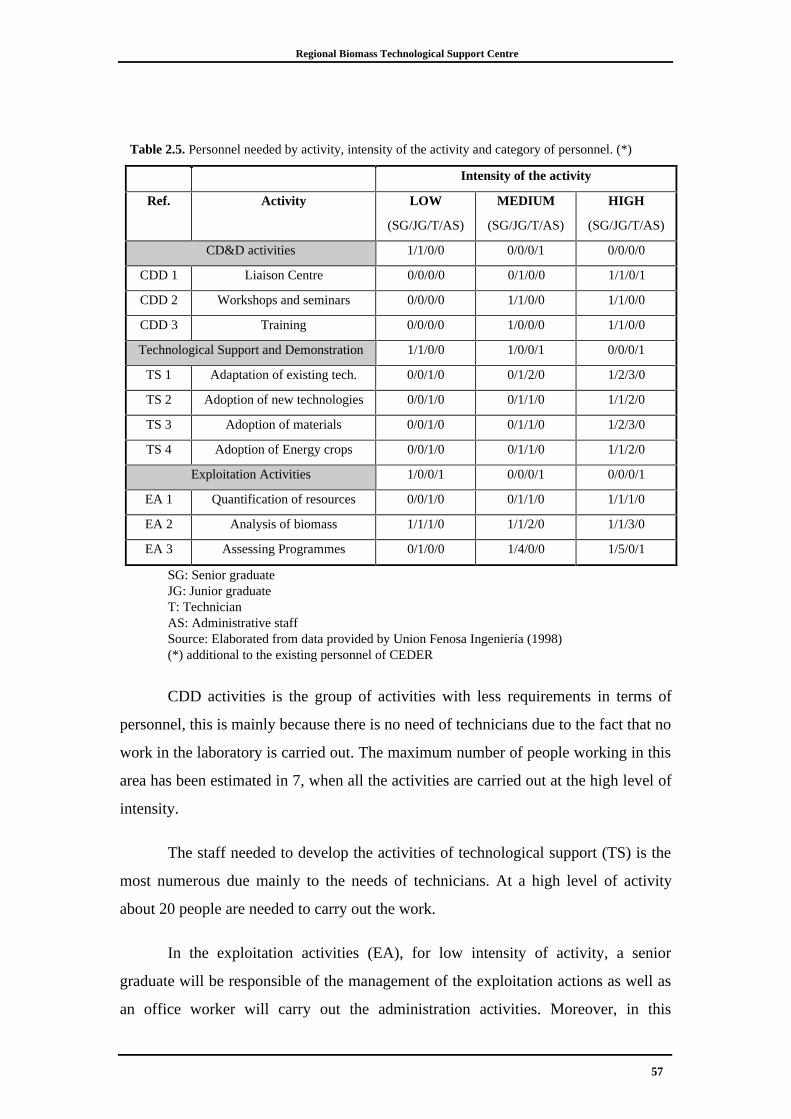
Regional Biomass Technological Support Centre
57
Table 2.5. Personnel needed by activity, intensity of the activity and category of personnel. (*)
Intensity of the activity
Ref. Activity LOW
(SG/JG/T/AS)
MEDIUM
(SG/JG/T/AS)
HIGH
(SG/JG/T/AS)
CD&D activities 1/1/0/0 0/0/0/1 0/0/0/0
CDD 1 Liaison Centre 0/0/0/0 0/1/0/0 1/1/0/1
CDD 2 Workshops and seminars 0/0/0/0 1/1/0/0 1/1/0/0
CDD 3 Training 0/0/0/0 1/0/0/0 1/1/0/0
Technological Support and Demonstration 1/1/0/0 1/0/0/1 0/0/0/1
TS 1 Adaptation of existing tech. 0/0/1/0 0/1/2/0 1/2/3/0
TS 2 Adoption of new technologies 0/0/1/0 0/1/1/0 1/1/2/0
TS 3 Adoption of materials 0/0/1/0 0/1/1/0 1/2/3/0
TS 4 Adoption of Energy crops 0/0/1/0 0/1/1/0 1/1/2/0
Exploitation Activities 1/0/0/1 0/0/0/1 0/0/0/1
EA 1 Quantification of resources 0/0/1/0 0/1/1/0 1/1/1/0
EA 2 Analysis of biomass 1/1/1/0 1/1/2/0 1/1/3/0
EA 3 Assessing Programmes 0/1/0/0 1/4/0/0 1/5/0/1
SG: Senior graduateJG: Junior graduateT: TechnicianAS: Administrative staffSource: Elaborated from data provided by Union Fenosa Ingeniería (1998)(*) additional to the existing personnel of CEDER
CDD activities is the group of activities with less requirements in terms of
personnel, this is mainly because there is no need of technicians due to the fact that no
work in the laboratory is carried out. The maximum number of people working in this
area has been estimated in 7, when all the activities are carried out at the high level of
intensity.
The staff needed to develop the activities of technological support (TS) is the
most numerous due mainly to the needs of technicians. At a high level of activity
about 20 people are needed to carry out the work.
In the exploitation activities (EA), for low intensity of activity, a senior
graduate will be responsible of the management of the exploitation actions as well as
an office worker will carry out the administration activities. Moreover, in this
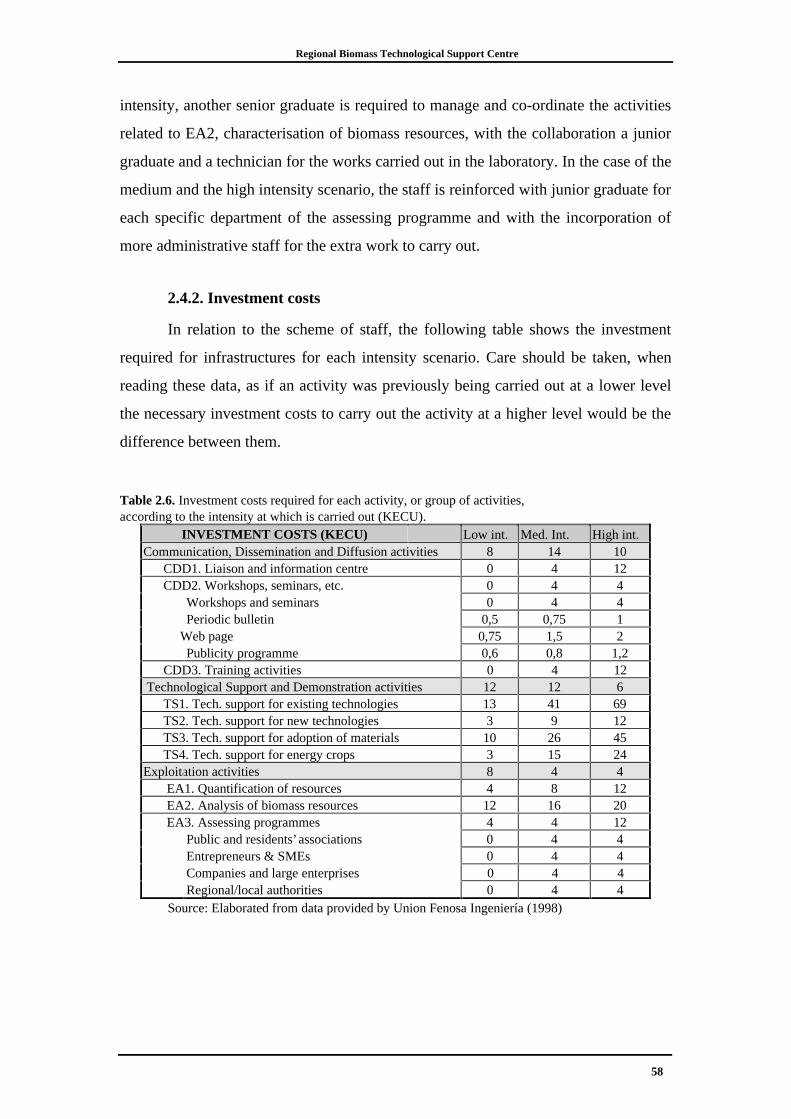
Regional Biomass Technological Support Centre
58
intensity, another senior graduate is required to manage and co-ordinate the activities
related to EA2, characterisation of biomass resources, with the collaboration a junior
graduate and a technician for the works carried out in the laboratory. In the case of the
medium and the high intensity scenario, the staff is reinforced with junior graduate for
each specific department of the assessing programme and with the incorporation of
more administrative staff for the extra work to carry out.
2.4.2. Investment costs
In relation to the scheme of staff, the following table shows the investment
required for infrastructures for each intensity scenario. Care should be taken, when
reading these data, as if an activity was previously being carried out at a lower level
the necessary investment costs to carry out the activity at a higher level would be the
difference between them.
Table 2.6. Investment costs required for each activity, or group of activities,according to the intensity at which is carried out (KECU).
INVESTMENT COSTS (KECU) Low int. Med. Int. High int.Communication, Dissemination and Diffusion activities 8 14 10 CDD1. Liaison and information centre 0 4 12 CDD2. Workshops, seminars, etc. 0 4 4
Workshops and seminars 0 4 4Periodic bulletin 0,5 0,75 1
Web page 0,75 1,5 2Publicity programme 0,6 0,8 1,2
CDD3. Training activities 0 4 12 Technological Support and Demonstration activities 12 12 6 TS1. Tech. support for existing technologies 13 41 69 TS2. Tech. support for new technologies 3 9 12 TS3. Tech. support for adoption of materials 10 26 45 TS4. Tech. support for energy crops 3 15 24Exploitation activities 8 4 4 EA1. Quantification of resources 4 8 12 EA2. Analysis of biomass resources 12 16 20 EA3. Assessing programmes 4 4 12
Public and residents’ associations 0 4 4Entrepreneurs & SMEs 0 4 4Companies and large enterprises 0 4 4Regional/local authorities 0 4 4
Source: Elaborated from data provided by Union Fenosa Ingeniería (1998)
Regional Biomass Technological Support Centre
59
2.4.3. Annual Operating Costs
In order to carry out the evaluation of the maintenance and operating costs,
excluding the labour costs, an extrapolation of usual yields had been made for
consulting and engineering companies (Salas, 1995). According to these data, the
consulting companies tend to show a rate between 60-80% of labour costs and 8-10%
for the operating costs of the total production of incomes. So, an average of 66%
approx. for labour costs and 9.5% approx. have been used for the estimation.
According to this, the operating costs would be of about the 15% of the costs in
personnel.
2.5. Scenarios of investment and action plan
Three possible options are analysed in this study; it must be borne in mind that
intermediate scenarios, between these three, could be also considered. The specific
activities proposed in section 2.3. are classified in these scenarios by priorities:
a) A basic option which is the minimum necessary to make an
adequate impact; this is to be identified as the “low investment scenario”,
b) a number of additional optional activities that make the centre more
interesting although more costly; this is “medium investment scenario”,
c) “high investment scenario” includes all the proposed activities.
For each activity an indication of the intensity along the time with which
should be carried out is also provided. The time horizon has been divided in the first
year, second and third year, and the fourth year. During the second and third year, the
costs and the intensity would be the same.
As previously said, in this study it will be considered that the facilities needed
to offer technological support are available at CEDER; in section 2.6. it is discussed
what would be the situation if CEDER could not provide the centre with the
appropriate capacity.
Regional Biomass Technological Support Centre
60
It must be highlighted that any initiative or scenario for the BioCentre should
be made with the agreement, collaboration, and support of the local/regional
authorities and the industrial and social associations.
In addition it should be stated that some services offered by the BioCentre
could recover money which, in part, can refund the investment and operational costs
of the centre.
2.5.1. Low investment
They are the minimum activities to be carried out in order to make an adequate
impact in the region. The following table shows the nature of the activities and a
timing for their implementation. In this scenario the emphasis is put on the activities
of liaison centre and the technological support activity of adoption of existing
technologies.
Table 2.7. Low investment activitiesReference Activity 1st year 2nd and 3rd year 4th year
CDD 1 Liaison Centre ** ** ***
CDD 2 Dissemination * * *
TS 1 Existing technologies * ** **
TS 3 Adoption of materials * * **
EA 3 Assessing Programmes * ** **
* = Low intensity
** = Medium intensity
*** = High intensity
According to the activities, and their intensity, to be developed in this scenario
the labour needed for the low investment scenario is shown below:
Table 2.8. Personnel needed along the time for the low investment scenario (*)1st year 2nd and 3rd year 4th year
Senior graduates 3 3 4
Junior graduates 2 7 8
Technicians 2 3 3
Administrative staff 1 3 3
Total 8 16 18
Source: Elaborated from data provided by Union Fenosa Ingeniería (1998)(*) Independent from, or additional to, the existing personnel of CEDER

Regional Biomass Technological Support Centre
61
The total costs along the time would be, expressed in KECU/year:
Regional Biomass Technological Support Centre
62
Table 2.9. Total annual costs for the low investment scenario (KECU/year) (*)
1st yr. 2nd yr. 3rd yr. 4th yr.
Labour costs 214 384 384 446Operating costs 32 58 58 67Investment costs 52 38 38 25 From 5th yr. on
Total annual costs 298 480 480 538 513
Source: Elaborated from data provided by Union Fenosa Ingeniería (1998)(*) Cost of amortisation, inflation and interest are not considered
2.5.2. Medium investment
This include a number of additional activities. In this scenario, the
intensification of the CDD activities, technological support, and exploitation actions
are the main characteristics, as they make the cost rise.
The table below includes the activities to be developed in this scenario and an
indication of the intensity along the time.
Table 2.10. Medium investment activities
Reference Activity 1st year 2nd and 3rd year 4th year
CDD 1 Liaison Centre ** ** ***
CDD 2 Dissemination ** ** **
CDD 3 Training ** ** **
TS 1 Existing technologies ** *** ***
TS 3 Adoption of materials * ** **
TS 4 Energy crops * ** **
EA 1 Quantification of resources * ** ***
EA 2 Characterisation of resources * ** ***
EA 3 Assessing Programmes ** ** ***
* = Low intensity
** = Medium intensity
*** = High intensity
In this scenario the requirements of personnel are much higher than
previously, specially because the centre would need some technicians to develop the
additional activities of technological support.
Regional Biomass Technological Support Centre
63
Table 2.11. Manpower needed for the medium investment scenario (*)
1st year 2nd and 3rd
year
4th year
Senior graduates 5 6 8
Junior graduates 5 10 11
Technicians 5 8 9
Administrative staff 3 3 4
Total 18 27 32
Source: Elaborated from data provided by Union Fenosa Ingeniería (1998)(*) Independent from, or additional to, the existing personnel of CEDER
The total costs along the time are:
Table 2.12. Total annual costs for the medium investment scenario (KECU/year) (*)
1st year 2nd yr. 3rd yr. 4th yr.
Labour costs 472 622 622 794Operating costs 71 93 93 119investment costs 130 43 43 26 From 5th yr. on
Total annual costs 673 758 758 939 913
Source: Elaborated from data provided by Union Fenosa Ingeniería (1998)(*) Cost of amortisation, inflation and interest are not considered
2.5.3. High investment
This includes all the proposed activities. In this case, the reinforcement of the
other activities are the main characteristics of this complete scenario. The activities
and their intensity to be developed in the centre are shown below.
Table 2.13. High investment scenario activitiesReference Activity 1st year 2nd and 3rd year 4th year
CDD 1 Liaison Centre *** *** ***
CDD 2 Dissemination ** ** ***
CDD 3 Training ** ** ***
TS 1 Existing technologies *** *** ***
TS 2 New technologies * ** ***
TS 3 Adoption of materials ** *** ***
TS 4 Energy crops * ** ***
EA 1 Quantification of resources ** ** ***
EA 2 Characterisation of resources ** ** ***
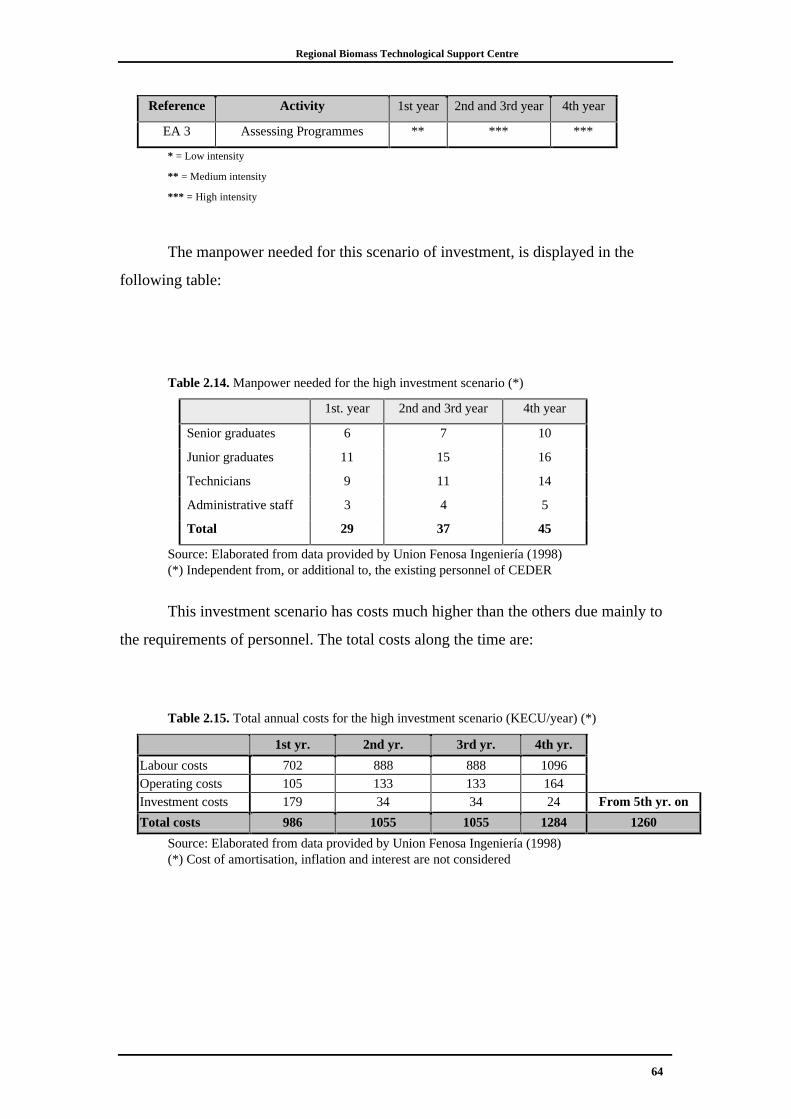
Regional Biomass Technological Support Centre
64
Reference Activity 1st year 2nd and 3rd year 4th year
EA 3 Assessing Programmes ** *** ***
* = Low intensity
** = Medium intensity
*** = High intensity
The manpower needed for this scenario of investment, is displayed in the
following table:
Table 2.14. Manpower needed for the high investment scenario (*)
1st. year 2nd and 3rd year 4th year
Senior graduates 6 7 10
Junior graduates 11 15 16
Technicians 9 11 14
Administrative staff 3 4 5
Total 29 37 45
Source: Elaborated from data provided by Union Fenosa Ingeniería (1998)(*) Independent from, or additional to, the existing personnel of CEDER
This investment scenario has costs much higher than the others due mainly to
the requirements of personnel. The total costs along the time are:
Table 2.15. Total annual costs for the high investment scenario (KECU/year) (*)
1st yr. 2nd yr. 3rd yr. 4th yr.
Labour costs 702 888 888 1096Operating costs 105 133 133 164Investment costs 179 34 34 24 From 5th yr. on
Total costs 986 1055 1055 1284 1260
Source: Elaborated from data provided by Union Fenosa Ingeniería (1998)(*) Cost of amortisation, inflation and interest are not considered
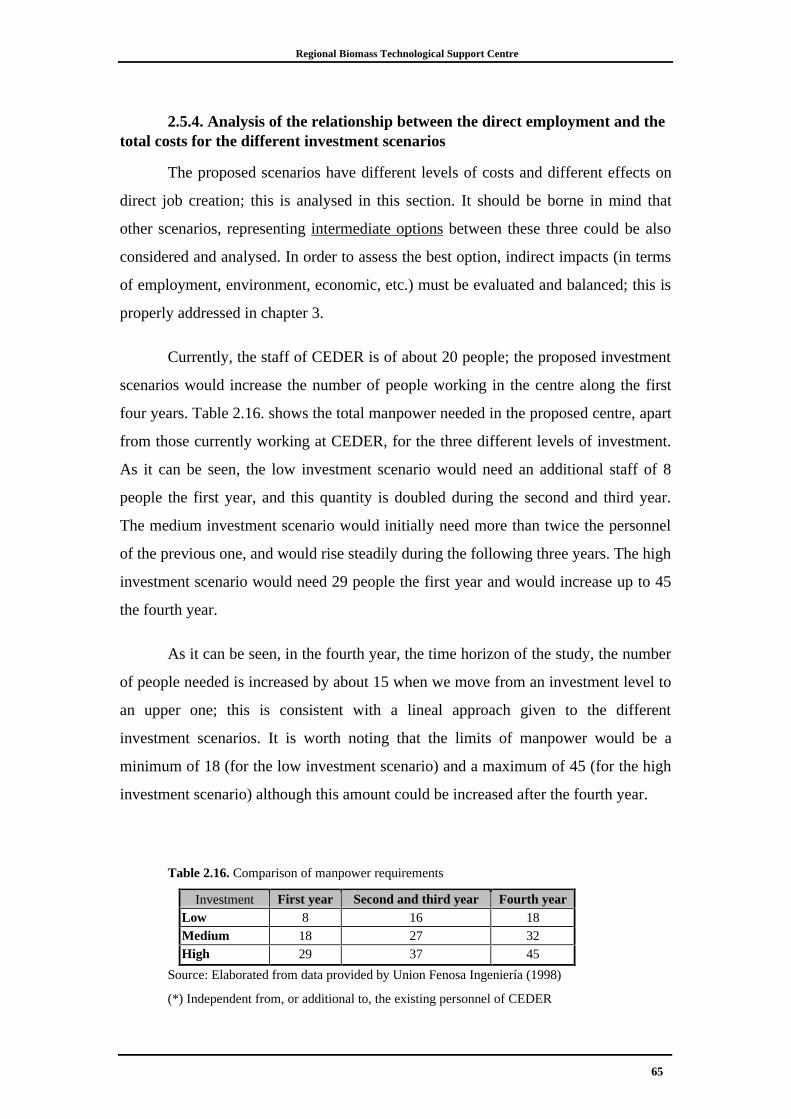
Regional Biomass Technological Support Centre
65
2.5.4. Analysis of the relationship between the direct employment and thetotal costs for the different investment scenarios
The proposed scenarios have different levels of costs and different effects on
direct job creation; this is analysed in this section. It should be borne in mind that
other scenarios, representing intermediate options between these three could be also
considered and analysed. In order to assess the best option, indirect impacts (in terms
of employment, environment, economic, etc.) must be evaluated and balanced; this is
properly addressed in chapter 3.
Currently, the staff of CEDER is of about 20 people; the proposed investment
scenarios would increase the number of people working in the centre along the first
four years. Table 2.16. shows the total manpower needed in the proposed centre, apart
from those currently working at CEDER, for the three different levels of investment.
As it can be seen, the low investment scenario would need an additional staff of 8
people the first year, and this quantity is doubled during the second and third year.
The medium investment scenario would initially need more than twice the personnel
of the previous one, and would rise steadily during the following three years. The high
investment scenario would need 29 people the first year and would increase up to 45
the fourth year.
As it can be seen, in the fourth year, the time horizon of the study, the number
of people needed is increased by about 15 when we move from an investment level to
an upper one; this is consistent with a lineal approach given to the different
investment scenarios. It is worth noting that the limits of manpower would be a
minimum of 18 (for the low investment scenario) and a maximum of 45 (for the high
investment scenario) although this amount could be increased after the fourth year.
Table 2.16. Comparison of manpower requirements
Investment First year Second and third year Fourth yearLow 8 16 18Medium 18 27 32High 29 37 45
Source: Elaborated from data provided by Union Fenosa Ingeniería (1998)
(*) Independent from, or additional to, the existing personnel of CEDER
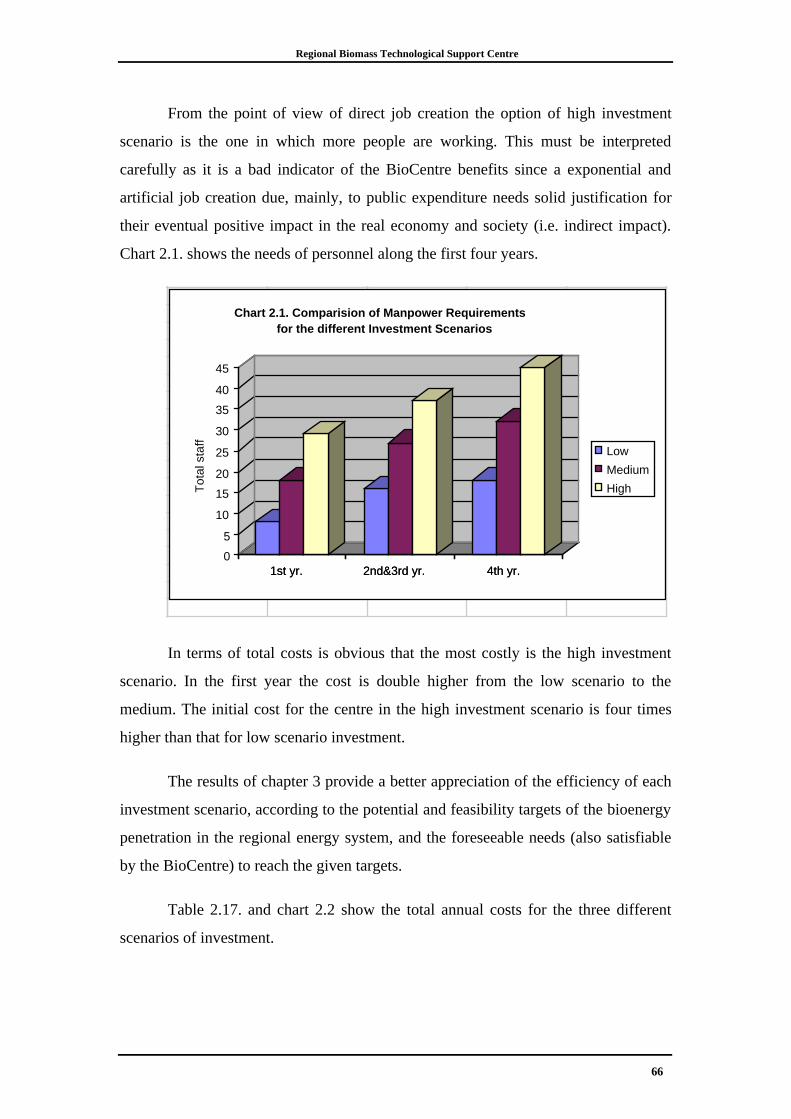
Regional Biomass Technological Support Centre
66
From the point of view of direct job creation the option of high investment
scenario is the one in which more people are working. This must be interpreted
carefully as it is a bad indicator of the BioCentre benefits since a exponential and
artificial job creation due, mainly, to public expenditure needs solid justification for
their eventual positive impact in the real economy and society (i.e. indirect impact).
Chart 2.1. shows the needs of personnel along the first four years.
1st yr. 2nd&3rd yr. 4th yr.0
5
10
15
20
25
30
35
40
45
Tot
al s
taff
1st yr. 2nd&3rd yr. 4th yr.
Chart 2.1. Comparision of Manpower Requirements for the different Investment Scenarios
Low
Medium
High
In terms of total costs is obvious that the most costly is the high investment
scenario. In the first year the cost is double higher from the low scenario to the
medium. The initial cost for the centre in the high investment scenario is four times
higher than that for low scenario investment.
The results of chapter 3 provide a better appreciation of the efficiency of each
investment scenario, according to the potential and feasibility targets of the bioenergy
penetration in the regional energy system, and the foreseeable needs (also satisfiable
by the BioCentre) to reach the given targets.
Table 2.17. and chart 2.2 show the total annual costs for the three different
scenarios of investment.
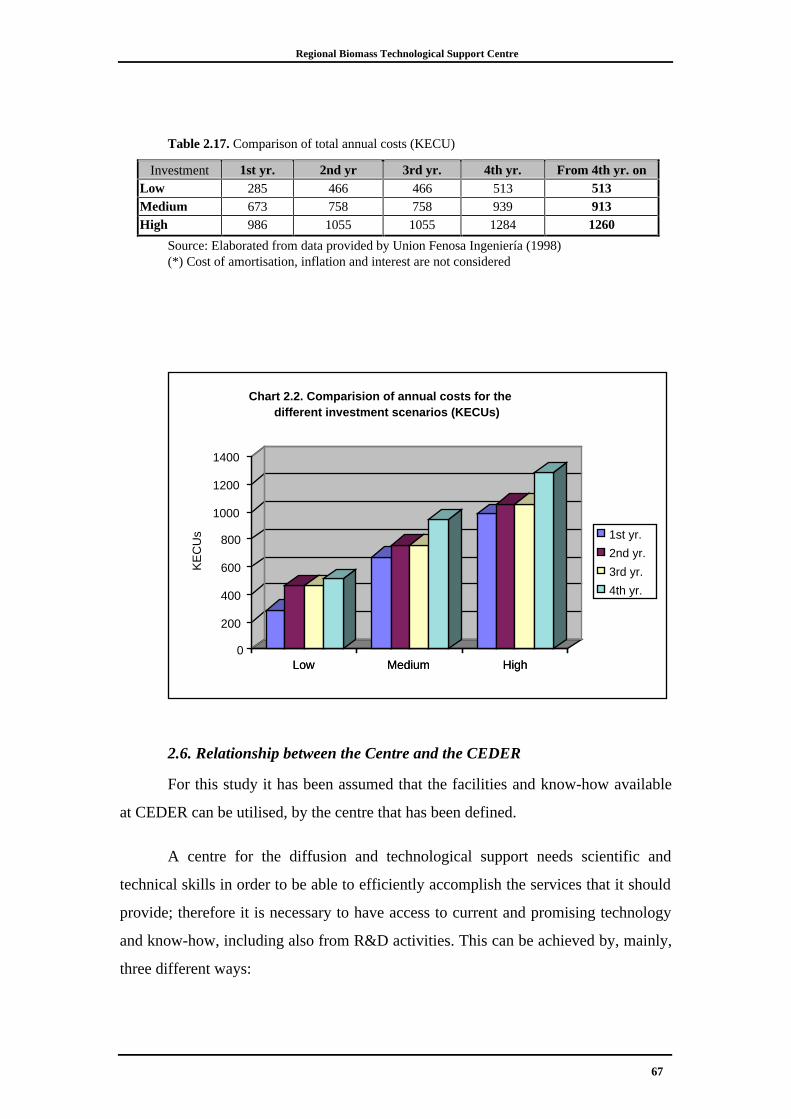
Regional Biomass Technological Support Centre
67
Table 2.17. Comparison of total annual costs (KECU)
Investment 1st yr. 2nd yr 3rd yr. 4th yr. From 4th yr. onLow 285 466 466 513 513Medium 673 758 758 939 913High 986 1055 1055 1284 1260
Source: Elaborated from data provided by Union Fenosa Ingeniería (1998)(*) Cost of amortisation, inflation and interest are not considered
Low Medium High0
200
400
600
800
1000
1200
1400
KE
CU
s
Low Medium High
Chart 2.2. Comparision of annual costs for the different investment scenarios (KECUs)
1st yr.
2nd yr.
3rd yr.
4th yr.
2.6. Relationship between the Centre and the CEDER
For this study it has been assumed that the facilities and know-how available
at CEDER can be utilised, by the centre that has been defined.
A centre for the diffusion and technological support needs scientific and
technical skills in order to be able to efficiently accomplish the services that it should
provide; therefore it is necessary to have access to current and promising technology
and know-how, including also from R&D activities. This can be achieved by, mainly,
three different ways:
Regional Biomass Technological Support Centre
68
1. To benefit from the present know how, and the future development of
the CEDER in S&T capabilities,
2. The proposed centre can have access to the technical and technological
support and know-how from universities and other public and commercial
organisations at, Regional, National and European world level which are
outstanding in bioenergy,
3. The centre could decide to set up a parallel own capability to carry out
some R&D activities for that purpose, even if this is not the scope of a centre
devoted to promote European wide obtained R&D results in Castilla y Leon.
To allocate the centre within the facilities of CEDER (following the first of the
ways above mentioned), seems to be the most appropriate (synergies, existing
expertise, low fixed costs, etc.). We are confident that CEDER continues or improves
its R&D efforts in order to share the results of their activities with the proposed
centre.
The facilities available at CEDER could efficiently cover the needs of some of
the technological support and exploitation actions, nevertheless it would be opportune
that CEDER is provided with some additional facilities in order to efficiently cover
the other areas in which the centre intends to have competence, specially if the
medium or high investment scenarios are adopted. However, as previously explained,
these areas can be covered- depending on the specific needs and requests- by means of
universities, experts, networks and other organisations world-wide.
In particular, the activities TS1, TS3, TS4 and EA 2 can be carried out with
the means currently available at CEDER. Although, as there is a fluidised bed
combustion boiler, and most of the demand is for a fixed bed boiler, it would be
opportune that CEDER is provided with a fixed bed boiler combustion plant. In
addition, to carry out the activity TS2, it would be appropriate for CEDER to be
provided with a gasification plant, and possibly also with a pyrolysis plant. In fact, to
be able to provide technological support in such promising new technologies it is
essential to benefit from a focused S&T development activity (also including basic,
Regional Biomass Technological Support Centre
69
targeted, and applied R&D) in those new technologies. As an indication, the costs of
this equipment are displayed below, in table 2.18.
Table 2.18. Cost of conversion plants (KECU)
Facility KECUs
Direct Fixed Bed Combustion Plant 250
Gasification Plant 563
Pyrolysis Plant 250
Source: Elaborated from data provided by Union Fenosa Ingeniería (1998)
In the hypothesis in which the CEDER can not carry out any R&D activity or
cannot support the proposed centre, the required scientific and technical skills for the
centre could be obtained, as previously stated in the second and third bullet points.
The following figure (Chart 2.3.) shows the facilities available at CEDER and the
centre’s activities that could be covered by them, as well as the additional equipment
that would be beneficial for CEDER to be provided, and of usefulness for the centre.
Chart 2.3. Facilities available at CEDER and the foreseen centre’s activities that could be covered by
them
FacilitiesAvailable at CEDER
Activityof the proposed centre
Mill and Tubular drier
Acid hydrolysis plant TS 1. Adaptation of Existing technologies
BFBC (Biomass Fluidised Bed Combustion)
Lab: Biomass analysis and emission analysis. TS 2. Adoption of New technologies
Laboratory: Samples preparing and drying
Laboratory: Combustion
Energy crops: 300 ha available TS 3. Adoption of Biomass Materials
forestry: 250 ha
TS 4. Adoption of Energy Crops
FacilitiesNot presently available at CEDER
Direct Fixed Bed Combustion Plant EA 2. Characterisation of biomass resources
Gasification Plant
Pyrolysis Plant
Regional Biomass Technological Support Centre
70
3. Socio-economic and Environmental Analysis
The possible impacts caused by a greater use of biomass energy in CyL are
discussed in this chapter. To estimate such impacts, three scenarios of biomass energy
utilisation are proposed for CyL, for the year 2010, based on the provisional
objectives in bioenergy of the region. These scenarios are described in section 3.1.
The potential employment impact (jobs created, jobs displaced, and
multiplying effects) in CyL is discussed in section 3.2., taking into account the overall
feedstock collection, production, harvesting, pre-treatment, transport, conversion and
end-use cycle of the biomass energy systems. Job creation due to the implementation
of the required biomass plants to cover the three scenarios are also calculated,
including the multiplying effect on job creation in manufacturing, products, and
services.
The possible economic impact at regional level of the expected biomass
resources mobilisation is described in section 3.3. Particular attention is paid to
additional regional investment that may accrue as a result. The input-output method is
also used to estimate the effects that the expected investments, both to create the
centre and to provide the additional power supply, can have on key socio-economic
variables, in particular on value-added.
The possible environmental impact of the expected increased and more
efficient use of biomass resources is analysed in section 3.4. including the main
atmospheric pollutants.
Section 3.5. presents an analysis of the potential impact on sectoral policies
deriving from the implementation of the BioCentre and from its activities. It is
pointed out if an increase of biomass utilisation in the region could result in a
convergent or divergent position with the main concerned policies: regional
development (economic growth), employment, environment, agriculture/forestry,
energy, R&D and innovation.
Regional Biomass Technological Support Centre
71
3.1. Hypothesis of biomass utilisation
Biomass already accounts for some 9% (more than 400 ktoe) of the primary
energy of the region, used almost exclusively in thermal applications. To assess the
impact, direct and indirect, that a larger use of biomass energy could have in the
region of Castilla y Leon, 3 different scenarios of utilisation are proposed in this
section.
The scenarios are constructed taking as a base the provisional bioenergy
objectives for the year 2005 proposed by the EREN (“Ente Regional de la Energía”);
these objectives are summarised in table 3.1.
Table 3.1. Provisional additional capacity of bioenergy proposed for the year 2005 in Castilla
y León (Ktoe).
Resource Thermal Electrical Total
Residues 97,5 10,3 107,8
Organic waste 5,0 2,2 7,2
Liquid biofuels 2,0 - 2,0
Total 104,5 12,5 117
Source: EREN 1997
From the above, the three scenarios proposed are the following:
a) to meet the objectives, that EREN has for 2005, in the year 2010 (low
scenario)
b) in the year 2010, double the provision of EREN for 2005 (medium
scenario)
c) the most optimistic scenario doubles the share of the medium scenario.
It has been assumed that the biomass power plants required to provide the
proposed electrical capacity are of co-generation type, which allows to recuperate the
exhaust heat. For each MW of electricity, 2.5 MW of heat are produced, in average, in
a co-generation plant .
Regional Biomass Technological Support Centre
72
The three different scenarios of biomass utilisation are displayed in the table
3.2. In this table it is shown the electricity capacity to be installed, the heat associated
by cogeneration to that electricity capacity, and the non-electrical capacity to be
installed to produce heat.
Table 3.2. Scenarios proposed of biomass utilisation for the year 2010 in Castilla y Leon.
Scenario Electricity Heat by cogeneration(associated to the
production of electricity)
Heat capacity apart fromthat of cogeneration
Total Heatcapacity
1 ktoe 12.5 31.25 73,25 104,5
Gwh 146 364.7 854.8 1220
MW 21.5 53.75 125.7 179.45
2 ktoe 25 62.5 146,5 209
Gwh 292 729 1709 2439
MW 43 107.5 252.4 359.9
3 ktoe 50 125 293 418
Gwh 584 1459 3419 4878
MW 86 215 502.8 717.8
Note: the conversion factor that has been used is 1 MW = 6.8 Gwh/year (Pietro Moncada, 1996)
The equivalent biomass primary energy, needed to cover the proposed
scenarios, is shown in the table 3.3.; this has been calculated considering a conversion
efficiency at the power station of 85%, both in the cogeneration plants and thermal
plants.
Table 3.3. Biomass resources needed to cover the proposed scenarios (Ktoe)
Scenario Total output (electricity+heat) Input needed (85% efficiency)
1 117 137,6
2 234 275,3
3 468 550,6
Regional Biomass Technological Support Centre
73
The existing potential for biomass energy in Castilla y Leon is clearly higher,
both residues and energy crops (see sections 1.2. and 1.3.), to meet the resource
requirements of the most optimistic scenario. In the following sections, these
assumption figures are used as the basis to estimate the impact.
3.2. Employment creation in biomass energy
Direct job creation for a biomass plant includes the construction and
installation of the plant, which is referred to a period of 2-3 years, plus the manpower
required for operating the plant and fuel supply chain, which is referred to the life of
the plant, typically 15-20 years. However, it is necessary to subtract the number of
employees displaced from the conventional energy sector in order to obtain the total
net number of employees corresponding to new jobs. On the base of results of recent
studies on this argument (see e.g. OME, ETSU) the number of employees needed for
building, or manufacturing, and installing the plants can be reduced, on average, by
28%, and by 8% the number of those needed for operating and maintaining the plants.
• Manufacturing and installation of the plants
Table 3.4. shows the number of jobs that can be created by the construction and the
installation of biomass co-generation and heat plants, per MW installed. In the case
of co-generation each MWe includes also 2,5 MWth of heat production. The jobs
displaced and created are also indicated.
Table 3.4. Jobs created for the construction and installation of a biomass plant (2-3 years)
Jobs for BFBC & BGCC jobs/MWe jobs/MWth
Plant Construction jobs 10 2.85
Plant Installation jobs (*) 4.8 1.37
Displaced jobs by manufacturing and installation (28%) 4 1.14
Net 10.8 3.08
(*) Includes engineering, civil work, and auxiliary
Source: H. Li. Chum, R. Overend (1993)
Taking into account the three scenarios of utilisation described in section 3.2.
the jobs needed for the construction and installation of the biomass plants of each
scenario are displayed in table 3.5. These jobs, as previously mentioned, have a
Regional Biomass Technological Support Centre
74
duration of 2-3 years, which is the usual time for this phase of the implementation of a
plant.
Table 3.5. Number of jobs needed for the construction and installation of the biomass plants of the
three scenarios.
Scenario Capacity to be installed Construction Installation Displaced(28%)
Net Total
1 21.5 MWe (+ 53,75 MWth) 215 103 86 232
125,7 MWth 358 172 143 387 619
2 43 MWe (+ 107,5 MWth) 430 206 172 464
251,4 MWth 716 344 286 774 1238
3 86 MWe (+ 215 MWth) 860 413 344 929
502,8 MWth 1433 689 573 1548 2476
Note: MWth produced by cogeneration are displayed in brackets beside the associated electricity
generation
• Operating and maintaining of the plants
In the 1 to 5 MWe range, approximately 4 jobs per MWe are required at power
stations (Table 3.6.). The data used to estimate the impact are those of the second
column in table 3.6. In fact, the most favourable plant size in Castilla y León is 1
MWe of capacity.
Table 3.6. shows the number of direct jobs per year created for operating and
maintaining the plants according to their size or capacity. These data are referred to
electricity generation; for heat production the same data are used in this study,
assuming that producing 1MWe is, in terms of job creation, roughly equivalent to
producing 3,5 MWth.
Table 3.6. Direct employment at biomass power stations according to scale.
Activity Number of direct jobs/year required
1 MWe 5 MWe 10 MWe 30 MWe
Fuel handling and treatment 12 16 20 24
Conversion 4 8 8 12
Power generation 4 4 4 8
Total (direct) 20 28 32 44
Source: elaboration from Grassi (1996) and Scrase (1997).
Regional Biomass Technological Support Centre
75
In addition, more jobs would be created for producing the fuel in the case of
energy crops. Grassi (1996) has estimated the employment requirements for biomass
to electricity and ethanol in the EU when produced from dedicated energy. At a 35 %
conversion efficiency a further 3 to 5 direct jobs per MWe are employed in the fuel
supply chain.
In the European Union, looking ahead to 2010-2015, the potential energy
supply from biomass is estimated at 130 Mtoe (some 80 Mtoe more than the current
situation), a level which corresponds to a renewable resource equivalent to two-thirds
of current oil production from the North Sea. Thirty Mtoe could be derived from
energy crops and plantations (about 37.5% of the total additional capacity).
The percentage of 37,5% is utilised when estimating the job creation in the
production of biomass fuel. Therefore for each MWe a further 1,5 direct jobs are
supported in the fuel supply chain.
With these data, table 3.7. is constructed which shows the number of direct
jobs created for the three different scenarios of biomass utilisation for operating,
maintaining, and fuel supply. It must be remembered that the jobs for the construction
and installation of biomass plants are for a period of 2-3 years, while the jobs for the
operating and fuel supply chain are for 15-20 years.
Table 3.7. Direct job creation for operating and maintaining the new biomass plants.
Scenario Capacity to be installed Fuel Production,handling and pre-
treatment
Conversion equipmentand power generation
Displaced(8%)
Net Total
1 21.5 MWe (+ 53,75 MWth) 290 172 37 425
125,7 MWth 485 287 62 710 1135
2 43 MWe (+ 107,5 MWth) 580 344 74 850
251,4 MWth 970 574 124 1420 2270
3 86 MWe (+ 215 MWth) 1160 688 148 1700
502,8 MWth 1940 1148 248 2840 4540
Note: MWth produced by cogeneration are displayed in brackets beside the associated
electricity generation
Regional Biomass Technological Support Centre
76
• Multiplier effect
The multiplier effect is a complex but an important component when
estimating employment benefits. Such effects vary from approximately 1.5 to 2, i.e. if
8 direct jobs/MWe are created in the production and conversion of biomass to
electricity, a further 4-8 indirect jobs are created in related industries e.g. in Austria it
is estimated that for each MW of installed capacity of energy from biomass 2 to 3 new
jobs are generated in rural areas.
The jobs created by multiplying effect are shown in table 3.8.
Table 3.8. Number of jobs created by multiplying effect for the 3 scenarios of utilisation.
Scenario Capacity to be installed Jobs per year Total
1 21.5 MWe (+ 53,75 MWth) 198-395
125,7 MWth 330-661 528-1056
2 43 MWe (+ 107,5 MWth) 395-790
251,4 MWth 666-1322 1056-2112
3 86 MWe (+ 215 MWth) 790-1580
502,8 MWth 1322-2644 2112-4224
Note: MWth produced by cogeneration are displayed in brackets beside the associated electricity
generation
• Summary
Table 3.9. summarises the findings showing the number of jobs both for
manufacturing-installing and maintaining, operating and fuel supplying (including
collecting, cropping and harvesting, pre-treatment and transport). It can be noted that
the jobs created for 15-20 years are almost the double than those of short duration (2-
3 years).
Table 3.9. Effects on the employment for the three different scenarios of utilisation.
Scenario Construction andinstallation Total jobs (2-3
years)
Maintaining and operating Total jobs (15-20 years)
Jobs created by multiplyingeffects
1 619 1056 528-1056
2 1238 2112 1056-2112
3 2476 4224 2112-4224
Regional Biomass Technological Support Centre
77
The Input-Output table methodology has been used to evaluate the distribution
of the total jobs created (direct and indirect) in the sectors of the society (a brief
explanation of this technique is provided within section 3.3.) giving the following
result (table 3.10.):
Table 3.10. Sectoral share of the total jobs created when implementing the bioenergy plants.
ECONOMIC SECTORS Share
Agriculture 47.4
Mining & Energy 3.26
Manufacturing 19.8
Building Industry 11
Services 18.4
total 100
Source: Elaborated from input-output tables of Spain(1992)
As it can be seen, agriculture is the sector that benefits the most, as 47% of the
jobs created are in this sector.
3.3. Economic impact
According to the EU White Paper on Renewable Sources of Energy within the
next years it will be utilised 90 Mtoe of additional biomass, this will require
investments of about 84 billion ECU all over Europe. Moreover, the additional annual
benefits from biomass energy related activities are estimated at 24.1 billion ECU.
To estimate the investment needed to implement the plants we have used the
figures of 1.3 MECU per MWe installed (P. Moncada, 1996), and 0.28 MECU per
MWth. Therefore, the following investments are estimated to implement the
additional electric and thermal capacities (table 3.11.):
Regional Biomass Technological Support Centre
78
Table 3.11. Expected investments for implementing the additional bioenergy capacity
(MECU)
Scenario Plants Capacity to be installed MECUs Total
1 Cogeneration 21.5 MWe (+ 53,75 MWth) 28
Heat 125,7 MWth 36 64
2 Cogeneration 43 MWe (+ 107,5 MWth) 56
Heat 251,4 MWth 72 128
3 Cogeneration 86 MWe (+ 215 MWth) 112
Heat 502,8 MWth 144 256
Note: Assumption, 1 MWe=1.3 MECU; 1 MWth = 0.28 MECU; Source: IPTS 1996
Note: MWth produced by cogeneration are displayed in brackets beside the associated
electricity generation
The input-output method has been used at this point to estimate the effects that
the expected investments, both to create the centre and to provide the additional
power supply, can have on key socio-economic variables, in particular on value-
added.
This method takes into account the intersectoral linkages of the economy
within a mathematical framework. These linkages are arranged in a matrix where any
element indicates the effect that a unit of the sector represented in the row has on the
sector represented in the column. A detailed explanation of this method is out of the
scope of this study, but the methodology and its application to energy issues are
exposed, for instance, in Hsu (1989), Heen (1991), and Wu and Chen (1990).
The input needed by the method is the sectoral desegregation of the
investments, in other words, in which sectors the money of the investment is directly
spent; they are different depending on whether is to create the centre or to install a
plant. These issues are analysed in the following subsections.
The results of the input-output analysis are the sectors that, at the end, are
benefiting the most, in terms of added value. In other words, the amount of money
from the investment that ends up as added value by sectors.
Regional Biomass Technological Support Centre
79
3.3.1. Direct economic impact
In order to assess the direct impact on the economy that the expected
investments to create the centre can have in Castilla y Leon, the scheme of the
scenarios of investment (low, medium, high) is taken into account. According to these
schemes the necessary input vector is displayed in table 3.12.; the meaning of this
vector is the share of the investment that is spent in each sector.
Table 3.12. Sectoral desegregation of the investments to create the BioCentre
ECONOMIC SECTORS Share
Agriculture 0
Mining & Energy 0
Manufacturing 12%
Building Industry 8%
Services 80%
Source: Elaborated from data provided by UFISA (1998)
With this vector, and the elements above mentioned (matrix and the vectors)
the input-output method is employed, providing the following sectoral distribution of
the money invested (table 3.13)
Table 3.13. Effects on added value by sector of the investments for the creation of the
BioCentre (KECUs)
ECONOMIC SECTORS Low Medium High Share(%)
Agriculture 215 375 525 11.9
Mining & Energy 179 312 437 9.9
Manufacturing 149 260 364 8.3
Building Industry 186 324 454 10.3
Services 1067 1857 2600 59.4
Total 1796 3128 4380 100
Source: Elaborated from input-output tables of Spain (1992)
It can be seen that the total money spent in the centre during the first four
years ends up mainly in the added value of the services sector; the rest of the sector
have a similar share of around 10% each.
Regional Biomass Technological Support Centre
80
3.3.2. Indirect economic impact
This subsection has the aim of evaluating the indirect impact caused by the
increased utilisation of biomass energy in CyL. The following table is concerning the
cost breakdown for the biomass plants (table 3.14.).
Table 3.14. Sectoral desegregation of the investment for implementing a biomass plant.
ECONOMIC SECTORS Share (%)
Agriculture 0
Mining & Energy 0
Manufacturing 60%
Building Industry 20%
Services 20%
Source: Elaborated from data provided by CIEMAT
With this input vector, the method gives, for every scenario of utilisation, the
following sectoral distribution of the invested money as shown in table 3.15. As
previously explained, these figures indicate the amount of money from the total
investment that rebounds as added value in the different sectors. As it can be seen the
sector that benefits the most is the agricultural sector (27.8%), followed by the
manufacturing sector (24.4%).
Table 3.15. Amount of money from the total investment that rebounds as added value in the different
sectors.(KECU)
Scenario 1 Scenario 2 Scenario 3 Share(%)
Total investment 64 128 256
ECONOMIC SECTORS
Agriculture 17.8 35.6 71.2 27.8
Mining & Energy 7.4 14.8 29.6 11.5
Manufacturing 15.6 31.2 62.4 24.4
Building Industry 9.8 19.6 39.2 15.3
Services 13.3 26.6 53.2 20.8
Total 64 128 256 100
Source: Elaborated from input-output tables of Spain(1992)
Regional Biomass Technological Support Centre
81
3.4. Environmental Impact
Biomass energy is diverse and its impacts are site, and management, specific.
It can be treated to produce solid, liquid or gaseous fuels and these in turn can be used
in various ways for heat and power or transport. Different approaches will be
appropriate for different localities. Given this diversity no single, composite figure or
indicator can express the environmental impacts of biomass energy in general. This is
further complicated by a relatively early stage of modern biomass energy applications.
Where a technology is some way off maturity it can be misleading to predict its
environmental profile.
Biomass energy is recognised as having significant environmental advantages
when compared with fossil fuels when produced and used in a sustainable manner.
Indeed this is a major factor for promoting bioenergy, but there are also negative
effects which should not be overseen. Burning any solid fuel has some negative
impacts on health, particularly when burned in household cooking/heating stoves
where there is little or no ventilation. Exposure to particulates from biomass or coal
burning causes respiratory infections, and carbon monoxide is implicated in problems
in pregnancy. The health problems associated with residential cooking and heating
should be associated with the way these services are provided, including cultural
practices, rather than the fuel used. Centralised provision of electricity and heat on a
local scale from biomass greatly reduces exposure to pollutants, increases the
efficiency of fuel use and can be economically viable.
There is no single best way to use biomass for energy, and the environmental
acceptability will depend on sensitive and well informed approaches to new
developments in each location. It is clear that biomass for energy can be
environmentally friendly, and steps must be taken to ensure that it is, if biomass is to
be accepted as an important fuel of the future. Perhaps the single greatest
environmental benefit of biomass is that it can help to prevent the build up of
greenhouse gases in the atmosphere.
The annual emissions of greenhouse gases (GHG) from fossil fuel combustion
and land use change are approximately 6.7 and 1.6 Pg C, respectively. There are
various ways in which biomass energy can help to reduce pollution:
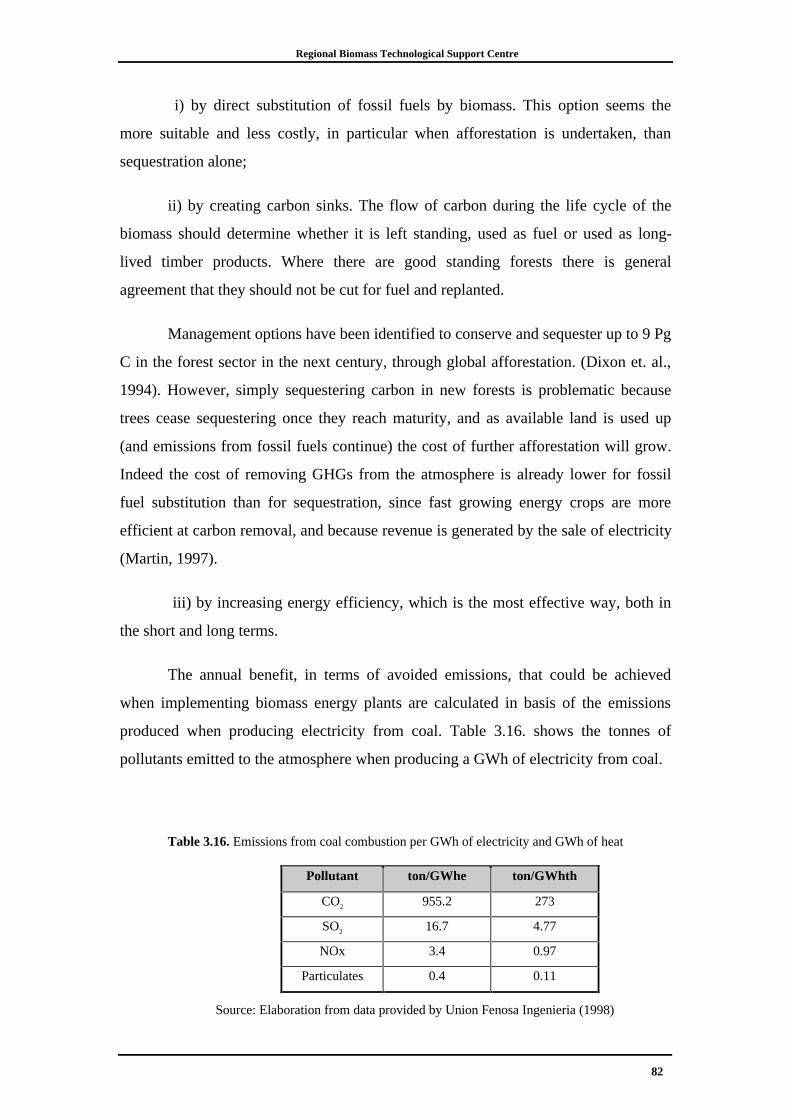
Regional Biomass Technological Support Centre
82
i) by direct substitution of fossil fuels by biomass. This option seems the
more suitable and less costly, in particular when afforestation is undertaken, than
sequestration alone;
ii) by creating carbon sinks. The flow of carbon during the life cycle of the
biomass should determine whether it is left standing, used as fuel or used as long-
lived timber products. Where there are good standing forests there is general
agreement that they should not be cut for fuel and replanted.
Management options have been identified to conserve and sequester up to 9 Pg
C in the forest sector in the next century, through global afforestation. (Dixon et. al.,
1994). However, simply sequestering carbon in new forests is problematic because
trees cease sequestering once they reach maturity, and as available land is used up
(and emissions from fossil fuels continue) the cost of further afforestation will grow.
Indeed the cost of removing GHGs from the atmosphere is already lower for fossil
fuel substitution than for sequestration, since fast growing energy crops are more
efficient at carbon removal, and because revenue is generated by the sale of electricity
(Martin, 1997).
iii) by increasing energy efficiency, which is the most effective way, both in
the short and long terms.
The annual benefit, in terms of avoided emissions, that could be achieved
when implementing biomass energy plants are calculated in basis of the emissions
produced when producing electricity from coal. Table 3.16. shows the tonnes of
pollutants emitted to the atmosphere when producing a GWh of electricity from coal.
Table 3.16. Emissions from coal combustion per GWh of electricity and GWh of heat
Pollutant ton/GWhe ton/GWhth
CO2 955.2 273
SO2 16.7 4.77
NOx 3.4 0.97
Particulates 0.4 0.11
Source: Elaboration from data provided by Union Fenosa Ingenieria (1998)
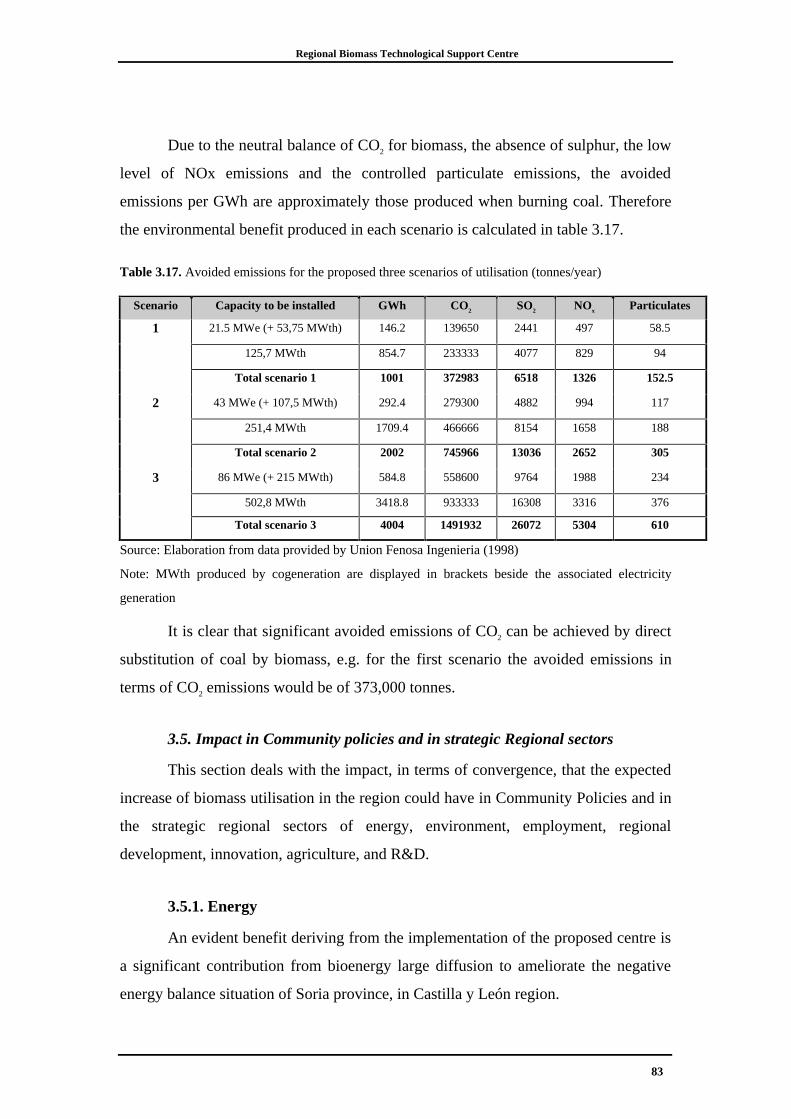
Regional Biomass Technological Support Centre
83
Due to the neutral balance of CO2 for biomass, the absence of sulphur, the low
level of NOx emissions and the controlled particulate emissions, the avoided
emissions per GWh are approximately those produced when burning coal. Therefore
the environmental benefit produced in each scenario is calculated in table 3.17.
Table 3.17. Avoided emissions for the proposed three scenarios of utilisation (tonnes/year)
Scenario Capacity to be installed GWh CO2 SO2 NOx Particulates
1 21.5 MWe (+ 53,75 MWth) 146.2 139650 2441 497 58.5
125,7 MWth 854.7 233333 4077 829 94
Total scenario 1 1001 372983 6518 1326 152.5
2 43 MWe (+ 107,5 MWth) 292.4 279300 4882 994 117
251,4 MWth 1709.4 466666 8154 1658 188
Total scenario 2 2002 745966 13036 2652 305
3 86 MWe (+ 215 MWth) 584.8 558600 9764 1988 234
502,8 MWth 3418.8 933333 16308 3316 376
Total scenario 3 4004 1491932 26072 5304 610
Source: Elaboration from data provided by Union Fenosa Ingenieria (1998)
Note: MWth produced by cogeneration are displayed in brackets beside the associated electricity
generation
It is clear that significant avoided emissions of CO2 can be achieved by direct
substitution of coal by biomass, e.g. for the first scenario the avoided emissions in
terms of CO2 emissions would be of 373,000 tonnes.
3.5. Impact in Community policies and in strategic Regional sectors
This section deals with the impact, in terms of convergence, that the expected
increase of biomass utilisation in the region could have in Community Policies and in
the strategic regional sectors of energy, environment, employment, regional
development, innovation, agriculture, and R&D.
3.5.1. Energy
An evident benefit deriving from the implementation of the proposed centre is
a significant contribution from bioenergy large diffusion to ameliorate the negative
energy balance situation of Soria province, in Castilla y León region.
Regional Biomass Technological Support Centre
84
This objective is in line with the contents of:
a) the European Energy Chapter (signed in December 1991) Title III -
"Specific Agreements": development of the renewable energy sources) which
represents a first strategic commitment to the energy & environmental issue, and of
b) the Declaration of Madrid on Renewable Energies (March 1994), and
c) the EC’s White Paper on Renewable energies entitled: Energy for the
Future: Renewable Sources of Energy (November, 1997) in many parts and forms.
Among other issues, these documents underline the need of use of instruments
and measures to promote the security of energy supply.
3.5.2. Environment
Through the application of the innovative EU R&D efforts, and through a
better knowledge by the society of the environmental balance of biomass systems (for
a better biomass acceptability and promotion in the field), both of which are key
objectives of the BioCentre studied, the environment will benefit.
In fact, the neutral CO2 balance and the insignificant presence of sulphur
emissions in biomass-based power generation systems make them environmentally
very attractive.
Moreover, energy crops can fit into local landscape and can receive acceptance
by local communities, if implanting these crops
a) biomass energy, in particular dedicated energy crops, do not result in a net
landscape incremental change. This can be ensured by proper choice of crop species
and management practices;
b) maintain biodiversity and,
c) sustainablity principles are applied e.g. adequate use fertilisers, pesticides,
water, environmental friendly conversion process, etc.
Regional Biomass Technological Support Centre
85
Other positive environmental implications depend on the better balance in the
soil & water pollutant emissions when compared to conventional energy systems, and
to the avoided negative environmental effects due to the abandonment of agricultural
lands. The coincidence of EU environmental policy goals with the mentioned benefits
is obvious.
3.5.3. Employment, Regional Development, and Innovation
If the existing barriers to implement at commercial scale the R&D results in
bioenergy are overcome, these activities would considerably contribute to the job
creation (in particular in the rural areas) and therefore would help to secure rural
development. Direct socio-economic development in depressed areas of the EU
through the implementation of biomass energy schemes is an important policy
objective in the EU.
An increase in job position availability can derive not only from biomass
production and conversion processes but on parallel activities as well, such as
growing out season vegetables in greenhouses and open-field. These benefits will
impact the EU employment creation efforts through technology innovation, transfer,
and diffusion.
According to the green paper on innovation (EC, 1995) technological progress
generates new wealth. Product innovations lead to an increase in effective demand
which encourages an increase in investment and employment. Process innovations
contribute to an increase in productivity of the factors of production. In the course of
time, the result is another increase in purchasing power, which promotes increased
demand and, here again, employment.
Keeping in mind this theory, and applying it to the biomass energy in the
hypothesis of a considerable market penetration share in Castilla y León/Soria region,
the following sequence can be proposed:
“More local energy resources exploited ----> more energy from biomass
produced ----> more capital investment in Castilla y León/Soria ----> more
technology locally manufactured ----> better regional balance of trade ----> more
incentives for technology innovation ----> more system efficiency (economical and
Regional Biomass Technological Support Centre
86
technological) ----> more profits for enterprises ----> more consumer saving ---->
more purchasing power ----> more jobs created ----> better (in qualitative and
quantitative terms) regional socio-economic growth” (Pietro Moncada-Paternò-
Castello & Miguel Aguado, 1996)
In other words, this sequence can be differently explained by saying that
biomass gives new possibilities to improve energy security, trade balance, and
technology innovation, providing new economic opportunities for rural areas. In
addition, energy-conversion industries would spring up near bio-fuel farms to reduce
the transportation costs. As rural energy industries grow, they will attract new
business and stimulate regional economic development.
3.5.4. Agriculture
The development of an operational methodology to promote the use of
biomass energy, would meet the objectives set out in the CAP, which can be
summarised as follows:
a) reduce surplus of food production;
b) control irregular fluctuations in international prices;
c) maintain or improve farmers' income;
d) enhance rural development and reduce emigration;
e) encourage non-food production;
f) protect and improve environmental conditions of the above and below
ground.
All such objectives can be met through the implementation, wide acceptance,
and the spreading of bioenergy systems. The improvement of the technology toward
attributes of simplicity and reliability, implied makes the transfer and the acceptance
very easy.
The mobilisation of resources through the application of the methodology
proposed and the application of the results of the present project will, preferentially,
Regional Biomass Technological Support Centre
87
address the benefits of biomass for energy large use to the agricultural sector (see
sections 3.3.1. and 3.3.2.), helping to achieve EU agricultural policy objectives.
3.5.5. R&D
The EU has ever researched and stimulated the link between R&D results and
their commercial applications. The EU R&D policy is making a considerable effort to
increase technological competitiveness and employment generation. Moreover, the
EC’s White Paper on European energy policy, particularly towards RTD, confirms the
importance of the following objective: "to integrate renewable energy into the market;
this action will allow the diffusion in the market of technologies such as ......biomass,
.....".
In conclusion, an increase of bioenergy utilisation in the region would result in
a convergent position with the European and National policies of regional
development (economic growth), employment, environment, agriculture/forestry,
energy, R&D and innovation.
Regional Biomass Technological Support Centre
88
4. Operational Recommendations to be Implemented by theKey Actors
An overall strategy to exploit and commercialise R&D results in biomass
energy would consist on a wide variety of polices, activities and instruments.
However, not all the tasks should, or could, be carried out by the range of market
actors such as regional and local authorities, utilities, financiers, industry,
entrepreneurs, etc. Thus the rational approach would be to identify and match
different recommendations on what would be more suited and targeted for each key
actor, trying to answer questions such as what is the role for each key actor within the
area of biomass and the development of the BioCentre?, what are the type of activities
best adopted to help overcome these problems and realise the benefits offered by a
greater use of biomass in the region?, etc.
4.1. National/Regional/Local authorities
Within the operational recommendations for the authorities, the general roles
of this type of institutions are the following:
• To promote and stimulate energy savings and energy efficiency
programmes.
• To participate and encourage renewable energy projects,
including biomass, regional development based on local resources, creation
of local employment and industrial activities.
With regard to political and legislative barriers, regional authorities, with
support from the National government, should promote the development of REs to
open suitable market niches for biomass energy e.g. through subsidies and policy
support, to ensure that biomass energy projects are put in an equal footing than fossil
fuels.
Regional authorities should facilitate the administrative procedures to help
overcome institutional barriers e.g. assisting in obtaining licenses. The BioCentre
could act as a connecting point between the regional authorities and project promoters
to speed-up administrative procedures.
Regional Biomass Technological Support Centre
89
4.2. Sectoral operators
Efforts should be made to overcome the technological barriers that hinder the
development of biomass energy projects e.g. by improving existing technologies,
R&D, etc., in collaboration with the proposed BioCentre.
All the key actors from sectoral operators (Utilities, financing groups, large
agroforestry industries, SME’s, resident’s associations and individuals) should be
aware of new developments in biomass energy so that they can identify and
implement heat and power projects at different scales according to the requirements of
each key-actor. For this purpose, all of these groups should be involved, within their
possibilities and own objectives and characteristics, participating in the activities of
the BioCentre that will be able to promote the development of biomass energy in the
region.
4.3. European Commission
The V Framework Program will present the opportunity to strengthen the
financial opportunities available for REs and above all to increase its weight within
the energy programmes. An important factor for the promotion of this kind of
activities is to support and encourage the less favoured regions, highly dependent on
energy imports, such as Castilla y Leon.
Therefore, the EC should give support to regional and local projects and
planning, in the framework of its promotional programmes such as ALTENER. In
addition, it is essential to encourage Member States to include REs implementation
plans in their programmes that are submitted to receive structural funds support for
co-financing.
The uncertainties for the medium and long term should encourage prudence
and the preparation of alternative solutions. The political will is essential in order to
prepare the medium and long term future and to obtain the support of the principal
actors. These actions have to be integrated and must be coherent with the other
existing policies. Within the actions to be promoted by the European Commission it
can be quoted:
• Using scenarios to limit uncertainty
Regional Biomass Technological Support Centre
90
• Prompting the regions draw up energy policies
• Occupying favourable market niches
• Assess incentives, encourage their harmonisation and promote the
most effective.
The most successful programmes are those that have been undertaken by small
countries or regions benefiting from a high degree of decision autonomy in the field
of energy planning (this is the specific case of Spain). Regional authorities, in
partnership with the local professionals and associative networks, have also been
very effective promoters of biomass energy. The European Union, undoubtedly, has a
role to play in encouraging regional and local authorities to prepare energy policies by
promoting local and regional partnerships.
Regional Biomass Technological Support Centre
91
5. Summary of Conclusions
The conclusions reached in this study can be summarised as follows:
The total biomass production in CyL in 1994 was estimated to be the
equivalent to 702 PJ and, after losses were taken into account, the total biomass use
was equivalent to 305 PJ; therefore it is clear that there are considerable losses of
biomass which offer good opportunities for waste utilisation. Currently the bulk of
these residues are burnt or let in the fields to rot. The same can be said with respect to
Soria province where the total biomass production in 1994 was of about 34 PJ and the
use was the equivalent to 15.5 PJ. In addition the availability of about 9.4 Mha
extension of land in CyL, of which 42% is cultivated land, offers good opportunities
for dedicated energy crops.
The identification of the most promising R&D results regarding biomass
feedstocks reveals that industrial and agroforestry residues are the most suitable
resource due to their availability and lower costs. The energy crops which appear the
most appropriate for the region include Cynara, Fibre Sorghum and Miscanthus; on
the other hand, as short rotation forestry crops, Poplar and Eucalyptus were identified
as most adequate for the region.
Regarding conversion technologies, direct combustion is a world-wide mature
and well established technology available commercially. Integrated Gasification
Combined Cycle (IGCC) is the most advanced and efficient (40-45% efficiency)
system available in the gasification field but the capital costs are still much higher
than those for combustion. Other technologies such as pyrolysis and enzymatic
hydrolysis are still emerging technologies.
A number of barriers for Castilla y León in general, and in Soria in particular,
that hinder a wider development of biomass energy systems, have been identified;
these are political, legislative, social, economic, financial, institutional, technical and
environmental.
The activities that seem the most appropriate to be realised in the Regional
Bioenergy Technological Support Centre (BioCentre) have been identified; these
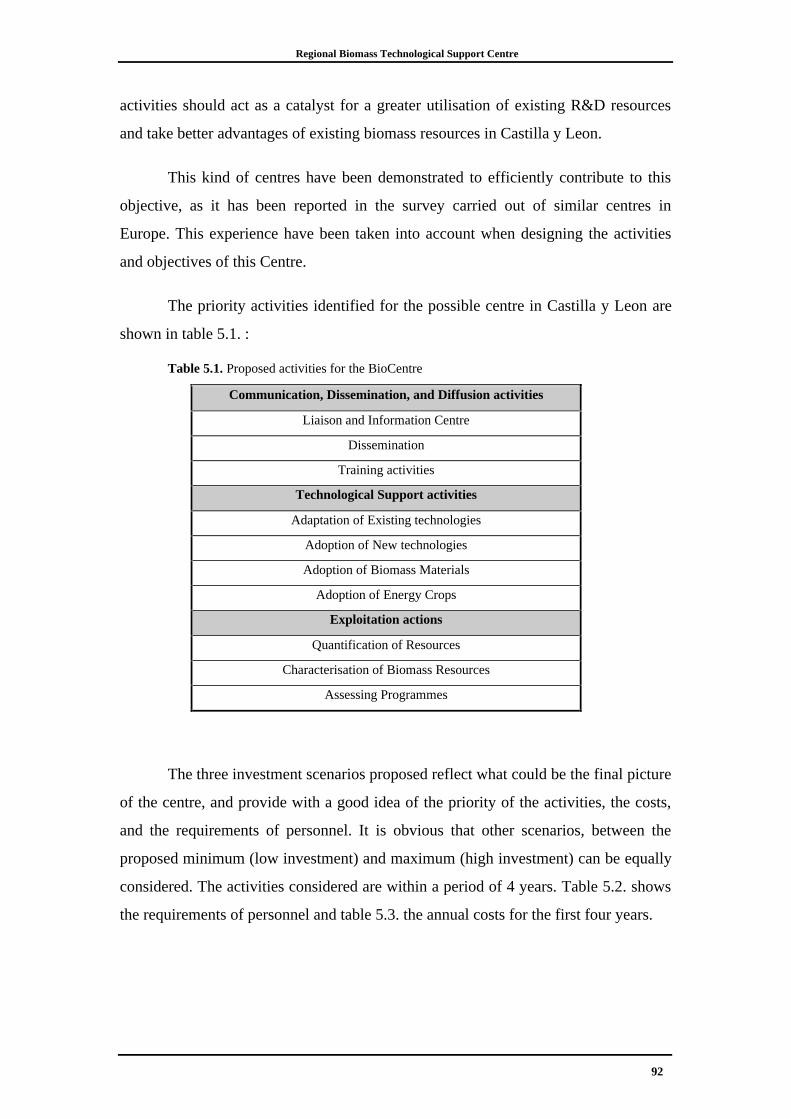
Regional Biomass Technological Support Centre
92
activities should act as a catalyst for a greater utilisation of existing R&D resources
and take better advantages of existing biomass resources in Castilla y Leon.
This kind of centres have been demonstrated to efficiently contribute to this
objective, as it has been reported in the survey carried out of similar centres in
Europe. This experience have been taken into account when designing the activities
and objectives of this Centre.
The priority activities identified for the possible centre in Castilla y Leon are
shown in table 5.1. :
Table 5.1. Proposed activities for the BioCentre
Communication, Dissemination, and Diffusion activities
Liaison and Information Centre
Dissemination
Training activities
Technological Support activities
Adaptation of Existing technologies
Adoption of New technologies
Adoption of Biomass Materials
Adoption of Energy Crops
Exploitation actions
Quantification of Resources
Characterisation of Biomass Resources
Assessing Programmes
The three investment scenarios proposed reflect what could be the final picture
of the centre, and provide with a good idea of the priority of the activities, the costs,
and the requirements of personnel. It is obvious that other scenarios, between the
proposed minimum (low investment) and maximum (high investment) can be equally
considered. The activities considered are within a period of 4 years. Table 5.2. shows
the requirements of personnel and table 5.3. the annual costs for the first four years.
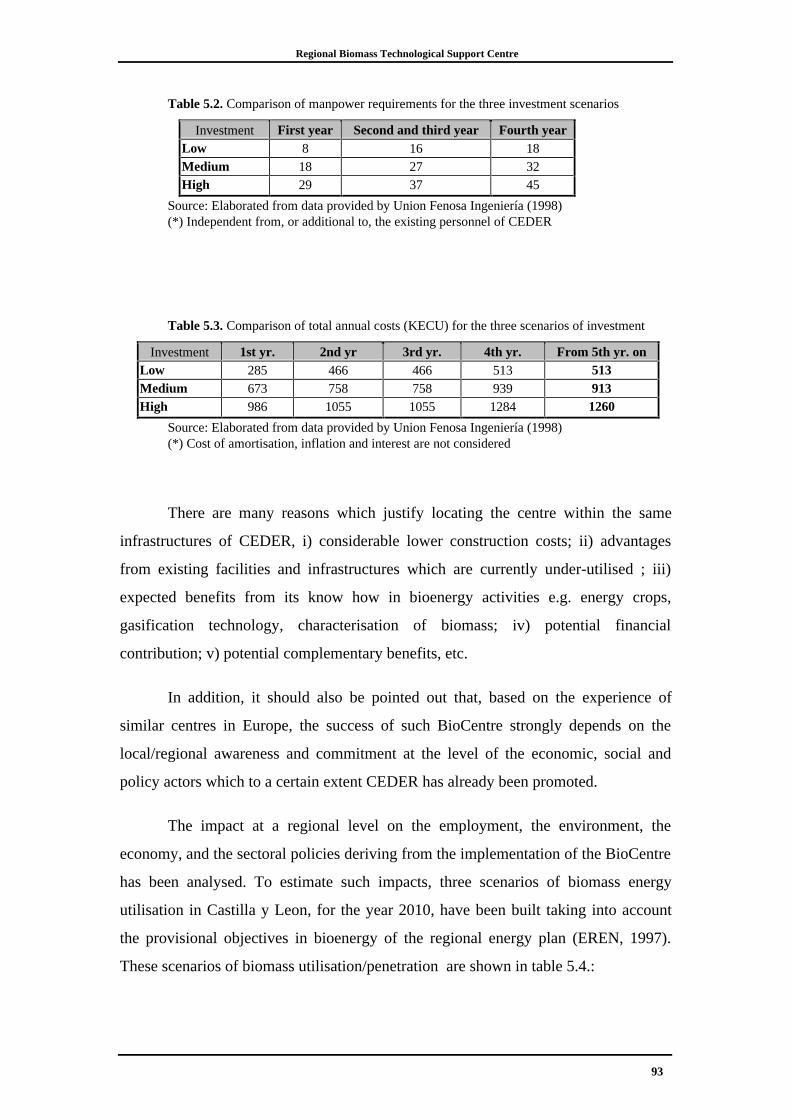
Regional Biomass Technological Support Centre
93
Table 5.2. Comparison of manpower requirements for the three investment scenarios
Investment First year Second and third year Fourth year Low 8 16 18 Medium 18 27 32 High 29 37 45
Source: Elaborated from data provided by Union Fenosa Ingeniería (1998) (*) Independent from, or additional to, the existing personnel of CEDER
Table 5.3. Comparison of total annual costs (KECU) for the three scenarios of investment
Investment 1st yr. 2nd yr 3rd yr. 4th yr. From 5th yr. on Low 285 466 466 513 513 Medium 673 758 758 939 913 High 986 1055 1055 1284 1260
Source: Elaborated from data provided by Union Fenosa Ingeniería (1998) (*) Cost of amortisation, inflation and interest are not considered
There are many reasons which justify locating the centre within the same
infrastructures of CEDER, i) considerable lower construction costs; ii) advantages
from existing facilities and infrastructures which are currently under-utilised ; iii)
expected benefits from its know how in bioenergy activities e.g. energy crops,
gasification technology, characterisation of biomass; iv) potential financial
contribution; v) potential complementary benefits, etc.
In addition, it should also be pointed out that, based on the experience of
similar centres in Europe, the success of such BioCentre strongly depends on the
local/regional awareness and commitment at the level of the economic, social and
policy actors which to a certain extent CEDER has already been promoted.
The impact at a regional level on the employment, the environment, the
economy, and the sectoral policies deriving from the implementation of the BioCentre
has been analysed. To estimate such impacts, three scenarios of biomass energy
utilisation in Castilla y Leon, for the year 2010, have been built taking into account
the provisional objectives in bioenergy of the regional energy plan (EREN, 1997).
These scenarios of biomass utilisation/penetration are shown in table 5.4.:
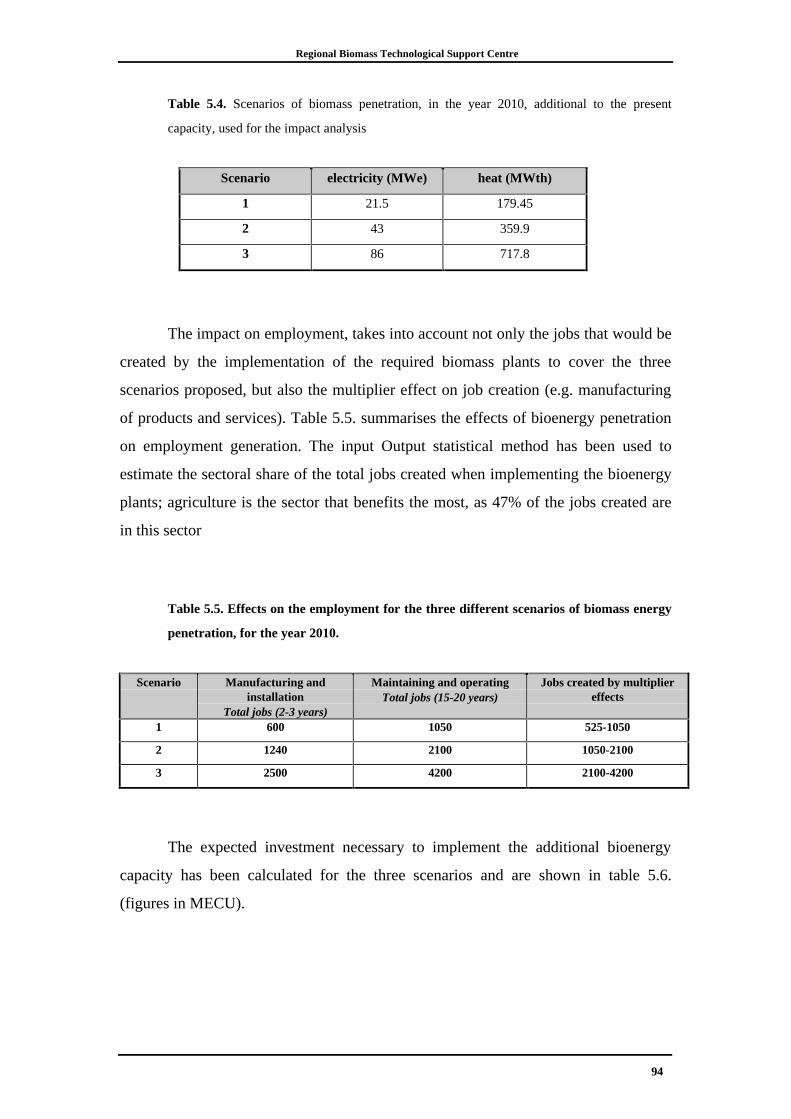
Regional Biomass Technological Support Centre
94
Table 5.4. Scenarios of biomass penetration, in the year 2010, additional to the present
capacity, used for the impact analysis
Scenario electricity (MWe) heat (MWth)
1 21.5 179.45
2 43 359.9
3 86 717.8
The impact on employment, takes into account not only the jobs that would be
created by the implementation of the required biomass plants to cover the three
scenarios proposed, but also the multiplier effect on job creation (e.g. manufacturing
of products and services). Table 5.5. summarises the effects of bioenergy penetration
on employment generation. The input Output statistical method has been used to
estimate the sectoral share of the total jobs created when implementing the bioenergy
plants; agriculture is the sector that benefits the most, as 47% of the jobs created are
in this sector
Table 5.5. Effects on the employment for the three different scenarios of biomass energy
penetration, for the year 2010.
Scenario Manufacturing andinstallation
Total jobs (2-3 years)
Maintaining and operating Total jobs (15-20 years)
Jobs created by multipliereffects
1 600 1050 525-1050
2 1240 2100 1050-2100
3 2500 4200 2100-4200
The expected investment necessary to implement the additional bioenergy
capacity has been calculated for the three scenarios and are shown in table 5.6.
(figures in MECU).
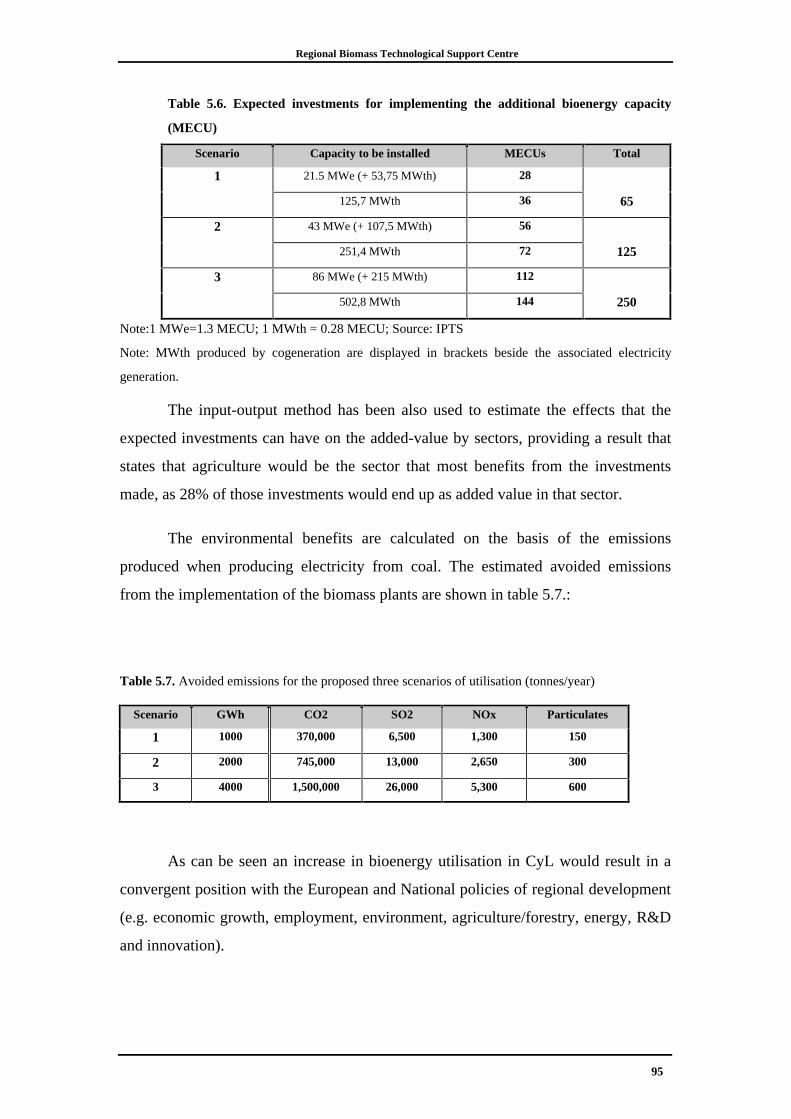
Regional Biomass Technological Support Centre
95
Table 5.6. Expected investments for implementing the additional bioenergy capacity
(MECU)
Scenario Capacity to be installed MECUs Total
1 21.5 MWe (+ 53,75 MWth) 28
125,7 MWth 36 65
2 43 MWe (+ 107,5 MWth) 56
251,4 MWth 72 125
3 86 MWe (+ 215 MWth) 112
502,8 MWth 144 250
Note:1 MWe=1.3 MECU; 1 MWth = 0.28 MECU; Source: IPTS
Note: MWth produced by cogeneration are displayed in brackets beside the associated electricity
generation.
The input-output method has been also used to estimate the effects that the
expected investments can have on the added-value by sectors, providing a result that
states that agriculture would be the sector that most benefits from the investments
made, as 28% of those investments would end up as added value in that sector.
The environmental benefits are calculated on the basis of the emissions
produced when producing electricity from coal. The estimated avoided emissions
from the implementation of the biomass plants are shown in table 5.7.:
Table 5.7. Avoided emissions for the proposed three scenarios of utilisation (tonnes/year)
Scenario GWh CO2 SO2 NOx Particulates
1 1000 370,000 6,500 1,300 150
2 2000 745,000 13,000 2,650 300
3 4000 1,500,000 26,000 5,300 600
As can be seen an increase in bioenergy utilisation in CyL would result in a
convergent position with the European and National policies of regional development
(e.g. economic growth, employment, environment, agriculture/forestry, energy, R&D
and innovation).
Regional Biomass Technological Support Centre
96
Local, regional and national authorities should promote, and stimulate, energy
savings and energy efficiency programmes, participate and encourage biomass energy
projects (e.g. subsidies and promoting activities) and facilitate the administrative
procedures in obtaining licenses to develop projects.
The sectoral operators, mainly centred in the utilities due to be larger
companies with suitable means for R&D works, should continue developing and
improving mature technologies (e.g. efficiency of direct combustion systems) as well
as researching in new technologies that can reach an industrial scale. Moreover all the
key actors from sectoral operators (Utilities, financing groups, large agroforestry
industries, SME’s, Resident’s Associations and individuals) should be aware of new
developments in biomass energy so that they can identify and implement heat and
power programmes at different scales according to the requirements of each key actor.
The most successful programmes are those that have been undertaken by small
countries or regions benefiting from a high degree of decision autonomy in the field
of energy planning (this is the specific case of Spain). Also the regional authorities, in
partnership with the local professionals and associative networks, have been the most
effective promoters of biomass. In this way, the European Union undoubtedly has a
role to play in encouraging regional and local authorities to prepare energy policies by
associating all the local partners concerned.
In conclusion, our findings indicate that the creation of such biomass centre in
the Soria province will stimulate the development of biomass energy-related activities
in CyL. Thus, it can be stated that the creation of a BioCentre will result in many
positive impacts ranging from socio-economic development, better utilisation of
natural resources, greater regional energy independence, and cleaner environment.
Regional Biomass Technological Support Centre
97
Bibliography• Anon, “The utilisation of biomass for energy in Austria”. IEA Bioenergy News 8, 2, 12. (1996)
• “Anuarios Estadisticos de Espana”, Instituto Nacional de Estadistica (INE). (various years)
• “Anuarios Estadisticos de la Junta de Castilla y Leon”, Junta de Castilla y Leon. (various years)
• “Anuario Estadistico de Castilla y Leon” Consejeria de Economia y Hacienda. Junta de Castilla yLeon, (1996)
• “Anuarios Estadisticos”, Ministerio de Industria y Energia (MINER), (various years)
• “Anuario de Estadistica Agraria”, Ministerio de Agricultura, Pesca y Alimentacion(MAAP) .(various years)
• “Atlas de Castilla y Leon”, Consejeria de Economia y Hacienda. Junta de Castilla y Leon (1996).
• Bridgewater, “Thermal Biomass Conversion and utilisation” Biomass Information System,University of Aston, European Commission 1996.
• “Boletin Mensual de Estadistica”, Instituto Nacional de Estadistica (INE) (various issues)
• “Boletin Mensual de Estadistica del Ministerio de Agricultura, Alimentacion y Pesca” (variousissues)
• “Boletin Mensual de Estadistica”, Ministerio de Agricultura, Pesca y Alimentacion (MAAP).(various years)
• Chartier, P.,“Perspectives for Biomass Energy in the European Union”. (1996)
• Christian Rakos. “The diffusion of Biomass District Heating in Austria”. (1996)
• CIEMAT, “Biomasa como Fuente de Energia y Productos para la Agricultura y la Industria”,(1990)
• “Coyuntura Economica de Castilla y Leon”, Consejeria de Economia y Hacienda. Junta de Castillay Leon (1997).
• “Datos Estadisticos de los Municipios de Castilla y Leon”, Consejeria de Economia y Hacienda.Junta de Castilla y Leon (1997).
• Dixon R.K., Brown, S. Houghton R.A.. Solomon, A.M. Trexler M.C. and Wisniewski J. “Carbonpools and flux of global forest ecosystems”, Science 263, 185190 (1994)
• “Energía de la biomasa”. Manuales de energías renovables, IDAE, (1996)
• Ericson, T., “Nutrient cycling in energy forest plantations”. Biomass and Bioenergy Vol. 6, pp 115-121. (1994)
• ETSU “Good practice guidelines: Short rotation coppice for energy productio”. Department ofTrade and Industry (London), Seacourt Press Ltd., Seacourt. (1996)
• “Evaluation of Biomass Potential and Development in Castilla y Leon”, Junta de Castilla y Leon,Consejeria de Castilla y Leon, (1992)
• “Exploiting R&D: Strategies to increase the use of biomass and biofuels. Main Report” ECOTECResearch & Consulting Ltd, UK and Spain. (1996).
• Ghislain Gosse, “Lignocellolosic energy crops in different agricultural scenarios”, Station deBioclimatologie, European Comission, 1996.
• Grassi G. “Potential employment impacts of bioenergy activity on employment”. Proceedings ofthe 9th European Bioenergy Conference, Vol 1, pp. 419-423. Eds. P. Chartier, G.L. Ferrero, V.M.Henins, S.Hultberg, J. Sachan and M. Wiinblad. (1996)
Regional Biomass Technological Support Centre
98
• Grubl A, Dell G. and Egger Ch. “Biomass Technologies in Austria market study”. Proceedings ofthe 9th European Bioenergy Conference, Vol 3, pp. 1788-1793. Eds. P. Chartier, G.L. Ferrero,V.M. Henins, S. Hultberg, J. Sachan and M. Wiinblad. (1996)
• “Guia de las Energias Renovables en Castilla y Leon”, Junta de Castilla y Leon IDAE/MINER.(1995).,
• Hall D.O., Rosillo Calle F. and Scrase J.I. “Biomass: An environmentally acceptable andsustainable energy source for the future”. Report to the Division of Sustainable Development,United Nations, New York. (1996)
• Hillring B. “Price trends in the Swedish woodfuel market”. Biomass and Bioenergy 12, 4151.(1997)
• Instituto de Estudios de la Energia (CIEMAT/IEE) (Various)
• “Integrated Biomass System”, Finesport engineering s.r.l., European Commission, 1992
• Jim Coombs, “Bioconversion Assessment Study”, CPL Scientific, European Commission, (1996)
• “Las Energias Renovables en Espana, Balance y Perpectivas 2000”, Secretaria de Estado de laEnergia y Recurso Minerales. Ministerio de Industria y Energia (MINER), (1996).
• “Las Energias Renovables en Castilla y Leon”, EREN (Ente Regional de la Energia) Junta deCyL. (1997)
• “Manual de Energia de la Biomasa”, Instituto para la Diversificacion de la Energia (IDAE),IDAE/MINER. (1996).
• Martin J.A. “A total fuel cycle approach to reducing greenhouse gas emissions: Solar generationtechnologies as greenhouse gas offsets in U.S. utility systems”. Solar Energy 59, 195203. (1997)
• “Memoria de la Division de Biomasa 1994-1995.”. Centro de Investigaciones Energeticas,Medioambientales y Tecnologicas (CIEMAT). (1996),
• Moncada Paternò Castello, et al. “Studio di Prefattibilita di un’Agencia Mediterranea in Sicilia perla Promozione delle Energie Rinnovabili e la Gestione Efficiente dell’Acqua”. The IPTS TechnicalReport Series, EUR 17255 IT(1996).
• Moncada Paternò Castello, Aguado, M. “Bioelectricity & employment impact”. Proceedings of theseminar “La biomasa fuente de riqueza”, Córdoba 1996.
• Myers N., “Lifting the veil on perverse subsidies”, Nature:392, 327327. (1998).
• Oriol Amat Salas, “Análisis Económico Financiero”. ed. Gestión 2000 S.A. (1995)
• Parfomak P.W. “Falling generation costs, environmental externalities and the economics ofelectricity conservation”. Energy Policy 25, 845860. (1997)
• “Politica Energetica Espanola”, Ministerio de Industria y Energia (MINER)., Secretaria Generalde la Energia y Recursos Minerales (various).
• Rijtema, P.E., De Vries, D., “Differences in Precipitation Excess and Nitrogen Leaching fromAgricultural Lands and Forest Plantations”, Biomass and Bioenergy Vol. 6, pp. 103113. (1994)
• Scrase, I. “Employment Opportunities from Biomass”(1997).
• Scrase, I. “Overview of Biomass in the EU” (1998).
• “Segundo Inventario Forestal (IFN2), Provincia de Soria”. Instituto Nacional para la Conservacionde la Naturaleza (ICONA/MAAP) (1994).
• Smith, C.T., “Environmental Consequences of Intensive Harvesting”, Biomass and Bioenergy, Vol.9, pp.161179. (1995)
• Solantausta, Bridgewater, Beckman, “Electricity Production by Advanced Biomass PowerSystems”, Technical Research Centre of Finland ESPOO, 1996.
Regional Biomass Technological Support Centre
99
• “Total Costs and Benefits of Biomass in selected regions of the European Union”: Final Report onPhase 1 of the EUJOULE project JOR3CT950006. BioCosts (1996)
• Venendaal R., Jrrgensen U. and Foster C.A. “European Energy Crops: A synthesis”. Biomass andBioenergy 13, 147185. (1997)
• Weinrech V.S. “Costs and employment impacts of renewable energies”. Paper presented at theETSU/Altener conference on The Social and Economic Impact of renewable Energy,StratforduponAvon, 11 September 1996. Research carried out as part of the EUAPAS ProjectRENACT940041: Long term integration of renewable energy sources into the European energysystem and its potential economic and environmental impacts. (1996)
• “White Paper on renewable Energies”. European Commission(1997).
• Wood E. “Biofuels and job creation”. Biologue 10, 6 11, (1992)
Regional Biomass Technological Support Centre
100
Acknowledgements
We would like to thank all those people who has collaborated in putting
together this report. We would like to thank all of them individually but they are too
many to list; we offer our apologies.
We would like especially to thank Dr. Juan Carrasco, Director of CEDER, for
his encouragement and support, and to the rest of the personnel at CEDER for their
assistance during our visit to the centre; to Mr. Domingo Heras, Director of the
Patronato para el Desarrollo Integral, and Mr. Gonzalo Mendoza Zabala, Director of
Soria Proyecta, for their support and contribution to the organisation of the meeting
in Soria.
In addition we would like to thank the organisations who answered our
enquiry of information, and specially to: Wilhelm Schlader (Energieinstitut
Voralberg); Pascaline Lamaire (Regional Agency Biomass Energy (Erbe)); Andreas
Keel (Association Suisse Pour L’energie Du Bois (Aseb)); Dr. N. Zografakis
(Regional Energy Agency Of Crete); Horst D. Scheuer (The Styrian Energy Agency);
Yann Oremus (Association Regionale Biomasse Normandie); Unni Lestum
(Okoplan); Yannick Marcon (Association Jurassienne pour la difussion des energies
alternatives,AJENA); Frederick Douard (Institut Technique Europeen du bois
energie,ITEBE); David Taylor (Irish Energy).
Regional Biomass Technological Support Centre
101
Contacts
Pietro Moncada Paternò-Castello
European Commission - Joint Research Centre
Institute for Prospective Technological Studies (IPTS)
W.T.C. Isla de la Cartuja, E-41092 Sevilla
Tel:+34-95-4488388, Fax: +34-5-4488279
E-mail: [email protected]
Web:http://www.jrc.es/~moncada
Francisco Javier Peinado Lebrero
European Commission - Joint Research Centre
Institute for Prospective Technological Studies (IPTS)
W.T.C. Isla de la Cartuja, E-41092 Sevilla
Tel:+34-95-4488329, Fax: +34-5-4488279
E-mail: [email protected]
Web:http://www.jrc.es/~peinado
Miguel Angel Aguado Monsonet
European Commission - Joint Research Centre
Institute for Prospective Technological Studies (IPTS)
W.T.C. Isla de la Cartuja, E-41092 Sevilla
Tel:+34-95-4488290, Fax: +34-5-4488279
E-mail: [email protected]
Web:http://www.jrc.es/~aguado
Dr. Frank Rosillo-Calle
King’s College London (KCL)
Division of Life Sciences
Campden Hill Road
London W8 7AH, UK
Tel: +44 (171) 333 4085
Fax: +44 (171) 333 4084
E-mail: [email protected]
Prof.D.O. Hall
Regional Biomass Technological Support Centre
102
King’s College London (KCL)
Division of Life Sciences
Campden Hill Road
London W8 7AH, UK
Tel: +44 (171) 333 4317
Fax: +44 (171) 333 4500
E-mail: [email protected]
Jesús Alonso Gonzalez
Unión Fenosa Ingeniería (UFISA)
c/Orense, 81 28020 Madrid
Tel: +34-1-5718582, Fax: +34-1-5711529
E-mail: [email protected]
Javier Alonso Martínez
Unión Fenosa Ingeniería (UFISA)
c/Orense, 81 28020 Madrid
Tel: +34-1-5718582, Fax: +34-1-5711529
E-mail: [email protected]