Embed Size (px)
Citation preview
Final draft R013_0405_env
UPDATE OF THE RISK ASSESSMENT OF
BIS(PENTABROMOPHENYL) ETHER (DECABROMODIPHENYL ETHER)
CAS Number: 1163-19-5 EINECS Number: 214-604-9
Final Environmental Draft of May 2004
Final draft R013_0405_env
ii
Introduction
A risk assessment of bis(pentabromophenyl) ether (generally known as ‘decabromodiphenyl ether’) produced in accordance with Council Regulation (EEC) 793/931 was published in 20022. The report highlighted a number of areas of uncertainty in relation to the secondary poisoning endpoint but concluded that consideration should be given at a policy level to the need to investigate risk management options in the absence of adequate scientific knowledge. In response to this conclusion, Industry voluntarily carried out further work to reduce the uncertainty in the assessment (including a more widespread monitoring project of the levels of decabromodiphenyl ether in birds’ eggs and a further investigation of the photolytic behaviour of the substance). In parallel with this testing, the rapporteur is investigating options for risk management and Industry has initiated a voluntary product stewardship programme. This updated risk assessment reviews the data on the exposure, fate and effects of decabromodiphenyl ether that have become available since the original risk assessment was completed. This includes the Industry-sponsored work, information submitted for the developing risk reduction strategy and data reported in the open literature. The rapporteur has consequently re-assessed the risks from the use of the substance, using the updated methodology of the revised Technical Guidance Document (2003). The format of the report is broadly in line with that of the original risk assessment. Significant new information is summarised and comments have been added to indicate how this affects the findings from the original report. The report addresses comments from Member States, Industry, and a peer-review panel of independent scientists in the UK (Dr A. Carter & Dr N. MacKay, ADAS Rosemaund; Dr H Crick, British Trust for Ornithology; Dr A. Hart, Central Science Laboratory; Dr H. Painter, independent biodegradation expert; Dr A. Sweetman, Lancaster University). N.B. This report has not yet been combined with the revised human health risk assessment that was circulated for discussion at the Technical Committee for New and Existing Substances in March 2004. Sections where the cross-referencing will need updating are indicated by ‘4.xxx’, highlighted in yellow. Rapporteur: United Kingdom Contact for the environmental section: Environment Agency, Chemicals Assessment Unit
Isis House, Howbery Park, Wallingford, Oxfordshire, OX10 8BD, UK Fax: + 44 1491 828 556 E-mail: [email protected]
The scientific work on the environmental sections was carried out by the Building Research Establishment Ltd (BRE), under contract to the rapporteur. 1 O.J. No. L 084, 05/04/1993 p. 0001 - 0075 2 European Union Risk Assessment Report: Bis(pentabromophenyl ether). 1st Priority List, Volume 17. European Commission Joint Research Centre, EUR 20402 EN, 2002. http://ecb.jrc.it/Documents/Existing-Chemicals/RISK_ASSESSMENT/REPORT/decabromophenyletherreport013.pdf

Final draft R013_0405_env
iii
Date of Last Literature Search: January 2004 (environment). A small number of important papers published since then have also been reviewed.
Final draft R013_0405_env
iv
OVERALL RESULTS OF THE RISK ASSESSMENT CAS Number: 1163-19-5 EINECS Number: 214-604-9 IUPAC Name: Bis(pentabromophenyl) ether Environment (x) i) There is a need for further information and/or testing. This conclusion applies to the PBT assessment. Decabromodiphenyl ether is likely to be very persistent (vP), but not bioaccumulative nor toxic in the marine environment according to the criteria presented in the Technical Guidance Document. However, the PBT assessment is complicated by data available on the: • widespread occurrence of the substance in top predators (e.g. birds and mammals,
including terrestrial species) and the Arctic; • neurotoxic effects and uptake of the substance by mammals in laboratory studies; and • possible formation of more toxic and accumulative products such as lower
brominated diphenyl ether congeners and brominated dibenzofurans in the environment.
This means that the available assessment methodology might not be applicable to this substance. As a minimum there is a continued need to monitor environmental contamination for a suitable time period for both the substance and (if possible) its more toxic and bioaccumulative degradation products. The monitoring options are outlined in a report (available on request from the rapporteur), but matrices will include estuarine sediment, bird of prey tissues and sewage sludge samples at least. Any programme should be reviewed at suitable time points to decide if further action is necessary. The fact that the additional work will take some years to deliver results led to a further examination of the evidence presented in this updated assessment at the policy level in May 2004 to review whether precautionary risk management is still considered necessary. The outcome is reported below. [The original assessment noted that the possible long-term increase in levels as a result of releases from waste sites might need to be considered further in any future revision. Methods are still not available to enable this to be done, so this statement is still valid.] (x) ii) There is at present no need for further information and/or testing or for risk reduction measures beyond those which are being applied already. This conclusion applies to the assessment of surface water and sediment (freshwater and marine), waste water treatment plants, the terrestrial compartment, the air compartment and secondary poisoning for all life cycle stages using the PEC/PNEC assessment approach.

Final draft R013_0405_env
v
Human health To be added Results of further discussion at the policy level (May 2004) The Competent Authorities agreed that the voluntary emission reduction programme proposed by Industry should be implemented in parallel with the collection of further data as described above. Industry will be required to provide progress updates in a series of interim reports delivered at suitable intervals. Depending on the success of the programme in reducing emissions, and the results of the further scientific investigations, the need for more formal risk reduction measures might be reviewed at a later date.
Final draft R013_0405_env
vi
CONTENTS
OVERALL RESULTS OF THE RISK ASSESSMENT IV
1 GENERAL SUBSTANCE INFORMATION 1
1.1 IDENTIFICATION OF THE SUBSTANCE 1
1.2 PURITY/IMPURITY, ADDITIVES 1
1.3 PHYSICO-CHEMICAL PROPERTIES 1 1.3.1 Summary of original risk assessment 1 1.3.2 Updated information 1
2 GENERAL INFORMATION ON EXPOSURE 3
2.1 PRODUCTION 3
2.2 USE 3 2.2.1 Summary of original risk assessment report 3 2.2.2 Updated information 3
2.3 EXPOSURE CONTROL 4
3 ENVIRONMENT 8
3.1 EXPOSURE ASSESSMENT 8 3.1.0 General discussion 8
3.1.0.1 Release from production 9 3.1.0.2 Emissions from use in polymer applications 9
3.1.0.2.1 Release at a polymer processing site 9 3.1.1.1.1 Release during service life of polymer products 10
3.1.0.3 Emissions from use in textiles 15 3.1.0.3.1 Formulation and back coating of textiles 15 3.1.0.3.2 Release during service life of textiles 17 3.1.0.3.3 Other possible sources 19
3.1.0.4 Summary of release estimates 20 3.1.0.4.1 Summary from original risk assessment 20 3.1.0.4.2 Summary of updated release estimates 20
3.1.0.5 Degradation 22 3.1.0.5.1 Abiotic degradation 22 3.1.0.5.2 Biodegradation 31
3.1.0.6 Accumulation 32 3.1.0.6.1 Summary of original risk assessment report 32 3.1.0.6.2 Updated information 32 3.1.0.6.3 Summary and discussion 37
3.1.0.7 Environmental distribution 39 3.1.0.7.1 Summary of original risk assessment report 39 3.1.0.7.2 Updated information 39
3.1.1 Aquatic compartment 41 3.1.1.1 Calculation of PECs 41
Final draft R013_0405_env
vii
3.1.1.1.1 Summary of original risk assessment report 41 3.1.1.1.2 Updated calculations 42
3.1.1.2 Levels of decabromodiphenyl ether in water, sediment and waste water treatment plants (WWTP) 42
3.1.1.2.1 Summary of original risk assessment report 42 3.1.1.2.2 Updated information 42 3.1.1.2.3 Comparison of predicted and measured levels 48
3.1.2 Terrestrial compartment 48 3.1.2.1 Predicted concentrations 48
3.1.2.1.1 Summary of original risk assessment report 48 3.1.2.1.2 Updated calculations 49
3.1.2.2 Measured levels 49 3.1.2.2.1 Summary of original risk assessment report 49 3.1.2.2.2 Updated information 50 3.1.2.2.3 Comparison of predicted and measured levels 50
3.1.3 Atmosphere 50 3.1.3.1 Calculation of PECs 50
3.1.3.1.1 Summary of original risk assessment report 50 3.1.3.1.2 Updated calculations 51
3.1.3.2 Measured levels 51 3.1.3.2.1 Summary of original risk assessment report 51 3.1.3.2.2 Updated information 51 3.1.3.2.3 Comparison of predicted and measured levels 53
3.1.4 Non-compartment specific exposure relevant to the food chain 54 3.1.4.1 Predicted concentrations 54
3.1.4.1.1 Summary of original risk assessment report 54 3.1.4.1.2 Updated calculations 54
3.1.4.2 Measured levels 55 3.1.4.2.1 Levels in aquatic biota 56 3.1.4.2.2 Levels in terrestrial biota 62 3.1.4.2.3 Levels in humans 78 3.1.4.2.4 Comparison of predicted and measured levels 78
3.1.5 Exposure assessment for the marine environment 78
3.2 EFFECTS ASSESSMENT: HAZARD IDENTIFICATION AND DOSE (CONCENTRATION) – RESPONSE (EFFECT) ASSESSMENT 81
3.2.1 Aquatic compartment (including sediment) 81 3.2.1.1 Summary of original risk assessment report 81 3.2.1.2 Updated information 81
3.2.2 Terrestrial compartment 82 3.2.2.1 Summary of original risk assessment report 82 3.2.2.2 Updated information 82
3.2.3 Atmosphere 82 3.2.3.1 Summary of original risk assessment report 82 3.2.3.2 Updated information 82
3.2.4 Non-compartment specific effects relevant for the food chain (secondary poisoning) 82
3.2.4.1 Summary of original risk assessment report 82 3.2.4.2 Updated information 83 3.2.4.3 Predicted no effect concentration (PNEC) for secondary poisoning 83
Final draft R013_0405_env
viii
3.3 RISK CHARACTERISATION 85 3.3.1 Aquatic compartment (including sediment) 85
3.3.1.1 Water 85 3.3.1.2 Sediment 85
3.3.1.2.1 Summary of original risk assessment report 85 3.3.1.2.2 Updated assessment 85
3.3.1.3 Sewage treatment processes 86 3.3.1.3.1 Summary of original risk assessment report 86 3.3.1.3.2 Updated assessment 86
3.3.2 Terrestrial compartment 86 3.3.2.1 Summary of original risk assessment report 86 3.3.2.2 Updated assessment 87
3.3.3 Atmosphere 87 3.3.4 Non-compartment specific effects relevant for the food chain (secondary
poisoning) 88 3.3.4.1 Summary of original risk assessment report 88 3.3.4.2 Updated assessment 88
3.3.5 Marine risk assessment 89 3.3.5.1 Risk characterisation for the marine environment 89 3.3.5.2 PBT assessment 90
3.3.5.2.1 Persistence 90 3.3.5.2.2 Bioaccumulation 90 3.3.5.2.3 Toxicity 92 3.3.5.2.4 Summary of PBT assessment 94
4 HUMAN HEALTH 98
5 RESULTS 99
6 REFERENCES 101
7 OTHER PAPERS REVIEWED THAT DID NOT CONTAIN SIGNIFICANT NEW INFORMATION RELEVANT TO THE RISK ASSESSMENT 110
ANNEX FUTURE MONITORING OPTIONS This is available on request from the rapporteur.
Final draft R013_0405_env
1
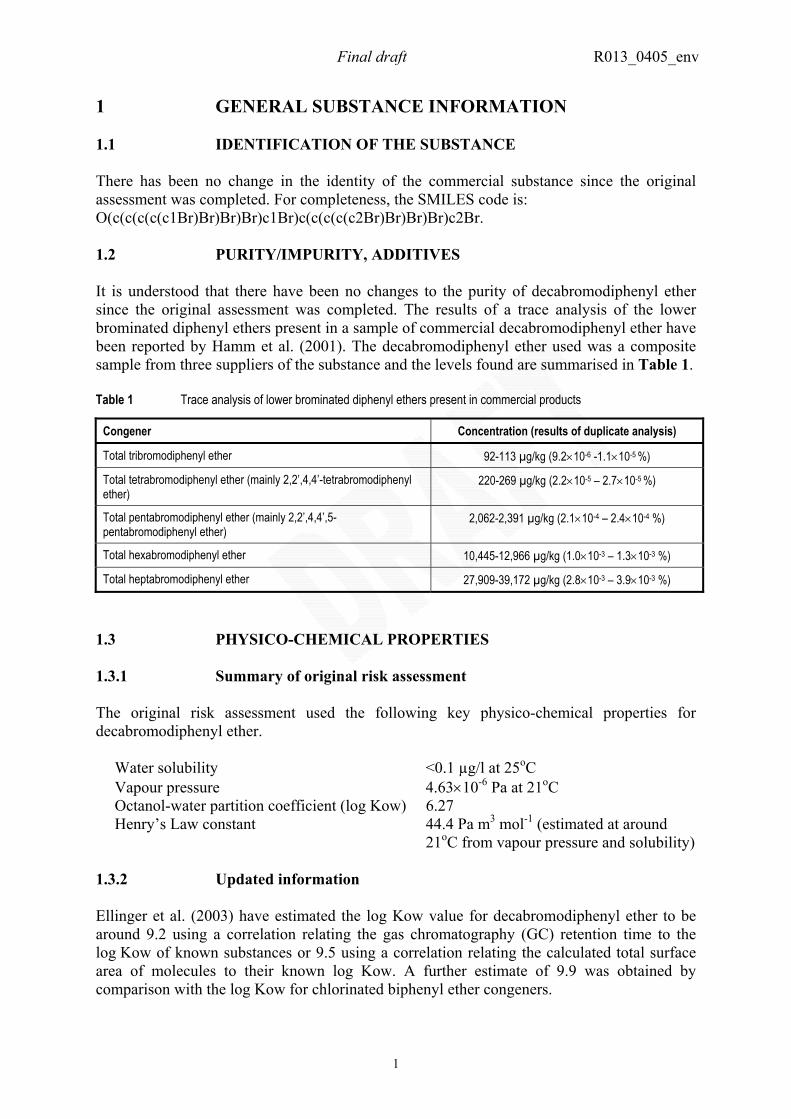
1 GENERAL SUBSTANCE INFORMATION 1.1 IDENTIFICATION OF THE SUBSTANCE There has been no change in the identity of the commercial substance since the original assessment was completed. For completeness, the SMILES code is: O(c(c(c(c(c1Br)Br)Br)Br)c1Br)c(c(c(c(c2Br)Br)Br)Br)c2Br. 1.2 PURITY/IMPURITY, ADDITIVES It is understood that there have been no changes to the purity of decabromodiphenyl ether since the original assessment was completed. The results of a trace analysis of the lower brominated diphenyl ethers present in a sample of commercial decabromodiphenyl ether have been reported by Hamm et al. (2001). The decabromodiphenyl ether used was a composite sample from three suppliers of the substance and the levels found are summarised in Table 1. Table 1 Trace analysis of lower brominated diphenyl ethers present in commercial products
Congener Concentration (results of duplicate analysis)
Total tribromodiphenyl ether 92-113 µg/kg (9.2×10⁻⁶ -1.1×10⁻⁵ %)
Total tetrabromodiphenyl ether (mainly 2,2’,4,4’-tetrabromodiphenyl ether)
220-269 µg/kg (2.2×10⁻⁵ – 2.7×10⁻⁵ %)
Total pentabromodiphenyl ether (mainly 2,2’,4,4’,5-pentabromodiphenyl ether)
2,062-2,391 µg/kg (2.1×10⁻⁴ – 2.4×10⁻⁴ %)
Total hexabromodiphenyl ether 10,445-12,966 µg/kg (1.0×10⁻³ – 1.3×10⁻³ %)
Total heptabromodiphenyl ether 27,909-39,172 µg/kg (2.8×10⁻³ – 3.9×10⁻³ %)
1.3 PHYSICO-CHEMICAL PROPERTIES 1.3.1 Summary of original risk assessment The original risk assessment used the following key physico-chemical properties for decabromodiphenyl ether. Water solubility <0.1 µg/l at 25oC Vapour pressure 4.63×10⁻⁶ Pa at 21oC Octanol-water partition coefficient (log Kow) 6.27 Henry’s Law constant 44.4 Pa m3 mol-1 (estimated at around
21oC from vapour pressure and solubility) 1.3.2 Updated information Ellinger et al. (2003) have estimated the log Kow value for decabromodiphenyl ether to be around 9.2 using a correlation relating the gas chromatography (GC) retention time to the log Kow of known substances or 9.5 using a correlation relating the calculated total surface area of molecules to their known log Kow. A further estimate of 9.9 was obtained by comparison with the log Kow for chlorinated biphenyl ether congeners.
Final draft R013_0405_env
2
Wania and Dugani (2003) derived an internally consistent set of physico-chemical property data for decabromodiphenyl ether using regression equations based on the data available for various di- to hexabromodiphenyl ethers. The predicted values for decabromodiphenyl ether were: vapour pressure 5×10⁻⁹ Pa; water solubility 0.28 µg/l; log Kow 8.70; log KOA 15.27 (octanol-air partition coefficient), log KAW -5.07 (air-water partition coefficient: this is equivalent to a Henry’s Law constant of 0.02 Pa m3 mol-1). It should be noted that the values estimated for water solubility and vapour pressure (and hence subsequent properties that rely on these values) are for the sub-cooled liquid and so are not directly comparable to the values reported in the original risk assessment for the solid (it would be expected that the vapour pressure and water solubility of the solid would be lower than that of the sub-cooled liquid). The new log Kow values determined by Ellinger et al. (2003) and estimated by Wania and Dugani (2003) are similar to that estimated previously using a HPLC technique (9.97; Watanabe and Tasukawa, 1990). The estimated vapour pressure of Wania and Dugani (2003) is lower than reported in the original risk assessment report. However, it should be noted that this new value is still only an estimate, and the value used in the original risk assessment report was based on experimental measurements (albeit with some uncertainty around the value). The estimated water solubility of Wania and Dugani (2003) appears to be in reasonable agreement with the available measured data given in the original report. Although the preferred log Kow value of 6.27 may appear low compared to values reported in the recent literature and widely used for lower congeners, the effect on the risk assessment of varying this value up to 9.7 was considered in Appendix E of the original report (this appendix also considered variations in other physico-chemical properties). Overall, the actual value chosen for log Kow did not have much effect, because the other important partition coefficients used in the calculations (e.g. fish bioconcentration factor) were based on measured data for decabromodiphenyl ether rather than predictions based on the log Kow value. The greatest uncertainty related to the sensitivity of the calculations of human exposure via the environment to the log Kow value. Therefore the key physico-chemical properties for the environmental modelling are the same as in the original assessment. The solubility of the substance in a variety of common organic solvents is believed to be very limited (see original report). Solubility in other types of solvent has been reported in recent studies measuring uptake in biota (e.g. Mörck et al. (2003) and Sandholm et al. (2003)). These data are considered in Sections 3.1.0.6.2 and 4.xxx, but in summary: Solvent Solubility, g/l Anisole 9.4 Tetrahydrofuran (THF) 8.8 Soya phospholipone:Lutrol (16:34 mixture) in water (concentration 0.11 g/l) 7 Dimethylamine (DMA) 6.6 Toluene 4.1 Anisole/peanut oil (30:70 mixture) 3.8 Dimethyl sulphoxide (DMSO) 3.5 Dimethyl sulphoxide:peanut oil (50:50 mixture) 2.5 Dimethylamide:polyethylene glycol:water (4:4:1 mixture) 1.9 Peanut oil <1 Ethyl acetate <0.8
Final draft R013_0405_env
3
2 GENERAL INFORMATION ON EXPOSURE 2.1 PRODUCTION The original risk assessment report indicated that decabromodiphenyl ether is no longer produced in the EU but is imported at high tonnage. It is understood that this is still the case. 2.2 USE 2.2.1 Summary of original risk assessment report The use pattern for decabromodiphenyl ether given in the original risk assessment was based on a consumption of 8,210 tonnes/year in the mid-1990s. The use pattern used in the assessment is shown below.
Use as a flame retardant in polymers 6,710 tonnes/year (81.7% of total) Use as a flame retardant in textiles 1,500 tonnes/year (18.3%) Total 8,210 tonnes/year
The net import of decabromodiphenyl ether into the EU in finished articles was assumed to be small compared with the actual amounts of decabromodiphenyl ether used in the EU. 2.2.2 Updated information The European Brominated Flame Retardant Industry Panel (EBFRIP) have provided more up-to-date information on the use of decabromodiphenyl ether in the EU to inform the risk reduction strategy that is under development as a result of the original risk assessment (EBFRIP, 2003). EBFRIP (2003) indicates that the current (2002) amount of decabromodiphenyl ether used in textiles in the EU is around 2,500 tonnes/year with around half of this being used in the United Kingdom. It is also indicated that the use in textiles in the EU is around 30% of the total EU usage and that it was envisaged that this percentage of total use would remain reasonably stable. On this basis, it can be estimated that the current total EU usage is around 8,300 tonnes/year, with 5,800 tonnes/year (70% of total) being used in plastic/polymer applications and 2,500 tonnes/year (30% of total) being used in textile applications. EBFRIP (2003) pointed out that although around 50% of the decabromodiphenyl ether used in textiles is used directly in the United Kingdom, a large proportion of the flame retardant formulations for backcoating, and the backcoated textiles themselves, are imported into the United Kingdom. The reason for this is that the only EU countries that currently have regulations specifying a level of flame retardancy for domestic upholstery fabrics are the United Kingdom and Eire. As a result, the large majority of upholstered fabrics containing flame retardants are supplied to these markets. In the domestic situation, decabromodiphenyl ether is most likely to be present as a backcoating on fixed upholstery (i.e. it is nailed/stapled onto the furniture and is not intended to be removed and therefore washed), although it may also be present on some types of removable seat cushions (Texconsul, 2003a). Such treated textiles will be labelled with the
Final draft R013_0405_env
4
appropriate care (cleaning) instructions. Few other textiles present in homes will contain decabromodiphenyl ether. EBFRIP (2003) also indicated that there is expected to be a slow but steady increase in the consumption of decabromodiphenyl ether in the EU in future years. However a more rapid increase in consumption could be expected if fire safety standards for domestic upholstered furniture within the rest of the EU are brought into line with those currently required in the United Kingdom. It should be noted that there are already requirements for flame retarded textiles for the contract sector/public buildings in other countries within the EU (e.g. the M1 norm in France and the B1 standard in Germany) and so textiles treated with decabromodiphenyl ether will still be used in these countries (TFA, 2003). EBFRIP (2003) also confirmed that decabromodiphenyl ether does not play an important role as a flame retardant for carpets. Most synthetic carpets are currently treated with a heavily-loaded thick backcoating of aluminium trihydrate. Nevertheless, this might change in the future if polypropylene-based fibres become more common (as they are potentially recyclable), and if the trend to flame-retard the polypropylene fibres themselves with brominated flame retardants (rather than to apply an after-treatment) increases. EBFRIP (2003) estimated that the amount of decabromodiphenyl ether imported into the EU in finished articles was around 1,300 tonnes/year. This estimate consisted of 500 tonnes/year from decabromodiphenyl ether present in non-television (TV) consumer electronics produced in Asia, 400 tonnes/year of decabromodiphenyl ether present in TVs produced in Asia, and 400 tonnes/year of decabromodiphenyl ether in flame retarded polystyrene produced outside the EU. It should also be noted that products containing decabromodiphenyl ether could also be exported out of the EU. The world-wide demand for decabromodiphenyl ether was reported to be 56,100 tonnes in 2001 (Voorspoels et al, 2003). For this revised assessment, the total EU consumption of decabromodiphenyl ether will be assumed to be 8,300 tonnes/year, with 5,800 tonnes/year being used in plastics mainly for electrical and electronic equipment and 2,500 tonnes/year being used in textiles. In addition it will be assumed that a further 1,300 tonnes/year of decabromodiphenyl ether are imported into the EU in finished (or partly finished) articles. 2.3 EXPOSURE CONTROL Directive 2002/96/EC3 on Waste Electrical and Electronic Equipment (WEEE Directive) became European law on the 13th February 2003 and should be implemented by Member States by the 13th August 2004. The purpose of this Directive is the prevention of waste electrical and electronic equipment and to reduce the disposal of such waste through reuse, recycling and other forms of recovery. The Directive seeks to improve the environmental performance of all operators involved in the lifecycle of electrical and electronic equipment (e.g. producers, distributors and consumers, and in particular, those operators directly involved in the treatment of waste electrical and electronic equipment). The Directive encourages the electrical and electronic equipment producers to design products so as to facilitate reuse and recycling, instigate systems for the separate collection of waste electronic
3 Directive 2002/96/EC of the European Parliament and of the Council of 27 January 2003 on waste electrical and electronic equipment (WEEE). Official Journal of the European Union, L37, 13/2/2003, pp24-38.
Final draft R013_0405_env
5
equipment and also encourages the use of best available treatment, recovery and recycling techniques for waste electrical and electronic equipment. The Directive also requires plastics containing brominated flame retardants to be collected separately from other waste. A further Directive (Directive 2002/95/EC) on the restriction of the use of certain hazardous substances in electrical and electronic equipment (RoHS Directive) also became European law on the 13th February 2003. This Directive should be implemented by Member States by the 13th August 2004. This Directive requires that new electrical and electronic equipment placed on the market from 1st July 2006 does not contain polybrominated diphenyl ethers (PBDEs) (with a potential exemption of decabromodiphenyl ether following the finalisation of this risk assessment). Decabromodiphenyl ether is considered a priority substance within the Water Framework Directive. No quality standard has so far been set for this substance but it is understood that the use of specific monitoring of sediment and biota is being considered to ensure that the ‘no deterioration’ target within the Directive is met. The brominated flame retardant industry, through the Bromine Environmental Science Forum (BSEF) has instigated several voluntary product stewardship programmes (BSEF, 2003a and 2003b). These are summarised in Table 2. The intention of these programmes is to reduce emissions of decabromodiphenyl ether by focussing on those parts of the life cycle with potential for dust emissions in particular. These are set out in Figure 2.1.
Final draft R013_0405_env
6
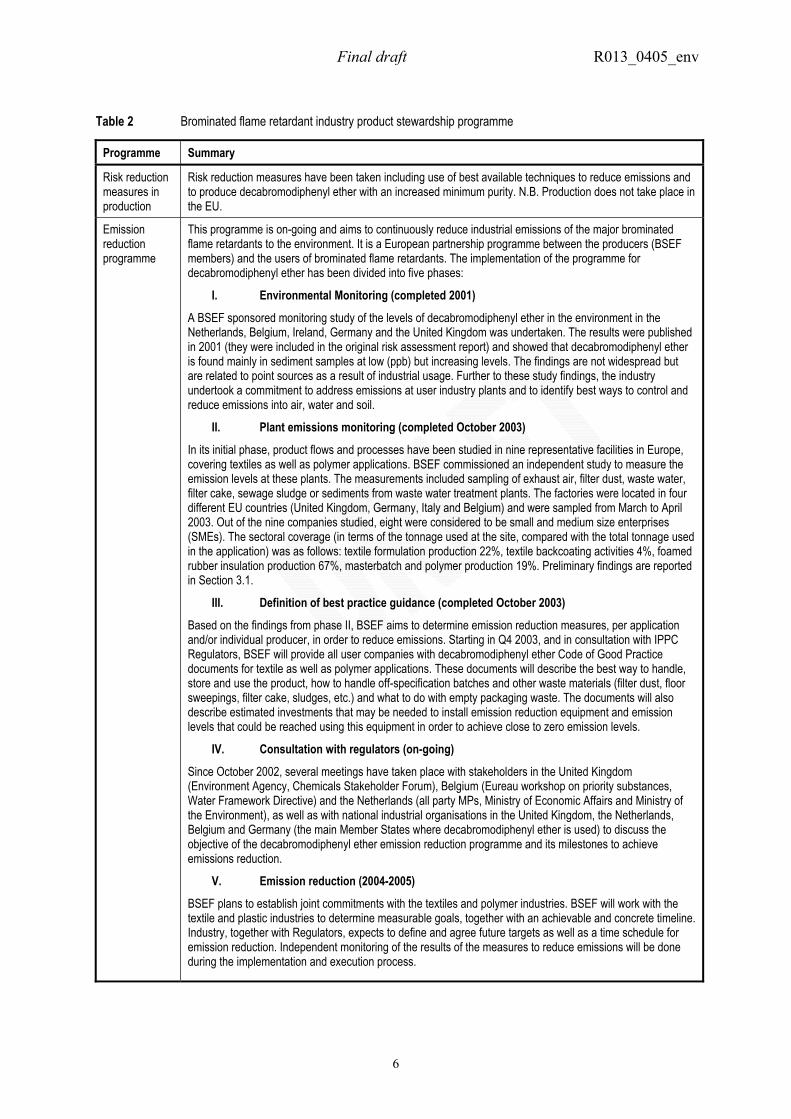
Table 2 Brominated flame retardant industry product stewardship programme
Programme Summary
Risk reduction measures in production
Risk reduction measures have been taken including use of best available techniques to reduce emissions and to produce decabromodiphenyl ether with an increased minimum purity. N.B. Production does not take place in the EU.
Emission reduction programme
This programme is on-going and aims to continuously reduce industrial emissions of the major brominated flame retardants to the environment. It is a European partnership programme between the producers (BSEF members) and the users of brominated flame retardants. The implementation of the programme for decabromodiphenyl ether has been divided into five phases:
I. Environmental Monitoring (completed 2001)
A BSEF sponsored monitoring study of the levels of decabromodiphenyl ether in the environment in the Netherlands, Belgium, Ireland, Germany and the United Kingdom was undertaken. The results were published in 2001 (they were included in the original risk assessment report) and showed that decabromodiphenyl ether is found mainly in sediment samples at low (ppb) but increasing levels. The findings are not widespread but are related to point sources as a result of industrial usage. Further to these study findings, the industry undertook a commitment to address emissions at user industry plants and to identify best ways to control and reduce emissions into air, water and soil.
II. Plant emissions monitoring (completed October 2003)
In its initial phase, product flows and processes have been studied in nine representative facilities in Europe, covering textiles as well as polymer applications. BSEF commissioned an independent study to measure the emission levels at these plants. The measurements included sampling of exhaust air, filter dust, waste water, filter cake, sewage sludge or sediments from waste water treatment plants. The factories were located in four different EU countries (United Kingdom, Germany, Italy and Belgium) and were sampled from March to April 2003. Out of the nine companies studied, eight were considered to be small and medium size enterprises (SMEs). The sectoral coverage (in terms of the tonnage used at the site, compared with the total tonnage used in the application) was as follows: textile formulation production 22%, textile backcoating activities 4%, foamed rubber insulation production 67%, masterbatch and polymer production 19%. Preliminary findings are reported in Section 3.1.
III. Definition of best practice guidance (completed October 2003)
Based on the findings from phase II, BSEF aims to determine emission reduction measures, per application and/or individual producer, in order to reduce emissions. Starting in Q4 2003, and in consultation with IPPC Regulators, BSEF will provide all user companies with decabromodiphenyl ether Code of Good Practice documents for textile as well as polymer applications. These documents will describe the best way to handle, store and use the product, how to handle off-specification batches and other waste materials (filter dust, floor sweepings, filter cake, sludges, etc.) and what to do with empty packaging waste. The documents will also describe estimated investments that may be needed to install emission reduction equipment and emission levels that could be reached using this equipment in order to achieve close to zero emission levels.
IV. Consultation with regulators (on-going)
Since October 2002, several meetings have taken place with stakeholders in the United Kingdom (Environment Agency, Chemicals Stakeholder Forum), Belgium (Eureau workshop on priority substances, Water Framework Directive) and the Netherlands (all party MPs, Ministry of Economic Affairs and Ministry of the Environment), as well as with national industrial organisations in the United Kingdom, the Netherlands, Belgium and Germany (the main Member States where decabromodiphenyl ether is used) to discuss the objective of the decabromodiphenyl ether emission reduction programme and its milestones to achieve emissions reduction.
V. Emission reduction (2004-2005)
BSEF plans to establish joint commitments with the textiles and polymer industries. BSEF will work with the textile and plastic industries to determine measurable goals, together with an achievable and concrete timeline. Industry, together with Regulators, expects to define and agree future targets as well as a time schedule for emission reduction. Independent monitoring of the results of the measures to reduce emissions will be done during the implementation and execution process.
Final draft R013_0405_env
7
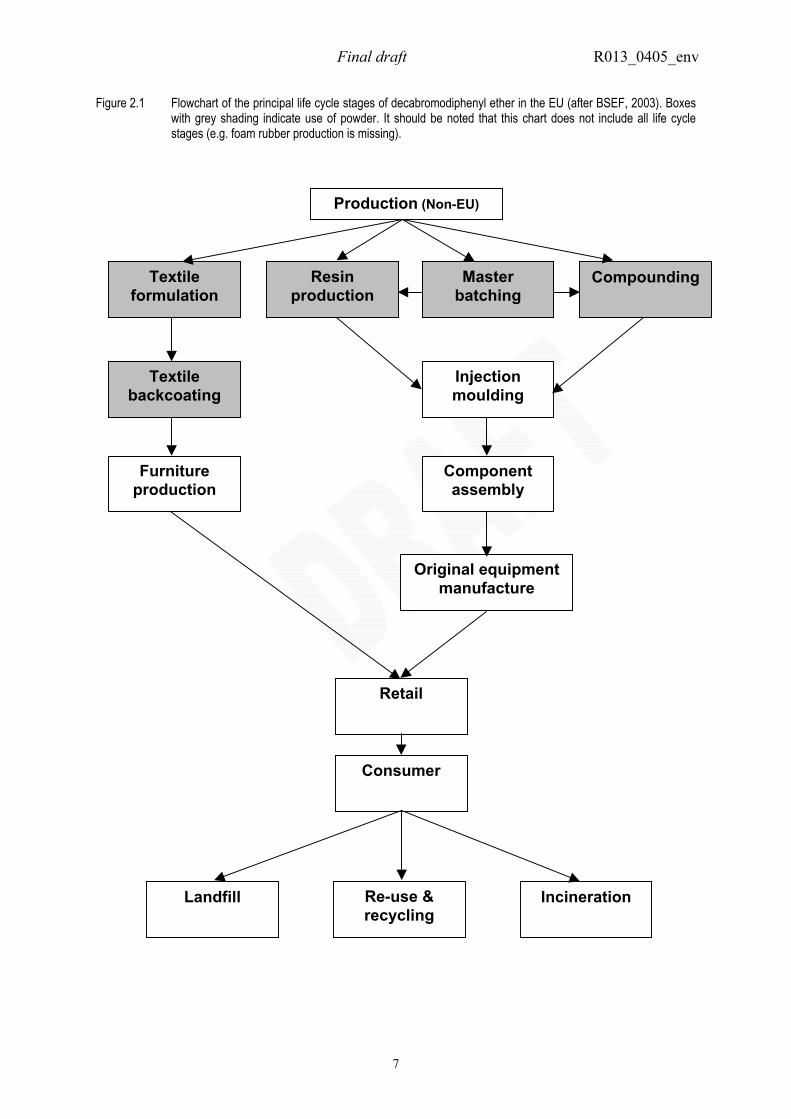
Figure 2.1 Flowchart of the principal life cycle stages of decabromodiphenyl ether in the EU (after BSEF, 2003). Boxes with grey shading indicate use of powder. It should be noted that this chart does not include all life cycle stages (e.g. foam rubber production is missing).
Production (Non-EU)
Textile formulation
Resin production
Master batching
Compounding
Textile backcoating
Injection moulding
Furniture production
Component assembly
Original equipment manufacture
Retail
Consumer
Re-use & recycling
Landfill Incineration
Final draft R013_0405_env
8
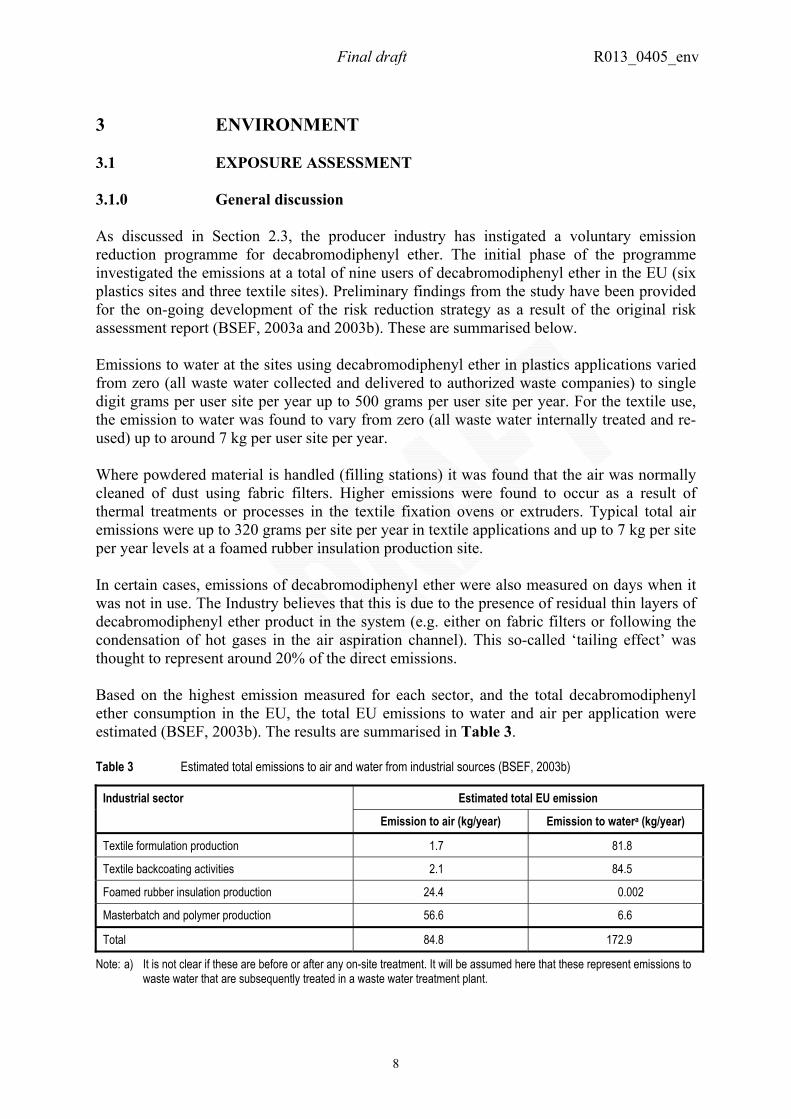
3 ENVIRONMENT 3.1 EXPOSURE ASSESSMENT 3.1.0 General discussion As discussed in Section 2.3, the producer industry has instigated a voluntary emission reduction programme for decabromodiphenyl ether. The initial phase of the programme investigated the emissions at a total of nine users of decabromodiphenyl ether in the EU (six plastics sites and three textile sites). Preliminary findings from the study have been provided for the on-going development of the risk reduction strategy as a result of the original risk assessment report (BSEF, 2003a and 2003b). These are summarised below. Emissions to water at the sites using decabromodiphenyl ether in plastics applications varied from zero (all waste water collected and delivered to authorized waste companies) to single digit grams per user site per year up to 500 grams per user site per year. For the textile use, the emission to water was found to vary from zero (all waste water internally treated and re-used) up to around 7 kg per user site per year. Where powdered material is handled (filling stations) it was found that the air was normally cleaned of dust using fabric filters. Higher emissions were found to occur as a result of thermal treatments or processes in the textile fixation ovens or extruders. Typical total air emissions were up to 320 grams per site per year in textile applications and up to 7 kg per site per year levels at a foamed rubber insulation production site. In certain cases, emissions of decabromodiphenyl ether were also measured on days when it was not in use. The Industry believes that this is due to the presence of residual thin layers of decabromodiphenyl ether product in the system (e.g. either on fabric filters or following the condensation of hot gases in the air aspiration channel). This so-called ‘tailing effect’ was thought to represent around 20% of the direct emissions. Based on the highest emission measured for each sector, and the total decabromodiphenyl ether consumption in the EU, the total EU emissions to water and air per application were estimated (BSEF, 2003b). The results are summarised in Table 3. Table 3 Estimated total emissions to air and water from industrial sources (BSEF, 2003b)
Estimated total EU emission Industrial sector
Emission to air (kg/year) Emission to watera (kg/year)
Textile formulation production 1.7 81.8
Textile backcoating activities 2.1 84.5
Foamed rubber insulation production 24.4 0.002
Masterbatch and polymer production 56.6 6.6
Total 84.8 172.9
Note: a) It is not clear if these are before or after any on-site treatment. It will be assumed here that these represent emissions to waste water that are subsequently treated in a waste water treatment plant.
Final draft R013_0405_env
9
3.1.0.1 Release from production No production of decabromodiphenyl ether currently occurs in the EU and no new release information has become available. The following release estimates were presented in the original risk assessment for (a) a generic worst case (default) site and (b) an actual former production site (site specific). These emissions will be considered in this updated assessment.
Generic production site (default) 0.5 tonnes/year to waste water over 100 days Former production site (site-specific) <0.8 kg/year in plant effluent over 17 days
3.1.0.2 Emissions from use in polymer applications 3.1.0.2.1 Release at a polymer processing site Summary of original risk assessment report The following release estimates were presented in the original risk assessment based on generic worst case assumptions. Polymer compounding and conversion site 51 kg/year to air over 268 days (local emissions) 51 kg/year to waste water over 268 days
Region emissions 340 kg/year to air 340 kg/year to waste water Continental emissions 3,060 kg/year to air 3,060 kg/year to waste water
Updated information BSEF (2003b) have recently generated exposure data at polymer processing sites (masterbatch and polymer production sites and foamed rubber insulation production sites). The measured emissions from representative sites are summarised below and these data will be considered in this revised assessment. Local emissions: polymer processing emissions to air not given
up to 0.5 kg/year to waste water Local emissions: foamed rubber up to 7 kg/year to air
insulation production emissions to waste water not given Total EU emission: polymer processing 56.6 kg/year to air 6.6 kg/year to waste water Total EU emission: foamed rubber 24.4 kg/year to air insulation production 0.002 kg/year to water Based on these data, the total EU emissions to air and waste water can be estimated as 81.0 and 6.6 kg/year respectively. Taking the regional emissions to be 10% of the total EU emissions, the following regional and continental emissions can be derived from these data.
Final draft R013_0405_env
10
Regional emission 8.1 kg/year to air 0.66 kg/year to waste water Continental emission 72.9 kg/year to air
5.9 kg/year to waste water For the local emissions, the BSEF (2003b) data set provided was incomplete as the emissions to air from a polymer production site were not given and the emission to water from a foamed rubber insulation production site was not given (although it can be inferred that these latter emissions would be small given the total regional emission estimated for this source). Therefore, in order to carry out a worst case assessment for a polymer processing site it will be assumed that the maximum emission to air from a polymer processing site will be 7 kg/year. Therefore the following local emissions from a polymer processing site will be assumed in the assessment. Polymer processing site 0.5 kg/year to waste water (assumed to be over 268
days as before) 7 kg/year to air (assumed to be over 268 days as before) 3.1.1.1.1 Release during service life of polymer products Summary of original risk assessment report The following emission factors were considered in the original risk assessment report. Volatile loss from polymer products 0.038% per year to air Leaching loss from polymer product considered to be small ‘Waste remaining in the environment4’ 2% over lifetime for outdoor applications 0% over lifetime for indoor applications 2% at disposal (all applications) Loss from landfills (leaching loss) considered to be small The emissions of ‘waste remaining in the environment’ were assumed to be released to industrial/urban soil (75%), air (0.1%) and surface water (24.9%). The emission factors, and the approach used, were considered to be highly uncertain and conservative. The following regional and continental emissions were estimated using this approach.
4 Waste remaining in the environment is considered to be small particles of polymer product, or dust generated from polymer products, that contain decabromodiphenyl ether. These particles are assumed to be released primarily to the industrial/urban soil compartment, but may also end up in sediment (if released to surface water) or air. End-products with outdoor uses are most likely to be sources of this waste, where release can occur over the lifetime of the product as a result of weathering and wear, etc. This type of waste can also be generated during the disposal of all types of plastic products, particularly where articles are dismantled or subject to other mechanical processes.
Final draft R013_0405_env
11
Regional emission 2,550 kg/year to air as vapour 13-15 kg/year to air as dust
3,330-3,680 kg/year to surface water 10,000-11,100 kg/year to industrial/ urban soil
Continental emission 22,950 kg/year to air as vapour 117-133 kg/year to air as dust 30,000-33,100 kg/year to surface water
90,400-99,800 kg/year to industrial/ urban soil
Updated information Volatile loss from products in use Kemmlein et al. (2003) determined the volatile emissions of polybrominated diphenyl ethers (including decabromodiphenyl ether) from a variety of products. The tests were carried out using 0.02 m3 and 1 m3 emission test chambers, and in some cases 1 litre cells, and were generally carried out for around 100 days at 23oC and 50% relative humidity. The air flow rates used in the experiment were 1 m3/hour in the 1 m3 chamber, 0.128 m3/hour in the 0.02 m3 chamber and 0.022 m3/hour in the 1 litre cells, giving 1, 5.6 and 22 air exchanges per hour in the three chamber types respectively. The emissions of polybrominated diphenyl ethers from two personal computers (PCs, both including the PC base unit and monitor, and one also including a printer) were determined using the 1 m3 test chamber. In addition, the emissions of polybrominated diphenyl ethers from a toner cartridge (experiment carried out at 40oC) and an old TV housing, a PC circuit board and casing (experiment carried out at both 23oC and 60oC) were determined using the 0.02 m3 test chamber. Finally the emissions of polybrominated diphenyl ethers from a sample of furniture upholstery, consisting of upholstery foam and cover, were determined using the 1 litre cell. A further experiment was carried out to investigate the emissions of decabromodiphenyl ether specifically from a sample of synthetic rubber using the 0.02 m3 test chamber. The emission rates for volatile loss of decabromodiphenyl ether were generally too low to be determined by the method used in most experiments. However, a specific emission rate for decabromodiphenyl ether of 0.28 ng/m2/hour was determined in the experiment with the TV casing. These new data on volatile emissions during use of electrical and electronic equipment indicate that the emissions of decabromodiphenyl ether are low, but not necessarily zero. For example if the emission figure of 0.28 ng/m2/hour is considered, the following estimates of total volatile losses of decabromodiphenyl ether can be estimated using a number of assumptions: • The total amount of decabromodiphenyl ether present in electrical and electronic
equipment is around 7,100 tonnes/year (5,800 tonnes/year used in the EU plus a further 1,300 tonnes/year imported in finished or partly finished articles; see Section 2.2.2).
• If it is assumed that the typical concentration of decabromodiphenyl ether in flame
retarded plastic is 10-15% (taken from original risk assessment report), the total
Final draft R013_0405_env
12
amount of plastics containing decabromodiphenyl ether used in new electrical and electronic equipment each year in the EU would be around 47,333-71,000 tonnes/year. It also needs to be considered here that finished articles containing decabromodiphenyl ether will have a lifetime typically >1 year and so the amount of plastic containing decabromodiphenyl ether in actual use at any one time will be higher than indicated by this figure. Assuming that a typical lifetime of an article containing decabromodiphenyl ether would be of the order of up to ten years, the total amount of plastic containing decabromodiphenyl ether present in articles could be up to around 473,330-710,000 tonnes in any one year.
• Finally, assuming that the plastic has a density of around 0.8 g/cm3 (800 kg/m3)
and that the plastic used in finished electrical goods has a typical thickness of around 2-5 mm (2×10⁻³-5×10⁻³ m) the total surface area of plastic containing decabromodiphenyl ether can very roughly be estimated as 1.18×10⁸-4.44×10⁸ m2 in any one year.
Using these estimated surface areas and the emission factor of 0.28 ng/m2/hour, the total volatile emissions in the EU from plastic articles can be very roughly estimated as 0.033-0.12 g/hour or 0.29-1.05 kg/year. Assuming 10% of these emissions occur in a region, the following regional and continental emissions can be estimated from this source. Regional emission 0.029-0.11 kg/year to air Continental emission 0.26-0.95 kg/year to air These values will be considered in the updated risk assessment for illustrative purposes. It should be noted that the estimate is based on relatively few experimental data (the general applicability of which is unclear) and a number of assumptions. Particulate losses (‘waste remaining in the environment’) from products in use No new information is available on the emissions of particulates containing decabromodiphenyl ether from products in use. In the original risk assessment the following assumptions were used.
• Only outdoor applications are considered to contribute significantly to this type of emission as a result of weathering, etc., over the products’ lifetime.
• It is estimated that <0.1% of the total use of plastics containing decabromodiphenyl ether would be in outdoor applications.
• The total emission over the lifetime of the product would be a maximum of 2%. It is recognised that there is a large uncertainty associated with this figure.
• The emissions are likely to be mainly to soil, with smaller amounts going to surface water (and hence sediment) and air. In the absence of any further information it will be assumed that the emissions will be split 75% to soil, 24.9% to surface water and 0.1% to air.
Using these assumptions, along with the total amount of decabromodiphenyl ether present in new articles in the EU each year (7,100 tonnes/year), the total amount of ‘waste remaining in the environment’ can be estimated as 142 kg/year. Assuming 10% of this occurs in a region, the following regional and continental emissions can be estimated.
Final draft R013_0405_env
13
Regional emission 0.014 kg/year to air 3.5 kg/year to surface water
10.6 kg/year to industrial/urban soil Continental emission 0.13 kg/year to air 31.8 kg/year to surface water 95.9 kg/year to industrial/urban soil These figures will be considered in the updated risk assessment. It is recognised that there is considerable uncertainty in the emission estimates obtained. Particulate losses (‘waste remaining in the environment’) during recycling of electronic equipment and ultimate disposal Voorspoels et al. (2003) report that currently around 88% of the plastics containing brominated flame retardants end up in landfill, with 10% being incinerated and less than 3% being recycled. As can be seen from the data reported by Voorspoels et al. (2003) recycling of plastics containing flame retardants is not routinely carried out in the EU. This is likely to change in the future, owing to the initiatives such as the WEEE Directive. As the remelting and reshaping of thermoplastics is in principle similar to their production, then the emissions of decabromodiphenyl from this stage of the recycling process will in principle be similar to those during the polymer processing stage identified in Section 3.1.0.2.1. The other aspect of recycling where emissions could occur is in the collection, separation and shredding/regrinding of plastics present in waste electrical and electronic equipment. Decabromodiphenyl ether has been measured in the air (see Section 3.1.3.2 and original risk assessment report) and in the blood of workers (see Section 0 and original risk assessment report) at such facilities. A study of the mass-flow of polybrominated diphenyl ethers (the congeners included were not specified) in an electronic equipment recycling facility in Japan has been studied (Tamade et al., 2002). The facility was built in 2000 and had a maximum throughput of 75 tonnes over ten and a half hours. The recycling facility had an adjoining incineration plant with a capacity of 150 tonnes per 24 hours. The incineration plant burned residues and refuse derived fuel (RDF) from the recycling facility, and was also using the exhaust from the recycling facility as its combustion air. As part of the study, the concentration of polybrominated diphenyl ethers present in TV back covers, dust collected from inside the TVs and dust from the air conditioning units within the recycling facility were determined. The mean level of polybrominated diphenyl ethers present in the back covers of TVs was 68 g/kg; the mean level found in dust from inside the TVs was 320 mg/kg; and the mean level in dust from the air conditioning unit was 4.2 mg/kg. The amount of polybrominated diphenyl ethers present in the TV back casing and dust from inside the TVs was found to be reasonably constant with age of the TV (the mean level found in the back casing was 36 g/kg, 91 g/kg and 77 g/kg in TVs from the second half of the 1980s, first half of the 1990s and second half of the 1990s respectively; the corresponding levels in dust from inside the TVs was 200 mg/kg, 160 mg/kg and 230 mg/kg respectively).
Final draft R013_0405_env
14
The mass balance determined during the recycling process indicated the exhaust from the light plastics and molder units contained higher amounts of brominated diphenyl ethers than the exhaust from the rough crusher and fine crusher. The total polybrominated diphenyl ether input into the facility was estimated to be 21 kg/hour and the total present in exhausts from the various units in the facility was around 40.8 mg/hour (fed to the incinerator) plus around 0.058 mg/hour fed direct to the atmosphere. The mass balance also showed that the amount of polybrominated diphenyl ether leaving the incinerator (as bottom ash, flue gas and fly ash) was around 1/80 to 1/600th of that entering the incinerator. In summary, the total air emission of polybrominated diphenyl ethers from this plant was around 40.9 mg/hour (327.2 mg/day assuming an eight-hour day or 0.098 kg/year assuming 300 eight-hour days/year) prior to incineration. The total emission (to air, in bottom ash, in flue gas and in fly ash) was around 0.068-0.51 mg/hour (0.54-4.1 mg/day assuming an eight-hour day or 1.6×10⁻⁴-1.2×10⁻³ kg/year assuming 300 eight-hour days/year) after passing through the incinerator. These data will be considered later to estimate the local PECs in air and soil (through atmospheric deposition) from such a plant, assuming that decabromodiphenyl ether is the predominant polybrominated diphenyl ether congener present in the samples. It is also possible to estimate the total regional and continental emissions from these processes if the following (large number of) assumptions are made. As the total polybrominated diphenyl ether (assumed to be mainly decabromodiphenyl ether for the purposes of this calculation) input into the recycling plant at the time of the measurements was around 21 kg/hour, it is possible to estimate an emission factor of 1.9 mg/kg for a plant without incineration and up to 0.024 mg/kg for a plant with incineration. At present the total amount of plastic containing decabromodiphenyl ether recycled in the EU is unknown but is expected to be small. However, the WEEE Directive (see Section 2.3) sets a recycling target of around 65% for information technology and communications equipment and so it is possible that larger amounts of plastic containing decabromodiphenyl ether could be recycled in the future. It should be noted that ‘recycling’ in the WEEE Directive covers re-use and other recycling options as well as recycling in the sense being discussed here (i.e. collection, separation and shredding/regrinding (with subsequent remelting and reshaping)). In order to obtain an ‘order of magnitude’ estimate of the possible future emissions of decabromodiphenyl ether from this source, the following assumptions and calculations have been made: • The quantity of articles/products containing decabromodiphenyl ether disposed of or
recycled each year is equal to the quantity of new articles/products containing decabromodiphenyl ether produced or imported each year. This would give an estimate of 7,100 tonnes/year for decabromodiphenyl ether in plastic products.
• The recycling rate is around 65%. This would mean that up to around 4,615 tonnes/year of decabromodiphenyl ether present in articles could be subject to recycling.
Using the figure of 4,615 tonnes/year as the estimate for the amount of decabromodiphenyl ether that may be subject to recycling in the future, the total emission (mainly to air) from recycling plants could be estimated as 0.11-8.8 kg/year using the emission factors derived above. Assuming that 10% of these emissions occur in a region, the following regional and continental releases can be estimated.
Final draft R013_0405_env
15
Regional release 0.011-0.88 kg/year to air Continental release 0.099-7.9 kg/year to air It should be noted that the representivity of these data in relation to the current situation in the EU is unknown and so the actual emissions and PECs calculated from these data should be treated as indicative only. It should also be noted that, as the emissions are likely to be particulate in nature, there may be a potential for dusts to settle in the facility and be subsequently washed into the waste water stream. It is not currently possible to estimate the significance of this source. Other information Sinkkonen et al. (2003a) investigated the behaviour of decabromodiphenyl ether during recycled aluminium production. An earlier screening study (Sinkkonen et al., 2003b) had indicated that polybrominated diphenyl ethers were present in samples of scrap materials used in recycled aluminium smelters. The samples included plastics used in electronic equipment, filter dust from an electronics crusher, cyclone dust from an electronics crusher and light fluff from a car chopper. The levels of polybrominated diphenyl ethers found in the scrap were 0.25-67.5 mg/kg dry weight, and the major congeners found were decabromodiphenyl ether and pentabromodiphenyl ether. Sinkkonen et al. (2003a) analysed the levels of decabromodiphenyl ether present in the ash from a recycled aluminium smelter in Finland. The smelter used shredded mixed metal scrap (from old cars and electronic equipment, etc.) and, in all, four ash samples from various parts of the process were analysed (collected from the respective flue gas filter units). The concentrations of decabromodiphenyl ether were generally low, with the highest concentration being found in the induction furnace ash (around 5 µg/kg). Little or no decabromodiphenyl ether was found in the other ash samples analysed. The authors conclude that decabromodiphenyl ether was significantly degraded during the aluminium smelting process. Hamm et al. (2001) have investigated the potential for formation of polybrominated dibenzofurans and dibenzo-p-dioxins from the repeated reprocessing of samples of high impact polystyrene containing decabromodiphenyl ether. The decabromodiphenyl ether (along with antimony trioxide) was incorporated into the plastic by extrusion. The plastic was then further processed by injection moulding and the amounts of polybrominated dibenzofurans and dibenzo-p-dioxins in the sample were determined. Subsequently the sample was ground and injection moulded four times and the amounts of brominated dibenzofurans and dibenzo-p-dioxins were re-determined. In all cases the levels found were at least one order of magnitude below the regulated limit in the German Chemicals Banning Ordinance. 3.1.0.3 Emissions from use in textiles 3.1.0.3.1 Formulation and back coating of textiles Summary of original risk assessment report The following emission estimates were assumed in the original risk assessment report. Local emission – formulation site 600 kg/year to waste water over 300 days - back coating site 300 kg/year to waste water over 300 days
Final draft R013_0405_env
16
Regional emission - formulation 600 kg/year to waste water - backcoating 300 kg/year to waste water Continental emission - formulation 900 kg/year to waste water - backcoating 900 kg/year to waste water Updated information BSEF (2003b) have recently generated exposure data at formulation and backcoating sites that use decabromodiphenyl ether. The measured emissions from representative sites are summarised below and these data will be considered in the revised assessment. Local emission up to 0.32 kg/year to air
up to 7 kg/year to waste water Total EU emission: formulation 1.7 kg/year to air 81.8 kg/year to waste water Total EU emission: backcoating 2.1 kg/year to air 84.5 kg/year to waste water Based on these data, the total EU emissions to air and waste water can be estimated as 3.7 and 166 kg/year respectively. Taking the regional emissions to be 10% of the total EU emissions, the following regional and continental emissions can be derived from these data. Regional emission: formulation 0.17 kg/year to air 8.2 kg/year to waste water Regional emission: backcoating 0.21 kg/year to air 8.5 kg/year to waste water Continental emission: formulation 1.5 kg/year to air 73.6 kg/year to waste water Continental emission: backcoating 1.9 kg/year to air 76.1 kg/year to waste water It is not clear from the preliminary data presented in BSEF (2003b): a) if the local (site) data refer to a formulation or a backcoating site, or b) whether the air and water emissions refer to the same site. As only the maximum emission data were reported on a site basis (and as the total EU emission estimates from the two sources are similar), it will be assumed here that these emissions represent the upper limit of the emissions measured at both a formulation and backcoating site. The local emissions that will be used in this updated assessment are summarised below.
Final draft R013_0405_env
17
Local emission: formulation 0.32 kg/year to air (assumed to be over 300 days as before)
7 kg/year to waste water (assumed to be over 300 days as before)
Local emission: backcoating 0.32 kg/year to air (assumed to be over 300 days
as before) 7 kg/year to waste water (assumed to be over 300
days as before) 3.1.0.3.2 Release during service life of textiles Summary of original risk assessment report The following emission figures were assumed in the original risk assessment report. Washing of textiles 3% per year to waste water ‘Waste remaining in the environment4’ 0% over lifetime for indoor applications 2% at disposal (all applications) Loss from landfills (leaching loss) considered to be small The emissions of ‘waste remaining in the environment’ were assumed to be released to industrial/urban soil (75%), air (0.1%) and surface water (24.9%). The following regional and continental emissions were estimated using this approach.
Regional emission 5.6 kg/year to air as dust up to 120,000 kg/year to waste water 1,390 kg/year to surface water
4,200 kg/year to industrial/ urban soil Continental emission 15.4 kg/year to air as dust up to 330,000 kg/year to waste water 3,840 kg/year to surface water
11,500 kg/year to industrial/ urban soil Updated information Leaching loss from products in use A recent unpublished preliminary study (Texconsul, 2003b) has been carried out to investigate the potential loss of decabromodiphenyl ether from a cotton fabric and a 100% polyester fabric, both backcoated with a flame retardant treatment containing decabromodiphenyl ether. The sample was subject to a soak test, then given three washes at 40oC followed by twelve washes at 40oC. The washes were carried out using a washing machine under standard laboratory conditions. The concentration of antimony trioxide, bromine and decabromodiphenyl ether present in the sample was found to remain essentially constant during the washing procedure for both fabrics (for example the decabromodiphenyl ether content of the cotton fabric was determined to be 10.4% in the original sample, 10.9% after the soak test, 9.8% after three machine washes at 40oC and 10.6% after twelve machine
Final draft R013_0405_env
18
washes at 40oC; similarly the decabromodiphenyl ether content of the polyester fabric was 15.7% in the original sample and 16.1% after twelve washes). Furthermore, it has been indicated that the majority of textiles treated with decabromodiphenyl ether for domestic applications is used in ‘fixed upholstery’ (i.e. it is nailed/stapled onto the furniture and is not intended to ever be removed and therefore washed) and so is never subject to washing (TFA, 2003). Any flame retarded textiles that are subject to washing have to be clearly labelled as being suitable for washing and have to have undergone tests to ensure their durability during washing. A figure of around 2% has been suggested as a reasonable estimate of the percentage of the current textiles that contain decabromodiphenyl ether that may be subject to washing during use. On this basis, the potential for leaching from textile washing appears to be much lower than assumed in the original risk assessment. However, the new preliminary data on losses from textiles during washing are not precise enough to show that the leaching loss is zero (i.e. the results are given to the nearest 0.1% based on the decabromodiphenyl ether content of the fabric; as the starting content was around 10-16%, a change of 0.1% would be equivalent to a 0.6-1% loss based on the amount of decabromodiphenyl ether – this is probably the minimum loss rate that could be determined using the method employed). There are no reliable data available with which to estimate the leaching loss rate of decabromodiphenyl ether from textiles. In the absence of such information and to recognise that
a) the leaching loss from textiles appears to be much lower than previously assumed, and
b) the fraction of textiles subject to washing is now much lower than previously assumed,
a possible leaching loss of 0.05% over the lifetime of the textile will be assumed. This figure is the suggested default figure from the Use Category Document on plastics additives (UCD, 1998). This information has been generated based on data for the losses of a phthalate plasticiser such as di(ethylhexyl)phthalate (DEHP) during regular washing of PVC flooring. Since leaching losses are likely to depend to some extent on the water solubility, the difference in solubility between DEHP (recommended value from draft DEHP ESR risk assessment report 3 µg/l) and decabromodiphenyl ether (≤ 0.1 µg/l) needs to be considered. Thus, based on these water solubilities, the potential for leaching of decabromodiphenyl ether appears to be lower than that determined for DEHP. It is recognised that the data generated from washing floors is difficult to extrapolate to textile washing and so any emission estimates obtained using these data are uncertain. The current amount of decabromodiphenyl ether used in textile applications in the EU is around 2,500 tonnes/year. Assuming that 2% of this is used in textiles subject to washing, and that the total loss of decabromodiphenyl ether during washing is 0.05% over the lifetime of the product, the total EU release of decabromodiphenyl ether can be estimated to be 25 kg/year. There is considerable uncertainty in this estimated figure. As discussed in the original risk assessment report, the use of flame retarded textiles in the EU is not evenly distributed throughout the EU owing to the differing fire safety regulations - particularly for domestic upholstery - in various countries. In order to take this distribution into account, it will be assumed that around 25% of these releases occur in a region (this is approximately the same distribution that was assumed in the original risk assessment).
Final draft R013_0405_env
19
Therefore the regional and continental releases from leaching from textiles can be estimated as follows. Regional release 6.3 kg/year to waste water Continental release 18.8 kg/year to waste water Particulate losses (‘waste remaining in the environment’) from products in use Another possibly important source of release from textile use may arise from particulate losses from the backcoating (i.e. small particles/dust of the backcoating that contain decabromodiphenyl ether) during the lifetime of the textile. There is no new information available with which to estimate such losses. These losses were assumed to be accounted for in the leaching losses estimated in the original risk assessment report. A study to investigate the particulate losses of decabromodiphenyl ether from textiles during use is currently on-going (Stevens et al., 2004). The final report is expected to be completed by Spring 2004. Particulate losses (‘waste remaining in the environment’) from disposal No new information is available on the possible losses that may occur during disposal of textiles containing decabromodiphenyl ether. In the original risk assessment report a loss figure of 2% was assumed, and the releases were thought to go to urban/industrial soil (75%), surface water (24.9%) and air (0.1%). Using these assumptions with the current usage figure for decabromodiphenyl ether in textiles (2,500 tonnes/year), gives a total EU emission of 50 tonnes/year (this assumes that the amount of textiles disposed of each year is equivalent to the amount of new textiles produced each year). Assuming that 25% of this release occurs in a region (see above) the total regional and continental releases from this source can be estimated as follows.
Regional emission 12.5 kg/year to air as dust 3,110 kg/year to surface water
9,375 kg/year to industrial/urban soil Continental emission 37.5 kg/year to air as dust 9,340 kg/year to surface water
28,125 kg/year to industrial/urban soil
It should be noted that there is a very large uncertainty in these estimates. 3.1.0.3.3 Other possible sources A recent study by Farrar et al. (2004) found that the levels of several polybrominated diphenyl ether congeners in suburban air from the United Kingdom were elevated on Bonfire Night (November 5th, when a large number of outdoor fires are traditionally lit across the country). The authors hypothesised that the uncontrolled burning of products containing polybrominated diphenyl ethers, for example furniture, on private bonfires was responsible for the increased levels in the air. The study, however, did not investigate the levels of decabromodiphenyl ether in the air.
Final draft R013_0405_env
20
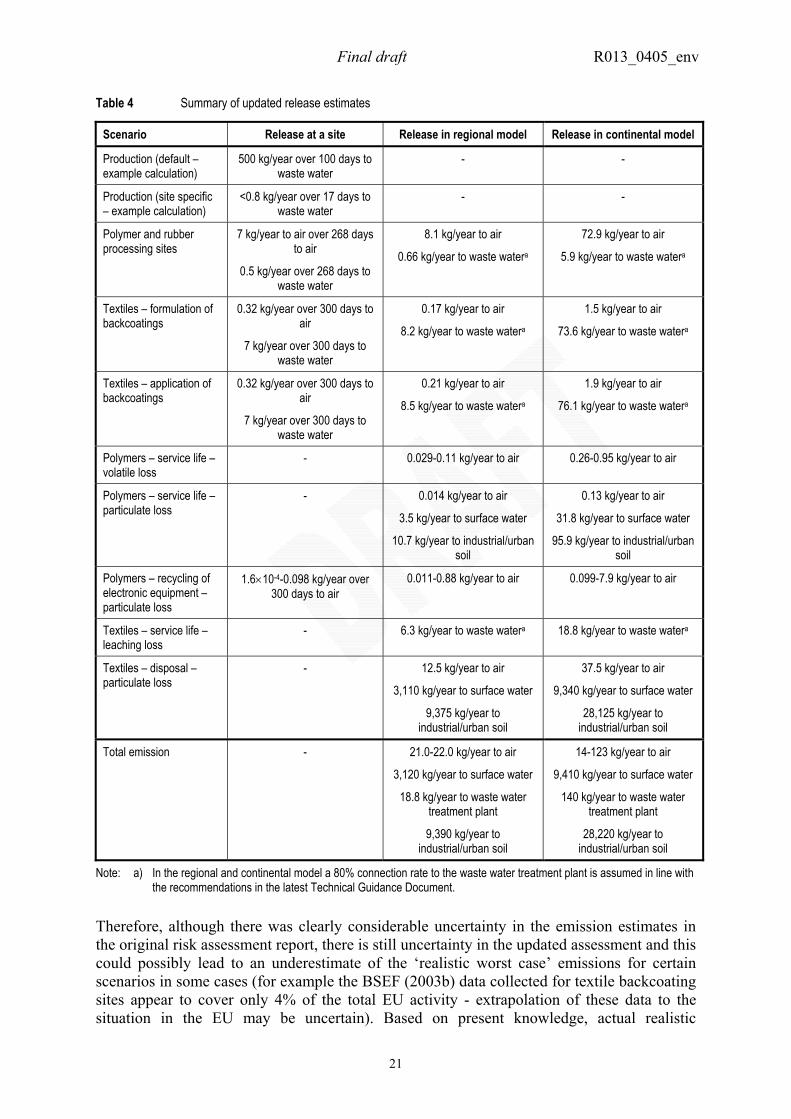
3.1.0.4 Summary of release estimates 3.1.0.4.1 Summary from original risk assessment The total emission of decabromodiphenyl ether estimated in the original report is summarised below. Regional model (tonnes/year) Continental model (tonnes/year) 2.9 to air as dust/vapour 26.2 to air as dust/vapour 84.9 to waste water treatment plant 234.4 to waste water treatment plant 41.1-41.4 direct to surface water 134-137 direct to surface water 14.2-15.3 to industrial/urban soil 102-111 to industrial/urban soil 940 to landfill/incineration 6,740-6,750 to landfill/incineration The original assessment assumed a 70% connection rate to waste water treatment plants at the regional and continental levels (in line with the recommendations given in the version of the Technical Guidance Document available at that time), and this was accounted for in the above figures. 3.1.0.4.2 Summary of updated release estimates The updated release estimates are summarised in Table 4. Palm (2001) estimated emission factors for decabromodiphenyl ether for the population of Stockholm to be around 53.3 mg/person/year to air, 2.3 mg/person/year to water and 9.8 mg/person/year to soil. Similar values of 5.8-46.1 mg/person/year to air, 0.14-2.0 mg/person/year to water and 0.86-8.6 mg/person/year to soil were given in Palm et al. (2002). These values were extrapolated from a study undertaken in Denmark using a substance-flow analysis to estimate the emissions of total brominated flame retardants in the Danish environment. Assuming a population of 20 million in a region (Technical Guidance default), the estimated regional emission using these factors would be up to 1,070 kg/year to air, 46.2 kg/year to water and 196 kg/year to soil. These emission factors thus lead to a higher release to air but lower release to water and soil than estimated in Table 4. It should be noted that the release estimates used in the original risk assessment were probably very conservative. However, the actual releases were not critical to the risk assessment as the PEC/PNEC approach did not indicate a risk using these conservative estimates. Since the original risk assessment was published, a considerable body of new data has become available on the emissions of decabromodiphenyl ether to the environment, and this has been considered in the updated assessment. These data show that the emissions to the environment are lower than assumed in the original risk assessment. However, it should be noted that much of these new data are preliminary and their validity, in terms of the representativeness to the overall situation in Europe has not yet been fully assessed.
Final draft R013_0405_env
21
Table 4 Summary of updated release estimates
Scenario Release at a site Release in regional model Release in continental model
Production (default – example calculation)
500 kg/year over 100 days to waste water
- -
Production (site specific – example calculation)
<0.8 kg/year over 17 days to waste water
- -
Polymer and rubber processing sites
7 kg/year to air over 268 days to air
0.5 kg/year over 268 days to waste water
8.1 kg/year to air
0.66 kg/year to waste watera
72.9 kg/year to air
5.9 kg/year to waste watera
Textiles – formulation of backcoatings
0.32 kg/year over 300 days to air
7 kg/year over 300 days to waste water
0.17 kg/year to air
8.2 kg/year to waste watera
1.5 kg/year to air
73.6 kg/year to waste watera
Textiles – application of backcoatings
0.32 kg/year over 300 days to air
7 kg/year over 300 days to waste water
0.21 kg/year to air
8.5 kg/year to waste watera
1.9 kg/year to air
76.1 kg/year to waste watera
Polymers – service life – volatile loss
- 0.029-0.11 kg/year to air 0.26-0.95 kg/year to air
Polymers – service life – particulate loss
- 0.014 kg/year to air
3.5 kg/year to surface water
10.7 kg/year to industrial/urban soil
0.13 kg/year to air
31.8 kg/year to surface water
95.9 kg/year to industrial/urban soil
Polymers – recycling of electronic equipment – particulate loss
1.6×10⁻⁴-0.098 kg/year over 300 days to air
0.011-0.88 kg/year to air 0.099-7.9 kg/year to air
Textiles – service life – leaching loss
- 6.3 kg/year to waste watera 18.8 kg/year to waste watera
Textiles – disposal – particulate loss
- 12.5 kg/year to air
3,110 kg/year to surface water
9,375 kg/year to industrial/urban soil
37.5 kg/year to air
9,340 kg/year to surface water
28,125 kg/year to industrial/urban soil
Total emission - 21.0-22.0 kg/year to air
3,120 kg/year to surface water
18.8 kg/year to waste water treatment plant
9,390 kg/year to industrial/urban soil
14-123 kg/year to air
9,410 kg/year to surface water
140 kg/year to waste water treatment plant
28,220 kg/year to industrial/urban soil
Note: a) In the regional and continental model a 80% connection rate to the waste water treatment plant is assumed in line with the recommendations in the latest Technical Guidance Document.
Therefore, although there was clearly considerable uncertainty in the emission estimates in the original risk assessment report, there is still uncertainty in the updated assessment and this could possibly lead to an underestimate of the ‘realistic worst case’ emissions for certain scenarios in some cases (for example the BSEF (2003b) data collected for textile backcoating sites appear to cover only 4% of the total EU activity - extrapolation of these data to the situation in the EU may be uncertain). Based on present knowledge, actual realistic
Final draft R013_0405_env
22
worst-case emissions for some scenarios are therefore likely to lie somewhere between those presented in this report and those in the original assessment. It is not currently possible to be more precise. However, this makes no difference to the risk characterisation, since the outcome of the PEC/PNEC comparison is in fact the same using both sets of figures. Perhaps the more important area of uncertainty concerns the relative significance of diffuse emissions arising from losses of the substance from flame-retarded products in use and at disposal. These emissions are very difficult to quantify, and are difficult to control. However, they can clearly occur. For example, decabromodiphenyl ether has been detected in sediments associated with effluents from waste dumps (see Section 3.1.1.2.2). It is also known to be present in indoor air and has been detected quite widely in household dust (see Section 3.1.3.2.2). It should also be noted that a number of studies show that decabromodiphenyl ether is present in sewage sludge from waste water treatment plants (see original risk assessment report and Section 3.1.2.2). Although it is not possible to determine the actual source of decabromodiphenyl ether in the samples (whether from washing of textiles, from plastics or from particulate losses from either of these), these findings imply that there is an urban source of decabromodiphenyl ether to waste water. 3.1.0.5 Degradation 3.1.0.5.1 Abiotic degradation Summary of original risk assessment Decabromodiphenyl ether was assumed to be hydrolytically stable in the environment. The half-life for atmospheric degradation by reaction with hydroxyl radicals was estimated to be 94 days. Decabromodiphenyl ether was shown to photodegrade under some conditions. For example, photolysis on solid surfaces had been demonstrated under laboratory conditions. Lower brominated diphenyl ether congeners had been identified among the degradation products from these studies (and some products remained unidentified). The available experimental evidence indicated that the lower brominated congeners, if formed, would most likely be only minor products, but the overall environmental degradation rate had not been determined and the environmental significance of this degradation pathway was uncertain. Updated information Further information has become available (Söderström, 2003; Söderström et al., 2003) on the photolysis studies of Sellström et al. (1998) and Tysklind et al. (2001) that were included in the original risk assessment report. These studies investigated the degradation of decabromodiphenyl ether using a variety of media (dissolved in toluene, or as a thin layer on silica gel, sand, soil or sediment). The solid matrix samples were prepared by adding a solution of decabromodiphenyl ether in toluene to the solid and then allowing the toluene to evaporate in the dark. The light sources used were either natural sunlight (sand, soil and sediment only: irradiation intensity at mid-day 2.3 mW/cm2) or four mercury UV-lamps fitted with filters to give a spectrum as close as possible to natural sunlight (irradiance intensity 1.6 mW/cm2). In the experiments, the irradiance from 24 hours sunlight corresponded to that of around 9 hours of artificial light. Experiments were performed in triplicate and each series consisted of blanks, dark controls and the samples. Sub-samples of the various matrices were placed in pyrex tubes and were irradiated for up to 244 hours (artificial light) or 96 hours
Final draft R013_0405_env
23
(natural light). The sediment samples were reconstituted with water before irradiation. The analysis of degradation products formed was carried out by gas chromatography-mass spectrometry using negative chemical ionisation and monitoring for the bromine ions formed (m/z -79 and -81). Sample extraction and preparation was carried out in the dark. The experiments carried out in toluene using artificial sunlight showed that degradation was occurring by reductive debromination. A build up and then decrease of firstly nona-, then octa-, then hepta- and then hexabromodiphenyl ether was seen as the experiment proceeded. The half-life for decabromodiphenyl ether was estimated to be less than 15 minutes under the conditions used. The experiments using the solid matrices also indicated that reductive debromination was occurring. A more detailed discussion of the products formed is given in Söderström (2003) and Söderström et al. (2003). The products formed in the different media were broadly comparable. Nona-, octa- and heptabromodiphenyl ethers were shown to be formed, along with lower brominated congeners (it was not always possible to identify the exact congeners formed owing to the lack of suitable reference material). Of the lower brominated congeners found commonly in the environment, 2,2’,4,4’5- and 2,2’4,4’,6-pentabromodiphenyl ether were found (in small amounts) only in the experiments with toluene and silica gel, 2,2’,4,4’,5,5’- hexabromodiphenyl ether was found in the experiments in toluene, sand (outdoor exposure) and possibly sediment and 2,2’4,4’,5,6’-hexabromodiphenyl ether was found in all exposures. The 2,2’,4,4’-tetrabromodiphenyl ether congener was only found to be formed in the experiments with the silica gel samples. The results were interpreted in terms of an initial stepwise debromination processes with the formation of lower brominated diphenyl ethers (nona- to hexabromodiphenyl ethers). Below hexabromodiphenyl ether the mass balance, based on the amounts of lower brominated congeners found, was low indicating that compounds other than brominated diphenyl ethers were being formed. The formation of polybrominated dibenzofurans was found to occur in some of the analysed samples. No tetra- or pentabromodibenzofurans were found in the experiments with silica gel, but tetra-, penta- and hexabromodibenzofurans were found in the sand and soil experiments. The absence of brominated dibenzofurans in the experiments using silica gel was explained by the authors in terms of a probable rapid further degradation of any such products formed under the optimal conditions used in this test compared with the conditions used in the more environmentally relevant sand and soil studies (KEMI, pers. com.). Thus from the results of these experiments, although it appears possible for reductive debromination to occur, the amounts of the lower brominated (e.g. tetra, penta-, or hexabromo-) diphenyl ethers formed will be very small. Furthermore, it would also be expected that the products formed would themselves undergo similar reductive debromination reactions. The half-life for decabromodiphenyl ether in the sand experiments was around 35-37 hours using natural sunlight (Sellström et al., 1998; Tysklind et al., 2001). The corresponding half-lives in sediment and soil were estimated to be 100 and 200 hours respectively (Tysklind et al., 2001) or 53 and 150-200 hours respectively (Söderström, 2003). Ohta (2001) studied the decomposition of decabromodiphenyl ether in organic solvents and organic solvent mixtures with water using various light sources (UV irradiation (254 nm), tungsten light and natural sunlight (the experiments were carried out in Japan in November)). The experiments were carried out using either 100 µg/ml of decabromodiphenyl ether dissolved in toluene or 100 µg/ml dissolved in a tolune:ethanol:water (1:3:6) mixture. Rapid decomposition of decabromodiphenyl ether was seen in the experiments in toluene with UV irradiation with complete degradation of decabromodiphenyl ether occurring within
Final draft R013_0405_env
24
40 minutes. Reductive debromination was shown to be occurring in this experiment but the lower brominated congeners formed also appeared to degrade (i.e. the amounts of the lower brominated congeners firstly increased but then decreased as the exposure continued). At the end of the 60-minute exposure period mono- to heptabromodiphenyl ether congeners were present (with only traces of octabromodiphenyl ether congeners). Decabromodiphenyl ether also degraded in toluene exposed to natural sunlight but here two heptabromodiphenyl ether congeners appeared to build up in the experiment. No details of the results of the other experiments were given. Olsman et al. (2002) investigated the photodegradation of decabromodiphenyl ether dissolved in toluene (initial concentration 2 mg/l). The solutions were exposed to artificial light (fluorescent tube) for four hours. Different filters were used in the various experiments to give radiation in the wavelength ranges 250-400 nm, 280-400 nm and 320-400 nm. The products from the irradations were tested for ‘dioxin-like’ activity in a 7-ethoxyresorufin-O-deethylase (EROD) induction bioassay. Lower brominated diphenyl ether congeners (no further information on the identity was given) were identified as degradation products in the experiments, and the photolysed solutions showed a ‘dioxin-like’ activity in the bioassay (the lower brominated diphenyl ether congeners were thought to have little or no activity in this assay). Peterman et al. (2003) investigated the photodegradation of 39 mono- to heptabrominated diphenyl ethers in lipid using natural sunlight (decabromodiphenyl ether was not studied in this experiment). The polybrominated diphenyl ethers were added as a solution in nonane to a thin layer of lipid (triolein, a triacylglycerol lipid) in polyethylene tubes (the tubes were 48 cm long by 2.5 cm deep by 0.1 mm thick and contained a total of 0.5 g of lipid). The contents of the tubes were mixed and the tube was then flattened and the ends sealed. The tubes were then exposed to natural sunlight (late summer, early afternoon) for either 2 minutes or 120 minutes. Dark controls were also run. The experiments showed that reductive debromination occurred to form lower brominated congeners. The photodegradation was most rapid with the higher brominated congeners, particularly those congeners containing at least one fully brominated aromatic ring. The rate of degradation was found to slow with decreasing number of bromine atoms/molecule and no significant net degradation of mono- to tribrominated diphenyl ethers was seen under the conditions used in this study. A further in-depth investigation of the photodegradation of decabromodiphenyl ether has been undertaken by Palm et al. (2003). The aim of the work was to try to address some of the uncertainties highlighted in the original EU risk assessment report for decabromodiphenyl ether, and was sponsored by the producer companies. The results of some of these experiments are also reported in da Rosa et al. (2003). The first series of experiments determined the UV spectrum of decabromodiphenyl ether in toluene, dichloromethane, tetrahydrofuran (THF), methanol and ethanol. The spectrum obtained was similar in all solvents used and showed a weak absorption band above 290 nm which is in the range of the solar spectrum at ground level. The spectrum of decabromodiphenyl ether in THF was also compared with those of other brominated diphenyl ethers. The wavelength of the absorption maxima found at wavelengths above 250 nm are shown in Table 5.
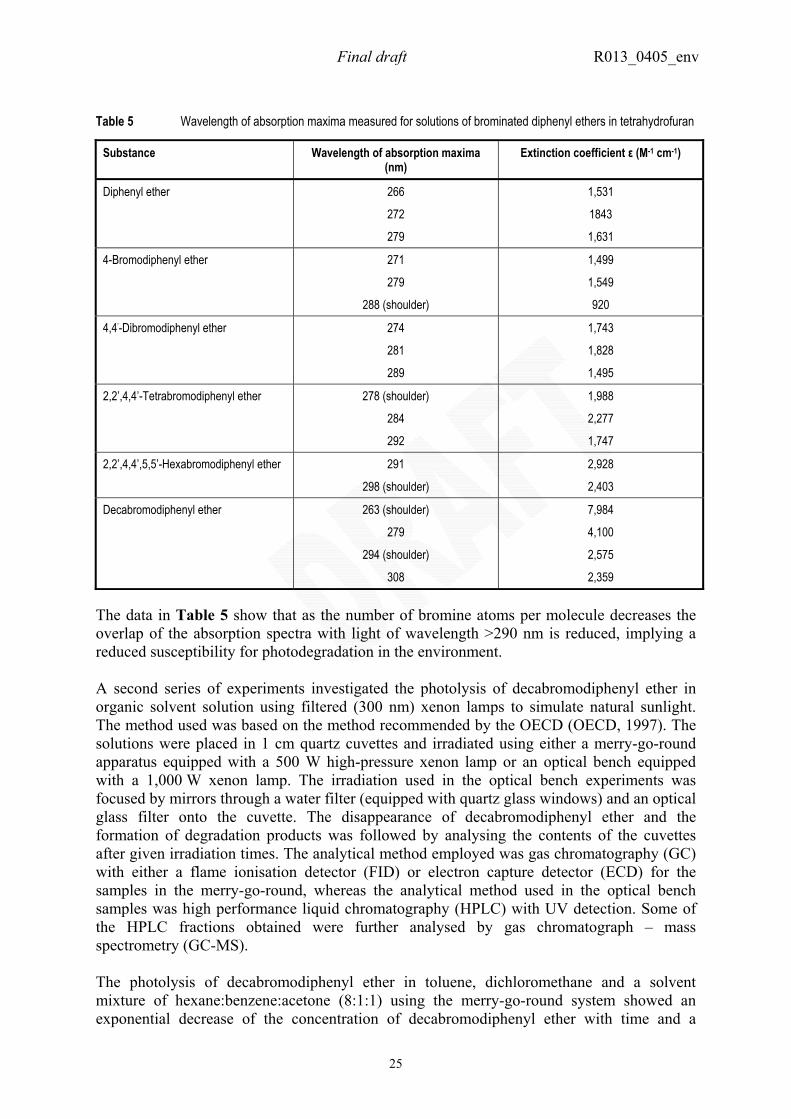
Final draft R013_0405_env
25
Table 5 Wavelength of absorption maxima measured for solutions of brominated diphenyl ethers in tetrahydrofuran
Substance Wavelength of absorption maxima (nm)
Extinction coefficient ε (M-1 cm-1)
Diphenyl ether 266
272
279
1,531
1843
1,631
4-Bromodiphenyl ether 271
279
288 (shoulder)
1,499
1,549
920
4,4’-Dibromodiphenyl ether 274
281
289
1,743
1,828
1,495
2,2’,4,4’-Tetrabromodiphenyl ether 278 (shoulder)
284
292
1,988
2,277
1,747
2,2’,4,4’,5,5’-Hexabromodiphenyl ether 291
298 (shoulder)
2,928
2,403
Decabromodiphenyl ether 263 (shoulder)
279
294 (shoulder)
308
7,984
4,100
2,575
2,359 The data in Table 5 show that as the number of bromine atoms per molecule decreases the overlap of the absorption spectra with light of wavelength >290 nm is reduced, implying a reduced susceptibility for photodegradation in the environment. A second series of experiments investigated the photolysis of decabromodiphenyl ether in organic solvent solution using filtered (300 nm) xenon lamps to simulate natural sunlight. The method used was based on the method recommended by the OECD (OECD, 1997). The solutions were placed in 1 cm quartz cuvettes and irradiated using either a merry-go-round apparatus equipped with a 500 W high-pressure xenon lamp or an optical bench equipped with a 1,000 W xenon lamp. The irradiation used in the optical bench experiments was focused by mirrors through a water filter (equipped with quartz glass windows) and an optical glass filter onto the cuvette. The disappearance of decabromodiphenyl ether and the formation of degradation products was followed by analysing the contents of the cuvettes after given irradiation times. The analytical method employed was gas chromatography (GC) with either a flame ionisation detector (FID) or electron capture detector (ECD) for the samples in the merry-go-round, whereas the analytical method used in the optical bench samples was high performance liquid chromatography (HPLC) with UV detection. Some of the HPLC fractions obtained were further analysed by gas chromatograph – mass spectrometry (GC-MS). The photolysis of decabromodiphenyl ether in toluene, dichloromethane and a solvent mixture of hexane:benzene:acetone (8:1:1) using the merry-go-round system showed an exponential decrease of the concentration of decabromodiphenyl ether with time and a
Final draft R013_0405_env
26
half-life under the conditions used of around 0.5 hours (rate constant ~4×10⁻⁴ s-1) was obtained with very little difference being seen in the rate constants obtained in the various solvent systems tested. Reductive debromination was found to occur, with firstly all three isomers of nonabromodiphenyl ether forming and then reacting further to form around six isomers of octabromodiphenyl ether which again degraded to two major heptabromodiphenyl ether isomers (along with several other minor heptabromodiphenyl ether isomers). Finally traces of a number of hexabromodiphenyl ether isomers were formed after around 3.5 hours irradiation. The rate constants for debromination of the intermediate brominated diphenyl ethers under the conditions used were estimated to be 1.1×10⁻⁴ s-1 for nonabromodiphenyl ether, 0.57×10⁻⁴ s-1 for octabromodiphenyl ether, 0.44×10⁻⁴ s-1 for heptabromodiphenyl ether. Mass balance calculations showed that the reductive debromination pathway accounted for around 75% degradation of the decabromodiphenyl ether in this study (and appeared to be the sole degradation pathway for the nonabromodiphenyl ethers to hexabromodiphenyl ethers formed during the study). The products from the remaining 25% of the degradation were not clear. The photolytic behaviour of decabromodiphenyl ether in THF was found to be similar to the other solvents tested and the rate constant for the reaction was shown to be independent of the initial concentration added. In addition, it was found that the quantum yield Ф (the number of molecules that react/number of photons absorbed) of decabromodiphenyl ether was independent of the wavelength over the region 280-350 nm. An experiment was also carried out exposing a saturated solution of decabromodiphenyl ether in toluene to natural sunlight for two full days at the end of July 2002. This lead to the complete disappearance of decabromodiphenyl ether. The degradation products found in the solution at the end of the exposure period included three nonobromodiphenyl ether isomers, several octabromodiphenyl ether and heptabromodiphenyl ether congeners (two isomers dominated), a group of hexabromodiphenyl ether isomers (a single isomer dominated) and a group of pentabromodiphenyl ethers. A similar breakdown pattern was also found by irradiating (this time using a sunlamp with a glass filter to a cut off at 320 nm) a saturated solution of decabromodiphenyl ether in THF for 84 hours. This longer exposure resulted also in the formation of brominated diphenyl ether products with less than five bromine atoms/molecule (e.g. tribromodiphenyl ethers and tetrabromobiphenyl ethers). The actual congeners formed in these experiments were not identified but the gas chromatographic pattern found did not resemble those found in commercial octabromodiphenyl ether and pentabromodiphenyl ether products. The authors of the report concluded that the much simpler fingerprint of congeners found in the commercial octabromodiphenyl ether and pentabromodiphenyl ether products implies that the lower brominated polybrominated diphenyl ethers found in the environment (which are dominated by the components from the commercial products5) are not derived from photolysis of decabromodiphenyl ether. The next set of experiments investigated the photolysis of 2,2’,4,4’-tetrabromodiphenyl ether and 2,2’,4,4’,5,5’-hexabromodiphenyl ether using a polychromatic light source with λ >280 nm in THF. In the experiments using 2,2’,4,4’-tetrabromodiphenyl ether (initial concentration 21.8 mg/l) degradation by progressive loss of bromine atoms to 2,4,4’-tribromodiphenyl ether, 4,4’-dibromodiphenyl ether and eventually down to
5 Most monitoring studies have investigated the occurrence of the main components of the commercial products and these are found to dominate the polybrominated diphenyl ethers reported to occur in environmental samples. However, analytical standards are not available for all congeners and so studies so far have not necessarily investigated the presence of the possible photolysis products from decabromodiphenyl ether in the environment.
Final draft R013_0405_env
27
4-bromodiphenyl ether was seen. Products with other bromine substitution patterns were generally absent (as shown by HPLC analysis and also the mass balance obtained from the above products) and no brominated dibenzofurans were found. The estimated photolysis rate constant under the conditions used was found to decrease from 0.073 min-1 (half-life ~9.5 minutes) for 2,2’,4,4’-tetrabromodiphenyl ether, to 0.056 min-1 (half-life ~12.4 minutes) for 2,4,4’-tribromodiphenyl ether, to 0.022 min-1 (half-life ~31.5 minutes) for 4,4’-dibromodiphenyl ether to 0.015 min-1 (half-life ~46.2 minutes) for 4-bromodiphenyl ether. The experiments using 2,2’,4,4’,5,5’-hexabromodiphenyl ether in THF (initial concentration 27.8 mg/l) showed a more complicated degradation pattern but the degradation was again found to occur by progressive loss of bromine atoms down to a monobrominated diphenyl ether congener. No brominated dibenzofurans were again observed. A similar set of experiments were then carried out exposing decabromodiphenyl ether (initial concentration 30 mg/l) in THF to the same polychromatic light source (λ >280 nm). The degradation pattern was much more complex than found for the tetra- and hexabrominated congeners tested above. The half-life for decabromodiphenyl ether under the conditions used was determined to be 1.9 minutes. Lower brominated diphenyl ether congeners were shown to be formed. All three possible nonabromodiphenyl ethers were found along with three octabromodiphenyl ethers and several heptabromodiphenyl ethers. However, under these conditions, about 17% of the degradation of decabromodiphenyl ether could not be explained by the formation of the lower brominated congeners and brominated dibenzofurans were also found to be formed. When the experiment was carried out using a cut-off filter at 320 nm, the half-life for decabromodiphenyl ether was found to increase to 26 minutes and the pattern of the nonabrominated diphenyl ether congeners formed was different from that obtained using light of λ >280 nm). It was concluded that the product distribution depends on the light source used. The quantum yields (Ф) determined in the study using the λ >280 nm light source and THF as solvent were 0.56 for 2,2’,4,4’-tetrabromodiphenyl ether, 0.69 for pentabromodiphenyl ether (estimated value for two congeners), 0.52 for 2,2’,4,4’,5,5’-hexabromodiphenyl ether, 0.22 for heptabromodiphenyl ether (estimated value), 0.32 for octabromodiphenyl ether (estimated value for at least five congeners), 0.26 for nonabromodiphenyl ether (mean for three congeners) and 0.38 for decabromodiphenyl ether. The quantum yield for decabromodiphenyl ether was found to be around 30% lower when a more polar solvent (acetonitrile) was used. In order to confirm that brominated dibenzofurans were formed during the photolysis of decabromodiphenyl ether a high concentration (~1.6 g/l) in THF was photolysed for 35 minutes and the products formed were analysed using a GC-MS technique. This confirmed the presence of mono-, di-, tri- and tetrabromodibenzofurans. Higher brominated dibenzofurans were not found, although it was indicated that the analysis of these products may have been complicated by the presence of the equivalent brominated diphenyl ethers formed in higher amounts. A single experiment was carried out to investigate the aqueous photolysis of decabromodiphenyl ether adsorbed onto silicon dioxide. The test solution was prepared by firstly dissolving 40 mg of decabromodiphenyl ether in 1 ml THF and then adding 1 g of silicon dioxide (specific surface areas 380 m2/g) and stirring at 11,000 rpm for five minutes. After this time the THF solvent was removed and the coated silicon dioxide particles were
Final draft R013_0405_env
28
vacuum dried overnight. The test suspension was then prepared by adding 100 ml of water to 50 mg of the coated particles and stirring at 11,000 rpm for 5 minutes. The nominal concentration of decabromodiphenyl ether in the final suspension was therefore 20 mg/l. The freshly prepared suspension was irradiated for 45 minutes with stirring using polychromatic light (λ >280 nm). Around 45% of the decabromodiphenyl ether was found to have degraded after 45 minutes. Details of all the degradation products formed during this study were not given in the test report but it was shown that brominated furans were formed in this study. Palm et al. (2003) concluded that all brominated diphenyl ethers should be degradable by sunlight with the half-life increasing with decreasing bromination. The half-life for decabromodiphenyl ether was estimated to be around 14 minutes in sunlight (the equivalent half-life estimated for hexabromodiphenyl ether was around 6 hours and for tetrabromodiphenyl ether was around 3 days) based on the data obtained (calculated from the overlap of the UV spectrum and the sunlight intensity for June at a latitude of 50o). The half-lives for other brominated diphenyl ether congeners were estimated to be around 1-5 hours for nona-, octa- and heptabromodiphenyl ether, 1 day for pentabromodiphenyl ether, 2 weeks for dibromodiphenyl ether and 1 month for monobromodiphenyl ether. Overall it was concluded that photolysis of decabromodiphenyl ether in the environment would lead to debrominated products down to monobromodiphenyl ether and finally (after months to years) diphenyl ether. In addition, it was concluded that the congener pattern obtained from such reactions would be different from that present in commercial products and that observed in environmental samples (but see footnote 5 above). As well as debromination to form lower brominated diphenyl ethers, a further photochemical pathway (accounting for around 20-30% of the total degradation of decabromodiphenyl ether) leading to the formation of brominated dibenzofurans was identified in the experiments by Palm et al. (2003). The brominated dibenzofurans are also expected to be susceptible to degradation by photolysis. In addition to the solution photolysis studies, Palm et al. (2003) also investigated the photochemical degradation of decabromodiphenyl ether (and certain other brominated diphenyl ethers) in an aerosol smog chamber. In these experiments, decabromodiphenyl ether (along with mirex) was adsorbed onto silicon dioxide (specific surface area 380 m2/g) at a concentration of around 1% by weight (this was reported to give a sub-monolayer thickness covering on the aerosol particles) and was then suspended in water, atomised, dried and dispersed as an aerosol in a smog chamber (density of the aerosol was around 2 mg/m3 after 1 hour). Although adsorption to such particles is not necessarily relevant for atmospheric transport processes (the particles were however of an environmentally relevant size (diameter ca. 1 µm in the aerosol)), they were chosen because they are transparent to light, can be coated with a monolayer of molecules and allow a stable aerosol to be generated and maintained. The conditions used are therefore assumed to maximise the degradation potential. The smog chamber had a large volume (1,760 l), which enabled residence times of around 10 hours to be obtained for the aerosol particles. The aerosol was then exposed to simulated sunlight (fluorescent lamps) and/or hydroxyl radicals. The hydroxyl radicals were generated either by the reaction of ozone with hydrazine in darkness or by the photochemical degradation of methyl nitrite. The hydrocarbons n-butane, 2,2-dimethylbutane or cyclohexane and toluene (at 30-100 ppb), and an inert standard (perfluorohexane at 60 ppb) were also added to the chamber. The rate of degradation of decabromodiphenyl ether was found to be barely measurable with the equipment used and the rate constant was determined to be <6×10-13 cm3 molecule-1 s-1 for reaction with hydroxyl radicals.
Final draft R013_0405_env
29
Further experiments carried out with aerosol-borne decabromodiphenyl ether showed that the substance was subject to photodegradation but the rate was much lower than found in solution by at least an order of magnitude, and was also lower than found in the experiments using the aqueous suspension. Similarly the photolysis of aerosol-borne 2,2’,4,4’,5,5’-hexabromodiphenyl ether was found to be around five times slower than found in THF solution. The photolysis of aerosol-borne 2,2’,4,4’,5,5’-hexabromodiphenyl ether resulted in the formation of some debrominated diphenyl ether products (three pentabromodiphenyl ethers were identified) but the overall product distribution found in the aerosol experiments differed from that found in the solution photolysis experiments in that almost no tetrabromodiphenyl ethers were found. In addition to direct photolysis, aerosol-borne 2,2’,4,4’,5,5’-hexabromodiphenyl ether was found to react with hydroxyl radicals, and a preliminary value for the rate constant for the reaction was determined as 2×10-12 cm3 molecule-1 s-1 at 7oC. The products from the reaction with hydroxyl radicals were not determined. Conclusions for abiotic degradation The available data on photodegradation of decabromodiphenyl ether clearly show that the substance photodegrades under a range of conditions. Studies carried out using organic solvents indicate that products such as lower brominated diphenyl ether congeners (which are potentially more toxic and accumulative than the parent compound6) and also polybrominated dibenzofurans are formed using either UV, natural sunlight or simulated sunlight. Several studies have also investigated the degradation of decabromodiphenyl ether using solid matrices in contact with water and either natural or simulated sunlight, for example Sellström et al. (1998), Örn (1997), Jafvert and Hua (2001) and Palm et al. (2003) (N.B. some of these studies are summarised in the original risk assessment report). These studies all show that decabromodiphenyl ether is likely to undergo photodegradation in the environment and that debromination to give lower brominated diphenyl ether congeners does occur. It is also clear that the lower brominated congeners formed can also undergo photodegradation themselves. The experiments carried out by Palm et al. (2003) and Söderström (2003) show that, as well as lower brominated diphenyl ether congeners, brominated dibenzofurans may also be formed during the photodegradation of decabromodiphenyl ether on solid matrices in contact with water. Again, the brominated dibenzofurans formed would also be expected to be susceptible to further photodegradation, in a similar way to the lower brominated diphenyl ether congeners formed. It should be noted, however, that the actual significance of the formation of, and subsequent degradation of, these products in the environment depends on the relative rates of formation and degradation of each product. Little information is currently available on the rates of these reactions under environmentally relevant conditions. Palm et al. (2003) and Eriksson et al. (2001) showed that the rate constant for debromination of brominated diphenyl ethers decreased as the number of bromine atoms/molecule decreased. This finding implies that in a system with a single input of decabromodiphenyl ether, complete photodegradation down to biphenyl ether itself would be expected to occur. However, it also implies that in a system with a continuous input of decabromodiphenyl
6 The commercial penta- and octabromodiphenyl ether products are being banned in the EU, based partly on evidence of widespread and increasing concentrations in biota and human breast milk at the time the assessments were completed.
Final draft R013_0405_env
30
ether, a steady-state build up of lower brominated congeners could occur. The magnitude of such a build up would be difficult to predict, as it would depend on the rate of input of decabromodiphenyl ether into the system. Similarly, it is difficult to predict if a build up of other degradation products such as brominated furans could occur. In order to assess the significance of the photolysis data for the risk assessment two key points need to be considered.
a) Are the products likely to be formed in the environment the same as those in the laboratory experiments?
b) What is the likelihood of exposure of decabromodiphenyl ether to light in the environment?
With regard to the likely products formed, the first step of the photolysis reaction is undoubtedly cleavage of a carbon-bromine bond. In laboratory studies using organic solvents, the nonabrominated aryl radical formed can then abstract a hydrogen atom from the solvent to form the debrominated product (reductive debromination). However, in the environment, particularly in the water phase, reaction of the aryl radical with water could occur leading to the formation of a phenolic product as has been found for many halogenated aromatic compounds (see Appendix F of the original risk assessment report). The subsequent photodegradation of the nonabrominated phenolic product is unknown but it is unlikely to form lower brominated diphenyl ether congeners. Thus, in the environment there may be two (or more) competing pathways for the reaction of the initially formed radical. The available experimental evidence in laboratory studies with water indicates that at least part of the degradation products seen are as a result of the reductive debromination pathway and so it has to be concluded that such products could also be formed in the environment. In addition, the experiments in water have also demonstrated that brominated dibenzofurans could be formed and it has to be concluded that these products could also be formed in the environment. Any brominated diphenyl ethers and brominated dibenzofurans formed would themselves be expected to be susceptible to further photodegradation but there is insufficient information available on their relative rates of formation from decabromodiphenyl ether and subsequent degradation under environmentally relevant conditions to determine the significance of this process in terms of a possible build up of these products in the environment. The second key point to be considered is the likelihood of exposure of decabromodiphenyl ether to light in the environment. The physico-chemical properties of decabromodiphenyl ether (very low vapour pressure, high log Kow) indicate that the majority of decabromodiphenyl ether released to the environment would partition onto suspended particulate matter (and ultimately sediment) or soil (see Section 3.1.0.7.2), where it is likely to be immobile. In these matrices only the surface layer is likely to be exposed to light (and in many sediments the amount of light reaching the sediment surface would be low). Quenching agents are also likely to be present. It can therefore be expected that only a very small fraction of the total decabromodiphenyl ether present in the environment would have the potential for photodegradation. Decabromodiphenyl ether has also been shown to be present in the atmosphere. Here, although it is likely to be adsorbed onto particulates, it could be exposed to sunlight and hydroxyl radicals. The available data indicate that under these conditions photodegradation of decabromodiphenyl ether may occur, but that the rate for the reaction would be much lower
Final draft R013_0405_env
31
than found in solution or aqueous suspension. In addition, it is likely that any debrominated diphenyl ether product formed would undergo further photolysis and, as the number of bromine atoms/molecule decrease, would become increasing susceptible to reaction with hydroxyl radicals. Overall, although it can be concluded that formation of lower brominated diphenyl ethers and brominated dibenzofurans can occur from the photolysis of decabromodiphenyl ether in the environment, the actual significance of the process is likely to be limited owing to the lack of exposure to light of the bulk of decabromodiphenyl ether in the environment. It is considered unlikely that such photolysis reactions of decabromodiphenyl ether could explain the current widespread occurrence of tetra-, penta- and hexabromodiphenyl ether congeners in the environment. Instead, it is much more likely that this is mainly the result of the emissions of the commercial penta- and octabromodiphenyl ether flame retardants. However any photolysis of decabromodiphenyl ether that does occur in the environment could make a (probably small) contribution to the levels of the lower brominated diphenyl ether congeners and also possibly brominated dibenzofurans present in the environment. Further evidence for this conclusion can be taken from the sediment core data of Zegers et al. (2000 and 2003) reported in Section 3.1.1.2.2. In this study the levels of decabromodiphenyl ether and lower brominated congeners were determined in dated sediment cores from Drammenfjord (Norway), the western Wadden Sea and the freshwater lake Woserin (Germany). In these samples, the main components of the commercial pentabromodiphenyl ether were found to be present in layers corresponding to the early 1970s onwards and decabromodiphenyl ether was found to be present in layers corresponding to the late 1970s onwards. The commercial octabromodiphenyl ether (as determined by a “marker” component 2,2’,3,4,4’,5’,6-heptabromodiphenyl ether) was absent from the cores. The levels of the commercial pentabromodiphenyl ether components were found to be levelling off in the most recent sediment layers (ca. 1995-1997) in samples from the western Wadden Sea and Lake Woserin, whereas the levels of commercial pentabromodiphenyl ether components in the samples from Drammenfjord were still found to be increasing in layers corresponding to 1999. In contrast to this, the levels of decabromodiphenyl ether had decreased in the most recent layers of all three sediment cores. The fact that the levels of decabromodiphenyl ether in more recent sediment layers were lower than in earlier sediment layers tends to suggest that decabromodiphenyl ether is reasonably stable in sediment and the levels found are related to the emissions at the time. 3.1.0.5.2 Biodegradation Summary of original risk assessment report The substance is not readily biodegradable. The available data show that decabromodiphenyl ether is unlikely to biodegrade rapidly in the environment under both aerobic and anaerobic conditions.
Final draft R013_0405_env
32
Updated information No new information on the biodegradation of decabromodiphenyl ether is available7. It will therefore be assumed that decabromodiphenyl ether is not biodegradable in this updated assessment. 3.1.0.6 Accumulation 3.1.0.6.1 Summary of original risk assessment report The available data indicated that little or no uptake of decabromodiphenyl ether occurs in aquatic organisms exposed via the water phase. Some limited uptake had been seen in experiments with fish exposed via food, but the tissue concentrations reached were much lower than those present in the food. Overall it was concluded that the substance can be considered to have a low bioaccumulation potential. A low fish BCF of 4 l/kg was assumed in the assessment. For mammalian systems, the available oral/feeding studies showed that only a small amount of the applied dose was taken up into, and distributed within, the various body tissues, but depuration appeared to be relatively rapid. The extent of uptake seen in the studies may have been a function of the administration vehicle used. There was also evidence that decabromodiphenyl ether could be metabolised to form hydroxylated derivatives. Therefore it was concluded that the bioaccumulation potential of decabromodiphenyl ether in mammalian systems was low. Decabromodiphenyl ether had, however, been found to be present in samples of eggs taken from wild bird populations, and also some marine mammals and fish, indicating that uptake of decabromodiphenyl ether by organisms was occurring in the environment. 3.1.0.6.2 Updated information A number of recent studies examining uptake in fish and mammals via the oral route have become available. These are summarised below. Fish The uptake, metabolism and depuration of polybrominated diphenyl ethers, including decabromodiphenyl ether, has been studied in common carp (Cyprinus carpio) exposed via spiked food (Stapleton et al., 2002, 2003a and 2003c). The test was carried out using juvenile carp (Cyprinus carpio; approximately 100 mm in length) and the fish were randomly assigned to one of five 132-litre polyethylene tanks. Two replicated tanks were used for the control population and three replicate tanks were used for the exposed population. The water used in the test was filtered well water at 22oC and this was provided at a constant flow rate of 1 litre/minute (giving a hydraulic residence time of around 2 hours). Aeration via air stones 7 The only evidence of a lack of aerobic biodegradation potential is given in Japanese papers: Chemicals Inspection and Testing Institute (CITI) (1992) and Sasaki (1978); the latter reference was not listed in the original risk assessment report. The rapporteur has checked the Sasaki reference and considers it very likely that the paper refers to the same dataset (since the title of the paper indicates it is a discussion of the Chemical Substance Control Law in Japan and the CITI report is actually a collection of data collected under this legislation). The entry for decabromodiphenyl ether indicates that the substance was not well degraded (which presumably means <30% degradation was seen in the MITI I test).
Final draft R013_0405_env
33
was provided in the tanks to maintain the dissolved oxygen concentration. The fish were acclimated to the test system for one week (during which they were fed a clean diet) prior to exposure to food contaminated with decabromodiphenyl ether. The decabromodiphenyl ether used in the experiment was >98% pure (no information was given on the identities of any impurities present) and was dissolved in cod liver oil. The food used in the study was a homogenised mixture of blood worms (80% by mass) and fish food pellets (20% by mass). The cod liver oil solution (20 ml) was then mixed into the food to give a decabromodiphenyl ether concentration of 940 µg/kg wet weight. Control food was prepared in a similar way, but pure cod liver oil was added to the homogenised food. The exposure part of the experiment was carried out for 60 days and the fish were fed either the spiked (exposed population) or control (control population) food at a rate of 1 g/day/fish (this corresponded to a daily dose of decabromodiphenyl ether of approximately 40 µg/kg body weight). After the 60-day exposure period, all the fish were fed the control diet for a further 40 days in order to monitor the depuration. One fish from each tank was sampled on days 0, 5, 10, 20, 30, 45, 60, 69, 85 and 100 of the experiment. The stomach cavity contents of the fish were discarded and the livers (pooled samples for the exposed and control populations) and the remaining whole body (individual samples) were analysed for the presence of polybrominated diphenyl ethers. No significant effects were seen on mortality of the carp (mortality was 9% in the exposed population and 7% in the control population), but growth rates were found to be statistically significantly reduced (p=0.05) in the exposed population (growth rate 5.4×10⁻³± 2.0×10⁻³ day-1) compared with the control population (growth rate 7.7×10⁻³±1×10⁻⁴ day-1). In addition the lipid contents of whole fish tissues were also found to be statistically significantly reduced (p=0.05) in the exposed population (lipid content 1.9±0.8%) compared with the control population (2.7±1.0%) based on the average of all fish at all time points throughout the exposure. No decabromodiphenyl ether was found in the whole fish tissues of either the exposed or control population at any sampling time (the detection limit for this substance was 1 µg/kg wet weight), indicating that little or no accumulation of decabromodiphenyl ether occurred (less than 1% of the total decabromodiphenyl ether administered was accumulated during the study). However, around seven peaks were found in the chromatograms from the exposed fish that were not present in the chromatograms from the control fish. Two of these peaks were positively identified as 2,2’,4,4’,5,6’- and 2,2’,4,4’,6,6’-hexabromodiphenyl ether, and the other five peaks were identified as an unknown pentabromodiphenyl ether, an unknown hexabromodiphenyl ether, two unknown heptabromodiphenyl ethers and an unknown octabromodiphenyl ether. The mass balance for the other congeners detected was not given. A mass balance calculation was carried out based on the presence of 2,2’,4,4’,5,6’-hexabromodiphenyl ether in the fish. The concentrations of this substance in the fish were up to 35 ng/fish by day 60 of the exposure. This congener was not, however, detected in the spiked food (detection limit was 0.03 ng/g wet weight) and so the maximum amount of 2,2’,4,4’,5,6’-hexabromodiphenyl ether that could have come from the food was around 2 ng/fish (assuming the detection limit represents the upper limit of the concentration in food, the substance was 100% absorbed and the daily feeding rate was 1 g food over 60 days). Thus it was concluded that the presence of this substance in the fish could not have been the result of impurities present in the food.
Final draft R013_0405_env
34
The same seven lower brominated congeners were also found to be present in the liver samples. The levels of total polybrominated diphenyl ethers in the liver were consistently higher than found in the whole fish tissue during the exposure period. The paper indicates that minimal levels of 2,2’,4,4’-tetrabromodiphenyl ether or 2,2’,4,4’,5-pentabromodiphenyl ether were found in either the control fish or the exposed fish. The concentrations of the lower brominated congeners identified in the study were found to increase throughout the exposure period. The concentrations of some of the lower brominated congeners (e.g. the unknown pentabromodiphenyl ether) were found to still increase for up to 10 days after the exposure ceased before the concentrations started to decrease, whereas the concentration of the octabromodiphenyl ether was found to start to decrease immediately the exposure to decabromodiphenyl ether ceased. During the depuration period, the tissue concentration of some of the congeners was found to be variable, but half-lives of around 50 days and 35 days were estimated for 2,2’4,4’,6,6’- and 2,2’,4,4’5,6’-hexabromodiphenyl ether respectively. Based on the concentrations of the lower brominated congeners found it was estimated that at least 0.44% of the total dose was absorbed in this study (it should be noted that this is based on the brominated diphenyl ether congeners found in this study; the actual absorption could be higher than this figure if other metabolites are also formed). This was in reasonable agreement with the 0.02-0.13% absorption seen the Kierkegaard et al. (1999) study summarised in the original risk assessment report. The authors concluded that presence of the lower brominated congeners in the exposed fish indicated that debromination of the decabromodiphenyl ether was occurring. Another similar study by Stapleton et al. (2003b) using single isomers showed that 2,2’,4,4’,5-pentabromodiphenyl ether and 2,2’,3,4,4’,5’,6-heptabromodiphenyl ether were debrominated in carp to form 2,2’,4,4’-tetrabromodiphenyl ether and 2,2’,4,4’,5’,6-hexabromodiphenyl ether respectively. It was thought that in this experiment the debromination occurred mainly within the intestinal tissue via mediation by indigenous enzyme systems or microbial fauna as only the debrominated products and not the parent compounds were detected in the fish tissues (it is surprising that no uptake of either the parent penta- or hexabromodiphenyl ether was seen in this study). A further study looking at the uptake of decabromodiphenyl ether by fish from food has been carried out by Tomy et al. (2004). In this study groups of juvenile lake trout (Salvelinus namaycush; initial mean weight 55 g; 70 fish per treatment group) were exposed to a diet containing thirteen polybrominated diphenyl ether congeners (the congeners ranged from tri- to decabromodiphenyl ethers). Two dosing levels were used (~2.5 µg/kg food per congener and ~25 µg/kg food per congener) along with a control food containing no added polybrominated diphenyl ethers. The exposure part of the study was carried out for 56 days and this was followed by a 112 day depuration period (during which the fish were fed the uncontaminated food). The feeding rate in the study was 1.5% of the mean weight of the trout (adjusted after each sampling period). The individual congeners used in the study each had a purity of >96%.
Final draft R013_0405_env
35
The procedure used to spike the food (commercial fish food) was as follows. A known amount of each congener was firstly added to corn oil which was then added to a blender containing the food. The mixture was then stirred gently for 20 minutes after which an aqueous gelatin binder was added. The mixture was then stirred again until a firm consistency was obtained (after around a further 20 minutes). The spiked food was then air dried for 40 minutes, extruded through a 4 mm diameter “noodler”, dried at 10°C for 48 hours and then crushed into pellets. The control food was prepared in the same way without the addition of the polybrominated diphenyl ethers. At various times during the study the concentrations of decabromodiphenyl ether present in the muscle of fish were determined. These concentrations were corrected for the concentrations found in the control fish, lipid normalised and corrected for growth dilution prior to calculating the assimilation efficiency, uptake and depuration rate constants, depuration half-life and the biomagnification factor (BMF; based on the assimilation efficiency, feeding rate and depuration rate constant). The concentration of decabromodiphenyl ether in the food was found to be 3.4 µg/kg dry weight in the low dose food, 27.5 µg/kg dry weight in the high dose food and 3.4 µg/kg dry weight in the control dose food. No reliable kinetic parameters could be determined for the low dose group. For the high dose treatment, the depuration half-life for decabromodiphenyl ether was determined to be 26±5 days, the assimilation efficiency was determined to be 5.28% and the BMF was determined to be 0.3. The paper also suggested that debromination of some of the higher brominated congeners could be occurring in this experiment. This was based on a comparison of the depuration half-lives obtained for some of the lower brominated congeners in the study (some of these had depuration half-lives that were longer than may be expected for recalcitrant molecules and one possible explanation for this was that they were being formed in the fish from other polybrominated diphenyl ethers), the fact that the concentration of some lower brominated congeners (e.g. 2,2’,4,4’,6-pentabromodiphenyl ether in the high dose experiment only) increased during the depuration phase, and the chromatographic elution patterns that indicated a number of polybrominated diphenyl ether congeners were present in the exposed fish that were absent from the fish food (however, the detection limit for these congeners in the food was not given and it is possible that they were present at concentrations below the detection limit). It was noted in the paper that one of the congeners that was absent from the food (2,2’,3,4,4’,6’-hexabromodiphenyl ether) could only be derived from decabromodiphenyl ether out of the congeners added to the food. The paper also attempted to carry out an analysis in order to determine whether impurities present in the decabromodiphenyl ether used could have explained the uptake pattern seen. The maximum concentration of decabromodiphenyl ether determined in the fish after 56 days exposure was ~200 µg/kg. Using this concentration as a basis, a standard solution of the decabromodiphenyl ether used (corresponding to a concentration of 200 µg/kg fish) was analysed for the presence of penta- and hexabromodiphenyl ether congeners. No penta- and hexabromodiphenyl ethers could be detected at this level and so the authors argued that impurities in the decabromodiphenyl ether used could not account for the uptake patterns seen. However, this argument appears to be crucially flawed as it assumes that the BMF for the penta- and hexabromodiphenyl ether congeners would be the same as for decabromodiphenyl ether. This assumption is incorrect based on the BMFs for the lower brominated congeners. 8 The results table in the paper gives the assimilation efficiency as 5.2% but the text later gives it as 0.3%.
Final draft R013_0405_env
36
The presence of decabromodiphenyl ether (and several of the lower brominated diphenyl ether congeners) in the control food, and the fact that the actual exposure was to a mixture of polybrominated diphenyl ether congeners, means that the results of this experiment are uncertain and difficult to interpret. Although the authors of the paper thought that the results of the study were suggestive of debromination of the higher congeners to form lower congeners, none of the data presented conclusively show this was occurring for decabromodiphenyl ether. KEMI (pers. com.) indicated that recent data from the Baltic might suggest an accumulation of decabromodiphenyl in salmon from sprat and herring. No further details of this study are currently available. Mammals Thomas et al. (2003) have investigated the uptake of decabromodiphenyl ethers by Grey Seals (Halichoerus grypus). The paper mentions the studies using decabromodiphenyl ether but indicates that the results will be published in a separate paper, and this is not yet available. However, the authors have kindly provided the following details of the study with decabromodiphenyl ether (Jones, 2003). Three juvenile Grey Seals were taken from the wild and kept in a licensed captive study facility. The seals were kept for one month on a stable diet of herring and mineral supplements, followed by one month on the same diet supplemented with a daily cod liver oil capsule containing 10 µg of decabromodiphenyl ether (99% pure). Following this, the seals were kept for a further month with the same diet supplemented with a control cod liver oil capsule (not containing decabromodiphenyl ether). Once per week the seals were weighed, blood samples and 24-hour faeces samples were collected, and physiological parameters were measured. In addition, blubber biopsies were taken at three timepoints during the study. The study found that the average absorption of decabromodiphenyl ether (determined as the difference between ingestion and excretion in the faeces) was around 89% (range 59-97%) during the one month the seals were exposed to decabromodiphenyl ether. There was a rapid increase in the decabromodiphenyl ether concentration in the blood during the exposure period, and this concentration declined rapidly after exposure ceased. Thirty days after the exposure ceased the concentration of decabromodiphenyl ether in blood was around 10% of the peak level. Decabromodiphenyl ether was also found to be present in the blubber shortly after the start of the exposure period, and was still found to be present in the blubber 30 days after the exposure ceased. Up to 68% of the total ingested decabromodiphenyl ether was estimated to be present in blubber at day 3 of the exposure period and around 11-15% of the total decabromodiphenyl ether ingested was estimated to be present in the blubber at the end of the study (after 30 days on the control diet). Recent work by Mörck et al. (2003) provides further information on the potential for uptake of decabromodiphenyl ether in rats. The study was designed to identify the metabolites of decabromodiphenyl ether and the absorption of decabromodiphenyl ether was maximised by careful choice of test vehicle (the study investigated the use of several different solvents for this purpose). Further details are provided in Section 4.xxx. Overall it was concluded that close to 10% of the initial oral dose in the experiment had been adsorbed (based on the excretion seen via bile). However, it was thought that the actual absorption could be higher than this as around 65% of the dose excreted in faeces was as metabolites. This contrasts with some earlier mammalian studies that showed very low levels of absorption (e.g. <1% of the dose). As well as bile/faeces, it was postulated that metabolism occurred in the liver and
Final draft R013_0405_env
37
small intestine and that a reactive metabolite (e.g. an arene oxide or a catechol) may be involved in later metabolic steps (debromination of decabromodiphenyl ether was thought to occur as a first step (KEMI, pers. com.)). It was also concluded that distribution of decabromodiphenyl ether to adipose tissue did not occur to any great extent. The highest concentrations of decabromodiphenyl ether were generally found in the plasma- and blood-rich tissues. Sandholm et al. (2003) has also investigated the bioavailability and half-life of decabromodiphenyl ether in blood of rats. Further details are provided in Section 4.xxx. The oral bioavailability (defined as the fraction of the administered parent compound reaching systemic circulation) was determined to be 26% and the maximum plasma concentration after oral dosing was found to be 264 pmol/ml (~253 ng/ml) and occurred 6 hours after dosing (the actual bioavailability could be higher than this as a 5-fold higher concentration of metabolites was present in the plasma relative to decabromodiphenyl ether itself (KEMI, pers. com.)). The terminal (elimination) half-life from the plasma was determined to be around 2.5 days. Similar metabolic profiles were obtained from both the animals dosed by gavage and those dosed intravenously. The neutral fraction was dominated by unchanged decabromodiphenyl ether, but traces of three nonabromodiphenyl ethers were also found. The phenolic fraction was found to contain at least thirteen metabolites containing bromine, but only three were present in high enough concentration to allow tentative identification. Monohydroxylated nonabromodiphenyl ether and monohydroxylated octabromodiphenyl ether were found to be present. The third metabolite was not unambiguously identified. Analysis of the plasma samples from the Mörck et al. (2003) metabolism study showed that the level of radioactivity present in the phenolic fraction was around 4 times higher than in the neutral fraction at both days 3 and days 7. The neutral fraction was again found to contain mainly unchanged decabromodiphenyl ether, along with traces (<0.5% of the total peak area) of three nonabromodiphenyl ethers. However, it was not possible to determine the nature of the metabolites in the phenolic fraction. The authors speculated that a possible explanation for the high concentrations of metabolites relative to the parent compound found in plasma at day three could be as a result of reversible binding of the metabolites to the thyroxine hormone transporting protein transthyretin. The results also showed that around 26% of the administered dose was bioavailable and, since the total concentrations of radioactivity in plasma were generally higher than the concentration of the parent compound, the actual overall absorption was likely to be higher than indicated by this figure, and possibly indicates that decabromodiphenyl ether undergoes first pass metabolism (in the GI-tract) before reaching the circulatory system. 3.1.0.6.3 Summary and discussion The TGD notes that certain classes of substances with a molecular mass greater than 700 are not readily taken up by fish, because of possible steric hindrance at passage of gill membranes or cell membranes of respiratory organs. These substances are unlikely to bioaccumulate significantly (regardless of the log Kow value). The molecular mass of decabromodiphenyl ether is 959.2. Perhaps of more relevance is molecular surface area, crudely indicated by molecular diameter. For example the lack of (or low) bioconcentration in the guppy (Poecilia reticulata)
Final draft R013_0405_env
38
of substances with a molecular cross-section >0.95 nm has been explained by limited membrane permeability (Sijm et al., 1993; Dimitrov et al., 2002). Recent work by Dimitrov et al. (2002) has indicated that a maximum cross-section of 1.5 nm may be an appropriate cut-off related to the maximum in the BCF-log Kow relationship. Two estimates of the molecular size for decabromodiphenyl ether are available. Hardy (2000) calculated the Van der Waals dot surface area for decabromodiphenyl ether to be 424.4 nm2, the molecular volume (based on Van der Waals radii; including the electronic cloud) to be 359.2 nm3, and a minimum box volume (into which the molecule will just fit) to be 1,339.1 nm3. The minimum box dimensions were 14.2 nm × 9.7 nm × 9.7 nm. A second estimate of the molecular size for decabromodiphenyl ether has been carried out by Dearden (2004) at the request of the rapporteur using TSAR v. 3.3 computer software (Accelrys Ltd, Oxford, England). In this study the molecular surface area and molecular volume were estimated to be 349.62 nm2 and 332.48 nm3 respectively, which are in reasonable agreement with the estimates given in Hardy (2000). In addition, Dearden (2004) also estimated the “substituent” length9 and width of the molecule to be 8.45-12.13 nm and 2.56-9.89 nm respectively. The experimental bioconcentration data for fish for decabromodiphenyl ether are therefore consistent with the very low accumulation expected for a substance with such a large molecular size. Nevertheless, the factors that may be important in determining the rate and extent of bioconcentration in fish from water (e.g. diffusion from water, ventilation rate, etc.) may be different to those governing uptake from other media such as food. For example, the digestibility and lipid content of the food may be important (Environment Agency, 2003) and active transport across cell membranes could also occur. It is therefore possible that despite the low accumulation in fish, uptake into organisms from other media could be higher. This appears to be confirmed by the new laboratory studies with mammals (both marine and terrestrial). However, the actual extent of uptake seen in the laboratory appears to depend on the administration vehicle used. It is therefore difficult to relate the findings from laboratory studies using different solvent systems to the situation in the environment. It should also be noted that there are a number of other possible experiment-related factors that could confound the interpretation of the available data on uptake and accumulation of decabromodiphenyl ether in mammals and fish. These could include, for example, photodegradation in organic solvents used to prepare food, etc.; the possible presence of low (undetectable) amounts of more accumulative lower brominated diphenyl ethers in food or the test substance; and the possible metabolism of decabromodiphenyl ether by gut microflora. These make the results of the various studies difficult to interpret. Still, the available data do suggest that uptake by organisms in the environment could occur if the organisms are exposed to decabromodiphenyl ether in a suitable form. The available data also indicate that decabromodiphenyl ether has a relatively short elimination half-life from organisms. This should limit the potential for bioaccumulation of decabromodiphenyl ether, although the fate of metabolites is unclear and the substance can be retained after exposure is stopped, as demonstrated in the study with Grey Seals. At least one study has provided some indication that decabromodiphenyl ether may be metabolised by fish (whether within the fish itself or by the microbial fauna present in the 9 In this case the length is defined as the maximum length of the substituent along the axis of the bond between the first atom of the substituent and the common fragment and the width is defined as the smallest width of the substituent in any direction perpendicular to the bond axis; the estimate was run several times using each bromine atom in turn as the common fragment and the rest of the molecule as the substituent
Final draft R013_0405_env
39
intestine) to form lower brominated diphenyl ether congeners. It should also be noted that the available toxicity data for decabromodiphenyl ether would account for the toxicity of any toxic metabolites formed in the organism during the study. This aspect is considered further in Sections 3.2 and 3.3. In addition to these laboratory studies, there are new monitoring studies (summarised in Section 3.1.4.2) that show that decabromodiphenyl ether is present in certain species of wild birds and their eggs, and also mammals and some fish. Although these data show that higher organisms are taking up decabromodiphenyl ether in the wild, the actual route of exposure is not known. The monitoring studies generally only investigate the presence of the parent compound, so the overall metabolite burden in the samples is unknown. 3.1.0.7 Environmental distribution 3.1.0.7.1 Summary of original risk assessment report The following adsorption coefficients were assumed in the original risk assessment. Koc 1.59×10⁶ l/kg
Kpsoil 31,773 l/kg Ksoil-water = 47,660 m3/m3
Kpsed 79.433 l/kg Ksed-water = 39,800 m3/m3
Kpsusp 158,866 l/kg Ksusp-water = 39,717 m3/m3 It was concluded that decabromodiphenyl ether would be expected to be relatively immobile in soil and unlikely to leach into groundwater. 3.1.0.7.2 Updated information No new data on the adsorption of decabromodiphenyl ether to soils and sediments are available. Sorption on to solid matrices such as atmospheric particulates, soils and sediments is expected to dominate the environmental partitioning and distribution of this substance. In order to further explore the likely environmental distribution of decabromodiphenyl ether, a level III fugacity model (EQC V1.01) was run. The input parameters and the predicted environmental distribution are shown in Table 6. The results in Table 6 show that if decabromodiphenyl ether is released to water, it is expected to partition almost exclusively to the sediment phase. Emissions to soil are predicted to remain in the soil phase, with very little transfer to other environmental compartments. Emissions to air are also predicted to partition mainly to the soil phase, presumably as a result of wet and dry deposition processes. A modelling study of the long-range atmospheric transport potential of decabromodiphenyl ether has been carried out by Wania and Dugani (2003). The study used four models that determined either the Characteristic Travel Distance (CTD; the distance in air at which the concentration has fallen to 1/e of its initial value), the Spatial Range (SR; the distance from a point of release that contains 95% of the spatially integrated concentration functions) or the Arctic Amplification Potential (AAP10; the fraction of the total global amount of a chemical that has accumulated in the Arctic Region after ten years of steady emissions). The predictions obtained for decabromodiphenyl ether from the various models were a CTD of 480-735 km, a SR of 0.18% and an AAP10 of 1.99. The study concluded that
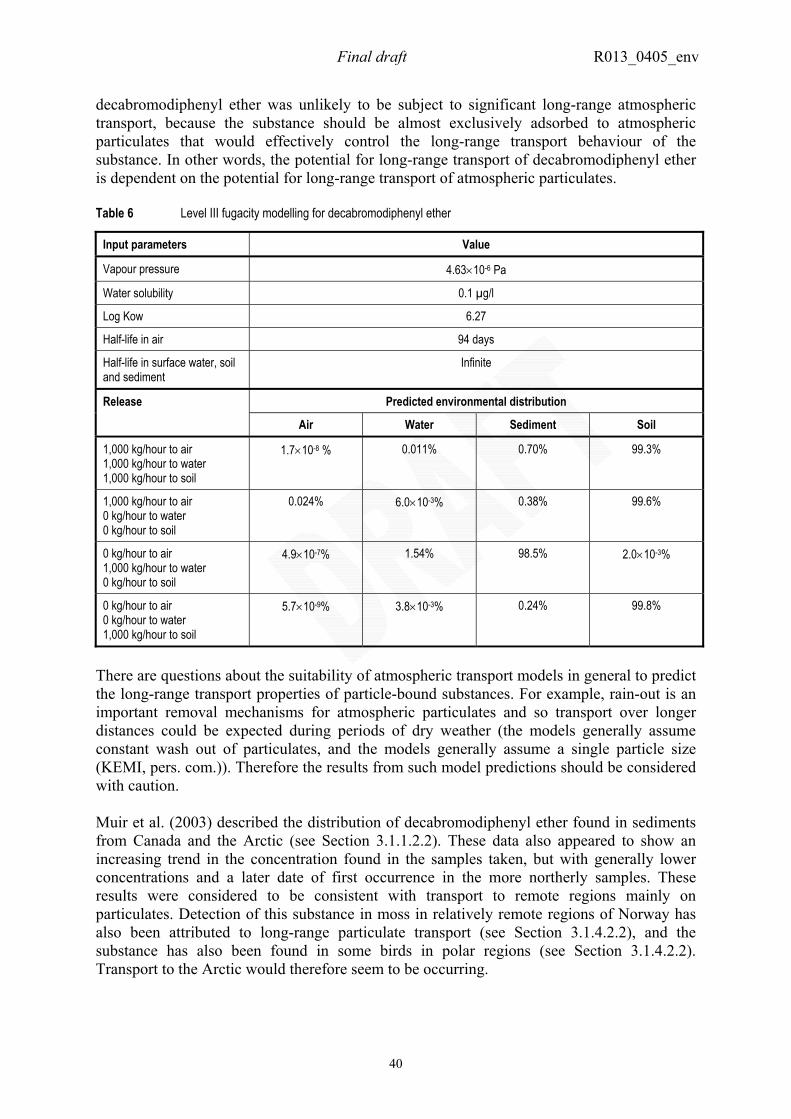
Final draft R013_0405_env
40
decabromodiphenyl ether was unlikely to be subject to significant long-range atmospheric transport, because the substance should be almost exclusively adsorbed to atmospheric particulates that would effectively control the long-range transport behaviour of the substance. In other words, the potential for long-range transport of decabromodiphenyl ether is dependent on the potential for long-range transport of atmospheric particulates. Table 6 Level III fugacity modelling for decabromodiphenyl ether
Input parameters Value
Vapour pressure 4.63×10⁻⁶ Pa
Water solubility 0.1 µg/l
Log Kow 6.27
Half-life in air 94 days
Half-life in surface water, soil and sediment
Infinite
Predicted environmental distribution Release
Air Water Sediment Soil
1,000 kg/hour to air 1,000 kg/hour to water 1,000 kg/hour to soil
1.7×10⁻⁸ % 0.011% 0.70% 99.3%
1,000 kg/hour to air 0 kg/hour to water 0 kg/hour to soil
0.024% 6.0×10⁻³% 0.38% 99.6%
0 kg/hour to air 1,000 kg/hour to water 0 kg/hour to soil
4.9×10⁻⁷% 1.54% 98.5% 2.0×10⁻³%
0 kg/hour to air 0 kg/hour to water 1,000 kg/hour to soil
5.7×10⁻⁹% 3.8×10⁻³% 0.24% 99.8%
There are questions about the suitability of atmospheric transport models in general to predict the long-range transport properties of particle-bound substances. For example, rain-out is an important removal mechanisms for atmospheric particulates and so transport over longer distances could be expected during periods of dry weather (the models generally assume constant wash out of particulates, and the models generally assume a single particle size (KEMI, pers. com.)). Therefore the results from such model predictions should be considered with caution. Muir et al. (2003) described the distribution of decabromodiphenyl ether found in sediments from Canada and the Arctic (see Section 3.1.1.2.2). These data also appeared to show an increasing trend in the concentration found in the samples taken, but with generally lower concentrations and a later date of first occurrence in the more northerly samples. These results were considered to be consistent with transport to remote regions mainly on particulates. Detection of this substance in moss in relatively remote regions of Norway has also been attributed to long-range particulate transport (see Section 3.1.4.2.2), and the substance has also been found in some birds in polar regions (see Section 3.1.4.2.2). Transport to the Arctic would therefore seem to be occurring.
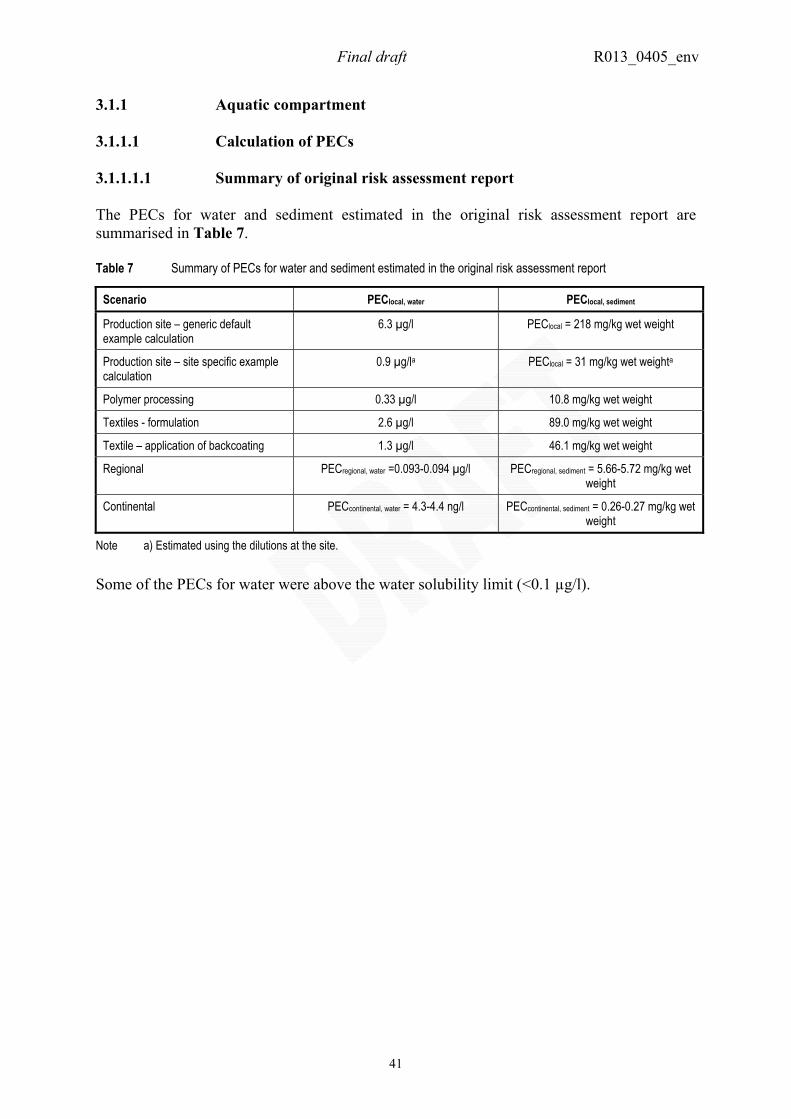
Final draft R013_0405_env
41
3.1.1 Aquatic compartment 3.1.1.1 Calculation of PECs 3.1.1.1.1 Summary of original risk assessment report The PECs for water and sediment estimated in the original risk assessment report are summarised in Table 7. Table 7 Summary of PECs for water and sediment estimated in the original risk assessment report
Scenario PEClocal, water PEClocal, sediment
Production site – generic default example calculation
6.3 µg/l PEClocal = 218 mg/kg wet weight
Production site – site specific example calculation
0.9 µg/la PEClocal = 31 mg/kg wet weighta
Polymer processing 0.33 µg/l 10.8 mg/kg wet weight
Textiles - formulation 2.6 µg/l 89.0 mg/kg wet weight
Textile – application of backcoating 1.3 µg/l 46.1 mg/kg wet weight
Regional PECregional, water =0.093-0.094 µg/l PECregional, sediment = 5.66-5.72 mg/kg wet weight
Continental PECcontinental, water = 4.3-4.4 ng/l PECcontinental, sediment = 0.26-0.27 mg/kg wet weight
Note a) Estimated using the dilutions at the site. Some of the PECs for water were above the water solubility limit (<0.1 µg/l).

Final draft R013_0405_env
42
3.1.1.1.2 Updated calculations The PECs for water, sediment and sewage treatment plant (STP), calculated using the updated emission estimates and the methods outlined in the new Technical Guidance Document, are summarised in Table 8. Table 8 Summary of updated PECs for water, sediment and STP
Scenario PEClocal, water PEClocal, sediment PECSTP
(effluent concentration)
Production site – generic default example calculation
6.2 µg/lb 213 mg/kg wet weight -
Production site – site specific example calculation
0.9 µg/la, b 31 mg/kg wet weighta 0.21-1.25 mg/l
Polymer processing 0.010 µg/l 0.35 mg/kg wet weight 7.9×10⁻⁵ mg/l
Polymers – recycling of electronic equipment
- - -
Textiles – formulation 0.036 µg/l 1.25 mg/kg wet weight 9.6×10⁻⁴ mg/l
Textile – application of backcoating
0.036 µg/l 1.25 mg/kg wet weight 9.6×10⁻⁴ mg/l
Regional PECregional, water = 7.8 ng/l PECregional, sediment = 0.48 mg/kg wet weight
-
Continental PECcontinental, water = 0.33 ng/l PECcontinental, sediment = 0.020 mg/kg wet weight
-
Note a) Estimated using the dilutions at the site. b) The concentrations estimated for production sites are above the water solubility of the substance and so should be treated with caution. The problem arises due to the high default emission factors that were used. It is not possible to refine the calculations using more reliable data since this stage of the life cycle no longer takes place in the EU.
3.1.1.2 Levels of decabromodiphenyl ether in water, sediment and waste
water treatment plants (WWTP) 3.1.1.2.1 Summary of original risk assessment report The levels of decabromodiphenyl ether in surface water are generally below the limit of detection of the methods used (generally <0.06-<2.5 µg/l). There were data showing that low levels of decabromodiphenyl ether are present in urban stormwater. In contrast to surface water, decabromodiphenyl ether had been found to be present in sediment samples, particularly those collected close to sources of release. The highest concentration measured was around 3.2 mg/kg dry weight, and sediment levels appear to be increasing in general. 3.1.1.2.2 Updated information Water levels The levels of decabromodiphenyl ether in marine water along the Dutch coast have been determined by Booij et al. (2000). The samples were collected using a semi-permeable membrane device (which samples the dissolved organic contaminants at rates that are proportional to the aqueous concentration). The concentration of decabromodiphenyl ether in the samples was determined by GC/MS with negative chemical ionisation (monitoring the
Final draft R013_0405_env
43
bromine ion at m/z 79 and 81 and also m/z 487) using a 25 m column (injector temperature 270oC and maximum oven temperature 320oC). The water samples were collected at one location in the Western Scheldt estuary (Hansweert) and at four locations along the Dutch coast. Sampling was carried out over 42 days in either January-March 1999 or October-November 1999. The concentrations of decabromodiphenyl ether were found to range between <0.1 pg/l to 1 pg/l in February and from 0.4 to 4 pg/l in October, with the highest concentrations being found at the sampling site in the Western Scheldt estuary. SFT (2004a) have provided details of recent and on-going monitoring studies in Norway and the Arctic region. One of these studies will investigate the levels of decabromodiphenyl ether in fifteen large volume samples (each around 100 litres) from the Kara Sea (Yeanisei River estuary). The results from this study are expected to be available in Spring 2004. Sediment levels The levels of decabromodiphenyl ether in sediments from 19 locations in and around the Scheldt basin have been reported by de Boer et al. (2002a). The samples were collected during 2001. Decabromodiphenyl ether was found in 17 out of the 19 samples analysed (detection limit was 0.1 µg/kg wet weight) at concentrations of between 0.4 and 440 µg/kg wet weight (0.7-700 µg/kg dry weight). Vethaak et al. (2002) also found decabromodiphenyl ether to be present at a concentration of <9.0-4,600 µg/kg in samples of suspended sediment and <9.0-510 µg/kg dry weight in samples of sediment collected in various water systems in the Netherlands. The highest levels found were in samples from the Scheldt. SFT (2002) carried out a screening study for the concentrations of decabromodiphenyl ether in sediments associated with the effluents from waste dumps in Norway. In all, twelve samples from six locations were analysed and decabromodiphenyl ether was found to be present in all twelve samples at a concentration of 0.49-91 µg/kg wet weight. The time trend in the levels of decabromodiphenyl ether in sediment cores from Drammenfjord (Norway), the western Wadden Sea and the freshwater Lake Woserin (Germany) has been studied by Zegers et al. (2003) and Zegers et al. (2000). Decabromodiphenyl ether was found to be present in the sediment layers corresponding to the late 1970s onwards, but were found to have decreased from the maximum in the most recent layers (corresponding to around 1999). Six marine and six freshwater sediment samples from Denmark have been analysed for the presence of decabromodiphenyl ether (Christensen and Platz, 2001). The sediment depth sampled was 0-2 cm for the marine samples and 0-10 cm for the fresh water samples (five lake samples and 1 river sample), and the samples were collected during autumn 2000. The detection limit of the method used was around 0.9-1.3 µg/kg dry weight. Decabromodiphenyl ether was determined to be present in five out of the six fresh water samples at a concentration of 2.1-8.1 µg/kg dry weight, and in five out of the six marine samples at a concentration of 1.6-21.5 µg/kg dry weight. The highest concentration was found in the sample from Copenhagen harbour The paper indicated that large matrix effects were seen in the analysis resulting in typical recoveries of between 150-200%, and so the reported values may overestimate the actual concentration. The levels of decabromodiphenyl ether in sediments from the Danube River have been determined (Sawal, 2002). The samples were taken in Summer 2001 and decabromodiphenyl ether was the dominant polybrominated diphenyl ether congener present (representing
Final draft R013_0405_env
44
between 40% and 99% of the total). In all, 33 samples were analysed and decabromodiphenyl ether was found to be present in most samples with the median value (of 26 samples) being 3.3 µg/kg dry weight and the maximum value found being 83.8 µg/kg dry weight. It was also noted that the samples with higher levels of decabromodiphenyl ether were not necessarily accompanied by higher levels of tetra- and pentabromodiphenyl ether. SFT (2004a) have provided details of recent and on-going monitoring studies in Norway and the Arctic region. Studies are underway on the levels of decabromodiphenyl ether in marine sediments and freshwater sediments from respectively six and four locations in the southern, central and northern parts of Norway. The results of these studies are expected to be available in Spring 2004. A further study has investigated the levels of decabromodiphenyl ether in marine sediments from ten locations in the Kola Bay and three locations in the Western Litsa Bay (Barents Sea, Russia). Decabromodiphenyl ether was not detected in any of the samples analysed in this study. WWTP and sludge levels Vethaak et al. (2002) found that decabromodiphenyl ether was present in the suspended particulates in untreated municipal waste water, the effluent from municipal sewage treatment plants and in industrial waste water in the Netherlands. The concentrations found were in the range <20-140 µg/kg dry weight (total of ten samples; median value 24 µg/kg dry weight) in the untreated municipal waste water, 310-920 µg/kg dry weight (three samples; median value 350 µg/kg dry weight) in the sewage treatment plant effluent and <0.52-200 µg/kg dry weight (three samples; median 123 µg/kg dry weight) in the industrial waste water. The levels of decabromodiphenyl ether in 114 sewage sludge samples taken from 22 municipal waste water treatment plants in Sweden have been reported by Öberg et al. (2002). The levels found were in the range not detected (<0.6 µg/kg wet weight) to 390 µg/kg wet weight, with the median level being 11 µg/kg wet weight. The samples were collected between October 1999 and September 2000. The samples with the highest concentration of decabromodiphenyl ether were collected from a waste water treatment plant that had possible contributions from the textile industry. De Boer et al. (2002a) investigated the concentrations of decabromodiphenyl ether in the influent, effluent and sewage sludge from ten sewage treatment plants in the Netherlands. The levels in influent and effluent refer to the concentration of decabromodiphenyl ether present on the suspended matter present. The results are summarised in Table 9. The levels of decabromodiphenyl ether in landfill leachate (before treatment) and sewage sludge from treatment of the leachate have been measured at nine landfills in the Netherlands (de Boer et al., 2002a). Decabromodiphenyl ether was found at concentrations of 230 and 420 µg/kg dry weight in solids from leachate water in two out of the nine leachate water samples analysed but was not detected (detection limit 0.2-0.4 µg/kg dry weight) in sewage sludge samples from two of the sites.
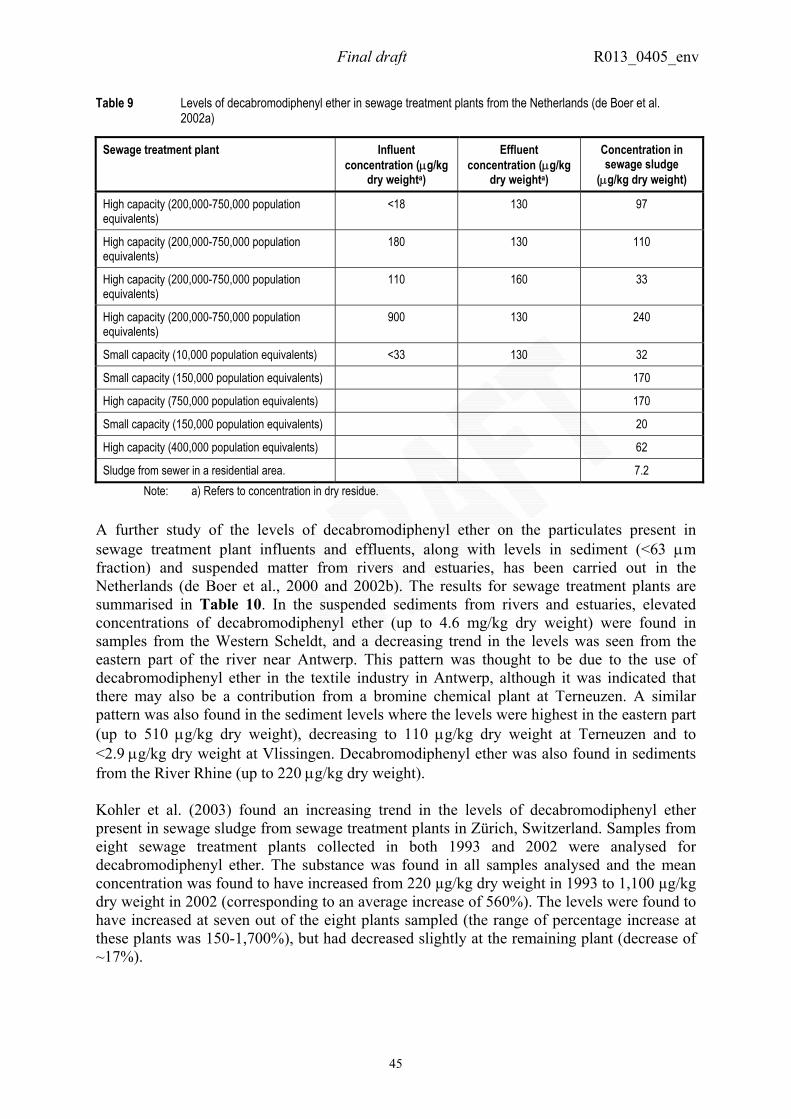
Final draft R013_0405_env
45
Table 9 Levels of decabromodiphenyl ether in sewage treatment plants from the Netherlands (de Boer et al. 2002a)
Sewage treatment plant Influent concentration (µg/kg
dry weighta)
Effluent concentration (µg/kg
dry weighta)
Concentration in sewage sludge
(µg/kg dry weight)
High capacity (200,000-750,000 population equivalents)
<18 130 97
High capacity (200,000-750,000 population equivalents)
180 130 110
High capacity (200,000-750,000 population equivalents)
110 160 33
High capacity (200,000-750,000 population equivalents)
900 130 240
Small capacity (10,000 population equivalents) <33 130 32
Small capacity (150,000 population equivalents) 170
High capacity (750,000 population equivalents) 170
Small capacity (150,000 population equivalents) 20
High capacity (400,000 population equivalents) 62
Sludge from sewer in a residential area. 7.2 Note: a) Refers to concentration in dry residue.
A further study of the levels of decabromodiphenyl ether on the particulates present in sewage treatment plant influents and effluents, along with levels in sediment (<63 µm fraction) and suspended matter from rivers and estuaries, has been carried out in the Netherlands (de Boer et al., 2000 and 2002b). The results for sewage treatment plants are summarised in Table 10. In the suspended sediments from rivers and estuaries, elevated concentrations of decabromodiphenyl ether (up to 4.6 mg/kg dry weight) were found in samples from the Western Scheldt, and a decreasing trend in the levels was seen from the eastern part of the river near Antwerp. This pattern was thought to be due to the use of decabromodiphenyl ether in the textile industry in Antwerp, although it was indicated that there may also be a contribution from a bromine chemical plant at Terneuzen. A similar pattern was also found in the sediment levels where the levels were highest in the eastern part (up to 510 µg/kg dry weight), decreasing to 110 µg/kg dry weight at Terneuzen and to <2.9 µg/kg dry weight at Vlissingen. Decabromodiphenyl ether was also found in sediments from the River Rhine (up to 220 µg/kg dry weight). Kohler et al. (2003) found an increasing trend in the levels of decabromodiphenyl ether present in sewage sludge from sewage treatment plants in Zürich, Switzerland. Samples from eight sewage treatment plants collected in both 1993 and 2002 were analysed for decabromodiphenyl ether. The substance was found in all samples analysed and the mean concentration was found to have increased from 220 µg/kg dry weight in 1993 to 1,100 µg/kg dry weight in 2002 (corresponding to an average increase of 560%). The levels were found to have increased at seven out of the eight plants sampled (the range of percentage increase at these plants was 150-1,700%), but had decreased slightly at the remaining plant (decrease of ~17%).
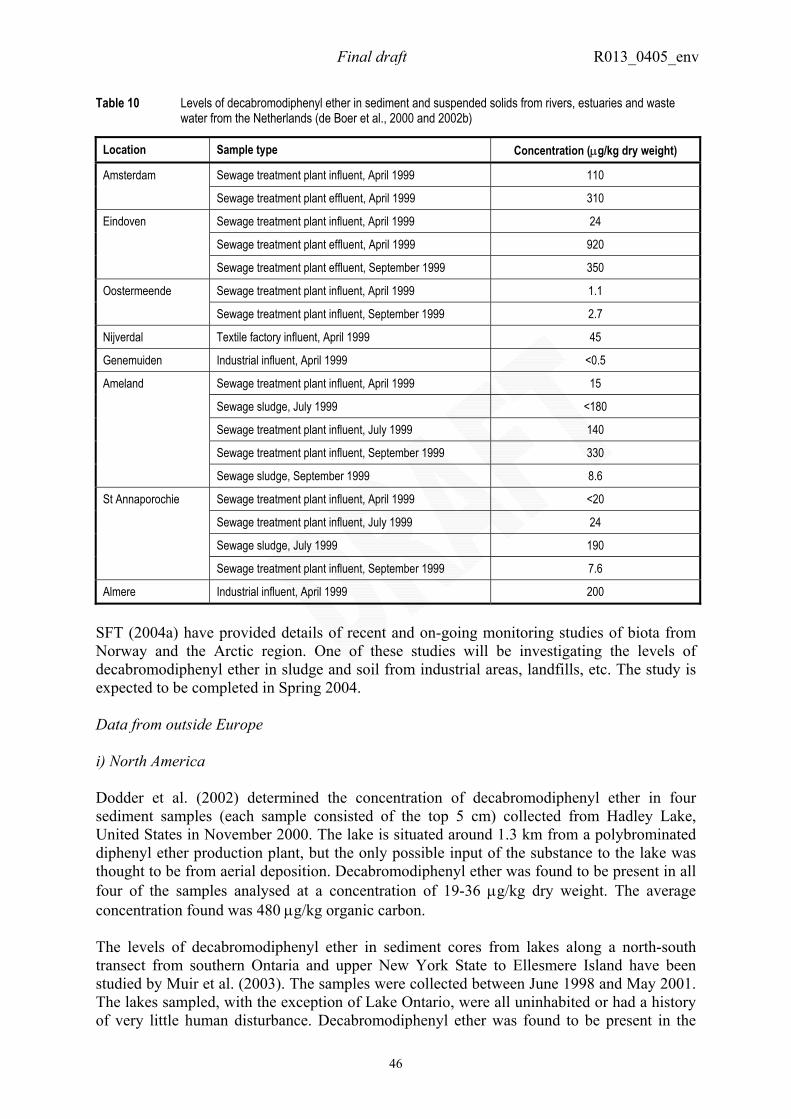
Final draft R013_0405_env
46
Table 10 Levels of decabromodiphenyl ether in sediment and suspended solids from rivers, estuaries and waste water from the Netherlands (de Boer et al., 2000 and 2002b)
Location Sample type Concentration (µg/kg dry weight)
Sewage treatment plant influent, April 1999 110 Amsterdam
Sewage treatment plant effluent, April 1999 310
Sewage treatment plant influent, April 1999 24
Sewage treatment plant effluent, April 1999 920
Eindoven
Sewage treatment plant effluent, September 1999 350
Sewage treatment plant influent, April 1999 1.1 Oostermeende
Sewage treatment plant influent, September 1999 2.7
Nijverdal Textile factory influent, April 1999 45
Genemuiden Industrial influent, April 1999 <0.5
Sewage treatment plant influent, April 1999 15
Sewage sludge, July 1999 <180
Sewage treatment plant influent, July 1999 140
Sewage treatment plant influent, September 1999 330
Ameland
Sewage sludge, September 1999 8.6
Sewage treatment plant influent, April 1999 <20
Sewage treatment plant influent, July 1999 24
Sewage sludge, July 1999 190
St Annaporochie
Sewage treatment plant influent, September 1999 7.6
Almere Industrial influent, April 1999 200
SFT (2004a) have provided details of recent and on-going monitoring studies of biota from Norway and the Arctic region. One of these studies will be investigating the levels of decabromodiphenyl ether in sludge and soil from industrial areas, landfills, etc. The study is expected to be completed in Spring 2004. Data from outside Europe i) North America Dodder et al. (2002) determined the concentration of decabromodiphenyl ether in four sediment samples (each sample consisted of the top 5 cm) collected from Hadley Lake, United States in November 2000. The lake is situated around 1.3 km from a polybrominated diphenyl ether production plant, but the only possible input of the substance to the lake was thought to be from aerial deposition. Decabromodiphenyl ether was found to be present in all four of the samples analysed at a concentration of 19-36 µg/kg dry weight. The average concentration found was 480 µg/kg organic carbon. The levels of decabromodiphenyl ether in sediment cores from lakes along a north-south transect from southern Ontaria and upper New York State to Ellesmere Island have been studied by Muir et al. (2003). The samples were collected between June 1998 and May 2001. The lakes sampled, with the exception of Lake Ontario, were all uninhabited or had a history of very little human disturbance. Decabromodiphenyl ether was found to be present in the
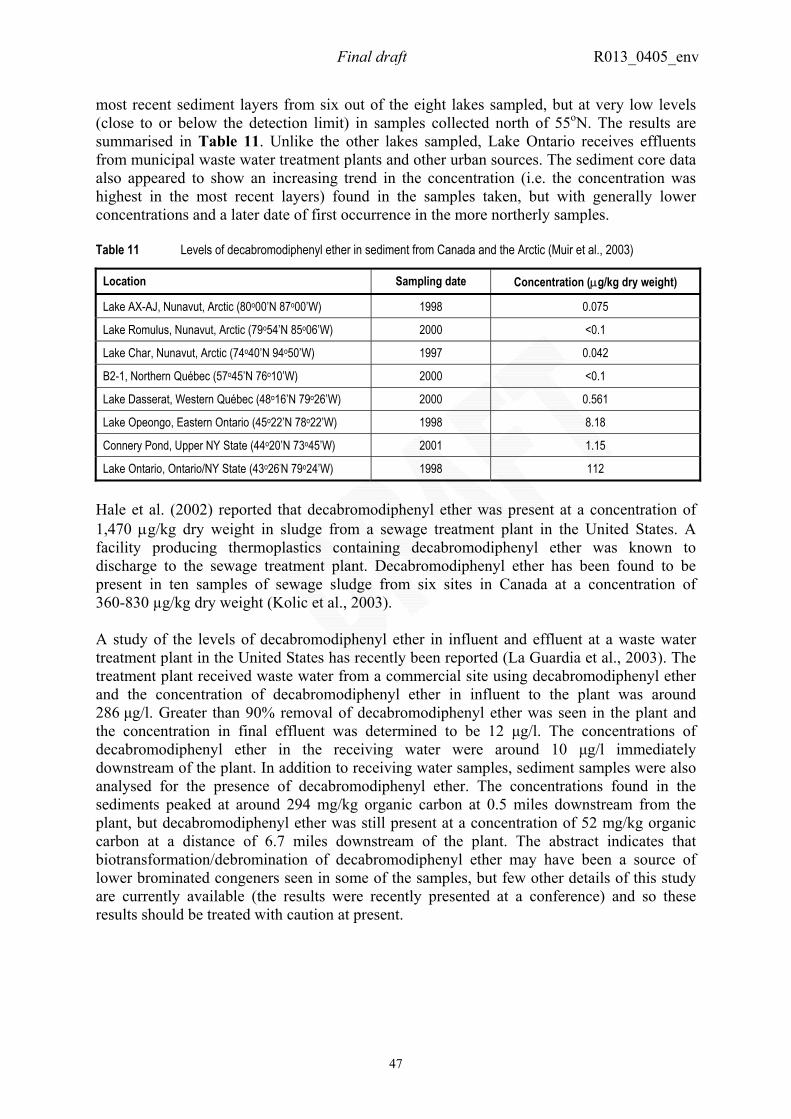
Final draft R013_0405_env
47
most recent sediment layers from six out of the eight lakes sampled, but at very low levels (close to or below the detection limit) in samples collected north of 55oN. The results are summarised in Table 11. Unlike the other lakes sampled, Lake Ontario receives effluents from municipal waste water treatment plants and other urban sources. The sediment core data also appeared to show an increasing trend in the concentration (i.e. the concentration was highest in the most recent layers) found in the samples taken, but with generally lower concentrations and a later date of first occurrence in the more northerly samples. Table 11 Levels of decabromodiphenyl ether in sediment from Canada and the Arctic (Muir et al., 2003)
Location Sampling date Concentration (µg/kg dry weight)
Lake AX-AJ, Nunavut, Arctic (80o00’N 87o00’W) 1998 0.075
Lake Romulus, Nunavut, Arctic (79o54’N 85o06’W) 2000 <0.1
Lake Char, Nunavut, Arctic (74o40’N 94o50’W) 1997 0.042
B2-1, Northern Québec (57o45’N 76o10’W) 2000 <0.1
Lake Dasserat, Western Québec (48o16’N 79o26’W) 2000 0.561
Lake Opeongo, Eastern Ontario (45o22’N 78o22’W) 1998 8.18
Connery Pond, Upper NY State (44o20’N 73o45’W) 2001 1.15
Lake Ontario, Ontario/NY State (43o26’N 79o24’W) 1998 112
Hale et al. (2002) reported that decabromodiphenyl ether was present at a concentration of 1,470 µg/kg dry weight in sludge from a sewage treatment plant in the United States. A facility producing thermoplastics containing decabromodiphenyl ether was known to discharge to the sewage treatment plant. Decabromodiphenyl ether has been found to be present in ten samples of sewage sludge from six sites in Canada at a concentration of 360-830 µg/kg dry weight (Kolic et al., 2003). A study of the levels of decabromodiphenyl ether in influent and effluent at a waste water treatment plant in the United States has recently been reported (La Guardia et al., 2003). The treatment plant received waste water from a commercial site using decabromodiphenyl ether and the concentration of decabromodiphenyl ether in influent to the plant was around 286 µg/l. Greater than 90% removal of decabromodiphenyl ether was seen in the plant and the concentration in final effluent was determined to be 12 µg/l. The concentrations of decabromodiphenyl ether in the receiving water were around 10 µg/l immediately downstream of the plant. In addition to receiving water samples, sediment samples were also analysed for the presence of decabromodiphenyl ether. The concentrations found in the sediments peaked at around 294 mg/kg organic carbon at 0.5 miles downstream from the plant, but decabromodiphenyl ether was still present at a concentration of 52 mg/kg organic carbon at a distance of 6.7 miles downstream of the plant. The abstract indicates that biotransformation/debromination of decabromodiphenyl ether may have been a source of lower brominated congeners seen in some of the samples, but few other details of this study are currently available (the results were recently presented at a conference) and so these results should be treated with caution at present.
Final draft R013_0405_env
48
ii) Asia Choi et al. (2003) investigated the levels of total polybrominated diphenyl ethers in sediment cores from Tokyo Bay, Japan. Decabromodiphenyl ether was found to be the major congener found in the samples and the concentration of total polybrominated diphenyl ethers (the concentrations of individual congeners were not given) were found to be very low in cores corresponding to 1904-1941. In the cores from 1946-1948 onwards, a rapid increase in the concentrations of total polybrominated diphenyl ethers was seen, peaking at around 78.1 µg/kg dry weight in 1992-1993, with the level found in the core for 1998-1999 being similar at around 76.6 µg/kg dry weight. Comparing the trend found with the historical usage of decabromodiphenyl ether in Japan, the authors of the paper concluded that there was a lag of around 10 years between the peak use and deposition in the sediments. Ohta et al. (2002) determined the concentration of decabromodiphenyl ether in sediment samples collected from six locations in the coastal area around Osaka Bay, Japan. The samples were collected in 1999 and decabromodiphenyl ether was found to be present in all six samples at a concentration in the range 7.8-350 µg/kg dry weight. The highest level was found in a sample from Hokkou collected in an area with many chemical factories. Decabromodiphenyl ether was found to be the dominant polybrominated diphenyl ether congener present in all samples (accounting for >96% of the total). 3.1.1.2.3 Comparison of predicted and measured levels The new data indicate that decabromodiphenyl ether is present in sediments from a number of locations, and has been found to be present in the suspended particulate phase in the influent and effluent from several waste water treatment plants. It is difficult to compare the measured levels directly with the PECs as the actual source of decabromodiphenyl ether in the samples is not always known. The predicted local and regional sediment concentrations for decabromodiphenyl ether are around 350-1,250 µg/kg wet weight and 480 µg/kg wet weight respectively. The concentrations actually found in sediment are generally of the order of up to a few hundred µg/kg dry weight, with higher concentrations of up to a few mg/kg dry weight being found in some surveys (see original risk assessment report). The estimated PECs appear to be in reasonable agreement (making allowance for a conversion from wet weight to dry weight), but towards the upper end, of the measured levels. The occurrence of decabromodiphenyl ether in the influent and sludge at municipal waste water treatment plants is suggestive of an urban source of decabromodiphenyl ether, possibly from products in use (although it is possible that industrial sources could also contribute to the input to some municipal waste water treatment plants). 3.1.2 Terrestrial compartment 3.1.2.1 Predicted concentrations 3.1.2.1.1 Summary of original risk assessment report The estimated PECs for soil in the original risk assessment are summarised in Table 12.
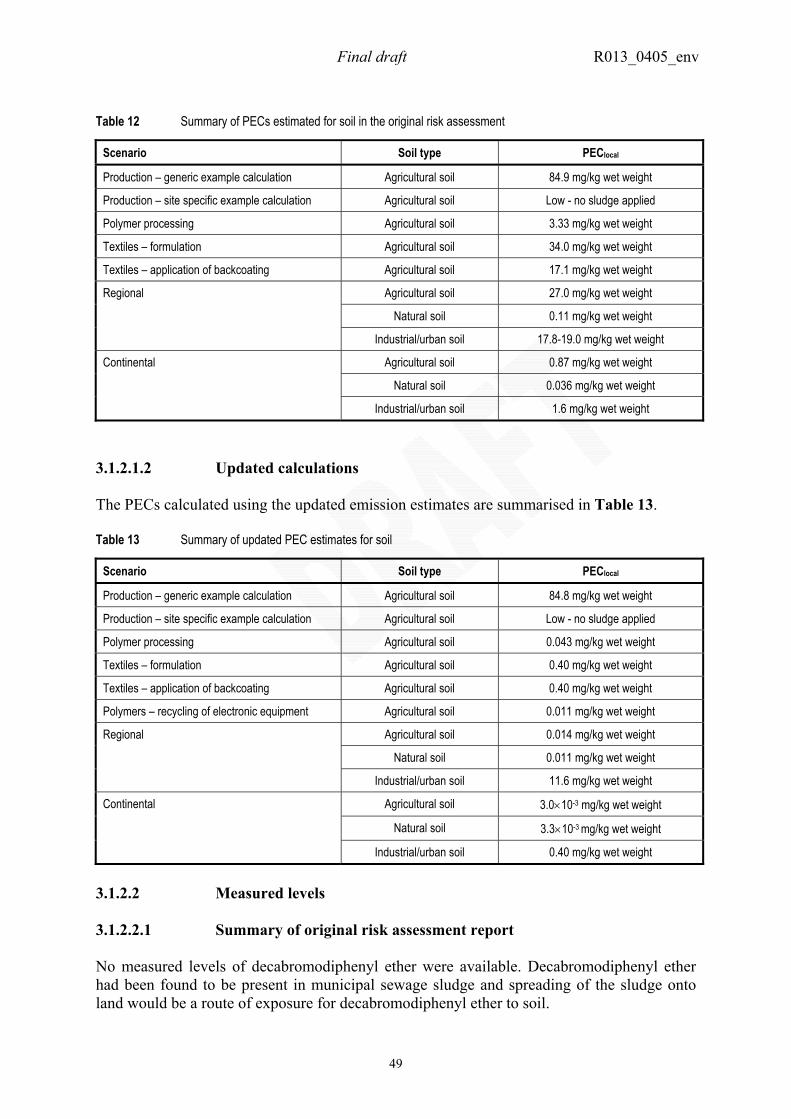
Final draft R013_0405_env
49
Table 12 Summary of PECs estimated for soil in the original risk assessment
Scenario Soil type PEClocal
Production – generic example calculation Agricultural soil 84.9 mg/kg wet weight
Production – site specific example calculation Agricultural soil Low - no sludge applied
Polymer processing Agricultural soil 3.33 mg/kg wet weight
Textiles – formulation Agricultural soil 34.0 mg/kg wet weight
Textiles – application of backcoating Agricultural soil 17.1 mg/kg wet weight
Agricultural soil 27.0 mg/kg wet weight
Natural soil 0.11 mg/kg wet weight
Regional
Industrial/urban soil 17.8-19.0 mg/kg wet weight
Agricultural soil 0.87 mg/kg wet weight
Natural soil 0.036 mg/kg wet weight
Continental
Industrial/urban soil 1.6 mg/kg wet weight
3.1.2.1.2 Updated calculations The PECs calculated using the updated emission estimates are summarised in Table 13. Table 13 Summary of updated PEC estimates for soil
Scenario Soil type PEClocal
Production – generic example calculation Agricultural soil 84.8 mg/kg wet weight
Production – site specific example calculation Agricultural soil Low - no sludge applied
Polymer processing Agricultural soil 0.043 mg/kg wet weight
Textiles – formulation Agricultural soil 0.40 mg/kg wet weight
Textiles – application of backcoating Agricultural soil 0.40 mg/kg wet weight
Polymers – recycling of electronic equipment Agricultural soil 0.011 mg/kg wet weight
Agricultural soil 0.014 mg/kg wet weight
Natural soil 0.011 mg/kg wet weight
Regional
Industrial/urban soil 11.6 mg/kg wet weight
Agricultural soil 3.0×10⁻³ mg/kg wet weight
Natural soil 3.3×10⁻³ mg/kg wet weight
Continental
Industrial/urban soil 0.40 mg/kg wet weight
3.1.2.2 Measured levels 3.1.2.2.1 Summary of original risk assessment report No measured levels of decabromodiphenyl ether were available. Decabromodiphenyl ether had been found to be present in municipal sewage sludge and spreading of the sludge onto land would be a route of exposure for decabromodiphenyl ether to soil.
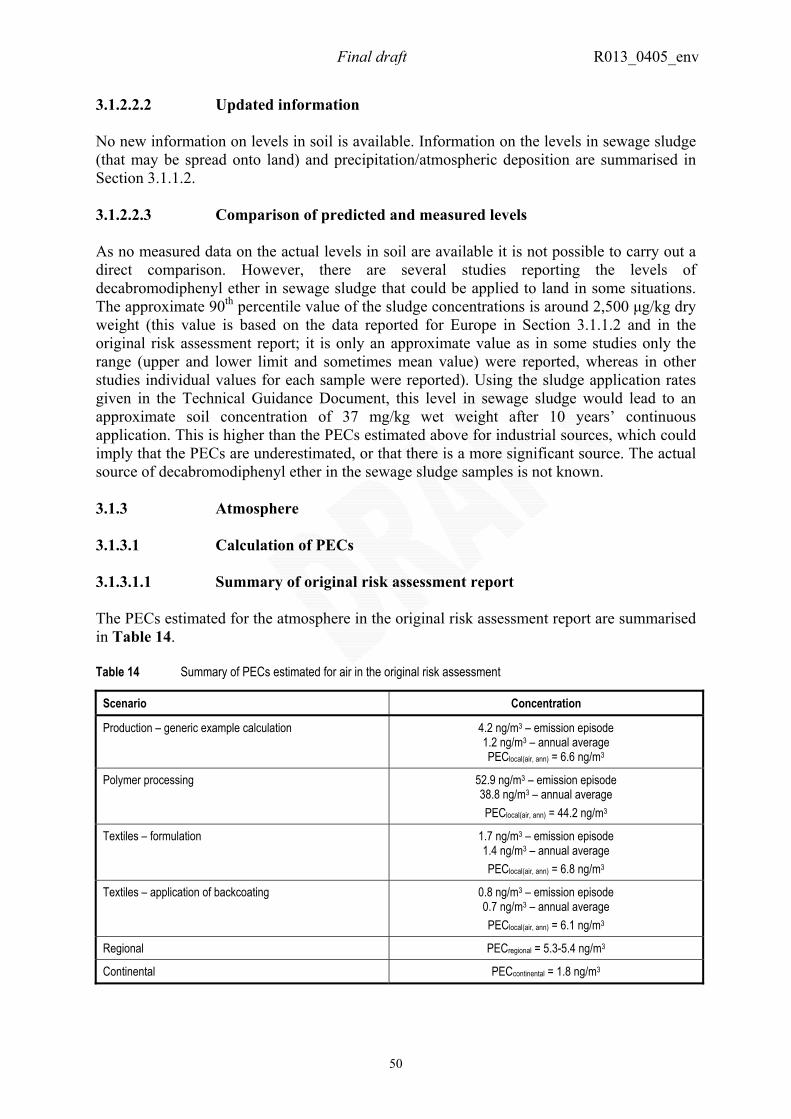
Final draft R013_0405_env
50
3.1.2.2.2 Updated information No new information on levels in soil is available. Information on the levels in sewage sludge (that may be spread onto land) and precipitation/atmospheric deposition are summarised in Section 3.1.1.2. 3.1.2.2.3 Comparison of predicted and measured levels As no measured data on the actual levels in soil are available it is not possible to carry out a direct comparison. However, there are several studies reporting the levels of decabromodiphenyl ether in sewage sludge that could be applied to land in some situations. The approximate 90th percentile value of the sludge concentrations is around 2,500 µg/kg dry weight (this value is based on the data reported for Europe in Section 3.1.1.2 and in the original risk assessment report; it is only an approximate value as in some studies only the range (upper and lower limit and sometimes mean value) were reported, whereas in other studies individual values for each sample were reported). Using the sludge application rates given in the Technical Guidance Document, this level in sewage sludge would lead to an approximate soil concentration of 37 mg/kg wet weight after 10 years’ continuous application. This is higher than the PECs estimated above for industrial sources, which could imply that the PECs are underestimated, or that there is a more significant source. The actual source of decabromodiphenyl ether in the sewage sludge samples is not known. 3.1.3 Atmosphere 3.1.3.1 Calculation of PECs 3.1.3.1.1 Summary of original risk assessment report The PECs estimated for the atmosphere in the original risk assessment report are summarised in Table 14. Table 14 Summary of PECs estimated for air in the original risk assessment
Scenario Concentration
Production – generic example calculation 4.2 ng/m3 – emission episode 1.2 ng/m3 – annual average PEClocal(air, ann) = 6.6 ng/m3
Polymer processing 52.9 ng/m3 – emission episode 38.8 ng/m3 – annual average PEClocal(air, ann) = 44.2 ng/m3
Textiles – formulation 1.7 ng/m3 – emission episode 1.4 ng/m3 – annual average PEClocal(air, ann) = 6.8 ng/m3
Textiles – application of backcoating 0.8 ng/m3 – emission episode 0.7 ng/m3 – annual average PEClocal(air, ann) = 6.1 ng/m3
Regional PECregional = 5.3-5.4 ng/m3
Continental PECcontinental = 1.8 ng/m3
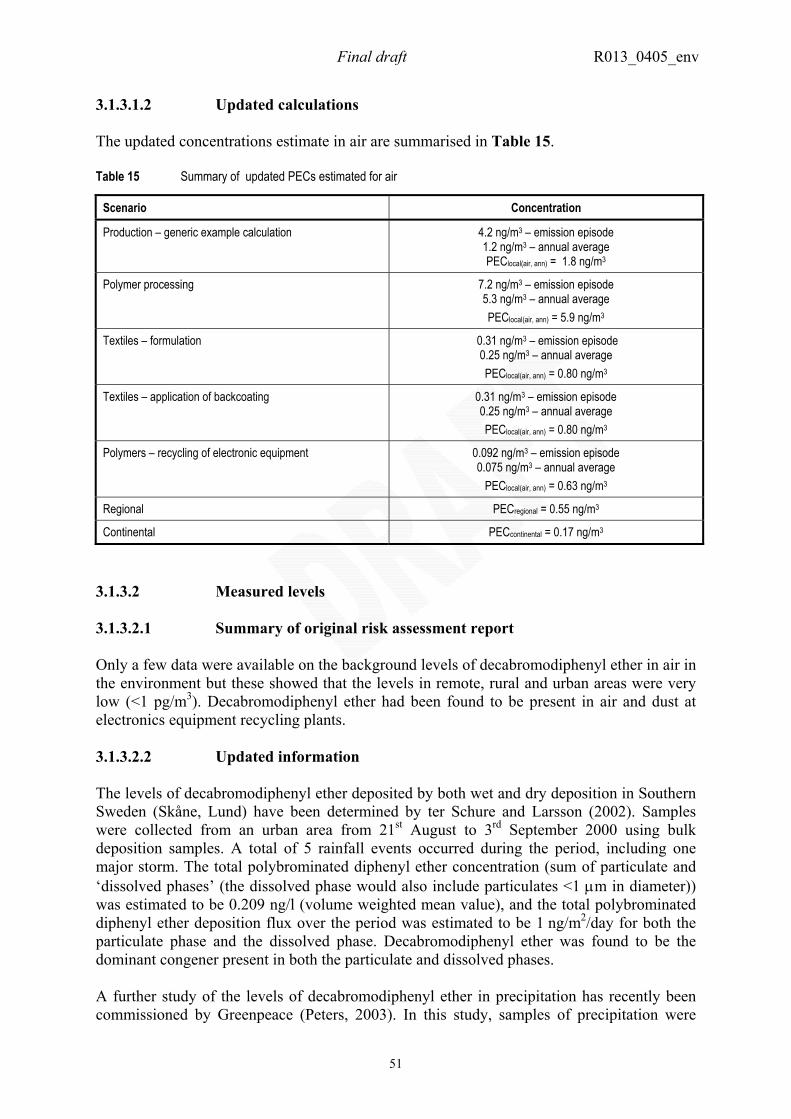
Final draft R013_0405_env
51
3.1.3.1.2 Updated calculations The updated concentrations estimate in air are summarised in Table 15. Table 15 Summary of updated PECs estimated for air
Scenario Concentration
Production – generic example calculation 4.2 ng/m3 – emission episode 1.2 ng/m3 – annual average PEClocal(air, ann) = 1.8 ng/m3
Polymer processing 7.2 ng/m3 – emission episode 5.3 ng/m3 – annual average PEClocal(air, ann) = 5.9 ng/m3
Textiles – formulation 0.31 ng/m3 – emission episode 0.25 ng/m3 – annual average PEClocal(air, ann) = 0.80 ng/m3
Textiles – application of backcoating 0.31 ng/m3 – emission episode 0.25 ng/m3 – annual average PEClocal(air, ann) = 0.80 ng/m3
Polymers – recycling of electronic equipment 0.092 ng/m3 – emission episode 0.075 ng/m3 – annual average
PEClocal(air, ann) = 0.63 ng/m3
Regional PECregional = 0.55 ng/m3
Continental PECcontinental = 0.17 ng/m3
3.1.3.2 Measured levels 3.1.3.2.1 Summary of original risk assessment report Only a few data were available on the background levels of decabromodiphenyl ether in air in the environment but these showed that the levels in remote, rural and urban areas were very low (<1 pg/m3). Decabromodiphenyl ether had been found to be present in air and dust at electronics equipment recycling plants. 3.1.3.2.2 Updated information The levels of decabromodiphenyl ether deposited by both wet and dry deposition in Southern Sweden (Skåne, Lund) have been determined by ter Schure and Larsson (2002). Samples were collected from an urban area from 21st August to 3rd September 2000 using bulk deposition samples. A total of 5 rainfall events occurred during the period, including one major storm. The total polybrominated diphenyl ether concentration (sum of particulate and ‘dissolved phases’ (the dissolved phase would also include particulates <1 µm in diameter)) was estimated to be 0.209 ng/l (volume weighted mean value), and the total polybrominated diphenyl ether deposition flux over the period was estimated to be 1 ng/m2/day for both the particulate phase and the dissolved phase. Decabromodiphenyl ether was found to be the dominant congener present in both the particulate and dissolved phases. A further study of the levels of decabromodiphenyl ether in precipitation has recently been commissioned by Greenpeace (Peters, 2003). In this study, samples of precipitation were
Final draft R013_0405_env
52
collected from 47 locations throughout the Netherlands, two locations in Germany and one location in Belgium over a four-weekly period. The samples were collected using open sample collectors (which were unable to distinguish between wet- and dry deposition) and so the findings represent the total deposition rather than from precipitation alone. Decabromodiphenyl ether was not found in any of the fifty samples analysed. The detection limit of the method used was, however, relatively high (at 25 ng/l) compared with the levels found by ter Schure and Larsson (2002) above. Greenpeace (2003) has carried out a survey of the levels of decabromodiphenyl ether in dust samples collected from around 70 households in the United Kingdom. The samples were collected between the 30th October and 8th November 2002 from ten regional areas, and pooled samples (from 7 households in each region) were analysed for the presence of decabromodiphenyl ether. The substance was found to be present in all ten pooled samples at a concentration of 3.8 to 19.9 mg/kg (ppm), with a mean value of 9.8 mg/kg. In addition, a single dust sample from a household in Denmark and a single dust sample from a household in Finland were found to contain decabromodiphenyl ether at a concentration of 0.26 and 0.1 mg/kg respectively. The results showed that decabromodiphenyl ether is a widespread contaminant of the indoor environment. Although the sample size is limited (and different collection methods were used for samples from Denmark and Finland), the levels in dust in the United Kingdom appear to be higher than those from the other countries sampled, possibly reflecting the different patterns of use of the substance. A similar study of household dust levels has been reported by Knoth et al. (2003). In this study dust from vacuum cleaner bags was collected from 40 households in Germany in either May-September 2001 or August 2002-January 2003. Polybrominated diphenyl ethers were found to be present in all 40 samples. Decabromodiphenyl ether was present in 39 samples and was the dominant congener found in 35 of the samples. The range of decabromodiphenyl ether concentrations found was 18.6 to 19,100 µg/kg, with the mean and 90th percentile concentration being 980 and 969 µg/kg respectively. The highest level of decabromodiphenyl ether was associated with dust from a mattress. The report concluded that abrasion of particles from polyurethane foam or textile backcoatings appeared to be an important source of polybrominated diphenyl ethers in the dusts sampled. The levels of decabromodiphenyl ether in indoor air have been determined at a plant for recycling electronic equipment, a factory for assembling circuit boards, a facility for repairing computers, a computer teaching hall and offices containing computers in Sweden (Sjödin et al., 2001a). At the electronic equipment recycling plant samples were taken from two locations, the dismantling hall and the shredder room. The concentration found in the dismantling hall was in the range 12 to 70 ng/m3 (mean level in twelve samples was 36 ng/m3). The concentration in the shredder room was found to be around 150-200 ng/m3 in two samples collected when plastic containing brominated flame retardants was being shredded and around 57-58 ng/m3 in two samples collected when plastic that didn’t contain brominated flame retardants was being shredded. Decabromodiphenyl ether was also found in air at the other locations investigated. The concentrations found were <0.04-0.32 ng/m3 (mean level in six samples 0.22 ng/m3) at the circuit board factory, <0.04-0.087 ng/m3 (mean level in four samples 0.083 ng/m3) in offices with computers, <0.04-0.093 ng/m3 in two samples at the computer repair facility and <0.04-0.17 ng/m3 in two samples at the computer teaching hall. Decabromodiphenyl ether was not detected (<0.04 ng/m3) in two samples of outdoor air from a suburban area of Stockholm.
Final draft R013_0405_env
53
Tollbäck et al. (2003) reported decabromodiphenyl ether to be present at a concentration of 33.3 ng/m3 in air at an electronics dismantling facility. Data from outside Europe i) North America Butt et al. (2003) have recently sampled the levels of polybrominated diphenyl ethers present in organic surface films present on window surfaces from buildings in Ontario. The composition of the organic film that builds up on building surfaces is thought to be representative of the air constituents to which the building is exposed. Samples of organic surface films were collected from nine exterior window surfaces and five interior window surfaces during July and August 2001. Seven of the sampling sites were from an urban area of Toronto, Ontario and the two remaining sites were considered to be suburban and rural respectively. The film growth period was unknown but in all cases was thought to be longer than four months. The samples were analysed for a total of 41 polybrominated diphenyl ethers (including decabromodiphenyl ether). The total amounts of polybrominated diphenyl ethers found on the external window surfaces were in the range 2.71-38.8 ng/m2 for urban areas (mean 10.9 ng/m2) compared to 1.09 ng/m2 for the suburban sample and 0.56 ng/m2 for the rural sample. The levels found in the interior samples were consistently higher than the external samples by a factor of 1.5 to 20 times. The highest levels were found at an electronics recycling facility where the level in the interior film (754 ng/m2) was around 20 times higher than in the exterior film (38.7 ng/m2) at the site. The polybrominated diphenyl ether congener profiles were reported to be similar in all samples analysed with decabromodiphenyl ether accounting for 17-77% (geometric mean 49%) of the total polybrominated diphenyl ethers found. The authors concluded that indoor urban sources of polybrominated diphenyl ethers were responsible for the pattern seen. ii) Asia The levels of decabromodiphenyl ether in air samples collected from the Osaka district in Japan have been reported (Ohta et al., 2002). The samples were collected at the athletics field of Setsunan University in 2001 and the level of decabromodiphenyl ether found was 100 pg/m3 in a sample collected in spring, 330 pg/m3 in a sample collected in summer, 200 pg/m3 in a sample collected in autumn and 340 pg/m3 in a sample collected in winter. Decabromodiphenyl ether was found to be the dominant polybrominated diphenyl ether congener present in all samples. 3.1.3.2.3 Comparison of predicted and measured levels The predicted concentrations in air are all very low - up to around 6 ng/m3 for local sources and 0.55 ng/m3 for regional sources. There are few measured data available with which to compare these PECs, but the levels found in urban air in Japan (up to 0.34 ng/m3) are similar to the predicted regional concentrations. The predicted air concentration at an electronic equipment recycling plant is around 0.64 ng/m3. The levels measured in air inside such plants are sometimes higher than this but it should be noted that the air inside the plant may be treated (e.g. filtered) prior to release, and will certainly be diluted on entering the environment.
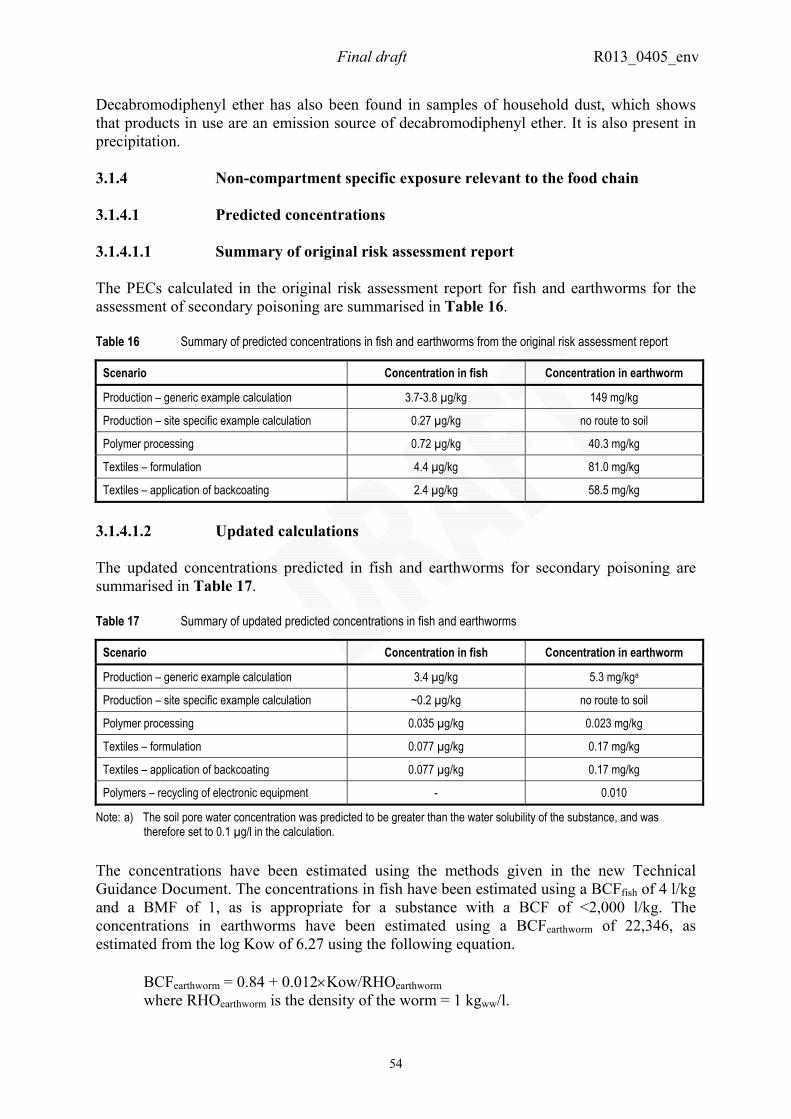
Final draft R013_0405_env
54
Decabromodiphenyl ether has also been found in samples of household dust, which shows that products in use are an emission source of decabromodiphenyl ether. It is also present in precipitation. 3.1.4 Non-compartment specific exposure relevant to the food chain 3.1.4.1 Predicted concentrations 3.1.4.1.1 Summary of original risk assessment report The PECs calculated in the original risk assessment report for fish and earthworms for the assessment of secondary poisoning are summarised in Table 16. Table 16 Summary of predicted concentrations in fish and earthworms from the original risk assessment report
Scenario Concentration in fish Concentration in earthworm
Production – generic example calculation 3.7-3.8 µg/kg 149 mg/kg
Production – site specific example calculation 0.27 µg/kg no route to soil
Polymer processing 0.72 µg/kg 40.3 mg/kg
Textiles – formulation 4.4 µg/kg 81.0 mg/kg
Textiles – application of backcoating 2.4 µg/kg 58.5 mg/kg
3.1.4.1.2 Updated calculations The updated concentrations predicted in fish and earthworms for secondary poisoning are summarised in Table 17. Table 17 Summary of updated predicted concentrations in fish and earthworms
Scenario Concentration in fish Concentration in earthworm
Production – generic example calculation 3.4 µg/kg 5.3 mg/kga
Production – site specific example calculation ~0.2 µg/kg no route to soil
Polymer processing 0.035 µg/kg 0.023 mg/kg
Textiles – formulation 0.077 µg/kg 0.17 mg/kg
Textiles – application of backcoating 0.077 µg/kg 0.17 mg/kg
Polymers – recycling of electronic equipment - 0.010
Note: a) The soil pore water concentration was predicted to be greater than the water solubility of the substance, and was therefore set to 0.1 µg/l in the calculation.
The concentrations have been estimated using the methods given in the new Technical Guidance Document. The concentrations in fish have been estimated using a BCFfish of 4 l/kg and a BMF of 1, as is appropriate for a substance with a BCF of <2,000 l/kg. The concentrations in earthworms have been estimated using a BCFearthworm of 22,346, as estimated from the log Kow of 6.27 using the following equation. BCFearthworm = 0.84 + 0.012×Kow/RHOearthworm where RHOearthworm is the density of the worm = 1 kgww/l.
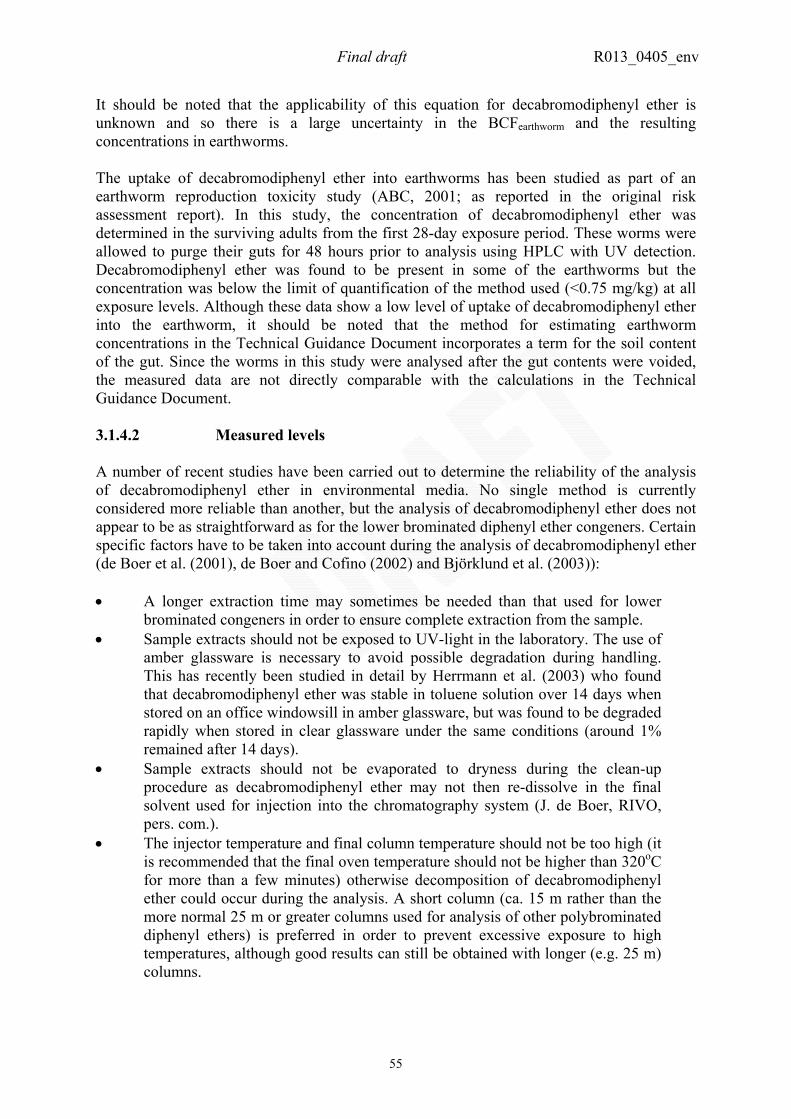
Final draft R013_0405_env
55
It should be noted that the applicability of this equation for decabromodiphenyl ether is unknown and so there is a large uncertainty in the BCFearthworm and the resulting concentrations in earthworms. The uptake of decabromodiphenyl ether into earthworms has been studied as part of an earthworm reproduction toxicity study (ABC, 2001; as reported in the original risk assessment report). In this study, the concentration of decabromodiphenyl ether was determined in the surviving adults from the first 28-day exposure period. These worms were allowed to purge their guts for 48 hours prior to analysis using HPLC with UV detection. Decabromodiphenyl ether was found to be present in some of the earthworms but the concentration was below the limit of quantification of the method used (<0.75 mg/kg) at all exposure levels. Although these data show a low level of uptake of decabromodiphenyl ether into the earthworm, it should be noted that the method for estimating earthworm concentrations in the Technical Guidance Document incorporates a term for the soil content of the gut. Since the worms in this study were analysed after the gut contents were voided, the measured data are not directly comparable with the calculations in the Technical Guidance Document. 3.1.4.2 Measured levels A number of recent studies have been carried out to determine the reliability of the analysis of decabromodiphenyl ether in environmental media. No single method is currently considered more reliable than another, but the analysis of decabromodiphenyl ether does not appear to be as straightforward as for the lower brominated diphenyl ether congeners. Certain specific factors have to be taken into account during the analysis of decabromodiphenyl ether (de Boer et al. (2001), de Boer and Cofino (2002) and Björklund et al. (2003)): • A longer extraction time may sometimes be needed than that used for lower
brominated congeners in order to ensure complete extraction from the sample. • Sample extracts should not be exposed to UV-light in the laboratory. The use of
amber glassware is necessary to avoid possible degradation during handling. This has recently been studied in detail by Herrmann et al. (2003) who found that decabromodiphenyl ether was stable in toluene solution over 14 days when stored on an office windowsill in amber glassware, but was found to be degraded rapidly when stored in clear glassware under the same conditions (around 1% remained after 14 days).
• Sample extracts should not be evaporated to dryness during the clean-up procedure as decabromodiphenyl ether may not then re-dissolve in the final solvent used for injection into the chromatography system (J. de Boer, RIVO, pers. com.).
• The injector temperature and final column temperature should not be too high (it is recommended that the final oven temperature should not be higher than 320oC for more than a few minutes) otherwise decomposition of decabromodiphenyl ether could occur during the analysis. A short column (ca. 15 m rather than the more normal 25 m or greater columns used for analysis of other polybrominated diphenyl ethers) is preferred in order to prevent excessive exposure to high temperatures, although good results can still be obtained with longer (e.g. 25 m) columns.
Final draft R013_0405_env
56
• Glassware used for previous analyses can be left contaminated, and levels may also be found in laboratory blanks for other reasons (e.g. dust containing the substance) (C. Allchin, CEFAS, pers. com.).
These are important considerations, particularly when assessing the significance of levels reported at or near the detection limit of the method (as is often the case with biota) as the occurrence of either ‘false negative’ or ‘false positive’ results is clearly a possibility in the analysis of low levels of decabromodiphenyl ether. Indeed a recent inter-laboratory study on the analysis of decabromodiphenyl ether found a very wide variation in the levels of decabromodiphenyl ether reported in biota by the 18 laboratories participating (de Boer and Cofino, 2002). 3.1.4.2.1 Levels in aquatic biota Summary of original risk assessment report Decabromodiphenyl ether had generally not been detected or found only in trace amounts in fish, invertebrate, whale, dolphin and seal samples collected in the EU. However, there was an apparent increasing incidence of decabromodiphenyl ether in the more recent samples compared with the earlier studies. It was not clear if this apparent increasing incidence was a result of the increasing sensitivity of the analytical methods used or as a result of an actual increasing presence in the organisms sampled. Updated information Boon et al., (2002) investigated the levels of decabromodiphenyl ether in samples of whelk (Buccinum undatum; soft parts), seastar (Asterias rubens; pyloric caeca), hermit crab (Pagurus bernhardus; abdomen), herring (Clupea harengus), whiting (Merlangius merlangus; liver and fillet), cod (Gadus morhua; liver and fillet) harbour seals (Phoca vitulina; liver and blubber) and harbour porpoise (Phocoena phocoena; liver and blubber). The invertebrate and fish samples were collected mainly during August and September 1999 from the North Sea basin and Skagerrak (area sampled was between 52o and 58oN and 1oW and 10oE), the harbour seals were from the German Wadden Sea and the harbour porpoises were from the Dutch coast. Decabromodiphenyl ether was reported to be detected only in a minority of samples (no details are given of which ones) at concentrations around the limit of detection of the analytical method used (~5 µg/kg lipid) (a long (25 m) column appears to have been used here) and the positive findings were possibly due to the presence of suspended particles or sediments containing decabromodiphenyl ether in parts of the digestive system of some of the samples analysed. The level of decabromodiphenyl ether in fish and mussels from the most important rivers and estuaries in the Netherlands has been investigated (de Boer et al., 2000 and 2002b). The samples analysed included flounder (Platichthys flesus; pooled fillet samples), bream (Abramis brama; pooled fillet samples), a marine mussel (Mytilus edulis; pooled samples (~100 g flesh/sample)) and a freshwater mussel (Dreissena polymorpha; pooled samples (~100 g flesh/sample)). The mussels were introduced at the sampling locations in small nets six weeks prior to sampling. The fish and mussel samples were collected during April, July and September. The analysis of the levels of decabromodiphenyl ether present was carried out using GC/MS with electron capture negative ionisation (ECNI) as the ionisation technique and a short (15 m) column. The paper reports that none of the 35 fish samples from
Final draft R013_0405_env
57
20 locations contained decabromodiphenyl ether (detection limit 0.06-21 µg/kg dry weight in bream and 0.2-5.9 µg/kg dry weight for flounder). However decabromodiphenyl ether appears to have been detected at a concentration of 0.3 µg/kg (i.e. very close to the detection limit of the method) in one sample of bream. This result is not discussed in the paper and so the significance is uncertain. Decabromodiphenyl ether was found at a concentration of 5 µg/kg dry weight in two marine mussel samples (a total of nine freshwater and six marine were analysed from 16 locations) from Vlissingen (Western Scheldt) and the Wadden Sea. However, the concentrations found were close to the detection limit of the method (3.7-34 µg/kg dry weight) and were thought to possibly result from the presence of small particles in the gut (the samples were not depurated prior to analysis). No other mussel samples were found to contain decabromodiphenyl ether. A further study of levels of decabromodiphenyl ether in aquatic organisms from the Netherlands has been reported by Vethaak et al. (2002). In this study decabromodiphenyl ether was found to be present at <0.35-0.9 µg/kg dry weight in fish muscle and <3.7-4.9 µg/kg dry weight in mussels (whole body). It was reported that decabromodiphenyl ether was present in only a few of the samples analysed. Furthermore, it was reported that the three mussel samples in which it was found had not been depurated prior to analysis and so the levels found here could have been due to decabromodiphenyl ether sorbed to particulates in the gut of the mussels. Lepom et al. (2002) and Karasyova et al. (2002) found decabromodiphenyl ether to be present in bream (Abramis brama) but not eel (Anguilla anguilla) from Germany. The samples were collected from the river Elbe upstream of Dresen in 2001 and in all 22 bream muscle samples and five eel muscle samples were analysed. Decabromodiphenyl ether was found to be present in 11 out of the 22 bream samples at concentrations up to 37 µg/kg lipid. No decabromodiphenyl ether was found in the eel samples (the detection limit of the method used was not given). The median concentration in bream was 0.97 µg/kg lipid. The presence of decabromodiphenyl ether was confirmed in some of the samples using a high resolution mass spectrometric (HRMS) method. As part of a study looking at the levels of hexabromocyclododecane and tetrabromobisphenol-A in biota, de Boer et al. (2002a) also reported the levels of decabromodiphenyl ether in yellow eels (Anguilla anguilla) collected from around the Scheldt basin during 2000. In all 18 samples were analysed (each sample being a pooled sample of around 10 eel tail ends) using a short column. Decabromodiphenyl ether was not detected in 13 of these samples (detection limit 0.1 µg/kg wet weight) but was found at concentrations of 0.4 µg/kg wet weight (1.5 µg/kg lipid) in a sample from Weveigem (Leie), 0.5 µg/kg wet weight (2.4 µg/kg lipid) in a sample from Doel (Scheldt), 0.5 µg/kg wet weight (2.8 µg/kg lipid) in a sample from Grens (Scheldt), 0.5 µg/kg wet weight (1.9 µg/kg lipid) in a sample from Kastel (Scheldt) and 0.6 µg/kg wet weight (7.2 µg/kg lipid) in a sample from Appels (Dender). The same study also investigated the levels of decabromodiphenyl ether in cod and hake liver from the North and Atlantic Sea. In these samples decabromodiphenyl ether was not detected (detection limit 0.5 µg/kg wet weight) in two samples of cod liver from the North Sea and one sample of hake liver from Southern Ireland. The levels of decabromodiphenyl ether in blue mussels (Mytilus edulis) along the Dutch coast has been determined by Booij et al. (2000). The sampling locations included one location in the Western Scheldt estuary (Hansweert) and at four locations along the Dutch coast. At each site 100 mussels (previously collected from the Eastern Scheldt) were exposed on buoys.
Final draft R013_0405_env
58
Sampling was carried out over 42 days in either January-March 1999 or October-November 1999. In addition, samples of native mussels from two of the sampling sites were also collected. Once collected the mussel samples were divided, with half of each sample being analysed without depuration and half being allowed to depurate their gut contents for 24 hours prior to analysis. The concentration of decabromodiphenyl ether in the samples was determined by a GC/MS using negative chemical ionisation (monitoring the bromine ion at m/z 79 and 81 and also m/z 487) using a 25 m column. The concentrations of decabromodiphenyl ether present in the mussels were found to be dominated by the presence of ingested particles. The concentration found was 3,350 µg/kg lipid and 1,580 µg/kg lipid in two samples prior to depuration and this fell to 50 and 480 µg/kg lipid respectively in the samples from the same locations that had been depurated for 24 hours. However, it is not clear if the values reported after 24 hours are still dominated by ingested particulates or represent actual uptake of the substance into the organism. SFT (2002) have recently determined the concentrations of decabromodiphenyl ether in blue mussel (six samples from three locations) and cod livers (six samples from two locations) from Norway. The detection limit of the method used was 0.5 µg/kg wet weight. Decabromodiphenyl ether was found to be present in five out of six mussel samples at a concentration of 0.03-0.16 µg/kg wet weight and in one out of six cod liver samples at 0.16 µg/kg wet weight. The levels reported appear to be below the detection limit given for the method. It is not clear if the mussels were depurated prior to analysis. Zegers et al. (2001) briefly reported the results of the analysis of pooled samples (five individuals for each sample) of various fish and invertebrate samples collected in the North Sea during August to September 1999. The samples included starfish (pyloric caeca), hermit crab (abdomen), whelk (whole body except shell) and fish (liver and fillet). In addition samples of blubber and liver from cetaceans were also analysed. Decabromodiphenyl ether was found to be present in some of the invertebrate samples at concentrations just above the detection limit of the analytical method used. However, it was possible that this may have represented decabromodiphenyl ether present in the digestive system of these organisms rather than actual uptake. The concentration of decabromodiphenyl ether in fish and most of the marine mammals was generally below the limit of detection. Nevertheless, decabromodiphenyl ether was thought to be present at low levels in the liver of an immature female porpoise, though no levels were reported. Voorspoels et al. (2003) analysed various benthic organisms from the Belgian North Sea and the Scheldt Estuary for the presence of decabromodiphenyl ether. The organisms were collected from seven locations in the North Sea and nine locations in the Scheldt Estuary during October and November 2001. The number of organisms collected varied between the locations but was between 3 and 10 for star fish (Asterias rubens), 30 and 50 for shrimp (Crangon crangon), crab (Lyocarcinus holsatus) and goby (Pomatoshistus minutus), and between 1 and 5 for common sole (Solea solea), dab (Limanda limanda), plaice (Pleuronectes platessa), whiting (Merlangius merlangus) and bib (Trisopterus luscus), where available (not all species could be collected from each sampling location, particularly in the Scheldt Estuary). The samples collected for each species at each location were generally pooled prior to analysis. The limit of quantification for decabromodiphenyl ether was around 2 and 4 µg/kg wet weight (it was reported that there was a relatively high but consistent response from decabromodiphenyl ether in the procedural blank samples and so the results were corrected for the procedural blank response and the levels of decabromodiphenyl ether were only reported in cases where the blank corrected concentration was at least three times
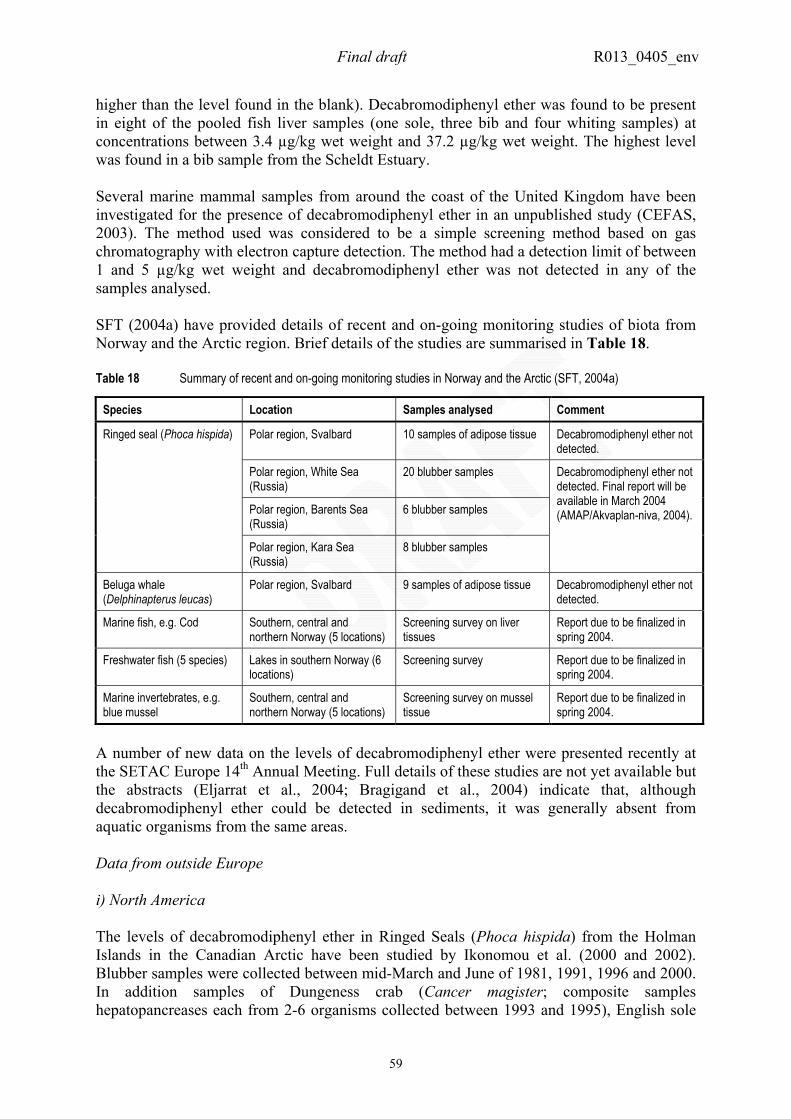
Final draft R013_0405_env
59
higher than the level found in the blank). Decabromodiphenyl ether was found to be present in eight of the pooled fish liver samples (one sole, three bib and four whiting samples) at concentrations between 3.4 µg/kg wet weight and 37.2 µg/kg wet weight. The highest level was found in a bib sample from the Scheldt Estuary. Several marine mammal samples from around the coast of the United Kingdom have been investigated for the presence of decabromodiphenyl ether in an unpublished study (CEFAS, 2003). The method used was considered to be a simple screening method based on gas chromatography with electron capture detection. The method had a detection limit of between 1 and 5 µg/kg wet weight and decabromodiphenyl ether was not detected in any of the samples analysed. SFT (2004a) have provided details of recent and on-going monitoring studies of biota from Norway and the Arctic region. Brief details of the studies are summarised in Table 18. Table 18 Summary of recent and on-going monitoring studies in Norway and the Arctic (SFT, 2004a)
Species Location Samples analysed Comment
Polar region, Svalbard 10 samples of adipose tissue Decabromodiphenyl ether not detected.
Polar region, White Sea (Russia)
20 blubber samples
Polar region, Barents Sea (Russia)
6 blubber samples
Ringed seal (Phoca hispida)
Polar region, Kara Sea (Russia)
8 blubber samples
Decabromodiphenyl ether not detected. Final report will be available in March 2004 (AMAP/Akvaplan-niva, 2004).
Beluga whale (Delphinapterus leucas)
Polar region, Svalbard 9 samples of adipose tissue Decabromodiphenyl ether not detected.
Marine fish, e.g. Cod Southern, central and northern Norway (5 locations)
Screening survey on liver tissues
Report due to be finalized in spring 2004.
Freshwater fish (5 species) Lakes in southern Norway (6 locations)
Screening survey Report due to be finalized in spring 2004.
Marine invertebrates, e.g. blue mussel
Southern, central and northern Norway (5 locations)
Screening survey on mussel tissue
Report due to be finalized in spring 2004.
A number of new data on the levels of decabromodiphenyl ether were presented recently at the SETAC Europe 14th Annual Meeting. Full details of these studies are not yet available but the abstracts (Eljarrat et al., 2004; Bragigand et al., 2004) indicate that, although decabromodiphenyl ether could be detected in sediments, it was generally absent from aquatic organisms from the same areas. Data from outside Europe i) North America The levels of decabromodiphenyl ether in Ringed Seals (Phoca hispida) from the Holman Islands in the Canadian Arctic have been studied by Ikonomou et al. (2000 and 2002). Blubber samples were collected between mid-March and June of 1981, 1991, 1996 and 2000. In addition samples of Dungeness crab (Cancer magister; composite samples hepatopancreases each from 2-6 organisms collected between 1993 and 1995), English sole
Final draft R013_0405_env
60
(Pleuronectes vetulus; composite samples of liver each from 1-13 organisms collected in 1992 and 2000) and Harbour Porpoise (Phocoena phocoena; individual blubber samples collected between 1991 and 1993) were collected from pristine reference sites (Gardener Channel and Bamfield), harbours (Vancouver, Victoria, Esquimalt and Prince Rupert) and near to pulp and paper mills (Howe Sound, Crofton, Prince Rupert, Kitimat and Fraser River Delta). Analysis was by high-resolution mass spectrometry (electron impact (EI)) using the selected ion monitoring mode. A short (15 m) column was used for the analysis of decabromodiphenyl ether. No levels of decabromodiphenyl ether were reported in the paper as the detector response seen from the samples was the same as seen from the procedural blanks (162-236 ng/kg), indicating that little or no decabromodiphenyl ether was detected in the sample. The occurrence of decabromodiphenyl ether in fish from two small lakes in the northeastern United States and two of the Great Lakes has been studied (Dodder et al., 2002). The samples analysed included twelve white crappie (Pomoxis annularis; the individual fish were combined in groups of four to give three composite samples), twelve bluegill (Lepomis macrochirus; the individual fish were combined in groups of four to give three composite samples) and two carp (Cyprinus carpio; muscle samples analysed individually) collected in 1999 from Hadley Lake (1.3 km from a polybrominated diphenyl ether manufacturing plant; aerial deposition is the only known method for the substances to enter the lake), three white crappie and three bluegills (whole body samples analysed individually) collected in 1999 from the Lake of the Ozarks (remote from point sources), and three composite samples of smelt (Osmerus mordax) collected in 1994 from each of Lake Superior and Lake Ontario (the fish were collected from offshore fishing grounds not impacted by local sources). Decabromodiphenyl ether was not found to be present in any of the samples analysed except for a trace amount in one of the composite samples of smelt from Lake Superior. The detection limit of the method used was around 1.3-1.6 µg/kg wet weight. Experiments carried out by the laboratory indicated that analytical recovery of decabromodiphenyl ether from spiked fish samples was low (around 20%) and so the results were considered as estimates. Oliaei and Hamilton (2003) reported that decabromodiphenyl ether was not detected in samples of common carp (Cyprinus carpio), white sucker (Catostomus commersoni), redhorse (Moxostoma sp.), walleye (Sander vitreus) and northern pike (Esox lucius) collected from the Rainy, Red River of the North, St. Louis, Mississippi, St. Croix and Minnesota Rivers downstream of waste water treatment plants in 2001 (decabromodiphenyl ether was reported to be present in the sediments from the areas sampled). No details of the detection limit of the method used were given. La Guardia et al. (2003) have recently reported levels of decabromodiphenyl ether in sunfish of up to 492 µg/kg lipid. The fish were collected close to the outfall from a waste water treatment plant in the United States. The waste water treatment plant was receiving waste water from a commercial site using decabromodiphenyl ether and the levels in influent, effluent from the waste water treatment plant, and the receiving water are summarised in Section 3.1.1.2.2. Few other details of this study are currently available. ii) Asia Akutsu et al. (2001) and Hori et al. (2000) determined the levels of decabromodiphenyl ether in fish samples from the Inland Sea of Seto, Japan. The fish sampled included conger eel, flounder, grey mullet, horse mackerel, red sea bream, sea bass and yellow tail. The samples were collected between October and December 1998 and in all 25 samples were analysed.
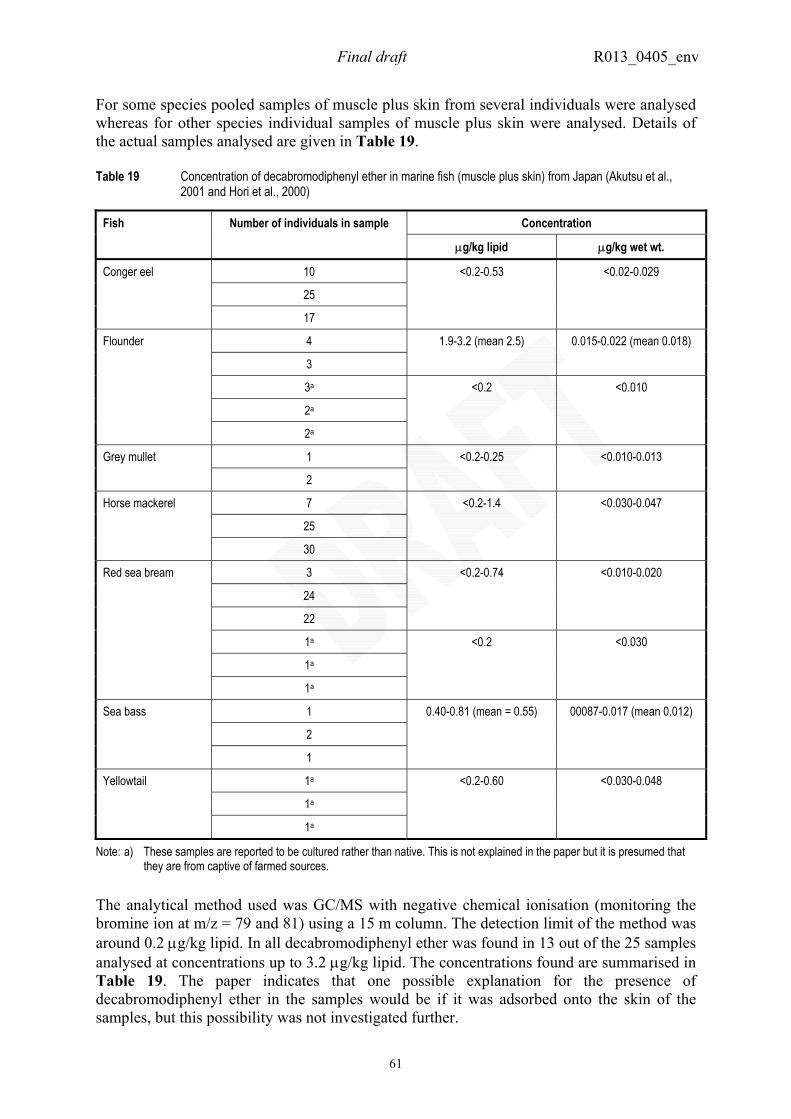
Final draft R013_0405_env
61
For some species pooled samples of muscle plus skin from several individuals were analysed whereas for other species individual samples of muscle plus skin were analysed. Details of the actual samples analysed are given in Table 19. Table 19 Concentration of decabromodiphenyl ether in marine fish (muscle plus skin) from Japan (Akutsu et al.,
2001 and Hori et al., 2000)
Concentration Fish Number of individuals in sample
µg/kg lipid µg/kg wet wt.
10
25
Conger eel
17
<0.2-0.53 <0.02-0.029
4
3
1.9-3.2 (mean 2.5) 0.015-0.022 (mean 0.018)
3a
2a
Flounder
2a
<0.2 <0.010
1 Grey mullet
2
<0.2-0.25 <0.010-0.013
7
25
Horse mackerel
30
<0.2-1.4 <0.030-0.047
3
24
22
<0.2-0.74 <0.010-0.020
1a
1a
Red sea bream
1a
<0.2 <0.030
1
2
Sea bass
1
0.40-0.81 (mean = 0.55) 00087-0.017 (mean 0.012)
1a
1a
Yellowtail
1a
<0.2-0.60 <0.030-0.048
Note: a) These samples are reported to be cultured rather than native. This is not explained in the paper but it is presumed that they are from captive of farmed sources.
The analytical method used was GC/MS with negative chemical ionisation (monitoring the bromine ion at m/z = 79 and 81) using a 15 m column. The detection limit of the method was around 0.2 µg/kg lipid. In all decabromodiphenyl ether was found in 13 out of the 25 samples analysed at concentrations up to 3.2 µg/kg lipid. The concentrations found are summarised in Table 19. The paper indicates that one possible explanation for the presence of decabromodiphenyl ether in the samples would be if it was adsorbed onto the skin of the samples, but this possibility was not investigated further.
Final draft R013_0405_env
62
Ueno et al. (2003) determined the levels of decabromodiphenyl ether in samples of skipjack tuna (Katsuwonus pelamis) collected from off-shore waters of Asia, Seychelles and Brazil, and open seas. The concentrations of decabromodiphenyl ether were below the detection limit of the method (5 µg/kg lipid) in all fifteen samples analysed. Kajiwara et al. (2003) analysed 30 samples of fat tissues from female Northern Fur Seals for the presence of decabromodiphenyl ether. The samples were collected off Sanriku, Japan, between 1972 and 1997. Decabromodiphenyl ether was not detected in any of the 30 samples analysed (the detection limit was 0.5 µg/kg lipid). 3.1.4.2.2 Levels in terrestrial biota Summary of original risk assessment report Decabromodiphenyl ether had been found to be present in some predatory birds’ eggs (Peregrine Falcon and to a lesser extent Common Tern10). The highest level found was around 430 µg/kg lipid in a Peregrine Falcon egg from Sweden. Updated information Mammals SFT (2004a) have provided brief details of recent and on-going monitoring studies of biota from Norway and the Arctic region. One of these studies investigated the levels of polybrominated diphenyl ethers in Polar Bear (Ursus maritimus) samples (approximately 30 samples of plasma and adipose tissue/skin) from polar regions (Svalbard, Greenland and Alaska). Decabromodiphenyl ether was not detected in any of these samples analysed. A summary of results from a further study of levels in Polar Bear from Norway have recently become available (SFT, 2004b; Skaare and Jensen, 2004). In this study adipose tissues from eight Polar Bears collected in 2001-2003 on Svalbard, Norway were analysed for decabromodiphenyl ether. The study was part of an ongoing EU project (Flame Retardants Integrated Risk Assessment for Endocrine Effects (FIRE11)). Decabromodiphenyl ether was found to be present at low but detectable levels in all of the samples (the detection limit of the method was 0.02 µg/kg wet weight). All samples were analysed twice in order to ensure adequate analytical quality. The final report of this study is expected to be published during 2004. Recent work by Mariussen et al. (2004) has found decabromodiphenyl ether to be present in liver samples from several mammals (and birds; see below) from Norway. Full details of the study are not yet available but the study investigated the levels of polybrominated diphenyl ethers in livers from Lynx (Lynx lnyx) (collected in 1993/1994 and 2002) and species representing their potential prey (grouse (Lagopus sp.; collected in 1990/1993 and 2000), Western Roe Deer (Capreolus capreolus; collected in 1995) and Moose (Alces alces; collected in 1995)). Decabromodiphenyl ether was found in most of the samples, with the highest levels being found in Lynx samples from 2002 (the highest level found was
10 All bird data are included in this section for ease of reference, even though not all are part of the terrestrial food web. 11 Further details of the FIRE project are available from http://www.rivm.nl/fire/.
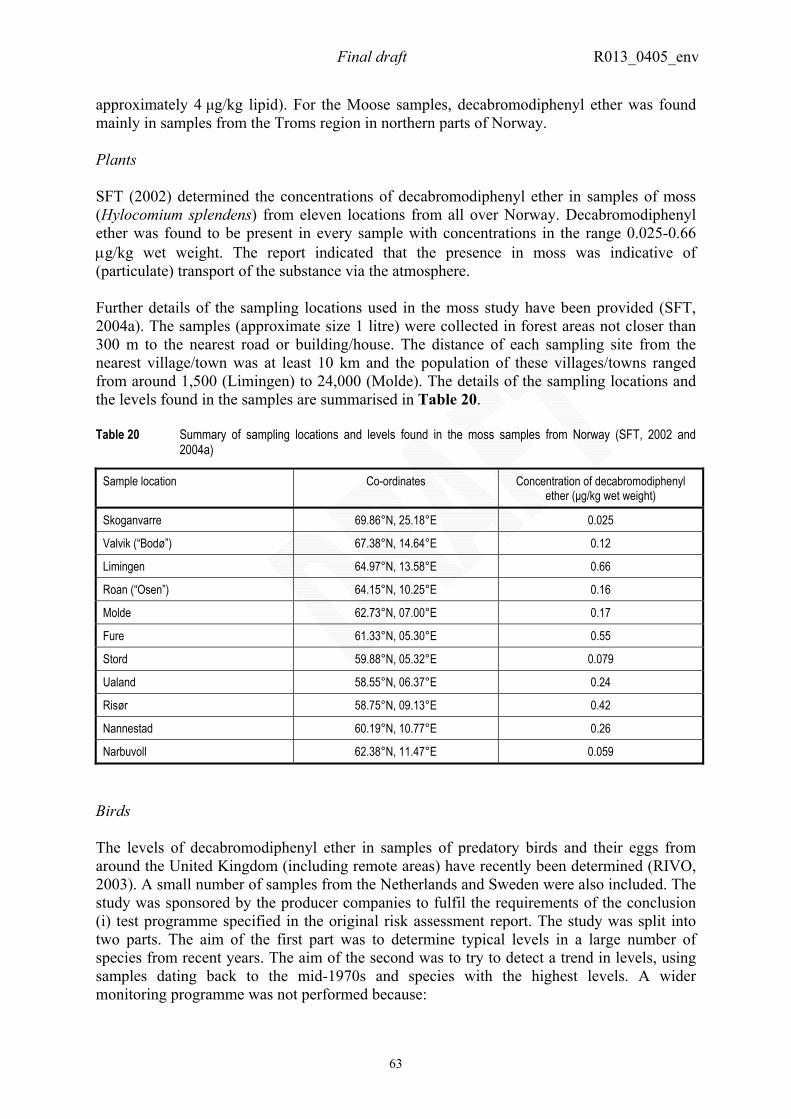
Final draft R013_0405_env
63
approximately 4 µg/kg lipid). For the Moose samples, decabromodiphenyl ether was found mainly in samples from the Troms region in northern parts of Norway. Plants SFT (2002) determined the concentrations of decabromodiphenyl ether in samples of moss (Hylocomium splendens) from eleven locations from all over Norway. Decabromodiphenyl ether was found to be present in every sample with concentrations in the range 0.025-0.66 µg/kg wet weight. The report indicated that the presence in moss was indicative of (particulate) transport of the substance via the atmosphere. Further details of the sampling locations used in the moss study have been provided (SFT, 2004a). The samples (approximate size 1 litre) were collected in forest areas not closer than 300 m to the nearest road or building/house. The distance of each sampling site from the nearest village/town was at least 10 km and the population of these villages/towns ranged from around 1,500 (Limingen) to 24,000 (Molde). The details of the sampling locations and the levels found in the samples are summarised in Table 20. Table 20 Summary of sampling locations and levels found in the moss samples from Norway (SFT, 2002 and
2004a)
Sample location Co-ordinates Concentration of decabromodiphenyl ether (µg/kg wet weight)
Skoganvarre 69.86°N, 25.18°E 0.025
Valvik (“Bodø”) 67.38°N, 14.64°E 0.12
Limingen 64.97°N, 13.58°E 0.66
Roan (“Osen”) 64.15°N, 10.25°E 0.16
Molde 62.73°N, 07.00°E 0.17
Fure 61.33°N, 05.30°E 0.55
Stord 59.88°N, 05.32°E 0.079
Ualand 58.55°N, 06.37°E 0.24
Risør 58.75°N, 09.13°E 0.42
Nannestad 60.19°N, 10.77°E 0.26
Narbuvoll 62.38°N, 11.47°E 0.059
Birds The levels of decabromodiphenyl ether in samples of predatory birds and their eggs from around the United Kingdom (including remote areas) have recently been determined (RIVO, 2003). A small number of samples from the Netherlands and Sweden were also included. The study was sponsored by the producer companies to fulfil the requirements of the conclusion (i) test programme specified in the original risk assessment report. The study was split into two parts. The aim of the first part was to determine typical levels in a large number of species from recent years. The aim of the second was to try to detect a trend in levels, using samples dating back to the mid-1970s and species with the highest levels. A wider monitoring programme was not performed because:
Final draft R013_0405_env
64
a) only the UK is known to have an extensive archive of relevant tissues, and b) the UK is expected to represent a worst case for exposure due to the high usage
of the substance. The tissue archive is a national resource held by the Centre for Ecology and Hydrology (CEH). Carcasses are sent in by members of the public as found. Unhatched eggs are collected under license for certain species at the end of the breeding season from various locations. The tissue archive was not necessarily designed for retrospective analysis of persistent organic pollutants. Degradation of the substance could have occurred over time or samples could have been contaminated during storage. Nevertheless, this archive represents the best possible collection of samples for this work. The two laboratories responsible for the measurements have been accredited for analysis of this substance. Samples analysed in the first part of the study were collected during 2002. The levels found are summarised in Table 21. In addition, some of the Peregrine Falcon eggs from Sweden analysed originally by Sellström et al. (2001) were reanalysed in this study, to ensure that the analytical methods were comparable. These results, along with the original data obtained by Sellström et al. (2001) are shown in Table 22. The original Swedish results were confirmed, thereby ensuring that the data were comparable. The second part of the RIVO (2003) study investigated the levels of decabromodiphenyl ether in historic samples of Peregrine Falcon eggs and Eurasian Sparrowhawk muscle from the United Kingdom to see if time trends could be found. These two species’ tissues were chosen because they had the greatest concentrations, the most frequent occurrence of the substance, and/or the most historical material available for further analysis. The results of these analyses are summarised in Table 23.
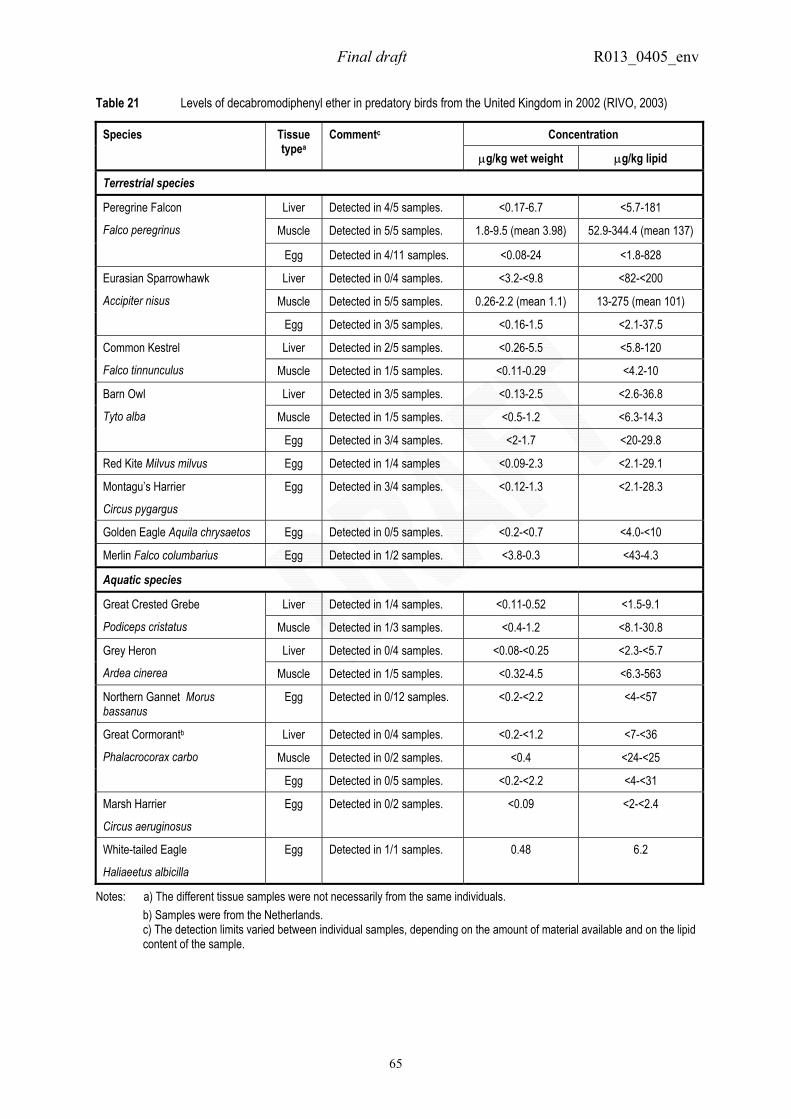
Final draft R013_0405_env
65
Table 21 Levels of decabromodiphenyl ether in predatory birds from the United Kingdom in 2002 (RIVO, 2003)
Concentration Species Tissue typea
Commentc
µg/kg wet weight µg/kg lipid
Terrestrial species
Liver Detected in 4/5 samples. <0.17-6.7 <5.7-181
Muscle Detected in 5/5 samples. 1.8-9.5 (mean 3.98) 52.9-344.4 (mean 137)
Peregrine Falcon
Falco peregrinus
Egg Detected in 4/11 samples. <0.08-24 <1.8-828
Liver Detected in 0/4 samples. <3.2-<9.8 <82-<200
Muscle Detected in 5/5 samples. 0.26-2.2 (mean 1.1) 13-275 (mean 101)
Eurasian Sparrowhawk
Accipiter nisus
Egg Detected in 3/5 samples. <0.16-1.5 <2.1-37.5
Liver Detected in 2/5 samples. <0.26-5.5 <5.8-120 Common Kestrel
Falco tinnunculus Muscle Detected in 1/5 samples. <0.11-0.29 <4.2-10
Liver Detected in 3/5 samples. <0.13-2.5 <2.6-36.8
Muscle Detected in 1/5 samples. <0.5-1.2 <6.3-14.3
Barn Owl
Tyto alba
Egg Detected in 3/4 samples. <2-1.7 <20-29.8
Red Kite Milvus milvus Egg Detected in 1/4 samples <0.09-2.3 <2.1-29.1
Montagu’s Harrier
Circus pygargus
Egg Detected in 3/4 samples. <0.12-1.3 <2.1-28.3
Golden Eagle Aquila chrysaetos Egg Detected in 0/5 samples. <0.2-<0.7 <4.0-<10
Merlin Falco columbarius Egg Detected in 1/2 samples. <3.8-0.3 <43-4.3
Aquatic species
Liver Detected in 1/4 samples. <0.11-0.52 <1.5-9.1 Great Crested Grebe
Podiceps cristatus Muscle Detected in 1/3 samples. <0.4-1.2 <8.1-30.8
Liver Detected in 0/4 samples. <0.08-<0.25 <2.3-<5.7 Grey Heron
Ardea cinerea Muscle Detected in 1/5 samples. <0.32-4.5 <6.3-563
Northern Gannet Morus bassanus
Egg Detected in 0/12 samples. <0.2-<2.2 <4-<57
Liver Detected in 0/4 samples. <0.2-<1.2 <7-<36
Muscle Detected in 0/2 samples. <0.4 <24-<25
Great Cormorantb
Phalacrocorax carbo
Egg Detected in 0/5 samples. <0.2-<2.2 <4-<31
Marsh Harrier
Circus aeruginosus
Egg Detected in 0/2 samples. <0.09 <2-<2.4
White-tailed Eagle
Haliaeetus albicilla
Egg Detected in 1/1 samples. 0.48 6.2
Notes: a) The different tissue samples were not necessarily from the same individuals. b) Samples were from the Netherlands. c) The detection limits varied between individual samples, depending on the amount of material available and on the lipid
content of the sample.
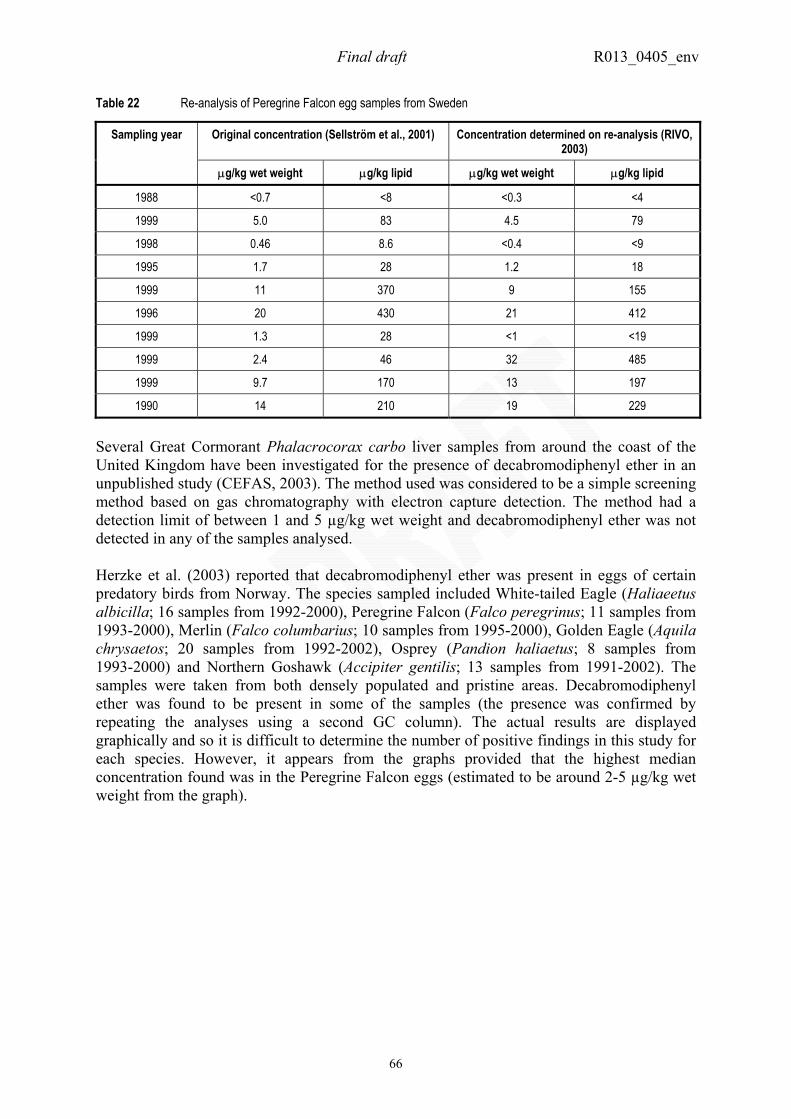
Final draft R013_0405_env
66
Table 22 Re-analysis of Peregrine Falcon egg samples from Sweden
Original concentration (Sellström et al., 2001) Concentration determined on re-analysis (RIVO, 2003)
Sampling year
µg/kg wet weight µg/kg lipid µg/kg wet weight µg/kg lipid
1988 <0.7 <8 <0.3 <4
1999 5.0 83 4.5 79
1998 0.46 8.6 <0.4 <9
1995 1.7 28 1.2 18
1999 11 370 9 155
1996 20 430 21 412
1999 1.3 28 <1 <19
1999 2.4 46 32 485
1999 9.7 170 13 197
1990 14 210 19 229
Several Great Cormorant Phalacrocorax carbo liver samples from around the coast of the United Kingdom have been investigated for the presence of decabromodiphenyl ether in an unpublished study (CEFAS, 2003). The method used was considered to be a simple screening method based on gas chromatography with electron capture detection. The method had a detection limit of between 1 and 5 µg/kg wet weight and decabromodiphenyl ether was not detected in any of the samples analysed. Herzke et al. (2003) reported that decabromodiphenyl ether was present in eggs of certain predatory birds from Norway. The species sampled included White-tailed Eagle (Haliaeetus albicilla; 16 samples from 1992-2000), Peregrine Falcon (Falco peregrinus; 11 samples from 1993-2000), Merlin (Falco columbarius; 10 samples from 1995-2000), Golden Eagle (Aquila chrysaetos; 20 samples from 1992-2002), Osprey (Pandion haliaetus; 8 samples from 1993-2000) and Northern Goshawk (Accipiter gentilis; 13 samples from 1991-2002). The samples were taken from both densely populated and pristine areas. Decabromodiphenyl ether was found to be present in some of the samples (the presence was confirmed by repeating the analyses using a second GC column). The actual results are displayed graphically and so it is difficult to determine the number of positive findings in this study for each species. However, it appears from the graphs provided that the highest median concentration found was in the Peregrine Falcon eggs (estimated to be around 2-5 µg/kg wet weight from the graph).
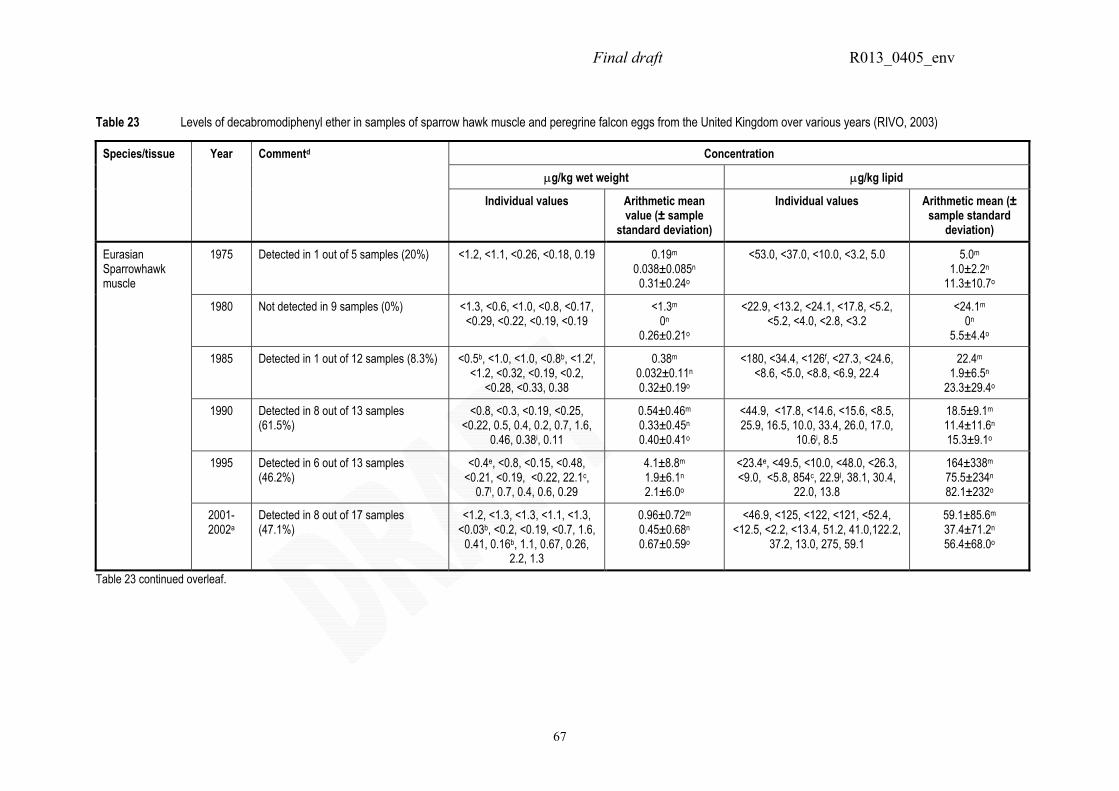
Final draft R013_0405_env
67
Table 23 Levels of decabromodiphenyl ether in samples of sparrow hawk muscle and peregrine falcon eggs from the United Kingdom over various years (RIVO, 2003)
Concentration
µg/kg wet weight µg/kg lipid
Species/tissue Year Commentd
Individual values Arithmetic mean value (± sample
standard deviation)
Individual values Arithmetic mean (± sample standard
deviation)
1975 Detected in 1 out of 5 samples (20%) <1.2, <1.1, <0.26, <0.18, 0.19 0.19m
0.038±0.085n 0.31±0.24o
<53.0, <37.0, <10.0, <3.2, 5.0 5.0m 1.0±2.2n
11.3±10.7o
1980 Not detected in 9 samples (0%) <1.3, <0.6, <1.0, <0.8, <0.17, <0.29, <0.22, <0.19, <0.19
<1.3m 0n
0.26±0.21o
<22.9, <13.2, <24.1, <17.8, <5.2, <5.2, <4.0, <2.8, <3.2
<24.1m 0n
5.5±4.4o
1985 Detected in 1 out of 12 samples (8.3%) <0.5b, <1.0, <1.0, <0.8b, <1.2f, <1.2, <0.32, <0.19, <0.2,
<0.28, <0.33, 0.38
0.38m 0.032±0.11n 0.32±0.19o
<180, <34.4, <126f, <27.3, <24.6, <8.6, <5.0, <8.8, <6.9, 22.4
22.4m 1.9±6.5n
23.3±29.4o
1990 Detected in 8 out of 13 samples (61.5%)
<0.8, <0.3, <0.19, <0.25, <0.22, 0.5, 0.4, 0.2, 0.7, 1.6,
0.46, 0.38i, 0.11
0.54±0.46m 0.33±0.45n 0.40±0.41o
<44.9, <17.8, <14.6, <15.6, <8.5, 25.9, 16.5, 10.0, 33.4, 26.0, 17.0,
10.6i, 8.5
18.5±9.1m 11.4±11.6n 15.3±9.1o
1995 Detected in 6 out of 13 samples (46.2%)
<0.4e, <0.8, <0.15, <0.48, <0.21, <0.19, <0.22, 22.1c,
0.7l, 0.7, 0.4, 0.6, 0.29
4.1±8.8m 1.9±6.1n 2.1±6.0o
<23.4e, <49.5, <10.0, <48.0, <26.3, <9.0, <5.8, 854c, 22.9l, 38.1, 30.4,
22.0, 13.8
164±338m 75.5±234n 82.1±232o
Eurasian Sparrowhawk muscle
2001-2002a
Detected in 8 out of 17 samples (47.1%)
<1.2, <1.3, <1.3, <1.1, <1.3, <0.03b, <0.2, <0.19, <0.7, 1.6,
0.41, 0.16b, 1.1, 0.67, 0.26, 2.2, 1.3
0.96±0.72m 0.45±0.68n 0.67±0.59o
<46.9, <125, <122, <121, <52.4, <12.5, <2.2, <13.4, 51.2, 41.0,122.2,
37.2, 13.0, 275, 59.1
59.1±85.6m 37.4±71.2n 56.4±68.0o
Table 23 continued overleaf.
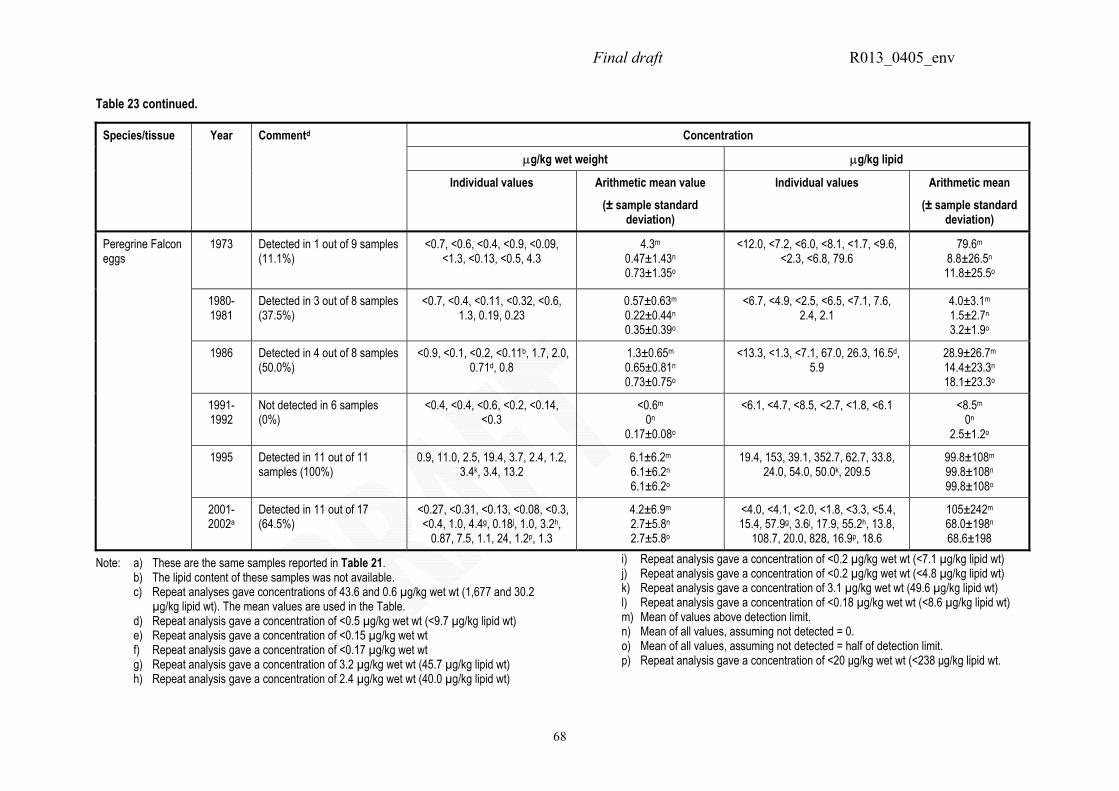
Final draft R013_0405_env
68
Table 23 continued.
Concentration
µg/kg wet weight µg/kg lipid
Species/tissue Year Commentd
Individual values Arithmetic mean value
(± sample standard deviation)
Individual values Arithmetic mean
(± sample standard deviation)
1973 Detected in 1 out of 9 samples (11.1%)
<0.7, <0.6, <0.4, <0.9, <0.09, <1.3, <0.13, <0.5, 4.3
4.3m 0.47±1.43n 0.73±1.35o
<12.0, <7.2, <6.0, <8.1, <1.7, <9.6, <2.3, <6.8, 79.6
79.6m 8.8±26.5n 11.8±25.5o
1980-1981
Detected in 3 out of 8 samples (37.5%)
<0.7, <0.4, <0.11, <0.32, <0.6, 1.3, 0.19, 0.23
0.57±0.63m 0.22±0.44n 0.35±0.39o
<6.7, <4.9, <2.5, <6.5, <7.1, 7.6, 2.4, 2.1
4.0±3.1m 1.5±2.7n 3.2±1.9o
1986 Detected in 4 out of 8 samples (50.0%)
<0.9, <0.1, <0.2, <0.11b, 1.7, 2.0, 0.71d, 0.8
1.3±0.65m
0.65±0.81n 0.73±0.75o
<13.3, <1.3, <7.1, 67.0, 26.3, 16.5d, 5.9
28.9±26.7m 14.4±23.3n 18.1±23.3o
1991-1992
Not detected in 6 samples (0%)
<0.4, <0.4, <0.6, <0.2, <0.14, <0.3
<0.6m 0n
0.17±0.08o
<6.1, <4.7, <8.5, <2.7, <1.8, <6.1 <8.5m 0n
2.5±1.2o
1995 Detected in 11 out of 11 samples (100%)
0.9, 11.0, 2.5, 19.4, 3.7, 2.4, 1.2, 3.4k, 3.4, 13.2
6.1±6.2m 6.1±6.2n 6.1±6.2o
19.4, 153, 39.1, 352.7, 62.7, 33.8, 24.0, 54.0, 50.0k, 209.5
99.8±108m 99.8±108n 99.8±108o
Peregrine Falcon eggs
2001-2002a
Detected in 11 out of 17 (64.5%)
<0.27, <0.31, <0.13, <0.08, <0.3, <0.4, 1.0, 4.4g, 0.18j, 1.0, 3.2h,
0.87, 7.5, 1.1, 24, 1.2p, 1.3
4.2±6.9m 2.7±5.8n 2.7±5.8o
<4.0, <4.1, <2.0, <1.8, <3.3, <5.4, 15.4, 57.9g, 3.6j, 17.9, 55.2h, 13.8,
108.7, 20.0, 828, 16.9p, 18.6
105±242m 68.0±198n 68.6±198
i) Repeat analysis gave a concentration of <0.2 µg/kg wet wt (<7.1 µg/kg lipid wt) Note: a) These are the same samples reported in Table 21. j) Repeat analysis gave a concentration of <0.2 µg/kg wet wt (<4.8 µg/kg lipid wt) b) The lipid content of these samples was not available. k) Repeat analysis gave a concentration of 3.1 µg/kg wet wt (49.6 µg/kg lipid wt) c) Repeat analyses gave concentrations of 43.6 and 0.6 µg/kg wet wt (1,677 and 30.2
µg/kg lipid wt). The mean values are used in the Table. l) Repeat analysis gave a concentration of <0.18 µg/kg wet wt (<8.6 µg/kg lipid wt) m) Mean of values above detection limit. d) Repeat analysis gave a concentration of <0.5 µg/kg wet wt (<9.7 µg/kg lipid wt) n) Mean of all values, assuming not detected = 0. e) Repeat analysis gave a concentration of <0.15 µg/kg wet wt o) Mean of all values, assuming not detected = half of detection limit. f) Repeat analysis gave a concentration of <0.17 µg/kg wet wt
p) Repeat analysis gave a concentration of <20 µg/kg wet wt (<238 µg/kg lipid wt. g) Repeat analysis gave a concentration of 3.2 µg/kg wet wt (45.7 µg/kg lipid wt) h) Repeat analysis gave a concentration of 2.4 µg/kg wet wt (40.0 µg/kg lipid wt)
Final draft R013_0405_env
69
SFT (2004a) have provided details of recent and on-going monitoring studies of biota from Norway and the Arctic region. Two of these studies are investigating the levels of decabromodiphenyl ether in Glaucous Gulls (Larus hyperboreus) The first study (Akvaplan-niva, 2004) investigated the levels of decabromodiphenyl ether in 20 hepatic samples collected in August 2001 from polar regions (Svalbard and Barentsburg). Analysis was carried out in the laboratory of the National Water Research Institute, Burlington, Canada. Decabromodiphenyl ether was found in 17 of the samples at a concentration of 0.07-10.0 µg/kg wet weight (in general the levels found were in the range 0.07-1.6 µg/kg wet weight, but one sample had a concentration of 10.0 µg/kg wet weight). These levels are comparable to the levels found in predatory birds. The second study (SFT, 2004a) is investigating the levels of decabromodiphenyl ether in 90 samples of plasma and 30 egg samples from Glaucous Gulls from polar regions (Bear Island). Preliminary results from this survey indicate that decabromodiphenyl ether was present at detectable levels in both the plasma and egg samples. The final results of this study are expected to be available in the near future. Recent work by Mariussen et al. (2004) has found decabromodiphenyl ether to be present in liver samples of grouse (Lagopus sp.; collected in 1990/1993 and 2000) from Norway. The level found was around 0.5 µg/kg lipid. Full details of this study are not yet available. Discussion of bird tissue monitoring data i) General findings Decabromodiphenyl ether has been found over a wide scale at low (parts per billion) levels in a variety of predatory birds and their eggs, both in the UK and elsewhere, including Arctic regions. For example, in the latest study sponsored by Industry, the substance was detected in 10 species out of the 14 initially sampled. It may be the case that some species have a particular capacity to accumulate the substance, although the levels are generally comparable across species. In addition, as noted in the original risk assessment report, there are known issues related to false positive and negative detections of this substance especially at low concentrations. However, the recent work carried out by RIVO (2003) is considered reliable since the laboratories involved have accreditation for the analysis. Given these findings it can be anticipated that other bird species would also contain decabromodiphenyl ether, and this has recently been confirmed by detection in samples of Glaucous Gull from polar regions, e.g. Svalbard and Bear Island, and grouse from Norway. According to the Governor of Svalbard website12 and SFT (2004a), there are no ‘typical’ birds-of-prey in the Svalbard area owing to the complete lack of rodents - this niche is filled by the Glaucous Gull, which is an opportunistic scavenger (feeding on a wide variety of food items, e.g. eggs, carrion, molluscs, fish, tundra plants, garbage and other birds). Terrestrial species (especially bird-eating species) appear to have the highest levels in relative terms, though it should be noted that: • only a very small number of samples were available for several species
(limiting the comparison that can be made),
12 http://www.sysselmannen.svalbard.no/index_en.htm
Final draft R013_0405_env
70
• other species groups (e.g. waterfowl) have not yet been investigated, and • the substance can also be found in species that are exclusively aquatic (e.g.
Great Crested Grebe). The highest levels were found in Eurasian Sparrowhawk and Peregrine Falcon. It is known that bird-eating species do not metabolise certain organochlorine pesticides as efficiently as other predatory species, and so differences in metabolic capability could possibly explain some of the differences between species (R. Shore, CEH, pers. com.). It was not possible to target locations with known emission sources of decabromodiphenyl ether due to the nature of the tissue archive. Some samples contained measurements of contamination that are considerably higher than others for the same species, suggesting that special exposure factors may be involved in some circumstances. It should be noted that the presence of metabolites and lower congeners was not investigated for any of the samples. ii) Possible sources of exposure Such widespread exposure from a chemical used in textiles and polymers is surprising, especially since this could not be readily anticipated from the known fate and environmental behaviour of this substance. In fact it was formerly considered unlikely to accumulate in wildlife tissues (due to evidence from aquatic and mammalian studies, its molecular size and low solubility in water and other solvents). The actual source of exposure of the birds to decabromodiphenyl ether is currently unknown. Possible routes include exposure through the air (e.g. particulates), exposure through food, exposure through water and exposure through ingestion of contaminated soil or sediment. It is possible to speculate on a number of scenarios that could lead to exposure. For example, deposition of the substance from the atmosphere, transport of sediment (e.g. due to flooding) and spreading of sewage sludge could all be important factors in exposure of terrestrial organisms. In addition, waterfowl and shorebirds that use estuaries may be affected both by direct exposure to contaminated sediment and through eating invertebrates such as mussels, which can contain decabromodiphenyl ether not only in their flesh, but also adsorbed onto particles in the gut. A portion of the UK populations of Peregrine Falcons and Eurasian Sparrowhawks move to feed on shorebirds on estuaries in winter and they might provide the source of contamination found in these birds of prey. However, since no contemporary data exist on levels in other terrestrial predators or potential food items, it is very difficult to determine if food chain accumulation is responsible for the levels that are found. Since other exposure routes might be significant, a simple comparison of the levels found in the birds and eggs with concentrations found in possible intake media (e.g. measured or predicted levels in fish) could well lead to erroneous conclusions being drawn on the bioaccumulation potential for this substance. The fact that both predators and prey are subject to seasonal movements also complicates this issue (i.e. exposure could take place in the breeding area, and/or on migration and/or on wintering grounds). The location of the sample therefore does not provide much information on possible sources, except for sedentary species. For example, the finding of decabromodiphenyl ether in Glaucous Gull involved birds collected from the Arctic in the
Final draft R013_0405_env
71
breeding season. However, exposure might not have occurred there – the birds are thought to over-winter in the northern part of the Atlantic Ocean (e.g. Greenland, Faeroes and Iceland), and they could feasibly migrate across Scandinavia: exposure could take place in any of these regions. Nevertheless, the proportion of sampled individuals/eggs (from diverse locations) that are contaminated can be over half for both Eurasian Sparrowhawk and Peregrine Falcon; this suggests widespread exposure and that the source for the birds is probably diffuse. In relation to this, it is notable that the substance was found in the only White-tailed Eagle egg that was sampled in the Industry-funded study. The British population is small and restricted to one of the most remote parts of the UK (north-west Scotland) (H. Crick, British Trust for Ornithology, pers. com.). In fact this egg was collected from a rural island with no known industrial sources of the substance (R. Kerr, Scottish Environment Protection Agency, pers. com.). The source of exposure of the parent female is unknown, but birds from this population are known to wander widely for up to four years prior to first breeding, after which they become sedentary (J. Love, Scottish Natural Heritage, pers. com.). Recent local exposure of the parent bird to a point source is unlikely due to the nature of the breeding area. The measured levels in the egg could therefore be due to: - early life exposure of the parent bird, for example if it resided near a polluted
area (this implies residues may have a relatively long half-life in the bird); or - recent exposure of the parent bird to contaminated terrestrial mammals, soil,
sediment and/or air, arising from diffuse sources and/or long-range transport; or - recent exposure of the parent bird arising from feeding on prey items (e.g. fish or
seabirds) that were exposed elsewhere (again suggesting that the substance can be transported through the environment for a significant distance).
Overall, although the importance of different exposure routes and links with sources remain unknown at present, the rapporteur considers that the findings in birds across a wide geographical area strongly suggest that the contamination is widespread away from local point sources. Diffuse releases from products in use and at disposal are probably important, although it is not possible to quantify this with any certainty at the moment. iii) Time trends The recent time trend data for decabromodiphenyl ether found in Eurasian Sparrowhawk muscle and Peregrine Falcon eggs from Table 23 are displayed in Figures 1 to 5. Figure 1 shows the frequency of occurrence of decabromodiphenyl ether in the samples over the various sampled years. Figures 2 and 3 show the levels found in Eurasian Sparrowhawk muscle, on a wet weight and lipid weight basis respectively, over the various sampled years. Figures 4 and 5 show the levels found in Peregrine Falcon eggs, on a wet weight and lipid weight basis respectively, over the various sampled years. Based on the 2002 data set for the United Kingdom (using the data for all species), the overall 90th percentile level found in eggs, liver and muscle was estimated (using a non-parametric technique) to be 14.2, 4.6 and 4 µg/kg wet weight respectively (209.8, 109.4 and 237.4 µg/kg respectively on a lipid basis) (EURAS, 2003). Overall decabromodiphenyl ether was detected in 35% of the samples analysed. The highest concentration found was 24 µg/kg wet weight (828 µg/kg lipid) in a Peregrine Falcon egg from the UK.
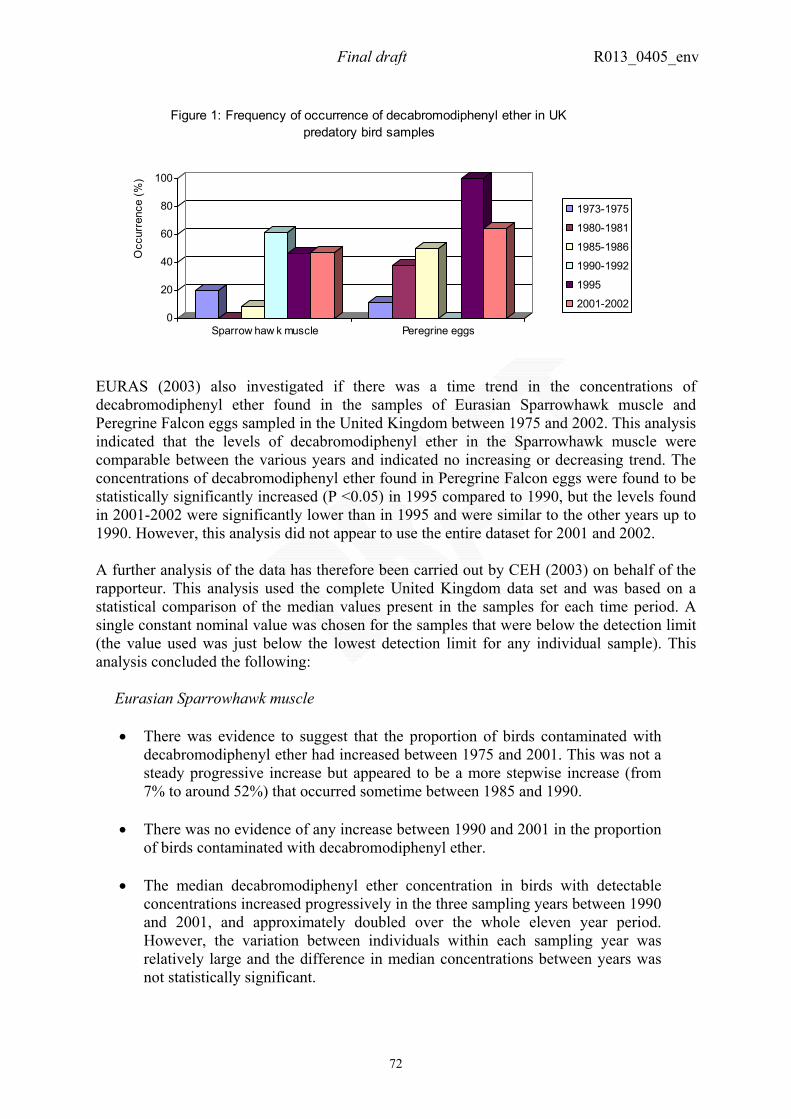
Final draft R013_0405_env
72
0
20
40
60
80
100
Occ
urre
nce
(%)
Sparrow haw k muscle Peregrine eggs
Figure 1: Frequency of occurrence of decabromodiphenyl ether in UK predatory bird samples
1973-1975
1980-1981
1985-1986
1990-1992
1995
2001-2002
EURAS (2003) also investigated if there was a time trend in the concentrations of decabromodiphenyl ether found in the samples of Eurasian Sparrowhawk muscle and Peregrine Falcon eggs sampled in the United Kingdom between 1975 and 2002. This analysis indicated that the levels of decabromodiphenyl ether in the Sparrowhawk muscle were comparable between the various years and indicated no increasing or decreasing trend. The concentrations of decabromodiphenyl ether found in Peregrine Falcon eggs were found to be statistically significantly increased (P <0.05) in 1995 compared to 1990, but the levels found in 2001-2002 were significantly lower than in 1995 and were similar to the other years up to 1990. However, this analysis did not appear to use the entire dataset for 2001 and 2002. A further analysis of the data has therefore been carried out by CEH (2003) on behalf of the rapporteur. This analysis used the complete United Kingdom data set and was based on a statistical comparison of the median values present in the samples for each time period. A single constant nominal value was chosen for the samples that were below the detection limit (the value used was just below the lowest detection limit for any individual sample). This analysis concluded the following:
Eurasian Sparrowhawk muscle • There was evidence to suggest that the proportion of birds contaminated with
decabromodiphenyl ether had increased between 1975 and 2001. This was not a steady progressive increase but appeared to be a more stepwise increase (from 7% to around 52%) that occurred sometime between 1985 and 1990.
• There was no evidence of any increase between 1990 and 2001 in the proportion of birds contaminated with decabromodiphenyl ether.
• The median decabromodiphenyl ether concentration in birds with detectable
concentrations increased progressively in the three sampling years between 1990 and 2001, and approximately doubled over the whole eleven year period. However, the variation between individuals within each sampling year was relatively large and the difference in median concentrations between years was not statistically significant.
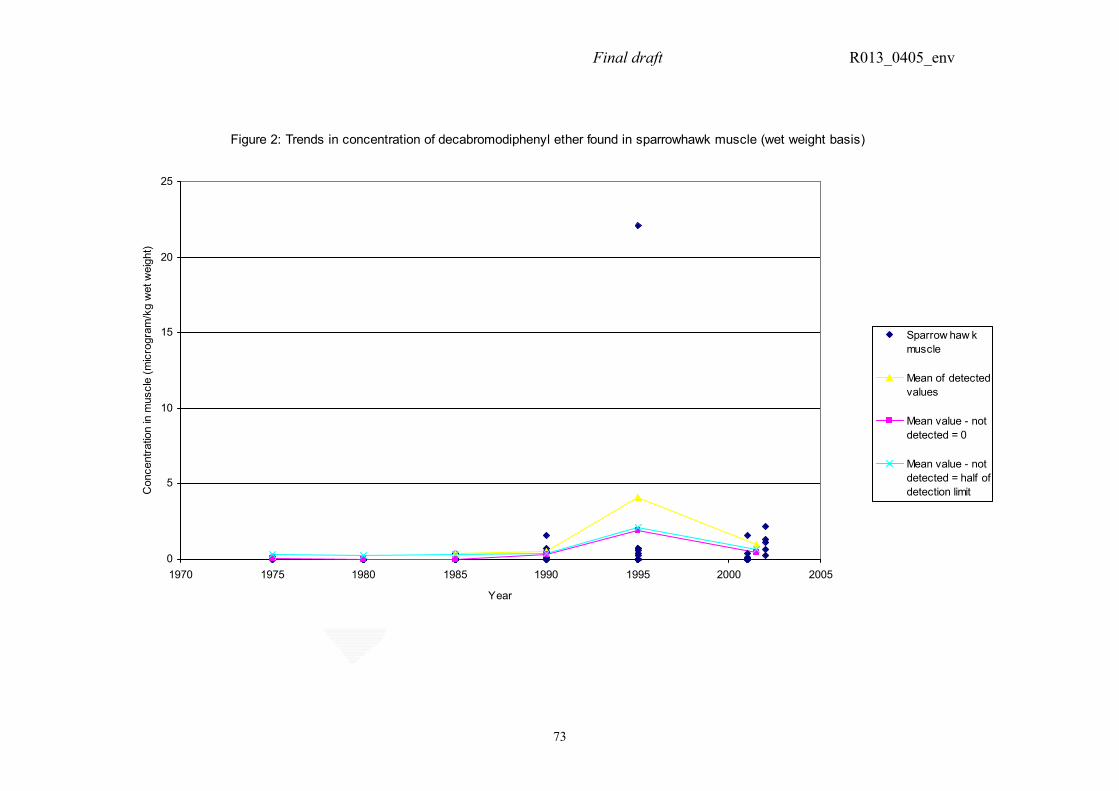
Final draft R013_0405_env
73
Figure 2: Trends in concentration of decabromodiphenyl ether found in sparrowhawk muscle (wet weight basis)
0
5
10
15
20
25
1970 1975 1980 1985 1990 1995 2000 2005
Year
Con
cent
ratio
n in
mus
cle
(mic
rogr
am/k
g w
et w
eigh
t)
Sparrow haw kmuscle
Mean of detectedvalues
Mean value - notdetected = 0
Mean value - notdetected = half ofdetection limit
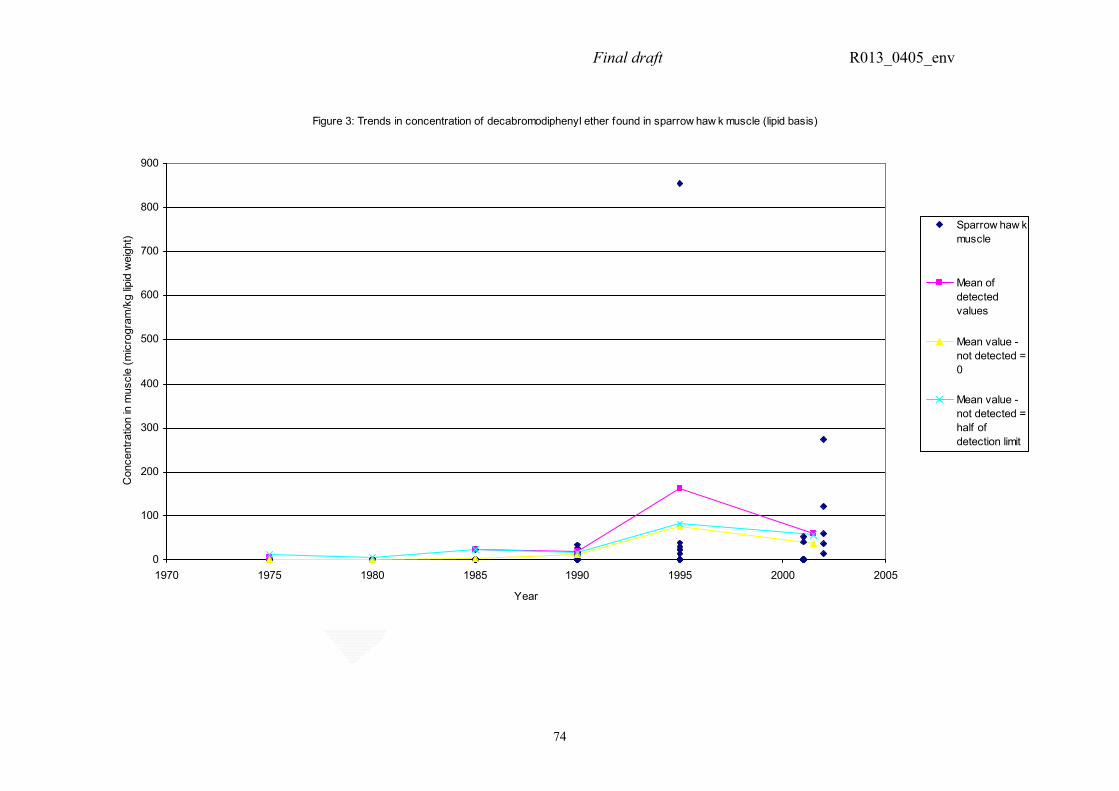
Final draft R013_0405_env
74
Figure 3: Trends in concentration of decabromodiphenyl ether found in sparrow haw k muscle (lipid basis)
0
100
200
300
400
500
600
700
800
900
1970 1975 1980 1985 1990 1995 2000 2005
Year
Con
cent
ratio
n in
mus
cle
(mic
rogr
am/k
g lip
id w
eigh
t)
Sparrow haw kmuscle
Mean ofdetectedvalues
Mean value -not detected =0
Mean value -not detected =half ofdetection limit
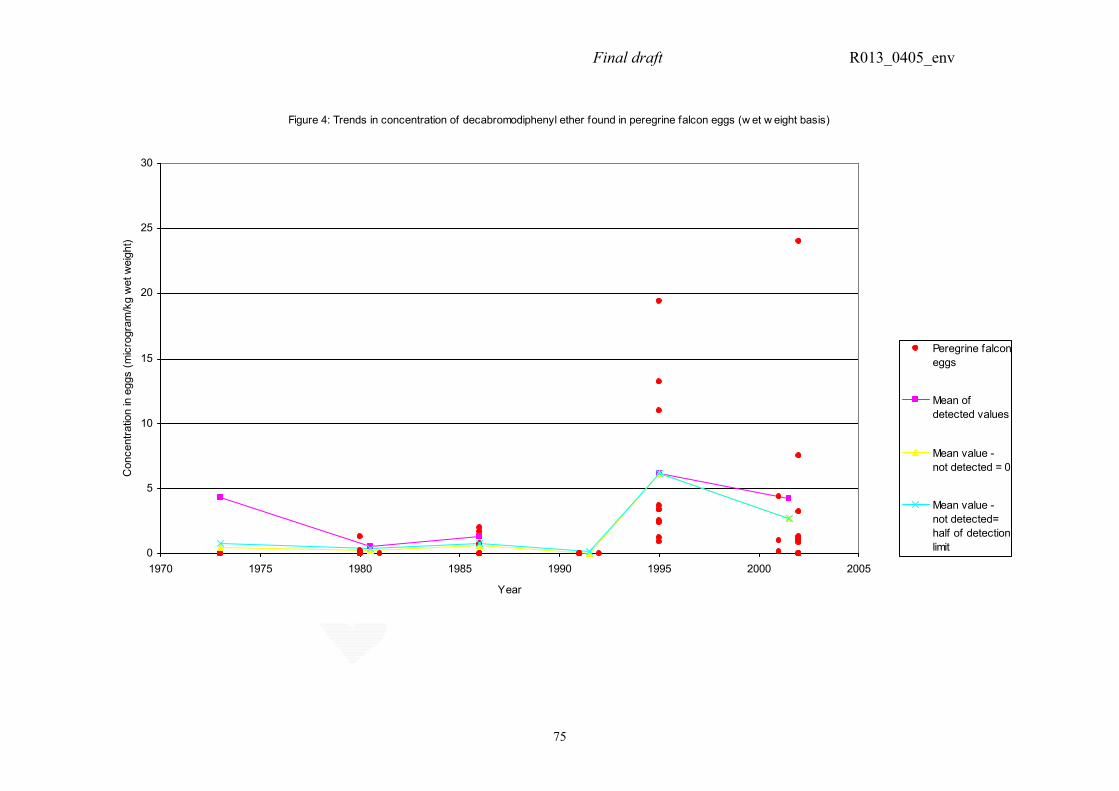
Final draft R013_0405_env
75
Figure 4: Trends in concentration of decabromodiphenyl ether found in peregrine falcon eggs (w et w eight basis)
0
5
10
15
20
25
30
1970 1975 1980 1985 1990 1995 2000 2005
Year
Con
cent
ratio
n in
egg
s (m
icro
gram
/kg
wet
wei
ght)
Peregrine falconeggs
Mean ofdetected values
Mean value -not detected = 0
Mean value -not detected=half of detectionlimit
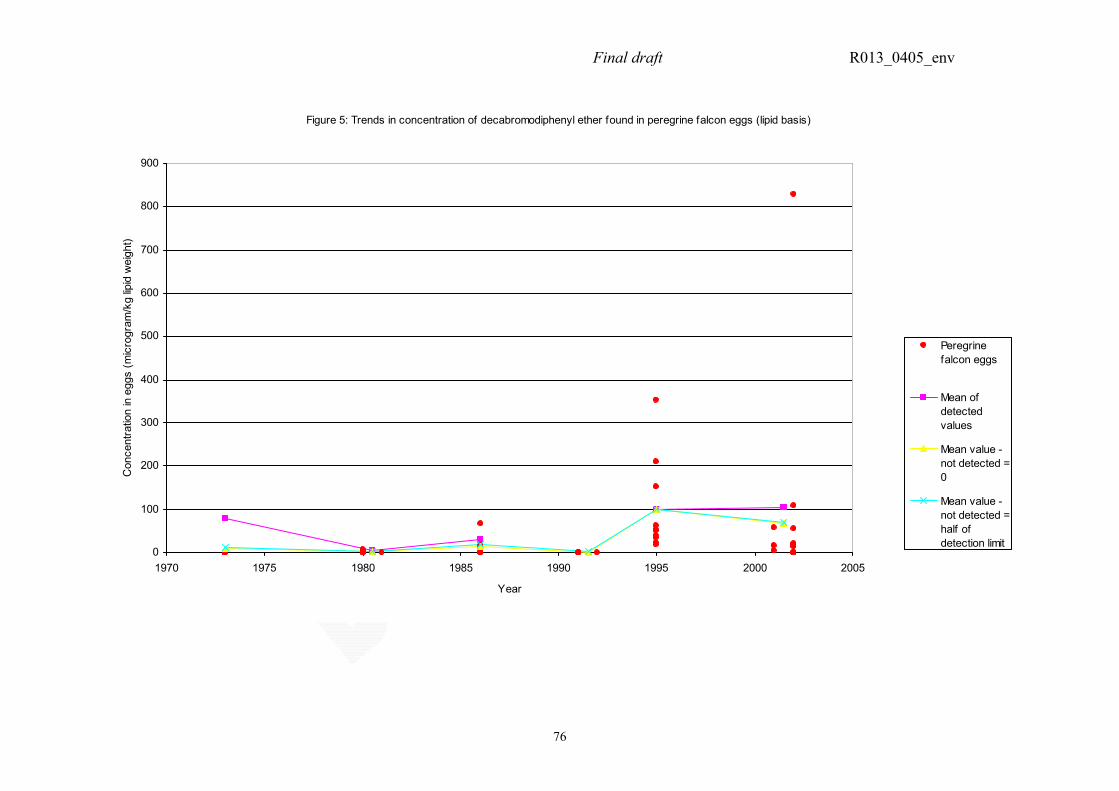
Final draft R013_0405_env
76
Figure 5: Trends in concentration of decabromodiphenyl ether found in peregrine falcon eggs (lipid basis)
0
100
200
300
400
500
600
700
800
900
1970 1975 1980 1985 1990 1995 2000 2005
Year
Con
cent
ratio
n in
egg
s (m
icro
gram
/kg
lipid
wei
ght)
Peregrinefalcon eggs
Mean ofdetectedvalues
Mean value -not detected =0
Mean value -not detected =half ofdetection limit
Final draft R013_0405_env
77
Peregrine Falcon eggs • There was some evidence to suggest that the proportion of eggs contaminated
with decabromodiphenyl ether may have doubled from the period 1973-1987 to the period 1987-2002. However, quantification of the scale of change was hampered by inter-year variability, particularly in the second time period. The most extreme variation was between 1991/2 (none of the six eggs sampled were contaminated) and 1995 (all ten eggs contaminated).
• The median decabromodiphenyl ether concentrations in eggs varied between
years but there was no progressive trend over time. The decabromodiphenyl ether concentration was statistically significantly greater in eggs from 1995 than in eggs from several earlier sampling periods but the levels in 1995 were not statistically significantly different from those in 2001-2002.
• There was no evidence that the proportion of eggs contaminated with
decabromodiphenyl ether or the concentrations of decabromodiphenyl ether in those eggs has increased progressively between 1987 and 2001-2002.
Overall, in general terms, levels currently found in both species examined are clearly higher than 20 years ago. In this context it may be relevant to note that the consumption of decabromodiphenyl ether in the UK would have increased significantly following the introduction of fire safety legislation for domestic furniture in 1988. A step increase in tissue levels was apparent shortly after this, but there is no clear evidence of any further statistically significant change in levels between 1995 and 2001/2002. Industry has commented that the total consumption of decabromodiphenyl ether in the EU has not changed very much during that period. It should be noted that the number of samples used in this study was small and may not be sufficiently representative to allow proper conclusions to be made about the levels in bird populations as a whole. They were also obtained from locations all over the United Kingdom, which might have masked other patterns (there were too few samples from specific locations to determine this). A proper randomisation protocol was not possible because of the nature of the tissue archive, and so there may be some important hidden biases13. The large amount of variation in the data set makes it difficult to judge whether levels might actually be increasing or not. Toxicokinetic studies in rats do not reveal a clear relationship between external and internal dose (see the original risk assessment report). The rate of absorption decreases with increasing dose suggesting a saturable mechanism of absorption. It is unclear, however, if this process has already achieved non-linearity in the range of exposure of the predatory birds. Therefore, it is impossible to predict whether long-term exposure at current or higher environmental levels will lead to an increase in the levels in biota. It is also not possible to speculate about future trends in these species with changes in use pattern, nor whether levels or trends could be different in other species that have not yet been examined (such as waterfowl).
13 For example although each egg analysed came from a separate clutch, all the Gannet eggs came from one colony and so the Gannet results do not provide spatial information in variation between colonies. Therefore it is difficult to determine any geographical trends from the data.
Final draft R013_0405_env
78
Finally, it should be noted that the monitoring studies only investigate the presence of the parent compound. Toxicokinetic studies in mammals suggest that a large number of metabolites may be formed, and the overall burden of these in wild organisms is unknown. 3.1.4.2.3 Levels in humans Summary of original risk assessment report Decabromodiphenyl ether had been found to be present in blood plasma of hospital workers, computer clerks, electronic equipment dismantlers and smelter workers in the EU. The levels found were up to 9.9 µg/kg lipid. Updated information A number of studies have reported the detection of low levels of decabromodiphenyl ether in human blood (both workers possibly occupationally exposed to decabromodiphenyl ether, and the general population) and breast milk samples in recent years. Further details are provided in Section 4.xxx. 3.1.4.2.4 Comparison of predicted and measured levels Decabromodiphenyl ether has been found to be present in some samples of fish. The levels are generally low, often close to the detection limit of the method used, and are generally consistent with the low predicted concentrations (0.7-4.4 µg/kg wet weight). No measured data are available for earthworms from the environment, but laboratory studies have shown little or no uptake into earthworms from the soil (see Section 3.1.4.1.2). The new data indicate that levels in marine mammals are generally low (below the limit of detection), although it should be noted that decabromodiphenyl ether had been previously detected at low levels in some samples of marine mammals (e.g. dolphin liver, Harbour Seal liver and blubber and Harbour Porpoise blubber and liver; see original risk assessment report). The presence of decabromodiphenyl ether in predatory birds and their eggs has been confirmed. The findings are widespread and involve a number of species. A higher occurrence seems to found in certain terrestrial feeding species than in aquatic feeding species, although this is only a generalisation. Time trends cannot be identified with confidence in view of the size and variability of the data set. The actual route of exposure of these birds to decabromodiphenyl ether is unknown. Recent information has indicated that decabromodiphenyl ether is present in some species of terrestrial mammals including Polar Bear, Lynx, Moose and Western Roe Deer. The estimated PECs will be used for risk characterisation (Section 3.3.4), but the measured levels will also be considered in the PBT assessment (Section 3.3.5.2). 3.1.5 Exposure assessment for the marine environment No exposure assessment for the marine environment was carried out in the original risk assessment. The methodology outlined in the revised Technical Guidance Document
Final draft R013_0405_env
79
essentially assumes that the adsorption/desorption, degradation and accumulation behaviour in the marine environment can, in the absence of specific information for the marine environment, be adequately described by the properties of the substance relevant for the freshwater environment. The starting point for the local marine assessment is the concentration of decabromodiphenyl ether in effluent from the site of discharge. This effluent from industrial sites is assumed to enter into the marine environment without further waste water treatment. As all the emissions are estimated on a mass/day basis, in order to estimate these concentrations, knowledge of the total aqueous effluent volume discharge from generic sites is needed. These data are not available. In this situation the Technical Guidance indicates that it can be assumed that the amount emitted per day is diluted into a volume of 200,000 m3, with adsorption onto suspended matter also being taken into account. The number of sites in coastal regions that may actually be emitting the substance is unknown. The emission estimates used as the starting point for the marine risk assessment are shown in Table 24. This table also shows the resulting concentrations in seawater, marine sediment and marine biota. For secondary poisoning, the concentrations in predators and top predators have been estimated using the following equations: PECoral, predator = 0.5×(PEClocal, seawater, ann+ PECregional, seawater) ×BCFfish×BMF1
PECoral, top predator = (0.1×PEClocal,seawater, ann+0.9×PECregional, seawater)×BCFfish×BMF1×BMF2 For decabromodiphenyl ether the values for BMF1 and BMF2 have been taken to be 1 as recommended in the Technical Guidance Document for a substance with a fish BCF <2,000 l/kg. It should be noted that it is currently not possible to estimate a regional concentration in seawater owing to the lack of a suitable nested steady state distribution model with the properties outlined in the guidance. Therefore, the calculations in Table 24 have assumed that the PECregional, seawater is around 1/10th of the PECregional obtained in Section 3.1.1.1.2 for land-based sources. Hence the PECregional, seawater is taken to be 7.8 x 10⁻⁴ µg/l.
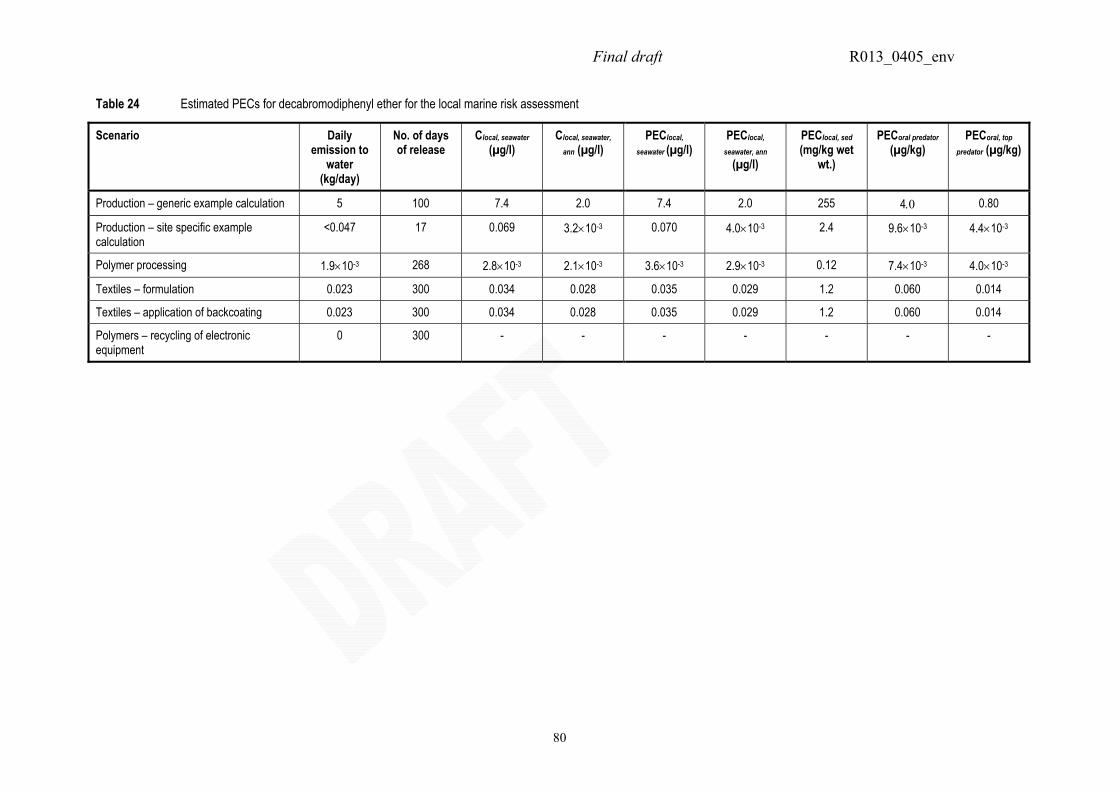
Final draft R013_0405_env
80
Table 24 Estimated PECs for decabromodiphenyl ether for the local marine risk assessment
Scenario
Daily emission to
water (kg/day)
No. of days of release
Clocal, seawater (µg/l)
Clocal, seawater,
ann (µg/l) PEClocal,
seawater (µg/l) PEClocal,
seawater, ann (µg/l)
PEClocal, sed (mg/kg wet
wt.)
PECoral predator (µg/kg)
PECoral, top
predator (µg/kg)
Production – generic example calculation 5 100 7.4 2.0 7.4 2.0 255 4.0 0.80
Production – site specific example calculation
<0.047 17 0.069 3.2×10⁻³ 0.070 4.0×10⁻³ 2.4 9.6×10⁻³ 4.4×10⁻³
Polymer processing 1.9×10⁻³ 268 2.8×10⁻³ 2.1×10⁻³ 3.6×10⁻³ 2.9×10⁻³ 0.12 7.4×10⁻³ 4.0×10⁻³
Textiles – formulation 0.023 300 0.034 0.028 0.035 0.029 1.2 0.060 0.014
Textiles – application of backcoating 0.023 300 0.034 0.028 0.035 0.029 1.2 0.060 0.014
Polymers – recycling of electronic equipment
0 300 - - - - - - -
Final draft R013_0405_env
81
3.2 EFFECTS ASSESSMENT: HAZARD IDENTIFICATION AND DOSE (CONCENTRATION) – RESPONSE (EFFECT) ASSESSMENT
3.2.1 Aquatic compartment (including sediment) 3.2.1.1 Summary of original risk assessment report Based on the available data for fish and algae, decabromodiphenyl ether appears to have a very low toxicity in acute tests, with no effects being seen up to the substances water solubility limit. It was therefore not possible to derive a PNEC for surface water. For sediment, no effects were seen in long-term tests with the oligochaete Lumbriculus variegatus in two sediment types at concentrations up to 3,841 mg/kg dry weight (equivalent to 1,480 mg/kg on a wet weight basis). A PNECsediment of ≥ 148 mg/kg wet weight was derived based on these data. The NOEC for microorganisms was ≥ 15 mg/l, and a PNECmicroorganisms of ≥ 1.5 mg/l was derived for waste water treatment processes. 3.2.1.2 Updated information No new data relating to the toxicity of decabromodiphenyl ether in aquatic organisms exposed via water have been identified. Therefore it is not possible to derive a meaningful PNEC for surface water. The PNECsediment will be taken to be ≥ 148 mg/kg wet weight and the PNECmicroorganisms will be taken to be ≥ 1.5 mg/l as before. For the marine environment it is not possible to derive a PNECmarine, water. For the marine sediment compartment an assessment factor of 50 appears to be appropriate for the NOEC of ≥ 1,480 mg/kg wet weight Lumbriculus variegatus (based on the data available for pentabromodiphenyl ether, tests with other freshwater species are unlikely to be more sensitive to decabromodiphenyl ether than Lumbriculus sp. (see original risk assessment report)). Therefore a PNECmarine, sediment of ≥ 29.6 mg/kg wet weight is derived for the marine risk assessment. Indications of effects in fish through exposure via contaminated food have been found in a study designed primarily to investigate the metabolism of decabromodiphenyl ether. The study was carried out by Stapleton et al. (2003c) and details of the study are given in Section 3.1.0.6.2. In the study juvenile fish were exposed to a concentration of decabromodiphenyl ether (940 µg/kg wet weight) for 60 days and effects on growth rate and also lipid content were seen in the exposed fish compared with control fish (both the growth rate and lipid contents were found to be statistically significantly reduced (p=0.05) in the exposed group compared to the control group). The growth rate was 7.7×10⁻³±1×10⁻⁴ day-1 in the control fish compared with 5.4×10⁻³±2.0×10⁻³ day-1 in the exposed fish and the mean lipid content over the whole exposure period was 2.7±1.0% in the control fish compared with 1.9±0.8% in the exposed fish. It should be noted that this study was not designed as a toxicity study, and the number of fish sampled at each time point was relatively low (the total number of tanks used was five, two control tanks and three replicate exposure tanks, and one fish was analysed from each tank at each time point). The significance of the possible toxic effects is not discussed in the paper by Stapleton et al. (2003c).
Final draft R013_0405_env
82
The Stapleton et al. (2003c) study found little or no uptake of decabromodiphenyl ether during the study, but did provide evidence that lower brominated congeners were being taken up by the fish, probably as a result of metabolism of decabromodiphenyl ether. Thus it is possible that any toxic effects seen in this study could be the result of these debrominated products (or other metabolic products) rather than direct toxicity of decabromodiphenyl ether itself. However, from the risk assessment point of view, the active “toxic agent” is not so relevant (i.e. it is not necessarily important to know how the observed toxicity arises) as the study shows that exposure to 940 µg/kg food of decabromodiphenyl ether results in possible adverse effects in the fish. Unfortunately, as only a single concentration was tested, it is not possible to identify whether the observed effects follow a dose response pattern or to estimate a NOEC. This result is considered further in the risk characterisation (see Section 3.3.4 and 3.3.5.2). 3.2.2 Terrestrial compartment 3.2.2.1 Summary of original risk assessment report Long-term toxicity data were available for plants and earthworms. No effects were seen on plants at a concentration of up to 5,349 mg/kg dry weight. The NOEC from the earthworm study was ≥ 4,910 mg/kg dry weight. A PNECsoil of ≥ 87 mg/kg dry weight was derived for the terrestrial compartment. 3.2.2.2 Updated information No new data relating to the toxicity of decabromodiphenyl ether in terrestrial systems have been identified. Therefore the PNECsoil will be taken to be ≥ 87 mg/kg dry weight as before. 3.2.3 Atmosphere 3.2.3.1 Summary of original risk assessment report Direct emissions of decabromodiphenyl ether to the atmosphere are likely to be very low. No biotic or abiotic effects are likely because of limited release and low volatility of decabromodiphenyl ether. 3.2.3.2 Updated information No new data relating to the effects of decabromodiphenyl ether in the atmospheric compartment have been identified. Therefore it is not possible to derive a meaningful PNEC. 3.2.4 Non-compartment specific effects relevant for the food chain
(secondary poisoning) 3.2.4.1 Summary of original risk assessment report The lowest long-term NOAEL was 1,120 mg/kg bw/day or 25,000 mg/kg food for systemic effects in a two year chronic study in rats. The PNECoral was derived as 2,500 mg/kg food.
Final draft R013_0405_env
83
However, it was also reported that effects were seen in a mouse neurotoxicity study at a single dose of 2.22 mg/kg bw, but few details of the study were available at the time. 3.2.4.2 Updated information A scientific paper describing the mouse developmental neurotoxicity study with decabromodiphenyl ether has now been published (Viberg et al., 2003). Further details are provided in Section 4.xxx. The authors concluded that exposure to decabromodiphenyl ether during a defined critical phase of neonatal brain development could give rise to irreversible changes in adult brain function, and that these changes appeared to worsen with age. The authors considered that it was not possible to determine a clear NOAEL from these data. It was also indicated that further studies would be needed to evaluate whether the parent compound (decabromodiphenyl ether) or its metabolites caused the effects. As described in Section 4.xxx, human health experts have made a number of criticisms of this study although it has been concluded that it is not possible to totally dismiss the results. Since the results cannot be used to draw a final conclusion for human health a new developmental neurotoxicity study in mice is required to investigate this endpoint further. 3.2.4.3 Predicted no effect concentration (PNEC) for secondary poisoning The PNEC used for secondary poisoning in the original risk assessment report was 2,500 mg/kg food. This was based on a NOAEL of 1,120 mg/kg body weight/day and an assessment factor of 10. The new Technical Guidance Document would now apply an assessment factor of 30 to this result (two-year chronic study), and so a PNEC of 833 mg/kg food will be considered in this revised assessment. The Viberg et al. (2003) developmental neurotoxicity study provides some indication that decabromodiphenyl ether has a potential to cause effects on mammalian systems at doses significantly lower than would be indicated by the PNEC used in the original risk assessment. Human health experts have not dismissed this study and so it has to be taken into account in the assessment of secondary poisoning. Nevertheless, it cannot be used directly in risk characterisation because:
• The authors of the paper considered that a clear NOAEL could not be determined in the study as some slight, but statistically (and potentially biologically) significant neurobehavioural effects were seen at the lowest dose level of 2.22 mg/kg when given on day 3 (although, given the relatively minor nature of the effects at this dose, it is possible that this dosing level is close to the NOAEL and it could be considered as such for illustrative purposes in this assessment).
• There are scientific criticisms of the study itself (see Section 4.xxx for further details).
For these reasons a PNEC cannot be derived based on the Viberg et al. (2003) data. Instead, for a provisional assessment, it is proposed that the dose levels used in the Viberg et al. (2003) study are compared directly with the levels found in the recent bird eggs samples. Although it is recognised that the extrapolation of the mouse data to birds is highly uncertain, and there are also several uncertainties associated with the study itself (see above), there is a rationale behind this as the developing bird embryo is clearly being exposed to
Final draft R013_0405_env
84
decabromodiphenyl ether (and presumably the decabromodiphenyl ether present in the egg will then be present in the young bird at hatch). As the egg monitoring data effectively represent the ‘internal dose’ of the egg/embryo/young bird, the Viberg et al. (2003) data also need to be considered in terms of the ‘internal dose’ received by the neonatal mice. The lowest dose tested in the Viberg et al. (2003) study was 2.22 mg/kg body weight. The actual ‘internal dose’ received by the mice will depend on the absorption efficiency. If this is 100% then the ‘internal dose’ would be 2.22 mg/kg wet weight, but the actual ‘internal dose’ would decrease as the absorption efficiency decreases. It is clear from the reported mouse data that at least 13.4% of the administered dose of decabromodiphenyl ether was present (either as metabolites or parent compound) in the brain, heart and liver of the mice 24 hours after dosing. This figure, however, may underestimate the actual absorption efficiency as only three tissues were analysed. The data of Sandholm et al. (2003) showed that around 26% of an administered dose (using a 4:4:1 v/v mixture of dimethylamide:polyethylene glycol:water mixture as vehicle) was thought to be bioavailable in rats, and similarly Mörck et al. (2003) found that at least 10% (and possibly up to 65%) of an oral dose (using a solution of soya phospholipone:Lutrol (16:34) in water (concentration 0.11 g/l) as vehicle) had been absorbed by rats (see Section 4.xxx). Although it is not possible to use these data directly (as they use different species and administration vehicles to those used in the Viberg et al. (2003) study), they do indicate that absorption of a single dose of decabromodiphenyl ether by mammals occurs and could be quite large. Assuming the minimum absorption seen in the Viberg et al. (2003) study is 13.4%, then the corresponding ‘internal dose’ for the 2.22 mg/kg body weight group would be 0.30 mg/kg wet weight. Similarly if it is assumed that the absorption efficiency is around 50%, then the ‘internal dose’ would be 1.11 mg/kg wet weight. These values are summarised below and will be used as a basis for a comparison with the levels found in the birds’ eggs in Section 3.3.4. Assumed absorption Estimated ‘internal dose’ 100% 2.22 mg/kg wet weight 50% 1.11 mg/kg wet weight 13.4% 0.30 mg/kg wet weight This is considered in the risk characterisation section under the PBT assessment (Section 3.3.5.2). As noted in Section 3.2.1.2, the apparent effects on fish growth following oral exposure observed in the Stapleton et al. (2003c) study will also be considered in the risk characterisation for the secondary poisoning end point.
Final draft R013_0405_env
85
3.3 RISK CHARACTERISATION 3.3.1 Aquatic compartment (including sediment) 3.3.1.1 Water Based on the currently available toxicity data, no effects are expected at concentrations up to the water solubility of the substance. The risk to the aquatic compartment (surface water) from decabromodiphenyl ether itself can be considered to be low. Given the nature of the substance, any releases to water are likely to be associated with the sediment/solid phase and so the assessment of effects on sediment organisms is much more relevant for this substance. Result ii) There is at present no need for further information and/or testing or for risk reduction
measures beyond those which are being applied already. 3.3.1.2 Sediment 3.3.1.2.1 Summary of original risk assessment report The PEC/PNEC ratios were <1 for all scenarios considered. No risks to the sediment compartment were identified. 3.3.1.2.2 Updated assessment The PNEC for sediment is estimated to be ≥ 148 mg/kg wet weight. The resulting updated PEC/PNEC ratios for sediment are shown in Table 25. Table 25 Summary of updated PEC/PNEC ratios for sediment
Scenario PEClocal, sediment PEC/PNEC
Production site – site specific example calculationa
31 mg/kg wet weight <0.21
Polymer processing 0.35 mg/kg wet weight <2.4×10⁻³
Polymers – recycling of electronic equipment
- -
Textiles – formulation 1.25 mg/kg wet weight <8.4×10⁻³
Textile – application of backcoating 1.25 mg/kg wet weight <8.4×10⁻³
Regional PECregional, sediment = 0.48 mg/kg wet weight <3.2×10⁻³
Continental PECcontinental, sediment = 0.020 mg/kg wet weight
<1.4×10⁻⁴
Note a) Production now ceased in the EU. Based on the PEC/PNEC ratios, the risk to the sediment compartment appears to be low. It should also be noted that the same conclusion was reached in the original risk assessment using more conservative emission estimates.
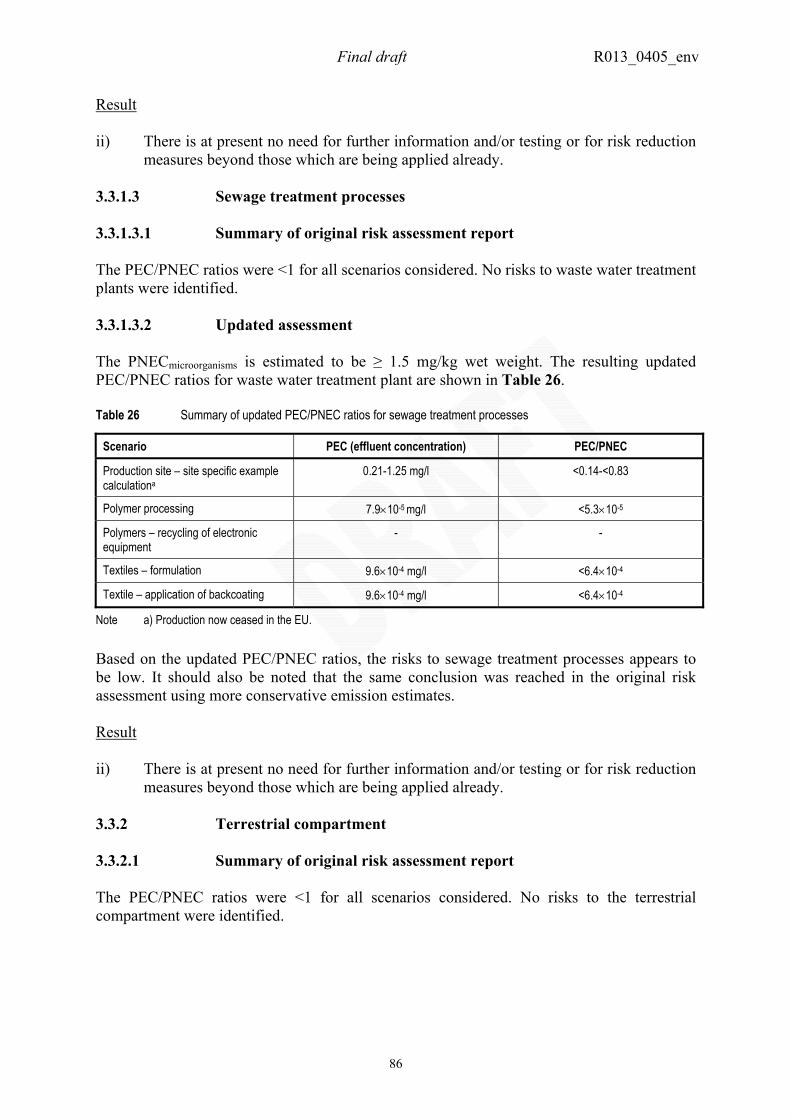
Final draft R013_0405_env
86
Result ii) There is at present no need for further information and/or testing or for risk reduction
measures beyond those which are being applied already. 3.3.1.3 Sewage treatment processes 3.3.1.3.1 Summary of original risk assessment report The PEC/PNEC ratios were <1 for all scenarios considered. No risks to waste water treatment plants were identified. 3.3.1.3.2 Updated assessment The PNECmicroorganisms is estimated to be ≥ 1.5 mg/kg wet weight. The resulting updated PEC/PNEC ratios for waste water treatment plant are shown in Table 26. Table 26 Summary of updated PEC/PNEC ratios for sewage treatment processes
Scenario PEC (effluent concentration) PEC/PNEC
Production site – site specific example calculationa
0.21-1.25 mg/l <0.14-<0.83
Polymer processing 7.9×10⁻⁵ mg/l <5.3×10⁻⁵
Polymers – recycling of electronic equipment
- -
Textiles – formulation 9.6×10⁻⁴ mg/l <6.4×10⁻⁴
Textile – application of backcoating 9.6×10⁻⁴ mg/l <6.4×10⁻⁴
Note a) Production now ceased in the EU. Based on the updated PEC/PNEC ratios, the risks to sewage treatment processes appears to be low. It should also be noted that the same conclusion was reached in the original risk assessment using more conservative emission estimates. Result ii) There is at present no need for further information and/or testing or for risk reduction
measures beyond those which are being applied already. 3.3.2 Terrestrial compartment 3.3.2.1 Summary of original risk assessment report The PEC/PNEC ratios were <1 for all scenarios considered. No risks to the terrestrial compartment were identified.
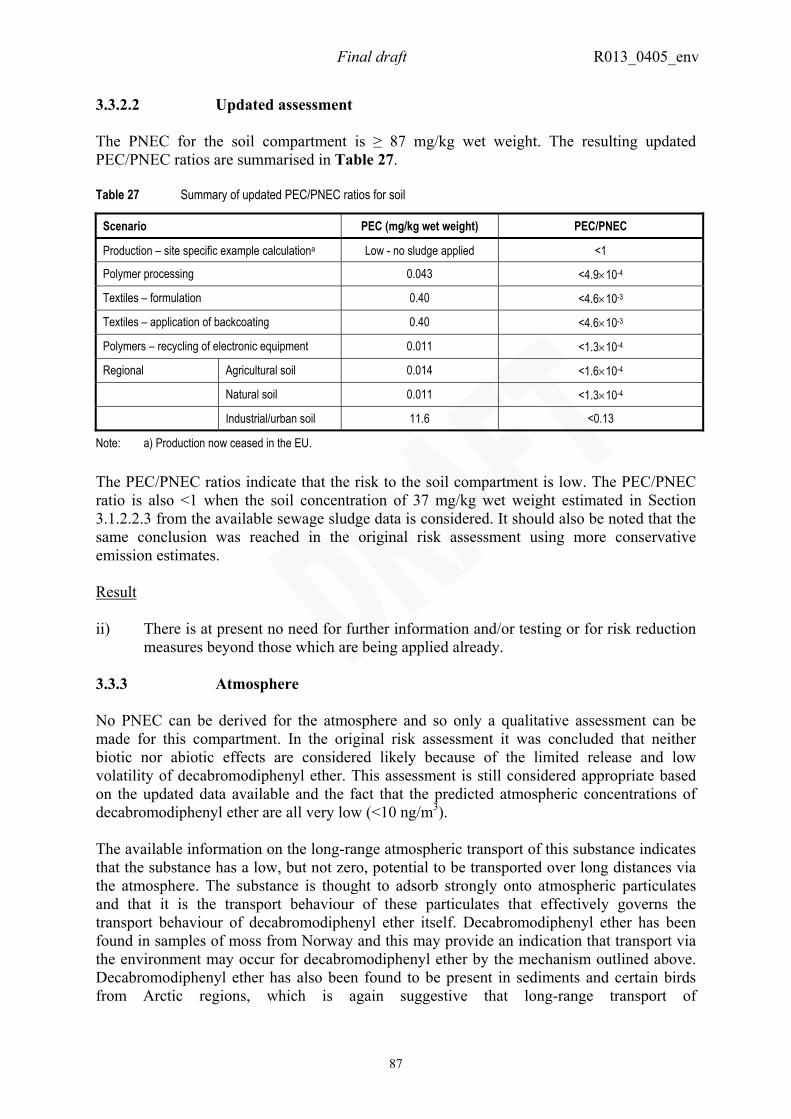
Final draft R013_0405_env
87
3.3.2.2 Updated assessment The PNEC for the soil compartment is ≥ 87 mg/kg wet weight. The resulting updated PEC/PNEC ratios are summarised in Table 27. Table 27 Summary of updated PEC/PNEC ratios for soil
Scenario PEC (mg/kg wet weight) PEC/PNEC
Production – site specific example calculationa Low - no sludge applied <1
Polymer processing 0.043 <4.9×10⁻⁴
Textiles – formulation 0.40 <4.6×10⁻³
Textiles – application of backcoating 0.40 <4.6×10⁻³
Polymers – recycling of electronic equipment 0.011 <1.3×10⁻⁴
Regional Agricultural soil 0.014 <1.6×10⁻⁴
Natural soil 0.011 <1.3×10⁻⁴
Industrial/urban soil 11.6 <0.13
Note: a) Production now ceased in the EU. The PEC/PNEC ratios indicate that the risk to the soil compartment is low. The PEC/PNEC ratio is also <1 when the soil concentration of 37 mg/kg wet weight estimated in Section 3.1.2.2.3 from the available sewage sludge data is considered. It should also be noted that the same conclusion was reached in the original risk assessment using more conservative emission estimates. Result ii) There is at present no need for further information and/or testing or for risk reduction
measures beyond those which are being applied already. 3.3.3 Atmosphere No PNEC can be derived for the atmosphere and so only a qualitative assessment can be made for this compartment. In the original risk assessment it was concluded that neither biotic nor abiotic effects are considered likely because of the limited release and low volatility of decabromodiphenyl ether. This assessment is still considered appropriate based on the updated data available and the fact that the predicted atmospheric concentrations of decabromodiphenyl ether are all very low (<10 ng/m3). The available information on the long-range atmospheric transport of this substance indicates that the substance has a low, but not zero, potential to be transported over long distances via the atmosphere. The substance is thought to adsorb strongly onto atmospheric particulates and that it is the transport behaviour of these particulates that effectively governs the transport behaviour of decabromodiphenyl ether itself. Decabromodiphenyl ether has been found in samples of moss from Norway and this may provide an indication that transport via the environment may occur for decabromodiphenyl ether by the mechanism outlined above. Decabromodiphenyl ether has also been found to be present in sediments and certain birds from Arctic regions, which is again suggestive that long-range transport of
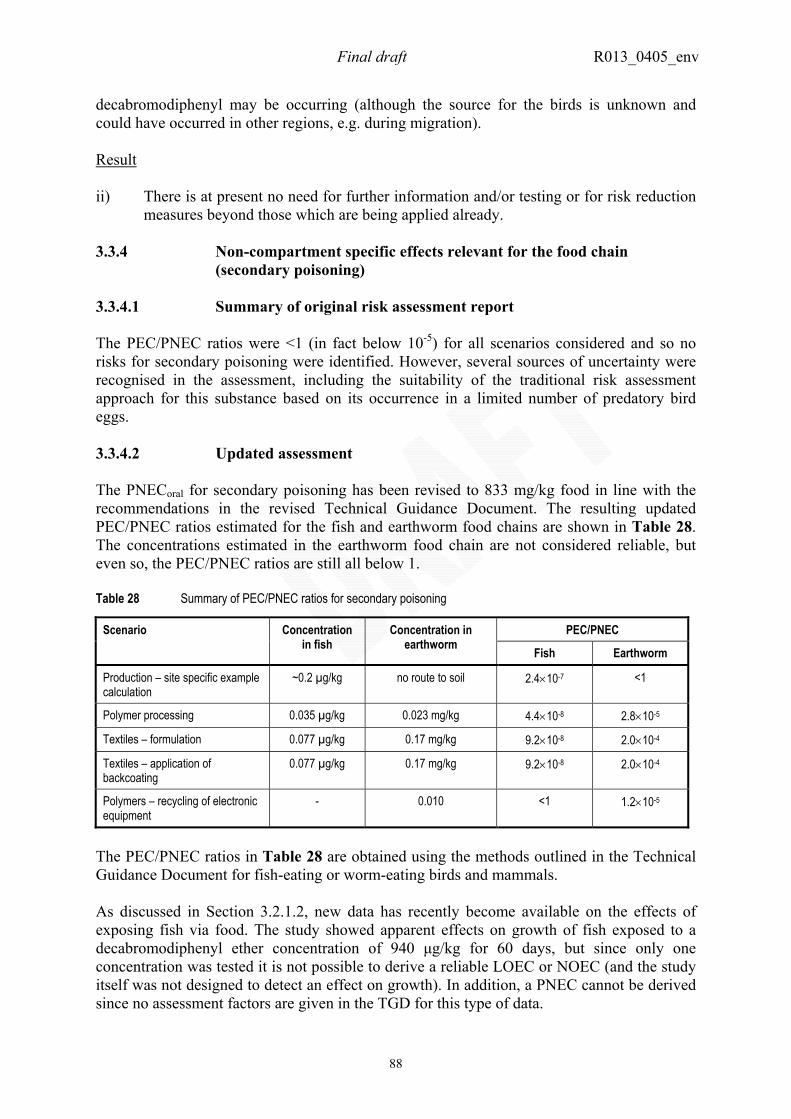
Final draft R013_0405_env
88
decabromodiphenyl may be occurring (although the source for the birds is unknown and could have occurred in other regions, e.g. during migration). Result ii) There is at present no need for further information and/or testing or for risk reduction
measures beyond those which are being applied already. 3.3.4 Non-compartment specific effects relevant for the food chain
(secondary poisoning) 3.3.4.1 Summary of original risk assessment report The PEC/PNEC ratios were <1 (in fact below 10-5) for all scenarios considered and so no risks for secondary poisoning were identified. However, several sources of uncertainty were recognised in the assessment, including the suitability of the traditional risk assessment approach for this substance based on its occurrence in a limited number of predatory bird eggs. 3.3.4.2 Updated assessment The PNECoral for secondary poisoning has been revised to 833 mg/kg food in line with the recommendations in the revised Technical Guidance Document. The resulting updated PEC/PNEC ratios estimated for the fish and earthworm food chains are shown in Table 28. The concentrations estimated in the earthworm food chain are not considered reliable, but even so, the PEC/PNEC ratios are still all below 1. Table 28 Summary of PEC/PNEC ratios for secondary poisoning
PEC/PNEC Scenario Concentration in fish
Concentration in earthworm Fish Earthworm
Production – site specific example calculation
~0.2 µg/kg no route to soil 2.4×10⁻⁷ <1
Polymer processing 0.035 µg/kg 0.023 mg/kg 4.4×10⁻⁸ 2.8×10⁻⁵
Textiles – formulation 0.077 µg/kg 0.17 mg/kg 9.2×10⁻⁸ 2.0×10⁻⁴
Textiles – application of backcoating
0.077 µg/kg 0.17 mg/kg 9.2×10⁻⁸ 2.0×10⁻⁴
Polymers – recycling of electronic equipment
- 0.010 <1 1.2×10⁻⁵
The PEC/PNEC ratios in Table 28 are obtained using the methods outlined in the Technical Guidance Document for fish-eating or worm-eating birds and mammals. As discussed in Section 3.2.1.2, new data has recently become available on the effects of exposing fish via food. The study showed apparent effects on growth of fish exposed to a decabromodiphenyl ether concentration of 940 µg/kg for 60 days, but since only one concentration was tested it is not possible to derive a reliable LOEC or NOEC (and the study itself was not designed to detect an effect on growth). In addition, a PNEC cannot be derived since no assessment factors are given in the TGD for this type of data.
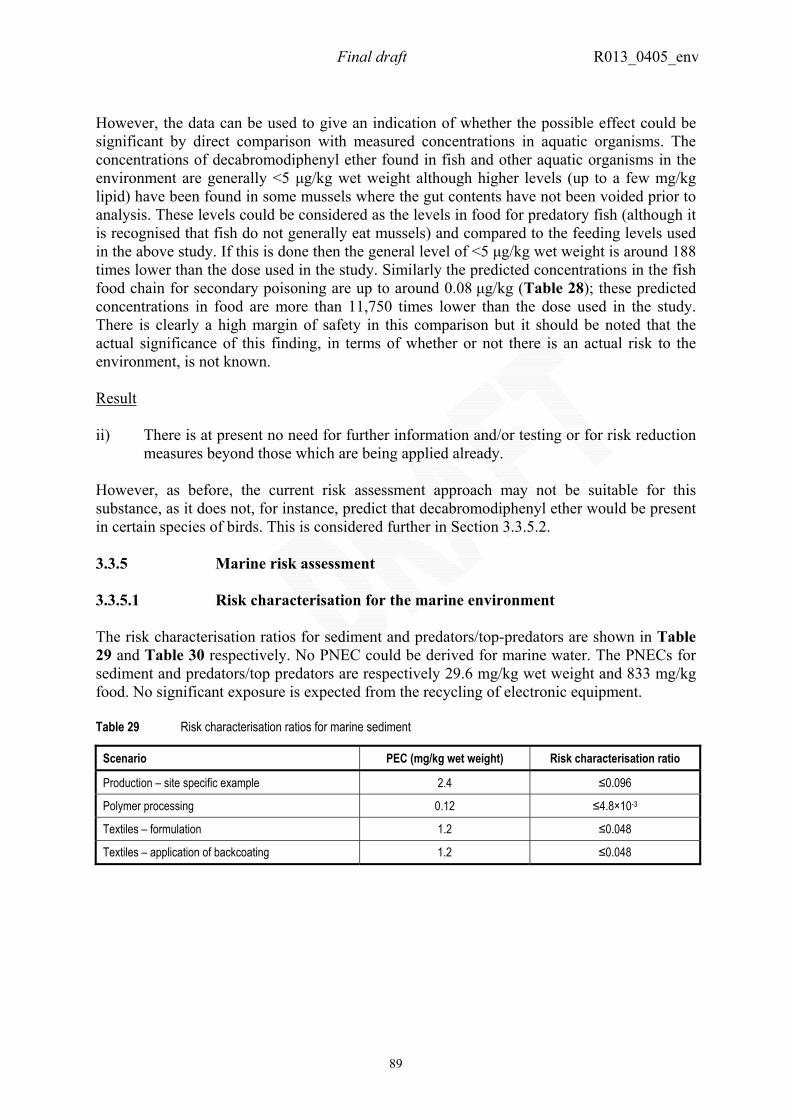
Final draft R013_0405_env
89
However, the data can be used to give an indication of whether the possible effect could be significant by direct comparison with measured concentrations in aquatic organisms. The concentrations of decabromodiphenyl ether found in fish and other aquatic organisms in the environment are generally <5 µg/kg wet weight although higher levels (up to a few mg/kg lipid) have been found in some mussels where the gut contents have not been voided prior to analysis. These levels could be considered as the levels in food for predatory fish (although it is recognised that fish do not generally eat mussels) and compared to the feeding levels used in the above study. If this is done then the general level of <5 µg/kg wet weight is around 188 times lower than the dose used in the study. Similarly the predicted concentrations in the fish food chain for secondary poisoning are up to around 0.08 µg/kg (Table 28); these predicted concentrations in food are more than 11,750 times lower than the dose used in the study. There is clearly a high margin of safety in this comparison but it should be noted that the actual significance of this finding, in terms of whether or not there is an actual risk to the environment, is not known. Result ii) There is at present no need for further information and/or testing or for risk reduction
measures beyond those which are being applied already. However, as before, the current risk assessment approach may not be suitable for this substance, as it does not, for instance, predict that decabromodiphenyl ether would be present in certain species of birds. This is considered further in Section 3.3.5.2. 3.3.5 Marine risk assessment 3.3.5.1 Risk characterisation for the marine environment The risk characterisation ratios for sediment and predators/top-predators are shown in Table 29 and Table 30 respectively. No PNEC could be derived for marine water. The PNECs for sediment and predators/top predators are respectively 29.6 mg/kg wet weight and 833 mg/kg food. No significant exposure is expected from the recycling of electronic equipment. Table 29 Risk characterisation ratios for marine sediment
Scenario PEC (mg/kg wet weight) Risk characterisation ratio
Production – site specific example 2.4 ≤0.096
Polymer processing 0.12 ≤4.8×10⁻³
Textiles – formulation 1.2 ≤0.048
Textiles – application of backcoating 1.2 ≤0.048
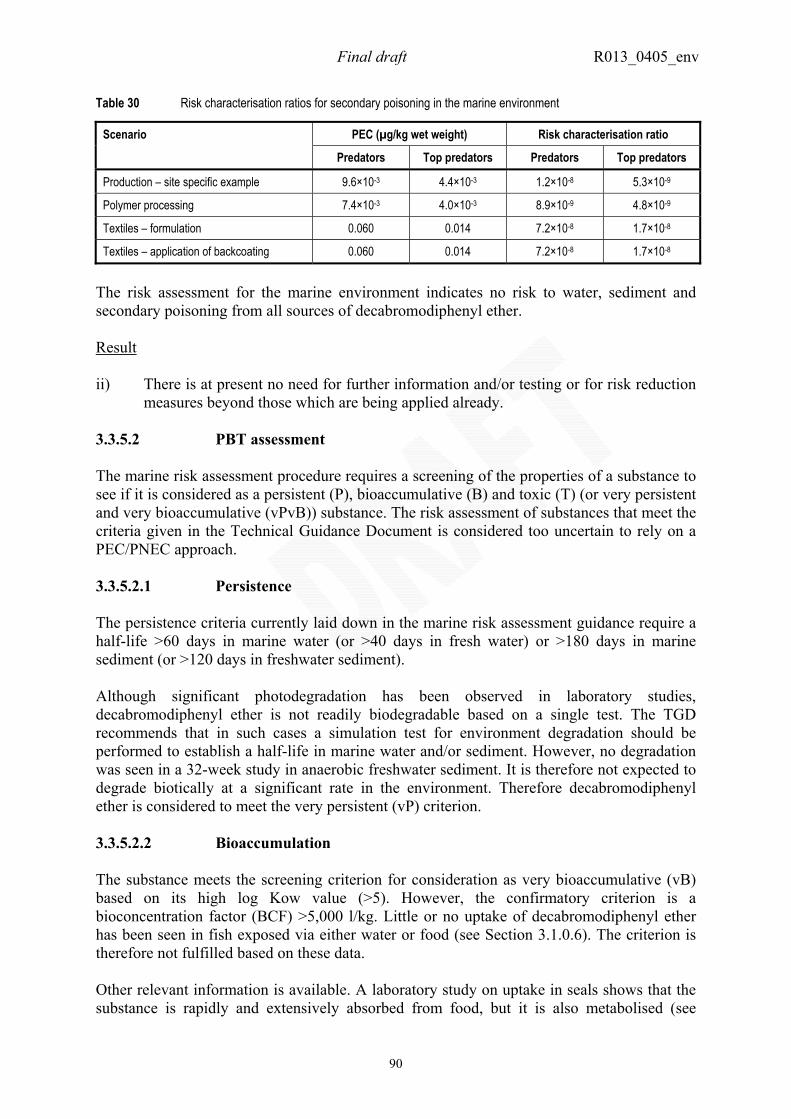
Final draft R013_0405_env
90
Table 30 Risk characterisation ratios for secondary poisoning in the marine environment
PEC (µg/kg wet weight) Risk characterisation ratio Scenario
Predators Top predators Predators Top predators
Production – site specific example 9.6×10⁻³ 4.4×10⁻³ 1.2×10⁻⁸ 5.3×10⁻⁹
Polymer processing 7.4×10⁻³ 4.0×10⁻³ 8.9×10⁻⁹ 4.8×10⁻⁹
Textiles – formulation 0.060 0.014 7.2×10⁻⁸ 1.7×10⁻⁸
Textiles – application of backcoating 0.060 0.014 7.2×10⁻⁸ 1.7×10⁻⁸
The risk assessment for the marine environment indicates no risk to water, sediment and secondary poisoning from all sources of decabromodiphenyl ether. Result ii) There is at present no need for further information and/or testing or for risk reduction
measures beyond those which are being applied already. 3.3.5.2 PBT assessment The marine risk assessment procedure requires a screening of the properties of a substance to see if it is considered as a persistent (P), bioaccumulative (B) and toxic (T) (or very persistent and very bioaccumulative (vPvB)) substance. The risk assessment of substances that meet the criteria given in the Technical Guidance Document is considered too uncertain to rely on a PEC/PNEC approach. 3.3.5.2.1 Persistence The persistence criteria currently laid down in the marine risk assessment guidance require a half-life >60 days in marine water (or >40 days in fresh water) or >180 days in marine sediment (or >120 days in freshwater sediment). Although significant photodegradation has been observed in laboratory studies, decabromodiphenyl ether is not readily biodegradable based on a single test. The TGD recommends that in such cases a simulation test for environment degradation should be performed to establish a half-life in marine water and/or sediment. However, no degradation was seen in a 32-week study in anaerobic freshwater sediment. It is therefore not expected to degrade biotically at a significant rate in the environment. Therefore decabromodiphenyl ether is considered to meet the very persistent (vP) criterion. 3.3.5.2.2 Bioaccumulation The substance meets the screening criterion for consideration as very bioaccumulative (vB) based on its high log Kow value (>5). However, the confirmatory criterion is a bioconcentration factor (BCF) >5,000 l/kg. Little or no uptake of decabromodiphenyl ether has been seen in fish exposed via either water or food (see Section 3.1.0.6). The criterion is therefore not fulfilled based on these data. Other relevant information is available. A laboratory study on uptake in seals shows that the substance is rapidly and extensively absorbed from food, but it is also metabolised (see
Final draft R013_0405_env
91
Section 3.1.0.6.2). Full details of this study have not been published yet. The substance has also been found in the tissues of a wide variety of marine organisms taken from the wild. However, it should be noted that the available data suggest that the substance is present at only very low levels in these samples (see Section 3.1.4.2.1). The presence of a synthetic substance in the tissues of top predators is clearly undesirable, but does not by itself necessarily constitute a risk. The interpretation of such monitoring data in terms of bioconcentration and bioaccumulation is not possible because the sources and concurrent exposure from environmental media are not known. Similarly, the finding of decabromodiphenyl ether over a wide scale at low (parts per billion) levels in a variety of predatory birds and their eggs - both in the UK and elsewhere (including Arctic regions) - is of relevance to this assessment (see Section 3.1.4.2.2). Such widespread exposure from a chemical used in textiles and polymers is unexpected, especially since this could not be readily anticipated from the known fate and environmental behaviour of this substance. Birds of prey are important ‘sentinel’ species since they sit at the top of food chains. No contemporary data exist on levels in other predators or potential food items, which makes it difficult to determine if food chain accumulation is responsible for the levels that are found. A crude comparison could be made of the levels predicted in fish and possible tissue levels in fish-eating species, assuming that the levels in eggs on a lipid basis are comparable to the levels in the parent birds. For example, the substance is rarely detected in fish (freshwater or marine), and levels are very close to the limit of detection (around 1 µg/kg lipid) when it is. The fact that the substance is detected at higher levels in birds might therefore imply that biomagnification is occurring. However, this depends crucially on fish being the route of exposure - a different conclusion would be drawn if contaminated sediment ingestion was the main source. It is therefore difficult to draw any meaningful conclusions on biomagnification potential based on the measured levels in biota at present because the actual route of exposure is unknown. Given the very large uncertainties, no quantitative comparisons are attempted in this assessment. This is considered further under the toxicity discussion below. Environmental degradation to form more accumulative products14 Although the substance is considered to be persistent in the environment, it is possible that eventual degradation can lead to the formation of lower PBDE congeners or other substances that are significantly more accumulative than the parent compound (some of these are considered to be PBT or vPvB in their own right). The direct substitution of bromine atoms by hydrogen is most likely to occur via abiotic mechanisms (particularly photodegradation) or anaerobic metabolism (e.g. in sediments, WWTP or possibly in the gastro-intestinal tract of organisms).
i) Photodegradation
The possible importance of photodegradation is discussed in Section 3.1.0.5.1. In summary, any photolysis of decabromodiphenyl ether that does take place in the environment could make a contribution to the levels of substances of concern (e.g. a steady-state build up of lower PBDE congeners could occur in a system with a continuous input of decabromodiphenyl ether). The magnitude of such a build up
14 A detailed discussion of the breakdown/transformation products (e.g. brominated dioxins and furans) formed during the life cycle of decabromodiphenyl ether (including burning and other high temperature processes) is included in the original risk assessment report.
Final draft R013_0405_env
92
would be difficult to predict, as it would depend on the rate of input of decabromodiphenyl ether into the system. Similarly, it is difficult to predict if a build up of other degradation products such as brominated furans could occur. It is impossible to quantify this further based on current knowledge. Whilst a further research programme could be requested in an attempt to resolve this issue, this would be difficult given the low solubility of the substance and associated analytical problems. Interpretation would still be complicated by the continuing inputs of lower PBDE congeners to the environment from other commercial products, and a lack of knowledge about the significance of other sources for substances like brominated dibenzofurans. On the balance of evidence, the rapporteur considers that the overall significance of this process is likely to be small (due principally to the limited exposure of the substance to sunlight and competing pathways to form hydroxylated substances). There is some supporting evidence from sediment cores, but further field observations would still be useful.
ii) Biotic degradation
There is some recent evidence that some organisms can debrominate the substance to the lower PBDE congeners (e.g. from studies with fish and in WWTP – see Sections 3.1.0.6.2 and 3.1.1.2.2 respectively). The relative significance of the rate of formation of lower congeners by any of these routes is unknown. Hydroxylated derivatives would be expected to predominate in aerobic systems, and the overall fate, behaviour and toxicity of these substances is not known with certainty.
In summary, the formation of PBT/vPvB substances in the environment as a result of degradation is a possibility that cannot be quantified based on current knowledge. Further information on trends in environmental levels of both the parent substance and its principal metabolites would be useful. Any significant formation of PBT/vPvB substances would be of serious concern. It should be noted that levels of the lower PBDE congeners in the environment are likely to be strongly correlated with the continuing release of these substances from articles still in use for some time into the future. Summary of bioaccumulation assessment Decabromodiphenyl ether does not meet either the bioaccumulative (B) or very bioaccumulative (vB) criterion described in the Technical Guidance Document based on fish data. The presence of the substance in the tissues of top predators might be an indication that biomagnification is taking place, but this is not clear because the routes of exposure are unknown. The significance of the formation of persistent and bioaccumulative degradation products is also uncertain. Further work is required to establish this, and this is discussed below. 3.3.5.2.3 Toxicity The available aquatic toxicity data for decabromodiphenyl ether show no effects at the limit of water solubility of the substance. In addition no effects were also seen in studies with the sediment species Lumbriculus variegatus. Evidence from mammals suggests that the substance has a low hazard potential in general, and it is not known to have any significant effects on mammals in terms of endocrine disruption or carcinogenicity, mutagenicity or
Final draft R013_0405_env
93
reproductive impairment. Therefore it is considered that decabromodiphenyl ether does not meet the T criterion based on this information. However, a single toxicity study provides some indication that it can cause behavioural disturbances in mice when they are exposed at a sensitive stage of brain development (possibly via a metabolite). This apparent toxicity makes the presence of decabromodiphenyl ether in the eggs of top predators an important and serious finding that must be considered as relevant in any assessment of long-term risk. Since the normal PEC/PNEC comparison methods described in the Technical Guidance Document do not apply to this situation, it is proposed for a provisional assessment that the measured levels in eggs are compared with the estimated ‘internal dose’ for developmental neurotoxicity in mice to derive an indicative estimate of the significance of the effect: • From Section 3.1.4.2.2, the overall 90th percentile concentration in eggs was
14.2 µg/kg wet weight (based on the 2002 data for all species). The maximum concentration was 24 µg/kg wet weight.
• In Section 3.2.4.3, the following ‘internal doses’ were estimated based on the
developmental neurotoxicity of decabromodiphenyl ether in mice: Assumed absorption Estimated ‘internal dose’ 100% 2.22 mg/kg wet weight 50% 1.11 mg/kg wet weight 13.4% 0.30 mg/kg wet weight When the estimated ‘internal dose’ for effects is compared to the 90th percentile measured concentration in eggs, the ratios obtained are around 156 (100% absorption), 78 (50% absorption) and 21 (13.4% absorption). The ratios for the egg with the highest concentration are 92 (100% absorption), 46 (50% absorption) and 12 (13.4% absorption). When considering these ratios it should be noted that:
a) they are based on an estimated ‘internal dose’ that might be causing an effect, and
b) if a PNEC were being considered (e.g. as in the secondary poisoning
scenario), the minimum assessment factor that could be applied to the toxicity data would be 30 (this factor is for use with chronic data; higher factors apply to other types of data).
Thus the fact that the ratios obtained are close to 30 (assuming 50% absorption) or below 30 (assuming 13.4% absorption) indicates that the current level of decabromodiphenyl ether in eggs is a possible reason for concern if the neurotoxic effects found in the Viberg et al. (2003) are confirmed. The levels in eggs are close to the lowest effect level from this study. However, it cannot be concluded that an actual risk to birds exists because of the large uncertainties in the data – both in terms of the extrapolation of the neurotoxic effect in mice to birds, and the robustness of the available toxicity data. Some experts have questioned the reliability of the results of the
Final draft R013_0405_env
94
Viberg et al. (2003) neurotoxicity study (on which the ratios are based). Further work to investigate these possible effects has been recommended for the human health assessment. In addition, there is no information on the lowest exposure/internal dose that can cause neurotoxic effects (or indeed any other adverse effect for this or similar substances) in birds. The impact of such an effect at the population level is unknown. There is no evidence of direct adverse impacts on populations but this has not been investigated. It is, however, unlikely that the impact of this substance is catastrophic. In summary, the significance of the residue levels that have been detected is still unknown but the apparent neurotoxicity gives some cause for concern15. 3.3.5.2.4 Summary of PBT assessment For the PBT assessment decabromodiphenyl ether can be considered to be very persistent (vP), but not bioaccumulative nor toxic based on the criteria provided in the TGD. However, the findings of the substance in top predators, evidence of neurotoxicity in mice and the potential for environmental degradation to persistent and bioaccumulative products complicate matters. The widespread presence of an anthropogenic substance in the tissues of wildlife species at the top of the food chain is undesirable, especially since the consequences of this exposure are unknown. It might even be an indication that biomagnification is taking place, although this is not clear because the routes of exposure are unknown. The data available about the significance of the occurrence of decabromodiphenyl ether in birds’ eggs and environmental degradation are of insufficient reliability and/or completeness to conclude that there is actually a risk – i.e. a conclusion (iii) cannot be drawn at this point in time. The risk at current levels of environmental contamination could even be considered acceptable (there is no firm evidence to show it is not, although the species found to be most contaminated are also those for which there is evidence of at least regional population declines). Had the proportion of birds that were contaminated been lower and/or shown a decreasing trend in contamination during the 1990s, this would have significantly added confidence to this conclusion. Conversely, had the time trend study shown that there were continuing increases in the proportion of animals contaminated and/or the levels of detectable residues, the risk would seem much less acceptable. Thus, the acceptability of current risk, in terms of bird contamination, would be based on the fact that there is no evidence of significantly increasing trends of contamination through the 1990s. However, the data on trends are very limited and effectively based on only three sampling points. It is important to remember that the substance is highly persistent and levels in sediments have been increasing in recent years. The use of the substance is also expected to increase steadily. It is therefore 15 It is noted for information that several of the species in which decabromodiphenyl ether was found are of current conservation concern in the UK. In particular, although the Peregrine Falcon population has more than recovered, overall, since the population crash induced by the effects of organochlorine pesticide contamination in the 1960s and ’70s, a serious population decline has recently taken place in the north and west of Scotland and the species has been very slow to recolonise parts of its former coastal distribution. The reasons for this are unknown. Similarly, it is believed that the Eurasian Sparrowhawk population plateaued in the early 1990s and has since been in shallow decline (H. Crick, British Trust for Ornithology, pers. com.). It is difficult to relate the measured levels of any substance that only has a sub-lethal effect to population trends in the species concerned, since populations fluctuate for a very large number of reasons (food availability, habitat change, persecution, etc.).
Final draft R013_0405_env
95
premature to conclude that there is no risk (conclusion (ii)), since the possibility that unacceptable effects may be occurring now or in the future cannot be ruled out. In this situation further information could be requested to address a number of outstanding questions, as follows:
• An investigation of toxicity in birds exposed via eggs, to include consideration of sub-lethal effects such as neurotoxicity.
• Further investigation of the neurotoxic potential in mice pups via direct dosing, to address the concerns raised about the Viberg et al. (2003) study. Such a study has in fact been requested for the health assessment. Nevertheless, the anticipated result would still only be in terms of an internal dose, and it is difficult to compare this with the egg data. The read across from mammals to birds would still be uncertain – for example it is known that birds are more sensitive to certain substances than mammals (e.g. DDT, selenium).
• Possibly a fish toxicity study using dietary exposure, to investigate the apparent effect on growth observed in a recent study on bioaccumulation.
• A study to establish the source of exposure of top predators. This will be difficult, but since point source exposure should be declining as a result of the voluntary Industry product stewardship programme, quantification of emissions from products in use and at disposal would be useful (since this has been shown to occur from a number of studies, but is difficult to quantify).
• Further, and on-going, environmental monitoring of both decabromodiphenyl ether, and possibly lower congeners and metabolites (including brominated dibenzofurans) to determine:
o Whether biomagnification in food chains is occurring. o Whether the belief that environmental degradation to PBT/vPvB
substances is insignificant is correct. o Possible sources of exposure of predators. o Trends in levels – a clear downward trend in levels would be
anticipated following the Industry’s voluntary emission reduction programme and the phase out of the other commercial PBDE products.
This would also be consistent with proposals currently being discussed under the Water Framework Directive (i.e. some of the data could arise from national monitoring schemes).
This conclusion is, in practice, almost the same as that presented in the original report. It should be noted that much of this work would be very difficult to perform, be expensive and would take a very long time to complete. The single piece of research that would do most to reduce the uncertainty of this assessment would be the measurement of dose-response relationships for embryos of predatory birds. This would permit the calculation of more reliable PEC/PNEC ratios. If combined with a toxicokinetic study, it might be possible to investigate whether the increased concentrations in terrestrial predatory birds are due to high exposure or less efficient metabolism. A toxicokinetics study might also permit the determination of the prevalence and persistence of lower congeners in tissues, and help inform the monitoring programme by indicating suitable chemicals to look for in biota.
Final draft R013_0405_env
96
This will not be straightforward to achieve. For example, exposure of eggs via dosing of adult birds would require an extensive series of preliminary tests to determine whether high enough levels could be achieved in eggs (the target tissue of interest) within a practical timeframe, and this would be expensive in terms of both animals and resources. Egg injection might be preferable, and standardised egg injection techniques have been developed for pesticide toxicity testing (A. Hart, Central Science Laboratory, pers. com.). Even then, there are no standard internationally accepted guidelines for avian neurotoxicity tests. A study could be performed to determine effects on reproductive performance (e.g. OECD 206 or the draft updated guideline) but it might be difficult to extrapolate the findings from the test species (typically precocial species such as gamebirds or ducks) to birds of prey. For example, birds of prey were found to be particularly susceptible to the effects of organochlorine pesticides despite low sensitivities found in gamebirds (H. Crick, British Trust for Ornithology, pers. com.). Altricial nestlings also represent a documented critical stage of development similar to neonatal mammals, and are more sensitive than adult birds and generally more sensitive than precocial young (D. Hoffman, US Geological Survey Patuxent Ecotoxicology Laboratory, pers. com.). In addition, this would leave the question about potential neurotoxicity in birds unanswered, since this protocol does not examine such effects. It may be possible to screen for endocrine disruption in birds (e.g. as has been done for tetrabromobisphenol-A - see the ESR risk assessment for that substance), since neurodevelopmental effects may be a consequence of changes in thyroid hormone levels (D. Hoffman, US Geological Survey Patuxent Ecotoxicology Laboratory, pers. com.). However, once again there are no standard protocols for this sort of test. In the absence of avian toxicity information, an unequivocal result for neurotoxic potential in mammals would be helpful. Standard guidelines are available for mammalian neurotoxicity tests, but these studies are only carried out at a small number of laboratories globally (V. Piccirillo, VJP Consulting, Inc., pers. com.). The test species of choice is the rat, so these facilities have little or no experience of testing mice in this regard (so protocols are only partially developed, and data on historical controls are lacking)16. Dosing of pups is also not routinely carried out (although it is an option in the test guideline, most tests use maternal dosing, since the concern is generally related to health assessments and this is a more appropriate exposure route in such circumstances). Exposure via maternal breast milk is less relevant in the context of this environmental assessment (since the exposure of concern is the bird egg). It should be noted that a repeat neurotoxicity test has been requested for the health assessment; its relevance for the environment assessment should be considered as a protocol is developed. Tests may also require radiolabelled material in order to trace metabolites and distribution in brain tissue. In addition there are strong ethical considerations regarding a request for further vertebrate toxicity testing for this substance, since it already has a very extensive data set. It is therefore questionable whether all of this information should be requested given the practical difficulties involved in delivering it. This would leave some questions unanswered. There is also an issue of proportionality that needs to be considered before requesting further work (the substance is not classified as dangerous for supply, and this sort of information has not been requested before for any other chemical under the Existing Substances Regulation).
16 A study in rats would not necessarily expose the organisms at a sufficiently sensitive stage of brain development to pick up an effect.
Final draft R013_0405_env
97
Result i) There is a need for further information and/or testing. In the absence of reliable information on avian toxicity and/or neurotoxicity, as a minimum there is a continued need to monitor environmental contamination for levels of both the substance and (if possible) its more toxic and bioaccumulative degradation products for a suitable time period. Current monitoring programmes could be used to facilitate this. The monitoring options are outlined in an Annex to this report (available on request from the rapporteur), but matrices will include estuarine sediment, bird of prey tissues and sewage sludge samples at least. It should be noted that the results of the monitoring programme alone might not answer all of the open questions in the risk assessment. For example, at present, it is not possible to say what level of decabromodiphenyl ether in any given medium would constitute a risk (e.g. due to uncertainty over the PNEC and PBT assessments). For any future risk management decisions it may be necessary to define the level at which a risk occurs (i.e. PEC/PNEC >1) more fully. A formal review of the monitoring data should therefore take place at an intermediate point in the programme to decide if further action is necessary (e.g. in approximately three years’ time to look at time trends over 2000-2005, if some retrospective analysis or data were also used). The outcome of the review might be expected to be either: • an agreement that there is no requirement for further work (e.g. if the
environmental levels are clearly declining), or • a need for further toxicity testing in addition to the mouse developmental
neurotoxicity study being performed for the human health assessment (e.g. if it is clear that levels are not declining from the currently established baselines, especially if there is a continuous upward trend (since it could be inferred that diffuse sources are important and the actual trigger level for possible effects may need to be known with more certainty than at present)), or
• an immediate requirement to implement risk reduction measures (e.g. if significant formation of PBT/vPvB substances or biomagnification were confirmed).
[The original assessment noted that the possible long-term increase in levels as a result of releases from waste sites might need to be considered further in any future revision. Methods are still not available to enable this to be done, so this statement is still valid.]

Final draft R013_0405_env
98
4 HUMAN HEALTH To be added.
Final draft R013_0405_env
99
5 RESULTS Environment (x) i) There is a need for further information and/or testing. This conclusion applies to the PBT assessment. Decabromodiphenyl ether is likely to be very persistent (vP), but not bioaccumulative nor toxic in the marine environment according to the criteria presented in the Technical Guidance Document. This suggests a low risk to the environment by this assessment method. However, the PBT assessment is complicated by data available on the: • widespread occurrence of the substance in top predators (e.g. birds and mammals,
including terrestrial species) and the Arctic; • neurotoxic effects and uptake of the substance by mammals in laboratory studies; and • possible formation of more toxic and accumulative products such as lower
brominated diphenyl ether congeners and brominated dibenzofurans in the environment.
This means that the available assessment methodology might not be applicable to this substance. The implications of these data for risk characterisation have been assessed in a qualitative way. The levels of the substance currently being detected in biota in particular give rise to an environmental concern that still requires further evaluation. The accumulation in predatory birds is surprising, since it is not predictable from the properties of the substance (both the source and routes of exposure are unknown). Such monitoring information is generally not available for the vast majority of chemicals, which makes the context of the findings difficult to judge. It should be noted that the levels are currently small (in the region of parts per billion), although the exposure would appear to be widespread, many species are affected and the metabolite burden is unknown. The crucial point is that the actual significance of the measured levels for the species concerned is not known. By extrapolation of mammalian toxicity data, the levels found in eggs could have toxicological consequences relating to brain development. However, the study from which the data are derived is not fully valid, and the read across between mammals and birds is uncertain. It therefore cannot be concluded that a risk is present. However, it also cannot be concluded that the contamination of eggs is not a concern, because of the lack of data on effects on birds. In any case, any increase in levels could potentially lead to effects in future even if there is no evidence of effects at the moment, and the time trend has not been established. The fact that the substance has been found in the Arctic (in sediments and moss) also raises concerns about long-range transport and possible impacts on organisms remote from sources of release. The substance is persistent and the consequences of low level exposure over the lifetime of long-lived organisms cannot be predicted with any certainty from the current database. An extensive research programme could be requested to resolve the outstanding issues (e.g. concerning neurotoxic potential). However, current test methodologies are unlikely to deliver data that will allow greater precision in estimating the actual level of risk. The proportionality of requesting such a test programme should also be considered in relation to other substances of concern under the Existing Substances Regulation, noting that this substance is not classified as dangerous for supply and the low level of risk identified in the assessment for all other end-points.
Final draft R013_0405_env
100
Nevertheless, there is expected to be a steady increase in consumption of this substance in the EU. It is persistent, which means that there is a potential for increased presence in the technosphere and the environment, particularly since there are clearly diffuse sources of exposure and some evidence of rising levels in the Arctic. As a minimum there is a continued need to monitor environmental contamination for a suitable time period for both the substance and (if possible) its more toxic and bioaccumulative degradation products. The monitoring options are outlined in a report (available on request from the rapporteur), but matrices will include estuarine sediment, bird of prey tissues and sewage sludge samples at least. Any programme should be reviewed at a suitable point to decide if further action is necessary. A final decision about risk would be taken when either: • a clear downward trend in environmental levels is observed, and/or • a clear NOAEL has been established for developmental neurotoxicity (either as a result of
the human health assessment or following further toxicity testing for the environment assessment), and/or
• the significance of biomagnification or the formation of more harmful substances is established in the field.
The fact that this additional work will take some years to deliver results led to a further examination of the evidence presented in this updated assessment at the policy level. The discussions involved a review as towhether precautionary risk management was still considered necessary, taking account of the risk management investigations already carried out by both the rapporteur and voluntarily by the Industry (recognising that the latter deals with point sources only). This review also took account of the fact that the information that leads to the conclusions of this assessment is rarely available for other substances, which makes comparisons of concerns difficult. The outcome of this discussion was eanagreemnt by the Competent Authorities that the voluntary emission reduction programme proposed by Industry should be implemented in parallel with the collection of further data as described above. Industry will be required to provide progress updates in a series of interim reports delivered at suitable intervals. Depending on the success of the programme in reducing emissions, and the results of the further scientific investigations, the need for more formal risk reduction measures might be reviewed at a later date. [The original assessment noted that the possible long-term increase in levels as a result of releases from waste sites might need to be considered further in any future revision. Methods are still not available to enable this to be done, so this statement is still valid.] (x) ii) There is at present no need for further information and/or testing or for risk reduction measures beyond those which are being applied already. This conclusion applies to the assessment of surface water and sediment (freshwater and marine), waste water treatment plants, the terrestrial compartment, the air compartment and secondary poisoning for all life cycle stages using the PEC/PNEC assessment approach. Human health To be added.
Final draft R013_0405_env
101
6 REFERENCES ABC (2001). Effects of decabromodiphenyl oxide on the survival and reproduction of the earthworm, Eisenia fetida. Study Number 46540, ABC Laboratories Inc., Columbia, Missouri. Akutsu K., Obana H., Okihashi M., Kitagawa M., Nakazawa H., Matsuki Y., Makino T., Oda H. and Hori S. (2001). GC/MS analysis of polybrominated diphenyl ethers in fish collected from the Inland Sea of Seto, Japan. Chemosphere, 44, 1325-1333. Akvaplan-niva (2004). Contaminants in birds from Barentsburg. Unpublished results, as reported in SFT (2004a). AMAP/Akvaplan-niva (2004). Contaminant levels in ringed seal from the Russian Arctic, in press, as reported in SFT (2004a). Björklund J., Tollbäck P. and Östman C. (2003). Evaluation of the gas chromatographic column system for the determination of polybrominated diphenyl ethers. Dioxin 2003, Organohalogen Compounds, 60-65, pages unknown. Booij K., Zegers B. N. and Boon J. P. (2000). Levels of some polybrominated diphenyl ethers (PBDE) flame retardants along the Dutch coast as derived from their accumulation in SPMDs and blue mussels (Mytilus edulis). Organohalogen Compounds, 47, 89-92. Boon J. P, Lewis W. E., Tjoen-A-Choy M. R., Allchin C. R., Law R. J., de Boer J., Ten Hallers-Tjabbes C. C. and Zegers B. N. (2002). Levels of polybrominated diphenyl ether (PBDE) flame retardants in animals representing different trophic levels of the North Sea food web. Environ. Sci. Technol., in press. Bragigand V. B., El Hourch M., Marchand P. and Amiard-Tiquet C. (2004). Brominated flame retardants in estuarine organisms at different levels of the food chain. Paper presented at SETAC Europe 14th Annual Meeting, Prague, 18-22 April, 2004. BSEF (2003a). E-mail to RPA regarding the DecaBDE Risk Reduction Strategy – Product Stewardship Programme Information. Bromine Science and Environmental Forum. BSEF (2003b). Product Stewardship Programme – Status Report for Deca-BDE Risk Assessment. Bromine Science and Environmental Forum, October 2003. Butt C. M., Truong J., Diamond M. L. and Ikonomou M. G. (2003). Polybrominated diphenyl ether (PBDE), dioxin and furan (PCDD/F) concentrations in organic window films from southern Ontario. Dioxin 2003, Organohalogen Compounds, 60-65, pages unknown. CEFAS (2003). Personal communication. CEH (2003). Personal communication.
Final draft R013_0405_env
102
Choi J-W., Fujimaki S., Kitamura K., Hashimoto K., Hashimoto S., Ito H., Sakurai T., Suzuki N., Nagasaka H., Tanabe K., Sakai S. and Morita M. (2003). Historical trends of PBDD/Fs, PBDEs, PCDD/Fs and dioxin-like PCBs in sediment cores from Tokyo Bay. Dioxin 2003, Organohalogen Compounds, 60-65, 2003, pages unknown. Christensen J. H. and Platz J. (2001). Screening of polybrominated diphenyl ethers in blue mussels, marine and freshwater sediments in Denmark. J. Environ. Monit., 3, 543-547. da Rosa et al. (2003). Photolytic debromination and degradation of decabromodiphenyl ether. An exploratory kinetic study in toluene. Fresenius Environmental Bulletin, 12, 940-945. Dearden J (2004). Estimation of molecular size of decabromodiphenyl ether. Personal communication. de Boer J. and Cofino W. P. (2002). First world-wide interlaboratory study on polybrominated diphenylethers (PBDEs). Chemosphere, 46, 625-633. de Boer J., van der Horst A. and Wester P. G. (2000). PBDEs and PBBs in suspended particulate matter, sediments, sewage treatment plant in- and effluents and biota from the Netherlands. Organohalogen Compounds, 47, 85-88. de Boer J., Allchin C., Law R., Zegers B. and Boon J. P. (2001). Method for the analysis of polybrominated diphenyl ethers in sediments and biota. Trends Anal. Chem., 20, 591-599. de Boer J., Allchin C., Zegers B., Boon J. P., Brandsma S. H., Morris S., Kruijt A. W., van der Veen I., van Hesselingen J. M. and Haftka J. J. H. (2002a). HBCD and TBBP-A in sewage sludge, sediments and biota, including interlaboratory study. RIVO Report Number C033/02, September 2002. de Boer J., Wester P. G., van der Horst A. and Leonards P. E. G. (2002b). Polybrominated diphenyl ethers in suspended particulate matter, sediments, sewage treatment plant in- and effluents and biota from the Netherlands. Env. Pollut., in press. Dimitrov S. D., Dimitrova N. C., Walker J. D., Veith G. D. and Mekenyan O. G. (2002). Predicting bioconcentration factors of highly hydrophobic chemicals. Effects of molecular size. Pure Appl. Chem., 74, 1823-1830. Dodder N. G., Strandberg B. and Hites R. A. (2002). Concentrations and spatial variations of polybrominated diphenyl ethers and several Organochlorine compounds in fishes from the Northeastern United States. Environ. Sci. Technol., 36, 146-151. EBFRIP (2003). EBFRIP Submission to RPA for the risk reduction strategy. Eljarrat E., De La Cal A., Raldua D. and Barcelo D. (2004). Occurrence and bioavailability of brominated flame retardants (PBDEs and HBCD) in Ebro river basin (Spain). Paper presented at SETAC Europe 14th Annual Meeting, Prague, 18-22 April, 2004.
Final draft R013_0405_env
103
Ellinger S., Hackenberg R. and Ballschmiter K. (2003). Determination of log Kow values for polybromo diphenyl ether (PBDEs) by capillary gas chromatography and by total surface area (TSA) correlation. Dioxin 2003, Organohalogen Compounds, 60-65, 2003, pages unknown. Environment Agency (2003). Review of methods for assessing biomagnification of chemicals. Unpublished Draft Report. August 2003. Eriksson J., Jakobsson E., Marsh G. and Bergman Å. (2001). Photodecomposition of brominated diphenyl ethers in methanol/water. Poster presentation, Second International Workshop on Brominated Flame Retardants, May 14-16, Stockholm University, Sweden, pp203-206. EURAS (2003). Data analysis of decaBDE occurrence in birds. Commissioned by BSEF Science Programme, Final Report – 9th October 2003. EURAS, Belgium. Farrar N. J., Smith K. E. C., Lee R. G. M., Thomas G. O., Sweetman A. J. and Jones K. C. (2004). Atmospheric emissions of polybrominated diphenyl ethers and other persistent organic pollutants during a major anthropogenic combustion event. Environ. Sci. Technol., in press. Greenpeace (2003). Consuming chemicals. Hazardous chemicals in house dust as an indication of chemical exposure in the home. Greenpeace Research Laboratories Technical Note 01/2003 (GRL-TN-01-2003). Hagmar L., Jakobsson K., Thuresson K., Rylander L., Sjödin A. and Bergman Å. (2000). Computer technicians are occupationally exposed to polybrominated diphenyl ethers and tetrabromobisphenol A. Organohalogen Compounds, 47, 202-205. Hale R. C., La Guardia M. J., Harvey E. and Mainor T. M. (2002). Potential role of fire retardant-treated polyurethane foam as a source of brominated diphenyl ethers to the US environment. Chemosphere, 46, 729-735. Hamm S., Strikkeling M., Ranken P. F., and Rothernbacher K. P. (2001). Determination of polybrominated diphenyl ethers and PBDD/Fs during the recycling of high impact polystyrene containing decabromodiphenyl ether and antimony oxide. Chemosphere, 44, 1353-1360. Hardy M. L. (2000). Properties of the major commercial PBDPO flame retardant, DBDPO, in comparison to PBB and PCB. Organohalogen Compounds, 47, 233-236. Herrmann T., Schilling B. and Päpke O. (2003). Photolysis of PBDEs in solvents by exposure to daylight in a routine laboratory. Dioxin 2003, Organohalogen Compounds, 60-65, 2003, pages unknown. Herzke D., Berger U., Nygård T. and Vetter W. (2003). Organochlorines, organobromines and their metabolites in eggs of Norwegian birds of prey. Dioxin 2003, Organohalogen Compounds, 60-65, pages unknown.
Final draft R013_0405_env
104
Hori S., Akutsu K., Kitagawa M., Oda H., Nakazawa H., Matsuki Y., Makino T. (2000). Development of analysis for polybrominated diphenyl ether in seafood and actual contamination of seafood. Organohalogen Compounds, 47, 214-217. Hori S., Akutsu K., Oda H., Nakazawa H., Matsuki Y. and Makino T. (2002). Development of an analysis method for polybrominated diphenyl ethers and their levels in Japanese human mother’s milk. Organohalogen Compounds, 58, 245-248. IEH (2003). Review of a recent study on the uptake and neurotoxicity of decabromodiphenyl ether (DecaBDE). Report for the Environment Agency, Institute for Environment and Health, October 2003. Ikonomou M. G., Fischer M., He T., Addison R. F. and Smith T. (2000). Congener patterns, spatial and temporal trends of polybrominated diphenyl ethers in biota samples from the Canadian west coast and the northwest territories. Organohalogen Compounds, 47, 2000, 77-80. Ikonomou M. G., Rayne S. and Addison R. F. (2002). Exponential increases of brominated flame retardants, polybrominated diphenyl ethers, in the Canadian Arctic from 1981 to 2000. Environ. Sci. Technol., 36, 1886-1892. Jafvert C. and Hua I. (2001). Photochemical reactions of decabromodiphenyl oxide and 2,2’,4,4’-tetrabromodiphenyl oxide. Final Report. School of Civil Engineering, Purdue University, West Lafayette, In. Jakobsson K., Thuresson K., Rylander L., Sjödin A., Hagmar L. and Bergman Å. (2002). Exposure to polybrominated diphenyl ethers and tetrabromobisphenol A among computer technicians. Chemosphere, 46, 709-716. Jakobsson K., Thuresson K., Höglund P., Sjödin A., Hagmar L. and Bergman Å. (2003). A summary of exposures to polybrominated diphenyl ethers (PBDEs) in Swedish workers, and determination of half-lives of PBDEs. Dioxin 2003, Organohalogen Compounds, 60-65, 2003, pages unknown. Jones K. C. (2003). Personal communication. Kajiwara N., Ueno D., Baba N., Yamada T. and Tanabe S. (2003). Polybrominated diphenyl ethers in marine mammals from Asian waters. Dioxin 2003, Organohalogen Compounds, 60-65, 2003, pages unknown. Karasyova T., Sawal G., Stachel B. and Lepom P. (2002). Polybrominated diphenyl ethers (PBDEs) in bream and eel from the River Elbe, Germany. Poster presentation at SETAC Europe, 2002. Kemmlein S., Hahn O. and Jann O. (2003). Emissionen von flammschutzmitteln aus bauprodukten und Konsumgütern. Bundesanstalt für Materialforschung und –prüfung (BAM), Umweltbundesamt, April 2003.
Final draft R013_0405_env
105
Kierkegaard A., Balk L., Tjärnlund U., de Wit C. A. and Jansson B. (1999). Dietary uptake and biological effects of decabromodiphenyl ether in rainbow trout (Oncorhynchus mykiss). Environ. Sci. Technol., 33, 1612-1617. Knoth W., Mann W., Meyer R. and Nebhuth J. (2003). Brominated diphenyl ether in indoor dust. Dioxin 2003, Organohalogen Compounds, 60-65, 2003, pages unknown. Kohler M. Zennegg M., Gerecke A. C., Schmid P. and Heeb N. (2003). Increasing concentrations of decabromodiphenyl ether (DecaBDE) in Swiss sewage sludge since 1993. Dioxin 2003, Organohalogen Compounds, 60-65, 2003, pages unknown. Kolic T. M., MacPherson K. A., Reiner E. J. and Ho T. (2003). Levels of polychlorinated dioxins and furans, dioxin-like PCBs and brominated diphenyl ethers in biosolids treated sludge. Dioxin 2003, Organohalogen Compounds, 60-65, 2003, pages unknown. La Guardia M. J., Hale R. C. and Harvey E. (2003). Are waste water treatment plants sources of polybrominated diphenyl ethers (PBDEs)?. Presentation at SETAC 2003. Lepom P., Karasyova T. and Sawal G. (2002). Occurrence of polybrominated diphenyl ethers in freshwater fish from Germany. Organohalogen Compounds, 58, 209-212. Lunder S. and Sharp R. (2003). Mothers’ Milk. Record levels of toxic fire retardants found in American mothers’ breast milk. Environmental Working Group. Available from: http://www.ewg.org/reports/mothersmilk/es.php. Mariussen E., Kslss J. A., Borgen A., Nygaard T. and Schlabach M. (2004). Analysis of brominated flame retardants in liver samples of lynx from the Norwegian biota. Paper presented at SETAC Europe 14th Annual Meeting, Prague, 18-22 April, 2004. Mörck A., Hakk H., Örn U. and Klasson Wehler E. (2003). Decabromodiphenyl ether in the rat – absorption, distribution, metabolism and excretion. Drug. Metabol. Deposit., in press. Muir D., Teixeira C., Chigak M., Yang F., D’Sa I., Cannon C., Pacepavicius G. and Alaee M. (2003). Current deposition and historical profiles of decabromodiphenyl ether in sediment cores. Dioxin 2003, Organohalogen Compounds, 60-65, 2003, pages unknown. Öberg K., Warman K. and Öberg T. (2002). Distribution and levels of brominated flame retardants in sewage sludge. Chemosphere, 48, 805-809. OECD (1997). Guidance document on direct phototransformation of chemicals in water. Environmental Health and Safety Publications, Series on Testing and Assessment No. 7. Organisation for Economic Co-operation and Development, Paris, France. Ohta et al. (2001). Characterization of the photolysis of decabromodiphenyl ether and the levels of PBDEs as its photo products in atmospheric air of Japan. Organohalogen Compounds, 52, 321-324. Ohta S., Nakao T., Nishimura H., Okumura T., Aozasa O. and Miyata H. (2002). Contamination levels of PBDEs, TBBPA, PCDDs/DFs, PBDDs/DFs and PXDDs/DFs in the environment of Japan. Organohalogen Compounds, 57, 57-60.
Final draft R013_0405_env
106
Oliaei F. and Hamilton C. (2003). PBDE Congener profiles in fish with different feeding behaviours from major rivers in Minnesota. Dioxin 2003, Organohalogen Compounds, 60-65, 2003, pages unknown. Olsman H. van Bavel B., Kalbin G., Pettersson A., Stenlund S., Strid Å. and Engwall M. (2002). Formation of dioxin-like compounds as photoproducts of decabromodiphenyl ether (DEBDE) during UV-irradiation. Organohalogen Compounds, 58, 41-44. Örn U. (1997). Synthesis of polybrominated diphenyl ethers and metabolism of 2,2’,4,4’-tetrabromo[14C]diphenyl ether. Licentiate Thesis, Department of Environmental Chemistry, Stockholm University. Palm A. (2001). The environmental fate of polybrominated diphenyl ethers in the centre of Stockholm – Assessment using a multimedia fugacity model. IVL Report B 1400. Swedish Environmental Research Institute, January 2001. Palm A., Cousins I. T., Mackay D., Tysklind M., Metcalfe C. and Alaee M. (2002). Assessing the environmental fate of chemicals of emerging concern: a case study of the polybrominated diphenyl ethers. Environ. Pollut., 117, 195-213. Palm W-U., Kopetzky R., Sossinka W., Krüger H-U., Liu Q., Barcellos da Rosa S. T and Zetzsch C. (2003). Environmental photochemistry of decabromodiphenyl ether: UV spectra, photolysis and photochemistry of polybrominated diphenyl ethers in organic solvents and adsorbed on particles in air and in aqueous suspension (including a feasibility study on OH reactivities in an aerosol smog chamber facility). Report for the Bromine Science and Environmental Forum. Peters R. J. B. (2003). Hazardous Chemicals in Precipitation. TNO-Report R 2003/198. Peterman P. H., Orazio C. E. and Feltz K. P. (2003). Sunlight photolysis of 39 mono-hepta PBDE congeners in lipid. Dioxin 2003, Organohalogen Compounds, 60-65, 2003, pages unknown. RIVO (2003). Preliminary results for analysis of bird samples. Personal communication. Sandholm A., Emanuelsson B-M. and Klasson Wehler E. (2003). Bioavailability and half-life of decabromodiphenyl ether (BDE-209) in the rat. In press. Sawal G., Herz A., Woitke P and Lepom P. (2002). Polybrominated diphenyl ethers (PBDEs) in sediments from the Danube River. Poster presentation at SETAC Europe 2002. Schecter A., Pavuk M., Päpke O., Ryan J. J., Birnbaum L. and Rosen R. (2003). Polybrominated diphenyl ethers (PBDEs) in U.S. mothers’ milk. Environ. Health Perspectives, 111, 1723-1729. Sellström U., Söderström G., de Wit C. and Tysklind M. (1998). Photolytic debromination of decabromodiphenyl ether (DeBDE). Organohalogen Compounds, 35, 447-450.
Final draft R013_0405_env
107
Sellström U., Lindberg P., Häggberg L. and de Wit C. (2001). Bromarade flamskyddsmedel (PBDEs) funna i ägg av pilgrimsfalkar (Falco peregrinus) häckande i Sverige. Rapport utgiven av Svenska Naturskyddsföreningen i samarbete med TCO-Utveckling AB. Stockholm, March 2001. [This is the full test report (in Swedish) of the Sellström et al. (2001) peregrine falcon data presented in the main report .] SFT (2002). Karlegging av bromerte flammehemmere og klorerte parafiner. Rapport 866/02. Statens forurensningstilsyn (Norwegian Pollution Control Authority). SFT (2004a). Personal communication from Statens forurensningstilsyn (Norwegian Pollution Control Authority). SFT (2004b). Additional information on decaBDE in polar bears. Document COM013_env_N4. Statens forurensningstilsyn (Norwegian Pollution Control Authority) Sijm D. T. H. M., Pärt P. and Opperhuizen A. (1993). Aquat. Toxicol., 25, 1-14. Sinkkonen S., Lahtiperä M., Vattulainen A., Takhistov V. V., Viktorovskii I. V., Utsal V. A. and Paasivirta J. (2003a). Analysis of known and new types of polyhalogenated aromatic substances in oven ash from recycled aluminium production. Chemosphere, 52, 761-775. Sinkkonen S., Vattulainen A., Paasivirta J. and Lahtiperä M. (2003b). Screening of halogenated aromatic compounds in some raw material lots for an aluminium recycling plant. Environ. Int. (special issue of brominated flame retardants). In press. (as quoted in Sinkkonen et al. 2003a). Sjödin A., Carlsson H., Thuresson K., Sjölin S., Bergman Å. and Östman C. (2001a). Flame retardants in indoor air at an electronics recycling plant and at other work environments. Environ. Sci. Technol., 35, 448-454. Sjödin A., Patterson Jr. D. G. and Bergman Å. (2001b). Brominated flame retardants in serum from U.S. blood donors. Environ. Sci. Technol., 35, 3830-3833. Skaare J. U. and Jensen B. J. (2004). Norwegian School of Veterinary Science. Summary of results as reported in SFT (2004b) Söderström G. (2003). On the combustion and photolytic degradation products of some brominated flame retardants. Department of Chemistry, Environmental Chemistry, University of Umeå, Sweden. Söderström G., Sellström U., de Wit C. A. and Tysklind M. (2003). Photolytic debromination of decabromodiphenyl ether (BDE 209). Environ. Sci. Technol., 38, 112-119. Stapleton H. M., Letcher R. J. and Baker J. E. (2002). Uptake, metabolism and depuration of polybrominated diphenyl ethers (PBDEs) by the common carp (Cyprinus carpio). Poster Presentation at Dioxin 2002, 22nd International Symposium on Halogenated Environmental Organic Pollutants and POPs. August 11-16 2002, Barcelona.
Final draft R013_0405_env
108
Stapleton H. M., Alaee M., Letcher R. J. and Baker J. E. (2003a). Debromination of decabromodiphenyl ether by juvenile carp (Cyprinus carpio). Dioxin 2003, Organohalogen Compounds, 61, 21-24. Stapleton H. M., Letcher R. J. and Baker J. E. (2003b). Intestinal debromination of BDE 99 and BDE 183 by the common carp (Cyprinus carpio). Dioxin 2003, Organohalogen Compounds, 60-65, 2003, pages unknown. Stapleton H. M., Alaee M., Letcher R. J. and Baker J. E. (2003c). Debromination of the flame retardant decabromodiphenyl ether by juvenile carp (Cyprinus carpio) following dietary exposure. Environ. Sci. Technol., 38, 112-119. Stevens G. C., Ghanem R., Thomas J. L., Horrocks A. R. and Kandola B. (2004). Undestanding flame retardant release to the environment. Paper presented at Flame Retardants 2004 Conference. Tamade Y., Shibakawa S., Osaki H., Kashimoto S., Yagi Y., Sakai S-I. and Takasuga T. (2002). A study of brominated compound release from an appliance-recycling facility. Organohalogen Comounds, 56, 189-192. ter Schure A. F. H. and Larsson P. (2002). Polybrominated diphenyl ethers in precipitation in Southern Sweden (Skåne, Lund). Atmospheric Environment, 36, 4015-4022. Texconsul (2003a). E-mail to Environment Agency on care labelling, 27/11/03. Texconsul (2003b). Letter to Textile Finishes Association provided to RPA during the development of the risk reduction strategy. TFA (2003). Further comments on the Deca-BDE RRS Report Stage 2. The Textile Finishers Association. Provided to RPA during the development of the risk reduction strategy. Thomas G., Moss S. E. W., Jones K. C. and Hall A. J. (2003). Absorption of PBDEs and PCBs by grey seals (Halichoerus grypus). Dioxin 2003, Organohalogen Compounds, 60-65, 2003, pages unknown. Tollbäck P., Björklund J. and Östman C. (2003). Large-volume programmed-temperature vaporiser injection for fast chromatography with electron capture and mass spectrometric detection of polybrominated diphenyl ethers. J. Chromatography A, 991, 241-253. Tomy G. T., Palace V. P., Halldorson T., Braekevelt E., Danell R., Wautier K., Evans B., Brinkworth L. and Fisk A. T. (2004). Bioaccumulation, biotransformation, and biochemical effects fo brominated diphenyl ethers in juvenile lake trout (Salvelinus namaycush). Environ. Sci. Technol., 38, 1496-1504. Tysklind M., Sellström U. Söderström G. and de Wit C. (2001). Abiotic transformation of polybrominated diphenyl ethers (PBDEs): Photolytic debromination of decabromodiphenyl ether. The Second International Workshop on Brominated Flame Retardants, BFR 2001, May 14-16, Stockholm.
Final draft R013_0405_env
109
UCD (1998). Use Category Document – Plastic Additives. Revised Draft for Discussion, June 1998. Building Research Establishment, produced under contract to the Environment Agency. Ueno D., Kajiwara N., Subramanian A. N., Fillamnn G., Nakata H., Lam P. K. S., Zheng J., Muchtar M., Prudente M. and Tanabe S. (2003). Global pollution monitoring of polybrominated diphenyl ethers (PBDEs) using skipjack tuna as a bioindicator. Dioxin 2003, Organohalogen Compounds, 60-65, 2003, pages unknown. Vethaak A. D., Rijs G. B. J., Schrap S. M., Ruiter H., Gerritsen A. and Lahr J. (2002). Estrogens and xeno-estrogens in the aquatic environment of the Netherlands. Occurrence, Potency and Biological Effects. RIZA/RIKZ Report No. 2002.001, February 2002. Viberg H., Fredriksson A., Jakobsson E., Örn U. and Eriksson P. (2003). Nerobehavioural derangements in adult mice receiving decabrominated diphenyl ether (PBDE 209) during a defined period of neonatal brain development. Toxicol. Sci., 76, 112-20. Voorspoels S., Covaci A. and Schepens P. (2003). Polybrominated diphenyl ethers in marine species from the Belgian North Sea and the Western Scheldt Estuary: Levels, profiles and distribution. Environ. Sci. Technol., 37, 4348-4357. Wania F. and Dugani C. (2003). Assessment the long-range transport potential of polybrominated diphenyl ethers: A comparison of four multimedia models. In press. Watanabe I. and Tatsukawa R. (1990). Anthropogenic brominated aromatics in the Japanese environment. In ‘Proceedings of Workshop on Brominated Aromatic Flame Retardants, Skokloster, Sweden, 24-26 October, 1989’. Swedish National Chemicals Inspectorate, KEMI, Solna, Sweden, 1990, pp63-71. WWF (2003). WWF-UK national biomonitoring Survey 2003. WWF-UK. Available from: . http://www.wwf.org.uk/filelibrary/pdf/biomonitoringresults.pdf. WWF (2004). Chemical Check Up. An analysis of chemicals in the blood of Members of the European Parliament. WWF. Available from: http://www.panda.org/about_wwf/what_we_do/toxics/news/news.cfm?uNewsID=12622 Zegers B. N., Lewis W. E. and Boon J. P. (2000). Levels of some polybrominated diphenyl ethers (PBDE) flame retardants in dated sediment cores. Organohalogen Compounds, 47, 229-232. Zegers B. N., Lewis W. E., Tjoen-A-Choy M. R., Smeenk C., Siebert U. and Boon J. P. (2001). Levels of some polybrominated diphenyl ether (PBDE) flame-retardants in animals from different trophic levels of the North Sea food web. Organohalogen Compounds, 52, 18-21. Zegers B. N., Lewis W. E., Booij K., Smittenberg R. H., Boer W., de Boer J. and Boon J. P. (2003). Levels of polybrominated diphenyl ether flame retardants in sediment cores from Western Europe. Environ. Sci. Technol., 37, 3803-3807.
Final draft R013_0405_env
110
7 OTHER PAPERS REVIEWED THAT DID NOT CONTAIN SIGNIFICANT NEW INFORMATION RELEVANT TO THE RISK ASSESSMENT
[Note: A number of papers were presented at the SETAC Europe 14th Annual Meeting17 in April 2004. It has not been possible to incorporate all of the data presented at this meeting, or other recently published data, into this report. Details of these papers are included below.] Alaee M. (2002). GC/ECNI/MS or GC/HRMS; Which technique is better suited for the analysis of PBDEs in environmental matrices? Enviroanalysis 2002. Proc. Biennial Int. Conf. Monitoring & Measurement Environ., 4th, Toronto, 27-30 May, pp309-312. Birnbaum L. S. and Staskal D. F. (2004). Brominated flame retardants: Cause for concern? Environmental Health Perspectives, 112, 9-17. Braekevelt E., Tittlemier S. A. and Tomy G. T. (2003). Direct measurement of octanol-water partition coefficients of some environmentally relevant brominated diphenyl ether congeners. Chemosphere, 51, 563-567. Brown D. J., Van Overmeire I., Goeyens L., Denison M. S., De Vito M. J. and Clark G. C. (2004). Analysis of Ah receptor pathway activation by brominated flame retardants. Chemosphere, 55, 1509-1518. Christensen J. H., Glasius M. and Pécseli M. (2002). Polybrominated diphenyl ethers (PBDEs) in marine fish and blue mussels from southern Greenland. Chemosphere, 47, 631-638. Chen J. W., Harner T., Yang P., Quan X., Chen S., Schramm K.-W. and Kettrup A. (2003). Quantitative predictive models for Octanol-air partition coefficients of polybrominated diphenyl ethers at different temperatures. Chemosphere, 51, 577-584. Covaci A., de Boer J., Ryan J. J., Voorspoels S. and Schepens P. (2002). Determination of polybrominated diphenyl ethers and polychlorinated biphenyls in human adipose tissue by large-volume injection – narrow-bore capillary gas chromatography/electron impact low-resolution mass spectrometry. Anal. Chem., 74, 790-798. de Boer J. and Allchin C. (2001). An indication of temporal trends in environmental PBDE levels in Europe. Organohalogen Compounds, 52, 13-17. [This paper repeats the data from de Boer et al. (2001) already presented in the main report.] De Wit A. and De Wit C. A. (2004). Comparative aspects of polybrominated diphenyl ether (PBDE) uptake and accumulation in biota. Paper presented at SETAC Europe 14th Annual Meeting, Prague, 18-22 April, 2004. Eljarrat E., de la Cal A., Raldua D., Duran C. and Barcelo D. (2004). Occurrence and bioavailability of polybrominated diphenyl ethers and Hexabromocyclododecane in sediment and fish from the Cinca River, a tributary of the Ebro River (Spain). Environ. Sci. Technol., 38, 2603-2608. 17 Further details are available at http://www.zuova.cz/setac2004/
Final draft R013_0405_env
111
Eriksson J., Eriksson L., Marsh G. and Bergman Å. (2003). A one step synthesis of all three nona-brominated diphenyl ethers. Organohalogen Compounds, 61, 191-194. Farrar N. J., Smith K. E. C., Lee R. G. M., Thomas G. O., Sweetman A. J. and Jones K. C. (2004). Atmospheric emissions of polybrominated diphenyl ethers and other persistent organic pollutants during a major anthropogenic combustion event. Environ. Sci. Technol., 38, 1681-1685. Gouin T., Harner T. and Mackay D. (2004). Mapping the spatial and temporal distribution of polybrominated diphenyl ethers in ambient air from the Great Lakes region. Paper presented at SETAC Europe 14th Annual Meeting, Prague, 18-22 April, 2004. Hall A. J., Kalantzi O., Moss S., Asplund L., Jones K. and Thomas G. (2004). PBDEs as thyroid hormone distruptors in seals. Paper presented at SETAC Europe 14th Annual Meeting, Prague, 18-22 April, 2004. Hardy M. L. (2000). Distribution of decabromodiphenyl oxide in the environment. Organohalogen Compounds, 47, 237-240. Hardy M. L. (2000). Properties of the major commercial PBDPO flame retardant, DBDPO in comparison to PBB and PCB. Organohalogen Compounds, 47, 2000, 233-236. Hardy, M. L. (2004). A comparison of the fish bioconcentration factors for brominated flame retardants with their non-brominated analogues. Env. Tox. & Chem., 23, 656-661 Harju M., Andersson P. L., Haglund P. and Tysklind M. (2002). Multivariate physicochemical characterisation and quantitative structure-property relationship modelling of polybrominated diphenyl ethers. Chemosphere, 47, 375-384. Harrad S., Wijesekera R., Hunter S., Halliwell C. and Baker R. (2004). Preliminary assessment of U.K. dietary and inhalation exposure to polybrominated diphenyl ethers. Environ. Sci. Technol., 38, 2345-2350. Hassanin A., Breivik K., Meijer S. N., Steinnes E., Thomas G. O. and Jones K. C. (2004). PBDEs in European background soils: Levels and factors controlling their distribution. Environ. Sci. Technol., 38, 738-745. Hites R. A. (2004). Polybrominated diphenyl ethers in the environment and in people. A meta-analysis of concentrations. Environ. Sci. Technol., 38, 945-956. Huyskens G., Van der Ven K, Moens L., Blust R. and De Coen W. (2004). Toxicogenomic analysis of the liver of zebrafish (Danio rerio) exposed to brominated flame retardants. Paper presented at SETAC Europe 14th Annual Meeting, Prague, 18-22 April, 2004. Huwe J. K., Lorentzsen M., Thuresson K. and Bergman Å. (2002). Analysis of mono- to deca-brominated diphenyl ethers in chickens at the part per billion level. Chemosphere, 46, 635-640. [This is the same data as Huwe et al. (2001) already presented in the main report.]
Final draft R013_0405_env
112
Jaward F. M., Farrar N. J., Harner T., Sweetman A. J. and Jones K. C. (2004). Passive air sampling of PCBs, PBDEs, and organochlorine pesticides across Europe. Environ. Sci. Technol., 38, 34-41. Kalantzi O. I., Martin F. L., Thomas G. O., Alcock R. E., Tang H. R., Carmichael P. L., Nicholson J. K., and Jones K. C. (2004). Regional levels of polybrominated diphenyl ethers (PBDEs) and chlorinated compounds in UK breast milk. In press. Kutch K., Schneider C., Gaiser S., Zenker A. and Metzger J. W. (2004). Polybrominated flame retardants in sewage sludge and fishes. Paper presented at SETAC Europe 14th Annual Meeting, Prague, 18-22 April, 2004. Lacorte S., Guillamón M., Martinez E., Viana P. and Barceló D. (2003). Occurrence and specific congener profile of 40 polybrominated diphenyl ethers in river and coastal sediments from Portugal. Environ. Sci. Technol., 37, 892-898. Law R. J., Allchin C. R., Morris S. and Jepson P. D. (2003). Persistent organohalogen compounds in marine mammals stranded or bycaught in the UK. Organohalogen Compounds, 62, 224-227. Lee R. G. M., Thomas G. O. and Jones K. C. (2004). PBDEs in the atmosphere of three locations in Western Europe. Environ. Sci. Technol., 38, 699-706. Leonards P. E. G., Brandsma S., Jol J., Vethaak D. and De Boer J. (2004). Occurrence of BFRs in various aquatic food chains. Paper presented at SETAC Europe 14th Annual Meeting, Prague, 18-22 April, 2004. Murvoll K. M. M., Jenssen B. M. and Skåre J. U. (2004). Effects of brominated diphenyl ethers on vitamin status in birds. Paper presented at SETAC Europe 14th Annual Meeting, Prague, 18-22 April, 2004. Olsman A. E., Kalbin G., Van Bavel B., Strid K. and Engwall M. (2004). Time- and wavelength dependent formation of dioxin-like compounds during UV-irradiation of decabrominated diphenyl ether (DeBDE). Paper presented at SETAC Europe 14th Annual Meeting, Prague, 18-22 April, 2004. Rice C. P., Chernyak S. M., Begnoche L., Quintal R. and Hickey J. (2002). Comparisons of PBDE composition and concentration in fish collected from the Detroit River, MI and Des Plaines River, IL. Chemosphere, 49, 731-737. Rudel R. A., Camann D. E., Spengler J. D., Korn L. R. and Brody J. G. (2003). Phthalates, alkylphenols, pesticides, polybrominated diphenyl ethers, and other endocrine-disrupting compounds in indoor air and dust. Environ. Sci. Technol., 37, 4543-4553. Rupp S., Kuch B. and Metzger J. W. (2004). Pyrolysis of polybrominated diphenyl ethers in the low-temperature-range – formation of PBDDs, PBDFs and mixed halogenated reaction products. Paper presented at SETAC Europe 14th Annual Meeting, Prague, 18-22 April, 2004.
Final draft R013_0405_env
113
Sasaki S. (1978). The scientific aspects of the chemical substances control law in Japan. In “Aquatic Pollutants: Transformation and Biological Effects”, edited by O. Hutzinger, I. H. Van Lelyveld and B. C. J. Zoeteman. Pergamon Press. Schaefer E. C., Ariano J. M. and Rothenbacher K. P. (2001). Fate of decabromodiphenyl ether in anaerobic freshwater sediment. Organohalogen Compounds, 52, 459-461. Shen L., Wania F., Lei Y. D. and Muir D. C. G. (2004). Polybrominated diphenyl ethers (PBDEs) in ambient air across North America. Paper presented at SETAC Europe 14th Annual Meeting, Prague, 18-22 April, 2004. Smeds A. and Saukko P. (2003). Brominated flame retardants and phenolic endocrine disrupters in Finnish human adipose tissue. Chemosphere, 53, 1123-1130. SNT (2002). Miljøgifter I hval og enkelte arter av marin fisk. SNT Arbeidsrapport 4, Satens næringsmideeltilsyn (Norwegian Food Control Authority). Available from: http://snt.mattilsynet.no/dokumentasjon/rapporter/2002/snt_arbeidsrapporter/200204.pdf Söderström G. and Marklund S. (2000). PXD and PXDF from combustion of bromo flame retardant containing MSW. Organohalogen Compounds, 47, 225-228. [This paper contains similar data to that from Söderström and Marklund (2001) already presented in the main report.] Söderström G. and Marklund S (2002). PBCDD and PBCDF from incineration of waste-containing brominated flame retardants. Environ. Sci. Technol., 36, 1959-1964. [This paper contains similar data to that from Söderström and Marklund (2001) already presented in the main report.] ter Schure A. F. H., Larsson P., Agrell C. and Boon J. P. (2004). Atmospheric transport of polybrominated diphenyl ethers and polychlorinated biphenyls to the Baltic Sea. Environ. Sci. Technol., 38, 1282-1287. Ueno D., Kajiwara N., Tanaka H., Subramanian A., Fillmann G., Lam P. K. S., Zheng G. J., Muchitar M., Razak H., Prudente M., Chung K-H. and Tanabe S. (2004). Global pollution monitoring of polybrominated diphenyl ethers using skipjack tuna as a bioindicator. Environ. Sci. Technol., 38, 2312-2316. Viberg H., Fredriksson A. and Eriksson P. (2003). Neurotoxicity of different polybrominated diphenyl ethers, including PBDE 209. Dioxin 2003, Organohalogen Compounds, 60-65, 2003, pages unknown. [This paper contains a summary of the neurotoxicity data already presented in the main report.] Vives I., Grimalt J. O., Lacorte S., Guillamón M. and Rosseland D. B. B. (2004). Polybromodiphenyl ethers flame retardants in fish from lakes in European high mountains and Greenland. Environ. Sci. Technol., 38, 2338-2344. Wenning R. J. (2002). Uncertainties and data needs in risk assessment of three commercial polybrominated diphenyl ethers: probabilistic exposure analysis and comparison with European Commission results. Chemosphere, 46, 779-796.
Final draft R013_0405_env
114
Wolkers H., van Bavel B., Derocher E., Wiig Ø., Kovacs K. M., Lydersen C. and Lindström G. (2004). Congener-specific accumulation of food chain transfer of polybrominated diphenyl ethers in two Arctic food chains. Environ. Sci. Technol., 38, 1667-1674. Zegers B. N., Lewis W. E. and Boon J. P. (2000). Levels of some polybrominated diphenyl ether (PBDE) flame retardants in dated sediment cores. Organohalogen Compounds, 47, 229-232. [This paper repeats the data from de Boer et al. (2001) already presented in the main report.] Zetzsch C. (2004). Photochemical studies of brominated diphenyl ethers (BDEs) with special regard to decaBDE – an overview. Paper presented at SETAC Europe 14th Annual Meeting, Prague, 18-22 April, 2004. Zu L. Y. and Hites R. A. (2004). Temporal trends and spatial distributions of brominated flame retardants in archived fishes from the Great Lakes. Environ. Sci. Technol., 38, 2779-2784.