Embed Size (px)
Citation preview
1 1 Slide Slide
Introduction to ProbabilityUncertainty, Probability, Tree Diagrams,
Combinations and Permutations
Chapter 4BA 201

2 2 Slide Slide
PROBABILITY
3 3 Slide Slide
Uncertainty
Managers often base their decisions on an analysis of uncertainties such as the following:
What are the chances that sales will decreaseif we increase prices?
What is the likelihood a new assembly method method will increase productivity?
What are the odds that a new investment willbe profitable?
4 4 Slide Slide
Probability
Probability is a numerical measure of the likelihood that an event will occur.
Probability values are from 0 to 1.
5 5 Slide Slide
Probability as a Numerical Measureof the Likelihood of Occurrence
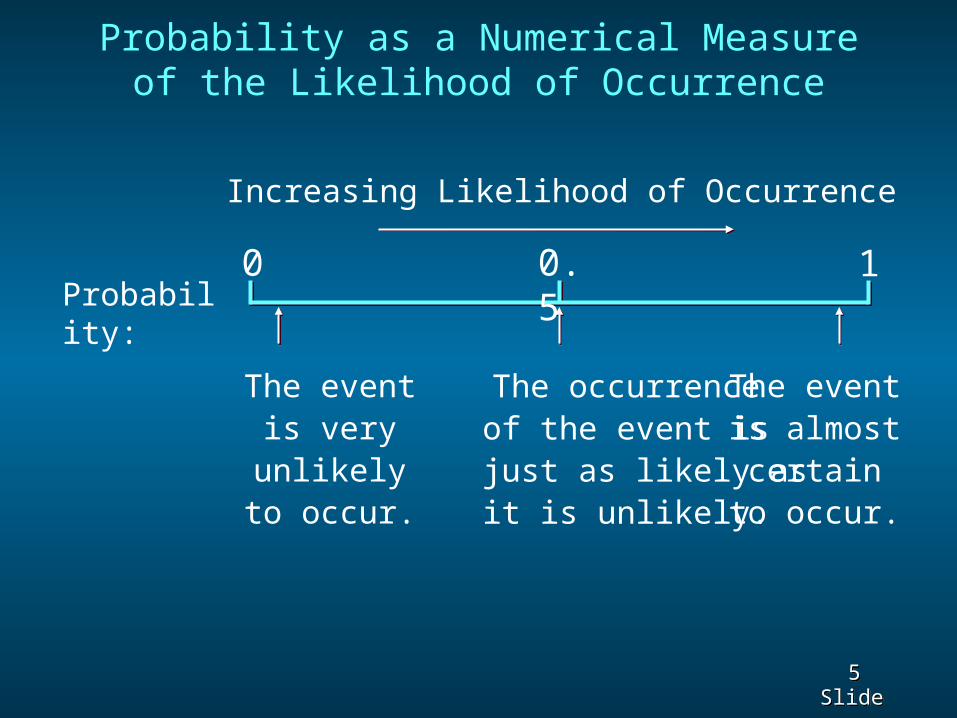
0 10.5
Increasing Likelihood of Occurrence
Probability:
The eventis veryunlikelyto occur.
The occurrenceof the event is
just as likely asit is unlikely.
The eventis almostcertain
to occur.

6 6 Slide Slide
STATISTICAL EXPERIMENTS
7 7 Slide Slide
Statistical Experiments
In statistical experiments, probability determines outcomes.
Even though the experiment is repeated in exactly the same way, an entirely different outcome may occur.
8 8 Slide Slide
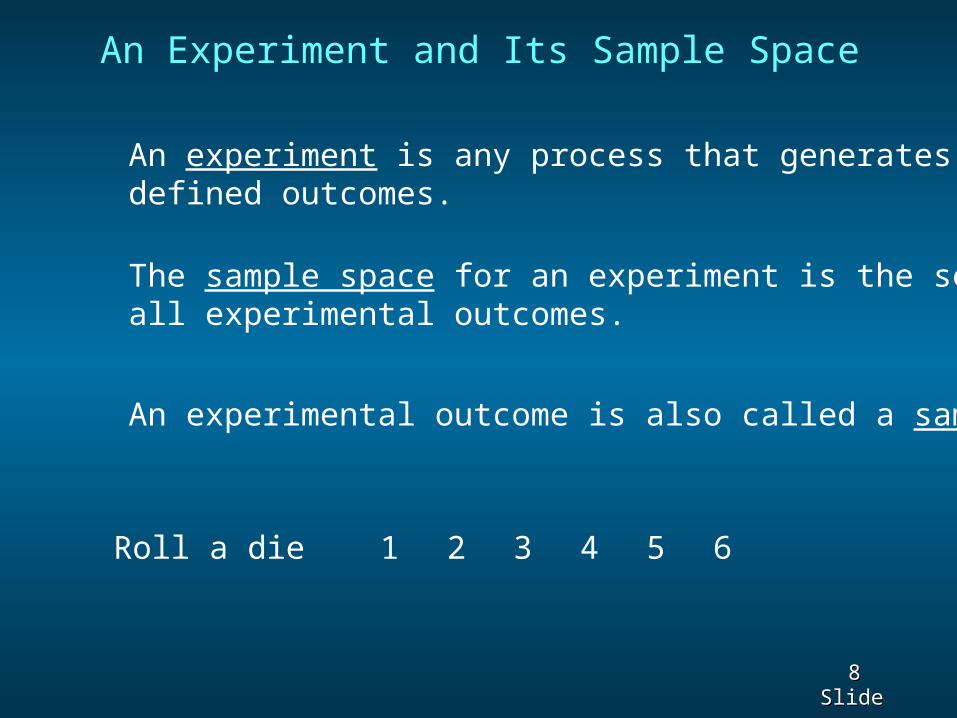
An Experiment and Its Sample Space
An experiment is any process that generates well- defined outcomes.
The sample space for an experiment is the set of all experimental outcomes.
An experimental outcome is also called a sample point.
Roll a die 1 3 4 52 6
9 9 Slide Slide
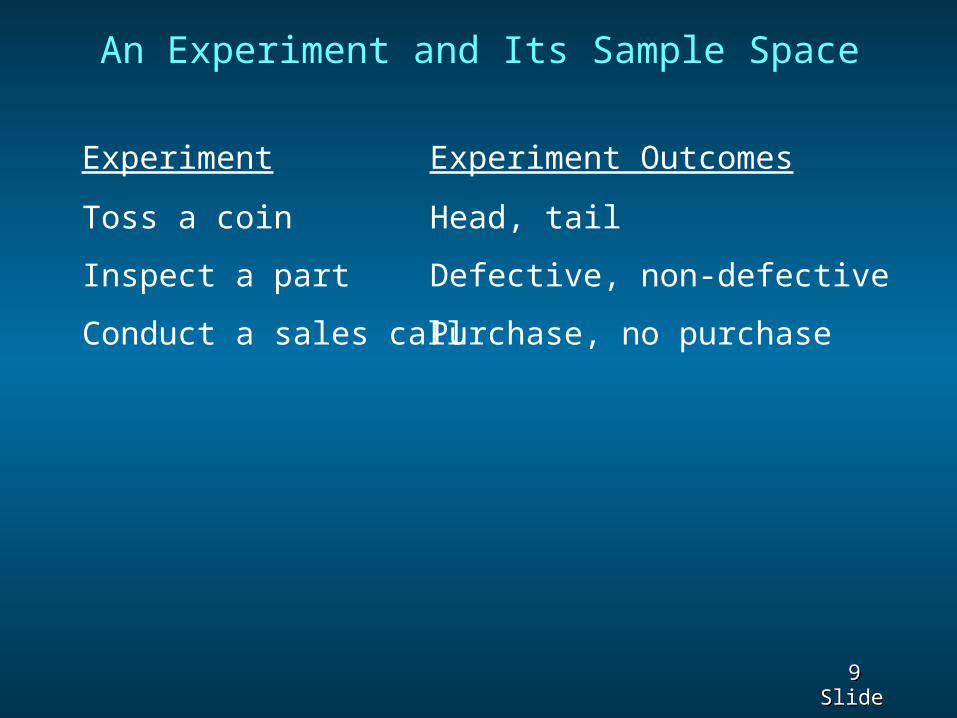
An Experiment and Its Sample Space
Experiment
Toss a coin
Inspect a part
Conduct a sales call
Experiment Outcomes
Head, tail
Defective, non-defective
Purchase, no purchase

10 10 Slide Slide
Bradley has invested in two stocks, Markley Oil and Collins Mining. Bradley has determined
that thepossible outcomes of these investments three
monthsfrom now are as follows.
Investment Gain or Loss in 3 Months (in $000)
Markley Oil Collins Mining 10 5 0-20
8-2
Bradley Investments
An Experiment and Its Sample Space
11 11 Slide Slide
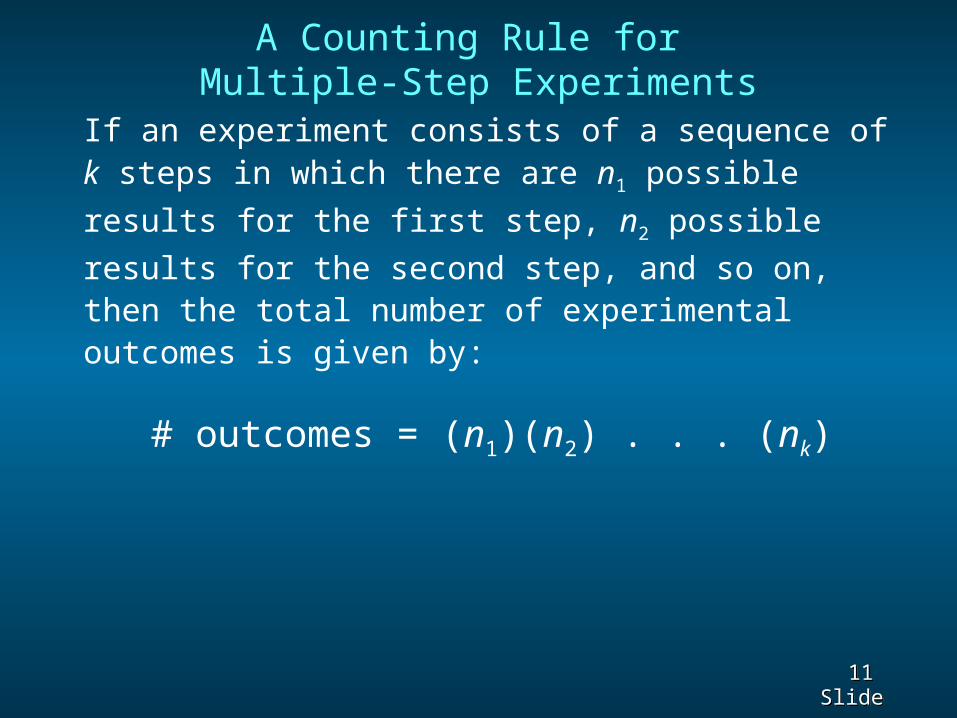
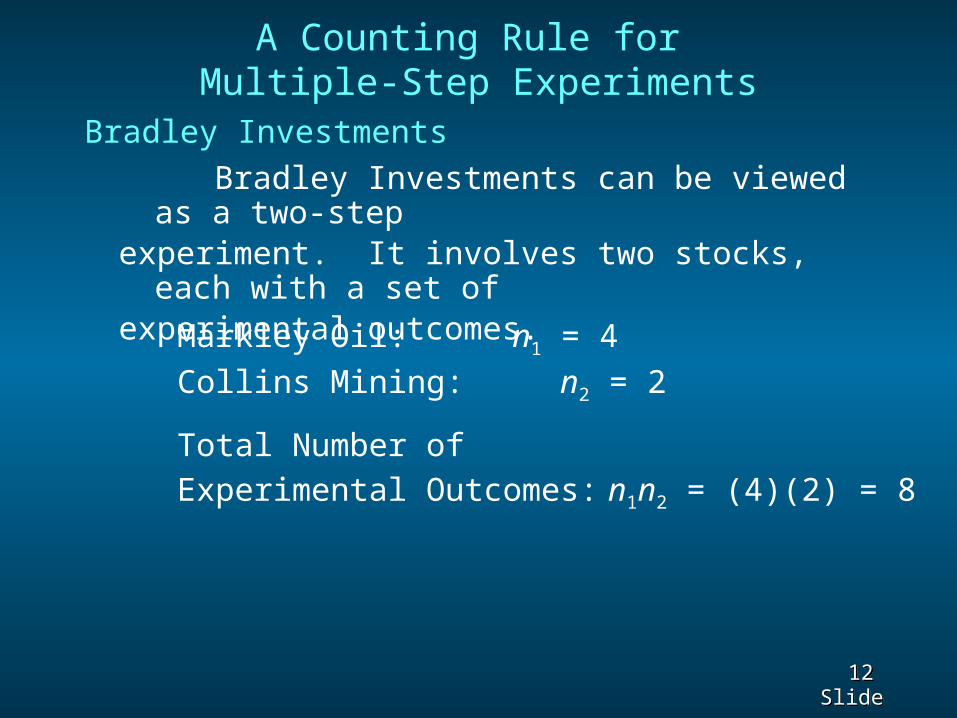
A Counting Rule for Multiple-Step Experiments
If an experiment consists of a sequence of k steps in which there are n1 possible results for the first
step, n2 possible results for the second step, and
so on, then the total number of experimental outcomes is given by:
# outcomes = (n1)(n2) . . . (nk)
12 12 Slide Slide
Bradley Investments can be viewed as a two-step
experiment. It involves two stocks, each with a set of
experimental outcomes.Markley Oil: n1 = 4Collins Mining: n2 = 2
Total Number of Experimental Outcomes: n1n2 = (4)(2) = 8
A Counting Rule for Multiple-Step Experiments
Bradley Investments
13 13 Slide Slide
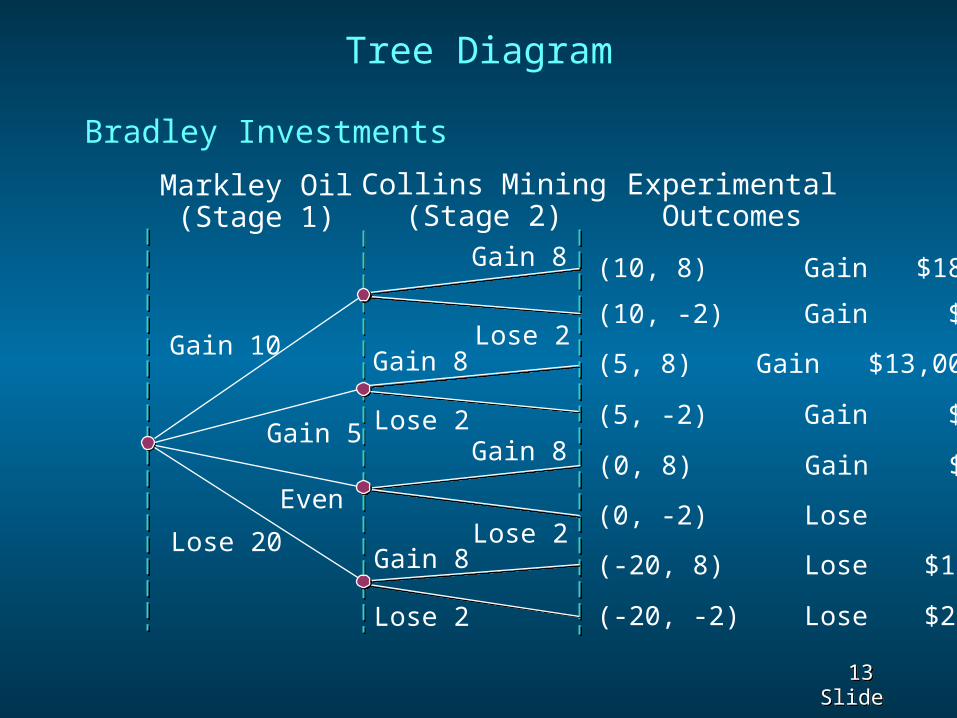
Tree Diagram
Gain 5
Gain 10
Lose 20
Even
Markley Oil(Stage 1)
Collins Mining(Stage 2)
ExperimentalOutcomes
(10, 8) Gain $18,000
(10, -2) Gain $8,000
(5, 8) Gain $13,000
(5, -2) Gain $3,000
(0, 8) Gain $8,000
(0, -2) Lose $2,000
(-20, 8) Lose $12,000
(-20, -2) Lose $22,000
Gain 8
Gain 8
Gain 8
Gain 8
Lose 2
Lose 2
Lose 2
Lose 2
Bradley Investments
14 14 Slide Slide
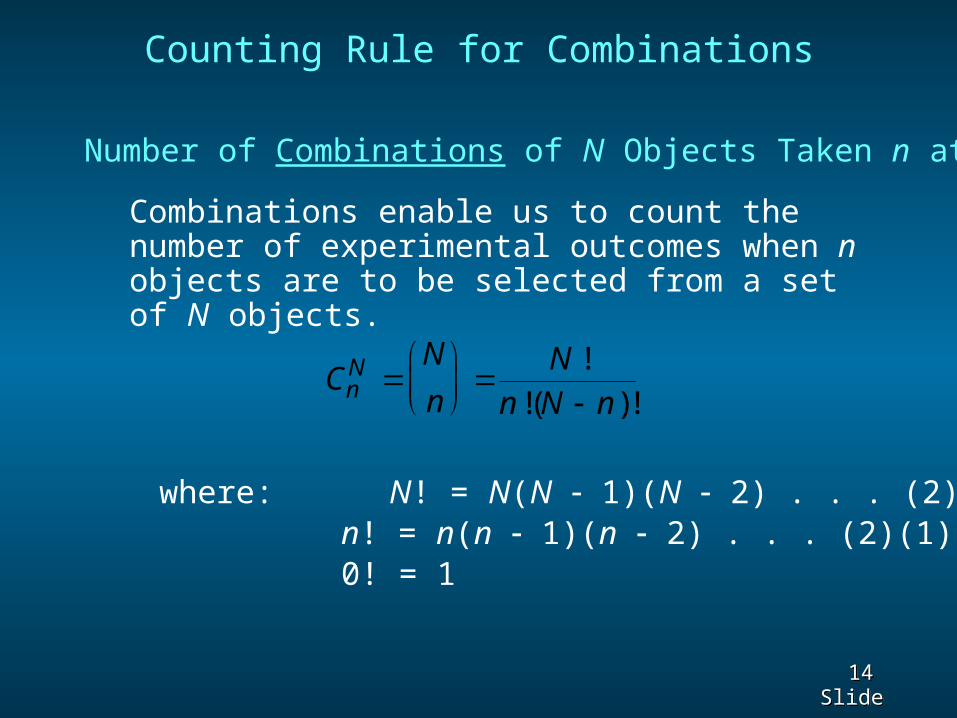
Combinations enable us to count the number of experimental outcomes when n objects are to be selected from a set of N objects.
Counting Rule for Combinations
CN
nN
n N nnN
!
!( )!
Number of Combinations of N Objects Taken n at a Time
where: N! = N(N - 1)(N - 2) . . . (2)(1) n! = n(n - 1)(n - 2) . . . (2)(1) 0! = 1
15 15 Slide Slide
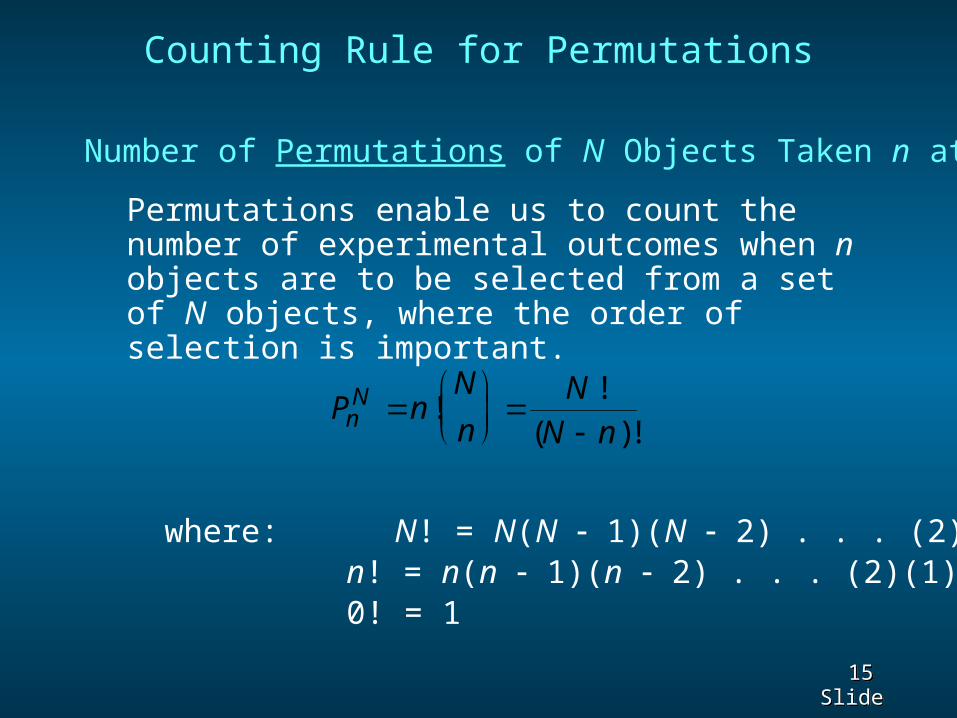
Number of Permutations of N Objects Taken n at a Time
where: N! = N(N - 1)(N - 2) . . . (2)(1) n! = n(n - 1)(n - 2) . . . (2)(1) 0! = 1
P nN
nN
N nnN
!!
( )!
Counting Rule for Permutations
Permutations enable us to count the number of experimental outcomes when n objects are to be selected from a set of N objects, where the order of selection is important.
16 16 Slide Slide
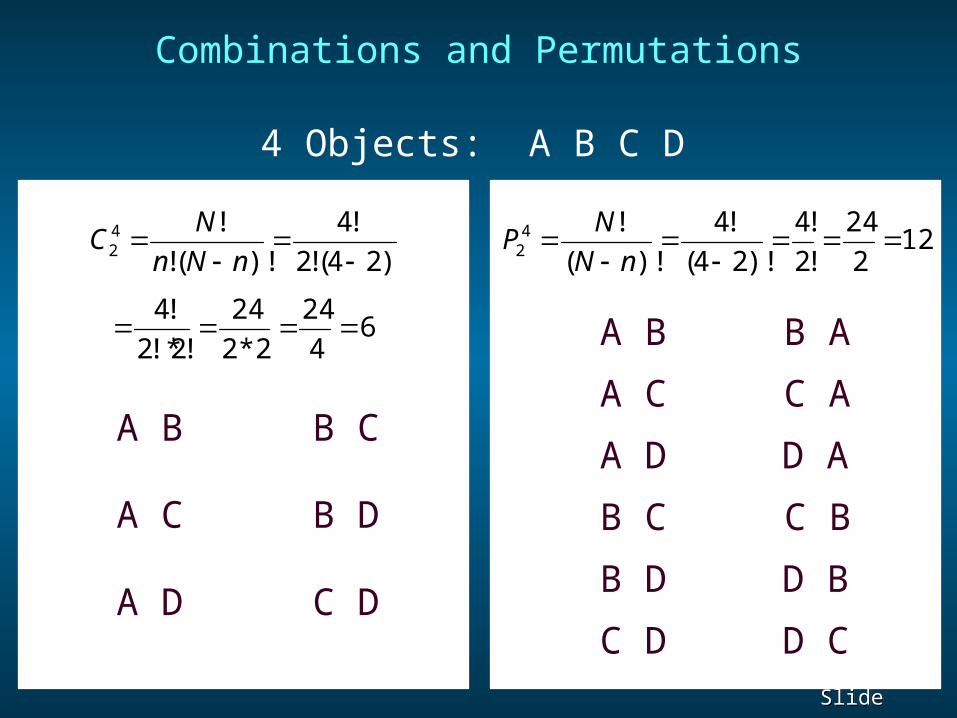
Combinations and Permutations
4 Objects: A B C D
122
24
!2
!4
)!24(
!4
)!(
!42
nN
NP
A B
A C
A D
B C
B D
C D
B A
C A
D A
C B
D B
D C
)!24(!2
!4
)!(!
!42
nNn
NC
64
24
2*2
24
!2!*2
!4
A B
A C
A D C D
B D
B C

17 17 Slide Slide
PRACTICETREE DIAGRAMS, COMBINATIONS, AND PERMUTATIONS
18 18 Slide Slide
Practice Tree Diagram
A box contains six balls: two green, two blue, and two red.You draw two balls without looking.
How many outcomes are possible?
Draw a tree diagram depicting the possible outcomes.
19 19 Slide Slide
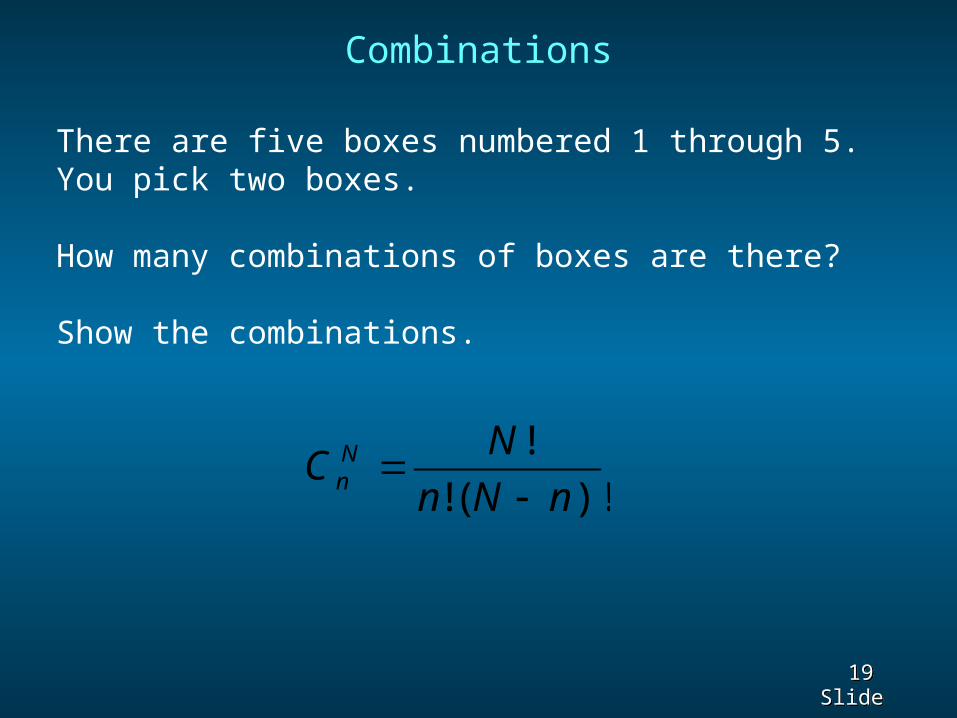
Combinations
There are five boxes numbered 1 through 5. You pick two boxes.
How many combinations of boxes are there?
Show the combinations.
)!(!
!
nNn
NC Nn
20 20 Slide Slide
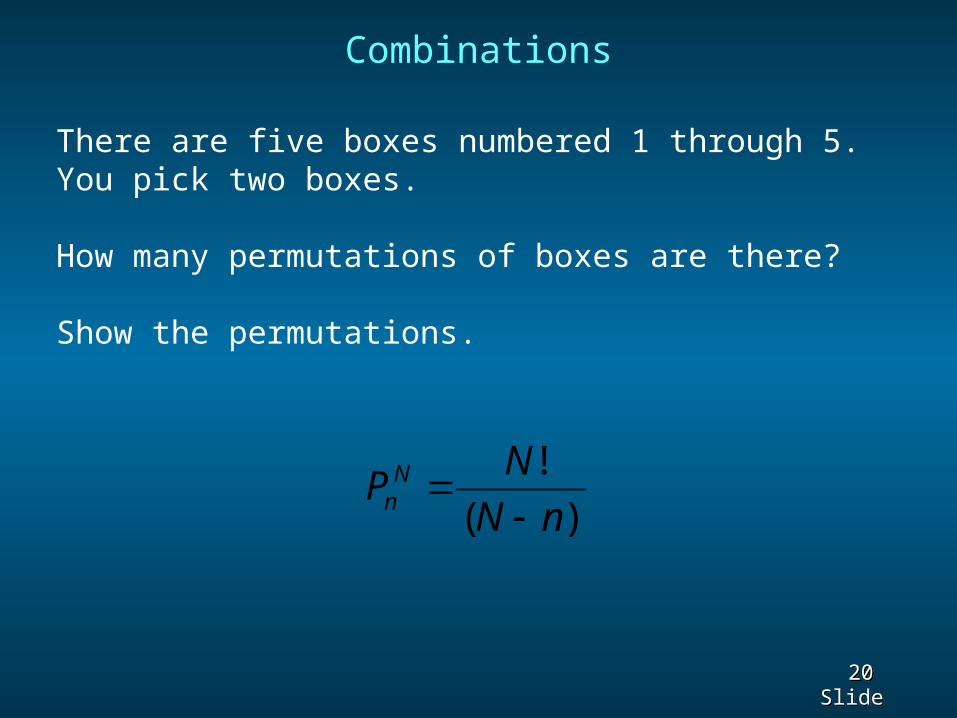
Combinations
There are five boxes numbered 1 through 5. You pick two boxes.
How many permutations of boxes are there?
Show the permutations.
)!(
!
nN
NPNn

21 21 Slide Slide