Embed Size (px)
Citation preview

1
2
www.ASPO-Australia.org.auAn Australia-wide network of professionals working to reduce oil vulnerability
ASPO-Australia Working groupsFinance SectorHealth Sector Social Services SectorRemote indigenous communitiesActive transport (bicycle & walking)Agriculture, Fisheries and FoodBiofuels Urban and transport planning Oil & Gas industryBehavioural changeLocal Government sectorRegional and city working groupsConstruction IndustryFreight sectorPublic transport sectorDefence and Security EconomicsTourism Young Professionals working group
Senate inquiry submission
ASPO-Australia is part of the international ASPO movement
Senate Inquiry into Australia's future oil supply and alternative
transport fuels
3
Outline What is Peak Oil ?
the time when global oil production stops rising and starts its final decline
We will never "run out of oil"
When is the most probable forecast date ? perhaps 2010-2015 (or earlier)
Will market forces solve our Peak Oil problems ? no, sorry!
Why is there no sign that anyone is taking Peak Oil risks seriously? don't know
Should local Government be helping prepare the communityfor Petrol Droughts and Peak Oil ? YES, indeed !
Can WALGA and regional council groupings help to nudge State and Federal Govts into action ? please !
1930 1970 2010 2050
Peak Oilbutwhen?

4
5
-
50,000
100,000
150,000
200,000
250,000
61-6
2
63-6
4
65-6
6
67-6
8
69-7
0
71-7
2
73-7
4
75-7
6
77-7
8
79-8
0
81-8
2
83-8
4
85-8
6
87-8
8
89-9
0
91-9
2
93-9
4
95-9
6
97-9
8
99-0
0
01-0
2
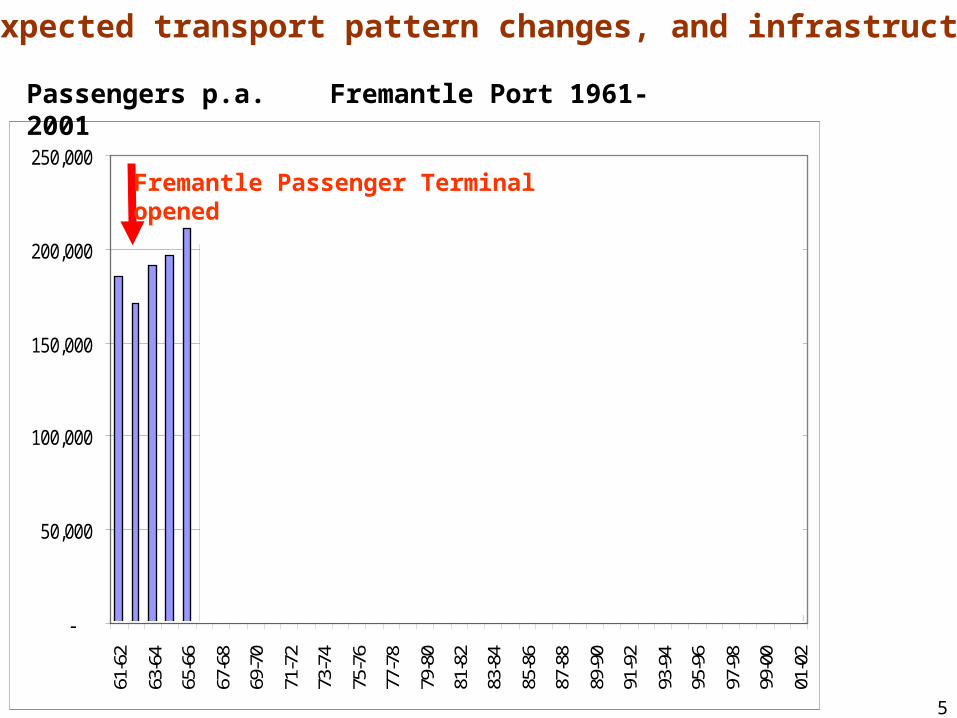
Passengers p.a. Fremantle Port 1961-2001
Fremantle Passenger Terminal opened
Unexpected transport pattern changes, and infrastructure
6
-
50,000
100,000
150,000
200,000
250,000
61-6
2
63-6
4
65-6
6
67-6
8
69-7
0
71-7
2
73-7
4
75-7
6
77-7
8
79-8
0
81-8
2
83-8
4
85-8
6
87-8
8
89-9
0
91-9
2
93-9
4
95-9
6
97-9
8
99-0
0
01-0
2
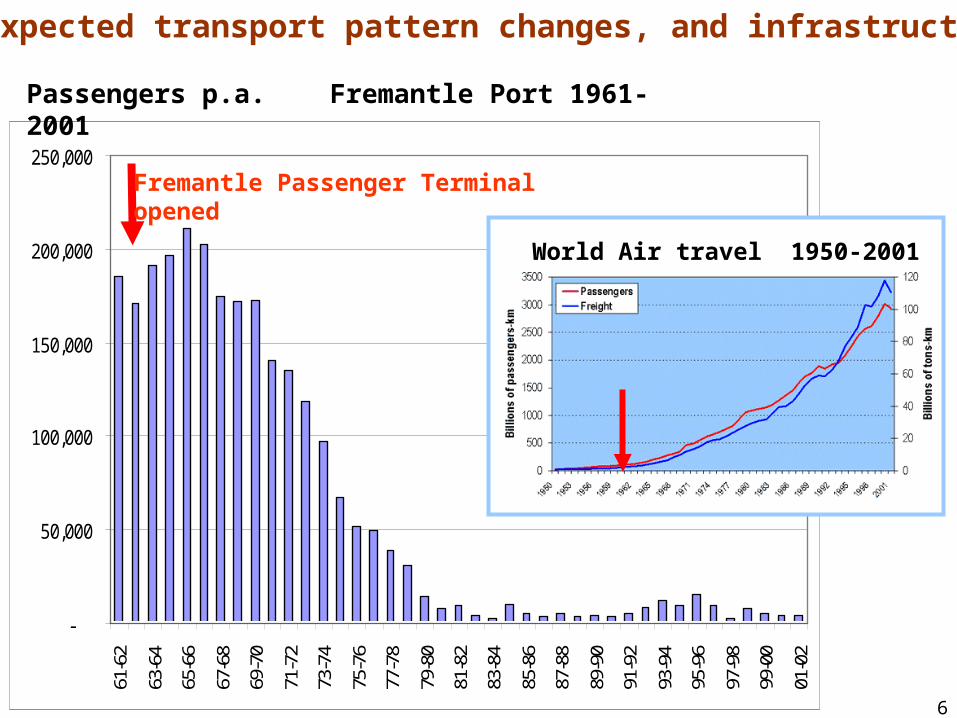
Passengers p.a. Fremantle Port 1961-2001
Fremantle Passenger Terminal opened
Unexpected transport pattern changes, and infrastructure
World Air travel 1950-2001

7

8
9
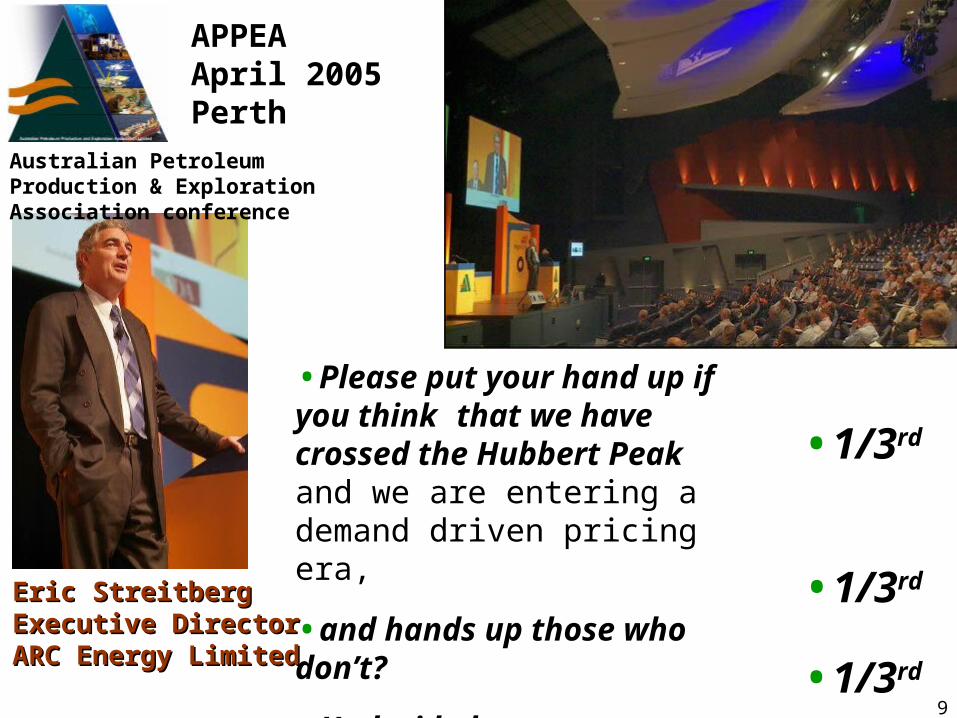
•Please put your hand up if you think that we have crossed the Hubbert Peak and we are entering a demand driven pricing era,
•and hands up those who don’t?
•Undecided
Eric StreitbergEric StreitbergExecutive Director Executive Director ARC Energy LimitedARC Energy Limited
Australian Petroleum Production & Exploration Association conference
APPEAApril 2005Perth
•1/3rd
•1/3rd
•1/3rd
10
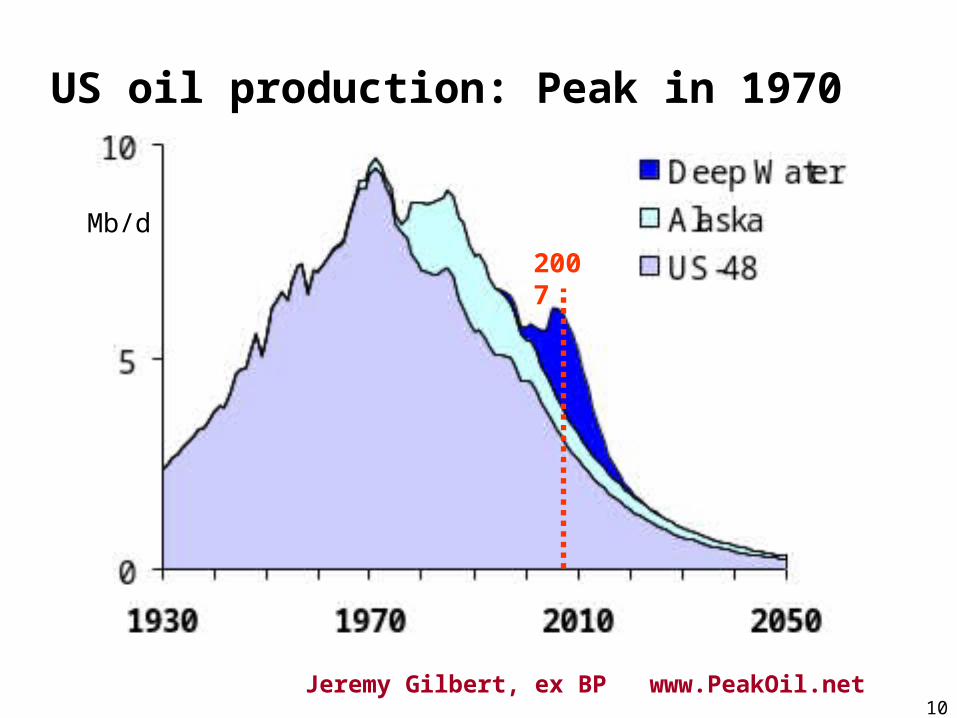
Mb/d
US oil production: Peak in 1970
2007
Jeremy Gilbert, ex BP www.PeakOil.net
11
Prof. Aleklett, ASPOSweden

12
13
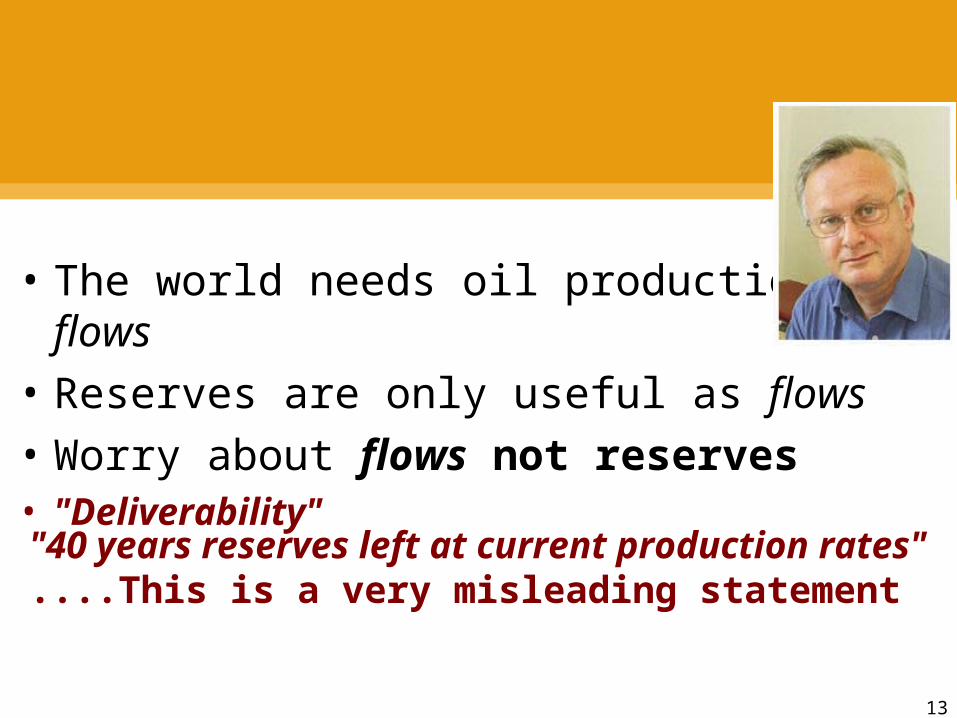
• The world needs oil production flows
• Reserves are only useful as flows
• Worry about flows not reserves• "Deliverability"
"40 years reserves left at current production rates"....This is a very misleading statement
14
A simple observation -- or why peak will be earlier than most people expect
‘Global production falls when loss of output from countries in decline exceeds gains in output from those that are expanding.’
15
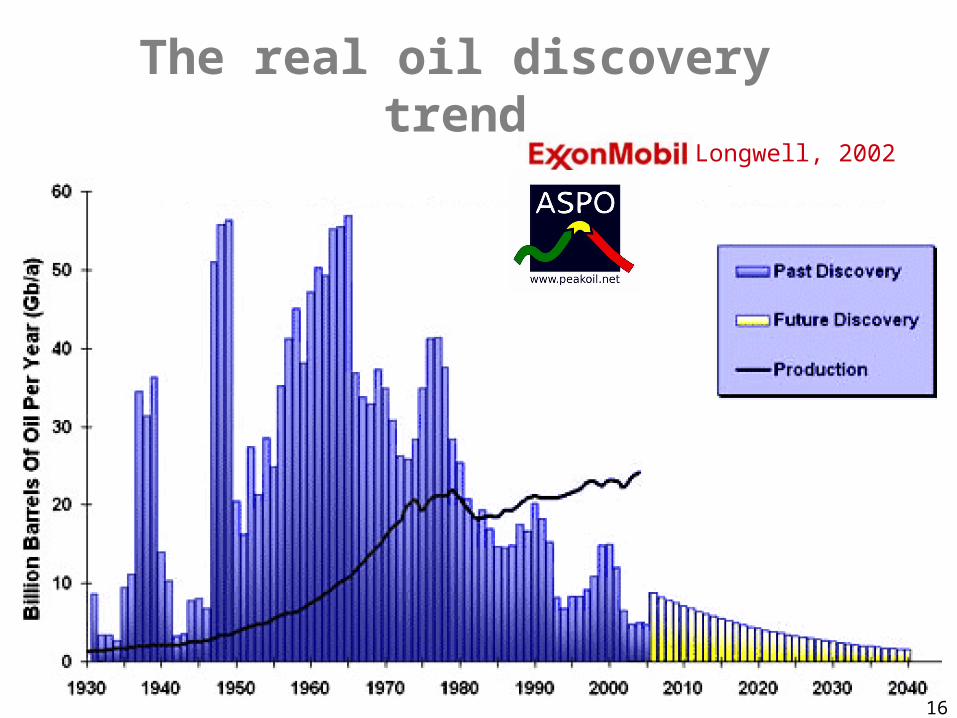
Why are oil supplies peaking?
• We are not finding oil fast enough
• We are not developing fields fast enough
• Too many fields are old and declining
16
The real oil discovery trendLongwell, 2002

17
18
-4000
-1500
1000
3500
6000
1965 1970 1975 1980 1985 1990 1995 2000 2005
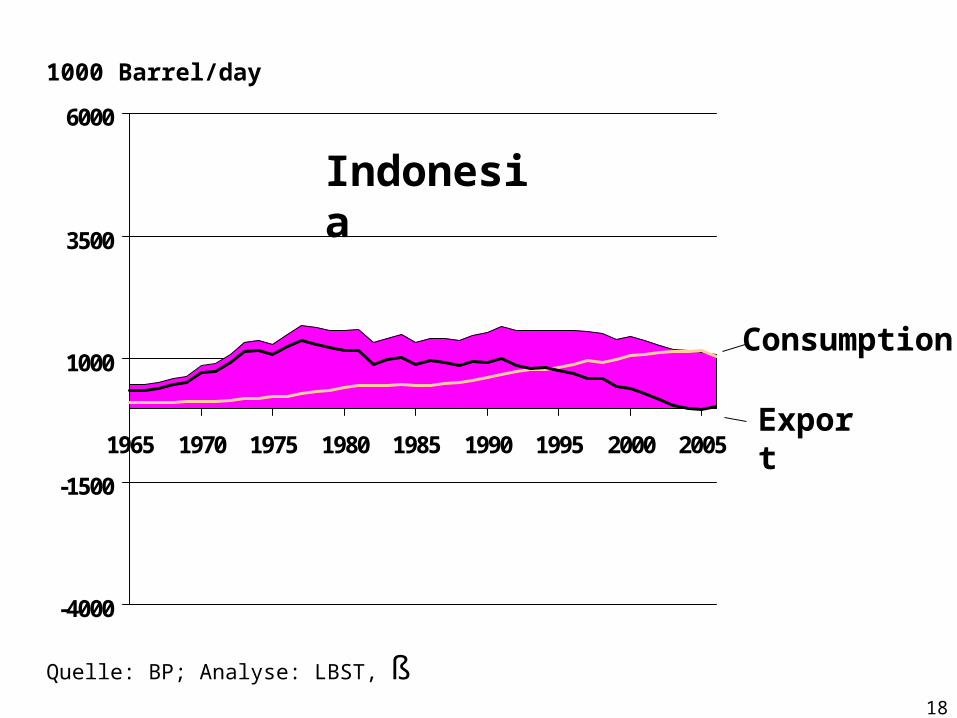
1000 Barrel/day
Indonesia
Consumption
Export
Quelle: BP; Analyse: LBST, ß
19
-4000
-2000
0
2000
4000
6000
1965 1970 1975 1980 1985 1990 1995 2000 2005
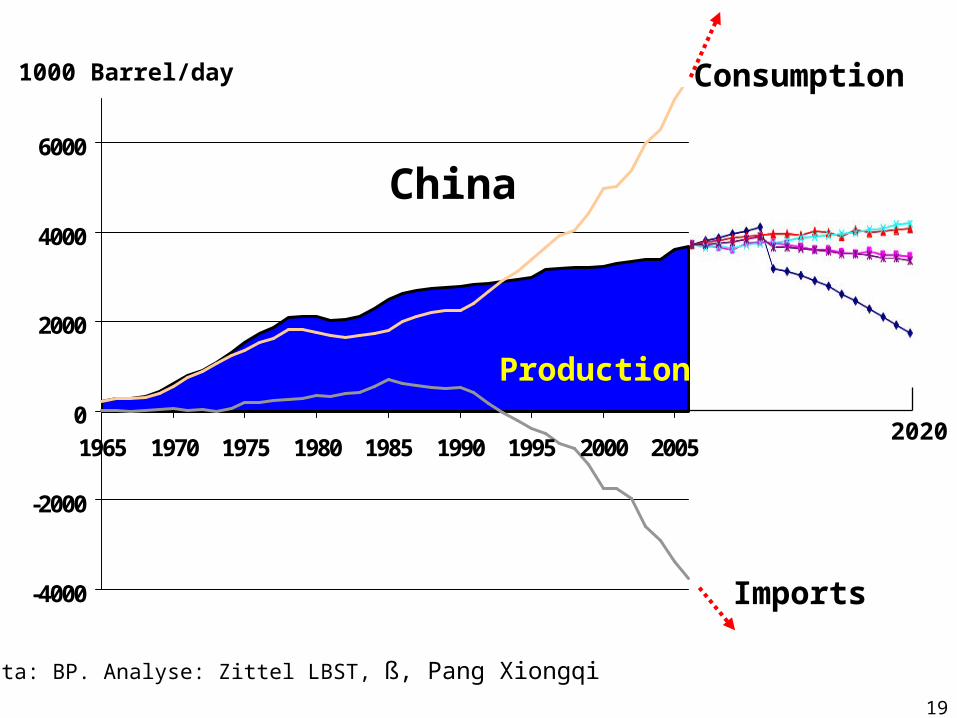
1000 Barrel/day
China
Consumption
Imports
Data: BP. Analyse: Zittel LBST, ß, Pang Xiongqi
2020
Production
20
Chris Skrebowski's conclusions
21
Lord Ron OxburghFormer Chairman, Shell UK Chairman, House of Lords Select Committee on Science and Technology Honorary Professor, Cambridge UniversityFellow of the Royal Society

22
23
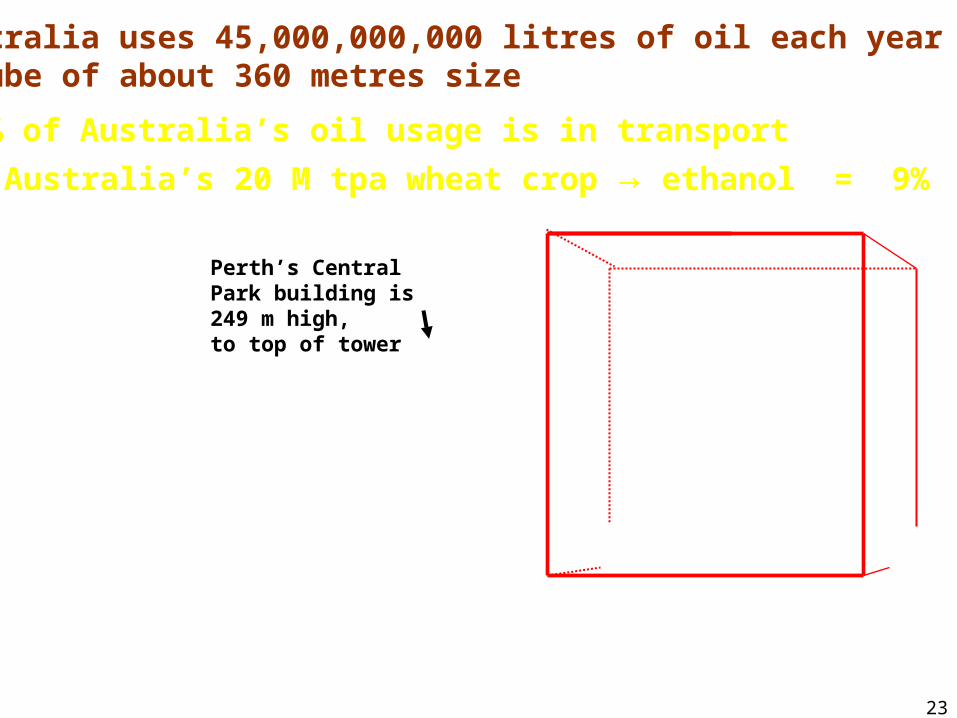
Perth’s Central Park building is 249 m high, to top of tower
Australia uses 45,000,000,000 litres of oil each yeara cube of about 360 metres size
80% of Australia’s oil usage is in transport
If Australia’s 20 M tpa wheat crop → ethanol = 9%
24
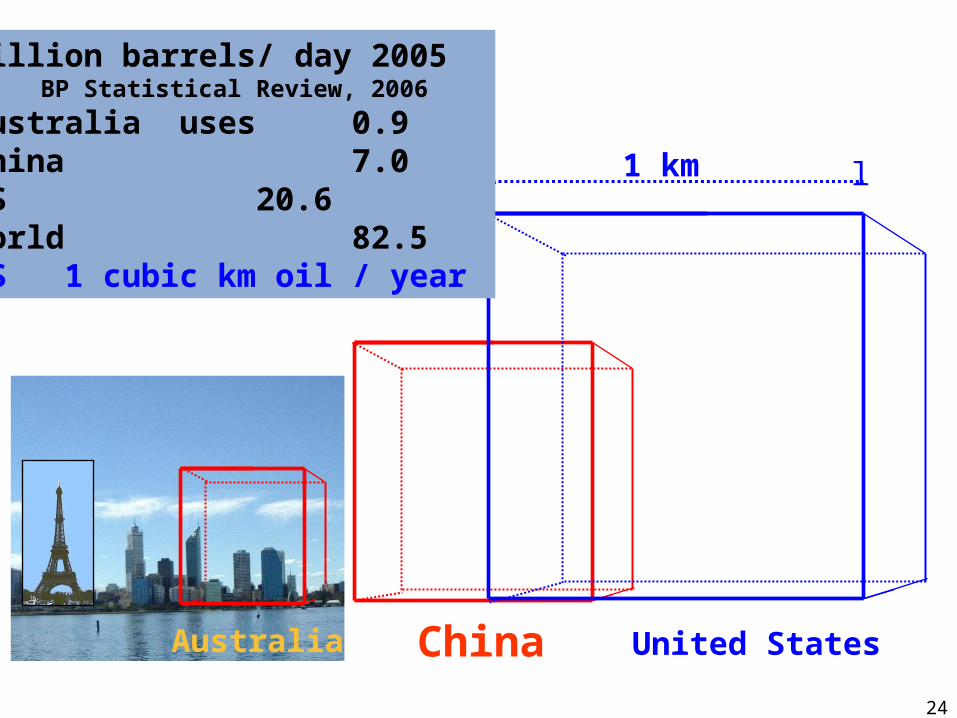
Australia China United States
1 kml l
Million barrels/ day 2005 BP Statistical Review, 2006
Australia uses 0.9 China 7.0US 20.6World 82.5 US 1 cubic km oil / year
25
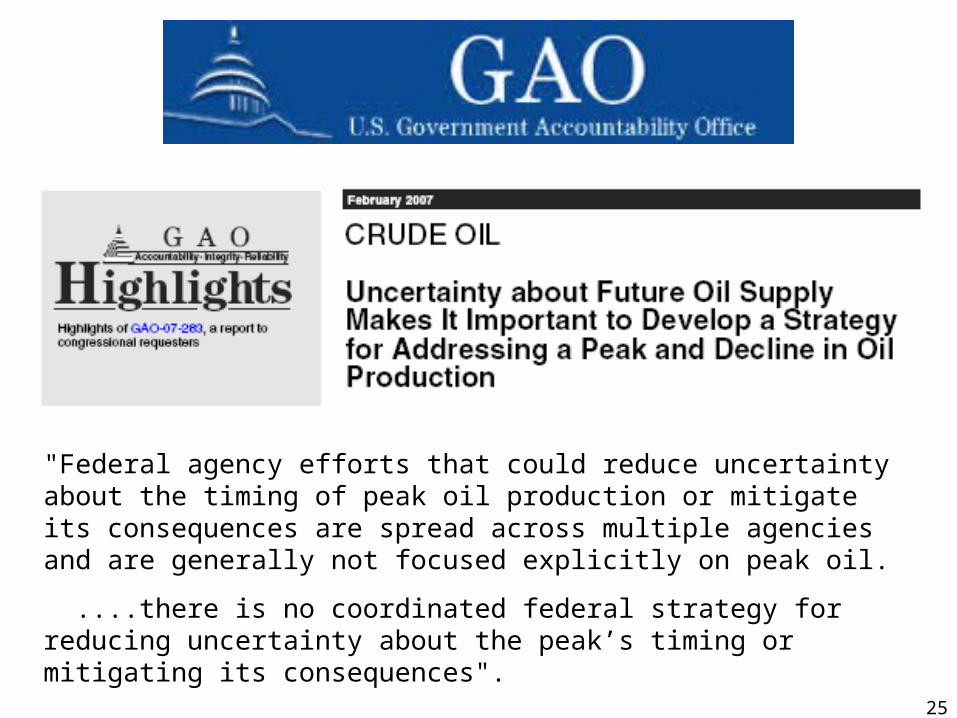
"Federal agency efforts that could reduce uncertainty about the timing of peak oil production or mitigate its consequences are spread across multiple agencies and are generally not focused explicitly on peak oil.
....there is no coordinated federal strategy for reducing uncertainty about the peak’s timing or mitigating its consequences".
26
PEAKING OF WORLD OIL PRODUCTION:IMPACTS, MITIGATION, & RISK MANAGEMENTRobert L. Hirsch, Roger Bezdek & Robert Wendling
February 2005for US Dept of Energy
"The peaking of world oil production presents the U.S. and the world with an unprecedented risk management problem.
Without timely mitigation, the economic, social, and political costs will be unprecedented.
Viable mitigation options exist on both the supply and demand sides, but to have substantial impact, they must be initiated more than a decade in advance of peaking."
"The world has never faced a problem like this.
.. oil peaking will be abrupt and revolutionary".

27
28
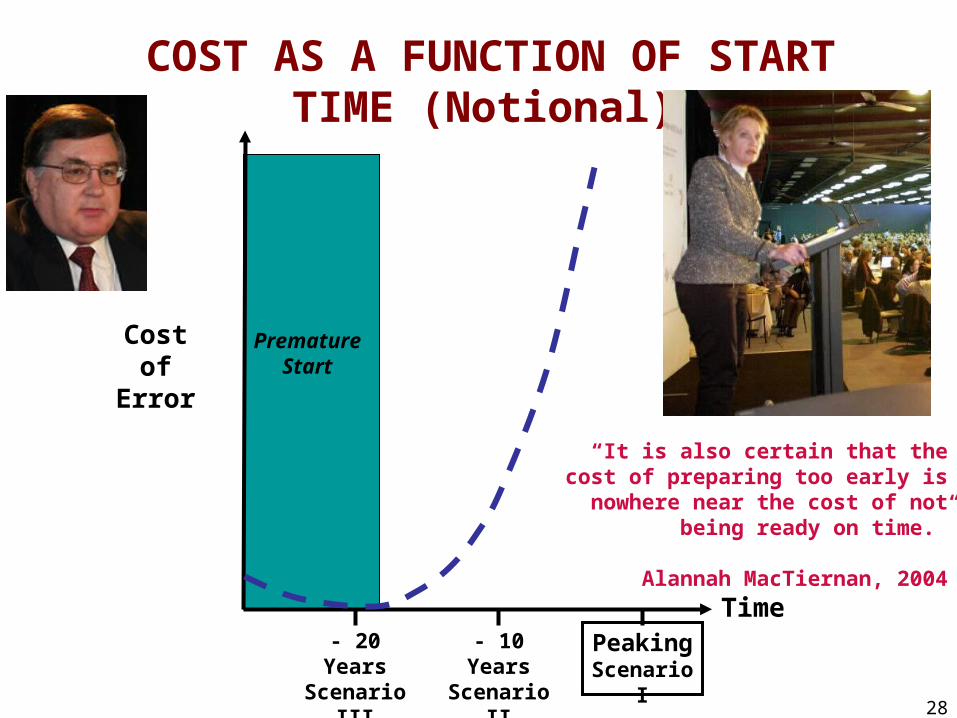
Time
Cost of Error
COST AS A FUNCTION OF START TIME (Notional)
Premature Start
Peaking Scenario I
- 10 Years Scenario II
- 20 Years Scenario III
“It is also certain that the cost of preparing too early is nowhere near the
cost of not being ready on time.”
Alannah MacTiernan, 2004

29

30

31

32
33
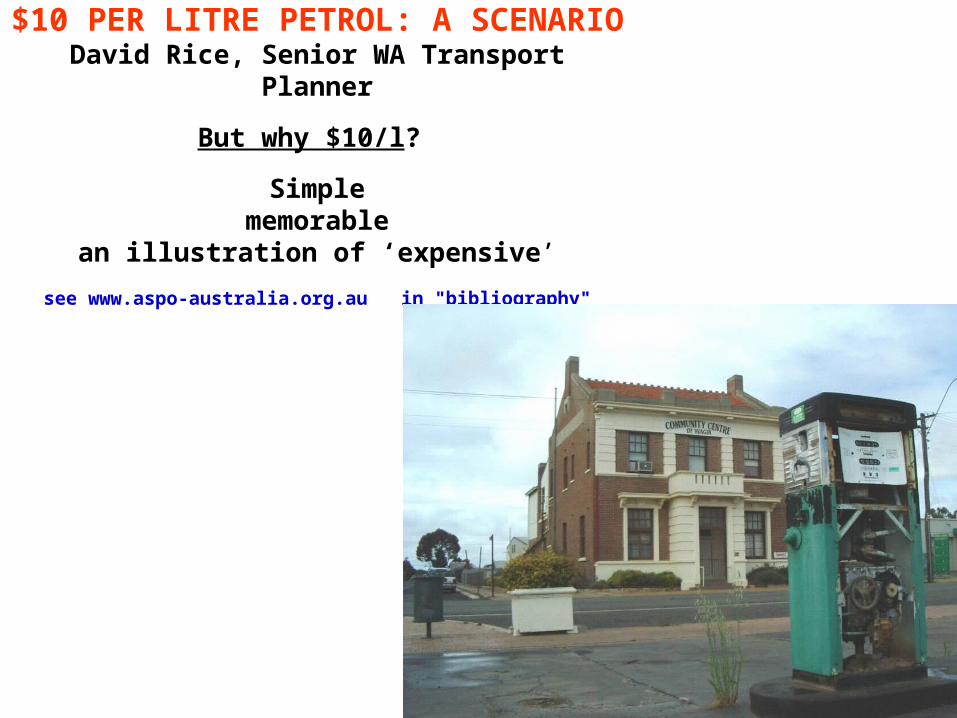
$10 PER LITRE PETROL: A SCENARIODavid Rice, Senior WA Transport Planner
But why $10/l?
Simplememorable
an illustration of ‘expensive’
see www.aspo-australia.org.au in "bibliography"
34
Government of Western Australia
STATE LIQUID FUEL SHORTAGE
EMERGENCY PLAN
OPERATIONAL PLAN PREPARED BY
ENERGY SAFETY DIRECTORATEDEPARTMENT OF CONSUMER
AND EMPLOYMENT PROTECTION20 Southport Street, W Leederville WA 6007Tel: (08) 9422 5200 Fax: (08) 9422 5244
January 2003
35
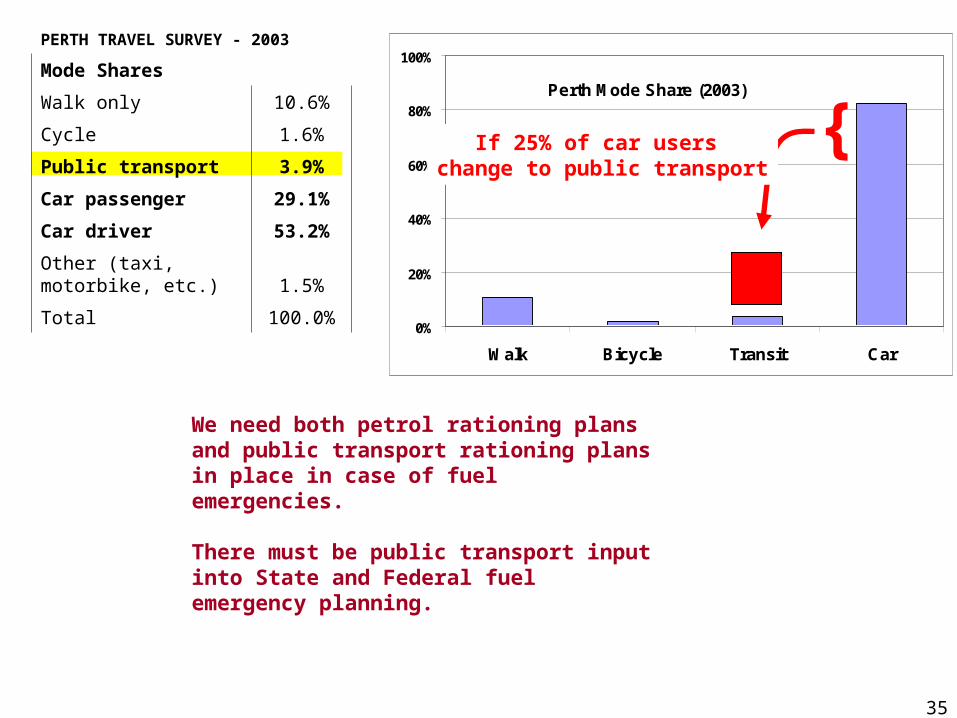
We need both petrol rationing plans and public transport rationing plans in place in case of fuel emergencies.
There must be public transport input into State and Federal fuel emergency planning.
0%
20%
40%
60%
80%
100%
Walk Bicycle Transit Car
Perth Mode Share (2003)
{If 25% of car users change to public transport
PERTH TRAVEL SURVEY - 2003
Mode Shares
Walk only 10.6%
Cycle 1.6%
Public transport 3.9%
Car passenger 29.1%
Car driver 53.2%
Other (taxi, motorbike, etc.) 1.5%
Total 100.0%

36
37www.ASPO-Australia.org.Au
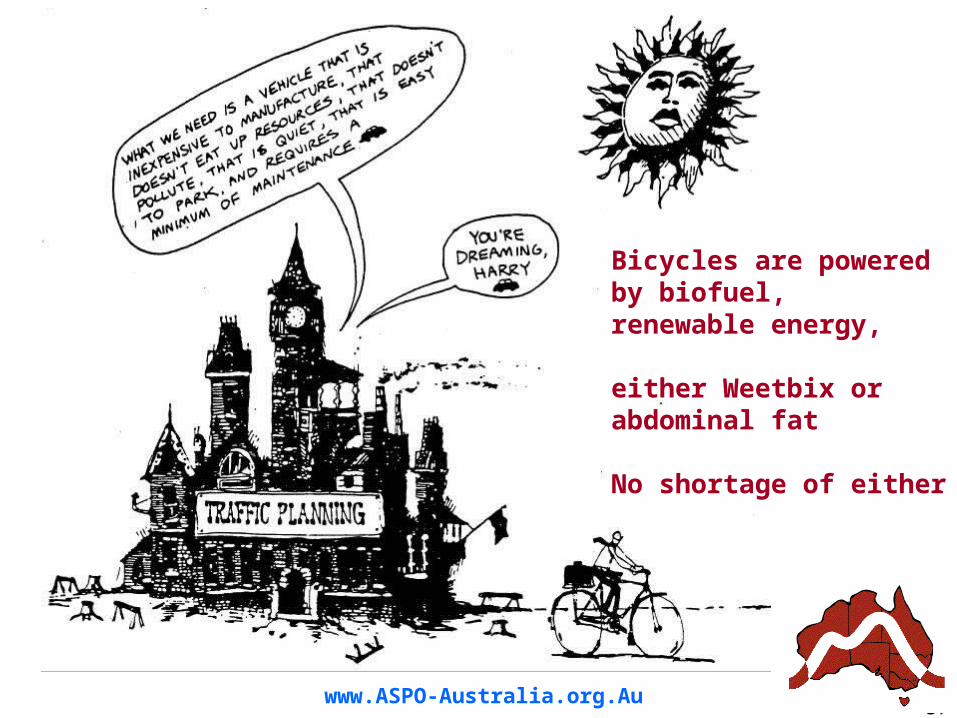
Bicycles are powered by biofuel, renewable energy,
either Weetbix or abdominal fat
No shortage of either

38
a few more slides follow,in case they are needed for questions
39
1: “Talk about it, Talk about it”2. Engage people, “Participatory democracy”3. Dismantle the "perverse policies" that subsidise heavy car use and excessive freight transport.
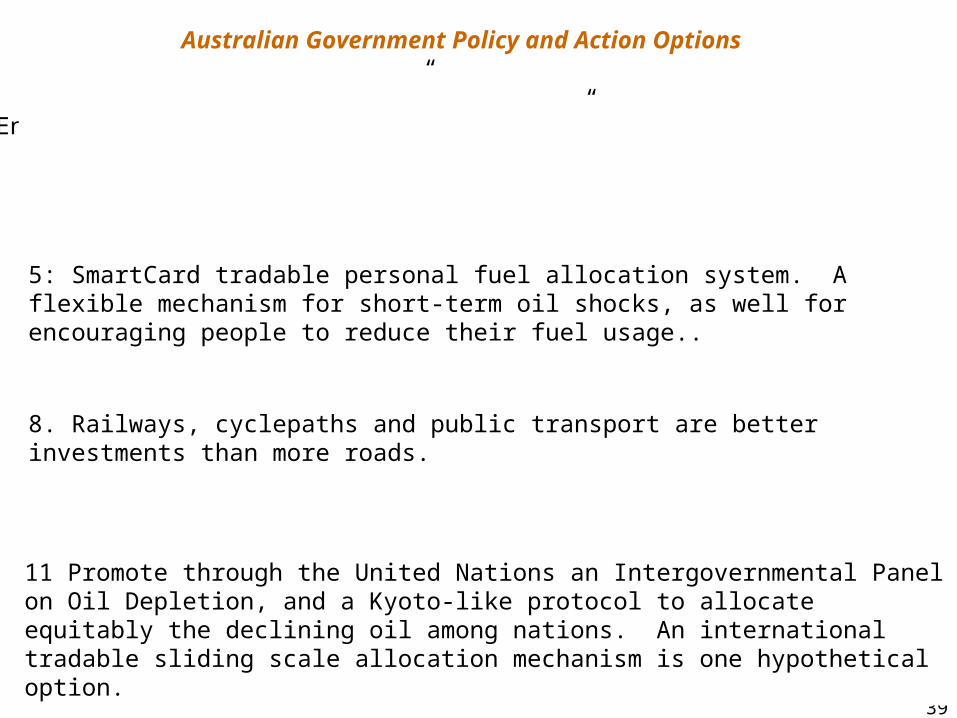
Australian Government Policy and Action Options
4. Encourage frugal use of fuel, and disadvantage profligate users. Fuel taxes should be incrementally raised to European levels to reduce usage.5: SmartCard tradable personal fuel allocation system. A flexible mechanism for short-term oil shocks, as well for encouraging people to reduce their fuel usage..
8. Railways, cyclepaths and public transport are better investments than more roads.
11 Promote through the United Nations an Intergovernmental Panel on Oil Depletion, and a Kyoto-like protocol to allocate equitably the declining oil among nations. An international tradable sliding scale allocation mechanism is one hypothetical option.
40
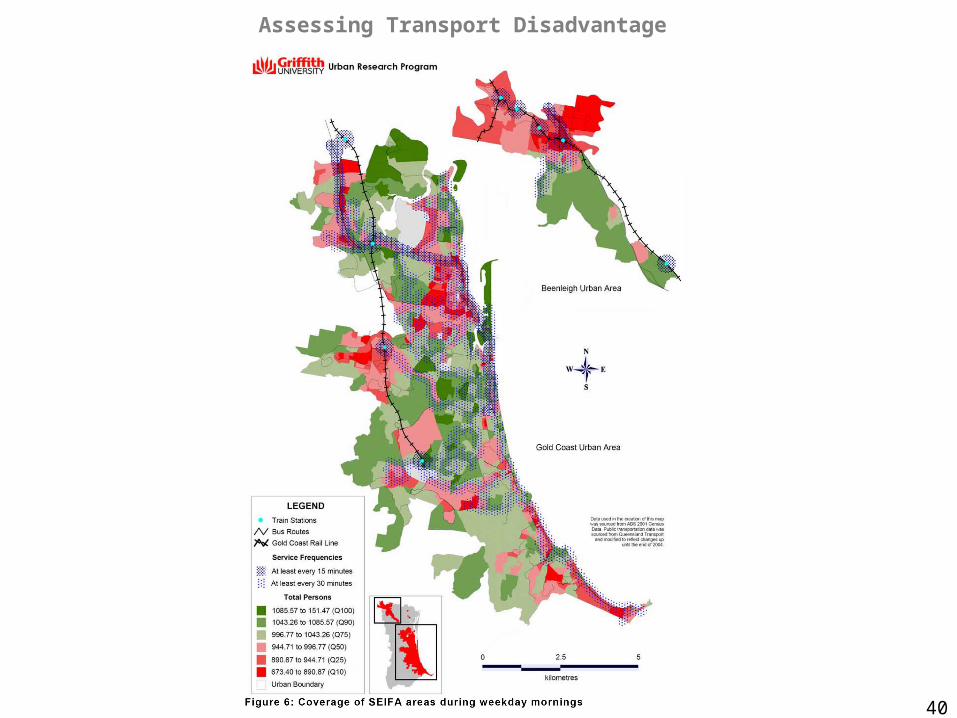
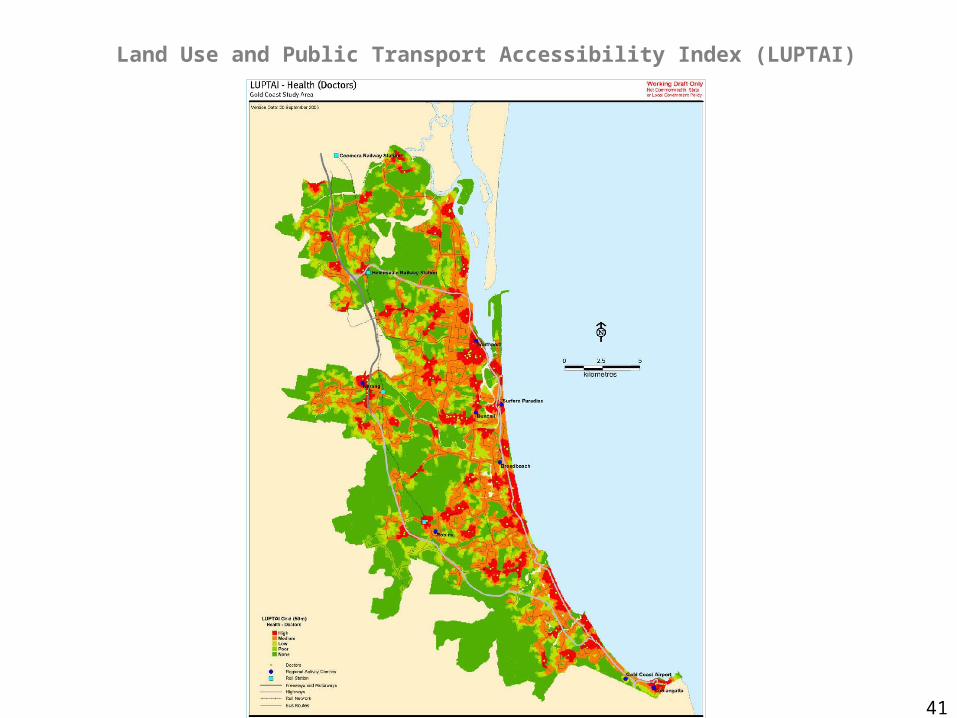
Assessing Transport Disadvantage
41
Land Use and Public Transport Accessibility Index (LUPTAI)
42
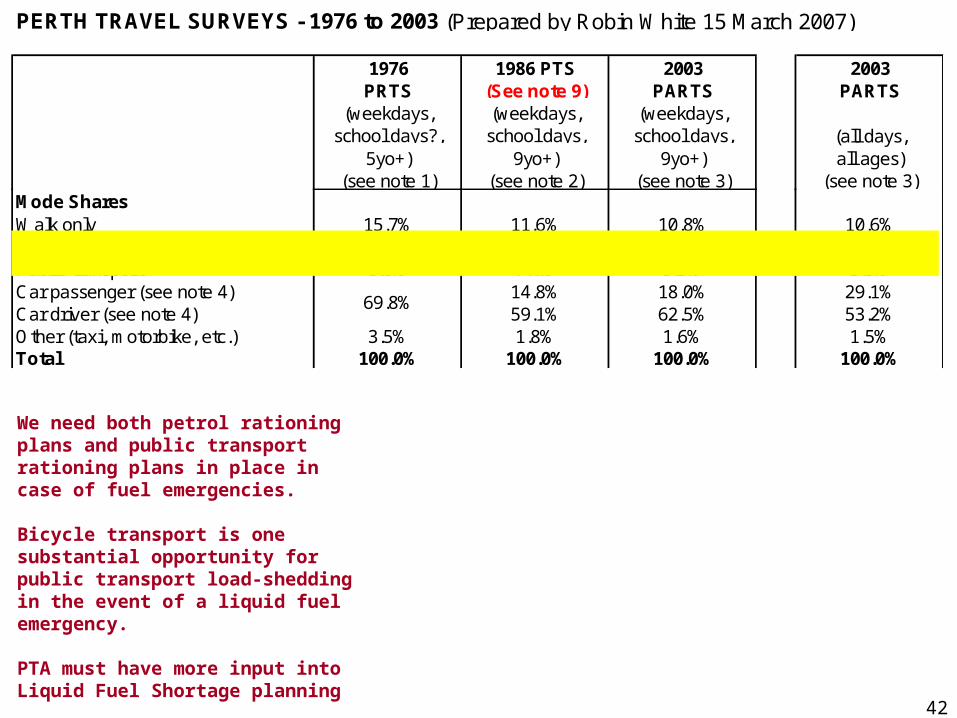
PERTH TRAVEL SURVEYS - 1976 to 2003 (Prepared by Robin White 15 March 2007)
1976 1986 PTS 2003 2003PRTS (See note 9) PARTS PARTS
(weekdays, school days?,
(weekdays, school days,
(weekdays, school days, (all days,
5yo+) 9yo+) 9yo+) all ages)(see note 1) (see note 2) (see note 3) (see note 3)
Mode SharesWalk only 15.7% 11.6% 10.8% 10.6%Cycle 3.0% 5.3% 1.6% 1.6%Public transport 8.0% 7.4% 5.5% 3.9%Car passenger (see note 4) 14.8% 18.0% 29.1%Car driver (see note 4) 59.1% 62.5% 53.2%Other (taxi, motorbike, etc.) 3.5% 1.8% 1.6% 1.5%Total 100.0% 100.0% 100.0% 100.0%
69.8%
We need both petrol rationing plans and public transport rationing plans in place in case of fuel emergencies.
Bicycle transport is one substantial opportunity for public transport load-shedding in the event of a liquid fuel emergency.
PTA must have more input into Liquid Fuel Shortage planning

43

44

45
46
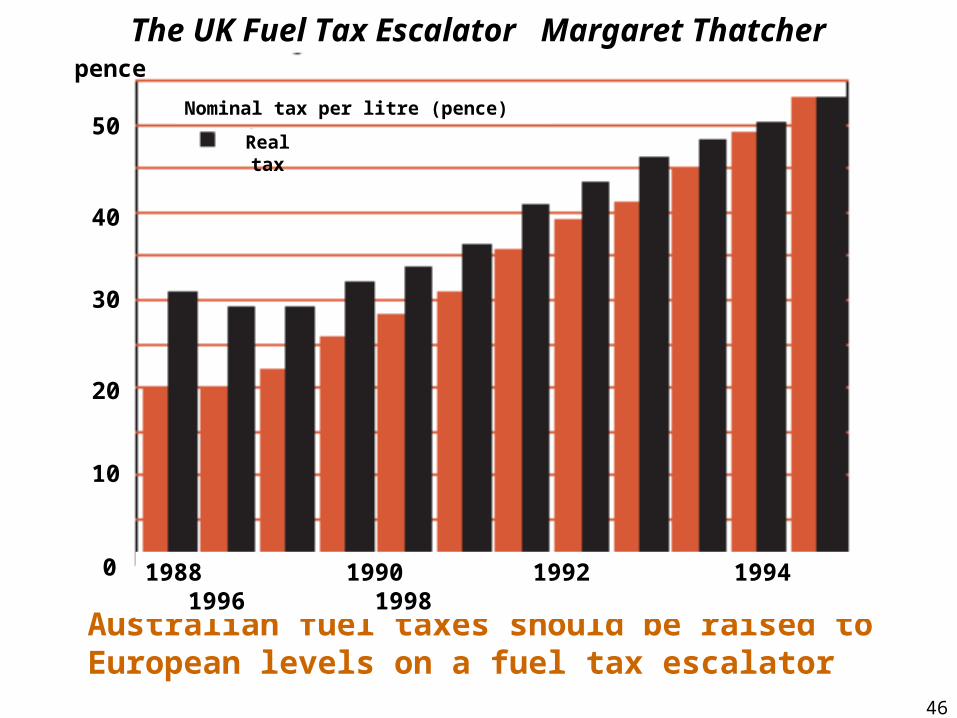
The UK Fuel Tax Escalator Margaret Thatcher
Australian fuel taxes should be raised to European levels on a fuel tax escalator
1988 1990 1992 1994 1996 1998
Nominal tax per litre (pence)
Real tax
10
30
50
40
20
0
pence
47
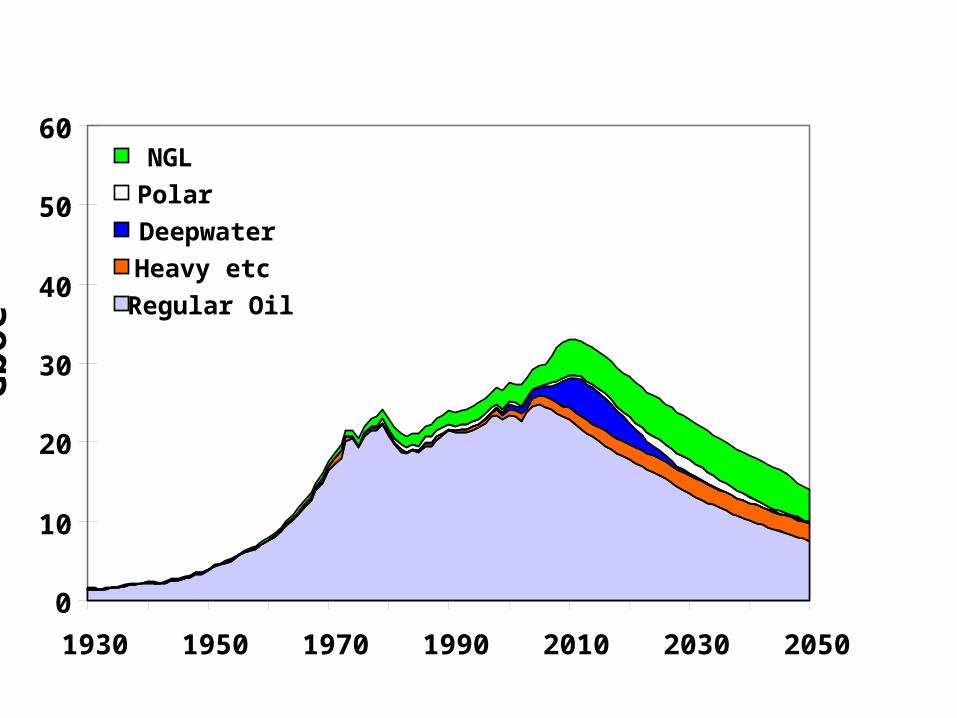
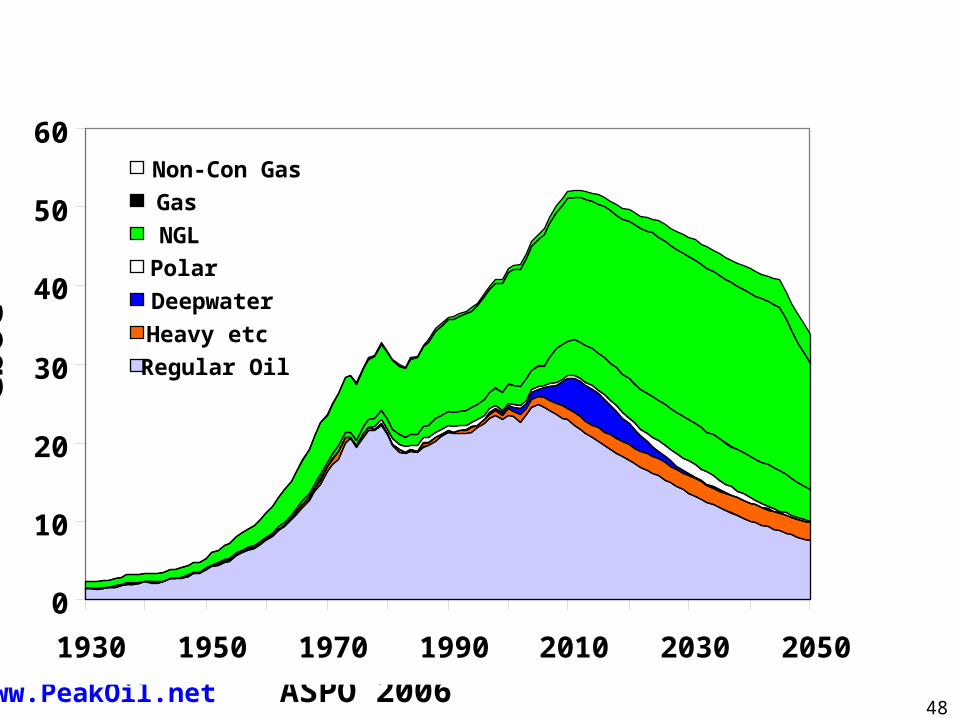
2007 }Oil
Gboe/pa World All Oil
www.PeakOil.net ASPO 2006
0
10
20
30
40
50
60
1930 1950 1970 1990 2010 2030 2050
Gb
oe
NGL
Polar
Deepwater
Heavy etc
Regular Oil
48
2007}Oil
}Gas
Gboe/pa World All Oil & Gas (gas at 10,000 cft=1bbl)
www.PeakOil.net ASPO 2006
0
10
20
30
40
50
60
1930 1950 1970 1990 2010 2030 2050
Gb
oe
Non-Con Gas
Gas
NGL
Polar
Deepwater
Heavy etc
Regular Oil
49
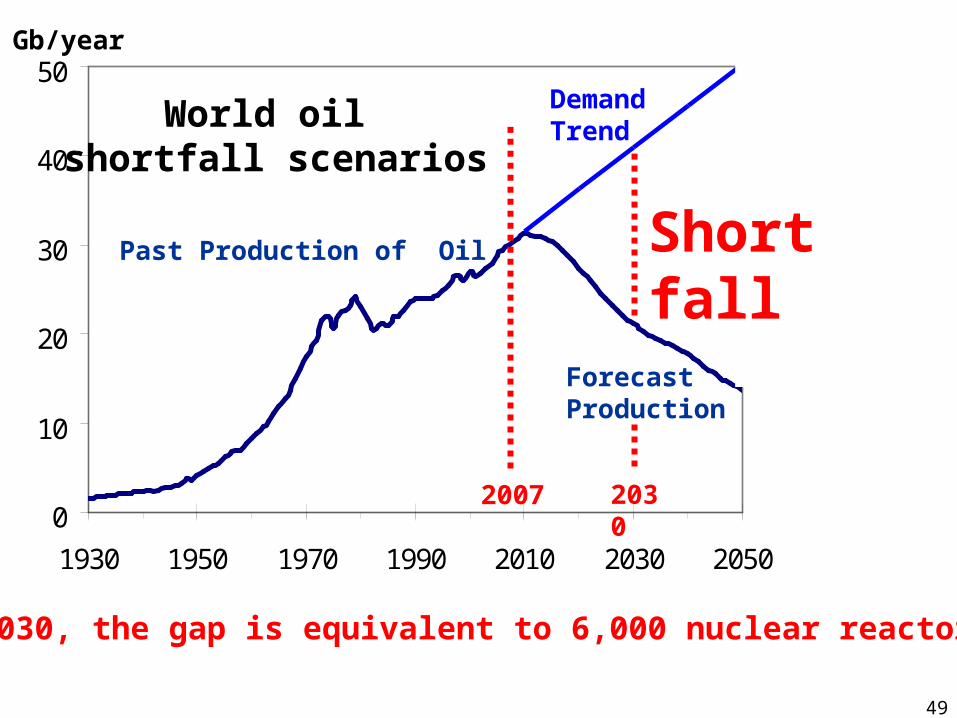
0
10
20
30
40
50
1930 1950 1970 1990 2010 2030 2050
2007
World oil shortfall scenarios
Past Production of Oil
ForecastProduction
Demand Trend
Gb/year
0
10
20
30
40
50
Shortfall
By 2030, the gap is equivalent to 6,000 nuclear reactors
2030
50
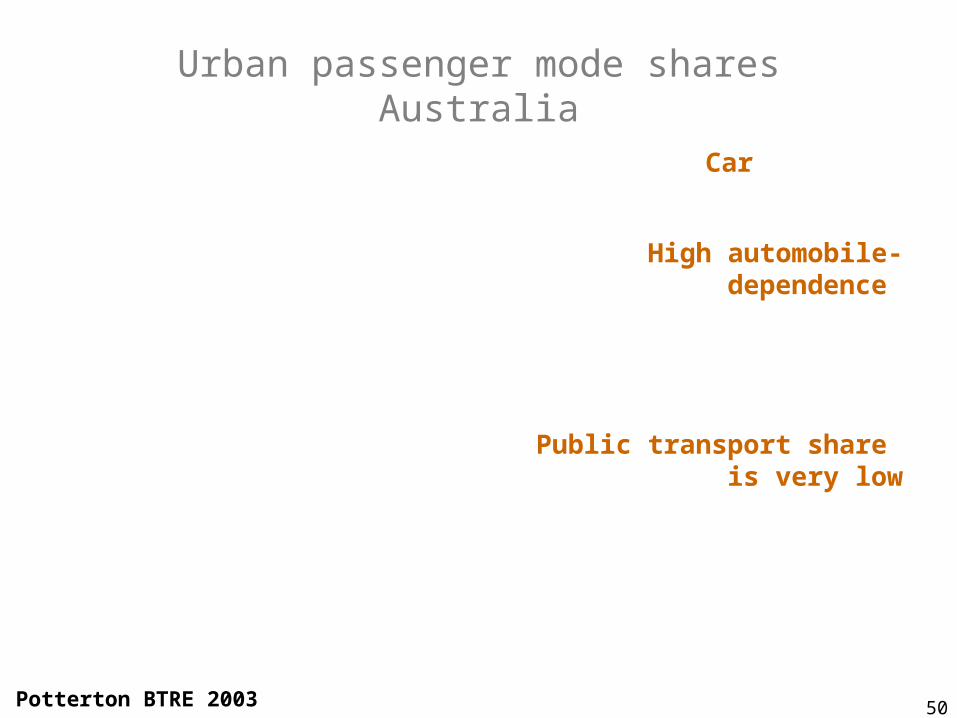
Urban passenger mode shares Australia
Potterton BTRE 2003
High automobile-dependence
Public transport share is very low
Car
51

52
Government of Western Australia
STATE LIQUID FUEL SHORTAGE
EMERGENCY PLAN
OPERATIONAL PLAN PREPARED BY
ENERGY SAFETY DIRECTORATEDEPARTMENT OF CONSUMER
AND EMPLOYMENT PROTECTION20 Southport Street, W Leederville WA 6007Tel: (08) 9422 5200 Fax: (08) 9422 5244
January 2003

53

54
55
February 2004

56

57
58

59
60
61
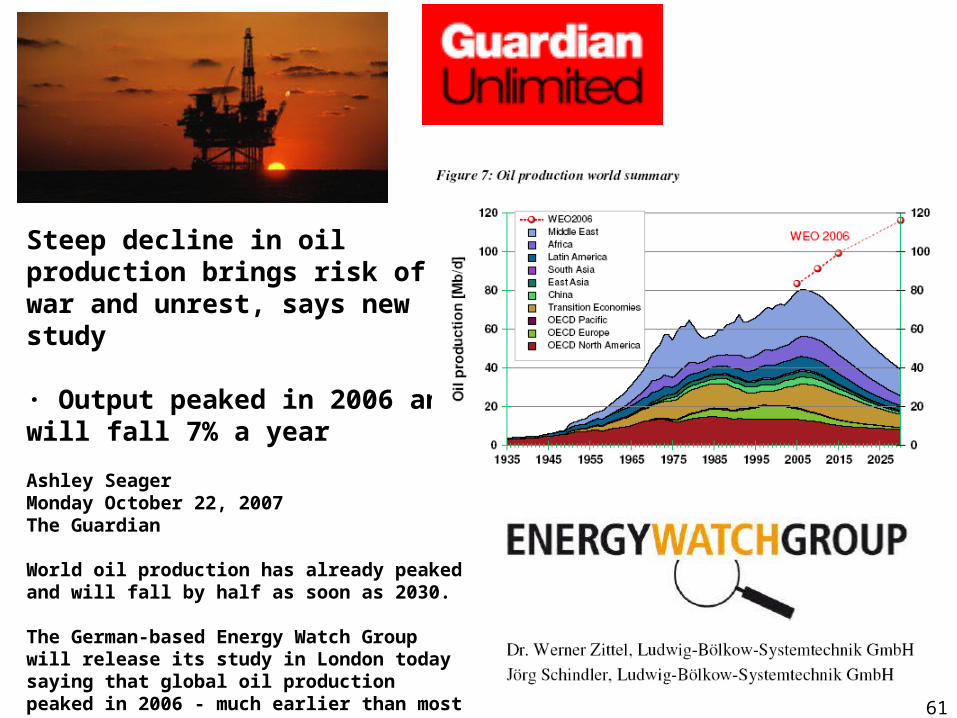
Steep decline in oil production brings risk of war and unrest, says new study
· Output peaked in 2006 and will fall 7% a year
Ashley SeagerMonday October 22, 2007The Guardian
World oil production has already peaked and will fall by half as soon as 2030.
The German-based Energy Watch Group will release its study in London today saying that global oil production peaked in 2006 - much earlier than most experts had expected.

62