Embed Size (px)
Citation preview
1
Aggregate Demand And Aggregate Supply
2
The Aggregate Demand Curve (AD)
The aggregate demand curve is downward sloping, specifying an inverse relationship between the price level and the quantity demanded of Real GDP, ceteris paribus.
3
The Aggregate Demand Curve (continued) Real GDP:
the value of the entire output produced annually within a country’s borders, adjusted for price changes.
4
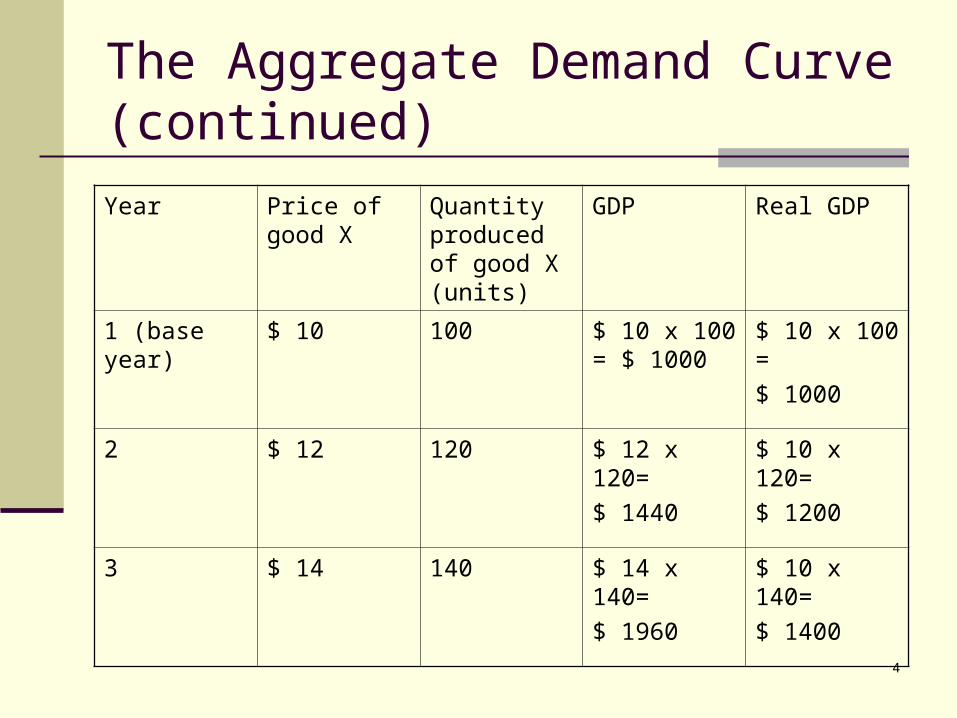
The Aggregate Demand Curve (continued)
Year Price of good X
Quantity produced of good X (units)
GDP Real GDP
1 (base year) $ 10 100 $ 10 x 100 = $ 1000
$ 10 x 100 =
$ 1000
2 $ 12 120 $ 12 x 120=
$ 1440
$ 10 x 120=
$ 1200
3 $ 14 140 $ 14 x 140=
$ 1960
$ 10 x 140=
$ 1400
5
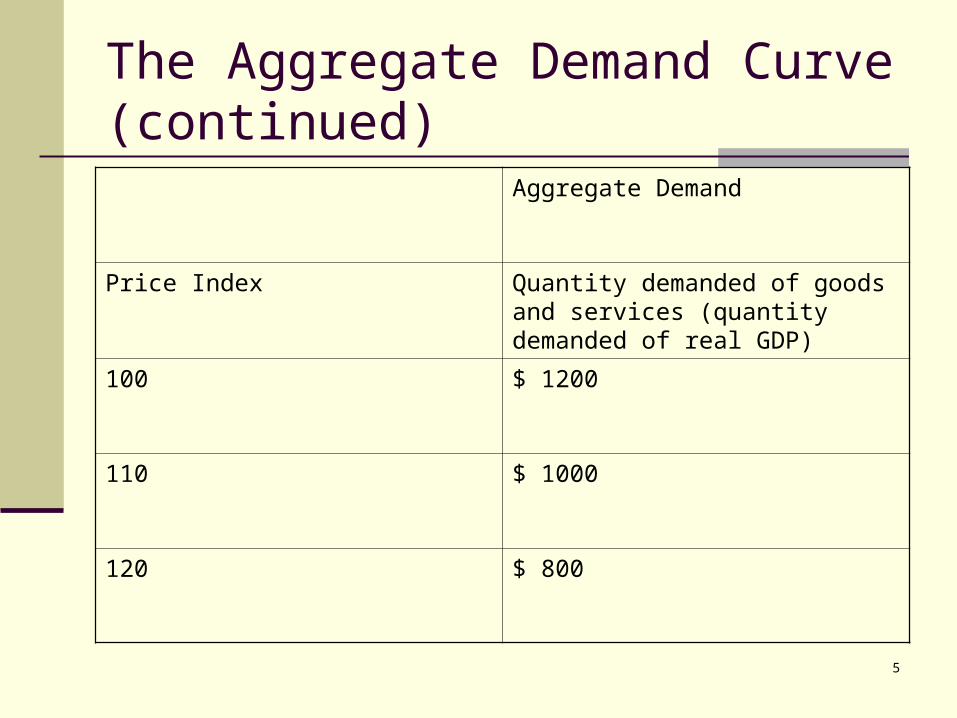
The Aggregate Demand Curve (continued)
Aggregate Demand
Price Index Quantity demanded of goods and services (quantity demanded of real GDP)
100 $ 1200
110 $ 1000
120 $ 800
6
Why Does The Aggregate Demand Curve Slope Downward? Explained by the real balance effect, the
interest rate effect, and the international trade effect.
7
Real Balance Effect (Due To A Change In The Price Level)…Monetary Wealth (Money Holdings)
Example:
A person who has $ 50000 in cash.
Suppose the price level falls.
Causes the purchasing power of the person’s
$ 50000 rises.
Becomes wealthier, buys more goods.
Exhibit 2 “Real Balance In Effect” Page 155.
8
Interest Rate Effect (Due To A Change In The Price Level)Consider of a person who buy a fixed bundle of goods each week. Suppose the price level falls, increasing the purchasing power of the person’s money. With more purchasing power, the person can purchase fixed bundle with less money. The person will save money more, causes the supply of credit increases, which is the interest rate drops. Households and businesses borrow more, buying more goods, Real GDP rises.
Exhibit 2 Page 155 “Interest Rate Effect”
9
International Trade Effect
The change in foreign sector spending as the price level changes.
Exhibit 2 Page 155 “International Trade Effect.”
10
A Change In The Quantity Demanded Of Real GDP Versus A Change In Aggregate Demand
A change in the quantity demanded of real GDP is brought about by a change in the price level.
Exhibit 3 Page 156 figure a.
11
A Change In The Quantity Demanded Of Real GDP Versus A Change In Aggregate Demand (continued)
A change in aggregate demand is represented as a shift in the aggregate demand curve.
Exhibit 3 Page 156 figure b.
12
Changes In Aggregate Demand: Shifts In The AD Curve Aggregate demand changes when the
spending on goods and services changes.
If spending increases at a given price level, aggregate demand increases.
If spending decreases at a given price level, aggregate demand decreases.
13
How Spending Components Affect Aggregate Demand?Let:C = $100I = $100G = $100EX = $50IM= $15$335 is spent on goods and servicesTotal expenditure on goods and services = C + I + G + NX
C increases, I increases, G increases, NX increases = Total expenditure increases
C decreases, I decreases, G decreases, NX decreases = Total expenditure decreases
14
Factors That Can Change C, I, G, NX And Therefore Can Change AD Consumption, 4 factors that can affect consumption, such
as: 1. Wealth wealth increases…..consumption increases….AD increases
wealth decreases…..consumption decreases….AD decreases
15
Factors That Can Change C, I, G, NX And Therefore Can Change AD (continued)
Consumption, 4 factors that can affect consumption, such as: 2. Expectations about future prices and income Expect higher future prices….consumption increases…..AD increases Expect lower future prices….consumption decreases…..AD decreases
Expect higher future income….consumption increases…..AD increases
Expect lower future income….consumption decreases….AD decreases
16
Factors That Can Change C, I, G, NX And Therefore Can Change AD (continued)
Consumption, 4 factors that can affect consumption, such
as: 3. Interest rate Interest rate increases…..consumption decreases….AD decreases
Interest rate decreases….consumption increases….AD increases
17
Factors That Can Change C, I, G, NX And Therefore Can Change AD (continued)
Consumption, 4 factors that can affect consumption, such
as: 4. Income taxes Income taxes increases…..consumption decreases….AD decreases
Income taxes decreases…consumption increases…..AD increases
18
Factors That Can Change C, I, G, NX And Therefore Can Change AD (continued)
Investment
3 factors that can affect investment, such as:
1. Interest rate
Interest rate increases…..investment
decreases….AD decreases
Interest rate decreases…investment
increases…..AD increases
19
Factors That Can Change C, I, G, NX And Therefore Can Change AD (continued)
Investment 3 factors that can affect investment, such as: 2. Expectations about future sales Businesses become optimistic about future sales….Investment increases…..AD increases
Businesses become pessimistic about future sales….Investment decreases…..AD decreases
20
Factors That Can Change C, I, G, NX And Therefore Can Change AD (continued)
Investment 3 factors that can affect investment, such as: 3. Business taxes Business taxes increases….Investment decreases…..AD decreases
Business taxes decreases….Investment increases….AD increases

21
Factors That Can Change C, I, G, NX And Therefore Can Change AD (continued)
Net export 2 factors that can affect investment, such as: 1. Foreign real national income Foreign real national income increases……Exports increases….Net export increases…..AD increases
Foreign real national income decreases……Exports decreases….Net export decreases…..AD decreases
22
Factors That Can Change C, I, G, NX And Therefore Can Change AD (continued)
Net export 2 factors that can affect investment, such as: 2. Exchange rate Dollar depreciates….US exports increases and US imports decreases….US net exports increases….AD increases
Dollar appreciates….US exports decreases and US imports increases….US net exports decreases….AD decreases
23
Short Run Aggregate Supply
Aggregate supply:
the quantity supplied of all goods and services (Real GDP) at different price levels, ceteris paribus.
Exhibit 6 Page 162
24
Changes In Short Run Aggregate Supply: Shifts In The SRAS Curve A change in quantity supplied of real GDP is
brought about by a change in the price level.
The factors that can shift the SRAS curve include:
- wage rates,
- prices of non labor inputs,
- productivity,
- supply shock.
25
Wage Rate
Exhibit 7 Page 164
26
Prices Of Non Labor Inputs
Almost the same as
Exhibit 7 Page 164
Increase the price non labor input….shift the SRAS curve leftward.
Decrease the price non labor input….shift the SRAS curve rightward.
27
Productivity
Increase in productivity….SRAS curve to shift right.
Decrease in productivity….SRAS curve to shift left.

28
Putting AD and SRAS Together: Short Run Equilibrium Exhibit 9 Page 167
29
Thinking In Terms Of Short Run Equilibrium Changes In The Economy Exhibit 10 Page 167
Figure a. An increase AD
Figure b. An increase SRAS
Figure c. A decrease SRAS
30
Long Run Aggregate Supply (LRAS)
LRAS curve:
The LRAS curve is a vertical line at the level of Natural Real GDP.
It represents the output the economy produces when wages and prices have adjusted to their (final) equilibrium levels and neither producers nor workers have any relevant misperceptions.
Exhibit 13. Page 172
31
Natural real GDP:
the real GDP that it produced at the natural unemployment rate. The real GDP that is produced when the economy is in long run equilibrium.
32
Short Run Equilibrium, Long Run Equilibrium, And Disequilibrium Exhibit 14 Page 172
33
Case 1:
Diagrammatically represent the effect on the price level and real GDP in the short run of each following:
a. A decrease in wealth.
b. An increase in wage rate.
c. A decrease in labor productivity.
34
Case 2:
Diagrammatically represent the following and identify the effect on real GDP and the price level in the short run:
a. An increase in SRAS that is greater than
the increase in AD.
b. A decrease in AD that is greater than the
increase in SRAS.
c. An increase in SRAS that is less than the
increase in AD
35
Case 3:
In the following figure, which part is representative of each of the following:
a. A decrease in wage rates.
b. An increase in the price level.
c. A beneficial supply shock.
d. An increase in the price of non labor
inputs.
36
Case 4:
In the following figure, which of the points is representative of each of the following:
a. The lowest real GDP.
b. The highest real GDP.
c. A decrease in SRAS that is greater than an
increase in AD.