Embed Size (px)
Citation preview
1
CBP MANUSCRIPT 19196 – Part A 1
2
Fiber type and metabolic characteristics of lion (Panthera leo), caracal (Caracal caracal) and 3
human skeletal muscle 4
5
Tertius Abraham Kohna, Richard Burroughsb, Marthinus Jacobus Hartmanc, Timothy David 6
Noakesa 7
8 a UCT/MRC Research Unit for Exercise Science and Sports Medicine, Department of Human 9
Biology, PO Box 115, Newlands, 7725, South Africa 10 b Centre of Veterinary Wildlife Studies, Faculty of Veterinary Science, Onderstepoort, Pretoria, 11
0110, South Africa 12 c Department of Companion Animal Clinical Studies, Faculty of Veterinary Science, Onderstepoort, 13
Pretoria, 0110, South Africa 14
15
Running title: Lion and caracal skeletal muscle 16
17
Corresponding author 18
Dr. Tertius A. Kohn 19
UCT/MRC Research Unit for Exercise Science and Sports Medicine, Department of Human 20
Biology, PO Box 115, Newlands, 7725, South Africa 21
Tel: +27 21 650 4577 22
Fax: +27 21 686 7530 23
E-mail: [email protected] 24
25
ABSTRACT 26
Lion (Panthera leo) and caracal (Caracal caracal) skeletal muscle samples from Vastus lateralis, 27
Longissimus dorsi and Gluteus medius were analyzed for fiber type and citrate synthase (CS), 3-28
hydroxyacyl Co A dehydrogenase (3HAD), phopshofructokinase (PFK), creatine kinase (CK), 29
phosphorylase (PHOS) and lactate dehydrogenase (LDH) activities and compared to human 30
runners, the latter also serving as validation of methodology. Both felids had predominantly type 31
IIx fibers (range 50 – 80%), whereas human muscle had more type I and IIa. Oxidative capacity of 32
both felids (CS: 5 – 9 µmol/min/g ww and 3HAD: 1.4 – 2.6 µmol/min/g ww) was lower than 33
humans, whereas the glycolytic capacity was elevated. LDH activity of caracal (346 ± 81) was 34
higher than lion (227 ± 62 µmol/min/g ww), with human being the lowest (55 ± 17). CK and PHOS 35
activities were also higher in caracal and lion compared to human, but PFK was lower in both felid 36
species. The current data and past research are illustrated graphically showing a strong 37
2
relationship between type II fibers and sprinting ability in various species. These data on caracal 38
and lion muscle confirm their sprinting behavior. 39
40
Keywords: Fiber type, myosin heavy chain, enzyme activities, feline 41
42
1. INTRODUCTION 43
The wild felid species are phenomenal athletes. Not only are they renowned for power, jumping 44
and sprinting capabilities, but are masters of stealth and stalking. 45
46
Lions, the world’s second largest and only social felid, are primarily known for their brute strength. 47
The average weight of an adult male can range between 180 to 225 kg (mean 190 kg), whereas 48
the females average approximately 128 kg (Skinner and Chimimba, 2005). Although not the fastest 49
land animal (reaching speeds of up to 70 km/h during short sprints), lions are known as fierce 50
killers and can easily take down animals their own size. The female lions are the primary hunters 51
whereas the males rarely aid in killing prey, but conserve themselves to defend the pride against 52
other male lions. Lion physiology is designed to allow stalking prey for long periods of time, 53
whereafter a short chase ensues. When hunting as a pride, female lions can take down zebra (± 54
300 kg), buffalo (± 600 kg), eland (± 1000 kg) and female elephants (± 4000 kg). This characteristic 55
is largely a result of their ability to work together as a group rather than that of individual muscle 56
strength. However, being physically fit is a requirement to stay part of the pride (Skinner and 57
Chimimba, 2005). 58
59
Caracals (also known as the “Rooikat”), on the other hand, are solitary predators. The males are 60
larger than the females, and their weight can range from 6 to 19 kg. The caracal is renowned for its 61
jumping capability and can jump up to 3 meters high from a stationary-crouched position to catch 62
their prey. Apart from birds, their prey also include small livestock, antelope and rabbits requiring a 63
short chase (Skinner and Chimimba, 2005). They are believed do reach a maximum speed of up to 64
100 km/h, but is yet to be confirmed. 65
66
Both animals are stalkers of prey, moving light-footedly and with stealth before the ultimate attack, 67
hence requiring muscle fibers (type and metabolism) to optimize this type of movement. 68
Additionally, to achieve such acceleration velocities would require fibers that could generate 69
enormous amounts of force in very little time (e.g. cheetah accelerates from 0 to 100 km/h in less 70
than 3 seconds) (Williams et al., 1997). 71
72
Skeletal muscle tissue is a highly complex organ, and apart for being responsible for generating 73
movement, also serves various other functions (e.g. imports glucose to regulate blood glucose 74
concentration, generate heat, produce inflammatory cytokinase, to name but a few). The primary 75
3
components of skeletal muscle responsible for generating motion can be subdivided into the 76
contractile proteins and the metabolism that supplies ATP needed for the former. The contractile 77
properties of an individual muscle fiber depend largely on the myosin heavy chain (MHC) isoform it 78
expresses. Three isoforms, namely MHC I, IIa and IIx are commonly expressed in adult 79
mammalian skeletal muscle, including humans (Acevedo and Rivero, 2006; Hyatt et al., 2010; 80
Kohn et al., 2007c; Quiroz-Rothe and Rivero, 2001). Fibers expressing MHC I have a slow 81
contractile speed, whereas those expressing MHC IIx are much faster (Bottinelli, 2001). A third 82
isoform, MHC IIa gives rise to fibers with a contractile speed leaning towards type IIx. The very fast 83
MHC IIb isoform, commonly found in limb muscle from small animals such as rats and mice, are 84
rarely found in the limbs of larger animals, but may be expressed in specialized muscles, such as 85
the larynx or eye (Kohn and Myburgh, 2007; Toniolo et al., 2008). 86
87
Type I fibers primarily obtain ATP for contraction from aerobic metabolism, with fat and the 88
oxidation of pyruvate via the Kreb’s cycle being the primary sources, making these fibers more 89
resistant to fatigue. They also contain large numbers of mitochondria, have a dense capillary 90
supply, small cross-sectional area (CSA) and a high myoglobin concentration, explaining their 91
distinctive red color. Type IIx fibers primarily rely on anaerobic metabolism, which includes ATP 92
replenishment via glycolysis and use of phosphocreatine stores. These fibers have very few 93
mitochondria, low capillary supply, are large in CSA, pale in color and fatigue easily. Type IIa fibers 94
show characteristics of both fatigue resistance, yet fast contraction velocities (Essén-Gustavsson 95
and Henriksson, 1984; Kohn et al., 2007a; Saltin and Gollnick, 1983). These type I, IIa and IIx 96
fibers are also classified as a combination of contractile speed and metabolism and therefore 97
known as slow twitch oxidative, fast twitch oxidative and fast twitch glycolytic, respectively. 98
99
Although a few studies have described the skeletal muscle characteristics of domestic cats (Hyatt 100
et al., 2010; Toniolo et al., 2008), very little is known about the wild felid species. Presently, only 101
the cheetah (not a true felid) and tiger have been studied. Both have large proportions of type IIx 102
fibers, with the primary source of ATP generation in cheetah muscle from anaerobic metabolism 103
(Hyatt et al., 2010; Williams et al., 1997). 104
105
As no data currently exist on lion and caracal skeletal muscle, the aim of this study was to 106
investigate and describe the skeletal muscle fiber type and metabolic profiles of these two wild 107
felids and to relate these findings to their typical physical activity profiles. 108
109
2. METHODS 110
2.1. Sample collection and storage 111
Two female lions, 1 female caracal and 9 male human endurance runners where used in this 112
study. The lions and human subjects were part of earlier studies for which ethical approval were 113
4
obtained from the Animal Use and Care Committee (University of Pretoria) and the Human 114
Research Ethics Committee (University of Cape Town), respectively. Biopsies from the human 115
runners were donated to this study to additionally aid in validating the techniques and serve as 116
control parameters. They included athletes specializing in various distances from 5 km to half 117
marathon runners. Muscle samples from sprinters were not available. The wild caracal was killed 118
on a game farm by a dog and the material provided to the authors. Human samples were collected 119
by biopsy. The two female lions were classified as healthy, having no visible signs of illness or 120
macroscopic abnormalities on dissection. They were between 2 and 3 years old, weighed ±120 kg 121
each, housed together in a 30 hectare enclosed camp and fed 35 kg fresh meat every 4 to 5 days. 122
The muscle samples were obtained after the animals were euthanized at Onderstepoort 123
Veterinarian Clinic. Samples from all animals were collected within 1 hour of death. 124
125
Skeletal muscle samples from the mid portion of the Vastus lateralis, Longissimus dorsi and 126
Gluteus medius were obtained for lion and caracal, whereas biopsies were obtained from the 127
Vastus lateralis of human subjects. All muscle samples were divided into smaller pieces (30 – 40 128
mg wet weight) and rapidly frozen in liquid nitrogen and stored at -87 °C until analyses. 129
130
2.2. Homogenate sample preparation for enzyme activities and SDS-PAGE 131
Samples were prepared as described by Kohn et al. (2007c), with modifications. A small piece of 132
frozen tissue was weighed and 100 mM potassium phosphate buffer, pH 7.30, added to a ratio of 133
1:19. The tissue was homogenized on ice using a Teflon tip, after which it was sonicated twice for 134
10 seconds at 6 W using a micro sonication probe (Virtis Virsonic Ultrasonic Cell Disrupter 100) 135
and centrifuged at 1700xg for 5 minutes (4 °C). Enzyme assays were performed using the 136
supernatant, whereas a small part of the pellet was diluted with sample buffer (5% β-MEtOH, 2.5% 137
SDS, 10% glycerol, 62.5 mM Tris, pH 6.8 and 0.1% bromophenol blue). These latter samples were 138
heated to 95 °C for 3 minutes and used for determining the MHC isoform content and Western blot 139
analyses. A rat muscle sample obtained from a previous published study were included to serve as 140
control for the MHC IIb isoform on Western blots (Smith et al., 2008). 141
142
2.3. Enzyme assays 143
Enzyme activities that served as markers for the respective metabolic pathways, were chosen as 144
follows: creatine kinase (CK) for rapid ATP replenishment capacity, phosphorylase (PHOS) for 145
glycogen breakdown capacity, phosphofructokinase (PFK) for flux capacity of glycolysis, lactate 146
dehydrogenase (LDH) for lactate production, citrate synthase (CS) for Kreb’s cycle oxidative 147
capacity and 3-hydroxyacetyl Co A dehydrogenase (3HAD) for fat oxidation capacity. Enzyme 148
activities were determined spectrophotometrically at 25 °C using methods described by Srere 149
(1969), Chi et al. (1983) and Essén-Gustavsson and Henriksson (1983), with modifications. All 150
reagents were from Sigma, the final volume in the cuvette 1000 µl and the absorbance wavelength 151
5
340 nm, except for CS, which was 412 nm. For each reaction, the maximum slope was determined 152
and expressed relative to the amount of tissue (µmol/min/g ww). 153
154
3HAD: 50 mM Tris, pH 8.00, 4 mM EDTA, 60 µM NADH, 50 µM acetoacetyl Co A, 10 µl sample. 155
156
CK: 100 mM imidazole, pH 6.70, 2 mM EDTA, 10 mM Mg-acetate, 4 mM glucose, 2 mM ADP, 5 157
mM AMP, 30 mM phosphocreatine, 10 µM diadenosine pentaphosphate, 2 mM NADP+, 20 mM n-158
acetylcysteine, 0.5 U/ml hexokinase (Roche), 0.3 U/ml glucose-6-phosphate dehydrogenase, 3 µl 159
sample. 160
161
CS: 100 mM Tris, pH 8.2, 0.1 mM 5,5’-dithiobis-(2-nitrobenzoate) (DTNB), 0.4 mM oxaloacetate, 162
0.16 mM acetyl Co A, 10 µl sample. 163
164
LDH: 50 mM Tris, pH 8.00 and 4 mM EDTA, 0.12 mM NADH, 2 mM pyruvate, 3 µl sample. 165
166
PFK: 50 mM Tris, pH 8.00, 2 mM EDTA, 5 mM MgCl2, 0.01% BSA, 0.12 mM NADH, 2 mM 167
fructose-6-phosphate, 0.07% β-mercaptoethanol, 2 mM ATP, 0.45 U/ml aldolase, 5.8 U/ml 168
glyceraldehyde-3-phosphate dehydrogenase, 58 U/ml triosephosphate isomerase, 5 µl sample. 169
170
PHOS: 37.6 mM potassium phosphate buffer, pH 7.00, 0.75 mM EDTA, 3.75 mM MgCl2, 1.5 mg/ml 171
glycogen, 0.45 mM NADP+, 37.5 µM glucose-1,6-bisphosphate, 0.75 mM AMP, 3.75 U/ml 172
phosphoglucomutase, 3.75 U/ml glucose-6-phosphate dehydrogenase, 3 µl sample. 173
174
2.4. Myosin heavy chain isoform content and Western blot analyses 175
The relative MHC isoform content was determined using SDS-PAGE as developed by Talmadge 176
and Roy (1993) and adapted by Kohn et al. (2007c). Briefly, a volume of sample was loaded on 7% 177
polyacrylamide gels containing 30% glycerol and run in the cold for 24 hours, first at constant 70 V 178
for 4 hours, followed by 20 hours at 275 V. Gels were subsequently silver stained, scanned and 179
analyzed using the Un-Scan-It (Silk Scientific Corporation) software package. The protocol 180
successfully separated the isoforms into three bands for human and lion skeletal muscle, whereas 181
four bands were separated for that of caracal and rat (rat not shown). 182
183
To validate the character of the isoforms, Western blot analyses were performed on the same 184
samples. After electrophoresis, the proteins were transferred to PVDF membranes overnight at 90 185
mA, washed in Tris buffered saline containing 0.1% Tween 20 (TBS-T) and blocked for 1 hour in 186
5%-non-fat dried milk in TBS-T. Monoclonal primary antibodies specific to the three MHC isoforms 187
were diluted 1:500 in TBS-T and the membranes rotated overnight in the cold. After washing in 188
TBS-T, the membranes were probed with horseradish peroxidase linked secondary antibodies for 189
6
1 hour, washed and chemiluminescence reaction performed (Pierce SuperSignal, Pierce, USA), 190
whereafter the membranes were exposed to X-ray film. These films were scanned as above and 191
analyzed for primary antibody reactivity. 192
193
Monoclonal primary antibodies were obtained from the Developmental Studies Hybridoma Bank, 194
Iowa. These were all previously validated for specific isoform reactivity in different species and 195
corresponded to MHC I (BA-D5), MHC IIa (2F7), MHC IIx (6H1) and MHC IIb (BF-F3, 10F5) 196
(Acevedo and Rivero, 2006; Hyatt et al., 2010; Lucas et al., 2000; Schiaffino et al., 1989). 197
198
2.5. Histochemical and immunohistochemical analyses 199
Serial cross sections (10 µm thick) were cut on a cryostat at -25 °C and stained using the NADH-200
tetrazolium stain to determine oxidative capacity of the muscle (Novikoff et al., 1961). On separate 201
sections, type I and II fibers were visualized using ATPase stability at alkaline pH 10.3 (Brooke and 202
Kaiser, 1970). 203
204
Immunohistochemistry was performed by incubating sections with the specific MHC antibodies as 205
described by Smith et al. (2008), but with modifications. Briefly, sections were fixed in pre-chilled 206
methanol for 10 minutes at -20 °C and hydrated in 0.05% Tween 20 phosphate buffered saline, pH 207
7.40 (PBS-T). Sections were then blocked with 5% bovine serum albumin (BSA) in PBS-T for 1 208
hour at room temperature in a humidified chamber. Primary antibodies diluted 1:25 in PBS-T were 209
added to the sections and incubated overnight at 4 °C in the dark. The following day, the sections 210
were washed twice in PBS-T for 2 minutes and incubated with horseradish peroxidase conjugated 211
secondary rabbit anti-mouse antibody (1:50 diluted in PBS-T) for 1 hour at room temperature. After 212
washing twice in PBS-T for 5 minutes, the immuno-reactive sites were visualized using the 213
peroxidase DAB substrate kit (DAKO Laboratories, Denmark). After adequate washing, the 214
sections were mounted with DPX (BDH laboratories). 215
216
All sections were inspected under a microscope (PrimoStar, Carl Zeiss MicroImaging, Germany) 217
and photographed using a CMOS camera. Fibers were classified as type I, IIa and IIx according to 218
the intensity profile of the ATPase, NADH and immunohistochemical stained sections. Hybrid fibers 219
were disregarded as they represented less than 1% of the total number of fibers analyzed. After 220
fiber identification, CSA (µm2) of each were determined on the pH 10.3 slides using pre-calibrated 221
software (AxioVision ver 4.81, Carl Zeiss MicroImaging, Germany). 222
223
2.6. Statistical analyses 224
Where applicable, values are expressed as mean ± standard deviation. Due to a small sample size 225
of the feline species, values of muscle samples were pooled to represent an overall view of the 226
7
animal. Relationships were tested using the Pearson’s correlation coefficient. For the latter, a one-227
way ANOVA with a Tukey post hoc test was used to indicate statistical significance (P < 0.05). 228
229
3. RESULTS 230
Due to a small sample size for the two animal species, their data from individual muscle groups 231
(Table 2 and Fig. 1) were averaged in order to obtain an overall representation of the animals, as 232
well as to statistically compare the two felids with that from human muscle. 233
234
3.1. Enzyme activities 235
As a whole, CS and 3HAD activities of lion and caracal muscle were approximately 3.5x and 2.5x 236
lower, respectively, than activities measured in human athletes (Table 1). Surprisingly, PFK 237
activities of both felid species were lower than that of human muscle, and different from each other. 238
On the other hand, LDH activity of lion and caracal was 4x and 6x higher, respectively, than 239
activities measured in human athletes. The pathways representing high-energy phosphates (CK) 240
and glycogen breakdown (PHOS) were approximately 2x higher in the animals compared to 241
humans. 242
243
For the felid species only, CS and 3HAD activities of the individual muscle groups were similar 244
(Figs. 1A and 1B). Both PFK and LDH seemed to be unaffected by the muscle groups, but a clear 245
species interaction existed, i.e. caracal had higher enzyme activities in all three muscle groups 246
analyzed compared to the lions (Figs. 1C and 1D). This interaction was not evident for CK and 247
PHOS activities measured in the three muscle groups of the two species (Figs. 1E and 1F). 248
249
3.2. MHC isoform identification 250
Both immunohistochemistry and Western blot analyses were used to identify the MHC isoforms in 251
lion and caracal. Gel electrophoresis separated the MHC isoforms from caracal and lion muscle 252
into four and three bands, respectively (Fig. 3A). The antibody 2F7 only recognized one band in all 253
the species and corresponded to the migratory level of the human MHC IIa band (Fig. 3B). The 254
MHC IIx antibody (6H1) only recognized one band for each of the species (Fig. 3C). However, 255
these bands migrated differently from one another, suggesting a difference in molecular weight. 256
The lion had the smallest MHC IIx isoform, followed by caracal and human. The position of the IIx 257
isoforms were also confirmed when double labeling was performed with the MHC I (BA-D5) 258
antibody (Fig. 3D). For all three species, only one MHC I band was identified and was similar in 259
size at the lower migratory level. 260
261
An extra band for caracal was identified between its MHC IIx and MHC I isoforms on the silver 262
stained gel (arrow in Fig. 3A). The BF-F3 antibody, known to react with the rat MHC IIb isoform, 263
8
failed to react with this unknown band (Fig. 3E). Similarly, 10F5 also failed to recognize this 264
unknown band (data not shown). 265
266
Immunohistochemical staining using the primary antibodies from Western blot, confirmed their 267
specificity to the three isoforms from each species. BA-D5 and 2F7 only reacted with type I and IIa 268
fibers, respectively, whereas the MHC IIx (6H1) antibody reacted with MHC IIx fibers, but also 269
showed slight cross-reactivity with type I fibers, but not with type IIa fibers (Figs. 2B, 2C, 2D and 270
2E). None of the fibers from either species reacted with the MHC IIb (BF-F3) antibody (data not 271
shown). 272
273
3.3. MHC isoform content 274
Overall, the predominant isoform expressed in the two felid muscle was MHC IIx, whereas MHC I 275
and IIa dominated the human Vastus lateralis muscle (Tables 1 and 2). A combination of all three 276
muscles revealed that the lion expressed less MHC IIx, but more MHC IIa than the caracal. This is 277
also evident when looking at the muscles individually. 278
279
3.4. Muscle morphology 280
Both lion and caracal muscle showed poor staining intensity with the NADH-tetrazolium method 281
when compared with their human counterparts (Fig. 2A). Those fibers expressing MHC I and IIa 282
were darker and darkest, respectively, in intensity compared to the IIx fibers. Alkaline incubation at 283
pH 10.3 and immunohistochemistry using the monoclonal MHC antibodies showed that caracal 284
and lion both had more type IIx fibers in their Vastus lateralis than that from human (Figs. 2B – E), 285
confirming the results obtained from SDS-PAGE. 286
287
The CSA of the Vastus lateralis muscles are presented in Table 1. The predominant fiber types 288
from each species had the largest CSA. Lion and caracal type IIx fibers were 1.6x and 2.1x larger, 289
respectively, than the remainder of their fiber types. The human type I and IIa fibers were larger 290
than their IIx fibers. 291
292
3.5. Correlations 293
No relationships were found between fiber type and the enzyme activities in any of the wild animal 294
muscles sampled in this study. For example, Pearson’s correlation coefficients for MHC I vs. CS 295
and 3HAD were r = 0.54 and r = 0.34, respectfully, whereas MHC IIx vs. LDH and CK were r = 296
0.53 and -0.200, respectively, all not significant. Once the data from the humans were included in 297
the analyses, all correlations became significant with most P values less than 0.0001. However, 298
the relationships were deemed insignificant, as all these relationships were the result of species 299
clustering. 300
301

9
4. DISCUSSION 302
The main findings of this study were that lion and caracal muscle as a whole, had high CK, PHOS 303
and LDH activities and low CS and 3HAD activities, with a predominant expression of the MHC IIx 304
isoform in all the felid muscles analyzed when compared to humans, indicating a species that have 305
great sprinting capability. In contrast, the rate limiting enzyme for glycolysis were significantly lower 306
than that from human muscle. 307
308
4.1. MHC isoform characteristics 309
The antibodies used in this investigation were able to recognize the isoforms on histological 310
sections. Their specificity was validated with the pH 10.30 and NADH stains. Only the 6H1 311
antibody, specific to the MHC IIx isoform, showed slight cross-reactivity with fibers containing only 312
MHC I. 313
314
Using SDS-PAGE, three isoforms were separated for all three species. Western blotting confirmed 315
their nature as MHC I, MHC IIa and MHC IIx (Fig. 3). Both MHC I and IIa of the felids migrated 316
similarly on the gel to that of human muscle. However, the MHC IIx differed significantly, even 317
between the two felids. According to the migratory size, the lion expressed the smallest MHC IIx 318
isoform, followed by that of caracal and human (Fig. 3A). A different amino acid sequence, or a 319
lack thereof, may contribute to this size difference. It is unclear what the effect of this size 320
difference might have on the overall contractility of these fibers. Both Toniolo et al. (2007) and 321
Marx et al. (2006) showed that with an increase in body mass, the unloaded shortening velocity 322
(Vo) of each fiber type decreases. It is interesting though that the largest difference in Vo occurred 323
within the type I fibers of the different species, despite their MHC I showing similar migratory 324
profiles. Conversely, the type IIx fibers showed the largest variation in migratory profiles, but the 325
difference in Vo was less than that observed for type I fibers. However, Toniolo et al. (2007) 326
warned that body mass may only partially predict Vo. For example, between man, pig and cow (in 327
order of increasing mass), the Vo of type I and IIa fibers were similar for man and cow. On the 328
other hand, Vo of type I and IIa fibers of pig were lower and higher, respectively, compared to 329
human and cow muscle. This discrepancy points to a more complex system in what determines the 330
contractile properties of the fibers. It would therefore be difficult to predict whether differences in 331
contractile properties of the caracal and lion exist based solely on body mass, and would require 332
further investigation. 333
334
A fourth band was identified for caracal and its position was slightly lower than the identified MHC 335
IIx band. It was initially suspected to be the MHC IIb isoform, but the antibodies specific to MHC IIb 336
(BF-F3 and 10F5) failed to recognize this band. The intensities of the MHC I, IIa and the unknown 337
band from the caracal (Fig. 3A) did not differ substantially. It is therefore speculated that if this 338
unknown band could react to the antibody, then enough protein was loaded. Recently it was shown 339
10
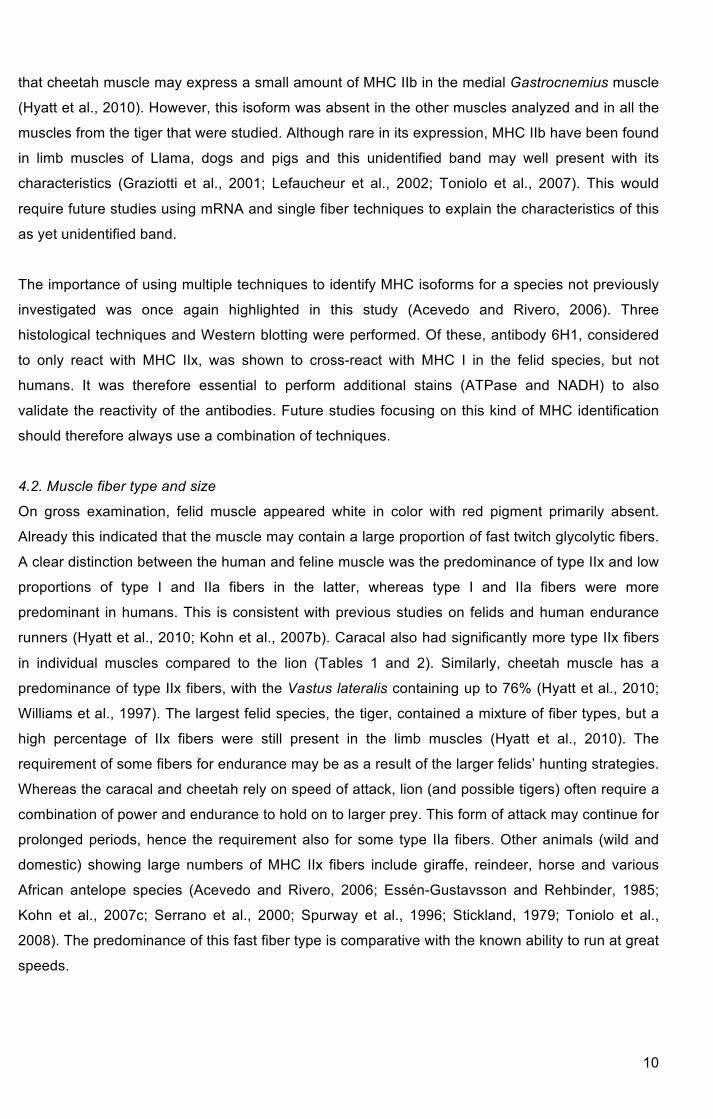
that cheetah muscle may express a small amount of MHC IIb in the medial Gastrocnemius muscle 340
(Hyatt et al., 2010). However, this isoform was absent in the other muscles analyzed and in all the 341
muscles from the tiger that were studied. Although rare in its expression, MHC IIb have been found 342
in limb muscles of Llama, dogs and pigs and this unidentified band may well present with its 343
characteristics (Graziotti et al., 2001; Lefaucheur et al., 2002; Toniolo et al., 2007). This would 344
require future studies using mRNA and single fiber techniques to explain the characteristics of this 345
as yet unidentified band. 346
347
The importance of using multiple techniques to identify MHC isoforms for a species not previously 348
investigated was once again highlighted in this study (Acevedo and Rivero, 2006). Three 349
histological techniques and Western blotting were performed. Of these, antibody 6H1, considered 350
to only react with MHC IIx, was shown to cross-react with MHC I in the felid species, but not 351
humans. It was therefore essential to perform additional stains (ATPase and NADH) to also 352
validate the reactivity of the antibodies. Future studies focusing on this kind of MHC identification 353
should therefore always use a combination of techniques. 354
355
4.2. Muscle fiber type and size 356
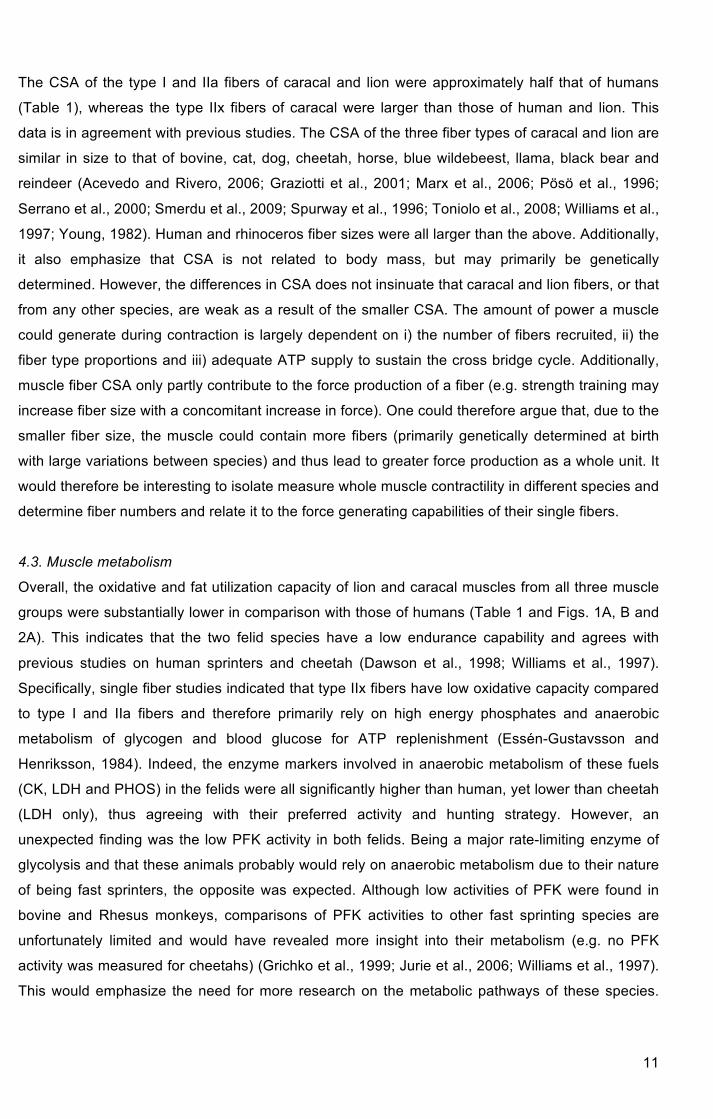
On gross examination, felid muscle appeared white in color with red pigment primarily absent. 357
Already this indicated that the muscle may contain a large proportion of fast twitch glycolytic fibers. 358
A clear distinction between the human and feline muscle was the predominance of type IIx and low 359
proportions of type I and IIa fibers in the latter, whereas type I and IIa fibers were more 360
predominant in humans. This is consistent with previous studies on felids and human endurance 361
runners (Hyatt et al., 2010; Kohn et al., 2007b). Caracal also had significantly more type IIx fibers 362
in individual muscles compared to the lion (Tables 1 and 2). Similarly, cheetah muscle has a 363
predominance of type IIx fibers, with the Vastus lateralis containing up to 76% (Hyatt et al., 2010; 364
Williams et al., 1997). The largest felid species, the tiger, contained a mixture of fiber types, but a 365
high percentage of IIx fibers were still present in the limb muscles (Hyatt et al., 2010). The 366
requirement of some fibers for endurance may be as a result of the larger felids’ hunting strategies. 367
Whereas the caracal and cheetah rely on speed of attack, lion (and possible tigers) often require a 368
combination of power and endurance to hold on to larger prey. This form of attack may continue for 369
prolonged periods, hence the requirement also for some type IIa fibers. Other animals (wild and 370
domestic) showing large numbers of MHC IIx fibers include giraffe, reindeer, horse and various 371
African antelope species (Acevedo and Rivero, 2006; Essén-Gustavsson and Rehbinder, 1985; 372
Kohn et al., 2007c; Serrano et al., 2000; Spurway et al., 1996; Stickland, 1979; Toniolo et al., 373
2008). The predominance of this fast fiber type is comparative with the known ability to run at great 374
speeds. 375
376
11
The CSA of the type I and IIa fibers of caracal and lion were approximately half that of humans 377
(Table 1), whereas the type IIx fibers of caracal were larger than those of human and lion. This 378
data is in agreement with previous studies. The CSA of the three fiber types of caracal and lion are 379
similar in size to that of bovine, cat, dog, cheetah, horse, blue wildebeest, llama, black bear and 380
reindeer (Acevedo and Rivero, 2006; Graziotti et al., 2001; Marx et al., 2006; Pösö et al., 1996; 381
Serrano et al., 2000; Smerdu et al., 2009; Spurway et al., 1996; Toniolo et al., 2008; Williams et al., 382
1997; Young, 1982). Human and rhinoceros fiber sizes were all larger than the above. Additionally, 383
it also emphasize that CSA is not related to body mass, but may primarily be genetically 384
determined. However, the differences in CSA does not insinuate that caracal and lion fibers, or that 385
from any other species, are weak as a result of the smaller CSA. The amount of power a muscle 386
could generate during contraction is largely dependent on i) the number of fibers recruited, ii) the 387
fiber type proportions and iii) adequate ATP supply to sustain the cross bridge cycle. Additionally, 388
muscle fiber CSA only partly contribute to the force production of a fiber (e.g. strength training may 389
increase fiber size with a concomitant increase in force). One could therefore argue that, due to the 390
smaller fiber size, the muscle could contain more fibers (primarily genetically determined at birth 391
with large variations between species) and thus lead to greater force production as a whole unit. It 392
would therefore be interesting to isolate measure whole muscle contractility in different species and 393
determine fiber numbers and relate it to the force generating capabilities of their single fibers. 394
395
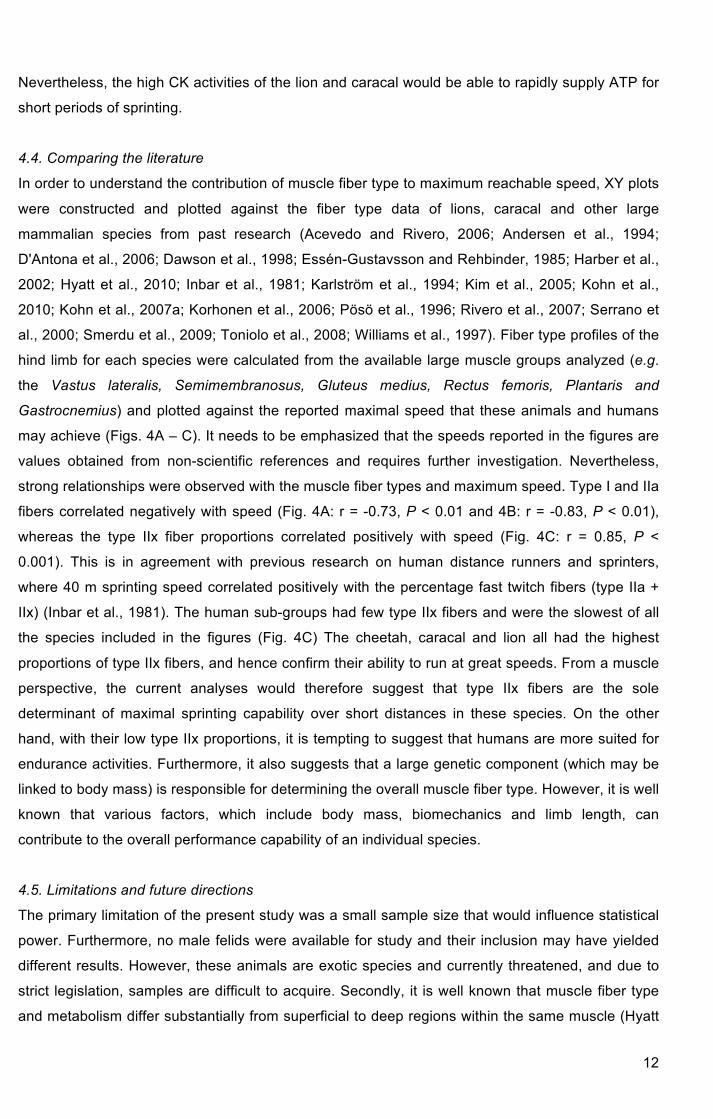
4.3. Muscle metabolism 396
Overall, the oxidative and fat utilization capacity of lion and caracal muscles from all three muscle 397
groups were substantially lower in comparison with those of humans (Table 1 and Figs. 1A, B and 398
2A). This indicates that the two felid species have a low endurance capability and agrees with 399
previous studies on human sprinters and cheetah (Dawson et al., 1998; Williams et al., 1997). 400
Specifically, single fiber studies indicated that type IIx fibers have low oxidative capacity compared 401
to type I and IIa fibers and therefore primarily rely on high energy phosphates and anaerobic 402
metabolism of glycogen and blood glucose for ATP replenishment (Essén-Gustavsson and 403
Henriksson, 1984). Indeed, the enzyme markers involved in anaerobic metabolism of these fuels 404
(CK, LDH and PHOS) in the felids were all significantly higher than human, yet lower than cheetah 405
(LDH only), thus agreeing with their preferred activity and hunting strategy. However, an 406
unexpected finding was the low PFK activity in both felids. Being a major rate-limiting enzyme of 407
glycolysis and that these animals probably would rely on anaerobic metabolism due to their nature 408
of being fast sprinters, the opposite was expected. Although low activities of PFK were found in 409
bovine and Rhesus monkeys, comparisons of PFK activities to other fast sprinting species are 410
unfortunately limited and would have revealed more insight into their metabolism (e.g. no PFK 411
activity was measured for cheetahs) (Grichko et al., 1999; Jurie et al., 2006; Williams et al., 1997). 412
This would emphasize the need for more research on the metabolic pathways of these species. 413
12
Nevertheless, the high CK activities of the lion and caracal would be able to rapidly supply ATP for 414
short periods of sprinting. 415
416
4.4. Comparing the literature 417
In order to understand the contribution of muscle fiber type to maximum reachable speed, XY plots 418
were constructed and plotted against the fiber type data of lions, caracal and other large 419
mammalian species from past research (Acevedo and Rivero, 2006; Andersen et al., 1994; 420
D'Antona et al., 2006; Dawson et al., 1998; Essén-Gustavsson and Rehbinder, 1985; Harber et al., 421
2002; Hyatt et al., 2010; Inbar et al., 1981; Karlström et al., 1994; Kim et al., 2005; Kohn et al., 422
2010; Kohn et al., 2007a; Korhonen et al., 2006; Pösö et al., 1996; Rivero et al., 2007; Serrano et 423
al., 2000; Smerdu et al., 2009; Toniolo et al., 2008; Williams et al., 1997). Fiber type profiles of the 424
hind limb for each species were calculated from the available large muscle groups analyzed (e.g. 425
the Vastus lateralis, Semimembranosus, Gluteus medius, Rectus femoris, Plantaris and 426
Gastrocnemius) and plotted against the reported maximal speed that these animals and humans 427
may achieve (Figs. 4A – C). It needs to be emphasized that the speeds reported in the figures are 428
values obtained from non-scientific references and requires further investigation. Nevertheless, 429
strong relationships were observed with the muscle fiber types and maximum speed. Type I and IIa 430
fibers correlated negatively with speed (Fig. 4A: r = -0.73, P < 0.01 and 4B: r = -0.83, P < 0.01), 431
whereas the type IIx fiber proportions correlated positively with speed (Fig. 4C: r = 0.85, P < 432
0.001). This is in agreement with previous research on human distance runners and sprinters, 433
where 40 m sprinting speed correlated positively with the percentage fast twitch fibers (type IIa + 434
IIx) (Inbar et al., 1981). The human sub-groups had few type IIx fibers and were the slowest of all 435
the species included in the figures (Fig. 4C) The cheetah, caracal and lion all had the highest 436
proportions of type IIx fibers, and hence confirm their ability to run at great speeds. From a muscle 437
perspective, the current analyses would therefore suggest that type IIx fibers are the sole 438
determinant of maximal sprinting capability over short distances in these species. On the other 439
hand, with their low type IIx proportions, it is tempting to suggest that humans are more suited for 440
endurance activities. Furthermore, it also suggests that a large genetic component (which may be 441
linked to body mass) is responsible for determining the overall muscle fiber type. However, it is well 442
known that various factors, which include body mass, biomechanics and limb length, can 443
contribute to the overall performance capability of an individual species. 444
445
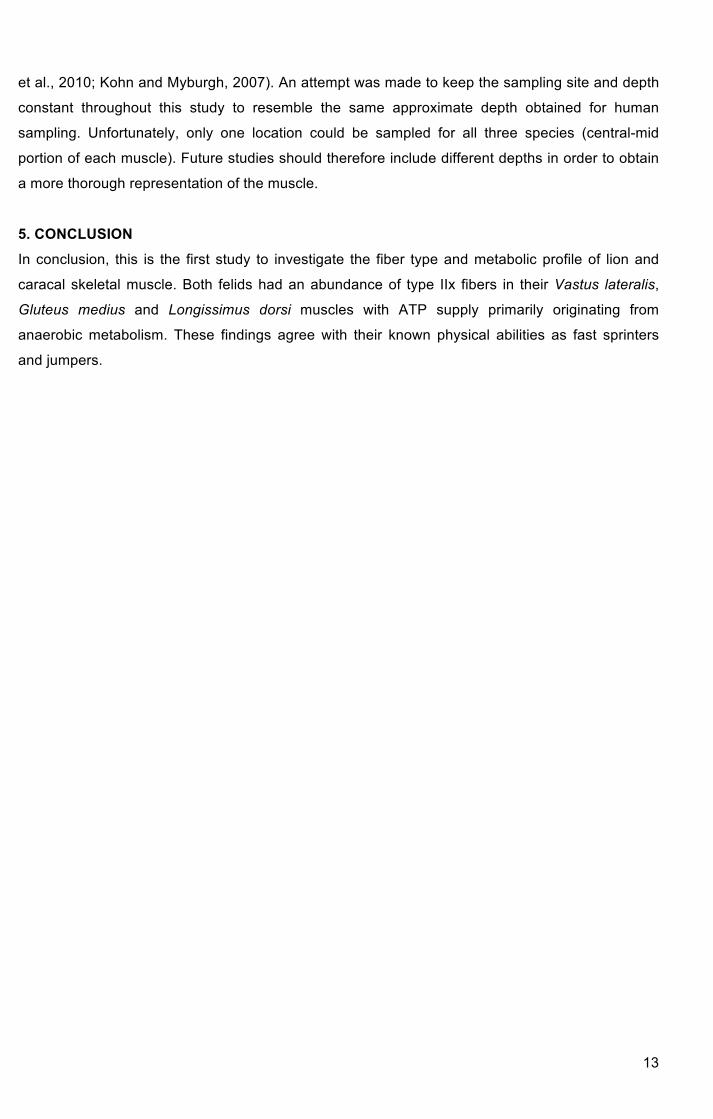
4.5. Limitations and future directions 446
The primary limitation of the present study was a small sample size that would influence statistical 447
power. Furthermore, no male felids were available for study and their inclusion may have yielded 448
different results. However, these animals are exotic species and currently threatened, and due to 449
strict legislation, samples are difficult to acquire. Secondly, it is well known that muscle fiber type 450
and metabolism differ substantially from superficial to deep regions within the same muscle (Hyatt 451
13
et al., 2010; Kohn and Myburgh, 2007). An attempt was made to keep the sampling site and depth 452
constant throughout this study to resemble the same approximate depth obtained for human 453
sampling. Unfortunately, only one location could be sampled for all three species (central-mid 454
portion of each muscle). Future studies should therefore include different depths in order to obtain 455
a more thorough representation of the muscle. 456
457
5. CONCLUSION 458
In conclusion, this is the first study to investigate the fiber type and metabolic profile of lion and 459
caracal skeletal muscle. Both felids had an abundance of type IIx fibers in their Vastus lateralis, 460
Gluteus medius and Longissimus dorsi muscles with ATP supply primarily originating from 461
anaerobic metabolism. These findings agree with their known physical abilities as fast sprinters 462
and jumpers. 463
464
465
14
6. ACKNOWLEDGEMENTS 466
This study was funded by the UCT/MRC Research Unit for Exercise Science and Sports Medicine 467
and the National Research Foundation of South Africa. T.A. Kohn is recipient of the Tim and 468
Marilyn Noakes Sports Science Postdoctoral Fellowship. All primary antibodies used in this study 469
were obtained from the Developmental Studies Hybridoma Bank developed under the auspices of 470
the NICHD and maintained by The University of Iowa, Department of Biological Sciences, Iowa 471
City, IA 52242. 472
473
Bea, Johan “Bul” and Neil Schoeman are thanked for their donation of the caracal muscle samples 474
and their hospitality. A sincere thank you is extended to Mrs. Morea Petersen for her assistance 475
with histological preparation. 476
477
7. REFERENCES 478
Acevedo, L. M., Rivero, J. L., 2006. New insights into skeletal muscle fibre types in the dog with 479
particular focus towards hybrid myosin phenotypes. Cell Tissue Res. 323, 283-303. 480
Andersen, J. L., Klitgaard, H., Saltin, B., 1994. Myosin heavy chain isoforms in single fibres from 481
m. vastus lateralis of sprinters: influence of training. Acta Physiol. Scand. 151, 135-142. 482
Bottinelli, R., 2001. Functional heterogeneity of mammalian single muscle fibres: do myosin 483
isoforms tell the whole story? Pflügers Arch. 443, 6-17. 484
Brooke, M. H., Kaiser, K. K., 1970. Three myosin ATPase systems: the nature of their pH lability 485
and sulfhydryl dependence. J. Histochem. Cytochem. 18, 670-672. 486
Chi, M. M., Hintz, C. S., Coyle, E. F., Martin, W. H., III, Ivy, J. L., Nemeth, P. M., Holloszy, J. O., 487
Lowry, O. H., 1983. Effects of detraining on enzymes of energy metabolism in individual human 488
muscle fibers. Am. J. Physiol. 244, C276-C287. 489
D'Antona, G., Lanfranconi, F., Pellegrino, M. A., Brocca, L., Adami, R., Rossi, R., Moro, G., Miotti, 490
D., Canepari, M., Bottinelli, R., 2006. Skeletal muscle hypertrophy and structure and function of 491
skeletal muscle fibres in male body builders. J. Pysiol. 570, 611-627. 492
Dawson, B., Fitzsimons, M., Green, S., Goodman, C., Carey, M., Cole, K., 1998. Changes in 493
performance, muscle metabolites, enzymes and fibre types after short sprint training. Eur. J. Appl. 494
Physiol. 78, 163-169. 495
Essén-Gustavsson, B., Henriksson, J., 1983. Enzyme profiles in type I, IIA, and IIB fiber 496
populations of human skeletal muscle, in: H. G. Knuttgen, J. A. Vogel, J. Poortmans (Eds.), 497
Biochemistry of Exercise IV. Human Kinetics Publishers, Champaign, Illinois, 447-452. 498
15
Essén-Gustavsson, B., Henriksson, J., 1984. Enzyme levels in pools of microdissected human 499
muscle fibres of identified type. Adaptive response to exercise. Acta Physiol. Scand. 120, 505-515. 500
Essén-Gustavsson, B., Rehbinder, C., 1985. Skeletal muscle characteristics of reindeer (Rangifer 501
tarandus L.). Comp. Biochem. Physiol. 82, 675-679. 502
Graziotti, G. H., Rios, C. M., Rivero, J. L., 2001. Evidence for three fast myosin heavy chain 503
isoforms in type II skeletal muscle fibers in the adult Llama (Lama glama). J. Histochem. 504
Cytochem. 49, 1033-1044. 505
Grichko, V. P., Gettelman, G. J., Widrick, J. J., Fitts, R. H., 1999. Substrate and enzyme profile of 506
fast and slow skeletal muscle fibers in rhesus monkeys. J. Appl. Physiol. 86, 335-340. 507
Harber, M. P., Gallagher, P. M., Trautmann, J., Trappe, S. W., 2002. Myosin heavy chain 508
composition of single muscle fibers in male distance runners. Int.J.Sports Med. 23, 484-488. 509
Hyatt, J. P., Roy, R. R., Rugg, S., Talmadge, R. J., 2010. Myosin heavy chain composition of tiger 510
(Panthera tigris) and cheetah (Acinonyx jubatus) hindlimb muscles. J. Exp. Zool. 313, 45-57. 511
Inbar, O., Kaiser, P., Tesch, P., 1981. Relationships between leg muscle fiber type distribution and 512
leg exercise performance. Int.J.Sports Med. 2, 154-159. 513
Jurie, C., Ortigues-Marty, I., Picard, B., Micol, D., Hocquette, J. F., 2006. The separate effects of 514
the nature of diet and grazing mobility on metabolic potential of muscles from Charolais steers. 515
Livest. Sci. 104, 182-192. 516
Karlström, K., Essén-Gustavsson, B., Lindholm, A., 1994. Fibre type distribution, capillarization and 517
enzymatic profile of locomotor and nonlocomotor muscles of horses and steers. Acta Anat. (Basel) 518
151, 97-106. 519
Kim, J. S., Hinchcliff, K. W., Yamaguchi, M., Beard, L. A., Markert, C. D., Devor, S. T., 2005. Age-520
related changes in metabolic properties of equine skeletal muscle associated with muscle 521
plasticity. Veterinary Journal 169, 397-403. 522
Kohn, T. A., Essen-Gustavsson, B., Myburgh, K. H., 2010. Specific muscle adaptations in type II 523
fibers after high-intensity interval training of well-trained runners. Scand J Med Sci Sports. 524
Kohn, T. A., Essén-Gustavsson, B., Myburgh, K. H., 2007a. Do skeletal muscle phenotypic 525
characteristics of Xhosa and Caucasian endurance runners differ when matched for training and 526
racing distances? J. Appl. Physiol. 103, 932-940. 527
Kohn, T. A., Essén-Gustavsson, B., Myburgh, K. H., 2007b. Exercise pattern influences skeletal 528
muscle hybrid fibers of runners and nonrunners. Med. Sci. Sport Exer. 39, 1977-1984. 529

16
Kohn, T. A., Hoffman, L. C., Myburgh, K. H., 2007c. Identification of myosin heavy chain isoforms 530
in skeletal muscle of four Southern African wild ruminants. Comp. Biochem. Physiol. 148, 399-407. 531
Kohn, T. A., Myburgh, K. H., 2007. Regional specialization of rat quadriceps myosin heavy chain 532
isoforms occurring in distal to proximal parts of middle and deep regions is not mirrored by citrate 533
synthase activity. J. Anat. 210, 8-18. 534
Korhonen, M. T., Cristea, A., Alen, M., Hakkinen, K., Sipila, S., Mero, A., Viitasalo, J. T., Larsson, 535
L., Suominen, H., 2006. Aging, muscle fiber type, and contractile function in sprint-trained athletes. 536
J.Appl.Physiol 101, 906-917. 537
Lefaucheur, L., Ecolan, P., Plantard, L., Gueguen, N., 2002. New insights into muscle fiber types in 538
the pig. J. Histochem. Cytochem. 50, 719-730. 539
Lucas, C. A., Kang, L. H., Hoh, J. F., 2000. Monospecific antibodies against the three mammalian 540
fast limb myosin heavy chains. Biochem. Biophys. Res. Commun. 272, 303-308. 541
Marx, J. O., Olsson, M. C., Larsson, L., 2006. Scaling of skeletal muscle shortening velocity in 542
mammals representing a 100,000-fold difference in body size. Pflügers Arch. 452, 222-230. 543
Novikoff, A. B., Shin, W. Y., Drucker, J., 1961. Mitochondrial localization of oxidative enzymes: 544
staining results with two tetrazolium salts. J. Biophys. Biochem. Cytol. 9, 47-61. 545
Pösö, A. R., Nieminen, M., Raulio, J., Räsänen, L. A., Soveri, T., 1996. Skeletal muscle 546
characteristics of racing reindeer (Rangifer tarandus). Comp Biochem.Physiol. 114, 277-281. 547
Quiroz-Rothe, E., Rivero, J. L., 2001. Co-ordinated expression of contractile and non-contractile 548
features of control equine muscle fibre types characterised by immunostaining of myosin heavy 549
chains. Histochem. Cell Biol. 116, 299-312. 550
Rivero, J. L., Ruz, A., Marti-Korff, S., Estepa, J. C., Aguilera-Tejero, E., Werkman, J., Sobotta, M., 551
Lindner, A., 2007. Effects of intensity and duration of exercise on muscular responses to training of 552
thoroughbred racehorses. J. Appl. Physiol. 102, 1871-1882. 553
Saltin, B., Gollnick, P. D., 1983. Skeletal muscle adaptability: significance for metabolism and 554
performance, in: L. D. Peachey, R. H. Adrian, S. R. Geiger (Eds.), Handbook of Physiology. 555
American Physiology Society, Bethesda, Maryland, 555-631. 556
Schiaffino, S., Gorza, L., Sartore, S., Saggin, L., Ausoni, S., Vianello, M., Gundersen, K., Lomo, T., 557
1989. Three myosin heavy chain isoforms in type 2 skeletal muscle fibres. J Muscle Res Cell Motil 558
10, 197-205. 559
17
Serrano, A. L., Quiroz-Rothe, E., Rivero, J. L., 2000. Early and long-term changes of equine 560
skeletal muscle in response to endurance training and detraining. Pflügers Arch. 441, 263-274. 561
Skinner, J. D., Chimimba, C. T., 2005. The mammals of the southern African subregion. 562
Cambridge University Press, Cape Town. 563
Smerdu, V., Cehovin, T., Strbenc, M., Fazarinc, G., 2009. Enzyme- and immunohistochemical 564
aspects of skeletal muscle fibers in brown bear (Ursus arctos). J Morphol 270, 154-161. 565
Smith, J. A., Kohn, T. A., Chetty, A. K., Ojuka, E. O., 2008. CaMK activation during exercise is 566
required for histone hyperacetylation and MEF2A binding at the MEF2 site on the Glut4 gene. Am. 567
J. Physiol. 295, E698-E704. 568
Spurway, N. C., Murray, M. G., Gilmour, W. H., Montgomery, I., 1996. Quantitative skeletal muscle 569
histochemistry of four east African ruminants. J. Anat. 188, 455-472. 570
Srere, P. A., 1969. Citrate synthase, in: J. M. Lowenstein (Ed.), Methods in Enzymology. Academic 571
Press, New York and London, 3-11. 572
Stickland, N. C., 1979. Comparative aspects of muscle fibre size and succinic dehydrogenase 573
distribution in the longissimus dorsi muscle of several species of East African mammals. Acta Anat. 574
(Basel) 105, 381-385. 575
Talmadge, R. J., Roy, R. R., 1993. Electrophoretic separation of rat skeletal muscle myosin heavy-576
chain isoforms. J. Appl. Physiol. 75, 2337-2340. 577
Toniolo, L., Cancellara, P., Maccatrozzo, L., Patruno, M., Mascarello, F., Reggiani, C., 2008. 578
Masticatory myosin unveiled: first determination of contractile parameters of muscle fibers from 579
carnivore jaw muscles. Am. J. Physiol. 295, C1535-C1542. 580
Toniolo, L., Maccatrozzo, L., Patruno, M., Pavan, E., Caliaro, F., Rossi, R., Rinaldi, C., Canepari, 581
M., Reggiani, C., Mascarello, F., 2007. Fiber types in canine muscles: myosin isoform expression 582
and functional characterization. Am J Physiol Cell Physiol 292, C1915-1926. 583
Williams, T. M., Dobson, G. P., Mathieu-Costello, O., Morsbach, D., Worley, M. B., Phillips, J. A., 584
1997. Skeletal-muscle histology and biochemistry of an elite sprinter, the African cheetah. J. 585
Comp. Physiol. 167, 527-535. 586
Young, O. A., 1982. Further studies on single fibres of bovine muscles. Biochemical Journal 203, 587
179-184. 588
589
590
18
8. TABLES
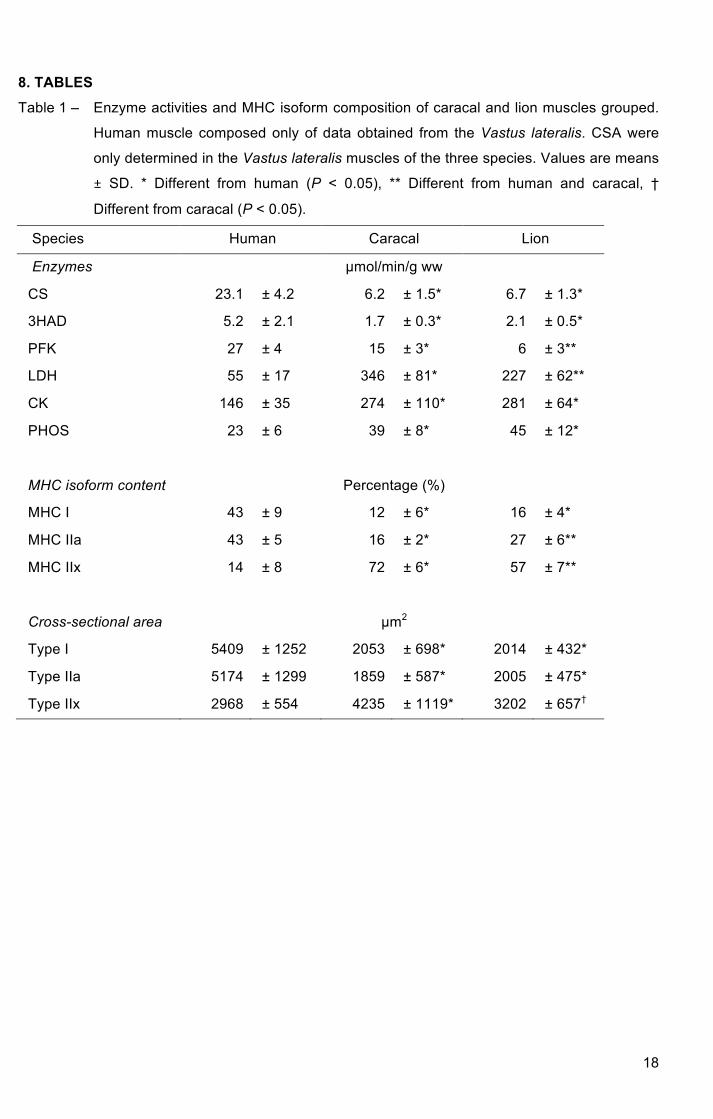
Table 1 – Enzyme activities and MHC isoform composition of caracal and lion muscles grouped.
Human muscle composed only of data obtained from the Vastus lateralis. CSA were
only determined in the Vastus lateralis muscles of the three species. Values are means
± SD. * Different from human (P < 0.05), ** Different from human and caracal, †
Different from caracal (P < 0.05).
Species Human Caracal Lion
Enzymes µmol/min/g ww
CS 23.1 ± 4.2 6.2 ± 1.5* 6.7 ± 1.3*
3HAD 5.2 ± 2.1 1.7 ± 0.3* 2.1 ± 0.5*
PFK 27 ± 4 15 ± 3* 6 ± 3**
LDH 55 ± 17 346 ± 81* 227 ± 62**
CK 146 ± 35 274 ± 110* 281 ± 64*
PHOS 23 ± 6 39 ± 8* 45 ± 12*
MHC isoform content Percentage (%)
MHC I 43 ± 9 12 ± 6* 16 ± 4*
MHC IIa 43 ± 5 16 ± 2* 27 ± 6**
MHC IIx 14 ± 8 72 ± 6* 57 ± 7**
Cross-sectional area µm2
Type I 5409 ± 1252 2053 ± 698* 2014 ± 432*
Type IIa 5174 ± 1299 1859 ± 587* 2005 ± 475*
Type IIx 2968 ± 554 4235 ± 1119* 3202 ± 657†

19
Table 2 – MHC isoform composition (%) of the three caracal and lion skeletal muscle groups.
Human values are expressed as mean ± SD.
Species MHC I MHC IIa MHC IIx
Vastus lateralis
Caracal 18 15 68
Lion 1 22 28 50
Lion 2 12 28 60
Human 43 ± 9 43 ± 5 14 ± 8
Longissimus dorsi
Caracal 6 15 79
Lion 1 17 33 50
Lion 2 11 32 58
Gluteus medius
Caracal 12 18 71
Lion 1 16 24 60
Lion 2 16 17 67
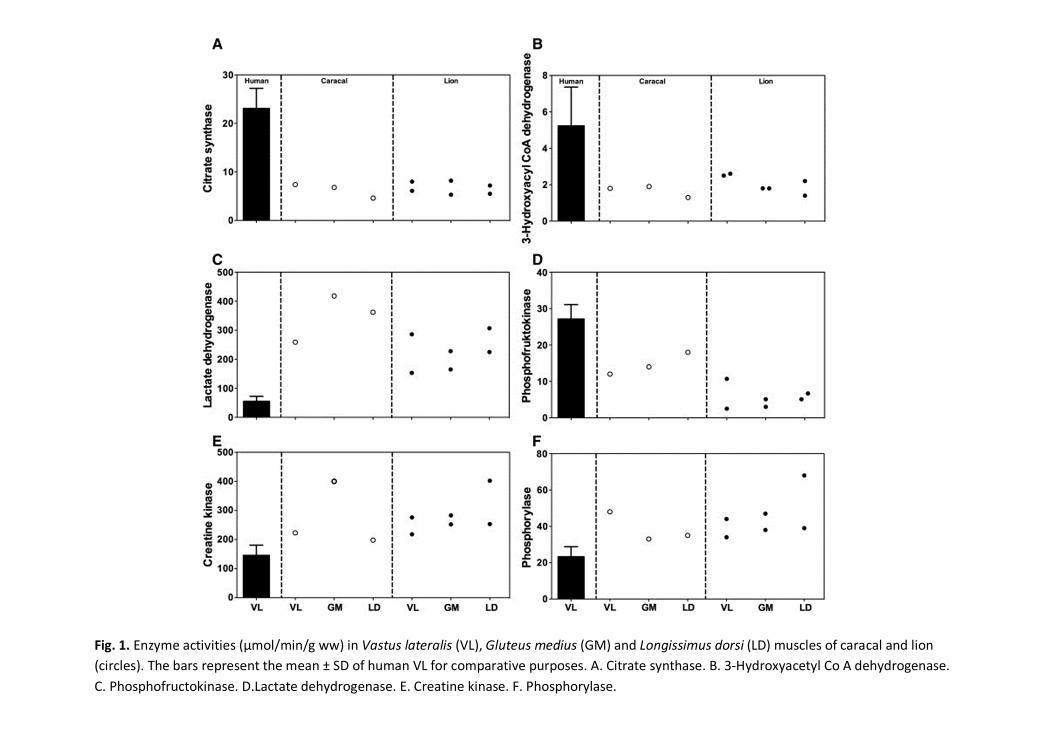
Fig. 1. Enzyme activities (μmol/min/g ww) in Vastus lateralis (VL), Gluteus medius (GM) and Longissimus dorsi (LD) muscles of caracal and lion(circles). The bars represent the mean ± SD of human VL for comparative purposes. A. Citrate synthase. B. 3-Hydroxyacetyl Co A dehydrogenase.C. Phosphofructokinase. D.Lactate dehydrogenase. E. Creatine kinase. F. Phosphorylase.
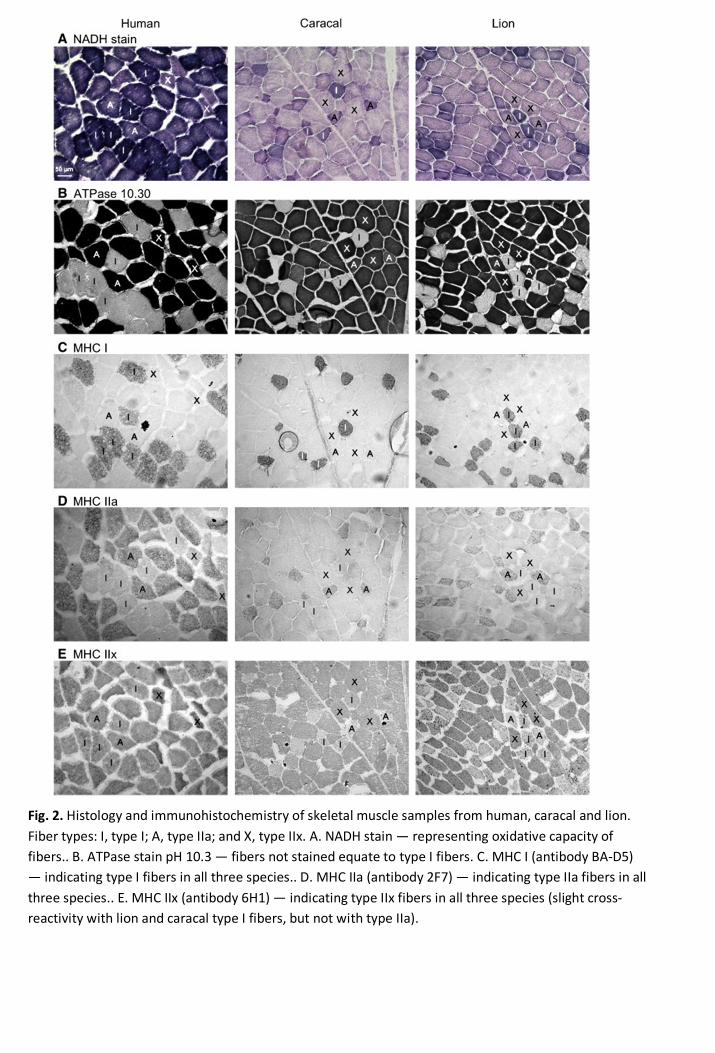
Fig. 2. Histology and immunohistochemistry of skeletal muscle samples from human, caracal and lion.Fiber types: I, type I; A, type IIa; and X, type IIx. A. NADH stain — representing oxidative capacity offibers.. B. ATPase stain pH 10.3 — fibers not stained equate to type I fibers. C. MHC I (antibody BA-D5)— indicating type I fibers in all three species.. D. MHC IIa (antibody 2F7) — indicating type IIa fibers in allthree species.. E. MHC IIx (antibody 6H1) — indicating type IIx fibers in all three species (slight cross-reactivity with lion and caracal type I fibers, but not with type IIa).
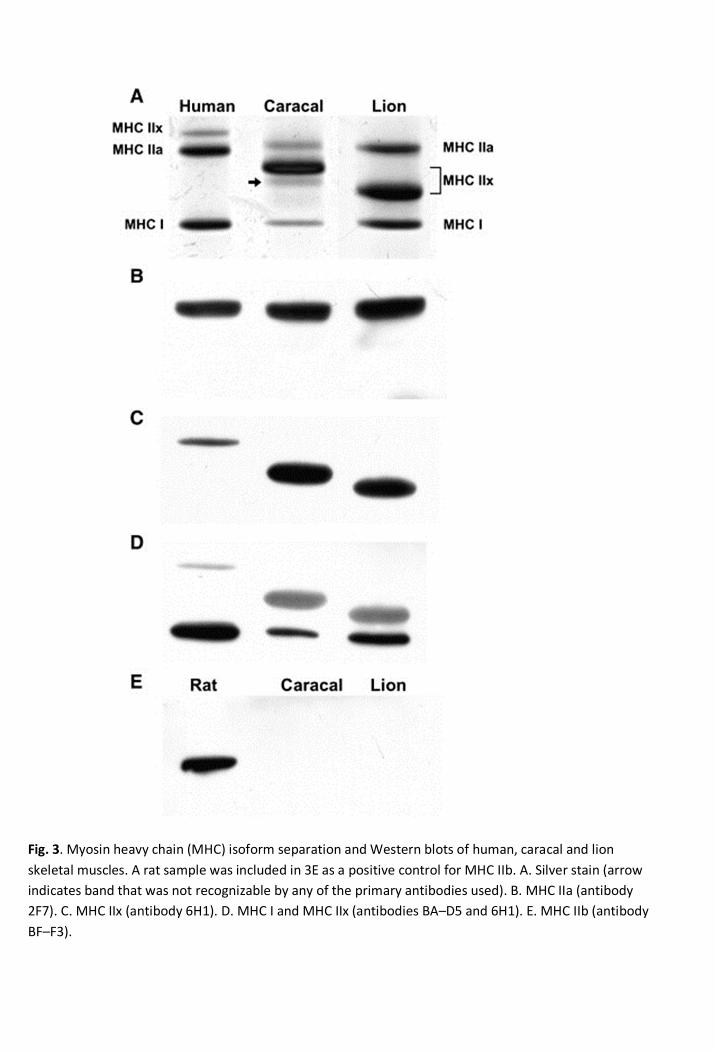
Fig. 3. Myosin heavy chain (MHC) isoform separation and Western blots of human, caracal and lionskeletal muscles. A rat sample was included in 3E as a positive control for MHC IIb. A. Silver stain (arrowindicates band that was not recognizable by any of the primary antibodies used). B. MHC IIa (antibody2F7). C. MHC IIx (antibody 6H1). D. MHC I and MHC IIx (antibodies BA–D5 and 6H1). E. MHC IIb (antibodyBF–F3).
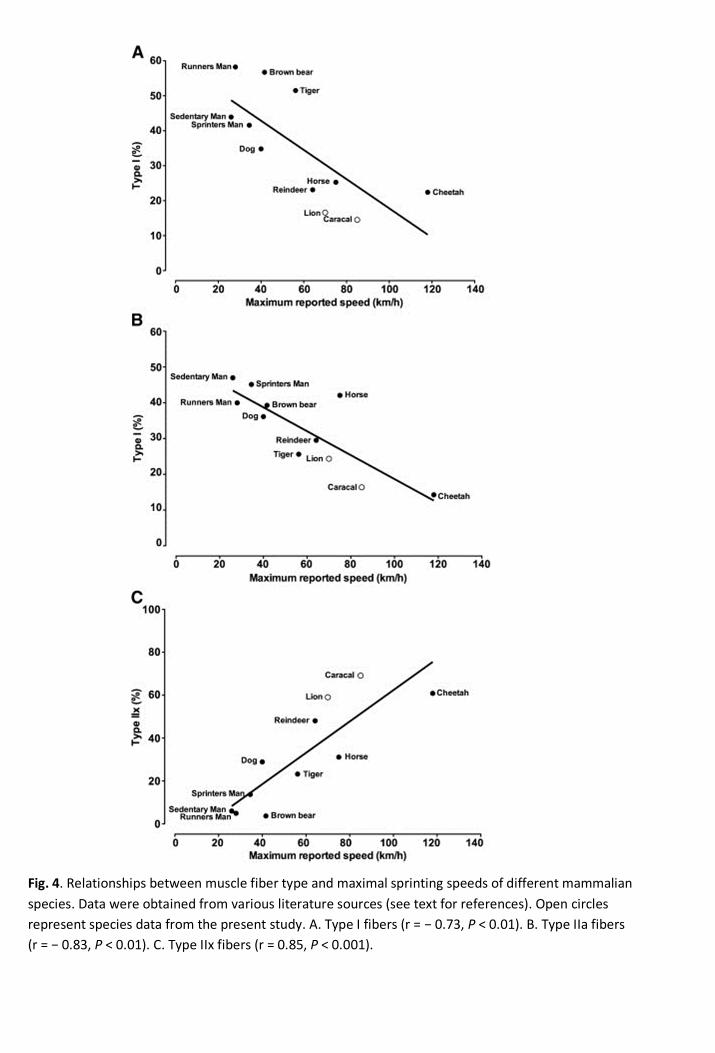
Fig. 4. Relationships between muscle fiber type and maximal sprinting speeds of different mammalianspecies. Data were obtained from various literature sources (see text for references). Open circlesrepresent species data from the present study. A. Type I fibers (r = − 0.73, P < 0.01). B. Type IIa fibers(r = − 0.83, P < 0.01). C. Type IIx fibers (r = 0.85, P < 0.001).