Embed Size (px)
Citation preview

1
Chapter 10
The Basics of Capital Budgeting
2
Topics Overview and “vocabulary” Methods
NPV IRR, MIRR Profitability Index Payback, discounted payback
Unequal lives Economic life Optimal capital budget
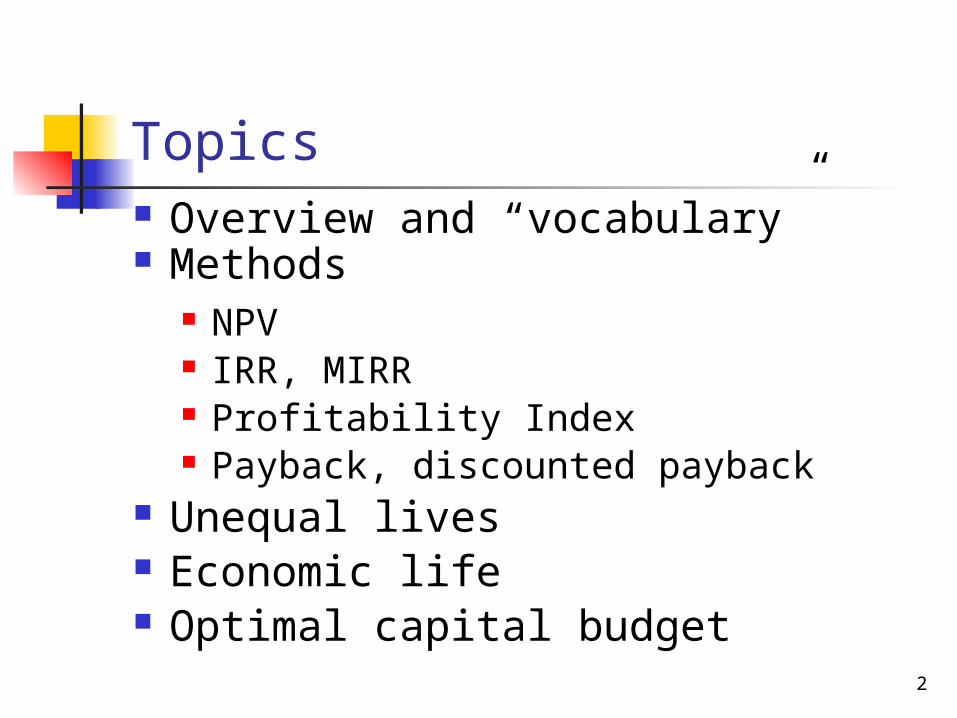
Project’s Cash Flows (CFt)
Marketinterest
rates
Project’s business
risk
Marketrisk
aversion
Project’sdebt/equity
capacityProject’s risk-
adjustedcost of capital
(r)
The Big Picture:The Net Present Value of a
Project
NPV = + + ··· + − Initial cost
CF1
CF2
CFN
(1 + r )1 (1 + r)N(1 + r)2
4
What is capital budgeting? Analysis of potential projects. Long-term decisions; involve large
expenditures. Very important to firm’s future.
5
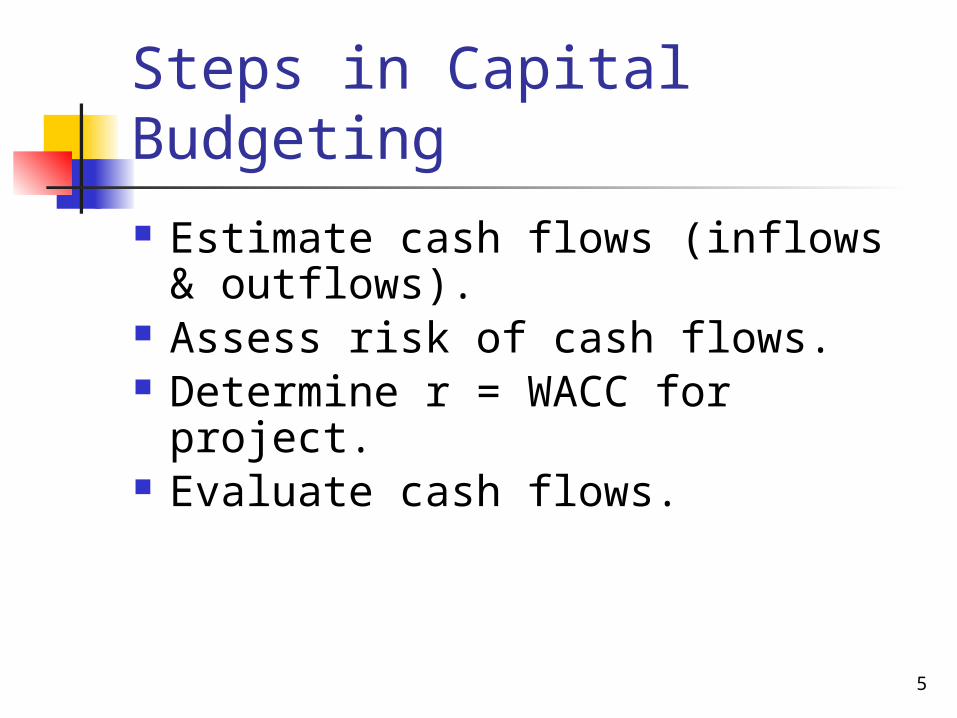
Steps in Capital Budgeting Estimate cash flows (inflows &
outflows). Assess risk of cash flows. Determine r = WACC for project. Evaluate cash flows.
6
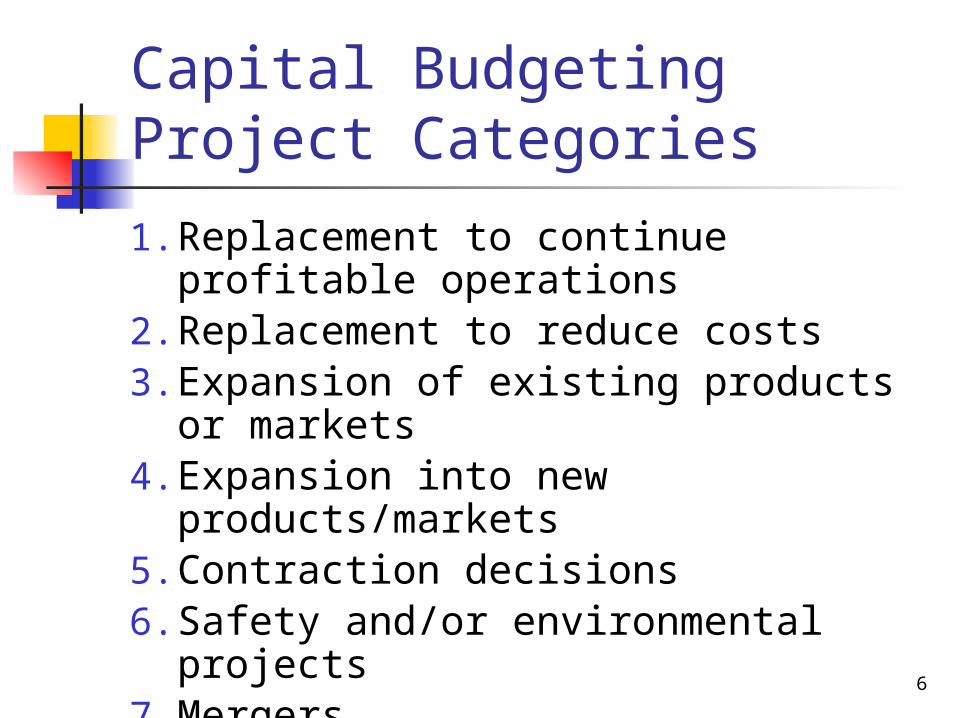
Capital Budgeting Project Categories
1. Replacement to continue profitable operations
2. Replacement to reduce costs3. Expansion of existing products or
markets4. Expansion into new
products/markets5. Contraction decisions6. Safety and/or environmental projects7. Mergers8. Other
7
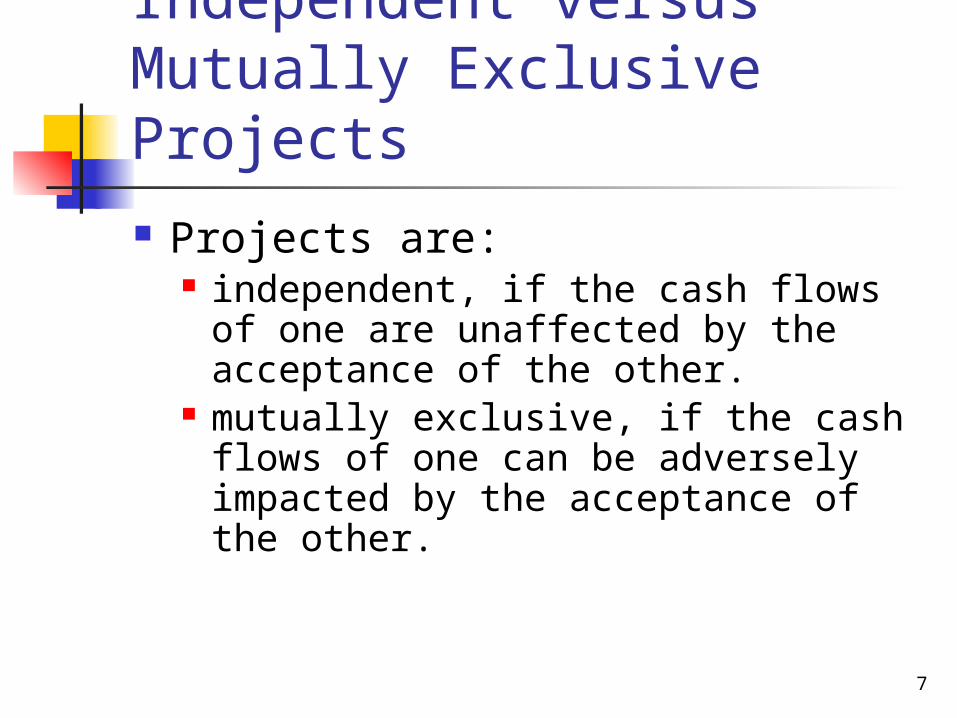
Independent versus Mutually Exclusive Projects Projects are:
independent, if the cash flows of one are unaffected by the acceptance of the other.
mutually exclusive, if the cash flows of one can be adversely impacted by the acceptance of the other.
8
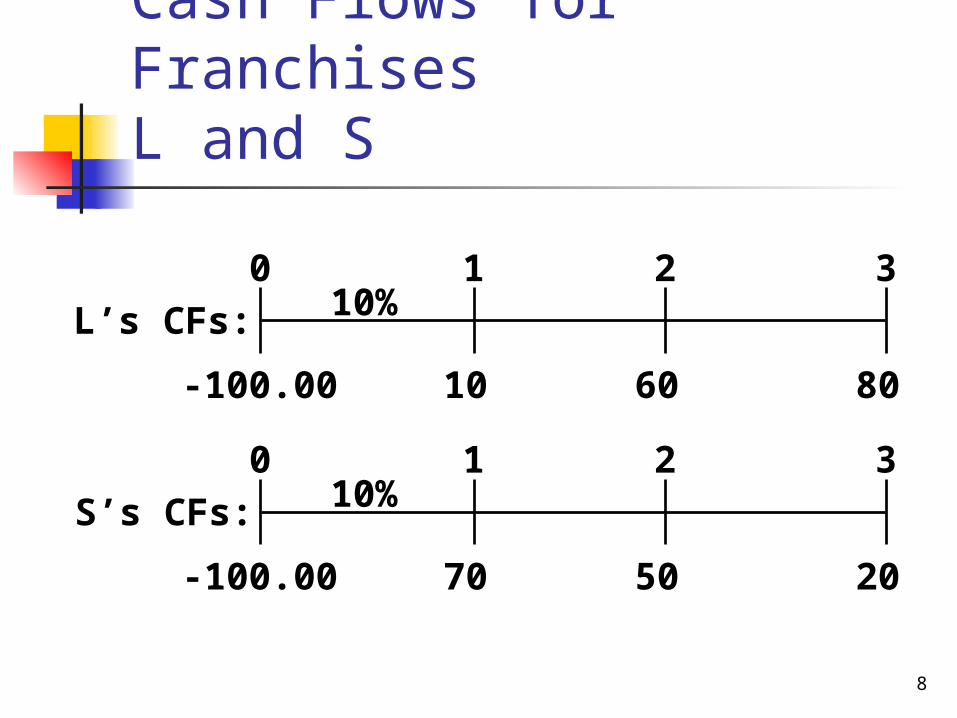
Cash Flows for Franchises
L and S
10 8060
0 1 2 310%L’s CFs:
-100.00
70 2050
0 1 2 310%S’s CFs:
-100.00
9
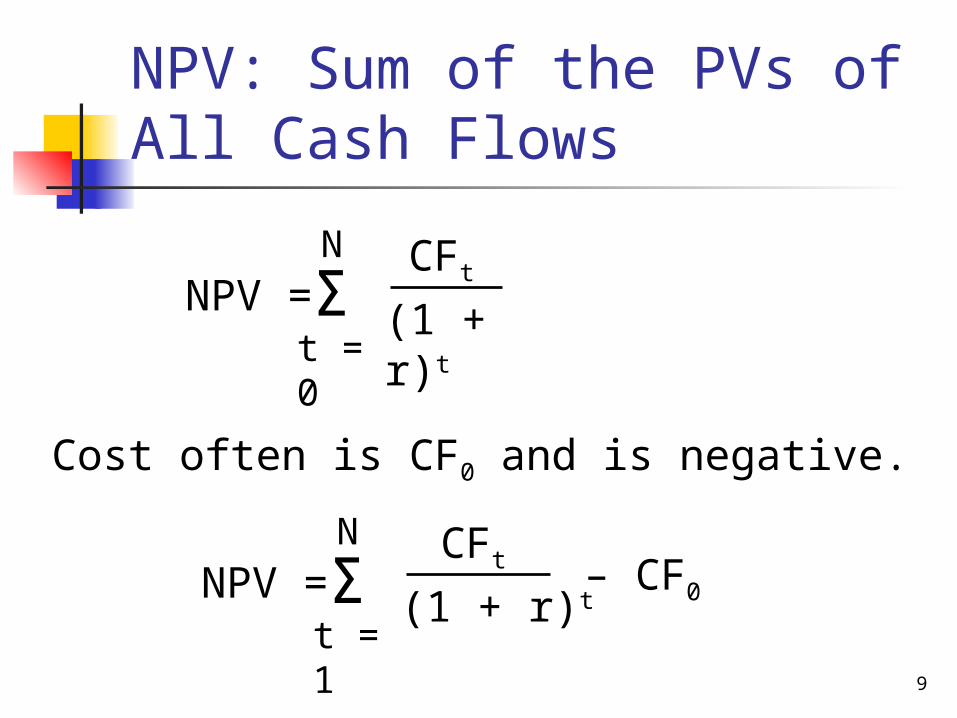
NPV: Sum of the PVs of All Cash Flows
Cost often is CF0 and is negative.
NPV = ΣN
t = 0
CFt
(1 + r)t
NPV = ΣN
t = 1
CFt
(1 + r)t– CF0
10
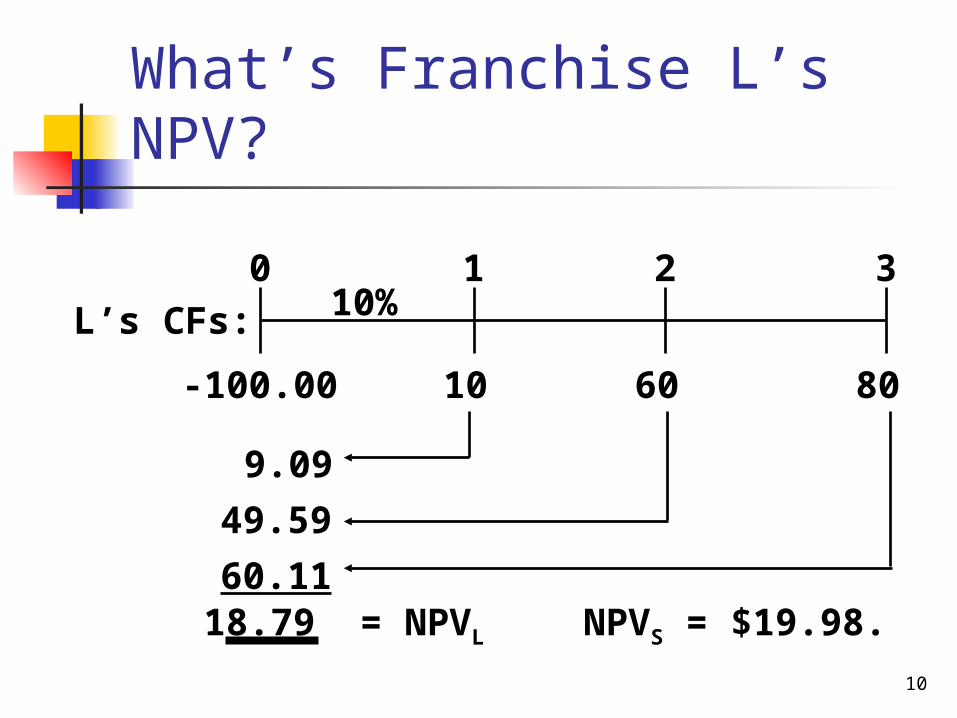
What’s Franchise L’s NPV?
10 8060
0 1 2 310%L’s CFs:
-100.00
9.09
49.59
60.1118.79 = NPVL NPVS = $19.98.
11
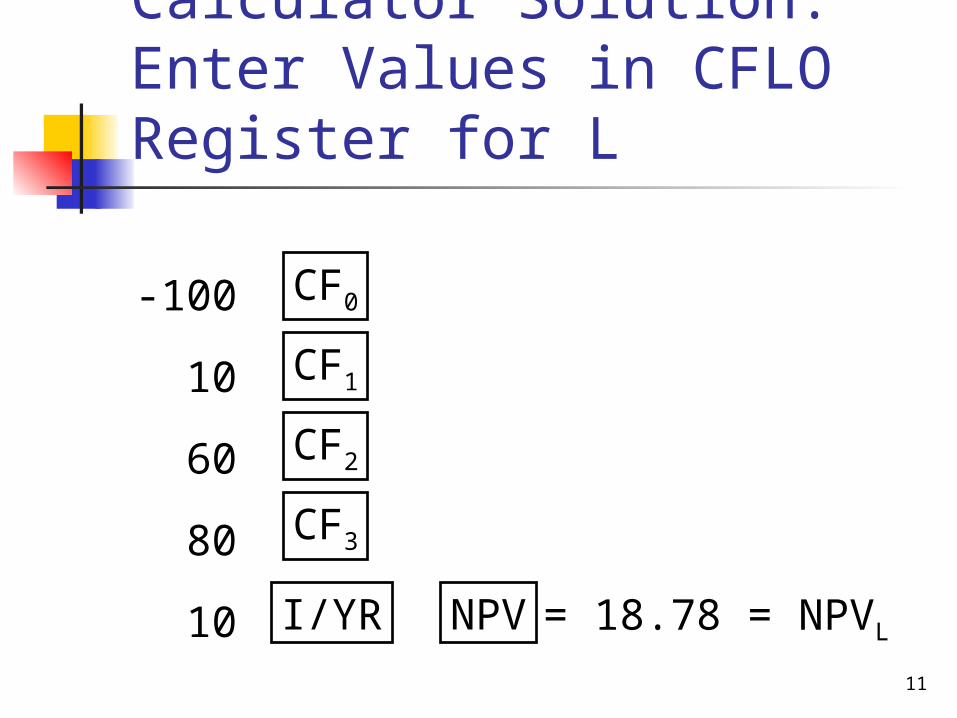
Calculator Solution: Enter Values in CFLO Register for L
-100
10
60
80
10
CF0
CF1
NPV
CF2
CF3
I/YR = 18.78 = NPVL
12
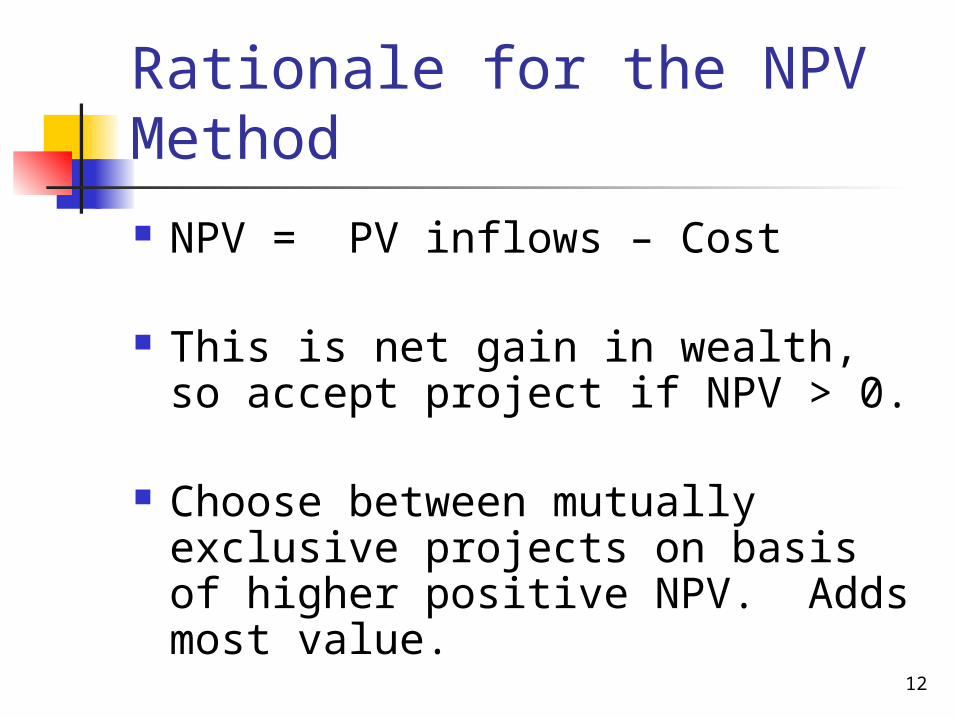
Rationale for the NPV Method NPV = PV inflows – Cost
This is net gain in wealth, so accept project if NPV > 0.
Choose between mutually exclusive projects on basis of higher positive NPV. Adds most value.
13
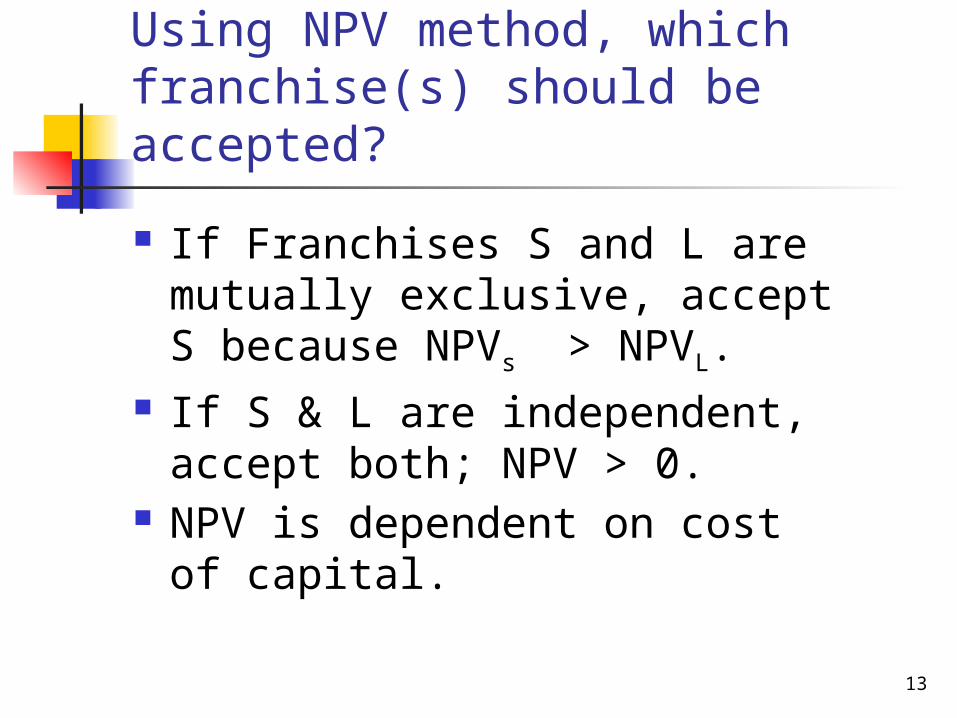
Using NPV method, which franchise(s) should be accepted?
If Franchises S and L are mutually exclusive, accept S because NPVs > NPVL.
If S & L are independent, accept both; NPV > 0.
NPV is dependent on cost of capital.
14
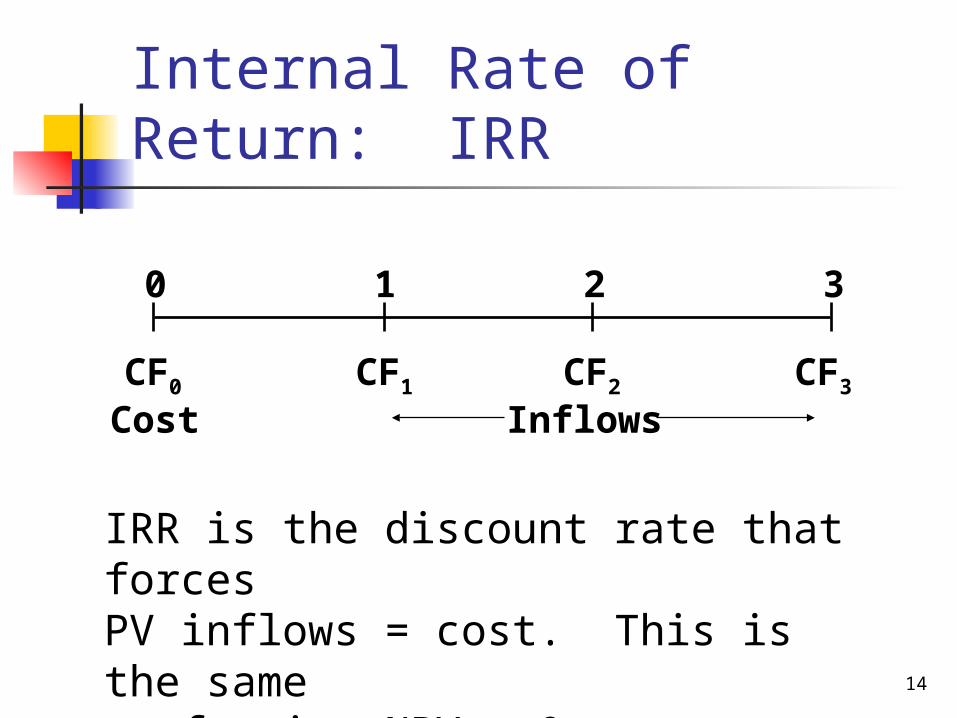
Internal Rate of Return: IRR
0 1 2 3
CF0 CF1 CF2 CF3
Cost Inflows
IRR is the discount rate that forcesPV inflows = cost. This is the sameas forcing NPV = 0.
15
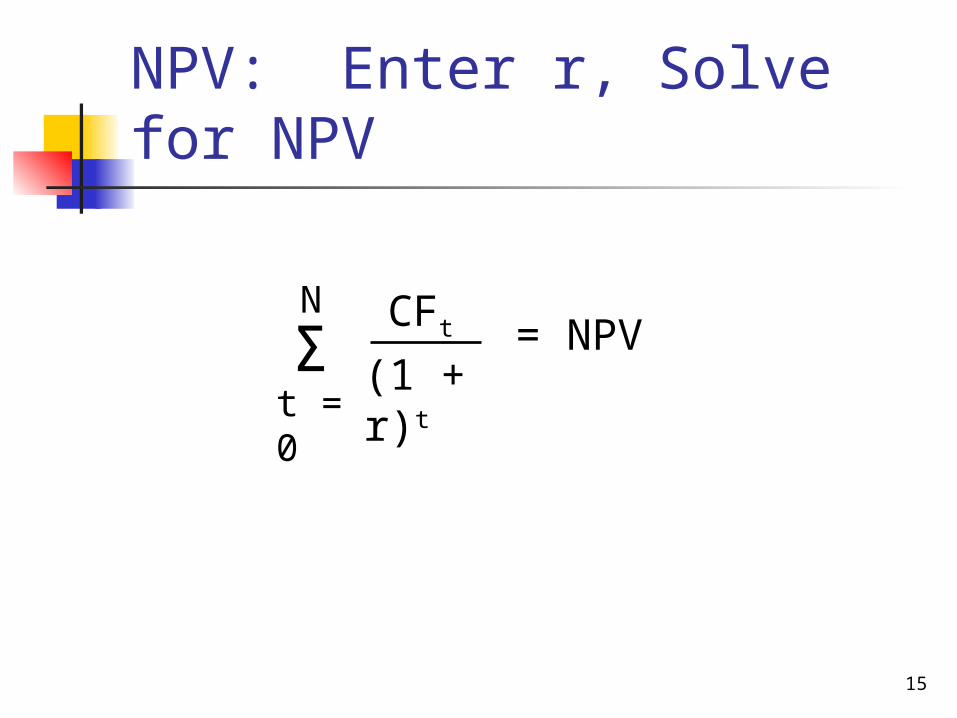
NPV: Enter r, Solve for NPV
= NPV ΣN
t = 0
CFt
(1 + r)t
16
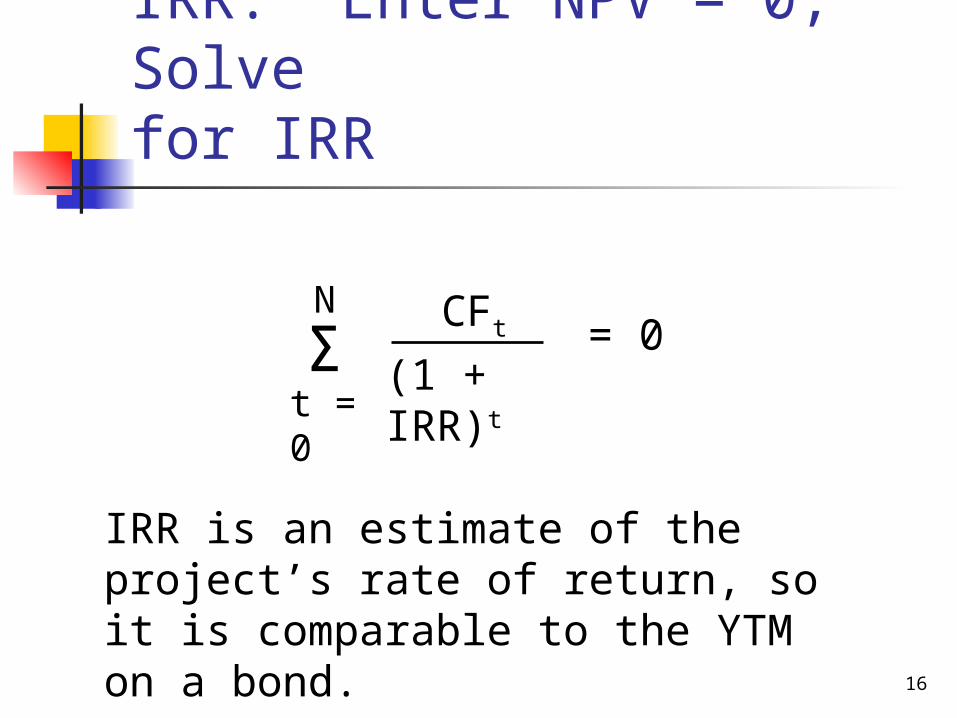
IRR: Enter NPV = 0, Solve for IRR
= 0 ΣN
t = 0
CFt
(1 + IRR)t
IRR is an estimate of the project’s rate of return, so it is comparable to the YTM on a bond.
17
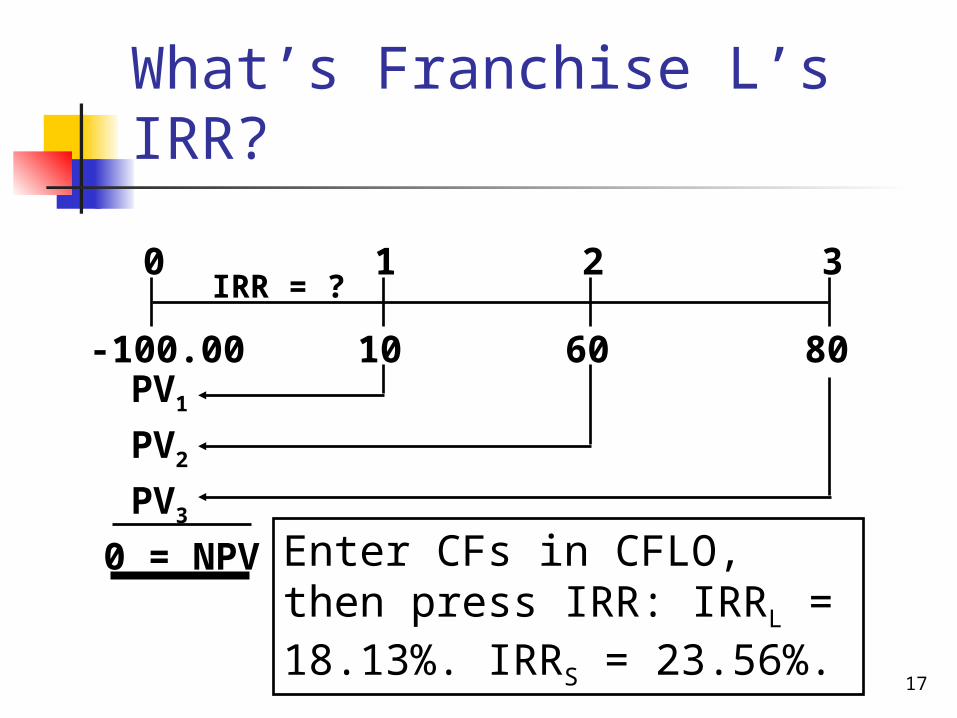
What’s Franchise L’s IRR?
10 8060
0 1 2 3IRR = ?
-100.00
PV3
PV2
PV1
0 = NPV Enter CFs in CFLO, then press IRR: IRRL = 18.13%. IRRS = 23.56%.
18
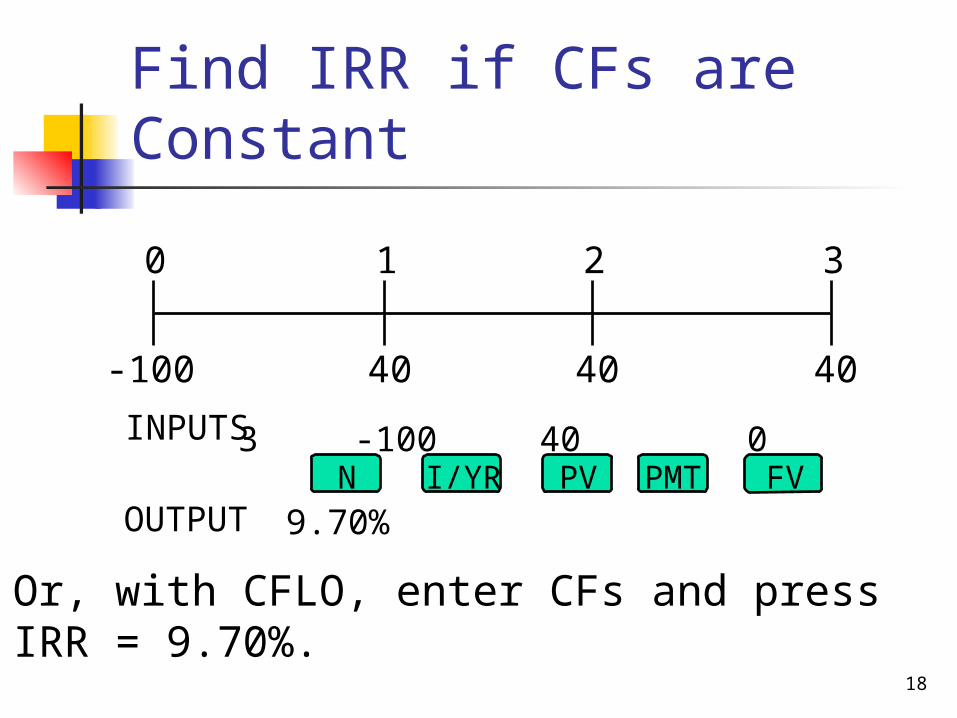
40 40 40
0 1 2 3
-100
Or, with CFLO, enter CFs and press IRR = 9.70%.
3 -100 40 0
9.70%N I/YR PV PMT FV
INPUTS
OUTPUT
Find IRR if CFs are Constant
19
Rationale for the IRR Method If IRR > WACC, then the project’s
rate of return is greater than its cost-- some return is left over to boost stockholders’ returns.
Example:WACC = 10%, IRR = 15%.
So this project adds extra return to shareholders.
20
Decisions on Franchises S and L per IRR
If S and L are independent, accept both: IRRS > r and IRRL > r.
If S and L are mutually exclusive, accept S because IRRS > IRRL.
IRR is not dependent on the cost of capital used.
21
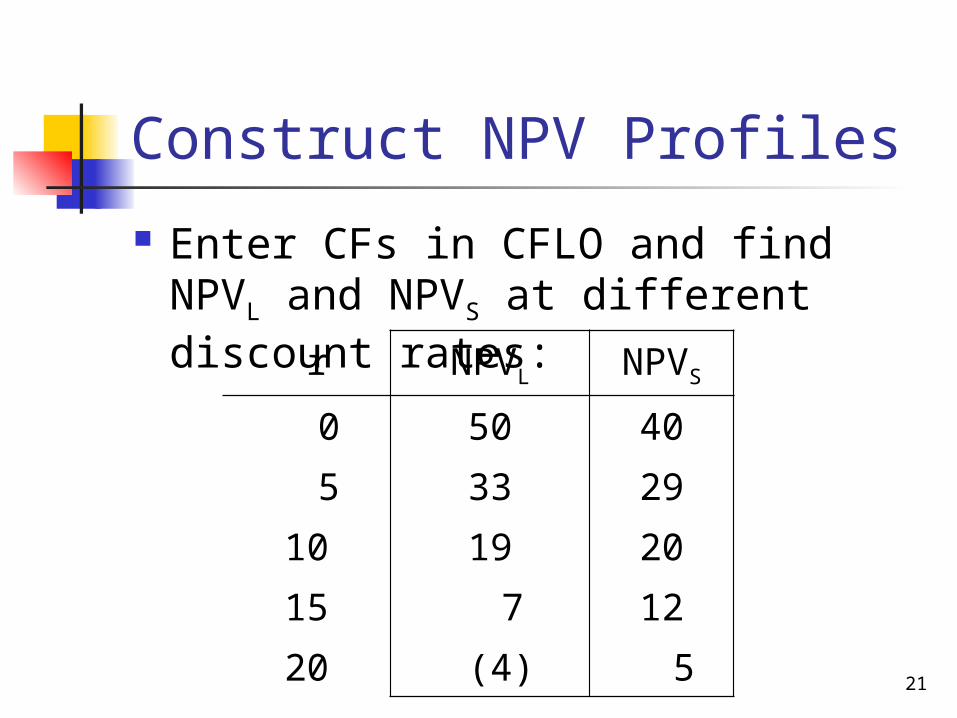
Construct NPV Profiles
Enter CFs in CFLO and find NPVL and NPVS at different discount rates: r NPVL NPVS
0 50 40 5 33 2910 19 2015 7 1220 (4) 5
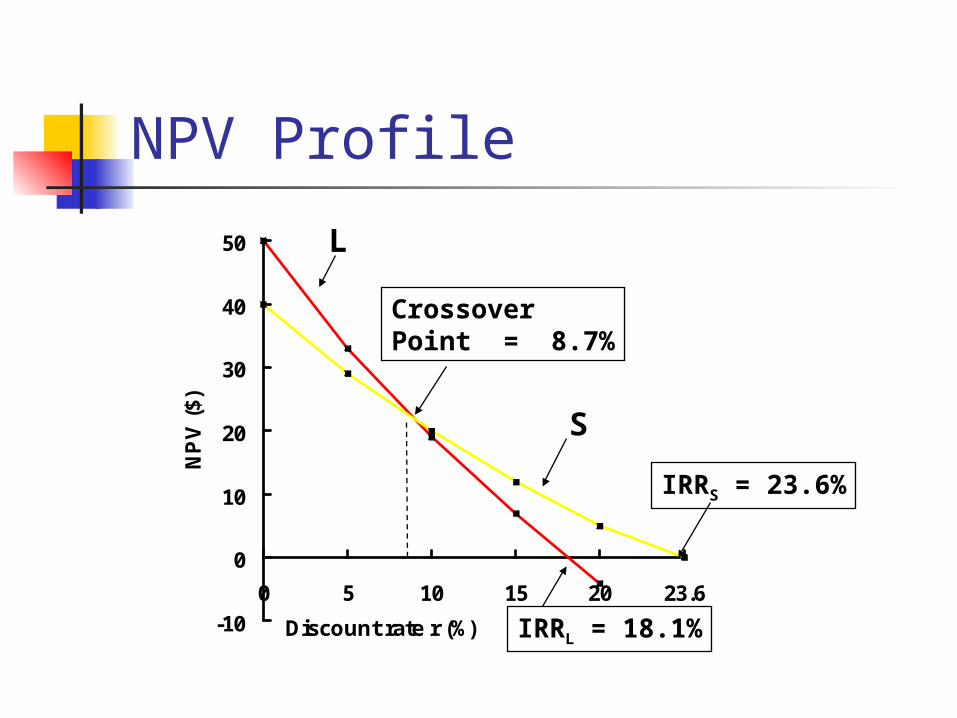
NPV Profile
-10
0
10
20
30
40
50
0 5 10 15 20 23.6
Discount rate r (%)
NP
V (
$)
IRRL = 18.1%
IRRS = 23.6%
Crossover Point = 8.7%
S
L
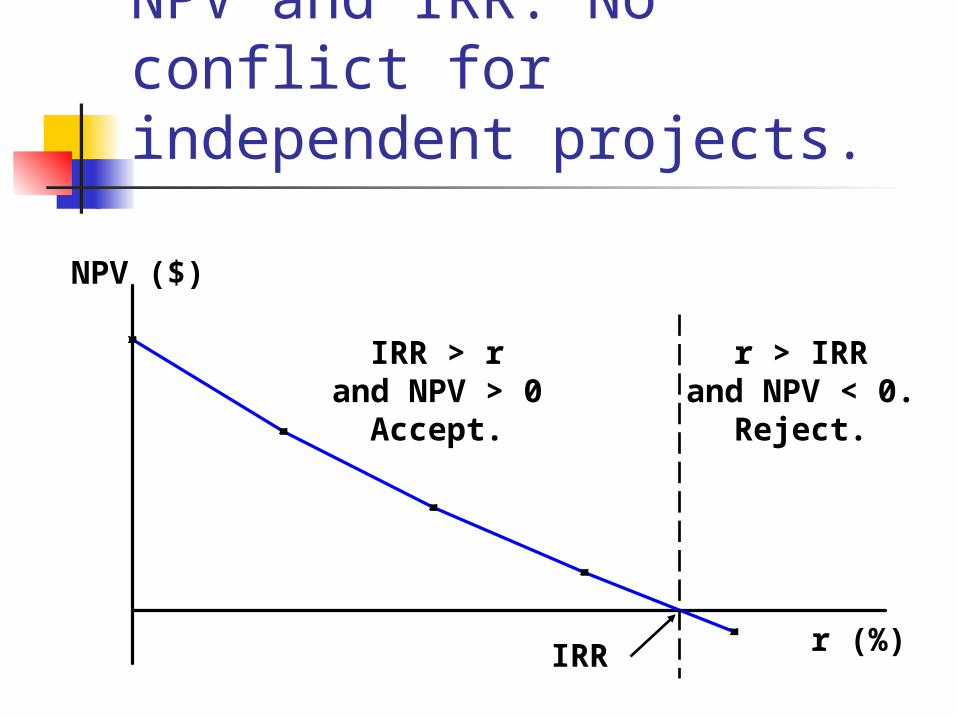
r > IRRand NPV < 0.
Reject.
NPV ($)
r (%)IRR
IRR > rand NPV > 0
Accept.
NPV and IRR: No conflict for independent projects.
24
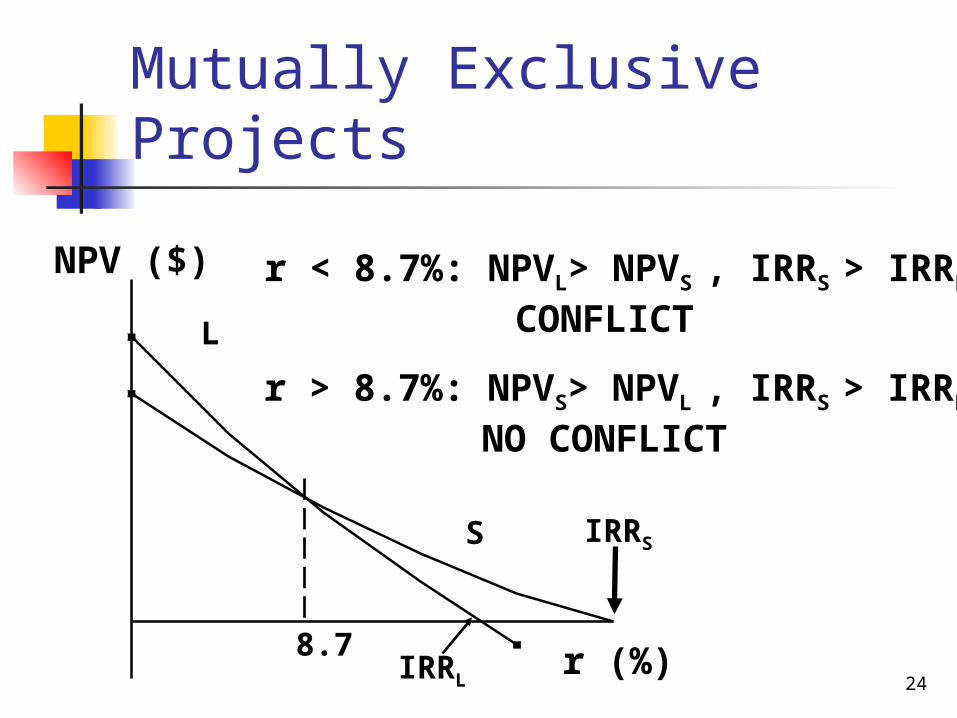
Mutually Exclusive Projects
8.7
NPV ($)
r (%)
IRRS
IRRL
L
S
r < 8.7%: NPVL> NPVS , IRRS > IRRL
CONFLICT
r > 8.7%: NPVS> NPVL , IRRS > IRRL
NO CONFLICT
25
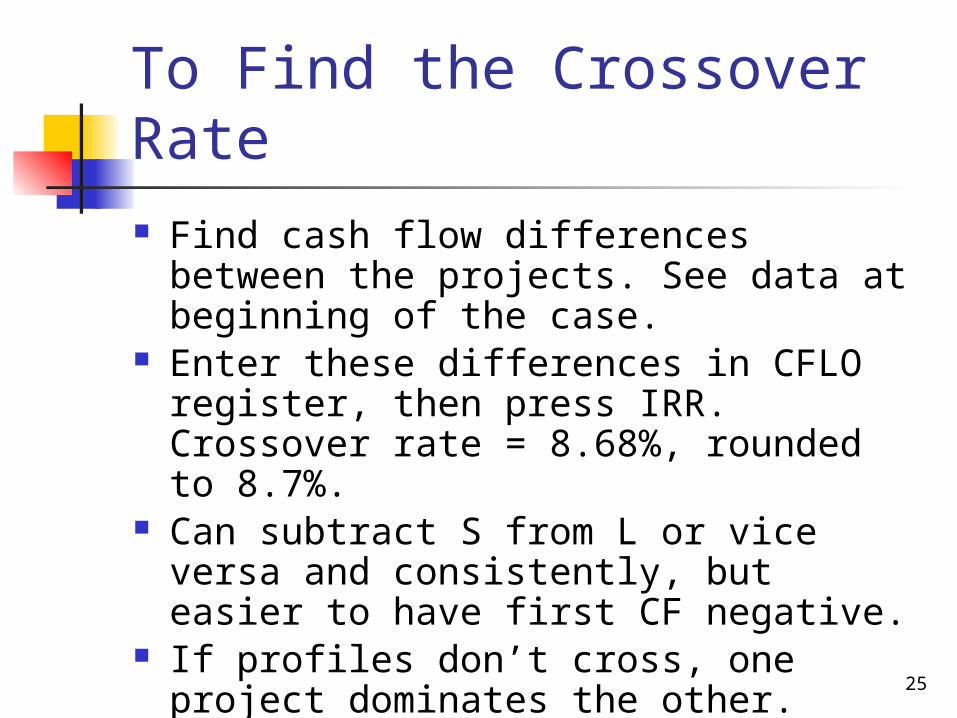
To Find the Crossover Rate Find cash flow differences between the
projects. See data at beginning of the case.
Enter these differences in CFLO register, then press IRR. Crossover rate = 8.68%, rounded to 8.7%.
Can subtract S from L or vice versa and consistently, but easier to have first CF negative.
If profiles don’t cross, one project dominates the other.
26
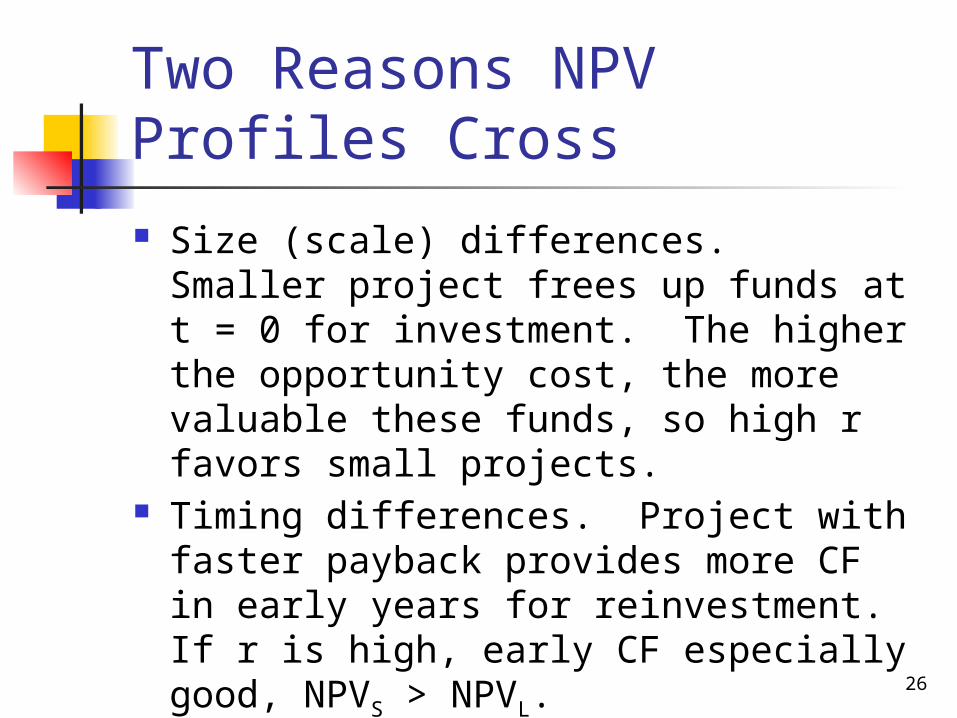
Two Reasons NPV Profiles Cross Size (scale) differences. Smaller project
frees up funds at t = 0 for investment. The higher the opportunity cost, the more valuable these funds, so high r favors small projects.
Timing differences. Project with faster payback provides more CF in early years for reinvestment. If r is high, early CF especially good, NPVS > NPVL.
27
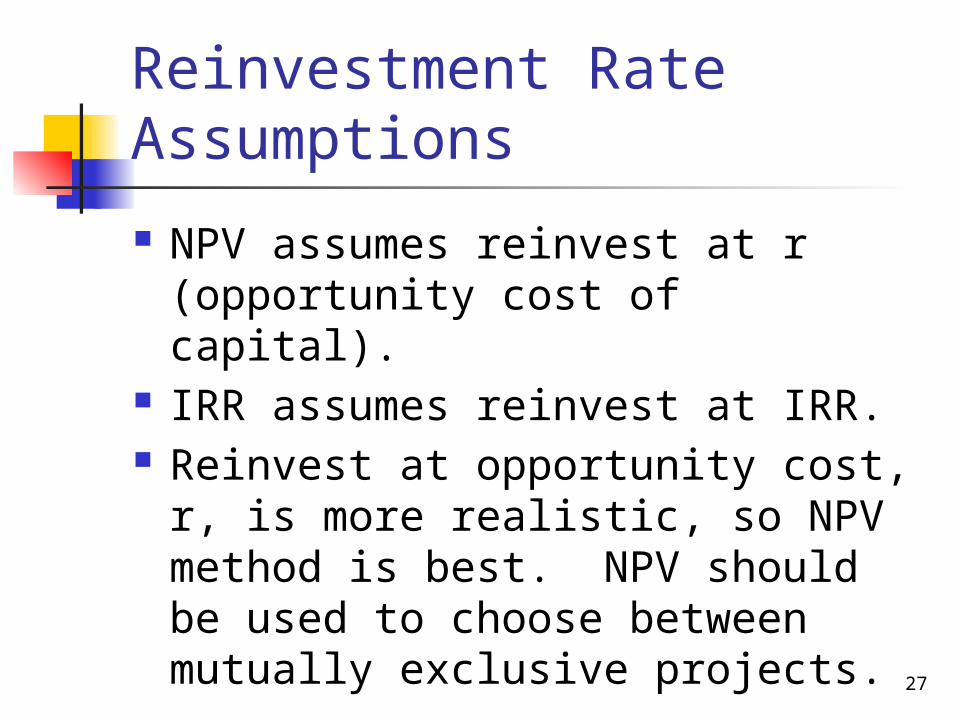
Reinvestment Rate Assumptions
NPV assumes reinvest at r (opportunity cost of capital).
IRR assumes reinvest at IRR. Reinvest at opportunity cost, r, is
more realistic, so NPV method is best. NPV should be used to choose between mutually exclusive projects.
28
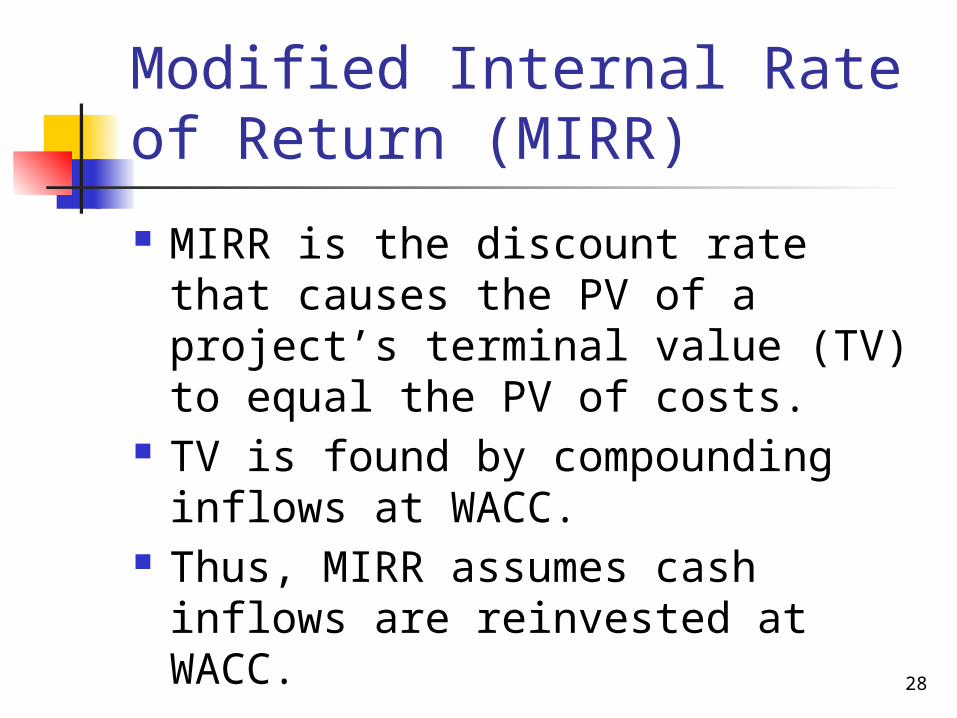
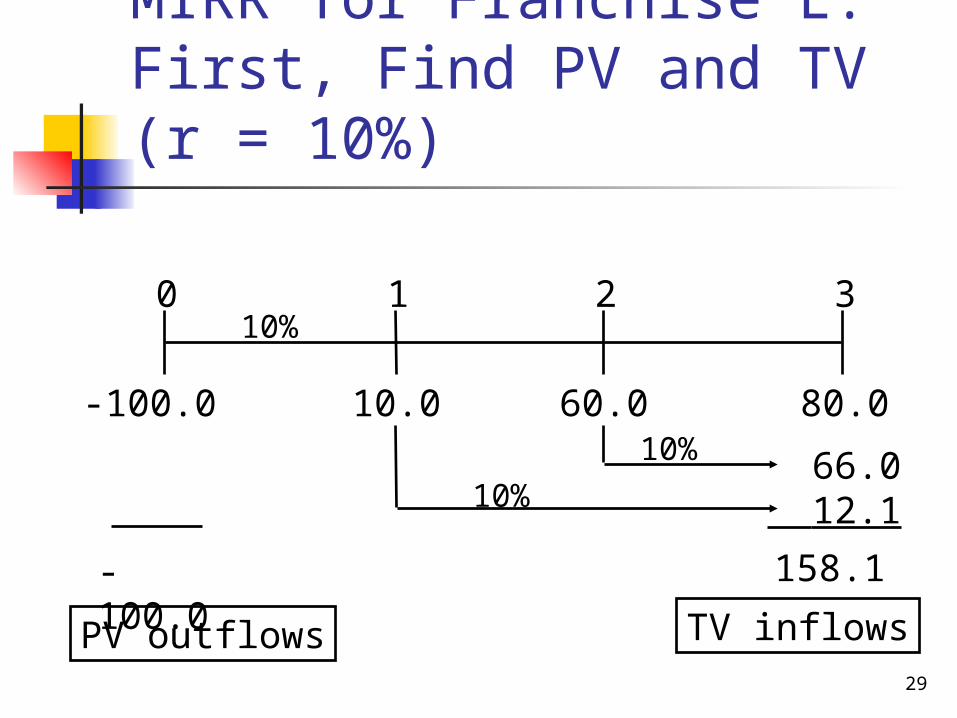
Modified Internal Rate of Return (MIRR)
MIRR is the discount rate that causes the PV of a project’s terminal value (TV) to equal the PV of costs.
TV is found by compounding inflows at WACC.
Thus, MIRR assumes cash inflows are reinvested at WACC.
29
10.0 80.060.0
0 1 2 310%
66.0 12.1
158.1
-100.010%
10%
TV inflows
-100.0PV outflows
MIRR for Franchise L: First, Find PV and TV (r = 10%)
30
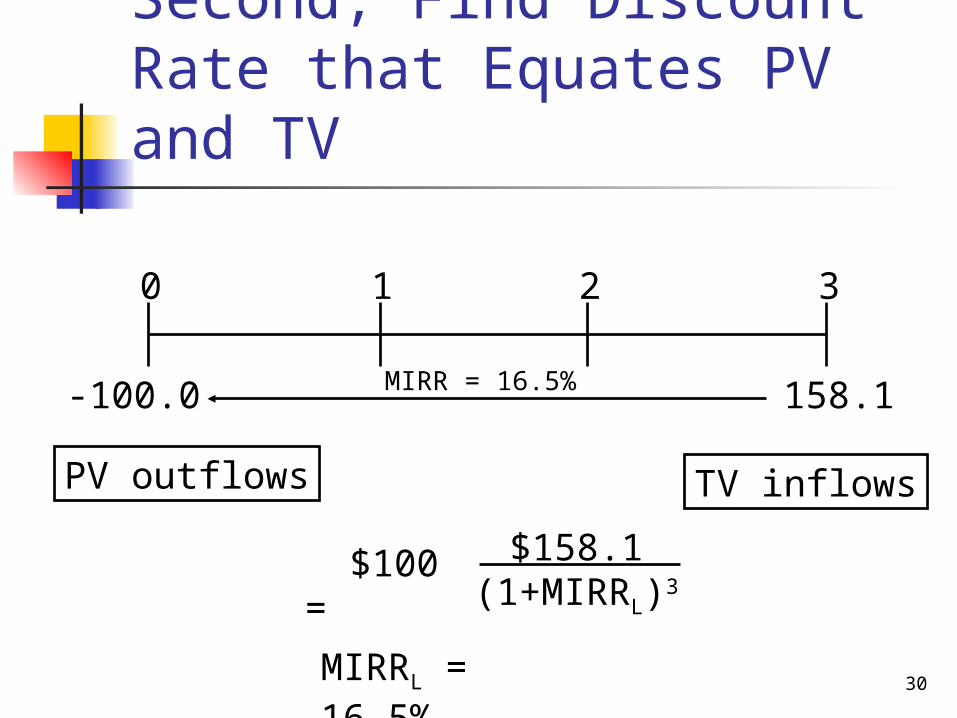
MIRR = 16.5% 158.1
0 1 2 3
-100.0
TV inflowsPV outflows
MIRRL = 16.5%
$100 =
$158.1(1+MIRRL)3
Second, Find Discount Rate that Equates PV and TV
31
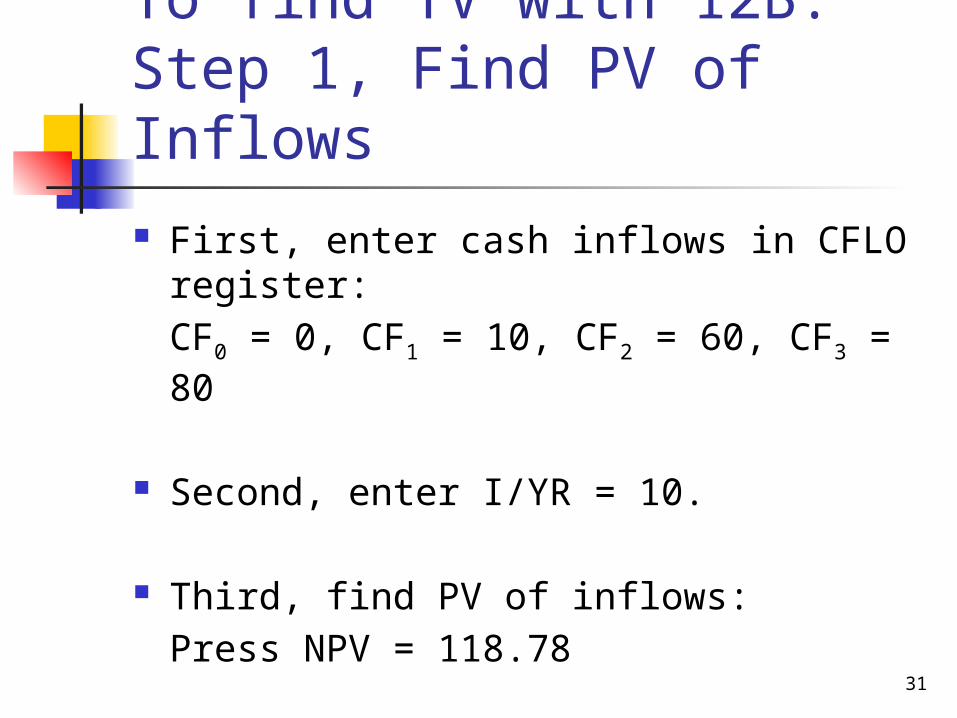
To find TV with 12B: Step 1, Find PV of Inflows First, enter cash inflows in CFLO
register:CF0 = 0, CF1 = 10, CF2 = 60, CF3 = 80
Second, enter I/YR = 10.
Third, find PV of inflows:Press NPV = 118.78
32
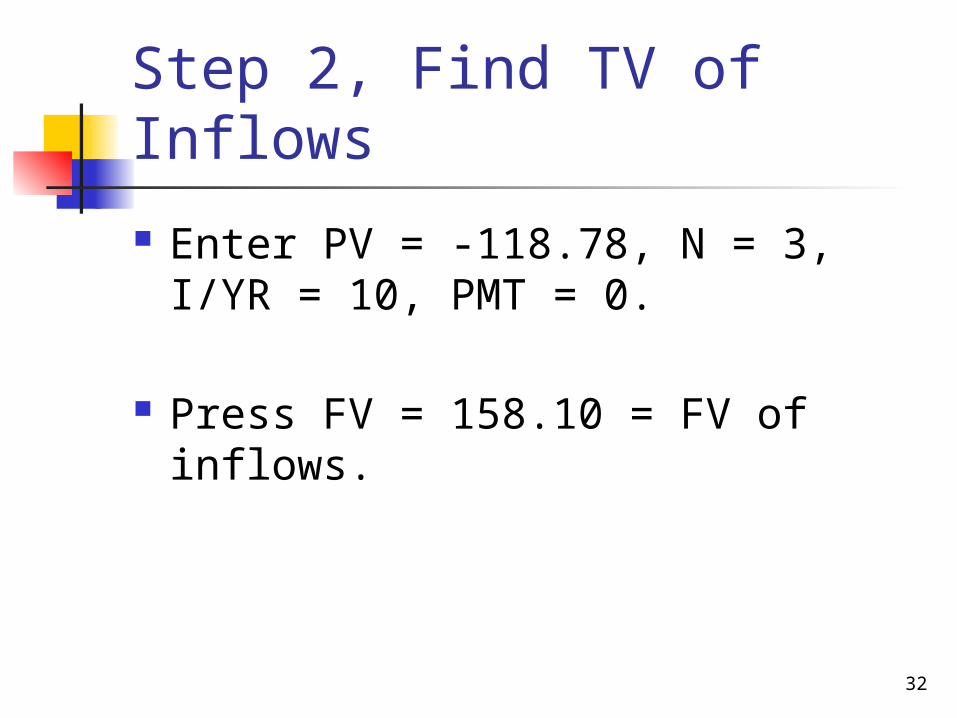
Step 2, Find TV of Inflows
Enter PV = -118.78, N = 3, I/YR = 10, PMT = 0.
Press FV = 158.10 = FV of inflows.
33
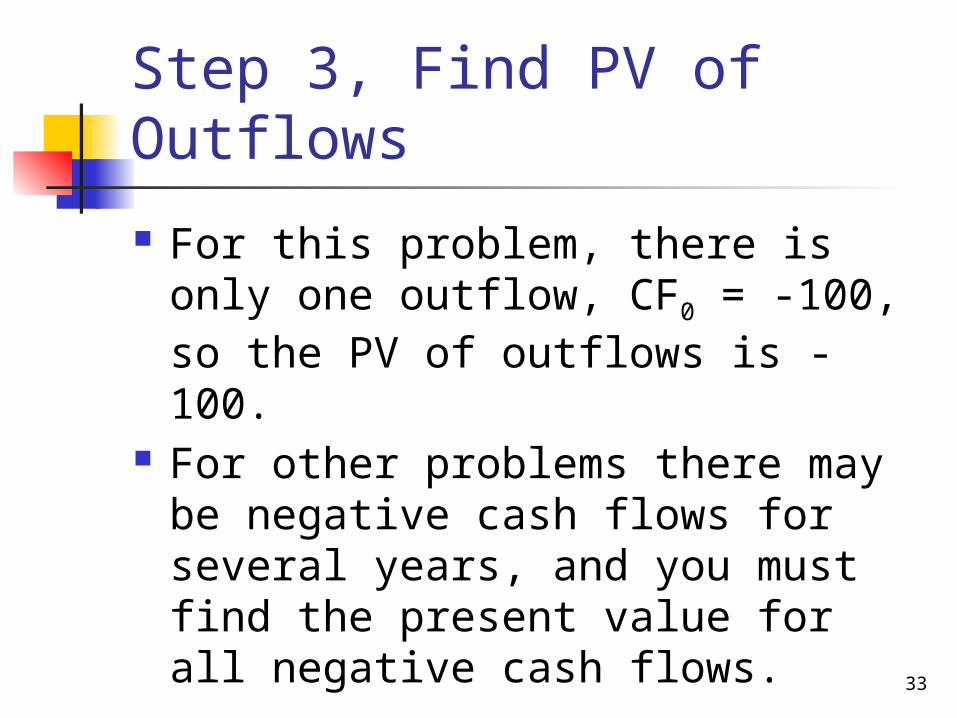
Step 3, Find PV of Outflows
For this problem, there is only one outflow, CF0 = -100, so the PV of outflows is -100.
For other problems there may be negative cash flows for several years, and you must find the present value for all negative cash flows.
34
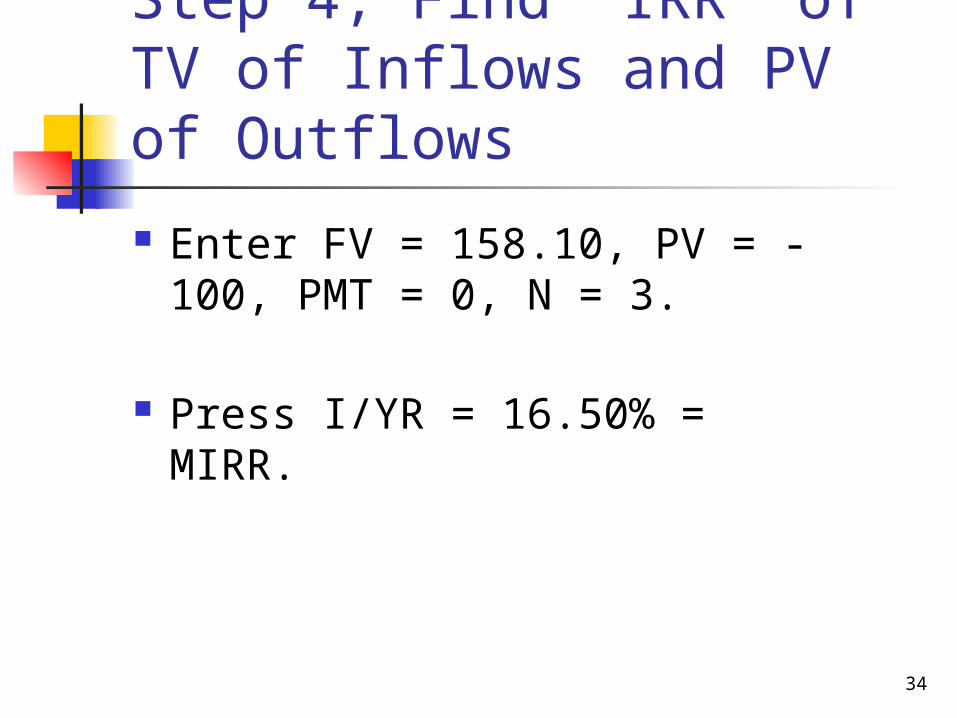
Step 4, Find “IRR” of TV of Inflows and PV of Outflows
Enter FV = 158.10, PV = -100, PMT = 0, N = 3.
Press I/YR = 16.50% = MIRR.
35
Why use MIRR versus IRR?
MIRR correctly assumes reinvestment at opportunity cost = WACC. MIRR also avoids the problem of multiple IRRs.
Managers like rate of return comparisons, and MIRR is better for this than IRR.
36
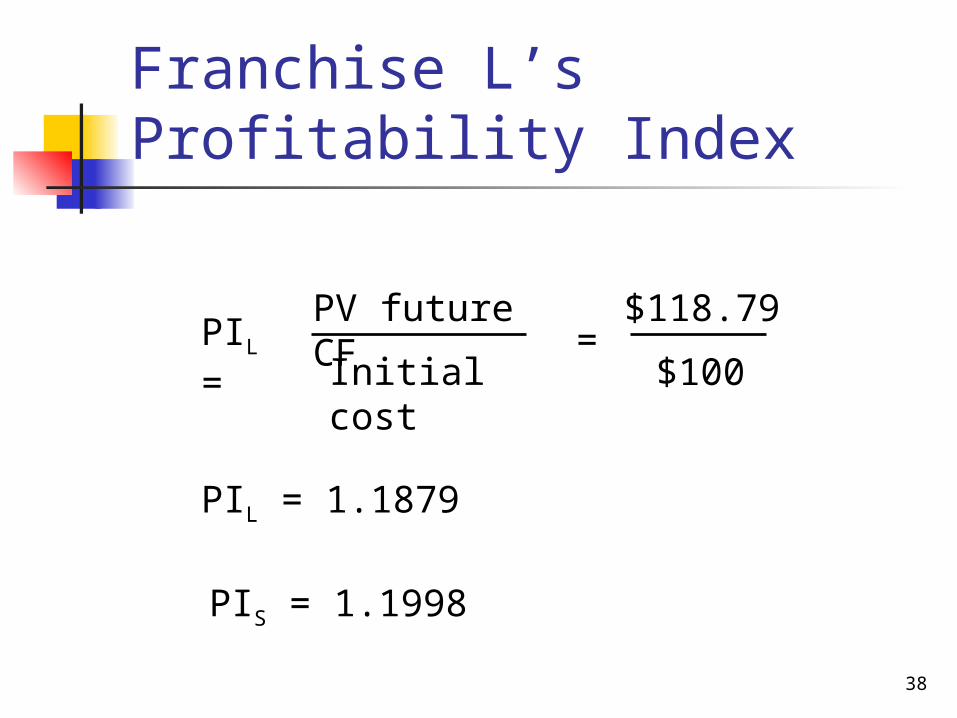
Profitability Index
The profitability index (PI) is the present value of future cash flows divided by the initial cost.
It measures the “bang for the buck.”
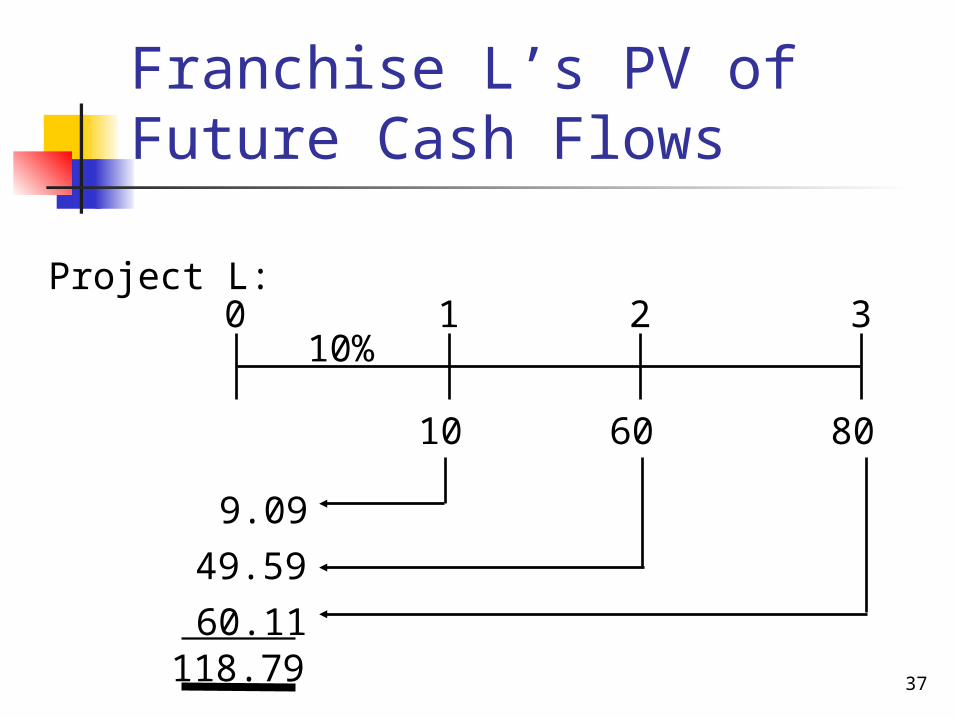
37
Franchise L’s PV of Future Cash Flows
10 8060
0 1 2 310%
Project L:
9.09
49.59
60.11118.79
38
Franchise L’s Profitability Index
PIL =PV future CF
Initial cost
$118.79=
PIL = 1.1879
$100
PIS = 1.1998
39
What is the payback period?
The number of years required to recover a project’s cost,
or how long does it take to get the business’s money back?
40
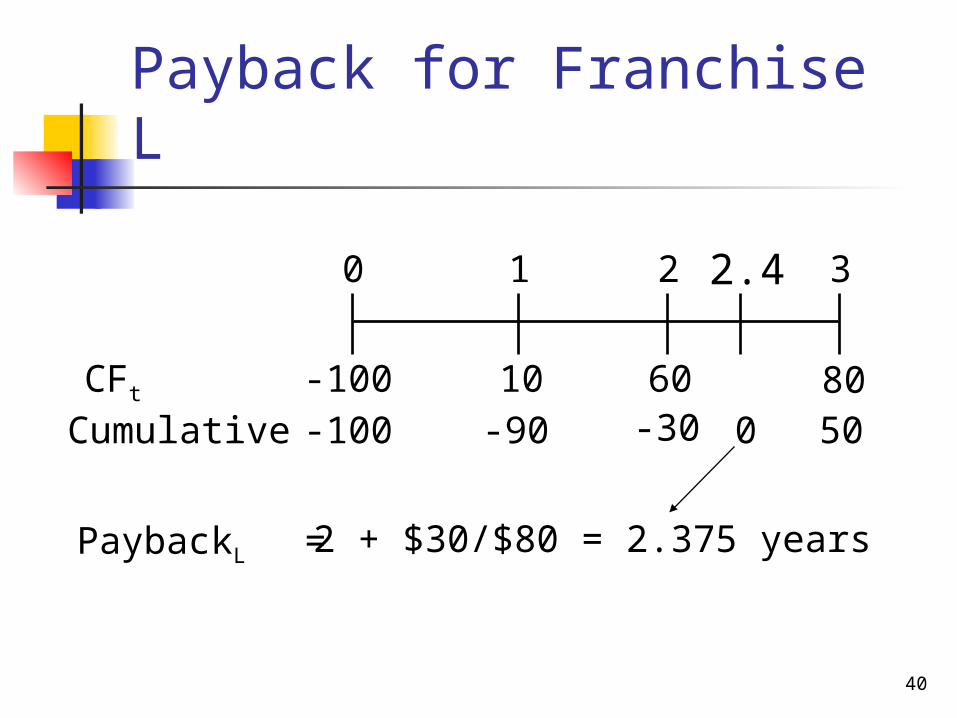
Payback for Franchise L
10 8060
0 1 2 3
-100
=
CFt
Cumulative -100 -90 -30 50
PaybackL 2 + $30/$80 = 2.375 years
0
2.4
41
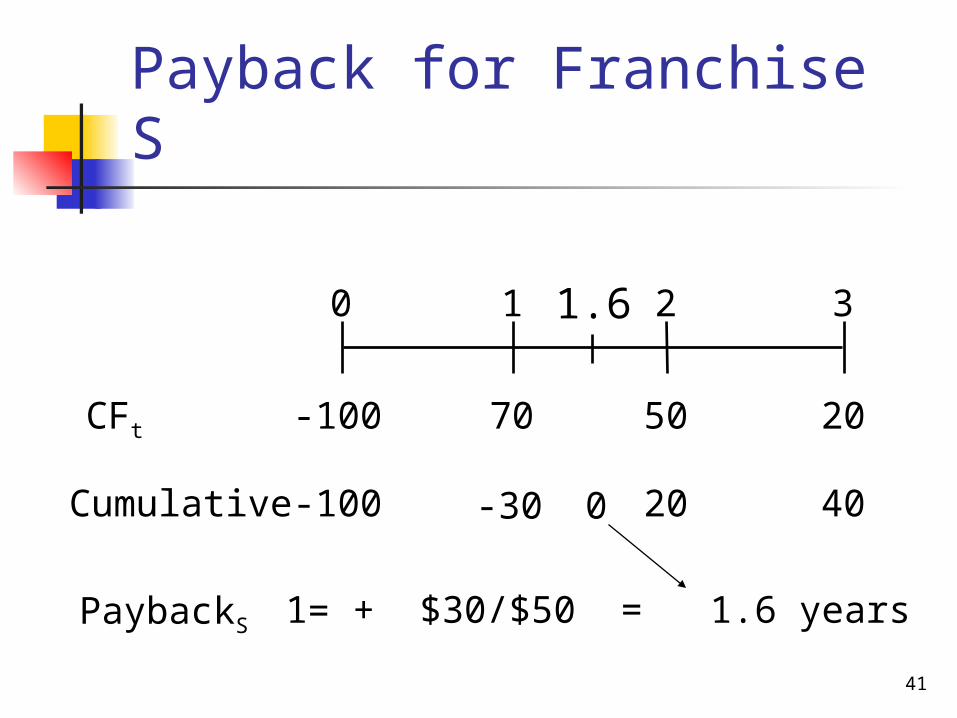
Payback for Franchise S
70 2050
0 1 2 3
-100CFt
Cumulative -100 -30 20 40
PaybackS 1 + $30/$50 = 1.6 years
0
1.6
=
42
Strengths and Weaknesses of Payback Strengths:
Provides an indication of a project’s risk and liquidity.
Easy to calculate and understand. Weaknesses:
Ignores the TVM. Ignores CFs occurring after the
payback period. No specification of acceptable
payback.
43
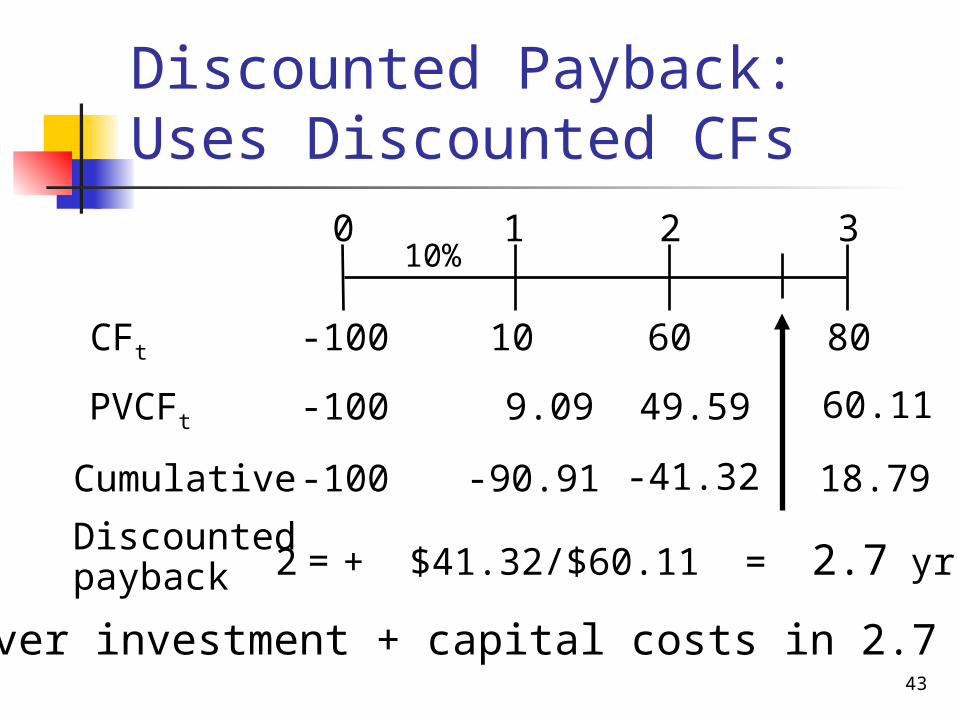
10 8060
0 1 2 3
CFt
Cumulative -100 -90.91 -41.32 18.79
Discountedpayback 2 + $41.32/$60.11 = 2.7 yrs
PVCFt -100
-100
10%
9.09 49.59 60.11
=
Recover investment + capital costs in 2.7 yrs.
Discounted Payback: Uses Discounted CFs
44
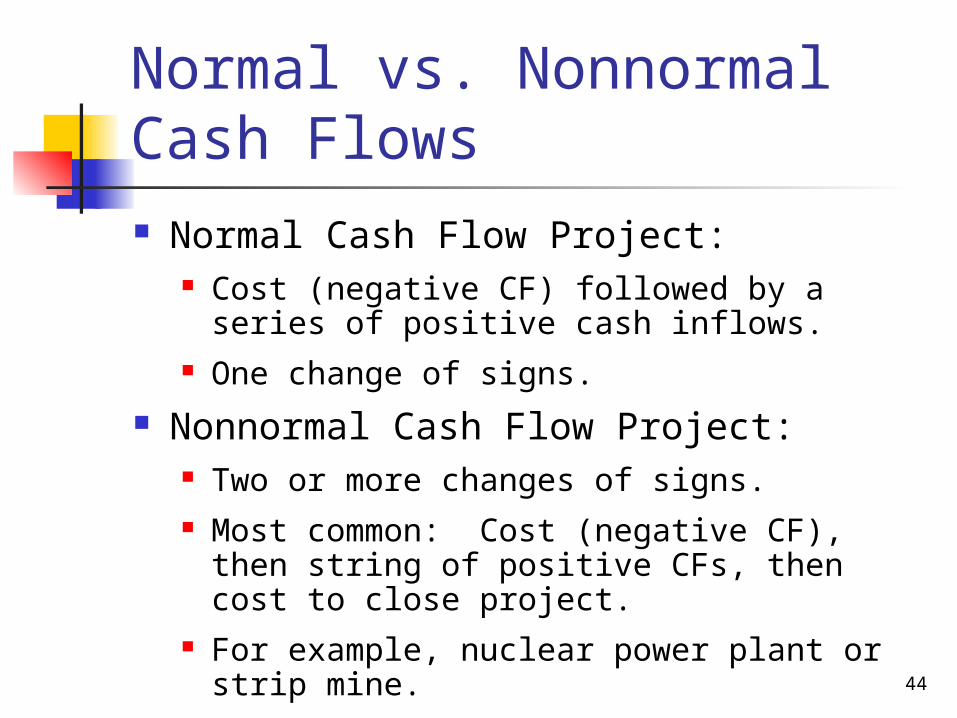
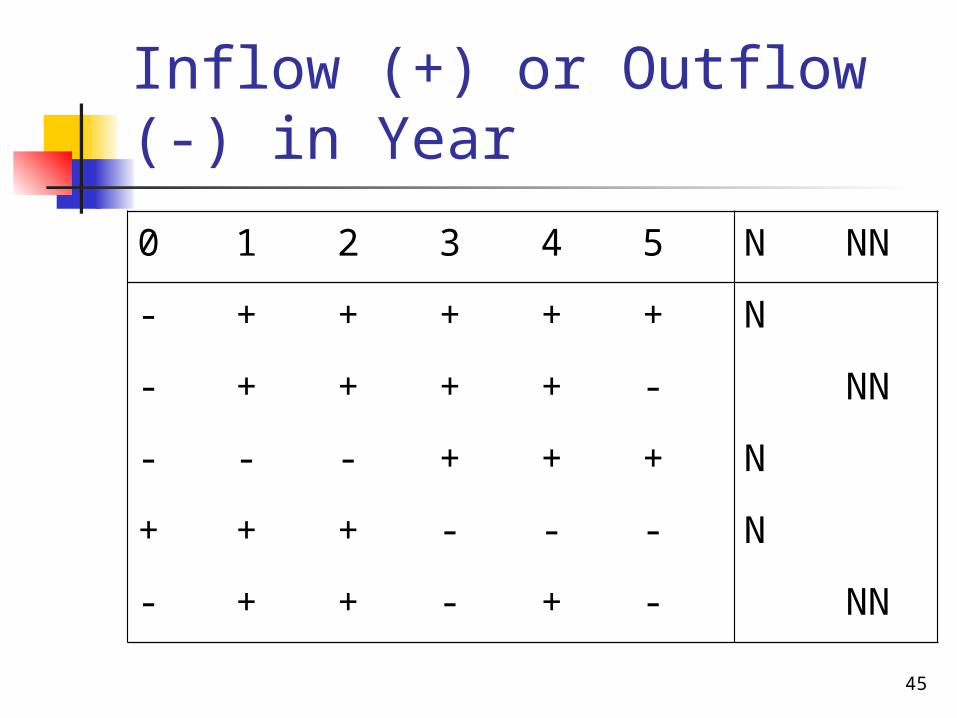
Normal vs. Nonnormal Cash Flows Normal Cash Flow Project:
Cost (negative CF) followed by a series of positive cash inflows.
One change of signs. Nonnormal Cash Flow Project:
Two or more changes of signs. Most common: Cost (negative CF), then
string of positive CFs, then cost to close project.
For example, nuclear power plant or strip mine.
45
Inflow (+) or Outflow (-) in Year
0 1 2 3 4 5 N NN
- + + + + + N
- + + + + - NN
- - - + + + N
+ + + - - - N
- + + - + - NN
46
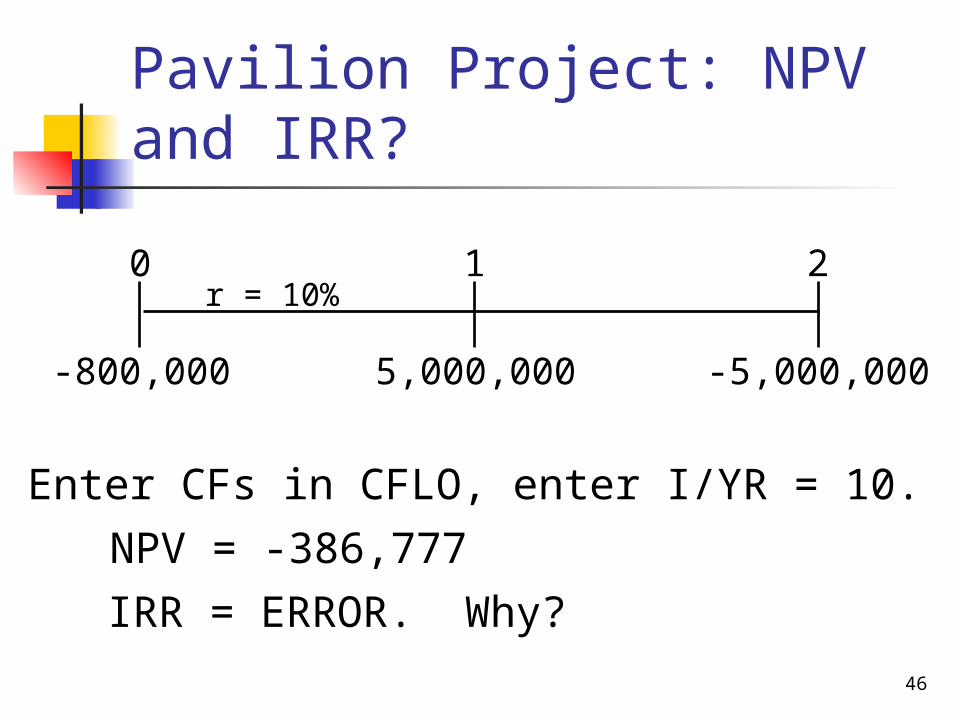
Pavilion Project: NPV and IRR?
5,000,000 -5,000,000
0 1 2r = 10%
-800,000
Enter CFs in CFLO, enter I/YR = 10.
NPV = -386,777
IRR = ERROR. Why?
47
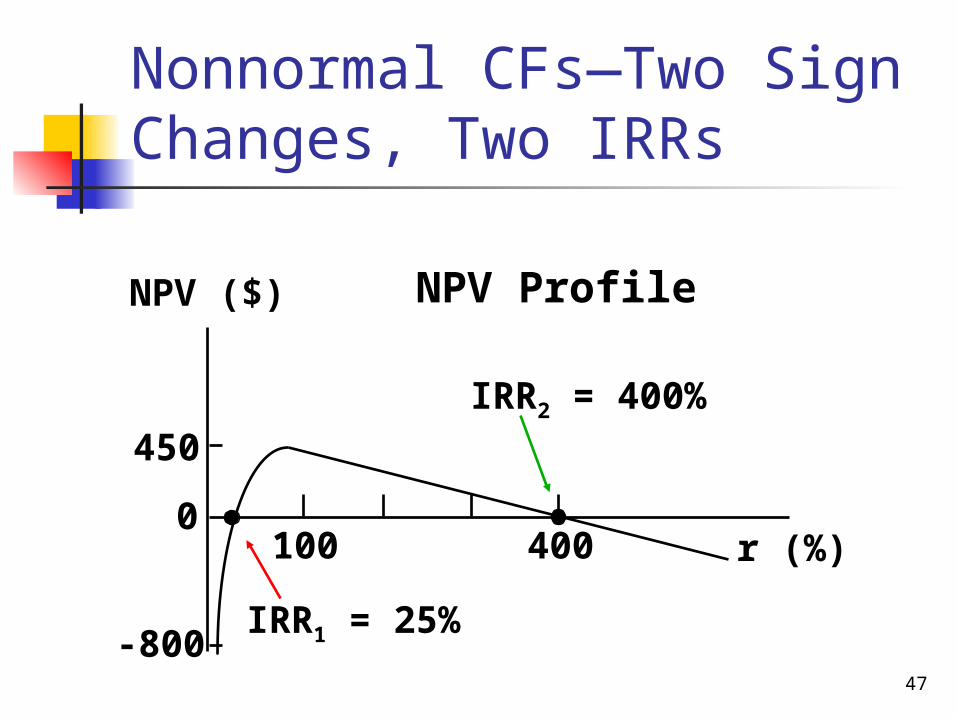
NPV Profile
450
-800
0400100
IRR2 = 400%
IRR1 = 25%
r (%)
NPV ($)
Nonnormal CFs—Two Sign Changes, Two IRRs
48
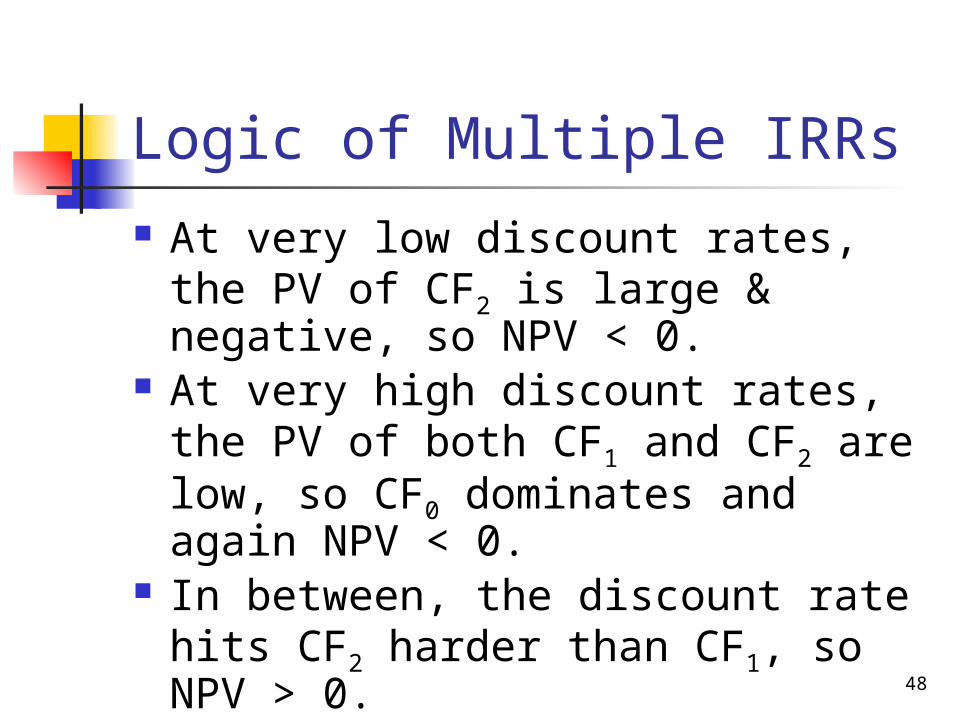
Logic of Multiple IRRs At very low discount rates, the PV
of CF2 is large & negative, so NPV < 0.
At very high discount rates, the PV of both CF1 and CF2 are low, so CF0 dominates and again NPV < 0.
In between, the discount rate hits CF2 harder than CF1, so NPV > 0.
Result: 2 IRRs.
49
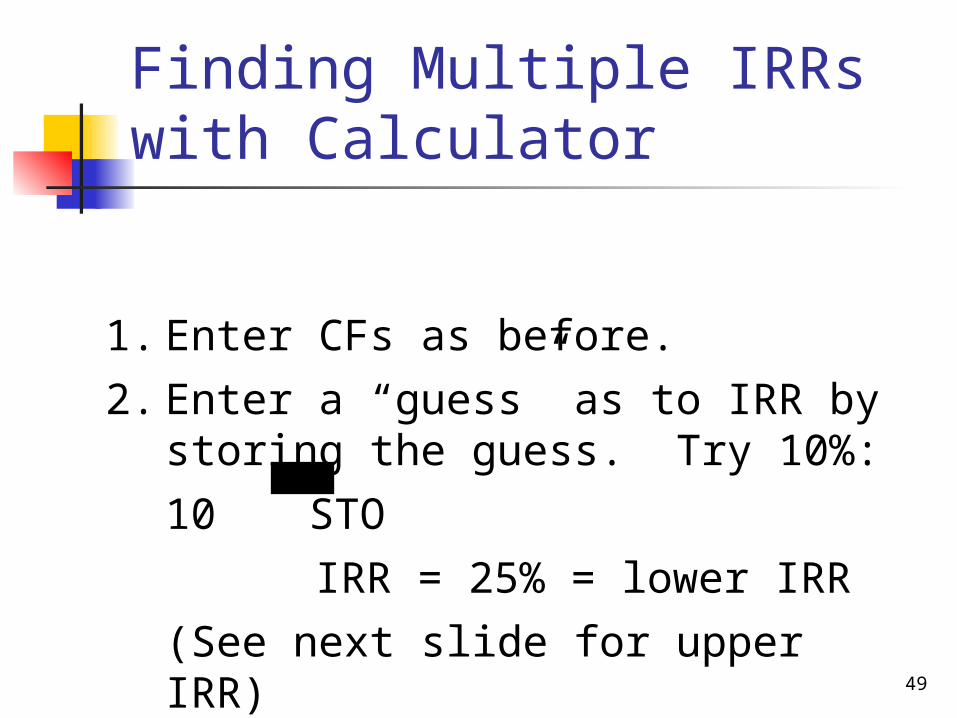
1. Enter CFs as before.
2. Enter a “guess” as to IRR by storing the guess. Try 10%:
10 STO
IRR = 25% = lower IRR
(See next slide for upper IRR)
Finding Multiple IRRs with Calculator
50
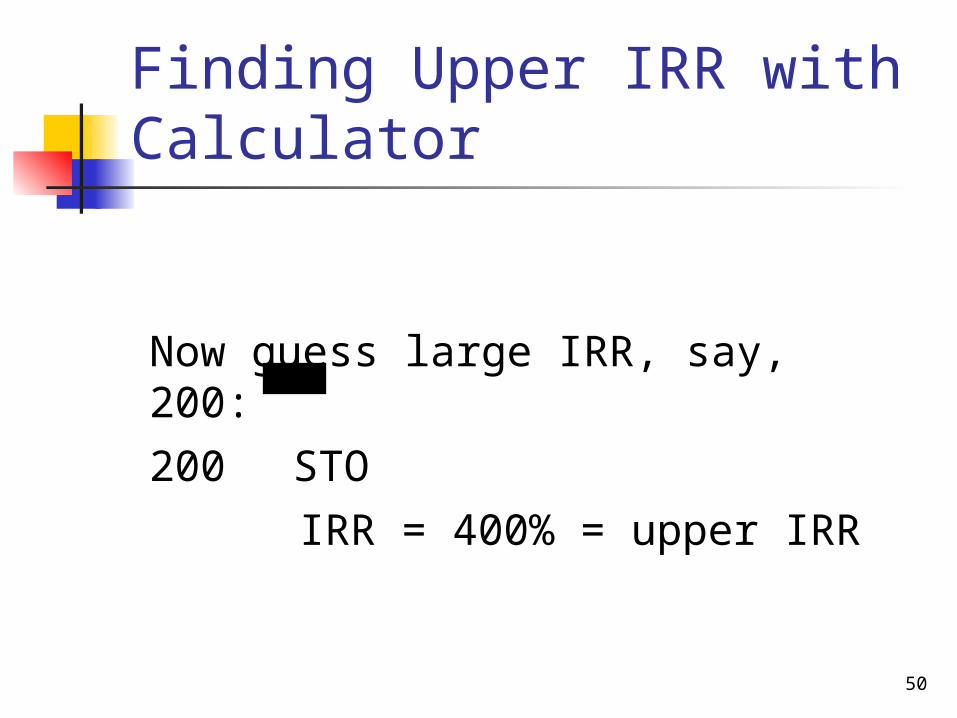
Now guess large IRR, say, 200:
200 STO
IRR = 400% = upper IRR
Finding Upper IRR with Calculator
51
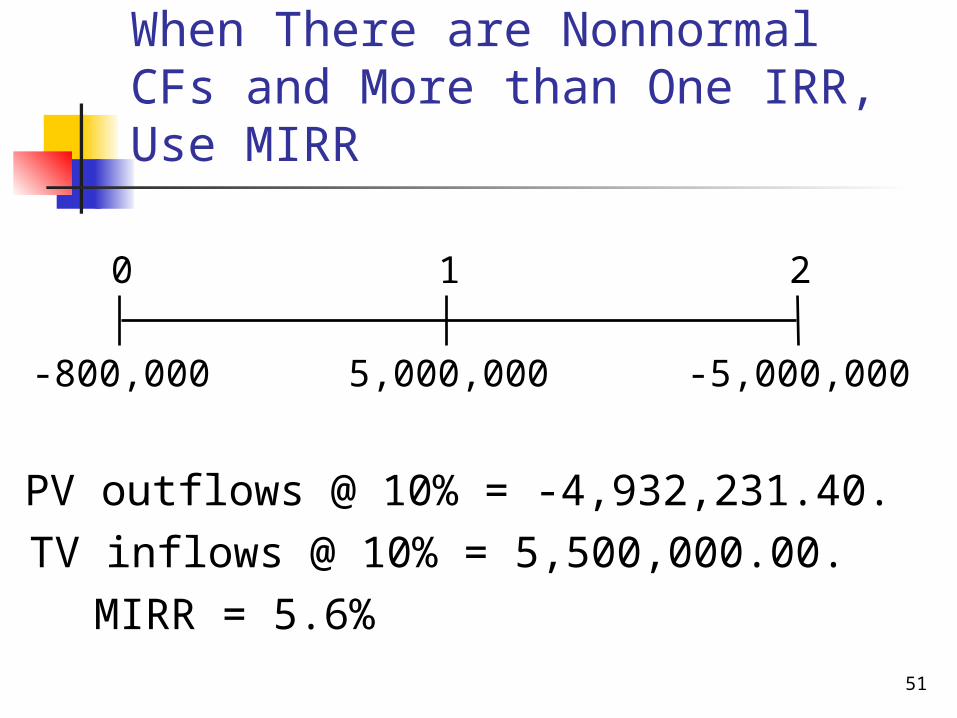
0 1 2
-800,000 5,000,000 -5,000,000
PV outflows @ 10% = -4,932,231.40.
TV inflows @ 10% = 5,500,000.00.
MIRR = 5.6%
When There are Nonnormal CFs and More than One IRR, Use MIRR
52
Accept Project P?
NO. Reject because MIRR = 5.6% < r = 10%.
Also, if MIRR < r, NPV will be negative: NPV = -$386,777.
53
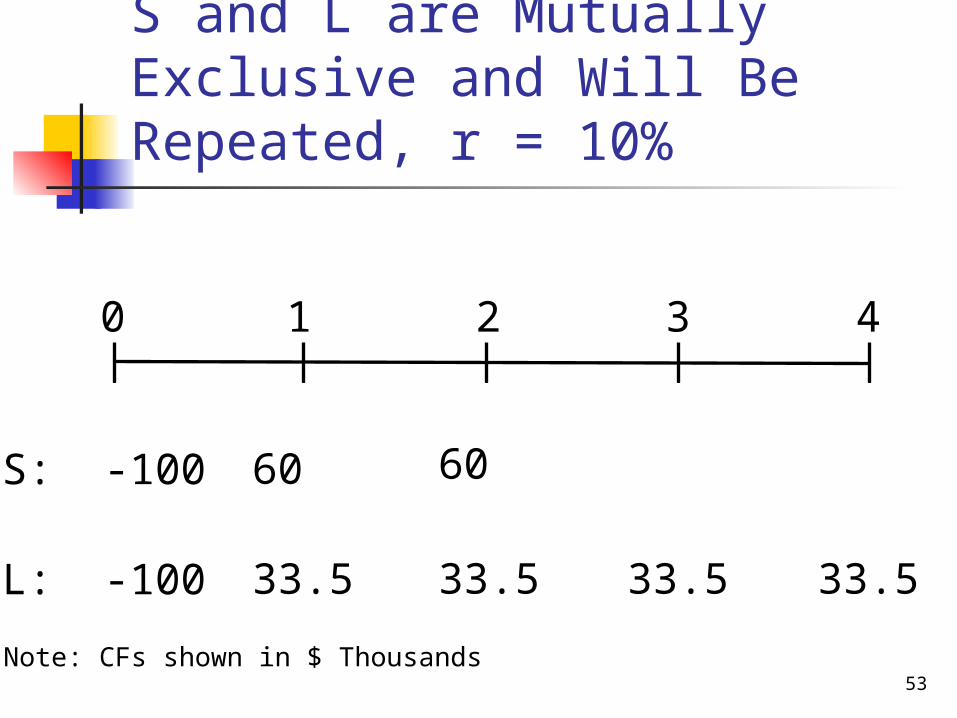
S and L are Mutually Exclusive and Will Be Repeated, r = 10%
0 1 2 3 4
S: -100
L: -100
60
33.5
60
33.5 33.5 33.5
Note: CFs shown in $ Thousands
54
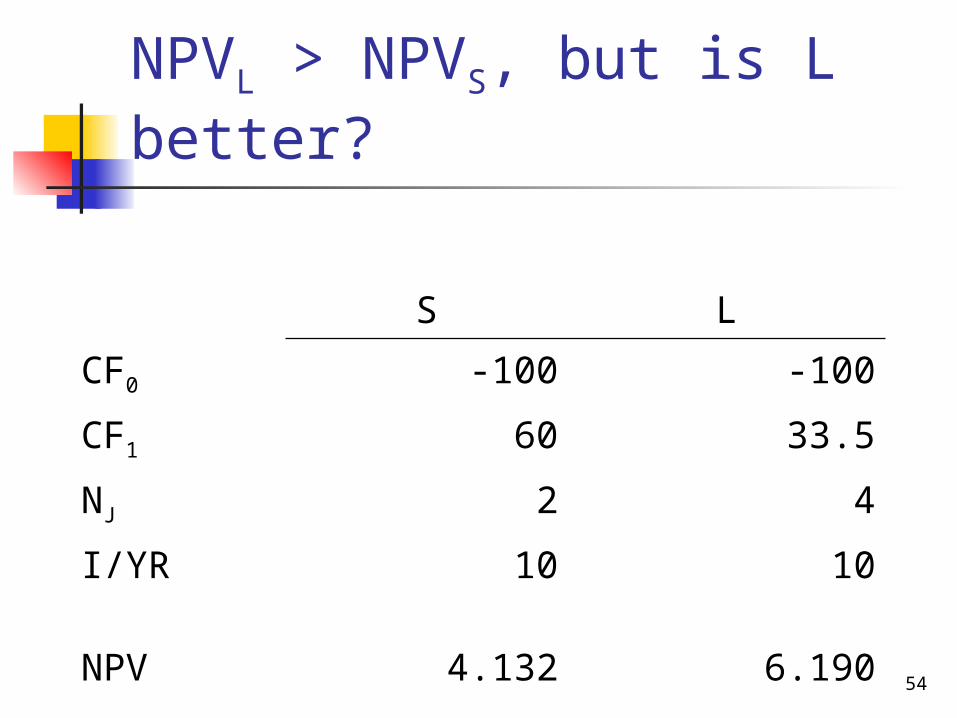
NPVL > NPVS, but is L better?
S LCF0 -100 -100
CF1 60 33.5
NJ 2 4
I/YR 10 10
NPV 4.132 6.190
55
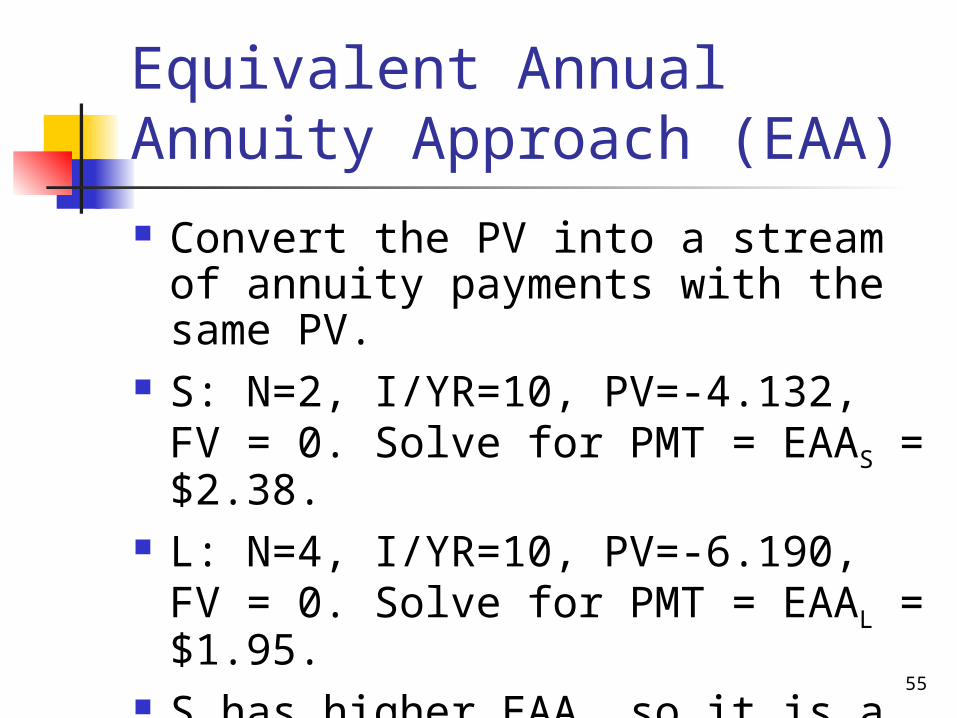
Equivalent Annual Annuity Approach (EAA) Convert the PV into a stream of
annuity payments with the same PV.
S: N=2, I/YR=10, PV=-4.132, FV = 0. Solve for PMT = EAAS = $2.38.
L: N=4, I/YR=10, PV=-6.190, FV = 0. Solve for PMT = EAAL = $1.95.
S has higher EAA, so it is a better project.
56
Put Projects on Common Basis Note that Franchise S could be
repeated after 2 years to generate additional profits.
Use replacement chain to put on common life.
Note: equivalent annual annuity analysis is alternative method.
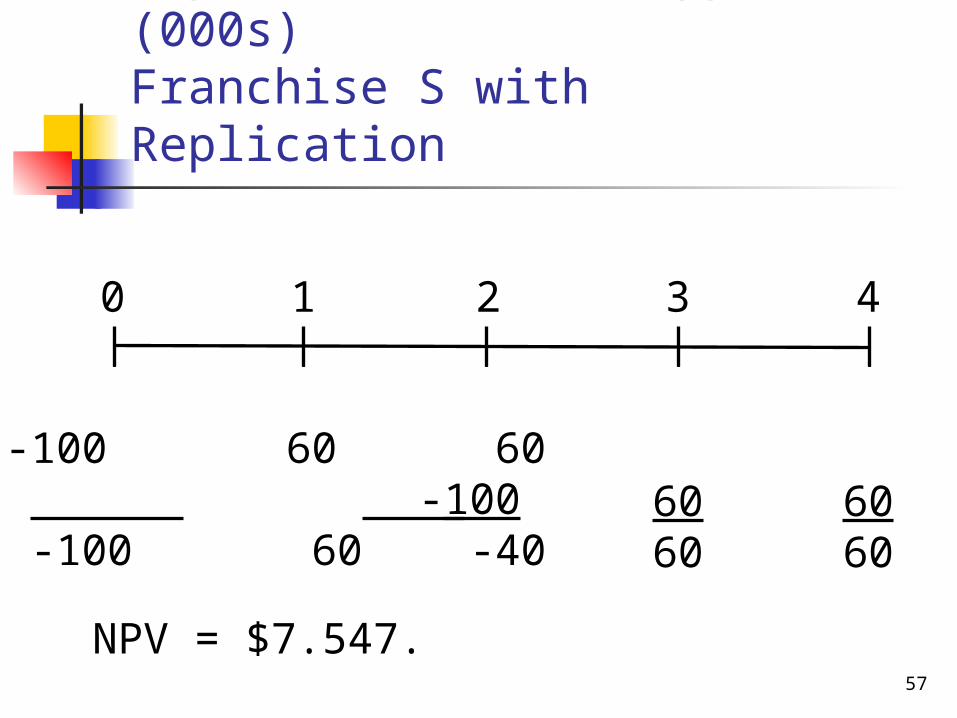
57
Replacement Chain Approach (000s)Franchise S with Replication
NPV = $7.547.
0 1 2 3 4
S: -100 60 -100 60
60-100 -40
6060
6060
58
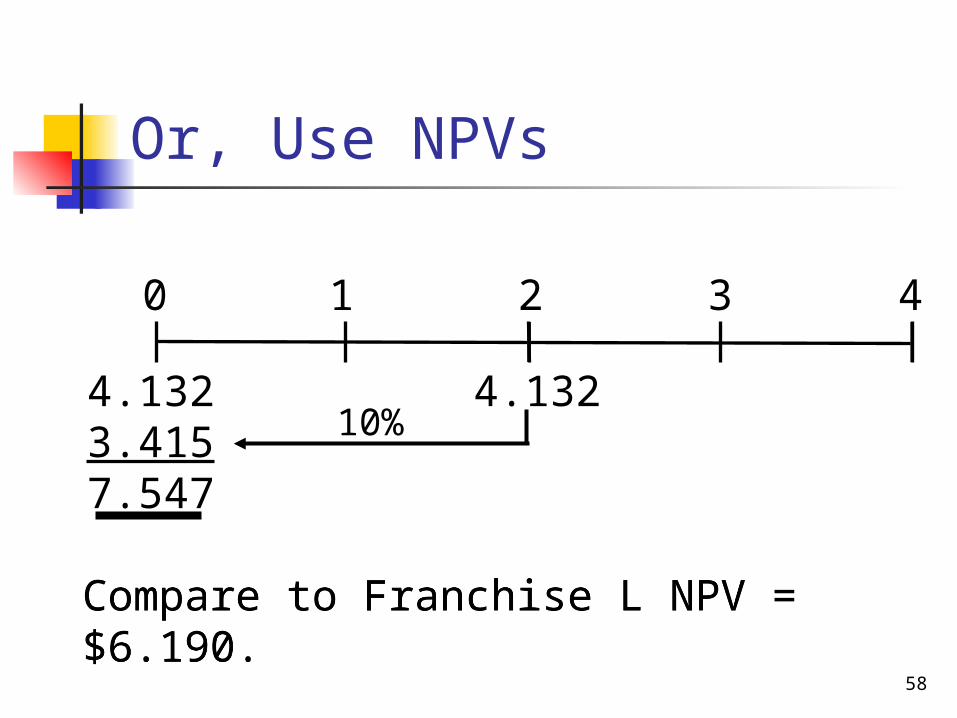
Compare to Franchise L NPV = $6.190.Compare to Franchise L NPV = $6.190.
0 1 2 3 4
4.1323.4157.547
4.13210%
Or, Use NPVs
59
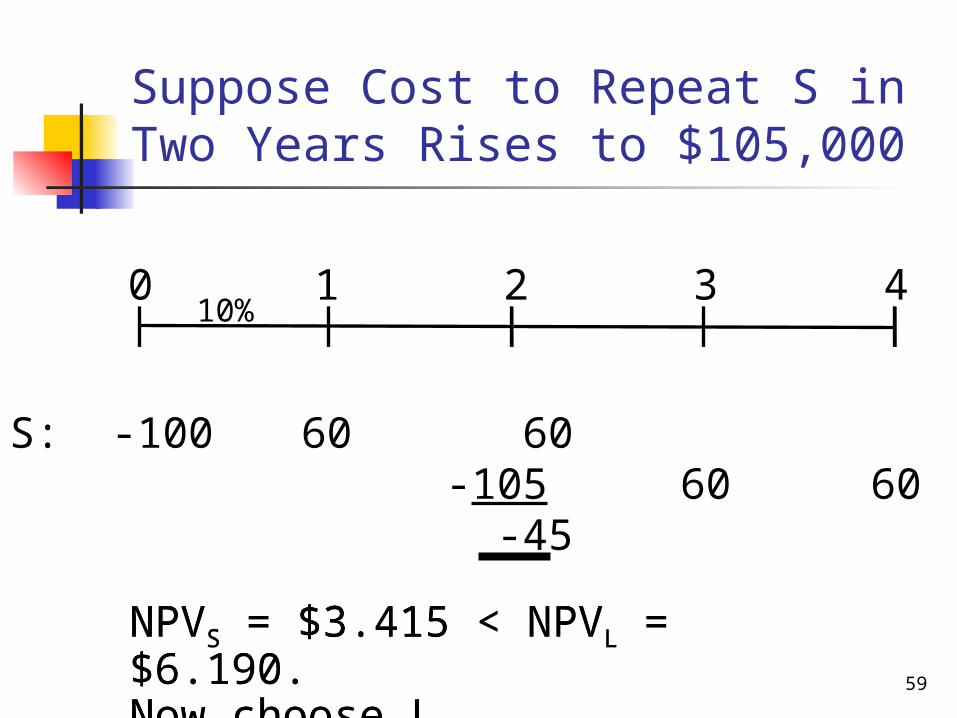
Suppose Cost to Repeat S in Two Years Rises to $105,000
NPVS = $3.415 < NPVL = $6.190.Now choose L.NPVS = $3.415 < NPVL = $6.190.Now choose L.
0 1 2 3 4
S: -100
60 60-105 -45
60 60
10%
60
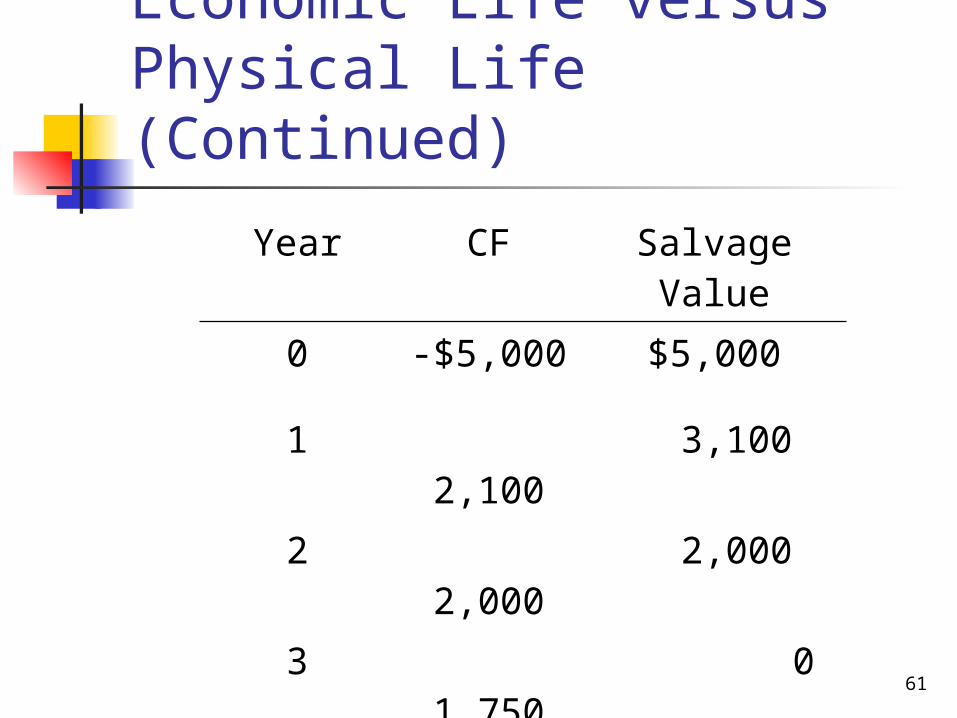
Economic Life versus Physical Life Consider another project with a 3-
year life. If terminated prior to Year 3, the
machinery will have positive salvage value.
Should you always operate for the full physical life?
See next slide for cash flows.
61
Economic Life versus Physical Life (Continued)
Year CF Salvage Value
0 -$5,000 $5,000
1 2,100 3,100
2 2,000 2,000
3 1,750 0
62
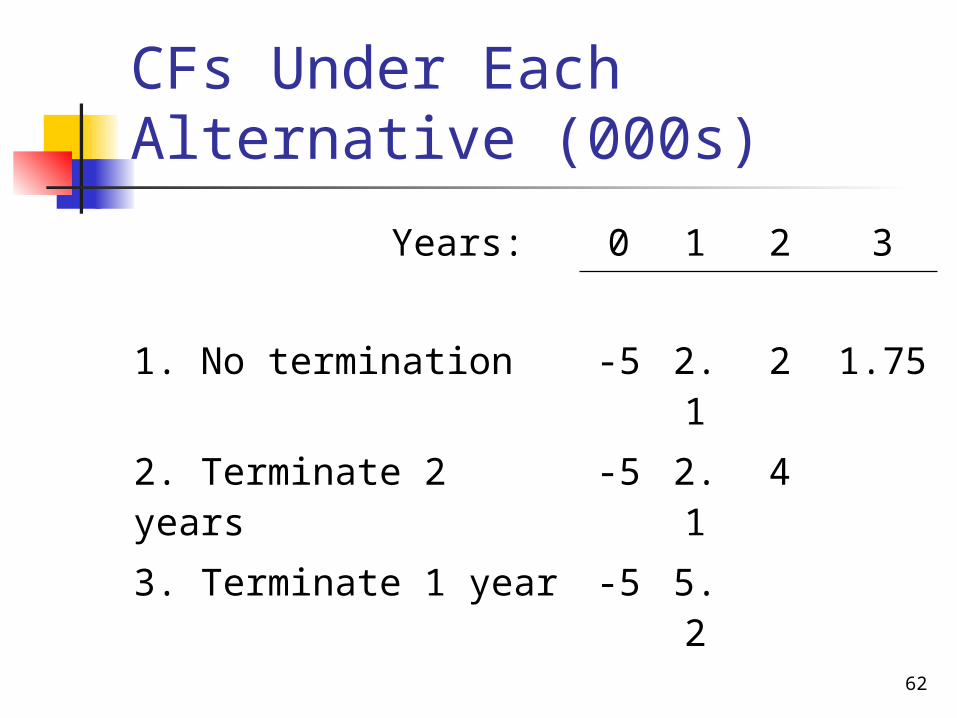
CFs Under Each Alternative (000s)
Years: 0 1 2 3
1. No termination -5 2.1
2 1.75
2. Terminate 2 years -5 2.1
4
3. Terminate 1 year -5 5.2
63
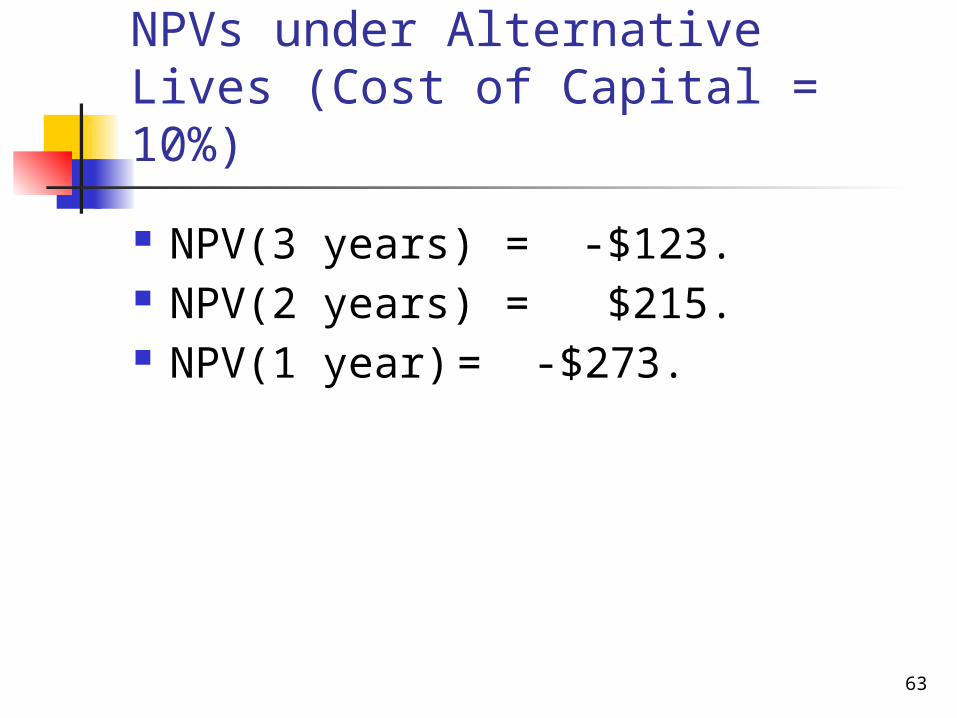
NPVs under Alternative Lives (Cost of Capital = 10%)
NPV(3 years) = -$123. NPV(2 years) = $215. NPV(1 year) = -$273.
64
Conclusions
The project is acceptable only if operated for 2 years.
A project’s engineering life does not always equal its economic life.
65
Choosing the Optimal Capital Budget
Finance theory says to accept all positive NPV projects.
Two problems can occur when there is not enough internally generated cash to fund all positive NPV projects: An increasing marginal cost of capital. Capital rationing
66
Increasing Marginal Cost of Capital
Externally raised capital can have large flotation costs, which increase the cost of capital.
Investors often perceive large capital budgets as being risky, which drives up the cost of capital.
(More...)
67
If external funds will be raised, then the NPV of all projects should be estimated using this higher marginal cost of capital.
68
Capital Rationing Capital rationing occurs when a
company chooses not to fund all positive NPV projects.
The company typically sets an upper limit on the total amount of capital expenditures that it will make in the upcoming year.
(More...)
69
Reason: Companies want to avoid the direct costs (i.e., flotation costs) and the indirect costs of issuing new capital.
Solution: Increase the cost of capital by enough to reflect all of these costs, and then accept all projects that still have a positive NPV with the higher cost of capital.(More...)
70
Reason: Companies don’t have enough managerial, marketing, or engineering staff to implement all positive NPV projects.
Solution: Use linear programming to maximize NPV subject to not exceeding the constraints on staffing.
(More...)
71
Reason: Companies believe that the project’s managers forecast unreasonably high cash flow estimates, so companies “filter” out the worst projects by limiting the total amount of projects that can be accepted.
Solution: Implement a post-audit process and tie the managers’ compensation to the subsequent performance of the project.