Embed Size (px)
Citation preview
1
1 Content
1 Content ................................................................................................................................................................. 1 2 Roles of the SBR .................................................................................................................................................. 2 2.1 Brief presentation of the issues and problems to be covered ...................................................................... 2 2.1.1 The SBR system.............................................................................................................................................. 2 2.1.2 Units and populations .................................................................................................................................... 3 2.1.3 Use of administrations in the SBR ................................................................................................................ 4 2.1.4 Use of Census Data......................................................................................................................................... 6 2.2 Annotated outline ........................................................................................................................................... 7 2.2.1 SBR Live Register .......................................................................................................................................... 7 2.2.2 SBR Backbone ................................................................................................................................................ 8 2.2.3 SBR Sample frame ....................................................................................................................................... 10 2.2.4 SBR Survey support .................................................................................................................................... 10 2.2.5 SBR Statistics ............................................................................................................................................... 11 2.2.6 SBR Global Data Exchange ........................................................................................................................ 13 2.2.6.1 International harmonisation of SBR ...................................................................................................... 13 2.2.6.2 Supra-national SBR approach................................................................................................................ 13 2.2.7 SBR Information source .............................................................................................................................. 15 2.3 Extension of the roles of the SBR................................................................................................................ 17 2.3.1 Satellites ........................................................................................................................................................ 17 2.3.2 Industrialisation ........................................................................................................................................... 17 2.3.3 Register-based Census ................................................................................................................................. 19
2
2 Roles of the SBR
2.1 Brief presentation of the issues and problems to be covered
Business statistics describe both production- and financial processes. These differ for nearly all
kinds of industry. Each industry has its own specific peculiarities, but is in some way also
connected to the others. The connections and differences of production- and financial processes
between industries can only be analysed if all target populations are derived in a similar and
coordinated way. It is much more practical and efficient when populations of statistical units are
stored and maintained in a single central database, the Statistical Business Register (SBR).
Traditionally the importance of the SBR in the production of business statistics is to derive high
quality survey frames, which are predefined by its elements: the statistical units. The main
statistical unit e.g. ‘enterprise’ used to be derived by profiling when a census was conducted.
Nowadays it is more common for many NSIs to compose the ‘enterprise’ by combining legal
units, which exist in one or more administrative sources. In that case the statistical unit is
automatically linked through the legal units to administrative units. This could help reducing the
response burden if more administrative data sources are utilised in the production of business
statistics.
New developments in the production of business statistics will extend the role and use of the
SBR. Globalisation, the increase in the use of administrative data, industrialisation and
upcoming new data sources (such as Big Data and data from the “cloud”) are some of the
developments that have to be taken into account when looking at the future use of the SBR.
In general the SBR should be the central place for an NSI where statistical units are derived and
maintained for all business related statistics. In this way the economic behaviour of business
populations could be compared in space and in time. But its coordinating role will become even
stronger when statistical compilers also refer and apply the units in the SBR without further
modifications. But this also depends on the quality of the sources used. In theory issues of over-
and under coverage should be solved in the SBR. However, in practice these issues are treated
when the final target population is determined by the statistician.
2.1.1 The SBR system
In general the growing demand for better, quicker and more detailed business statistics and the
need of policy makers for more comparable international business data force many NSIs to
extend the role of a SBR as a general multipurpose database.
The primary aim of the SBR is to maintain statistical units in order to derive ‘enterprise’
populations for business statistics. In a live environment, the Live Register of the SBR, new
information from the ‘source(s)’ is updated. In the SBR the information from the source(s) is
used to create and delete statistical units and standardise attributes according the subscribed
classifications of variables. It depends on the content, the quality and the availability of the
source(s) which kind of information is stored in the Live Register.
It is possible to link the information from all available sources directly to the SBR Live Register
and build a system which extracts a population from it to fulfill one specific role in the statistical
production process. However if an SBR should fulfill different purposes and should feed a
number of statistical production processes, then this system could become very complex.
Therefore it could be an option to split (groups of) roles of the SBR into distinctive subsystems
of the SBR.
For current and upcoming developments in the production of business statistics, such as
globalisation, the increase in the use of administrative data and upcoming new data sources, the
role of the SBR becomes even more important. The SBR is an important component in linking
3
and connecting data sources. As such, the SBR becomes a ‘gateway’ for business data by
combining both ‘traditional sources’ and ‘new media’. It also facilitates the new industrialised
and standardised production of statistics, both on a national and international level.
In this respect, a central role in the SBR will be fulfilled by a backbone, derived from the Live
Register. The backbone represents a set of statistical units valid for a specific reference period
with a limited number of coordinated characteristics (e.g. isic, nace, sizeclass). Hence the
backbone represents a coordinated population of statistical units in space and time. The
backbone should also provide the link between statistical and administrative units (for data
collection) for the reference period. Available data on the ‘administrative units’ which are
collected in other statistical processes or are stored and maintained in other registrations can be
linked to the backbone anytime. (e.g. registrations which are available at another moment in
time).
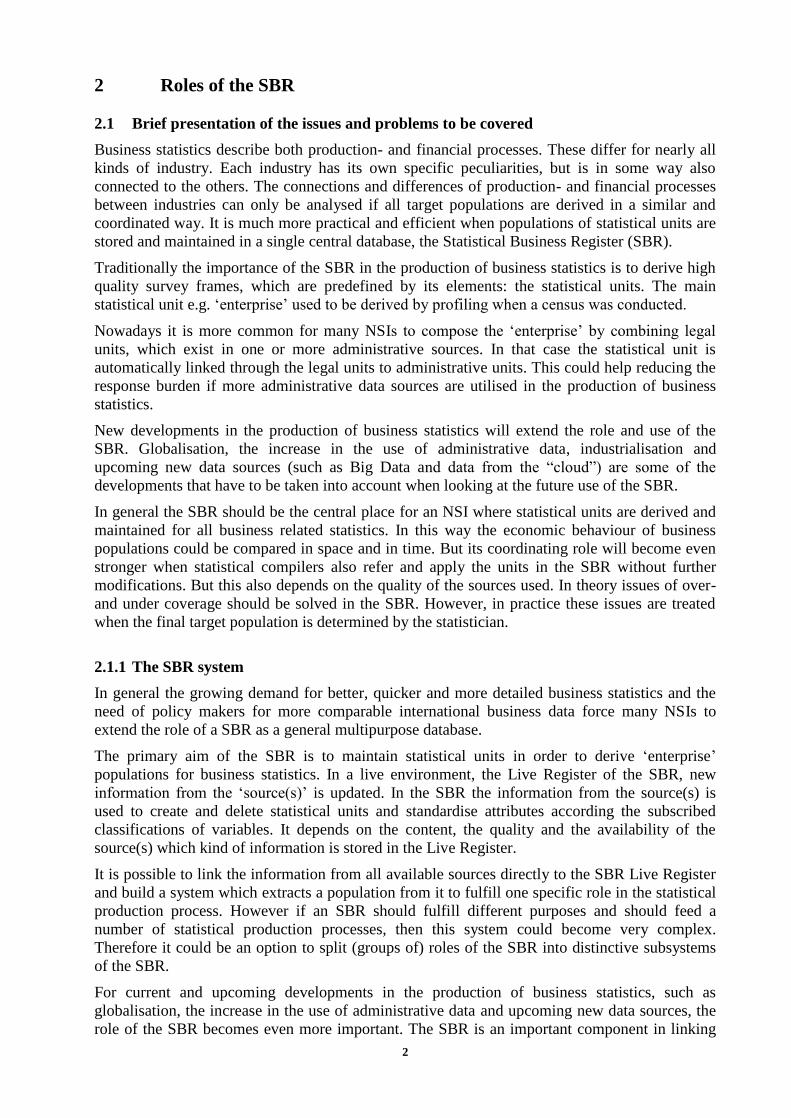
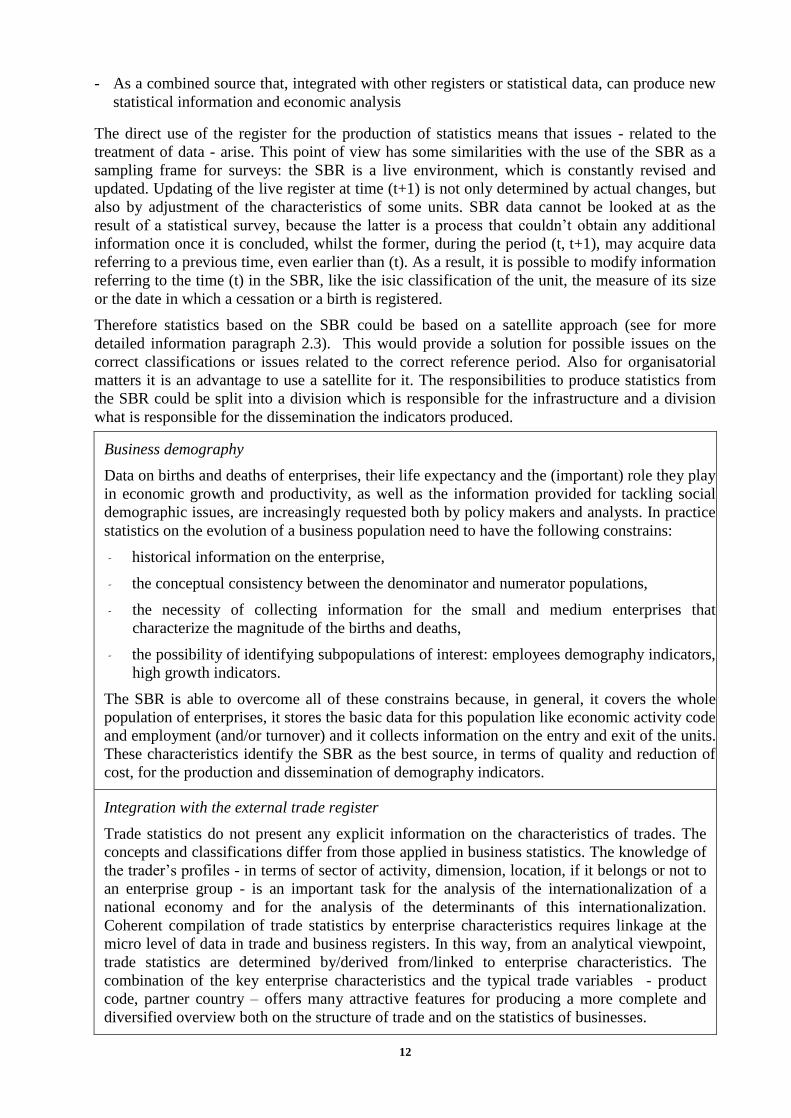
In the figure below, the roles of a SBR are listed in blue and could, but not necessary should,
represent a sub-system of the SBR. Each sub-system can require an extra information source as
input.
Figure 1: SBR System
2.1.2 Units and populations
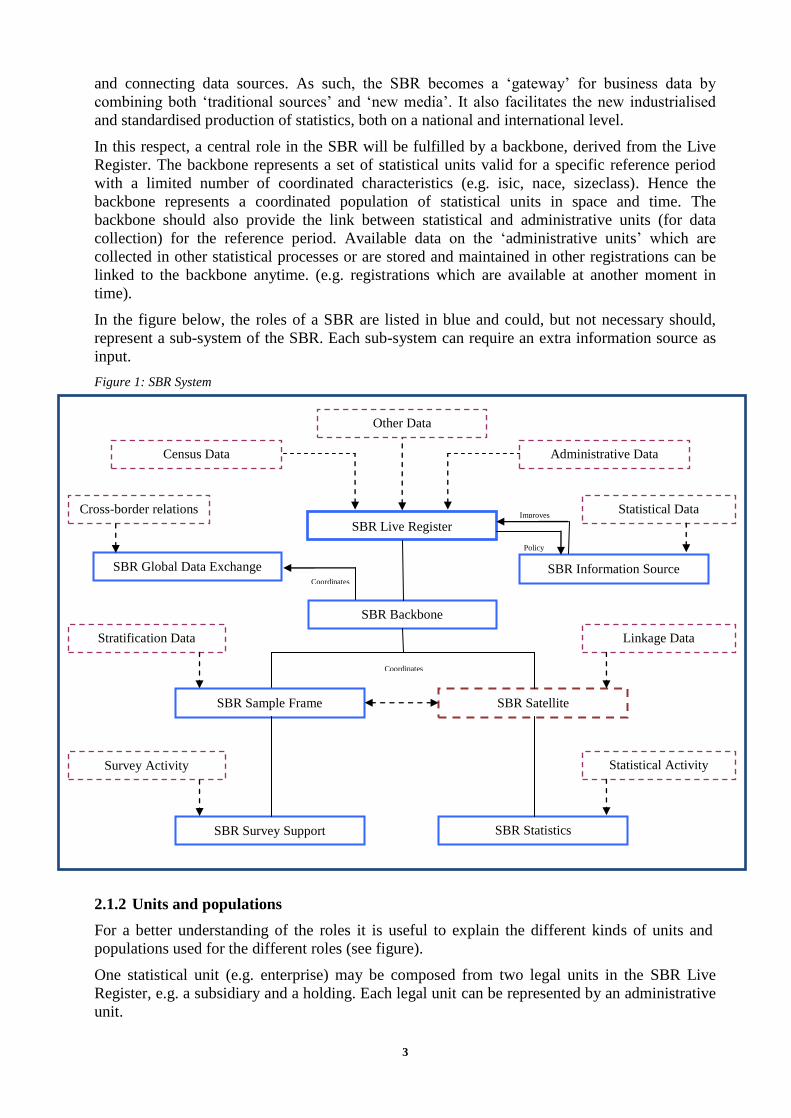
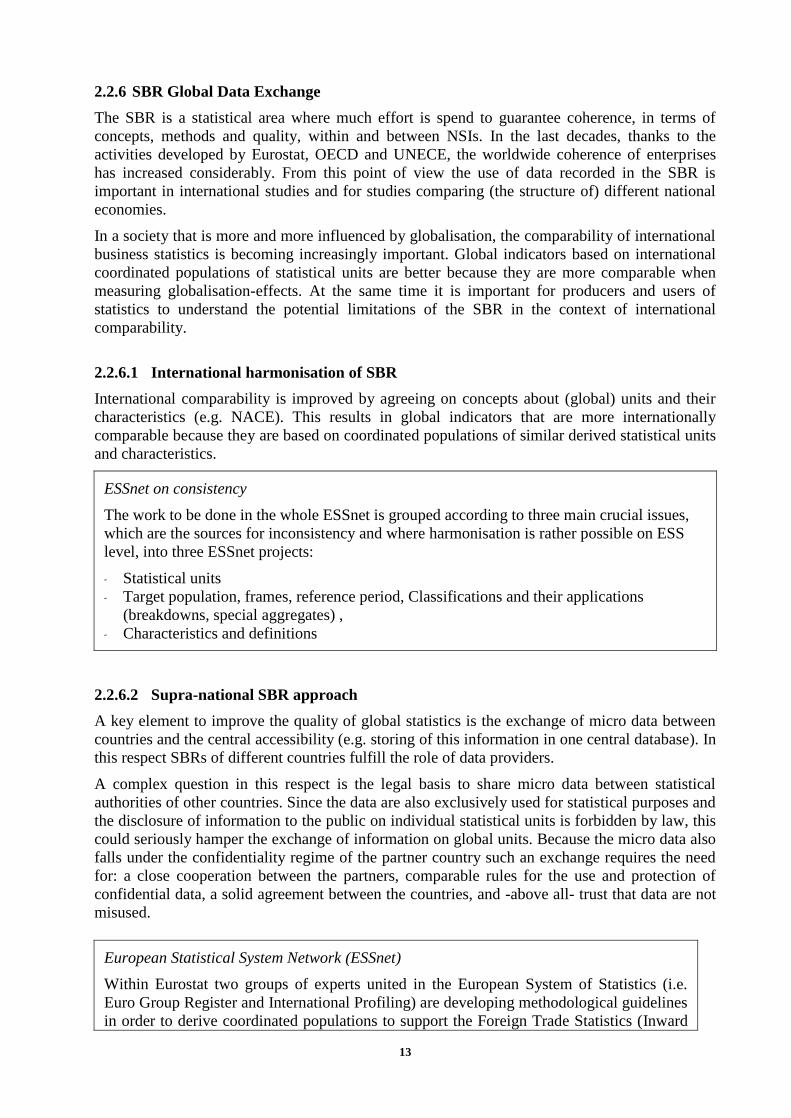
For a better understanding of the roles it is useful to explain the different kinds of units and
populations used for the different roles (see figure).
One statistical unit (e.g. enterprise) may be composed from two legal units in the SBR Live
Register, e.g. a subsidiary and a holding. Each legal unit can be represented by an administrative
unit.
SBR Live Register
SBR Backbone
Stratification Data
SBR Survey Support
SBR Satellite
Linkage Data
SBR Sample Frame
Survey Activity
SBR Statistics
Statistical Activity
SBR Information Source
Administrative Data Census Data
Improves
Coordinates
Coordinates
SBR Global Data Exchange
Cross-border relations Statistical Data
Policy
Other Data
4
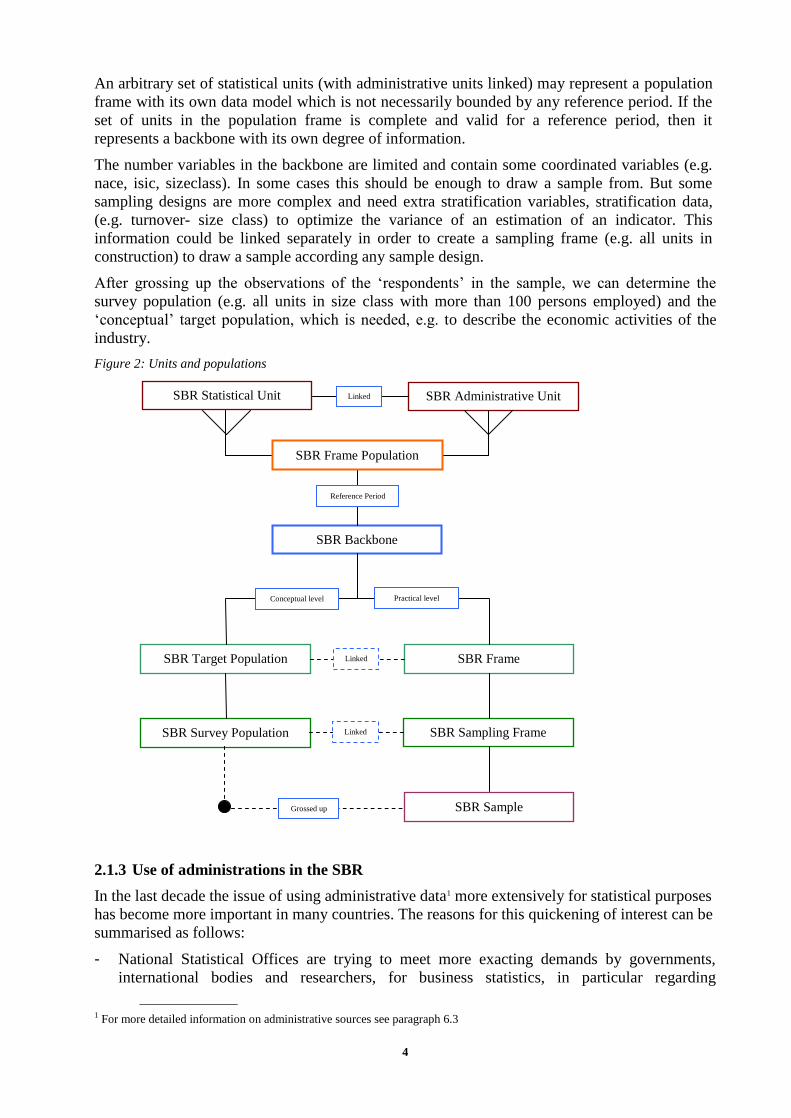
An arbitrary set of statistical units (with administrative units linked) may represent a population
frame with its own data model which is not necessarily bounded by any reference period. If the
set of units in the population frame is complete and valid for a reference period, then it
represents a backbone with its own degree of information.
The number variables in the backbone are limited and contain some coordinated variables (e.g.
nace, isic, sizeclass). In some cases this should be enough to draw a sample from. But some
sampling designs are more complex and need extra stratification variables, stratification data,
(e.g. turnover- size class) to optimize the variance of an estimation of an indicator. This
information could be linked separately in order to create a sampling frame (e.g. all units in
construction) to draw a sample according any sample design.
After grossing up the observations of the ‘respondents’ in the sample, we can determine the
survey population (e.g. all units in size class with more than 100 persons employed) and the
‘conceptual’ target population, which is needed, e.g. to describe the economic activities of the
industry.
Figure 2: Units and populations
2.1.3 Use of administrations in the SBR
In the last decade the issue of using administrative data1 more extensively for statistical purposes
has become more important in many countries. The reasons for this quickening of interest can be
summarised as follows:
- National Statistical Offices are trying to meet more exacting demands by governments,
international bodies and researchers, for business statistics, in particular regarding
1 For more detailed information on administrative sources see paragraph 6.3
SBR Statistical Unit
SBR Target Population
SBR Administrative Unit
SBR Frame
Linked
SBR Backbone
Practical level Conceptual level
Reference Period
SBR Frame Population
Linked
SBR Survey Population SBR Sampling Frame
SBR Sample
Linked
Grossed up
5
microeconomic analysis of small areas, specific sectors of activity and for particular
aggregates. At the same time they are under pressures to reduce the costs of data collection
and the response burden.
- Recent advances in information technology have made it easier to handle large amounts of
data and have opened up new possibilities for linking different statistical and administrative
databases at a massive scale.
- Administrative sources often give complete, or almost complete, coverage of the target
population, whereas sample surveys only cover a relatively small proportion. The use of
administrative sources therefore decreases or may even eliminate survey errors, removes (or
significantly reduces) non-response, and provides more accurate and detailed estimates for
various sub-populations.
The majority of NSIs setup and update their SBR using one or more administrative sources (Tax
Records, Chambers of Commerce etc.). They represent the universe of the legal units from
which the target population of the register is extracted and build. Administrative sources also
provide direct information for some essential SBR variables, such as: enterprise or legal unit
name, location of local units, legal status. Furthermore they provide indirect information for
some other important variables, such as: nace, isic, size class, demographic events, etc. In
general the SBR is the first ‘contact point’ between administrative and statistical authorities.
The role of first (in terms of time) and main (in terms of relevance) ‘actor’ is fundamental
especially in opening a door to the use of administrative sources in the statistical domain.
Since one function of the register is to enable information in administrative files to be generally
used for statistics, cross-links with those files must be maintained. The methodological and
conceptual aspects for the integration of the data in different administrative files are founded in
the capacity of the SBR to carry out a physical connection between records in different sources
referring to the same unit. The record linkage process identifies the same entity in different files.
Enabling the use of automatic linkage procedures requires identification variables, such as:
identification code, name, address, etc. The availability of a common business identification
code, shared with fiscal and other government departments, greatly facilitate the connection of
the SBRs with other registers. Its absence requires the use of complex record linkage procedures
based on different variables (e.g. name, address, nace, isic).
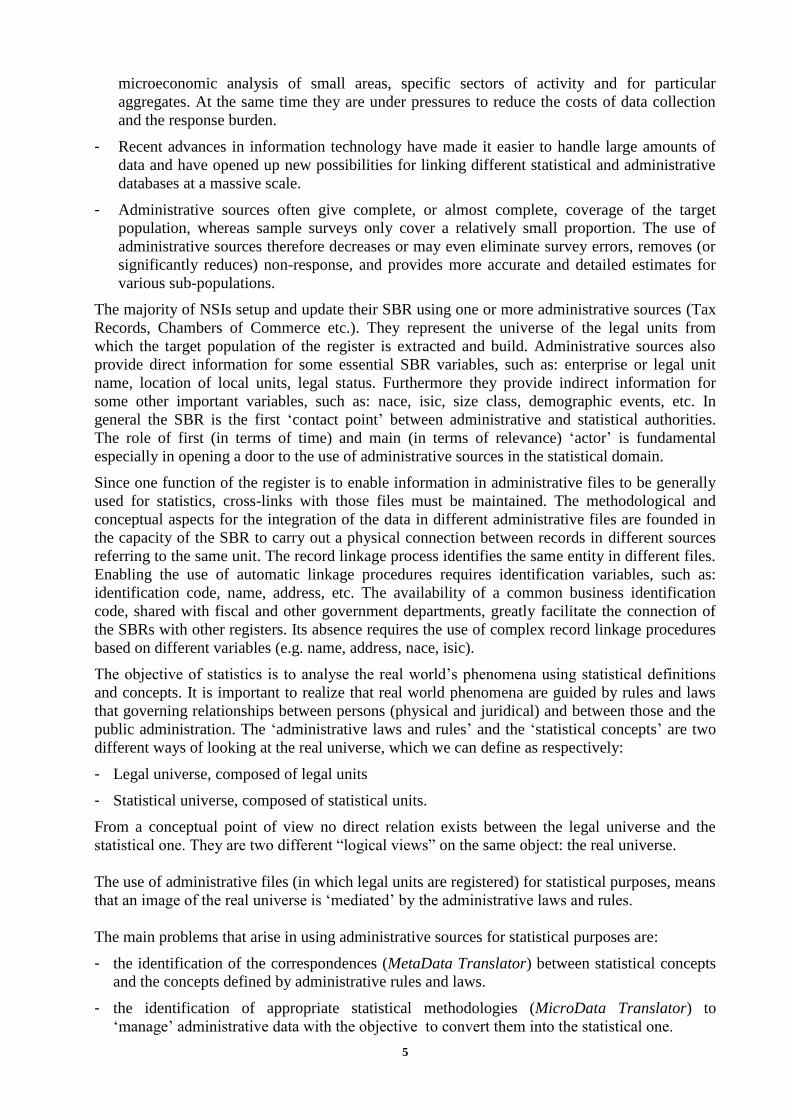
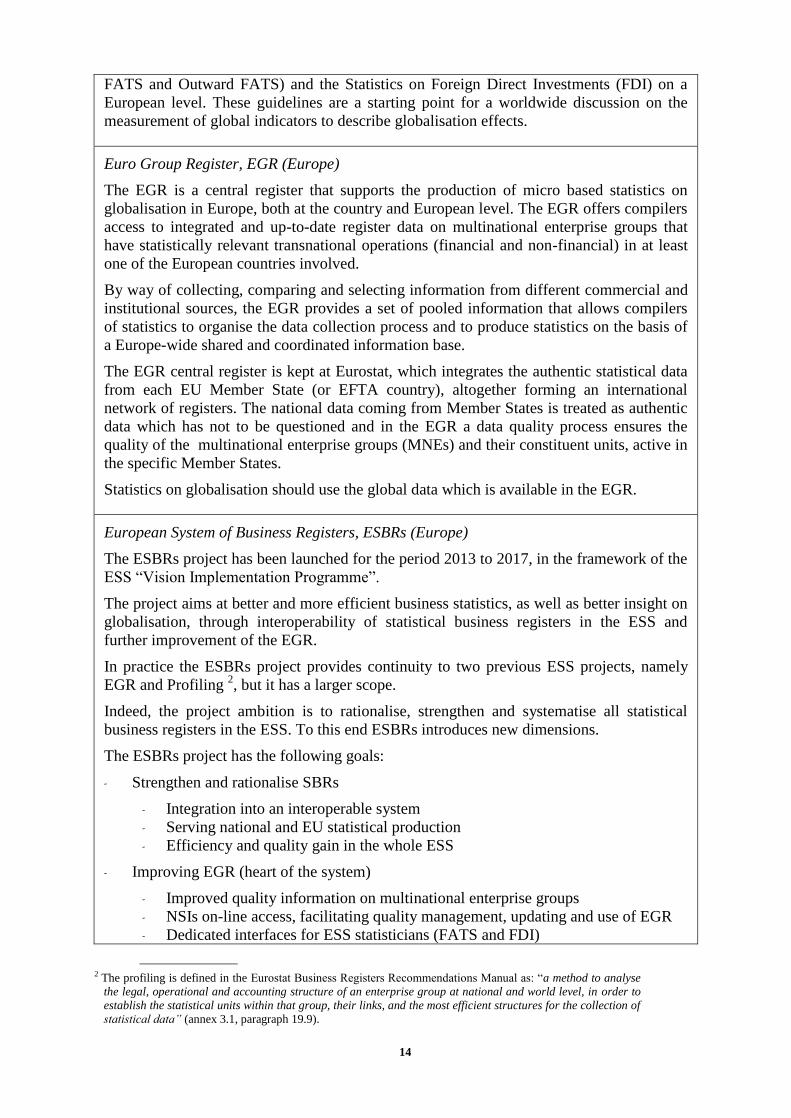
The objective of statistics is to analyse the real world’s phenomena using statistical definitions
and concepts. It is important to realize that real world phenomena are guided by rules and laws
that governing relationships between persons (physical and juridical) and between those and the
public administration. The ‘administrative laws and rules’ and the ‘statistical concepts’ are two
different ways of looking at the real universe, which we can define as respectively:
- Legal universe, composed of legal units
- Statistical universe, composed of statistical units.
From a conceptual point of view no direct relation exists between the legal universe and the
statistical one. They are two different “logical views” on the same object: the real universe.
The use of administrative files (in which legal units are registered) for statistical purposes, means
that an image of the real universe is ‘mediated’ by the administrative laws and rules.
The main problems that arise in using administrative sources for statistical purposes are:
- the identification of the correspondences (MetaData Translator) between statistical concepts
and the concepts defined by administrative rules and laws.
- the identification of appropriate statistical methodologies (MicroData Translator) to
‘manage’ administrative data with the objective to convert them into the statistical one.
6
Figure 3: Link between statistical and administrative universe
2.1.4 Use of Census Data
In some countries the census is one of the main sources to derive a central sample frame in order
to conduct and coordinate their business surveys. In order to fulfill the role of a live register for a
SBR, the register should at least consist of a statistical unit which approximates the valid
(theoretical) international definition of the central economic unit (e.g. enterprise) and the
economic activity of it. Also a predefined maintenance strategy is a main characteristic to
become a SBR. The units in the SBR should be maintained and updated with the most recent
information available that is valid for a specific reference year (time-stamps). The information of
surveys or available administrative sources could be used to set up a maintenance procedure.
Although with less functionality (e.g. without the link between statistical and a legal or
administrative unit), a backbone which consists of the identifications of statistical units can be
derived from it for statistical purposes (e.g. the frozen states of the actual and historical frames
with the reference year as time-stamp could be composed as the backbone).
SBR in China
Since 2010, China’s BR has obtained big progress in constructing and utilizing a central
frame. The frame for “above threshold” enterprises was built, and we have institutionalized
that “each survey must use the unified register as sampling frame, and any unit that is not
included in the register should not be selected as a respondent”.
China conducts the national economic census once five years, in the years ended with 3 or 8.
The respondents are legal units, establishments and individual business engaged in the second
industry and tertiary industry national wide. Specifically, the following sectors are covered:
mining, manufacturing, production and supply of electricity, gas and water, construction,
transport, storage and post, information transmission, computer services and software,
wholesale and retail trades, hotels and catering services, financial intermediation, real estate,
leasing and business services, scientific research, technical services and geologic prospecting,
management of water conservancy, environment and public facilities, services to households
and other services, education, health, social security and social welfare, culture, sport and
entertainment, public management and social organization etc. Up until 2010, the Chinese
SBR has been totally updated by the results of the first and second economic census (2004
and 2008).
To raise the quality and the usability of the Chinese SBR, the challenge for Statistics China is
Meta Data Translator
defined defined
applied applied
Real
Universe
Statistical
concepts
Laws and
Admin rules
Legal
Universe
Statistical
Universe Micro Data Translator
7
to integrate various administrative data, improve the general maintenance strategy and
improve the coverage of the SBR with small and medium enterprises below the predefined
threshold.
2.2 Annotated outline
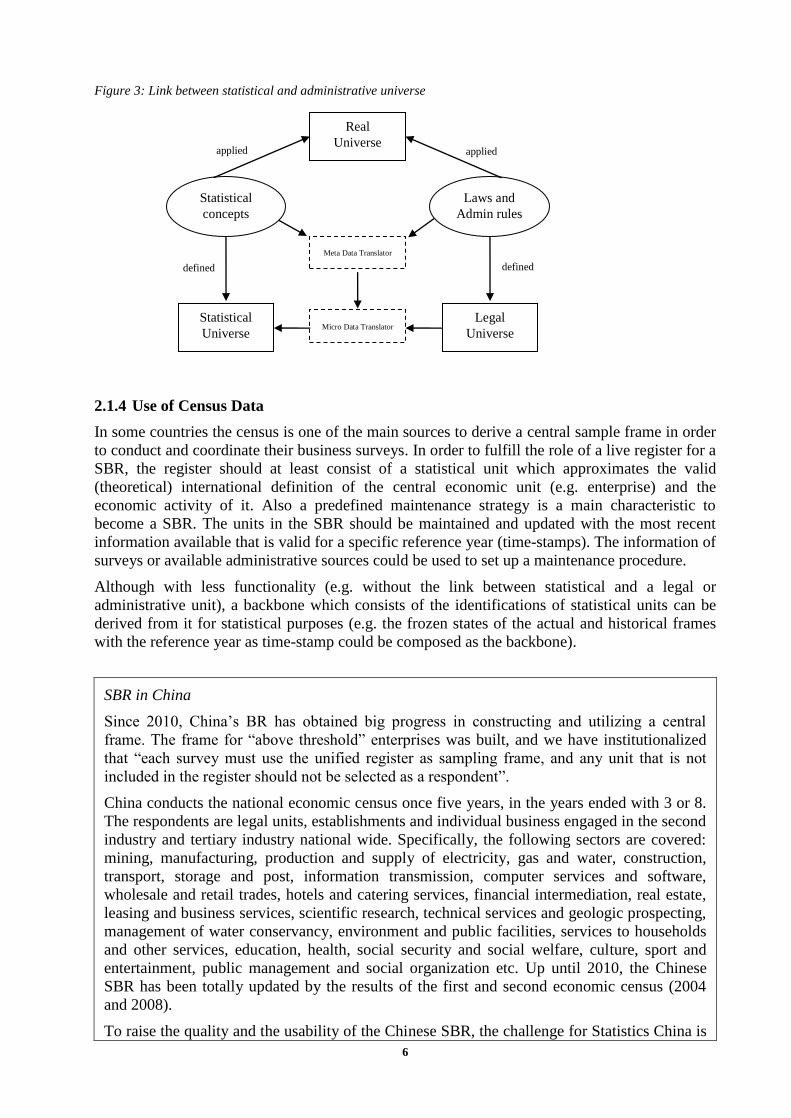
This paragraph describes the different roles a SBR fulfills. The different roles and goals of the
SBR are listed below. For each role a best practice example is listed.
Table 1 - Overview of the roles of the SBR
Role Goal Example
1 SBR Live Register The gateway between (different)
source(s) and the statistical units
Floating administrative units
2 SBR Backbone Coordinate populations of statistical and
administrative units in space and time.
Backbone for Business
Statistics (the Netherlands)
3 SBR Sample frame Provide set of administrative units valid
for the reference period with all
attributes to draw a sample.
Live register and Target
area
4 SBR Survey
support
Control administrative burden and
monitor survey response
Survey holiday
The SBR and the
enforcement information
(the Netherlands)
5 SBR Statistics Statistical information based on
registers.
Business Demography
Statistics (Europe)
6 SBR Global data
exchange
Coherence in global statistics European Statistical System
Network (ESSnet);
Euro Group Register, EGR
(Europe)
7 SBR Information
source
Support market investigation
performance
Use of GIS (Mexico)
2.2.1 SBR Live Register
Statistical units in economic statistics are the reporting units that describe populations of
companies with ‘similar’ production- of financial processes. An important role of the SBR is to
maintain and keep track of the changes of statistical units and their characteristics due to real life
events. This is a continuous process in which constant modifications of a collection of statistical
units occur in time and space. The degree of modifications depends on the update strategy of the
SBR. In this respect the SBR can be considered as a kind of ‘Live Register’ in which the
composition of units constantly changes over time.
In the Live Register statistical units are derived and the decision is made whether a statistical
unit keeps its identity in the SBR, is deleted from the SBR or is registered as a new unit.
Monitoring the continuity of statistical units is important in the maintenance of the SBR.
8
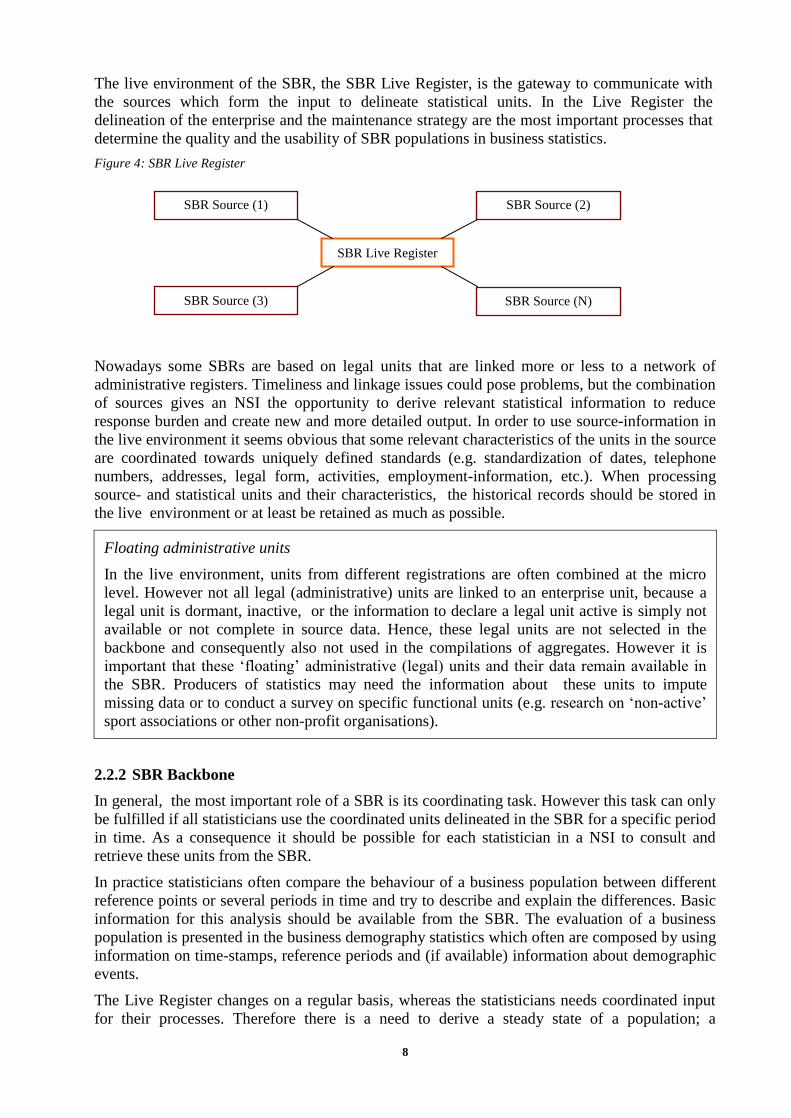
The live environment of the SBR, the SBR Live Register, is the gateway to communicate with
the sources which form the input to delineate statistical units. In the Live Register the
delineation of the enterprise and the maintenance strategy are the most important processes that
determine the quality and the usability of SBR populations in business statistics.
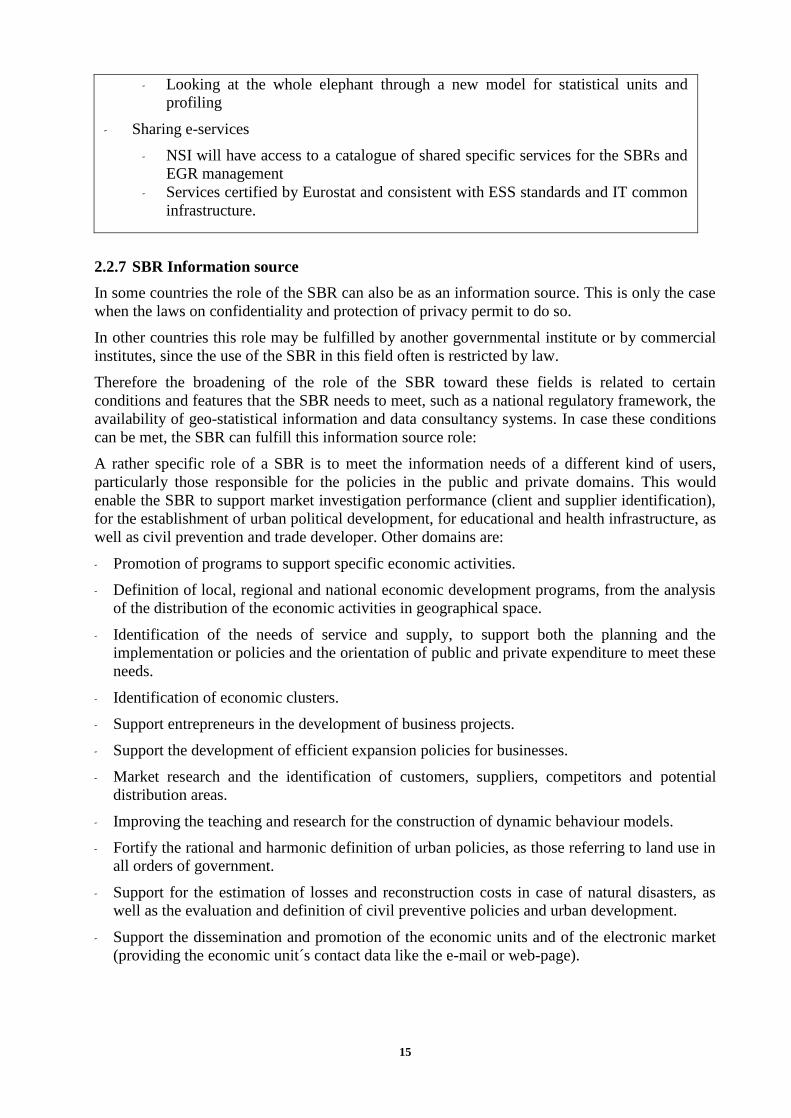
Figure 4: SBR Live Register
Nowadays some SBRs are based on legal units that are linked more or less to a network of
administrative registers. Timeliness and linkage issues could pose problems, but the combination
of sources gives an NSI the opportunity to derive relevant statistical information to reduce
response burden and create new and more detailed output. In order to use source-information in
the live environment it seems obvious that some relevant characteristics of the units in the source
are coordinated towards uniquely defined standards (e.g. standardization of dates, telephone
numbers, addresses, legal form, activities, employment-information, etc.). When processing
source- and statistical units and their characteristics, the historical records should be stored in
the live environment or at least be retained as much as possible.
Floating administrative units
In the live environment, units from different registrations are often combined at the micro
level. However not all legal (administrative) units are linked to an enterprise unit, because a
legal unit is dormant, inactive, or the information to declare a legal unit active is simply not
available or not complete in source data. Hence, these legal units are not selected in the
backbone and consequently also not used in the compilations of aggregates. However it is
important that these ‘floating’ administrative (legal) units and their data remain available in
the SBR. Producers of statistics may need the information about these units to impute
missing data or to conduct a survey on specific functional units (e.g. research on ‘non-active’
sport associations or other non-profit organisations).
2.2.2 SBR Backbone
In general, the most important role of a SBR is its coordinating task. However this task can only
be fulfilled if all statisticians use the coordinated units delineated in the SBR for a specific period
in time. As a consequence it should be possible for each statistician in a NSI to consult and
retrieve these units from the SBR.
In practice statisticians often compare the behaviour of a business population between different
reference points or several periods in time and try to describe and explain the differences. Basic
information for this analysis should be available from the SBR. The evaluation of a business
population is presented in the business demography statistics which often are composed by using
information on time-stamps, reference periods and (if available) information about demographic
events.
The Live Register changes on a regular basis, whereas the statisticians needs coordinated input
for their processes. Therefore there is a need to derive a steady state of a population; a
SBR Source (1)
SBR Live Register
SBR Source (2)
SBR Source (3) SBR Source (N)
9
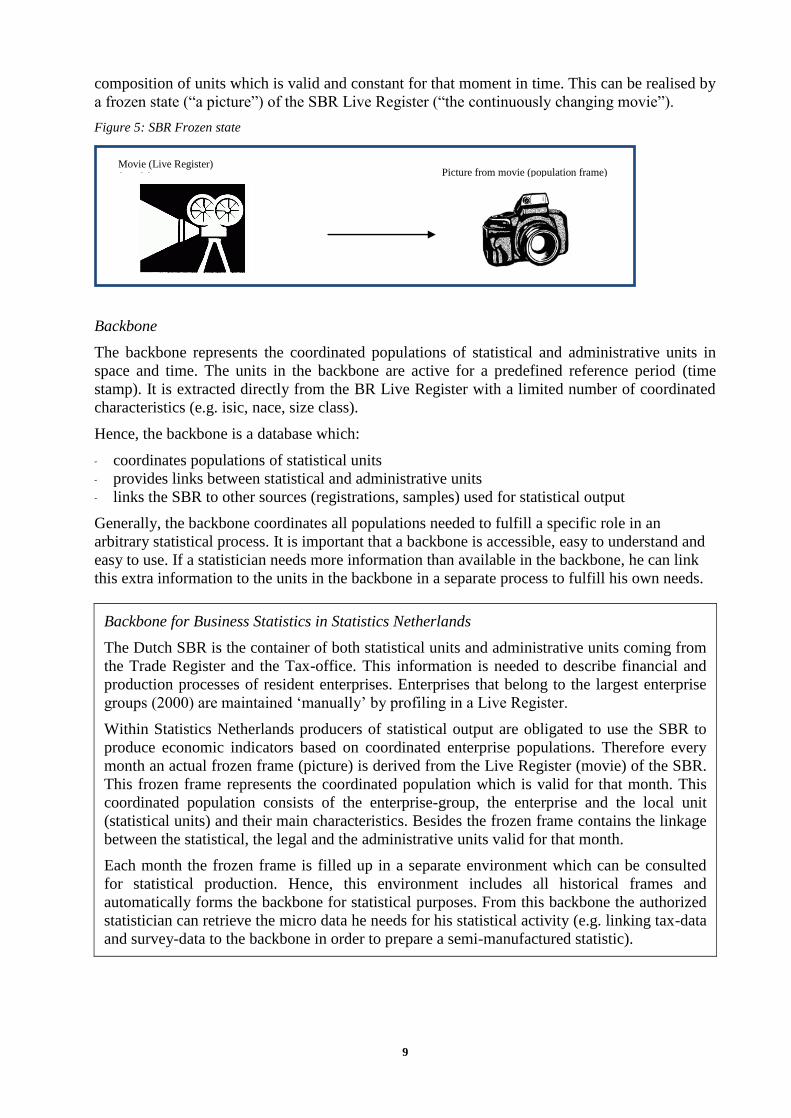
composition of units which is valid and constant for that moment in time. This can be realised by
a frozen state (“a picture”) of the SBR Live Register (“the continuously changing movie”).
Figure 5: SBR Frozen state
Backbone
The backbone represents the coordinated populations of statistical and administrative units in
space and time. The units in the backbone are active for a predefined reference period (time
stamp). It is extracted directly from the BR Live Register with a limited number of coordinated
characteristics (e.g. isic, nace, size class).
Hence, the backbone is a database which:
- coordinates populations of statistical units
- provides links between statistical and administrative units
- links the SBR to other sources (registrations, samples) used for statistical output
Generally, the backbone coordinates all populations needed to fulfill a specific role in an
arbitrary statistical process. It is important that a backbone is accessible, easy to understand and
easy to use. If a statistician needs more information than available in the backbone, he can link
this extra information to the units in the backbone in a separate process to fulfill his own needs.
Backbone for Business Statistics in Statistics Netherlands
The Dutch SBR is the container of both statistical units and administrative units coming from
the Trade Register and the Tax-office. This information is needed to describe financial and
production processes of resident enterprises. Enterprises that belong to the largest enterprise
groups (2000) are maintained ‘manually’ by profiling in a Live Register.
Within Statistics Netherlands producers of statistical output are obligated to use the SBR to
produce economic indicators based on coordinated enterprise populations. Therefore every
month an actual frozen frame (picture) is derived from the Live Register (movie) of the SBR.
This frozen frame represents the coordinated population which is valid for that month. This
coordinated population consists of the enterprise-group, the enterprise and the local unit
(statistical units) and their main characteristics. Besides the frozen frame contains the linkage
between the statistical, the legal and the administrative units valid for that month.
Each month the frozen frame is filled up in a separate environment which can be consulted
for statistical production. Hence, this environment includes all historical frames and
automatically forms the backbone for statistical purposes. From this backbone the authorized
statistician can retrieve the micro data he needs for his statistical activity (e.g. linking tax-data
and survey-data to the backbone in order to prepare a semi-manufactured statistic).
Picture from movie (population frame) Movie (Live Register) (movie)
10
2.2.3 SBR Sample frame
The primary benefits of maintaining one sample frame are better coverage, harmonisation of
surveys, integration of survey data, reduction of costs, prevention of double counting of
statistical information and above all better quality and more coherence in official statistics. Of
course, this benefits can only be realized when one central register is used to derive a sample
frame.
In this respect the backbone is the best possible population to select a frame from which we can
draw a sample from. The coordinated variables (e.g. nace, isic and size class) are already
included in the backbone. But what if the optimized sample design cannot be applied, because
some important stratification variables, which correlate strongly with the indicator to be
compiled, are missing in the backbone (e.g. turnover class, recent isic, nace)? In this case it
should be possible to enrich the statistical units in the backbone with information available from
other (independent) sources and satellites in order to complete the (sample) frame.
A sample design which uses a panel-population might be very complex to apply. In this case
information on units drawn in historical samples for similar surveys should be available in the
same environment.
Some NSIs exclude enterprises from a survey to reduce response burden (survey holiday),
because the enterprise already participated in a previous survey or another survey that’s
conducted the same period.
The exact terminology used to explain the distinction between a frame, sample frame, sample,
survey population and survey is outlined in the table in paragraph 2.2.
Sampling frame
In the Netherlands the issues around sampling as mentioned here were taken into account.
Therefore an independent sub-system will be developed by Statistics Netherlands. Of course
the sample frame(s) that serves as input for this system is linked to the backbone and enriched
with data required according to the appropriate sample design.
2.2.4 SBR Survey support
Coherence in the outcome of business statistics is improved, if the underlying survey populations
are related to the same frame. In a regular business survey, information is collected with a
respondent which represents the statistical unit in the sample frame. The answers to the questions
of the survey are provided by a questionnaire to be filled out by the respondent.
In general, a survey support tool facilitates:
- Survey registration:
Units which are involved in different or specific surveys (over time) could be listed to help
developing policies to reduce administrative burden (e.g. observation of small enterprises
once every two years or only participation in one survey per year for a small enterprise).
The survey registration also registers information about the reporting unit that is about to be
approached for a specific survey. The likelihood of contacting a respondent is improved when
the most recent contact or communication information is available and updated in this system.
It is important to register the preference of the mode in which the answers are provided for a
survey. (e.g. the mode in which the respondents provide the answers for a survey may
influences the response rate. Applying mixed modes (paper, telephone, face-to-face) could
improve this).
11
- Survey control:
To control the survey process, frame-errors should be marked (e.g. if it is not possible to
contact a respondent, because of a wrong address) and the respondents are monitored during
the whole survey observation process. This often requires intensive cooperation with a help-
desk functionality linked to the survey support tool.
In order to raise response, reminders could be send. The administration of reminders could be
a complicated process, especially when it depends on a predefined reaction time of the
respondent and/or the quality of the answers to the survey of the respondent.
Monitoring of the quality of the survey outcome is done by reporting on unit-response rates
(per mode) or an item non-response list on the questions in the questionnaire.
The SBR and enforcement information in the Netherlands
Many countries have legislation regarding the obligation of enterprises to respond to
questionnaires from a NSI. Since 2003, the Netherlands has a new statistical law. This law
states that Statistics Netherlands (SN) is obliged to make use of official governmental
registrations to derive its statistical output as much as possible. Another obligation for SN is
the need to reduce the administrative burden on enterprises, for example by utilising the
above mentioned registrations as sources of information. This implies that the units in these
registrations need to be integrated in the statistical production of official statistics. Therefore
SN has included fiscal information on the structure of enterprises in control of the finance
department in their SBR. However not all information requested by Eurostat or by national
agreements can be extracted from the registers available. Therefore the possibility to conduct
a survey in which data obtained by questionnaires provided by a small amount of respondents
is still needed.
By law SN has the right to enforce offending business-owners that do not respond to
questionnaires as a means to provide the requested information. In the announcement letter to
the survey, the enforcement procedure is explained. If an enterprise does not respond to an
official questionnaire send by the SN, then several (predefined) reminders are sent to the
responsible contact person of the enterprise. If he or she ‘refuses’ to respond, then SN has the
possibility to fine the enterprise without any intervention of a third party. To assist this
process a separate ICT-system has been created, containing all relevant SBR information that
keeps track of the complete history of all attempts to contact the responsible contact person of
the enterprise. This could be used as evidence if the enterprise will start a juridical procedure
to the SN.
2.2.5 SBR Statistics
NSIs are trying to meet the increasing demands of governments, international bodies and
researchers for business statistics on specific topics such as small areas, specific sectors of
activity and for particular aggregates. Furthermore the information provided has to be consistent
and comparable at country, global or other geographical area and for different economic
structures. At the same time NSIs are under pressures to reduce the data collection costs and
response burden.
To solve the contradiction between more information - less costs, the SBR plays a key role
through the direct dissemination of data in the following aspects:
- As a primary informative source for the dissemination of the information on the structure and
the demography of the business population.
12
- As a combined source that, integrated with other registers or statistical data, can produce new
statistical information and economic analysis
The direct use of the register for the production of statistics means that issues - related to the
treatment of data - arise. This point of view has some similarities with the use of the SBR as a
sampling frame for surveys: the SBR is a live environment, which is constantly revised and
updated. Updating of the live register at time (t+1) is not only determined by actual changes, but
also by adjustment of the characteristics of some units. SBR data cannot be looked at as the
result of a statistical survey, because the latter is a process that couldn’t obtain any additional
information once it is concluded, whilst the former, during the period (t, t+1), may acquire data
referring to a previous time, even earlier than (t). As a result, it is possible to modify information
referring to the time (t) in the SBR, like the isic classification of the unit, the measure of its size
or the date in which a cessation or a birth is registered.
Therefore statistics based on the SBR could be based on a satellite approach (see for more
detailed information paragraph 2.3). This would provide a solution for possible issues on the
correct classifications or issues related to the correct reference period. Also for organisatorial
matters it is an advantage to use a satellite for it. The responsibilities to produce statistics from
the SBR could be split into a division which is responsible for the infrastructure and a division
what is responsible for the dissemination the indicators produced.
Business demography
Data on births and deaths of enterprises, their life expectancy and the (important) role they play
in economic growth and productivity, as well as the information provided for tackling social
demographic issues, are increasingly requested both by policy makers and analysts. In practice
statistics on the evolution of a business population need to have the following constrains:
- historical information on the enterprise,
- the conceptual consistency between the denominator and numerator populations,
- the necessity of collecting information for the small and medium enterprises that
characterize the magnitude of the births and deaths,
- the possibility of identifying subpopulations of interest: employees demography indicators,
high growth indicators.
The SBR is able to overcome all of these constrains because, in general, it covers the whole
population of enterprises, it stores the basic data for this population like economic activity code
and employment (and/or turnover) and it collects information on the entry and exit of the units.
These characteristics identify the SBR as the best source, in terms of quality and reduction of
cost, for the production and dissemination of demography indicators.
Integration with the external trade register
Trade statistics do not present any explicit information on the characteristics of trades. The
concepts and classifications differ from those applied in business statistics. The knowledge of
the trader’s profiles - in terms of sector of activity, dimension, location, if it belongs or not to
an enterprise group - is an important task for the analysis of the internationalization of a
national economy and for the analysis of the determinants of this internationalization.
Coherent compilation of trade statistics by enterprise characteristics requires linkage at the
micro level of data in trade and business registers. In this way, from an analytical viewpoint,
trade statistics are determined by/derived from/linked to enterprise characteristics. The
combination of the key enterprise characteristics and the typical trade variables - product
code, partner country – offers many attractive features for producing a more complete and
diversified overview both on the structure of trade and on the statistics of businesses.
13
2.2.6 SBR Global Data Exchange
The SBR is a statistical area where much effort is spend to guarantee coherence, in terms of
concepts, methods and quality, within and between NSIs. In the last decades, thanks to the
activities developed by Eurostat, OECD and UNECE, the worldwide coherence of enterprises
has increased considerably. From this point of view the use of data recorded in the SBR is
important in international studies and for studies comparing (the structure of) different national
economies.
In a society that is more and more influenced by globalisation, the comparability of international
business statistics is becoming increasingly important. Global indicators based on international
coordinated populations of statistical units are better because they are more comparable when
measuring globalisation-effects. At the same time it is important for producers and users of
statistics to understand the potential limitations of the SBR in the context of international
comparability.
2.2.6.1 International harmonisation of SBR
International comparability is improved by agreeing on concepts about (global) units and their
characteristics (e.g. NACE). This results in global indicators that are more internationally
comparable because they are based on coordinated populations of similar derived statistical units
and characteristics.
ESSnet on consistency
The work to be done in the whole ESSnet is grouped according to three main crucial issues,
which are the sources for inconsistency and where harmonisation is rather possible on ESS
level, into three ESSnet projects:
- Statistical units
- Target population, frames, reference period, Classifications and their applications
(breakdowns, special aggregates) ,
- Characteristics and definitions
2.2.6.2 Supra-national SBR approach
A key element to improve the quality of global statistics is the exchange of micro data between
countries and the central accessibility (e.g. storing of this information in one central database). In
this respect SBRs of different countries fulfill the role of data providers.
A complex question in this respect is the legal basis to share micro data between statistical
authorities of other countries. Since the data are also exclusively used for statistical purposes and
the disclosure of information to the public on individual statistical units is forbidden by law, this
could seriously hamper the exchange of information on global units. Because the micro data also
falls under the confidentiality regime of the partner country such an exchange requires the need
for: a close cooperation between the partners, comparable rules for the use and protection of
confidential data, a solid agreement between the countries, and -above all- trust that data are not
misused.
European Statistical System Network (ESSnet)
Within Eurostat two groups of experts united in the European System of Statistics (i.e.
Euro Group Register and International Profiling) are developing methodological guidelines
in order to derive coordinated populations to support the Foreign Trade Statistics (Inward
14
FATS and Outward FATS) and the Statistics on Foreign Direct Investments (FDI) on a
European level. These guidelines are a starting point for a worldwide discussion on the
measurement of global indicators to describe globalisation effects.
Euro Group Register, EGR (Europe)
The EGR is a central register that supports the production of micro based statistics on
globalisation in Europe, both at the country and European level. The EGR offers compilers
access to integrated and up-to-date register data on multinational enterprise groups that
have statistically relevant transnational operations (financial and non-financial) in at least
one of the European countries involved.
By way of collecting, comparing and selecting information from different commercial and
institutional sources, the EGR provides a set of pooled information that allows compilers
of statistics to organise the data collection process and to produce statistics on the basis of
a Europe-wide shared and coordinated information base.
The EGR central register is kept at Eurostat, which integrates the authentic statistical data
from each EU Member State (or EFTA country), altogether forming an international
network of registers. The national data coming from Member States is treated as authentic
data which has not to be questioned and in the EGR a data quality process ensures the
quality of the multinational enterprise groups (MNEs) and their constituent units, active in
the specific Member States.
Statistics on globalisation should use the global data which is available in the EGR.
European System of Business Registers, ESBRs (Europe)
The ESBRs project has been launched for the period 2013 to 2017, in the framework of the
ESS “Vision Implementation Programme”.
The project aims at better and more efficient business statistics, as well as better insight on
globalisation, through interoperability of statistical business registers in the ESS and
further improvement of the EGR.
In practice the ESBRs project provides continuity to two previous ESS projects, namely
EGR and Profiling 2, but it has a larger scope.
Indeed, the project ambition is to rationalise, strengthen and systematise all statistical
business registers in the ESS. To this end ESBRs introduces new dimensions.
The ESBRs project has the following goals:
- Strengthen and rationalise SBRs
- Integration into an interoperable system
- Serving national and EU statistical production
- Efficiency and quality gain in the whole ESS
- Improving EGR (heart of the system)
- Improved quality information on multinational enterprise groups
- NSIs on-line access, facilitating quality management, updating and use of EGR
- Dedicated interfaces for ESS statisticians (FATS and FDI)
2 The profiling is defined in the Eurostat Business Registers Recommendations Manual as: “a method to analyse
the legal, operational and accounting structure of an enterprise group at national and world level, in order to
establish the statistical units within that group, their links, and the most efficient structures for the collection of
statistical data” (annex 3.1, paragraph 19.9).
15
- Looking at the whole elephant through a new model for statistical units and
profiling
- Sharing e-services
- NSI will have access to a catalogue of shared specific services for the SBRs and
EGR management
- Services certified by Eurostat and consistent with ESS standards and IT common
infrastructure.
2.2.7 SBR Information source
In some countries the role of the SBR can also be as an information source. This is only the case
when the laws on confidentiality and protection of privacy permit to do so.
In other countries this role may be fulfilled by another governmental institute or by commercial
institutes, since the use of the SBR in this field often is restricted by law.
Therefore the broadening of the role of the SBR toward these fields is related to certain
conditions and features that the SBR needs to meet, such as a national regulatory framework, the
availability of geo-statistical information and data consultancy systems. In case these conditions
can be met, the SBR can fulfill this information source role:
A rather specific role of a SBR is to meet the information needs of a different kind of users,
particularly those responsible for the policies in the public and private domains. This would
enable the SBR to support market investigation performance (client and supplier identification),
for the establishment of urban political development, for educational and health infrastructure, as
well as civil prevention and trade developer. Other domains are:
- Promotion of programs to support specific economic activities.
- Definition of local, regional and national economic development programs, from the analysis
of the distribution of the economic activities in geographical space.
- Identification of the needs of service and supply, to support both the planning and the
implementation or policies and the orientation of public and private expenditure to meet these
needs.
- Identification of economic clusters.
- Support entrepreneurs in the development of business projects.
- Support the development of efficient expansion policies for businesses.
- Market research and the identification of customers, suppliers, competitors and potential
distribution areas.
- Improving the teaching and research for the construction of dynamic behaviour models.
- Fortify the rational and harmonic definition of urban policies, as those referring to land use in
all orders of government.
- Support for the estimation of losses and reconstruction costs in case of natural disasters, as
well as the evaluation and definition of civil preventive policies and urban development.
- Support the dissemination and promotion of the economic units and of the electronic market
(providing the economic unit´s contact data like the e-mail or web-page).
16
SBR Regulatory Framework
The data in the SBR must be specified in the standards that regulate the administration of the
SBR, since it may refer to the identification and location of the establishments and enterprises. In
this respect it is important to consider that the data corresponds to information the enterprises
make public and is generally classified in the legal standards of a country as data of public
interest, which any citizen has access to. The regulatory framework has to grant the
dissemination of the following data:
- Identification and stratification variables: Name of the establishment or enterprise,
denomination or corporate name, code and name of the economic activity class, size
according to the stratum of occupied personnel
- Geographical location variables: street, external and internal number, neighbourhood, zip
code, locality.
- Geographical coordinates of the location: latitude and longitude
- Contact variables: phone, fax, e-mail, web-page
- Date of birth of a unit in the SBR
Providing this information to all the users of the SBR may imply the need for revision of laws,
regulations, policies and standards governing both SBR and its source registers, in order to
identify the needs for the conciliation rules that allow the publication of this data. For this
purpose, the involvement of the directive levels responsible for the SBR and of the source
registers is necessary for the conclusion of agreements, regulations or arrangements that allow its
implementation.
Geo-statistical information and the SBR data consultancy systems
The SBR should be able to provide the users information on the distribution of the economic
activity and establishments in the geographical space. This information should be used by a
geographical information system (GIS) to present it as geo-statistical cartography, since it
graphically represents the localities broadening the register, street names, and location of the
mayor services and the delimitation of blocks with their corresponding enumeration. The use of
GIS is fundamental to provide the users with the necessary data to perform an analysis on the
economic activity and its relation to the geographical space. Through the GIS, it is possible to
incorporate the necessary information layers as geo-statistical data, settlements, street axes,
block fronts, locality polygons, blocks, external numbers, urban services, reference elements,
natural resources, geographical names, hydro graphic networks, routes of communication,
territory images, relief, limits references, geodesic references.
Geo-statistical information
In Mexico, the National Directory of Economic Units is a backbone register of the SBR that
is available to any user through a free consultation system in the National Institute of
Statistics and Geography (http://www3.inegi.org.mx/sistemas/mapa/denue/default.aspx), due
to having these features, it has allowed broadening the roles as supporting tools for public
and private policy developers, for decision-makers, as well as for professors and researchers.
The case of Spatial analysis
In recent years, there has been a growing interest in the analysis of territorial systems. This
interest can be attributed to significant increases in the use of geographic information
systems (GIS), characterized by powerful capabilities to integrate and use a wide variety of
spatial information. The individual address records have become the standard level for
spatial investigation in many socioeconomic and planning applications. Because of the
17
increased level of user friendliness and accessibility of GIS packages, x-y coordinates can be
quite easily assigned to the each address in the SBR. The geospatial dimension represents
important information for the building of a geographic infrastructure data system useful for
geospatial analysis on the economic structure.
2.3 Extension of the roles of the SBR
Including all the different roles into the SBR could lead to a very complex implementation of the
SBR. Each role requires different input, throughput and output. Ideally this will fit into one
whole SBR but it is expected that this complex implementation will be very complex to maintain.
A possible implementation of the SBR could be to link extra information to the backbone.
2.3.1 Satellites
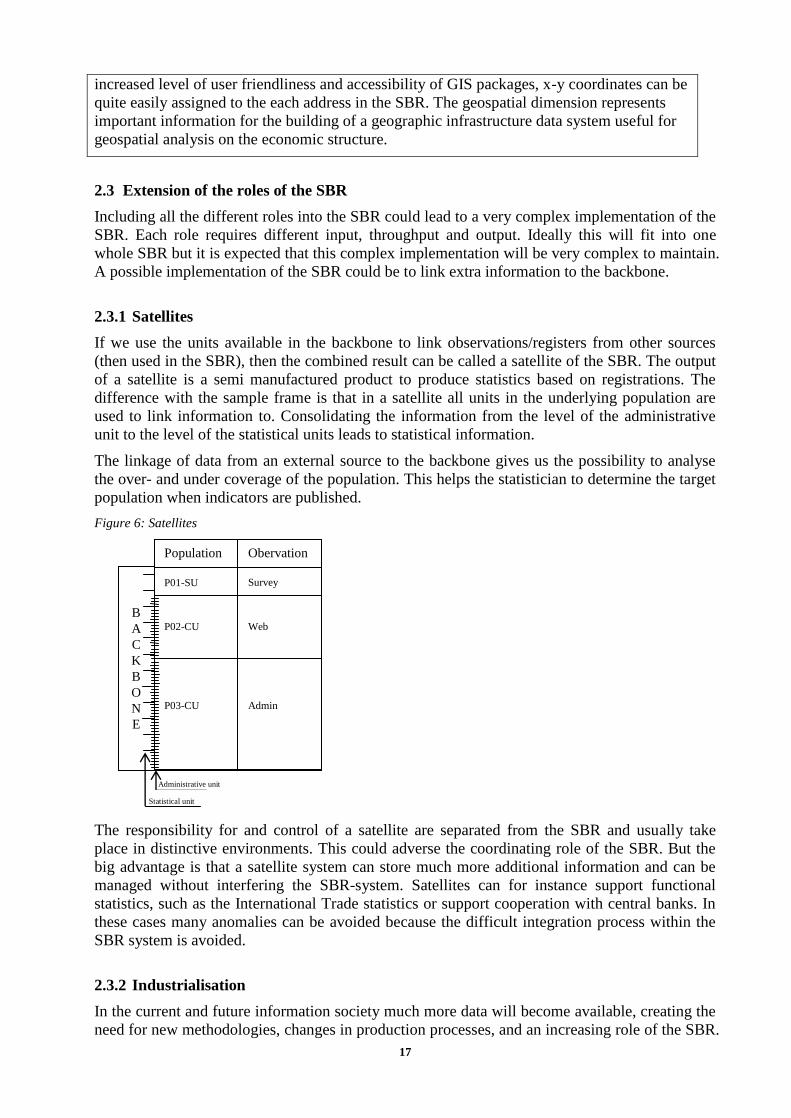
If we use the units available in the backbone to link observations/registers from other sources
(then used in the SBR), then the combined result can be called a satellite of the SBR. The output
of a satellite is a semi manufactured product to produce statistics based on registrations. The
difference with the sample frame is that in a satellite all units in the underlying population are
used to link information to. Consolidating the information from the level of the administrative
unit to the level of the statistical units leads to statistical information.
The linkage of data from an external source to the backbone gives us the possibility to analyse
the over- and under coverage of the population. This helps the statistician to determine the target
population when indicators are published.
Figure 6: Satellites
The responsibility for and control of a satellite are separated from the SBR and usually take
place in distinctive environments. This could adverse the coordinating role of the SBR. But the
big advantage is that a satellite system can store much more additional information and can be
managed without interfering the SBR-system. Satellites can for instance support functional
statistics, such as the International Trade statistics or support cooperation with central banks. In
these cases many anomalies can be avoided because the difficult integration process within the
SBR system is avoided.
2.3.2 Industrialisation
In the current and future information society much more data will become available, creating the
need for new methodologies, changes in production processes, and an increasing role of the SBR.
Statistical unit
B
A
C
K
B
O
N
E
Population Obervation
P01-SU
P02-CU
P03-CU
Survey
Web
Admin
Administrative unit
18
The SBR could be used for data integration for a wider variety of sources. It will be a challenge
to analyse a source and split the data available into pieces containing the information for the
units and characteristics that can be linked in a satellite of the SBR and be used in the statistical
production process.
A very interesting a rapidly growing source of information for the production of statistics is the
World Wide Web. Much information on enterprises is available on the internet. This is often
used to check data already included in the SBR. But it is a challenge to extract correct and useful
statistical information from it. Examples of ways to collect data from the internet are through
social network sites or through public website which sell commercial products. Another
approach is the use of so-called web robots; programs that collect data by systematically copying
textual information on web pages.
To process the data collected often ‘text mining’ techniques are used to extract knowledge from
strings of text. At the moment methods to extract and prepare internet data to extract statistical
information as a substitute for existing indicators are rarely applied. This can be caused by the
fact that the technical infrastructure is missing, because the data collected cannot be used
because of legal issues, is out-dated, incomplete or can’t be linked to (the correct) unit in the
backbone. Potential advantages of this kind of information is, that it is quickly available and
could be used as a quick way to describe social behaviour, an economic trend or as a means to
validate traditional statistics.
Generally this kind of use is associated with the ‘open data’ concept. Open data also uses non-
textual material such as maps, chemical or medical data which often is controlled by commercial
institutes and may limit the distribution of any results derived from it.
Even more complex is to extraction of information from ‘big data’ sources. These sources are
characterized by large amounts of data that are continuous or frequently updated and contain a
wide range of data types and formats. Big data cannot easily be handled in an ordinary relational
database structure. It often also requires powerful software running on ‘heavy’ hardware.
The aim of the SBR should be to connect these (Open or Big) data to coordinated populations of
statistical units in order to derive relevant indicators for policy makers. Relating this kind of data
is expected to be difficult for sources predominantly containing event based data. If linking Open
and Big data to the SBR is successful the produced indicators need to be compared with similar
indicators based on populations derived from other sources to enable publication in coherence.
Internet as a data source
In order to use the internet as a data source for vacancy statistics, the information available
should be analysed thoroughly. Next a strategy or a methodology should be developed to
include this data in the statistical production process. In the Netherlands, a Dutch
(commercial) company collected and analysed as much of the vacancy-data available on the
internet using text mining techniques to prevent double counting and to classify and link
vacancies to the legal units in the Dutch Trade Register. Attributes like reference dates,
source, profession, education, region, salary, working hours, type of contract, skills,
experience, activity and basic information on the employer were extracted from the internet
and stored in a private database. In this way it is possible to produce figures on new placed
vacancies on the internet on a daily basis. Trends in new available vacancies are quickly made
visible in this way. In addition, findings on the internet advertisement-behaviour of
companies can be compiled.
Statistics Netherlands investigated the usability of this private database for the production of
official vacancy statistics in order to reduce administrative burden for enterprise participating
in the ‘vacancy survey’. It turned out that it was not possible to estimate distributions of
vacancies solely based on this source, because vacancies on the internet were dominated by
19
vacancies for highly educated employees. The estimation of the total number of vacancies
based on the internet data was also incomparable with the outcome of the regular vacancy
survey. This resulted from the many differences in the target populations of both data sources.
Use of internet data as an extra source of information was found more promising in this case.
2.3.3 Register-based Census
An economic census provides information about the structure and function of a productive
system from the national (macro-area) to the local (micro-area) level. In general it guarantees
periodic and comprehensive statistics about business, establishments, activities carried out and
employment every five or ten years. The economic census statistics are essential “for sound
economic policy and successful business planning”3 and it represents an essential framework for
all economic indicators (production indexes, input/output measures, labour,..) and the census
data are fundamental input to benchmark GDP estimates.
Statistical data on basic information of the business is important and necessary for the public and
private sector in policy formulation and development planning of economic and industry in both
the national and local level. National and local government use these data to monitor economic
activity and the changes in – national or regional – economy. Census data are very useful for the
individual businesses to calculate market share, locate business markets, identify business site
locations, and evaluate new business opportunities.
In many countries the censuses are regulated by law and provides for mandatory responses. In
the last decades, the development, in a wide range of the countries, of the National SBR
guarantees a strong improvement of methods and tools of census data collection.
At one end of the line we have traditional censuses collecting data by use of enumerators and
questionnaires, using no register information at all. At the other end we have the totally register-
based census. Some countries use mixed mode data collection with a combination of data from
registers and questionnaires (as a total count or a sample survey). However, even countries
conducting mainly traditional censuses may use register information to some extent, for instance
as an address list
The interaction between the SBR and the Census Survey can be defined a “register-assisted”
census data collection that combines some elements of a direct door-to-door survey and some of
a classic survey by list. This technique of data collection is characterized by the following three
elements:
- Enumerators are supplied with lists of the enumeration units located in their “census” districts,
drawn by the SBR. Their task consists in verifying the actual status of the listed units,
deleting the records of the doubled and the ceased ones, and adding new records for the
possible non-listed units (born in the lag between the time reference of the list and the date of
the survey, or unregistered for any other reason).
- Some days before the survey, all the listed units receive by mail a personalized questionnaire
to be withdrawn by enumerators, partly filled in with information drawn from the SBR. In this
way, the respondents had just to complete the form with the missing information and verify
the correctness of the pre-printed fields (rectifying them, if necessary).
- Enumerators are also provided with blank (non-personalised) questionnaires; to be used only
for non-listed units or in substitution of personalised questionnaires got lost or damaged.
Using this method, based on the synergy between the Census and the BR, the main results are:
3Alan Greenspan, chairman of the Federal Reserve Board, USA
20
- to reduce the burden for respondents, by limiting the number of questions and radically
simplifying the questionnaire. Besides, the overall reduction of the quantity of collected data,
allowed a simplification and a shortening of data processing, and has a positive impact on the
quality of the data itself.
- to produce a new approach to the quality and coverage control, since it is possible to carry out
a micro-level coverage analysis, by comparing the data collection raw file with an image of
the SBR referring to the same date of the Census. This micro approach, instead of the
“classic” macro based on a post-enumeration sample survey, made possible the precise
identification of every single unit under/over covered in both data sources. The results are that
the theoretical under coverage – main problem of a direct door-to-door survey – and over
coverage - main problem of a SBR – are significantly reduced.
- to create the basis for the improvement of the SBR in terms of new variables detected, e.g.
secondary activities.
An evolution of the previous “register-assisted” approach is the development of a register-
based Economic Census. With this approach the census data are reproduced entirely from the
integration between SBR and administrative sources, without any direct data collection from
business. In this way the possibility to turn from a traditional business Census to a register-based
one depends mainly upon the degree of enhancement done in the statistical use of administrative
sources and, on the other hand, on the improvements in terms of quality each administrative
body has developed in the business area. The SBR regulates the integration activities.
The advantages of the register-based, with respect to the ‘register-assisted’ approach are:
- a significant decrease in costs for the statistical authorities;
- the not existence of ‘respondent units’ implies the not existence of burden;
- the statistics can be available every year, therefore able to detect short term changes in
economic structure of the national and local economies.
On the other hand besides the classical problems that arise in the use of administrative sources
(the need to deal with administrative definitions and their operational rules, the timeliness in the
production of data, the treatment and the exploitation of new administrative data, the
enlargement of the dataset of information, the huge amounts of data linked,…), the key
disadvantage of this approach are the impossibility to use direct statistical information for the
quality assessment of the SBR, especially in terms of under/over coverage.
The realization of a register-based census needs to face with some statistical constraints:
- A high quality of the SBR in terms of coverage: the population, in terms of enterprises and
local units, are done and cannot be changed or corrected.
- The existence of an unified identification code systems across different administrative sources.
In the absence of such unified systems it is extremely difficult, if not impossible, to link
different registers: the integration is the key of the virtual census.
- The development of appropriate statistical methodologies (probabilistic and/or deterministic)
able to translate administrative variables into the statistical ones or able to estimate statistical
variables starting from one (or more linked) administrative data.
The realization of a register-based census depends of national constrains that are the national
statistical objectives and the availability of national administrative sources able to support such
objectives. A generalized approach is quite impossible – both in terms of contents and processes
and applied methodologies. Below the Italian experience for the development of the 2011 Virtual
Economic Census – developed using only the integration between SBR and administrative
sources - is shortly presented.
21
The Italian ‘virtual’ economic census (VEC)
For the first time the decennial Business Census named CIS 2011 aiming at the
enumeration of businesses, related persons employed and other typologies of
employment, classified by Activity code, size, juridical status and other structural
information about the system of enterprises is done without any direct data collection
from business but instead it is based exclusively from statistical data obtained from the
integration of administrative sources.
The VEC system is built around a set of basic registers containing comprehensive data on
firm units and individual. The core of this system is ASIA BR which is yearly produced
as a result of an integration process of administrative and statistical sources. The ASIA
BR is considered the reference universe and the official source for the Italian statistical
information on the structure and the demography of the business population.
The identification and acquisition of new set of administrative sources changed the way
the process is carried out, and add new contents to the system of businesses where
information is available not only at unit (enterprise, local unit) level but also at an
individual level in that each person involved in the business production process is
identified; in fact each unit inside an administrative source is linked to the BR statistical
unit by means of identification codes: persons can be linked to the business in which they
assume any ownership share, to the employer for whom they are working, etc.
This system makes use of many administrative sources that can be grouped into different
typologies: fiscal data (VAT, income, participation in partnerships, remuneration taken
from 770-Form Tax Register, statistics-based Tax Assessment fiscal survey - i.e. ‘Studi
di settore’), Social security data (monthly employer declarations on each employee, on
outworkers - i.e. persons that are linked to a production unit and that are not
employer/own account workers or employees – and on self-employed workers and
family workers in agriculture, handicraft and trade data); Chamber of Commerce data
(list of partners or shareholders of each legal unit); data from the government agency for
the insurance against work-related injuries (workplace, insurance payments). The
integration of has been guarantee by the tax code, available – with a very high level of
coverage - both for legal units and individuals, in all sources and in ASIA-BR. In such
way the tax code represent, in Italy, an indirect unified identification code systems.
According to the input sources information the new employment data structure for the
BR is set up according to a LEED structure (Linked Employer-Employment Database).
While in the ‘old’ BR the number of persons employed represented one of the
characteristics associated to a statistical unit (attribute), in the new data structure each
single person is linked to the statistical unit in which it assumes any form of employment
according to the conceptual framework of the employment classification. In this new
system firms and workers employed are identified by links deriving from integration and
matching process of the several administrative sources. The data structure is based on
links i.e. direct relationship between employment identification codes and enterprises
together with the basic enterprise attributes, employment composition at enterprise level
(e.g. gender and age composition, workplace) and employment attributes that differ
according to the type of employment of interest.
This new integrated approach is able to provide an in-depth analysis of the employment
of the enterprises and of local units: this analysis “was” and “is” the main objective of the
Italian Economic Census.
The main results of the Italian VEC are:
- to produce on employment with a particular focus on worker demographic
22
characteristics of the worker, such as gender, age, birth location (country);
- to produce more detailed information and the job variables (professional status, type of
contract, full/part time, etc.);
- to identify the different typologies of workers used in the firm (employees, self-
employment, family worker, outworkers, temporary workers) to guarantee a global
picture of the labour input both for each enterprise and for sectorial al territorial levels;
- to face and solve measurement issues (hours worked, number of jobs, full time
equivalent jobs, number of persons employed).
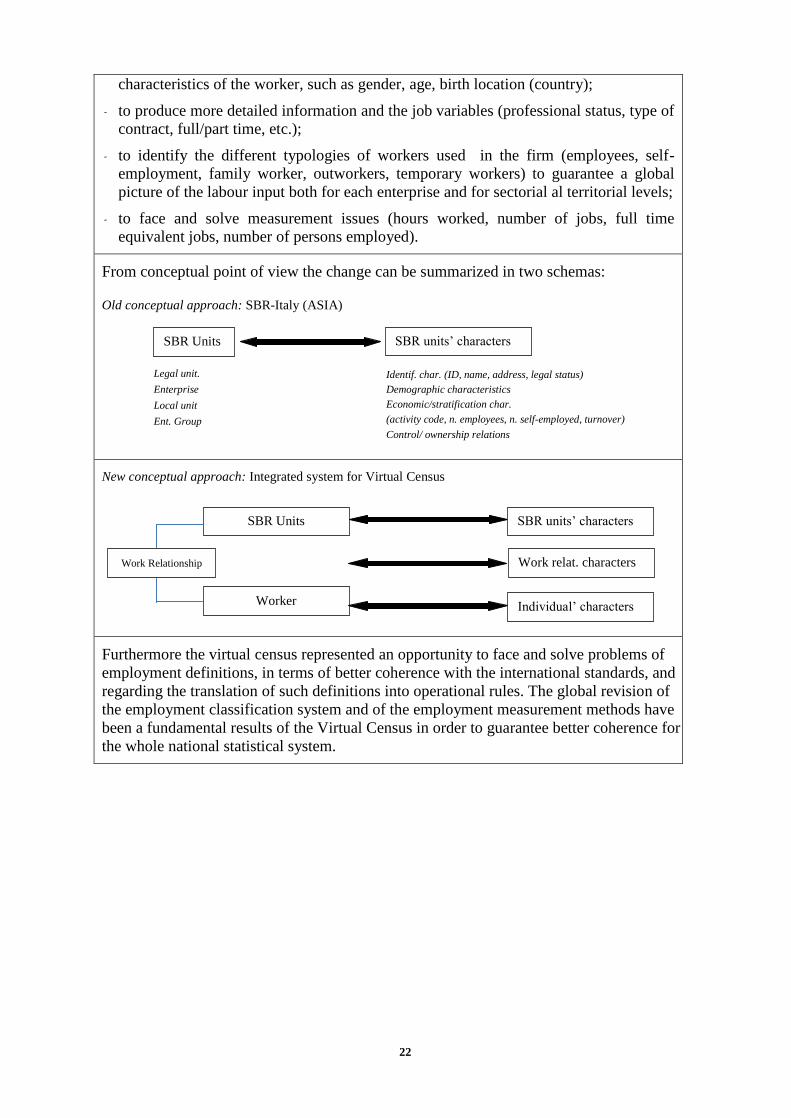
From conceptual point of view the change can be summarized in two schemas:
Old conceptual approach: SBR-Italy (ASIA)
New conceptual approach: Integrated system for Virtual Census
Furthermore the virtual census represented an opportunity to face and solve problems of
employment definitions, in terms of better coherence with the international standards, and
regarding the translation of such definitions into operational rules. The global revision of
the employment classification system and of the employment measurement methods have
been a fundamental results of the Virtual Census in order to guarantee better coherence for
the whole national statistical system.
SBR Units
Legal unit.
Enterprise
Local unit
Ent. Group
SBR units’ characters
Identif. char. (ID, name, address, legal status)
Demographic characteristics
Economic/stratification char.
(activity code, n. employees, n. self-employed, turnover)
Control/ ownership relations
SBR Units SBR units’ characters
Worker Individual’ characters
Work Relationship Work relat. characters