Embed Size (px)
Citation preview

1
Data quality and surveys forData quality and surveys for SEEAW SEEAW
Training Course on Water AccountingTraining Course on Water AccountingAmman, JordanAmman, Jordan
10-13 March 2008 10-13 March 2008
Michael VardonMichael VardonUnited Nations Statistics DivisionUnited Nations Statistics Division
OutlineOutline
• Data qualityData quality
• Data sourcesData sources
• Surveys optionsSurveys options
• SurveysSurveys
• Examples of surveys from AustraliaExamples of surveys from Australia
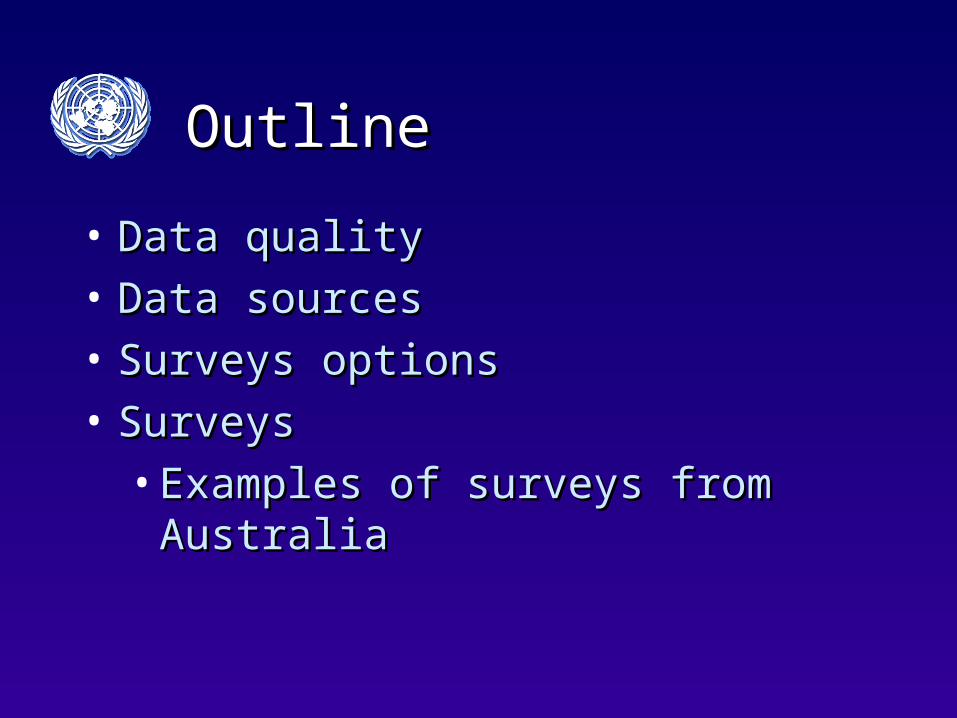
Data qualityData quality
• RelevanceRelevance• Accuracy Accuracy • TimelinessTimeliness• AccessibilityAccessibility• InterpretabilityInterpretability• CoherenceCoherenceStatistics Canada – Quality Guidelines 4Statistics Canada – Quality Guidelines 4thth Edition 2003 Edition 2003http://www.statcan.ca/english/freepub/12-539-XIE/12-539-XIEhttp://www.statcan.ca/english/freepub/12-539-XIE/12-539-XIE03001.pdf03001.pdf
Relevance
“The relevance of statistical information reflects the degree to which it meets the real needs of clients. It is concerned with whether the available information sheds light on the issues that are important to users. Assessing relevance is subjective and depends upon the varying needs of users. The Agency’s challenge is to weigh and balance the conflicting needs of current and potential users to produce a program that goes as far as possible in satisfying the most important needs within given resource constraints.”
Statistics Canada – Quality Guidelines 4Statistics Canada – Quality Guidelines 4 thth Edition 2003 Edition 2003 p. 6
Accuracy
“The accuracy of statistical information is the degree to which the information correctly describes the phenomena it was designed to measure. It is usually characterized in terms of error in statistical estimates and is traditionally decomposed into bias (systematic error) and variance (random error) components. It may also be described in terms of the major sources of error that potentially cause inaccuracy (e.g., coverage, sampling, non response, response).”
Statistics Canada – Quality Guidelines 4Statistics Canada – Quality Guidelines 4thth Edition 2003 Edition 2003 p. 6-7
Timeliness
“The timeliness of statistical information refers to the delay between the reference point (or the end of the reference period) to which the information pertains, and the date on which the information becomes available. It is typically involved in a trade-off against accuracy. The timeliness of information will influence its relevance.”
Statistics Canada – Quality Guidelines 4Statistics Canada – Quality Guidelines 4thth Edition 2003 Edition 2003 p. 7
Accessibility
“The accessibility of statistical information refers to the ease with which it can be obtained from the Agency. This includes the ease with which the existence of information can be ascertained, as well as the suitability of the form or medium through which the information can be accessed. The cost of the information may also be an aspect of accessibility for some users.”
Statistics Canada – Quality Guidelines 4Statistics Canada – Quality Guidelines 4thth Edition 2003 Edition 2003 p. 7
Interpretability
“The interpretability of statistical information reflects the availability of the supplementary information and metadata necessary to interpret and utilize it appropriately. This information normally includes the underlying concepts, variables and classifications used, the methodology of data collection and processing, and indications or measures of the accuracy of the statistical information.”
Statistics Canada – Quality Guidelines 4Statistics Canada – Quality Guidelines 4thth Edition 2003 Edition 2003 p. 7
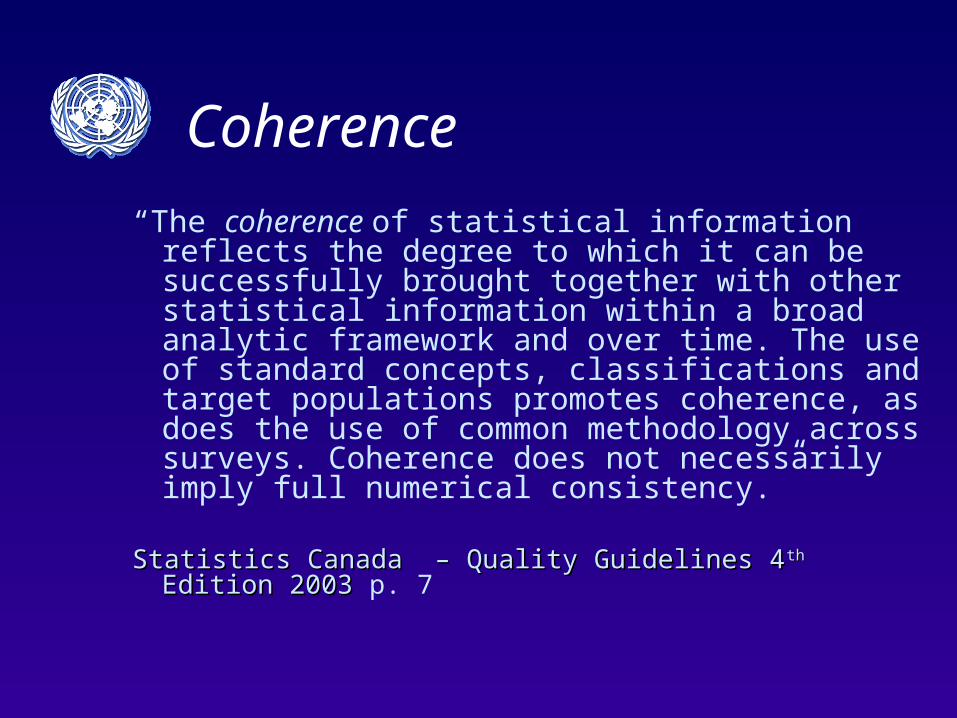
Coherence
“The coherence of statistical information reflects the degree to which it can be successfully brought together with other statistical information within a broad analytic framework and over time. The use of standard concepts, classifications and target populations promotes coherence, as does the use of common methodology across surveys. Coherence does not necessarily imply full numerical consistency.”
Statistics Canada – Quality Guidelines 4Statistics Canada – Quality Guidelines 4thth Edition 2003 Edition 2003 p. 7
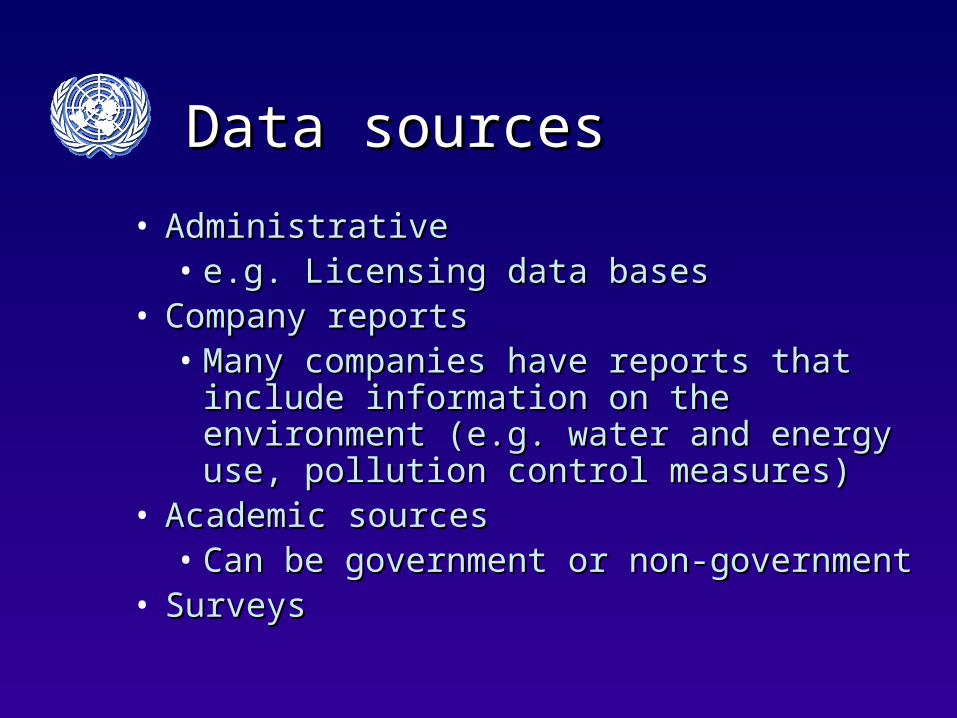
Data sourcesData sources
• AdministrativeAdministrative• e.g. Licensing data basese.g. Licensing data bases
• Company reportsCompany reports• Many companies have reports that include Many companies have reports that include
information on the environment (e.g. water and information on the environment (e.g. water and energy use, pollution control measures)energy use, pollution control measures)
• Academic sourcesAcademic sources• Can be government or non-governmentCan be government or non-government
• SurveysSurveys
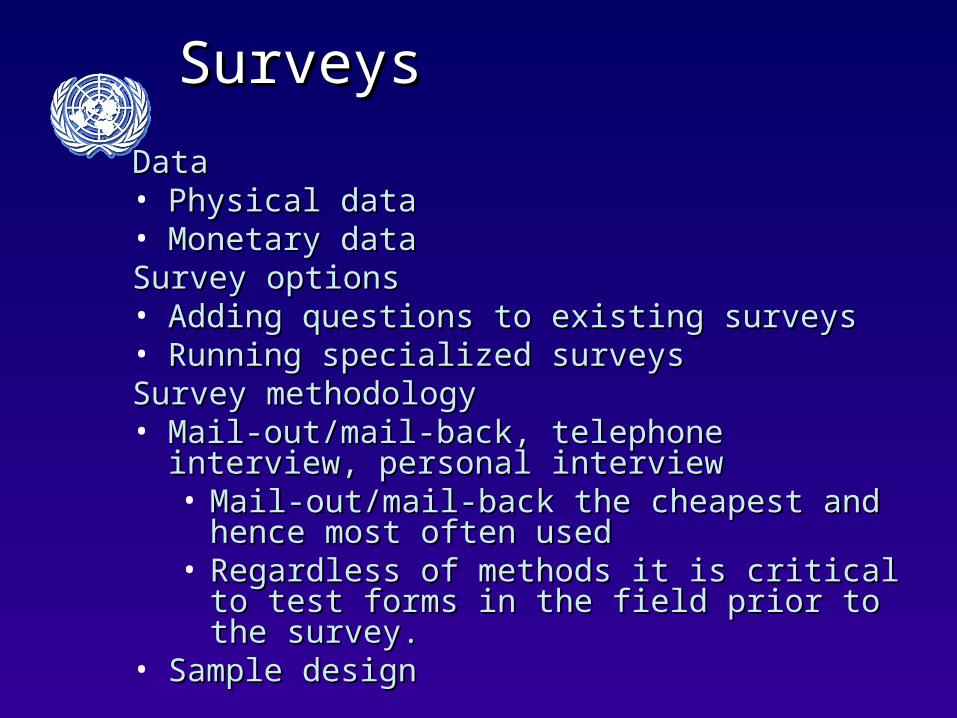
SurveysSurveys
DataData• Physical dataPhysical data• Monetary dataMonetary dataSurvey optionsSurvey options• Adding questions to existing surveysAdding questions to existing surveys• Running specialized surveysRunning specialized surveysSurvey methodologySurvey methodology• Mail-out/mail-back, telephone interview, personal Mail-out/mail-back, telephone interview, personal
interviewinterview• Mail-out/mail-back the cheapest and hence most often Mail-out/mail-back the cheapest and hence most often
usedused• Regardless of methods it is critical to test forms in the Regardless of methods it is critical to test forms in the
field prior to the survey.field prior to the survey.• Sample designSample design
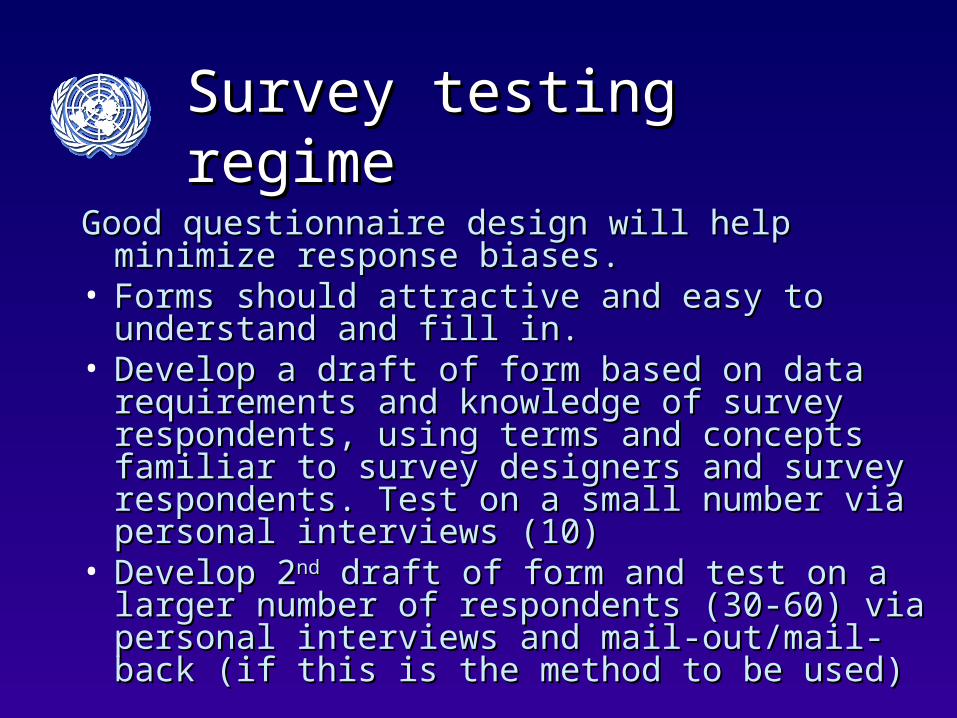
Survey testing regime Survey testing regime
Good questionnaire design will help minimize response Good questionnaire design will help minimize response biases. biases.
• Forms should attractive and easy to understand and Forms should attractive and easy to understand and fill in.fill in.
• Develop a draft of form based on data requirements Develop a draft of form based on data requirements and knowledge of survey respondents, using terms and knowledge of survey respondents, using terms and concepts familiar to survey designers and survey and concepts familiar to survey designers and survey respondents. Test on a small number via personal respondents. Test on a small number via personal interviews (10)interviews (10)
• Develop 2Develop 2ndnd draft of form and test on a larger number draft of form and test on a larger number of respondents (30-60) via personal interviews and of respondents (30-60) via personal interviews and mail-out/mail-back (if this is the method to be used)mail-out/mail-back (if this is the method to be used)
Specialized SurveysSpecialized Surveys
AdvantageAdvantage• Can collect a range of data need for the Can collect a range of data need for the
accounts as well as additional data to aid accounts as well as additional data to aid interpretation and understandinginterpretation and understanding
• Can select sample to represent total water Can select sample to represent total water use (not total economic activity)use (not total economic activity)
DisadvantageDisadvantage• Costly to develop and runCostly to develop and run
Adding questions to existing Adding questions to existing surveyssurveys
AdvantageAdvantage• Direct link to the other data collected in the surveyDirect link to the other data collected in the survey• Cheaper than running specialized surveysCheaper than running specialized surveys
DisadvantageDisadvantage• Financial officers or business accountants who Financial officers or business accountants who
typically fill in business survey forms may not be typically fill in business survey forms may not be familiar with environmental datafamiliar with environmental data
• Sample selection may not be idealSample selection may not be ideal
Sample selection may not be idealSample selection may not be ideal
For example, in business surveys sample may be For example, in business surveys sample may be selected to estimate total economic activity, not selected to estimate total economic activity, not total water use or supplytotal water use or supply
As such large water using industries (food and As such large water using industries (food and beverage manufacturing, metal manufacturing, beverage manufacturing, metal manufacturing, paper manufacturing, electricity generation) may paper manufacturing, electricity generation) may be under-represented in sample design. This be under-represented in sample design. This problem can be overcome by adding sample in problem can be overcome by adding sample in these industriesthese industries
Example questionnaires from Example questionnaires from AustraliaAustralia
Specialized surveysSpecialized surveys• Water Supply and Sewerage SurveyWater Supply and Sewerage Survey• Water Survey (supplement to Agricultural Survey)Water Survey (supplement to Agricultural Survey)
Adding questions to existing surveysAdding questions to existing surveys• Mining SurveyMining Survey• Manufacturing SurveyManufacturing Survey• Agricultural Census Agricultural Census
All surveys mail-out /mail-backAll surveys mail-out /mail-back
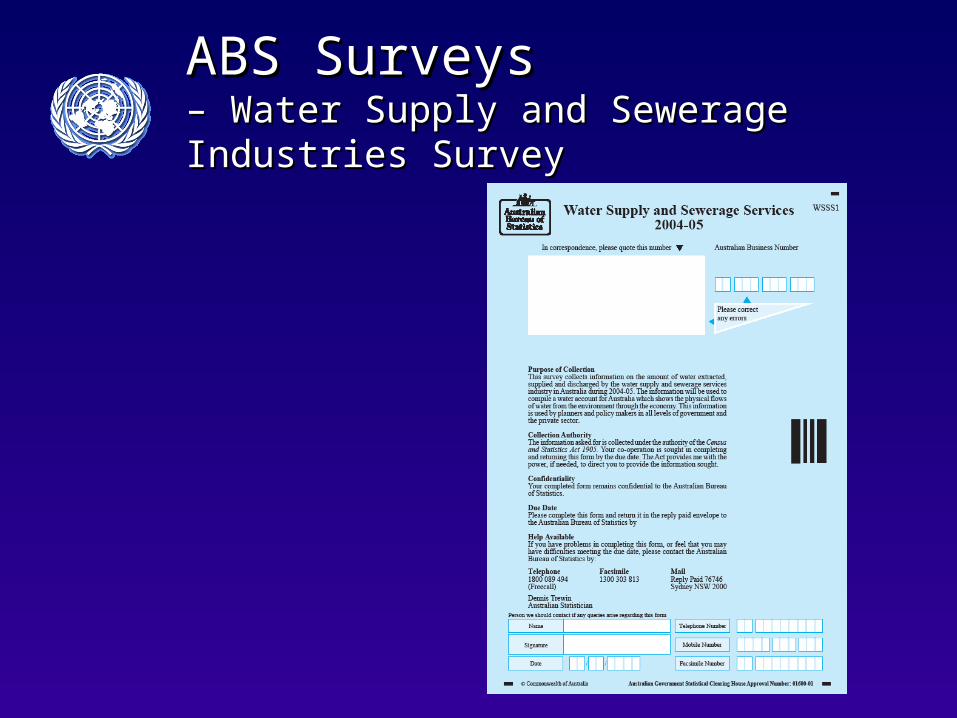
ABS Surveys ABS Surveys – Water Supply and Sewerage Industries Survey– Water Supply and Sewerage Industries Survey
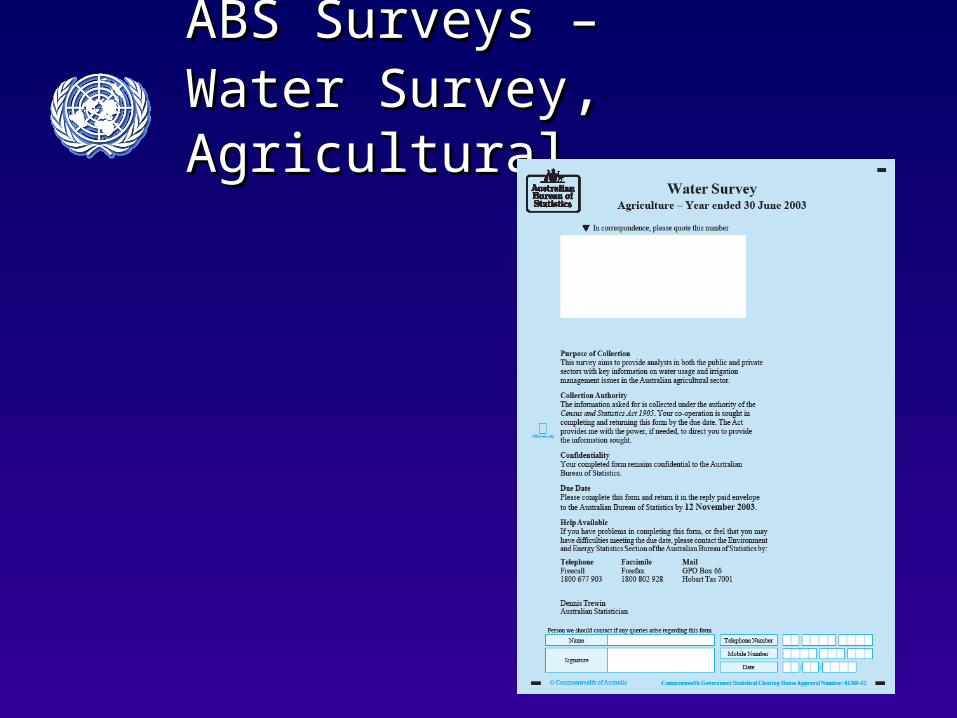
ABS Surveys – ABS Surveys – Water SurveyWater Survey, , Agricultural Agricultural
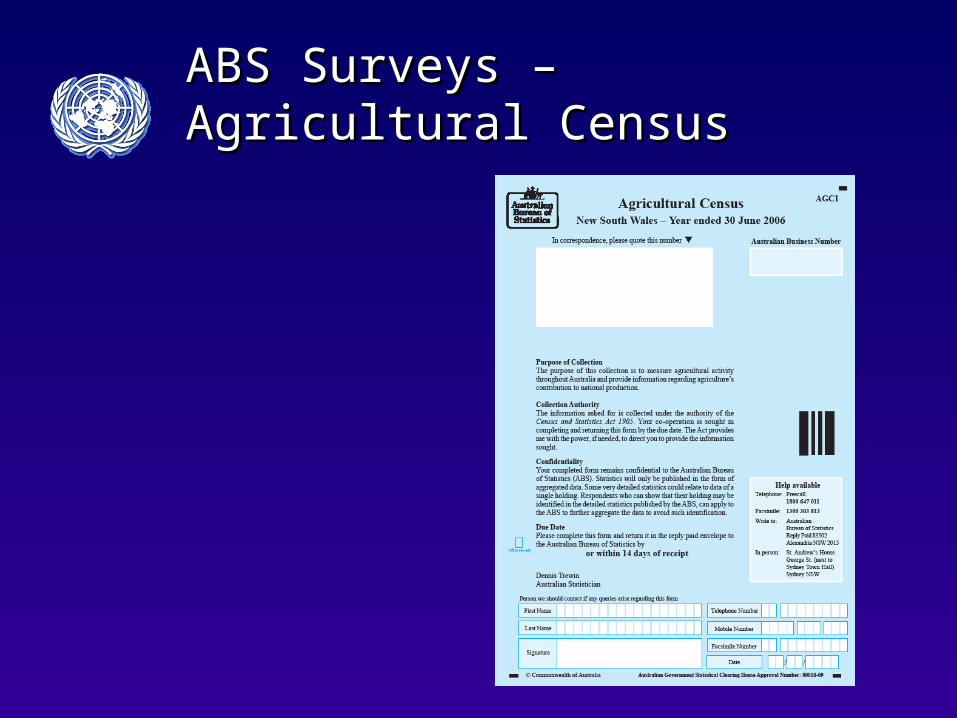
ABS Surveys – ABS Surveys – Agricultural CensusAgricultural Census
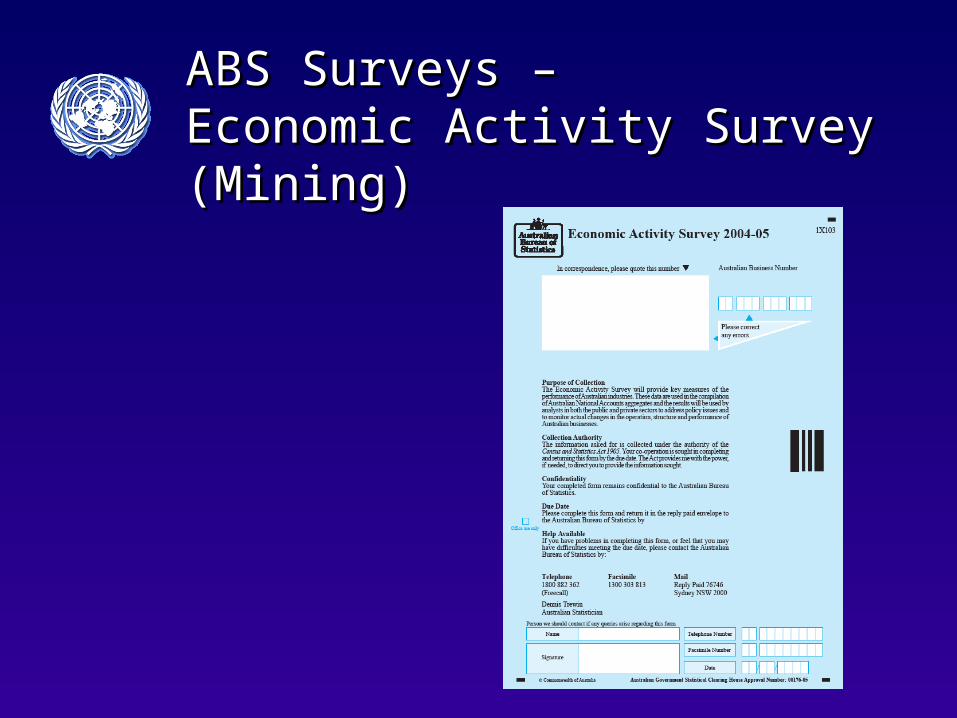
ABS Surveys – ABS Surveys – Economic Activity Survey (Mining)Economic Activity Survey (Mining)
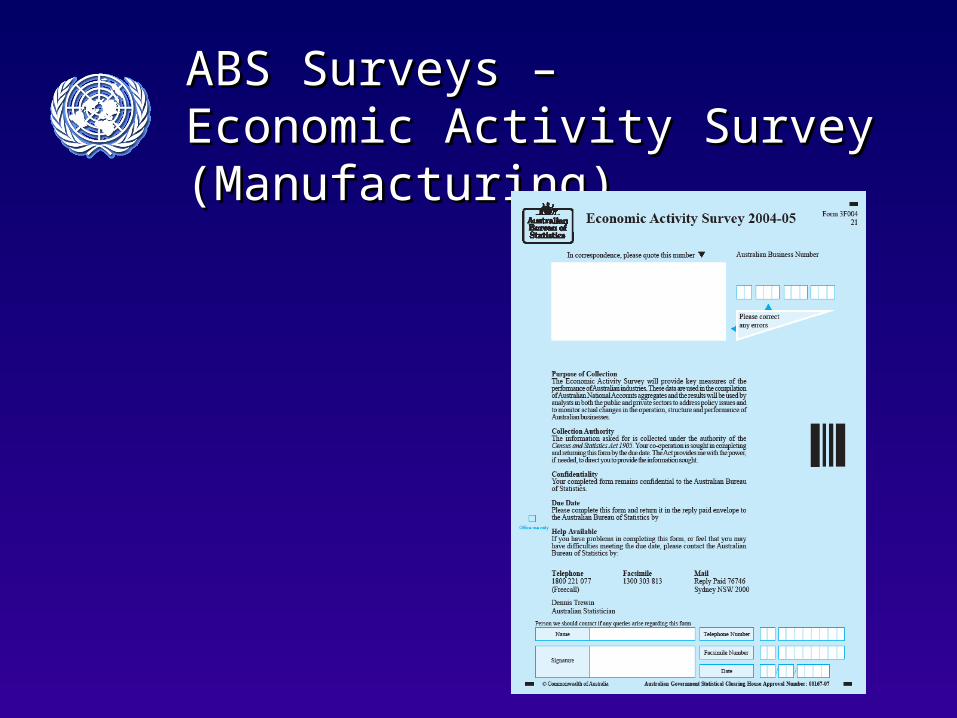
ABS Surveys – ABS Surveys – Economic Activity Survey Economic Activity Survey (Manufacturing)(Manufacturing)
Intensive follow-up, 1Intensive follow-up, 1
• Survey forms will often be filled in by a Survey forms will often be filled in by a financial officer or business accountant who financial officer or business accountant who may not have easy access to the data may not have easy access to the data requiredrequired
• Intensive follow-up required and should be Intensive follow-up required and should be targeted at large water using industries. For targeted at large water using industries. For example:example:• Pulp and paper manufacturing, Pulp and paper manufacturing, • Food and beverage manufacturingFood and beverage manufacturing• Metals manufacturing Metals manufacturing • Electricity generationElectricity generation
Intensive follow-up, 2Intensive follow-up, 2
Steps for intensive follow-up in AustraliaSteps for intensive follow-up in Australia• 11stst Reminder letter Reminder letter• 22ndnd Reminder letter Reminder letter• Phone call - important to carefully train staff. Also Phone call - important to carefully train staff. Also
it may be possible to collect key data items over it may be possible to collect key data items over the phonethe phone
• Final reminder Final reminder • Notice of Direction (fill in the form or be Notice of Direction (fill in the form or be
summoned to court)summoned to court)
Data checking / input editingData checking / input editing
• Identification of outliers or improbable (that Identification of outliers or improbable (that is very large or very small numbers) are is very large or very small numbers) are identified for each industry (or region).identified for each industry (or region).
• Double check very large numbers with the Double check very large numbers with the data supplier (often units are wrongly data supplier (often units are wrongly reported (e.g. mreported (e.g. m33 reported not 1,000 m reported not 1,000 m33 or or acres not hectares)acres not hectares)
• Check blank cells – they may be zeroCheck blank cells – they may be zero

Contact detailsContact details
Michael VardonAdviser on Environmental-Economic AccountingUnited Nations Statistics DivisionNew York 10017 USARoom DC2 1532
Phone: +1 917 367 5391Fax: +1 917 363 1374Email: [email protected]