Embed Size (px)
Citation preview
1
Epidemiologic Measures of Association
Saeed Akhtar, PhDAssociate Professor, Epidemiology
Division of Epidemiology and BiostatisticsAga Khan University, Karachi, Pakistan
2
Epidemiologic Measures of Association
•Session ObjectivesBy the end of session students should be able to:
•Compute & Interpret Relative risk (RR) & Odds ratio (OR) as a measure of association between exposure and Disease
• Understand when OR approximates RR
3
Definitions Association
• A statistical relationship between two or more variables
Risk• Probability conditional or unconditional of
the occurrence of some event in time
• Probability of an individual developing a disease or change in health status over a fixed time interval, conditional on the individual not dying during the same time period
Absolute risk
4
Association between exposure & Disease
• Question: Is there an excess risk associated with a given exposure?
• Objective:To determine whether certain exposure is associated with a given disease
• Methodology:Use one of the epidemiologic study designs
CohortCase-control
5
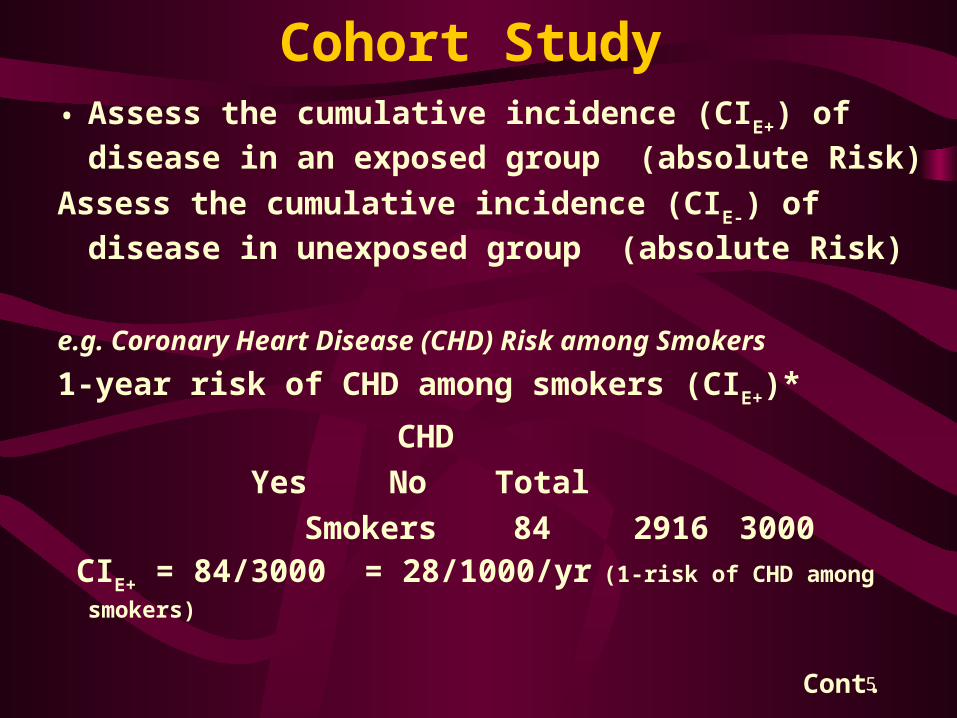
Cohort Study• Assess the cumulative incidence (CIE+) of
disease in an exposed group (absolute Risk)Assess the cumulative incidence (CIE-) of
disease in unexposed group (absolute Risk)
e.g. Coronary Heart Disease (CHD) Risk among Smokers
1-year risk of CHD among smokers (CIE+)*
CHD Yes No Total Smokers 84 2916 3000 CIE+ = 84/3000 = 28/1000/yr (1-risk of CHD among
smokers)
Cont.
6
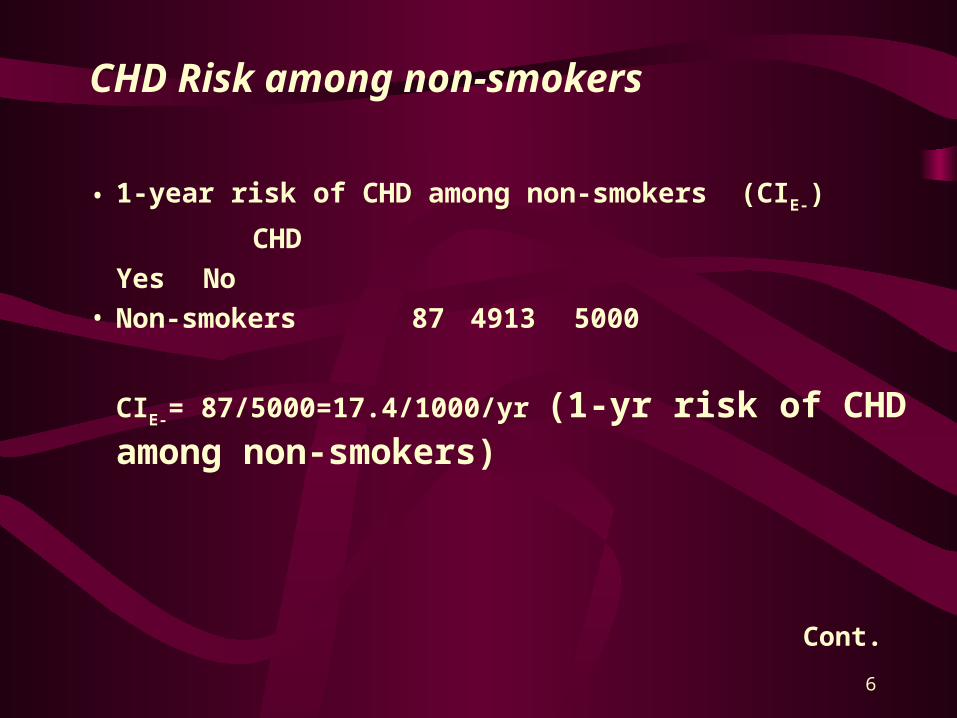
CHD Risk among non-smokers
• 1-year risk of CHD among non-smokers (CIE-)
CHDYes No
• Non-smokers 87 4913 5000
CIE-= 87/5000=17.4/1000/yr (1-yr risk of CHD among non-smokers)
Cont.
7
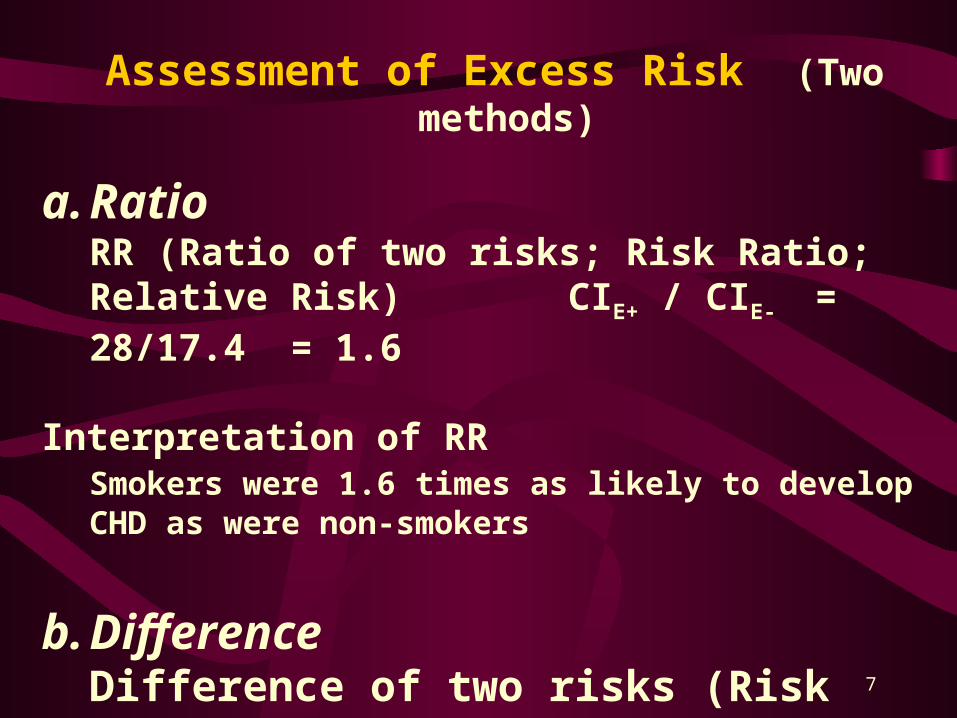
Assessment of Excess Risk (Two methods)
a.Ratio RR (Ratio of two risks; Risk Ratio; Relative Risk) CIE+ / CIE- = 28/17.4 = 1.6
Interpretation of RR Smokers were 1.6 times as likely to develop CHD as were non-smokers
b.DifferenceDifference of two risks (Risk Difference)*
CIE+- CIE-= 28.0 – 17.4 = 10.6
8
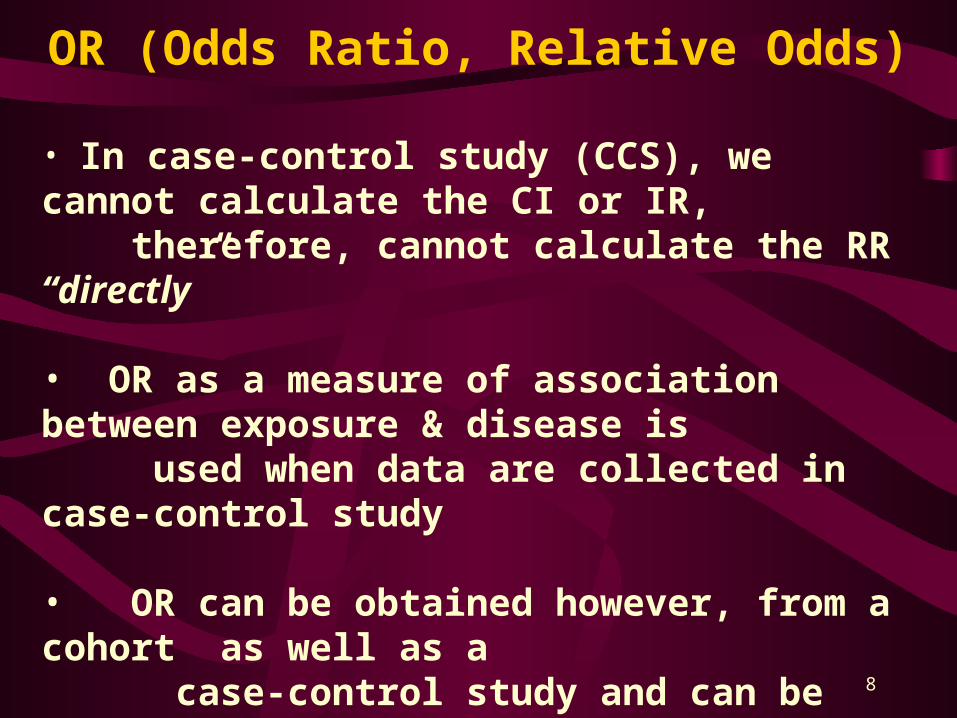
OR (Odds Ratio, Relative Odds)
• In case-control study (CCS), we cannot calculate the CI or IR, therefore, cannot calculate the RR “directly”
• OR as a measure of association between exposure & disease is used when data are collected in case-control study
• OR can be obtained however, from a cohort as well as a case-control study and can be used instead of RR.
9
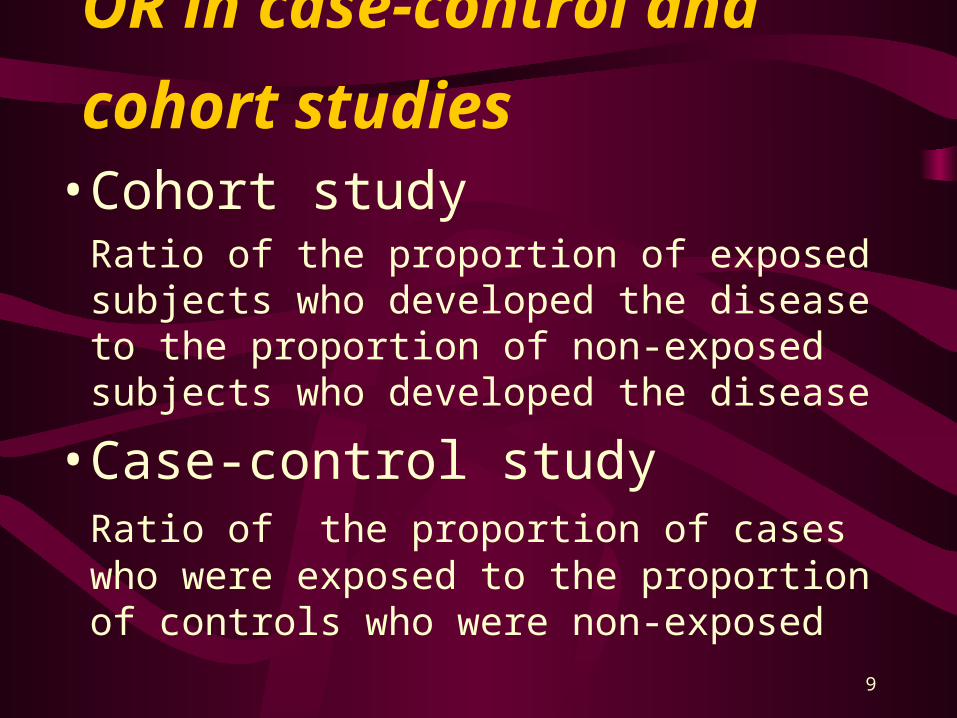
OR in case-control
and cohort studies • Cohort study
Ratio of the proportion of exposed subjects who developed the disease to the proportion of non-exposed subjects who developed the disease
• Case-control studyRatio of the proportion of cases who were exposed to the proportion of controls who were non-exposed
10
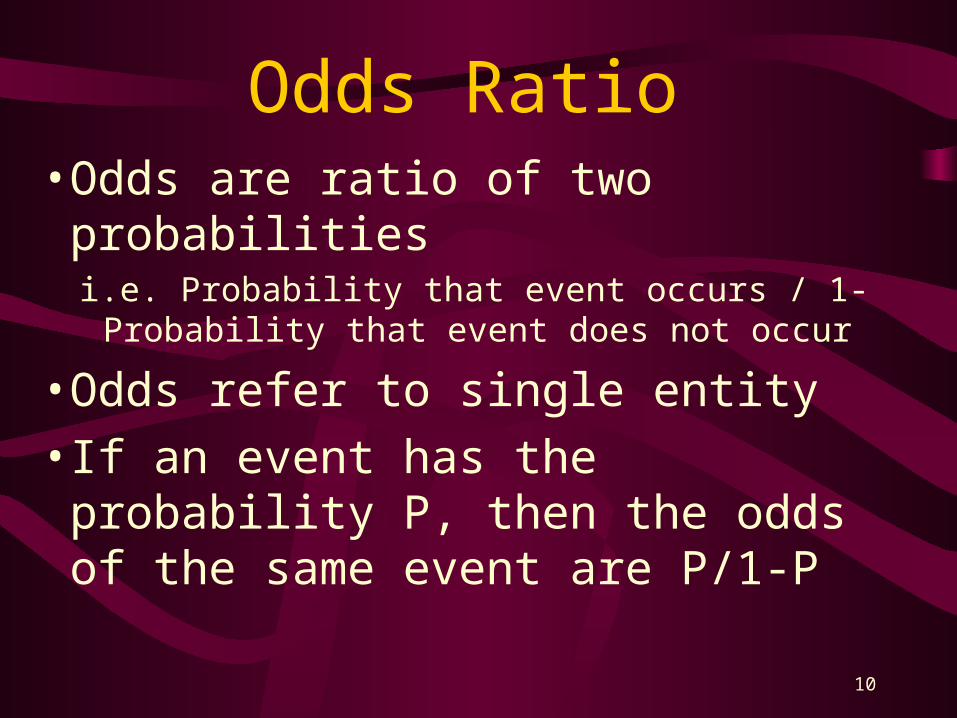
Odds Ratio• Odds are ratio of two probabilities
i.e. Probability that event occurs / 1-Probability that event does not occur
• Odds refer to single entity• If an event has the probability P, then
the odds of the same event are P/1-P
11
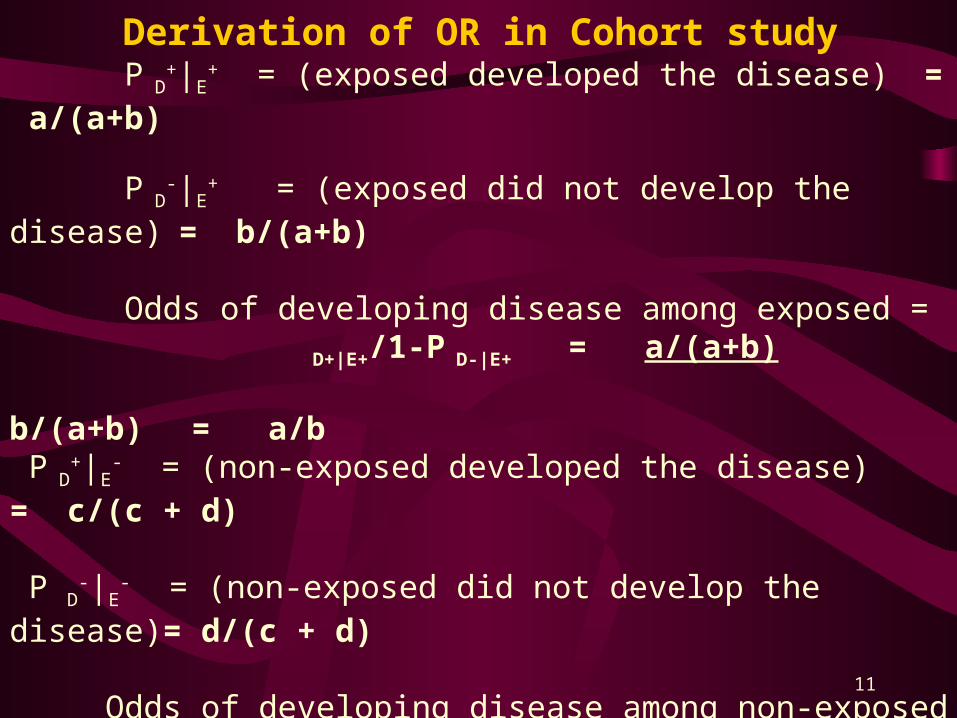
Derivation of OR in Cohort study P D
+|E+ = (exposed developed the disease) =
a/(a+b) P D
-|E+ = (exposed did not develop the disease) =
b/(a+b) Odds of developing disease among exposed =
D+|E+/1-P D-|E+ = a/(a+b) b/(a+b) = a/b
P D
+|E- = (non-exposed developed the disease) = c/(c
+ d)
P D-|E
- = (non-exposed did not develop the disease)= d/(c + d)
Odds of developing disease among non-exposed =
= PD+|E-/1-P D+|E
- = c/(c+d)
d/(c + d) = c/d
Odds ratio a/b : c/d = ad/bc
12
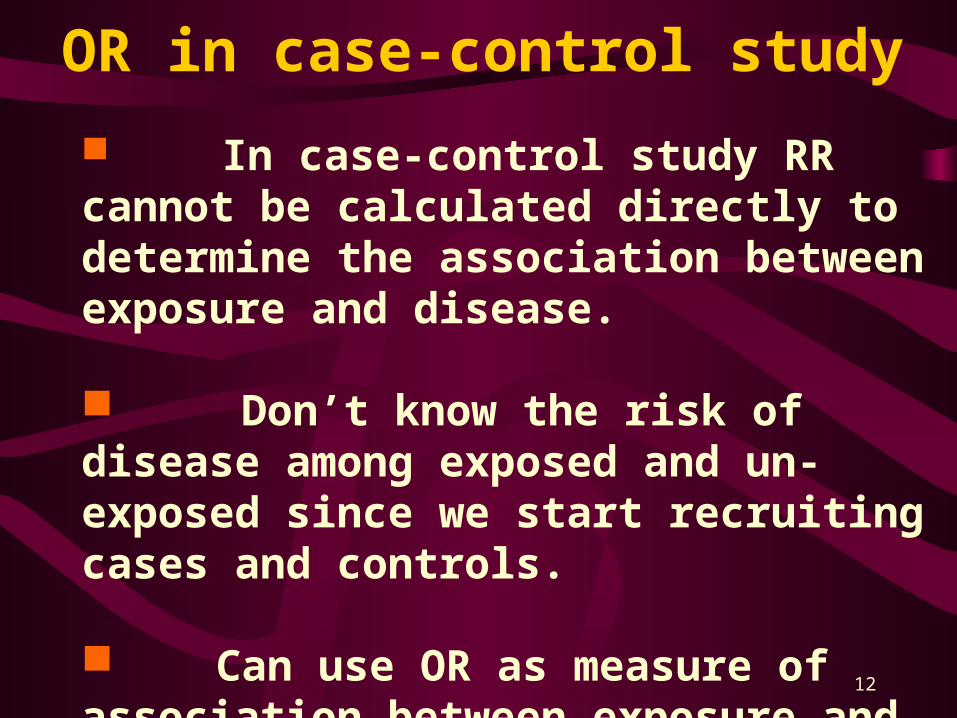
OR in case-control study
In case-control study RR cannot be calculated directly to determine the association between exposure and disease.
Don’t know the risk of disease among exposed and un-exposed since we start recruiting cases and controls.
Can use OR as measure of association between exposure and disease in a case control study.
13
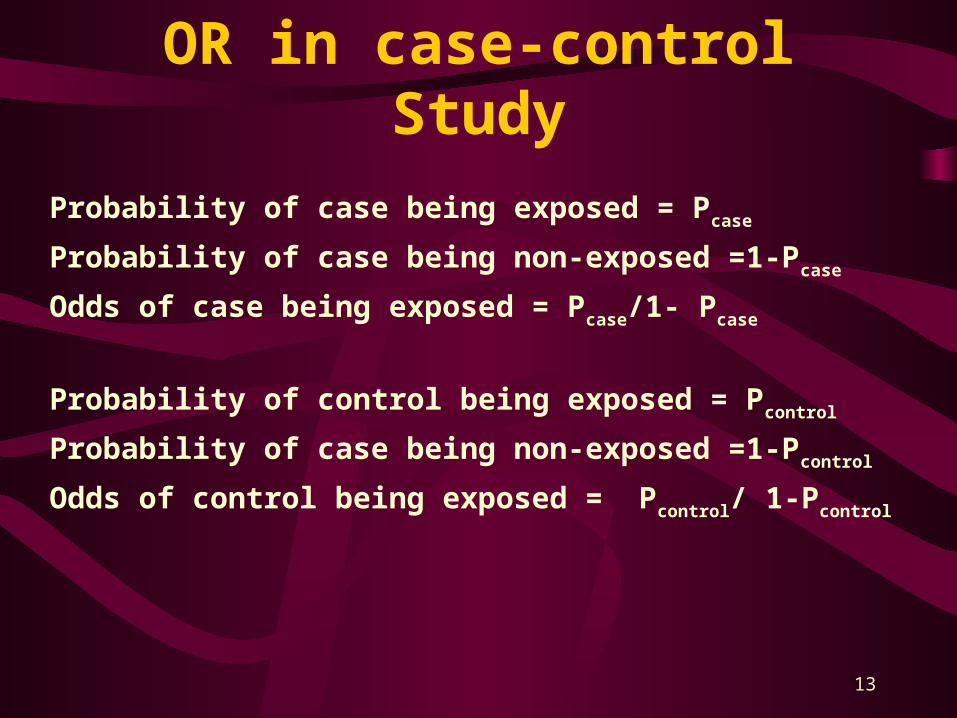
OR in case-control Study
Probability of case being exposed = Pcase
Probability of case being non-exposed =1-Pcase
Odds of case being exposed = Pcase/1- Pcase
Probability of control being exposed = Pcontrol
Probability of case being non-exposed =1-Pcontrol
Odds of control being exposed = Pcontrol/ 1-Pcontrol
14
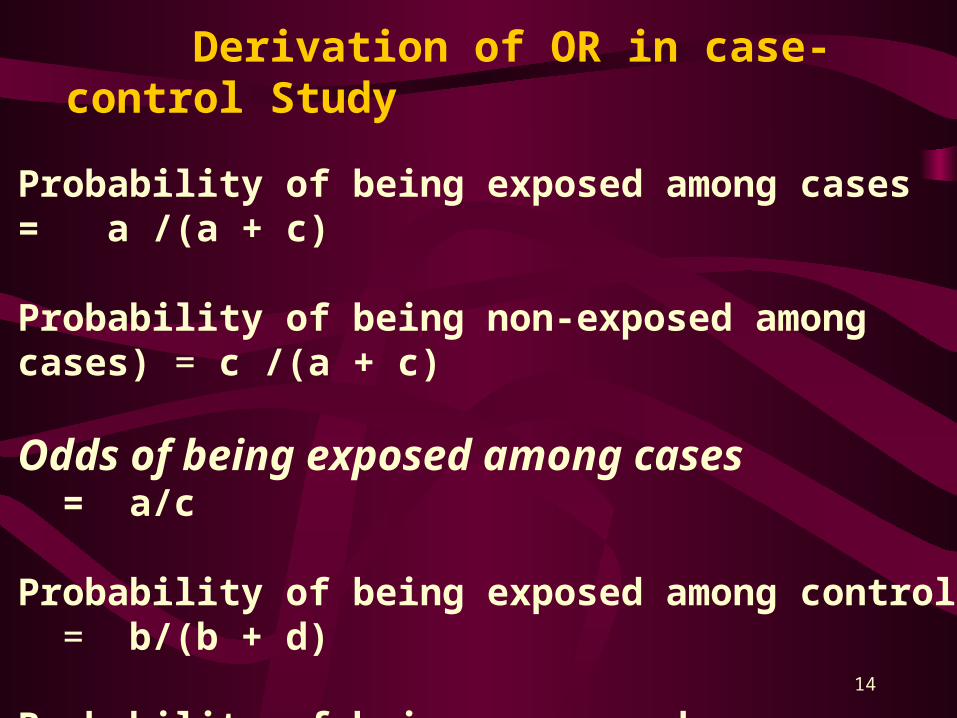
Derivation of OR in case-control Study
Probability of being exposed among cases = a /(a + c)
Probability of being non-exposed among cases) = c /(a + c)
Odds of being exposed among cases = a/c
Probability of being exposed among controls = b/(b + d)
Probability of being unexposed among controls = d/(b + d)
Odds of being exposed among controls = b/d
OR = ad/bc
15
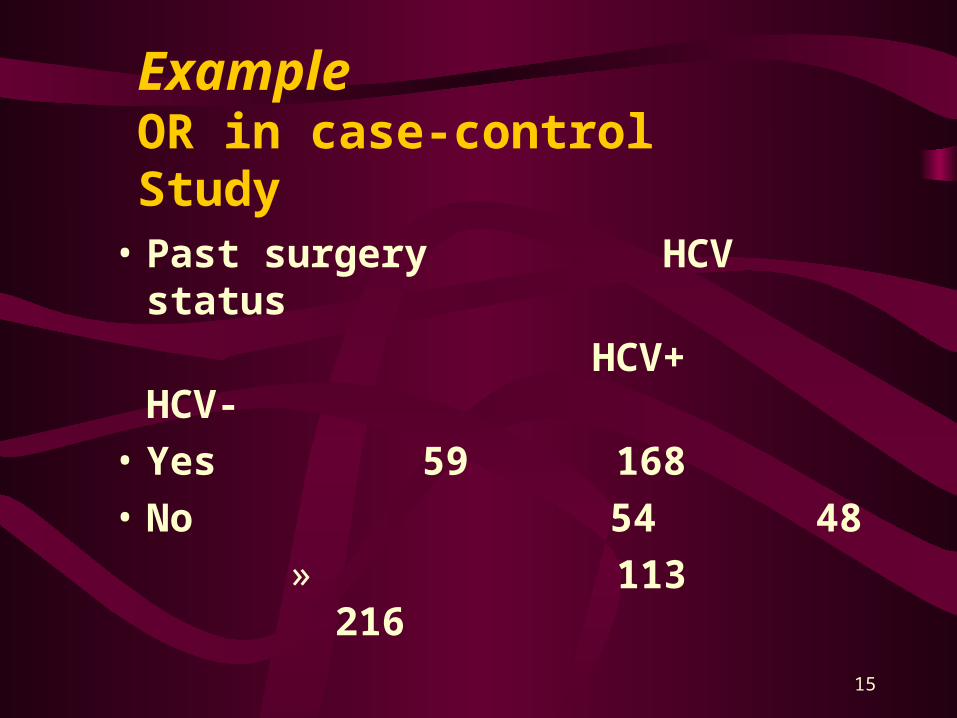
• Past surgery HCV status
HCV+ HCV-
• Yes 59 168
• No 54 48
» 113 216
ExampleOR in case-control Study
16
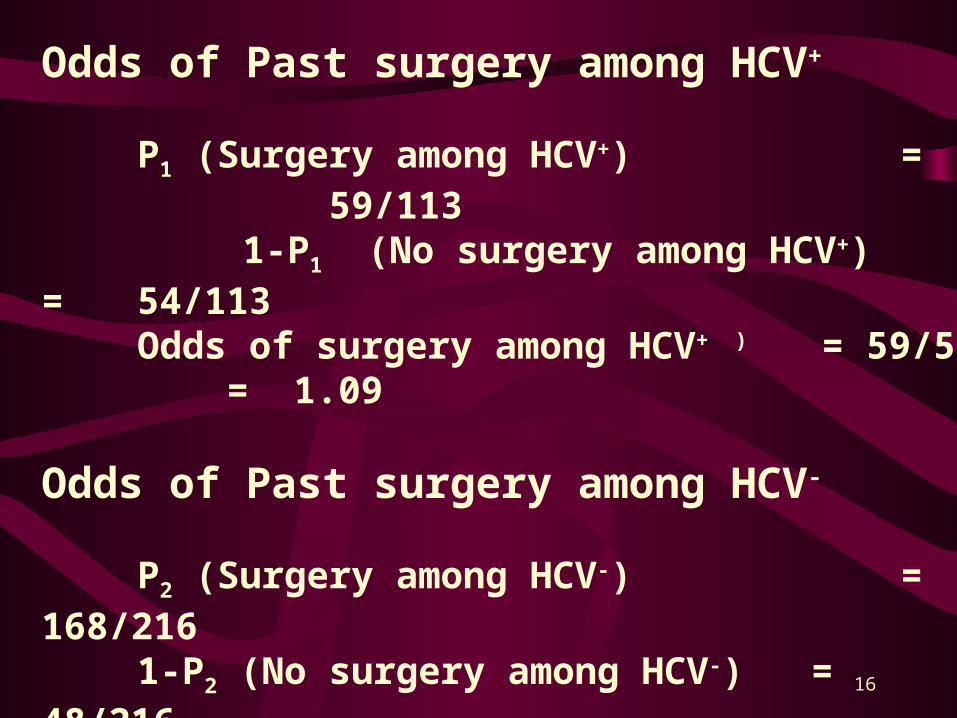
Odds of Past surgery among HCV+
P1 (Surgery among HCV+) = 59/113 1-P1 (No surgery among HCV+) = 54/113
Odds of surgery among HCV+ ) = 59/54 = 1.09
Odds of Past surgery among HCV-
P2 (Surgery among HCV-) = 168/2161-P2 (No surgery among HCV-) = 48/216Odds of surgery among HCV- = 168/48 = 3.5
OR = 3.50/1.09 = 3.21
17
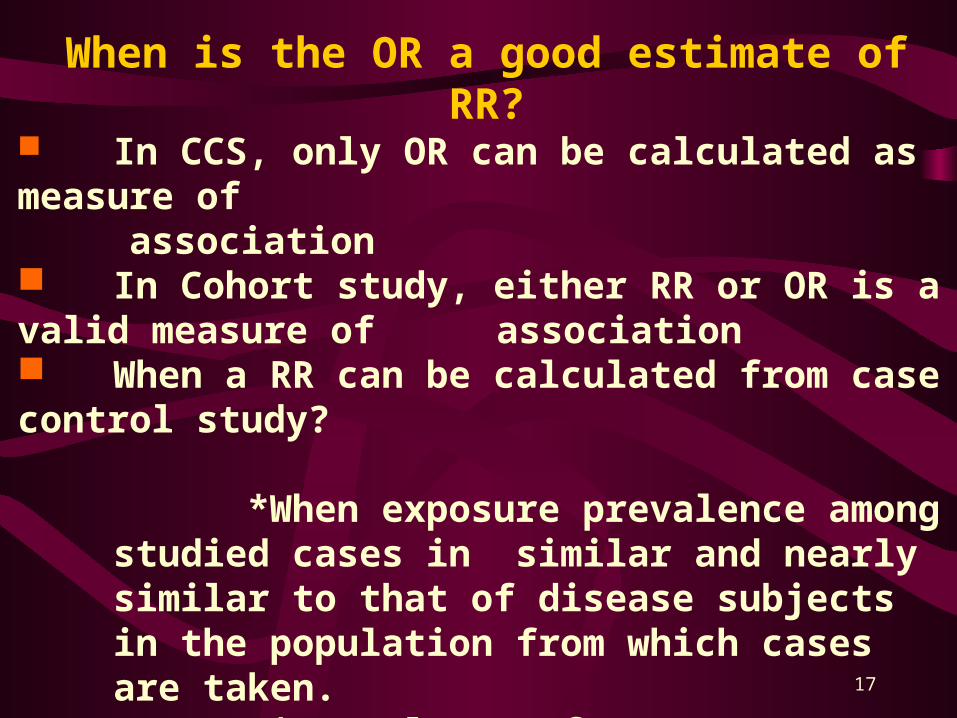
When is the OR a good estimate of RR? In CCS, only OR can be calculated as measure of association In Cohort study, either RR or OR is a valid measure of association When a RR can be calculated from case control study?
*When exposure prevalence among studied cases in similar and nearly similar to that of disease subjects in the population from which cases are taken. *Prevalence of exposure among studied controls is similar to that of non-diseased population from cases were drawn. *Rare disease (CI < 0.1)
18
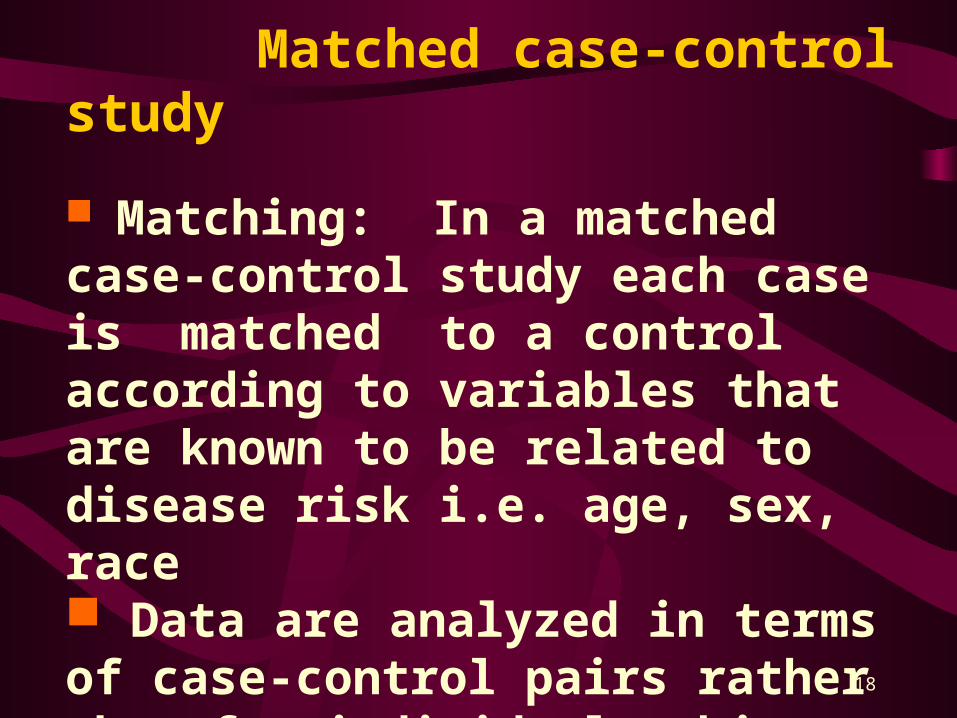
Matched case-control study
Matching: In a matched case-control study each case is matched to a control according to variables that are known to be related to disease risk i.e. age, sex, race Data are analyzed in terms of case-control pairs rather than for individual subjects Four types of case-control combinations are possible in regard to exposure history.
19
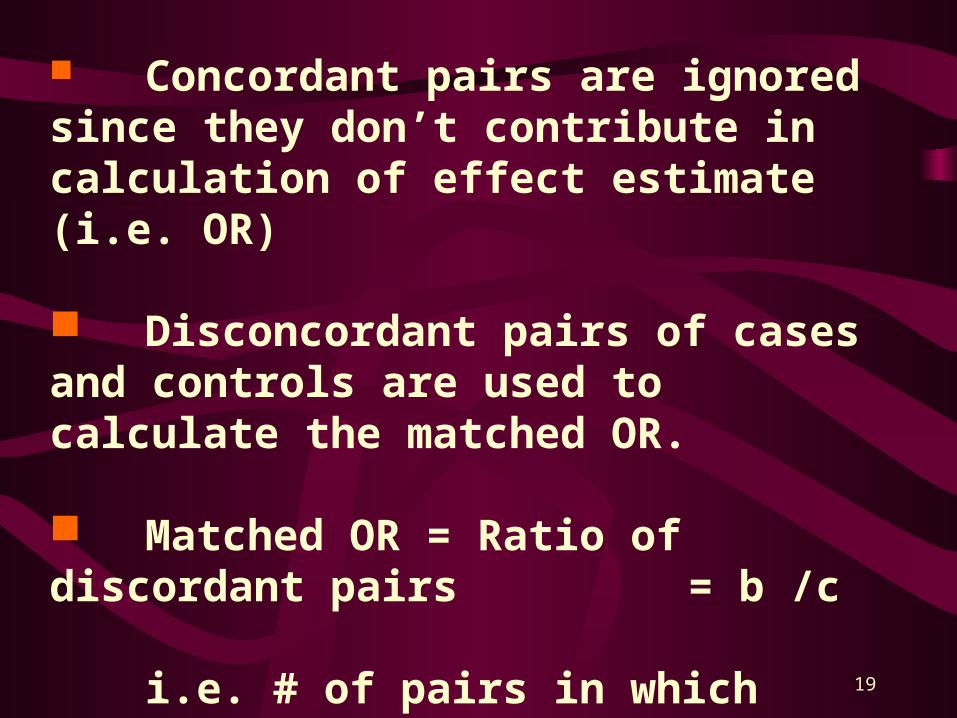
Concordant pairs are ignored since they don’t contribute in calculation of effect estimate (i.e. OR)
Disconcordant pairs of cases and controls are used to calculate the matched OR.
Matched OR = Ratio of discordant pairs = b /c
i.e. # of pairs in which cases exposed / # of pairs in which controls were exposed
20
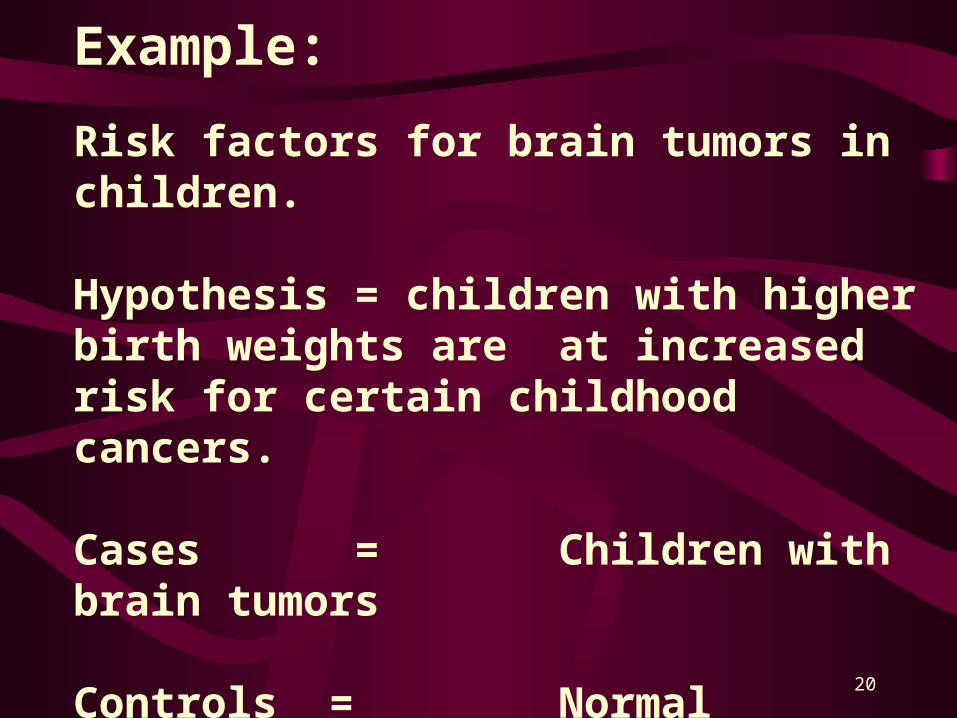
Example:
Risk factors for brain tumors in children.
Hypothesis = children with higher birth weights are at increased risk for certain childhood cancers.
Cases = Children with brain tumors
Controls = Normal children
Exposure = Birth weight > 8 lbs.
21
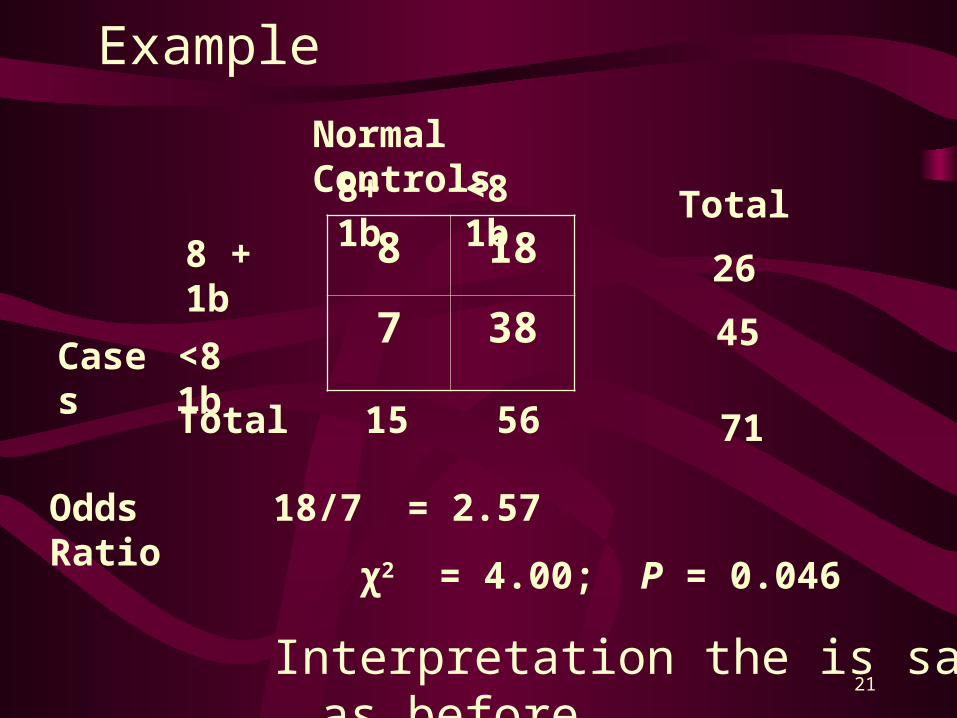
8 18
7 38
8 + 1b
Cases <8 1b
Total
26
45
15 56 71
8+ 1b <8 1b
Total
Normal Controls
Odds Ratio 18/7 = 2.57
χ2 = 4.00; P = 0.046
Interpretation the is same as before
Example


![(c) B. Gerstman 2007Chapter 91 Epidemiology Kept Simple Chapter 9: Types of Epidemiologic Studies [Introduction to Analytic Studies]](https://img.pdfslide.net/doc/110x75/56649d6b5503460f94a4a898/c-b-gerstman-2007chapter-91-epidemiology-kept-simple-chapter-9-types-of.jpg)