Embed Size (px)
Citation preview
1
IEA Energy Scenarios for India for 2030
Lars StrupeitMalé Declaration: Emission inventory preparation / scenarios /
atmospheric transport modelling and soil acidification workshopUNEP RRCAP, Bangkok, Thailand. 28 January to 1 February 2008
2
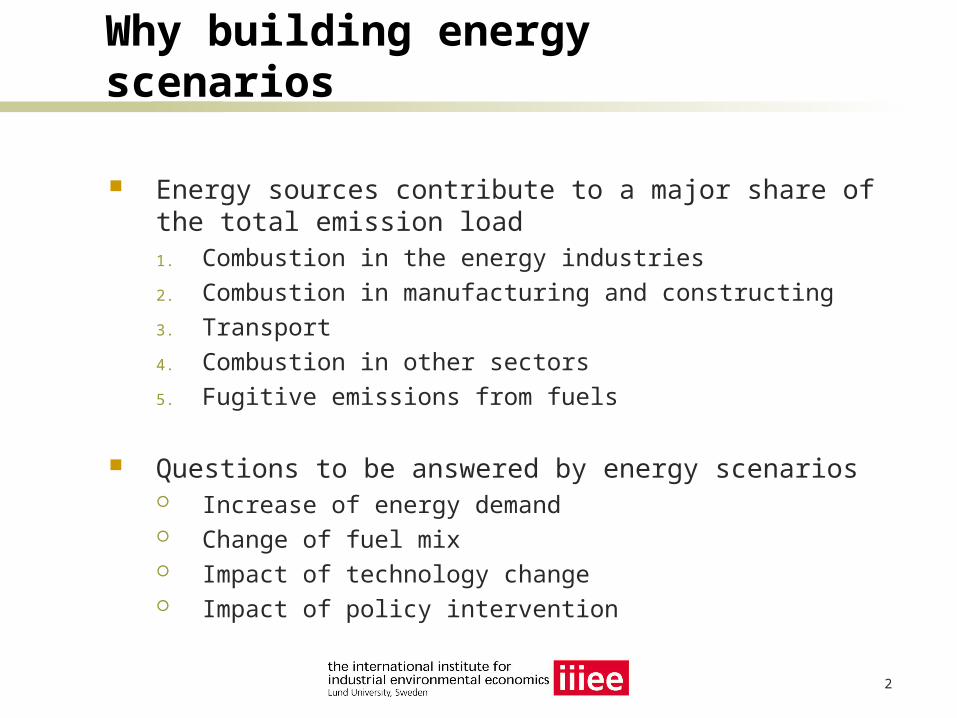
Why building energy scenarios
Energy sources contribute to a major share of the total emission load1. Combustion in the energy industries
2. Combustion in manufacturing and constructing
3. Transport
4. Combustion in other sectors
5. Fugitive emissions from fuels
Questions to be answered by energy scenarios Increase of energy demand Change of fuel mix Impact of technology change Impact of policy intervention
3
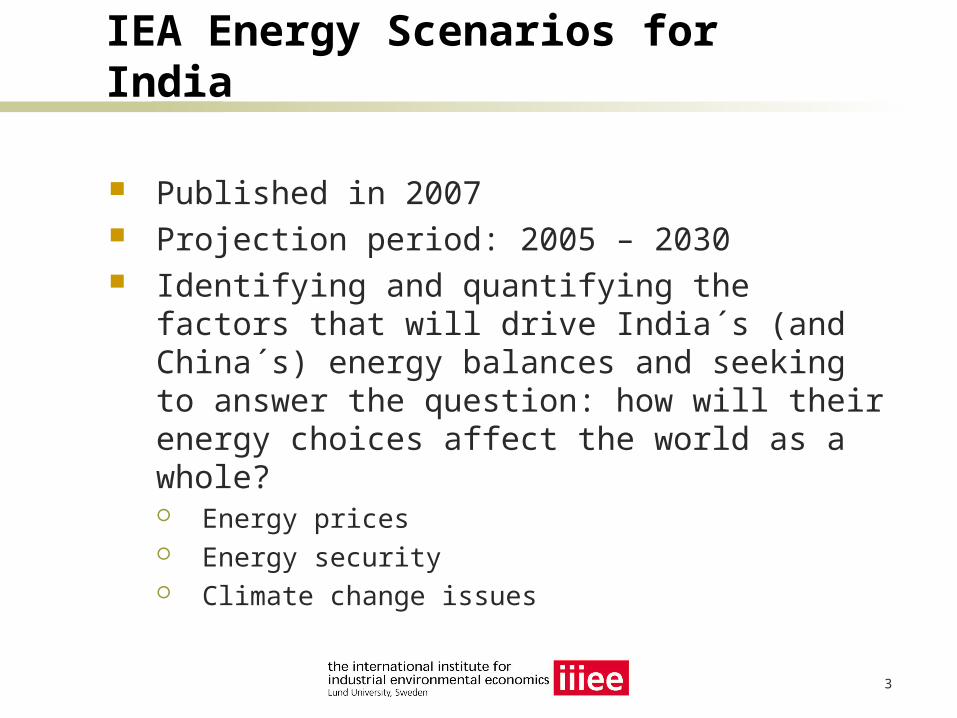
IEA Energy Scenarios for India
Published in 2007 Projection period: 2005 – 2030 Identifying and quantifying the factors that will drive
India´s (and China´s) energy balances and seeking to answer the question: how will their energy choices affect the world as a whole? Energy prices Energy security Climate change issues
4
IEA Energy Scenarios for India
Cooperation with the Energy and Resources Institute (TERI) in New Delhi and “other public and private bodies in India”
5
The IEA World Energy Model (WEM)
Large-scale mathematical model designed to replicate how energy markets function
Incorporates detailed “bottom-up” sub-models of the energy system
For India a rural urban breakdown in the residential sector has been introduced
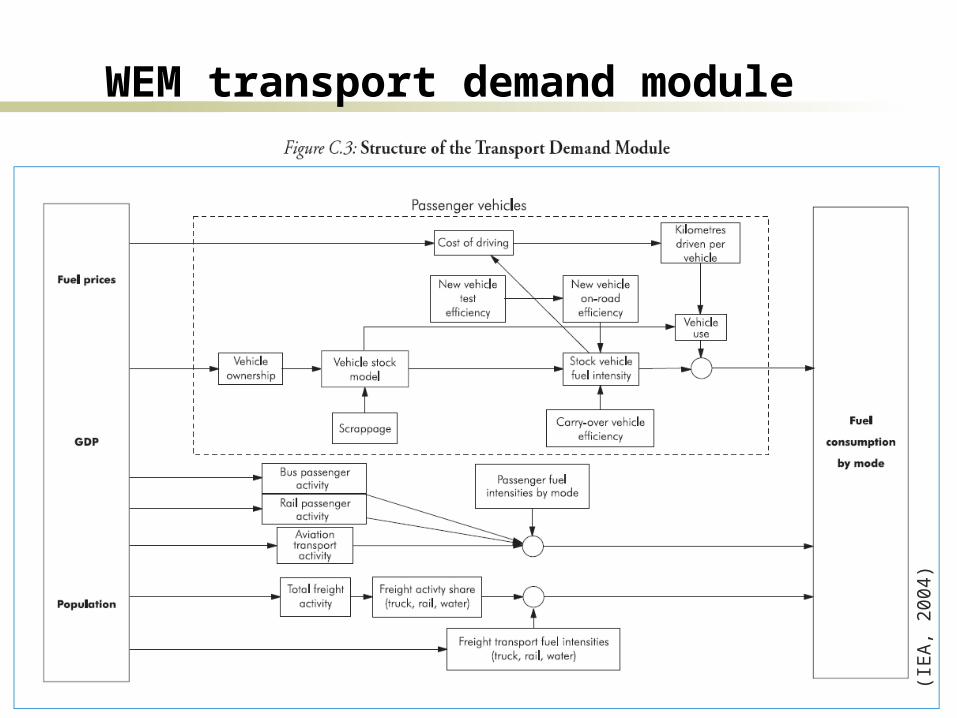
WEM transport demand module
(IE
A,
2004
)
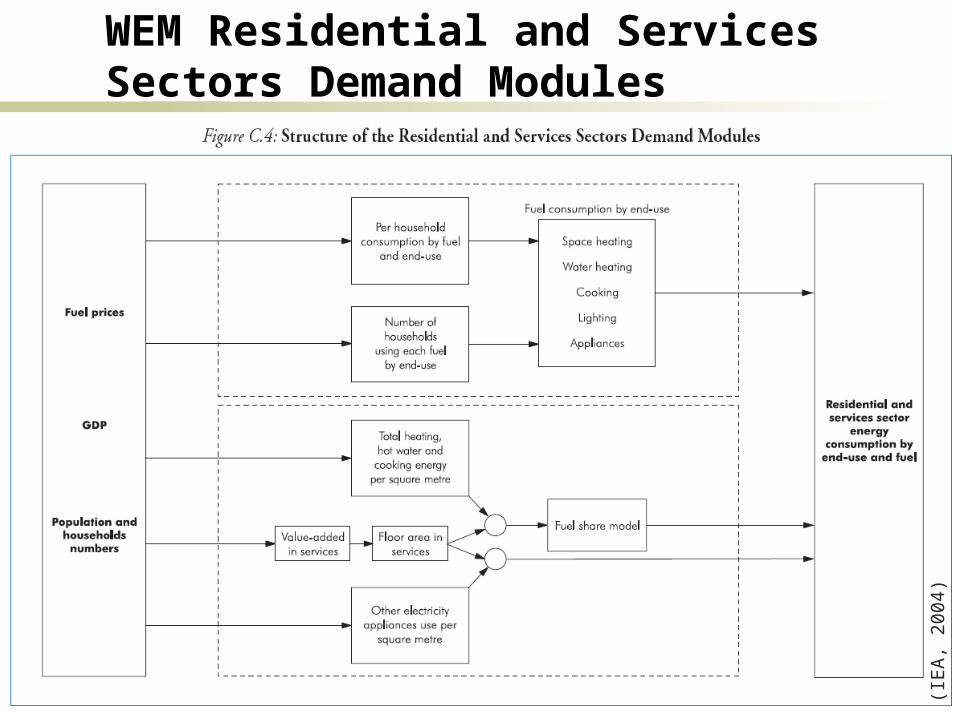
WEM Residential and Services Sectors Demand Modules
(IE
A,
2004
)
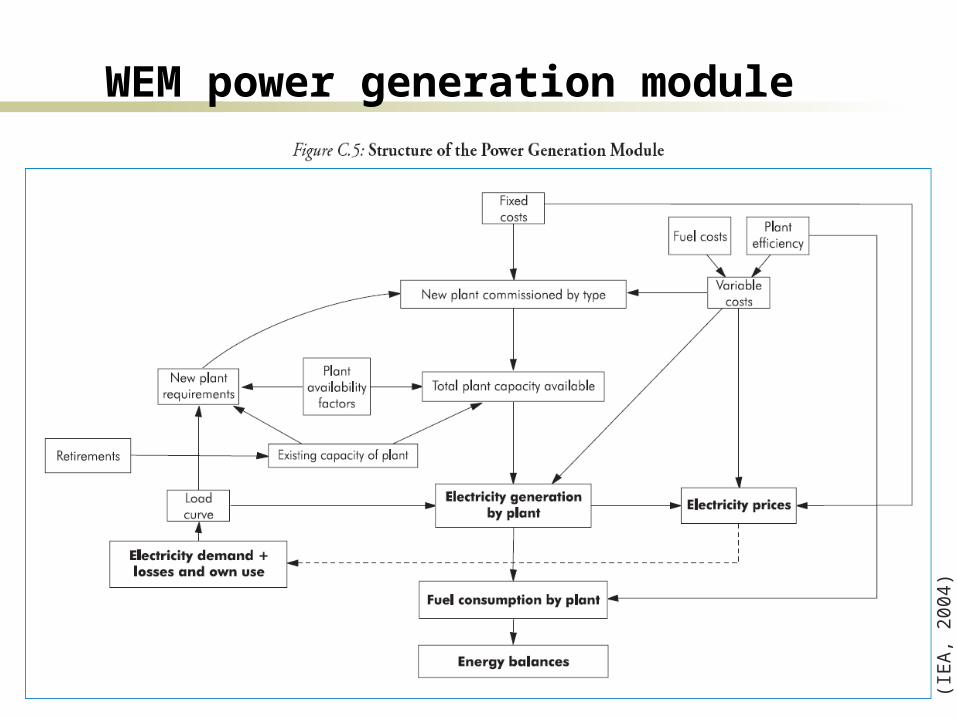
WEM power generation module
(IE
A,
2004
)
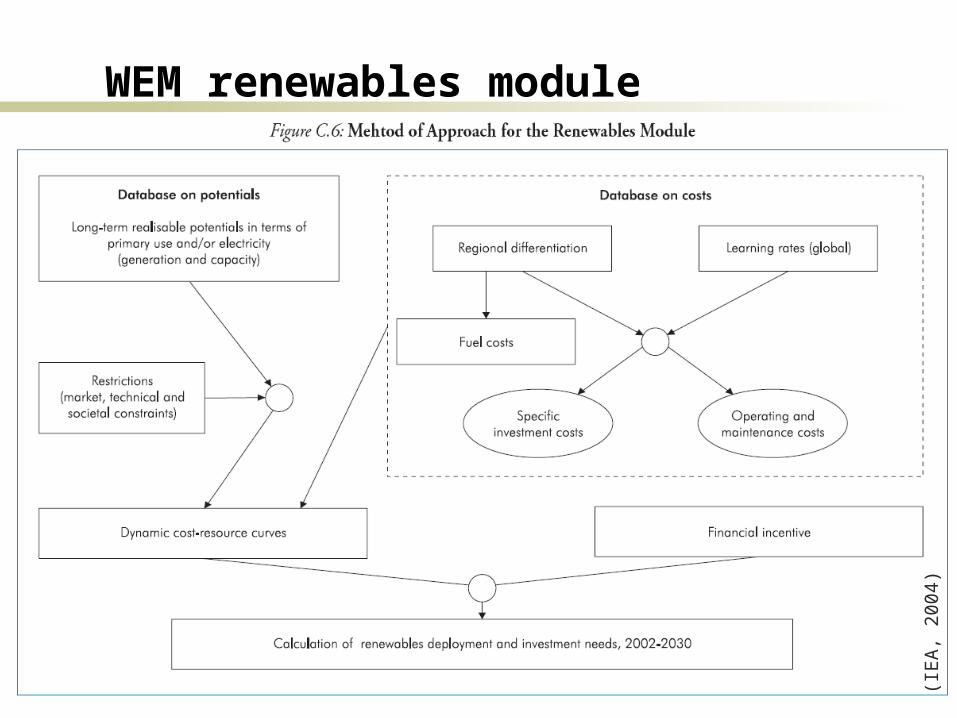
WEM renewables module
(IE
A,
2004
)
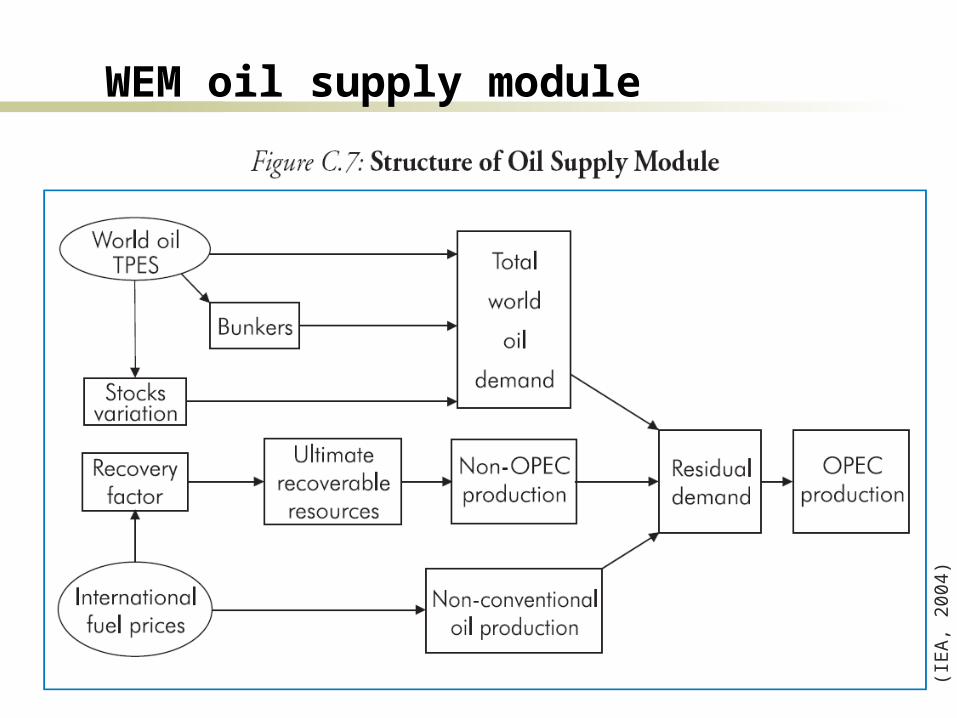
WEM oil supply module
(IE
A,
2004
)
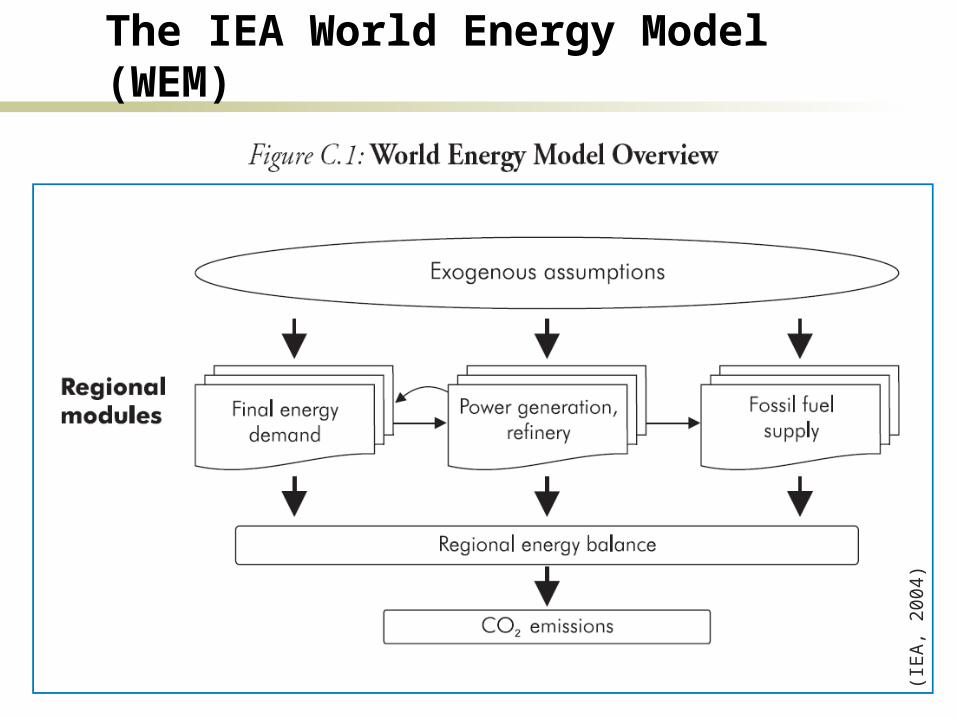
The IEA World Energy Model (WEM)
(IE
A,
2004
)
12
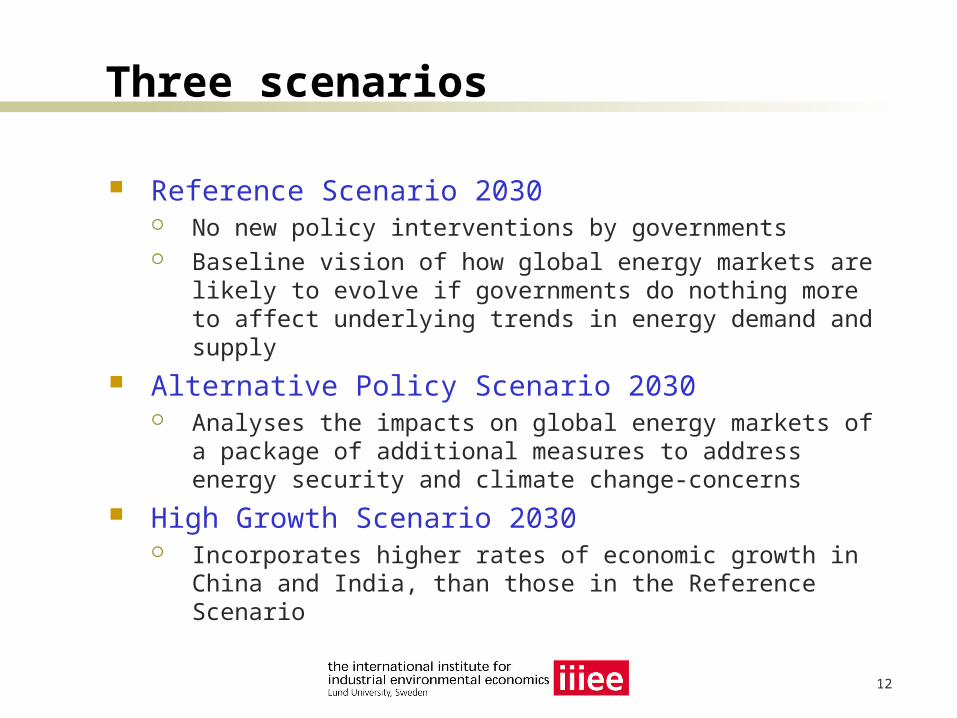
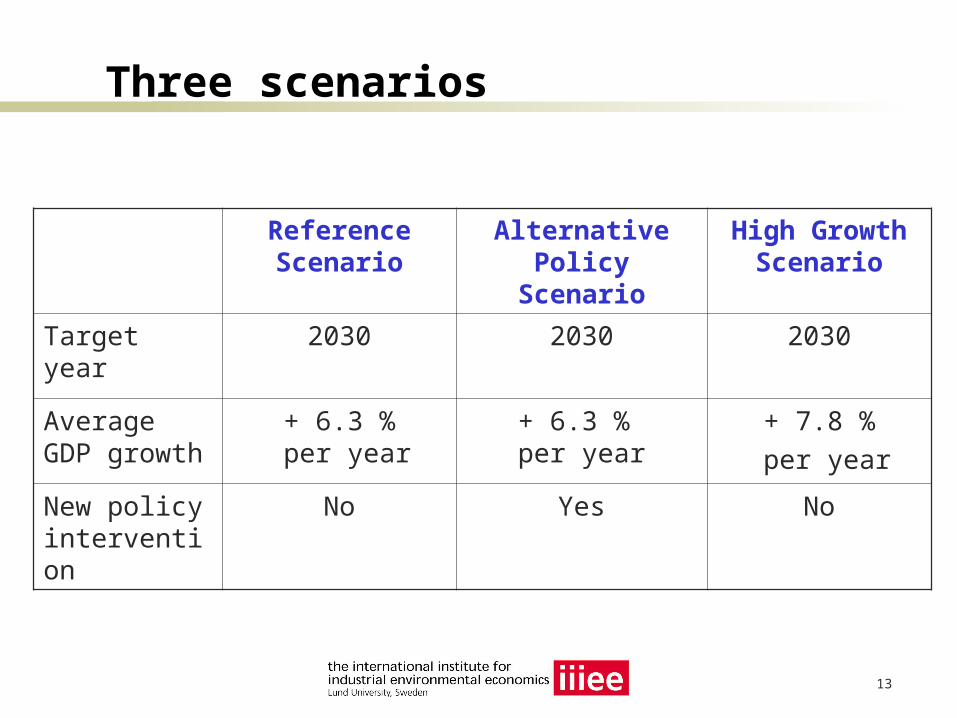
Three scenarios
Reference Scenario 2030 No new policy interventions by governments Baseline vision of how global energy markets are likely to
evolve if governments do nothing more to affect underlying trends in energy demand and supply
Alternative Policy Scenario 2030 Analyses the impacts on global energy markets of a
package of additional measures to address energy security and climate change-concerns
High Growth Scenario 2030 Incorporates higher rates of economic growth in China
and India, than those in the Reference Scenario
13
Three scenarios
Reference Scenario
Alternative Policy Scenario
High Growth Scenario
Target year 2030 2030 2030
Average GDP growth
+ 6.3 % per year
+ 6.3 % per year
+ 7.8 %
per year
New policy intervention
No Yes No
14
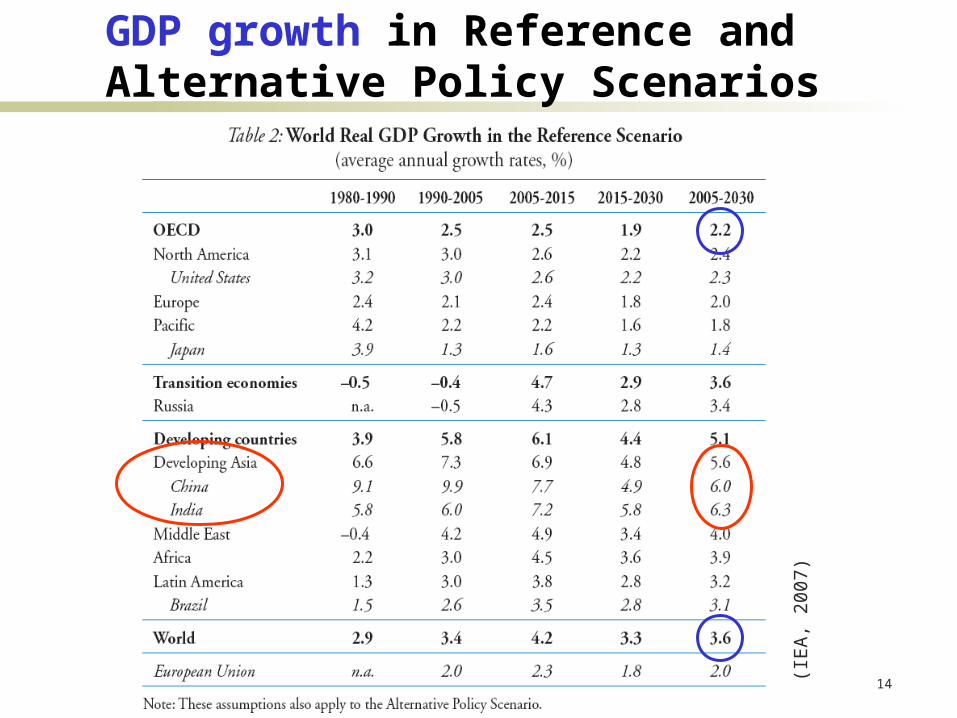
GDP growth in Reference and Alternative Policy Scenarios
(IE
A,
2007
)
15
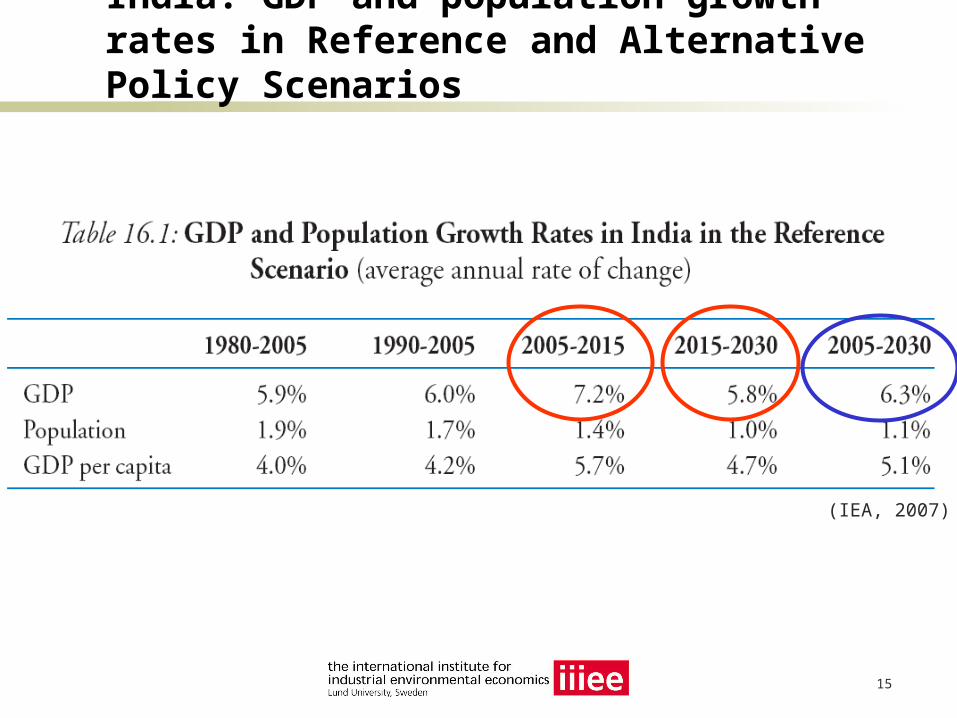
India: GDP and population growth rates in Reference and Alternative Policy Scenarios
(IEA, 2007)
16
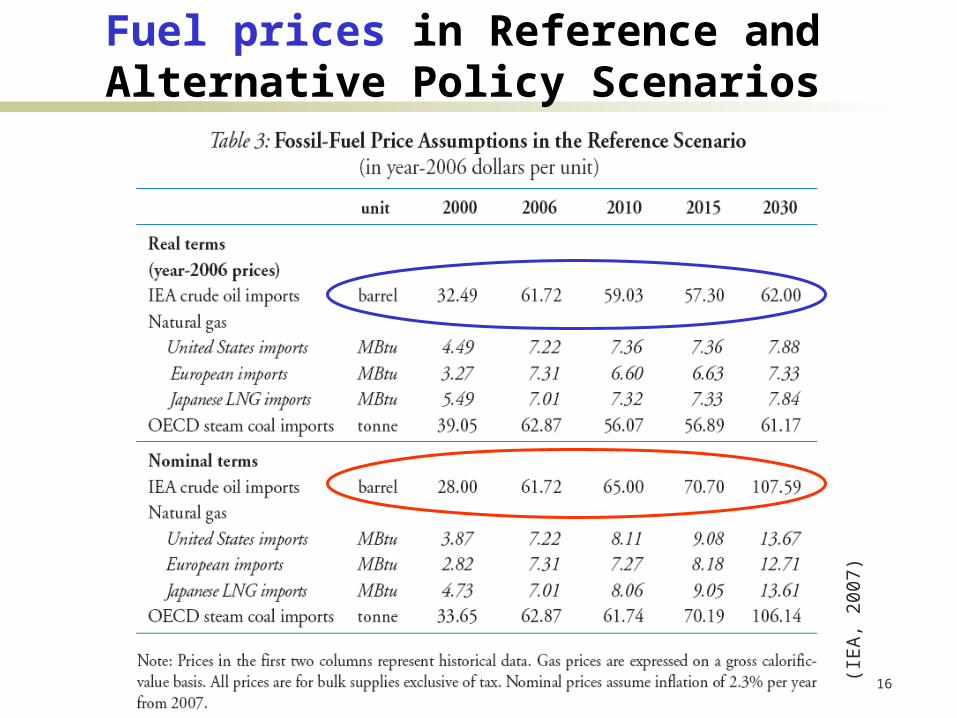
Fuel prices in Reference and Alternative Policy Scenarios
(IE
A,
2007
)
17
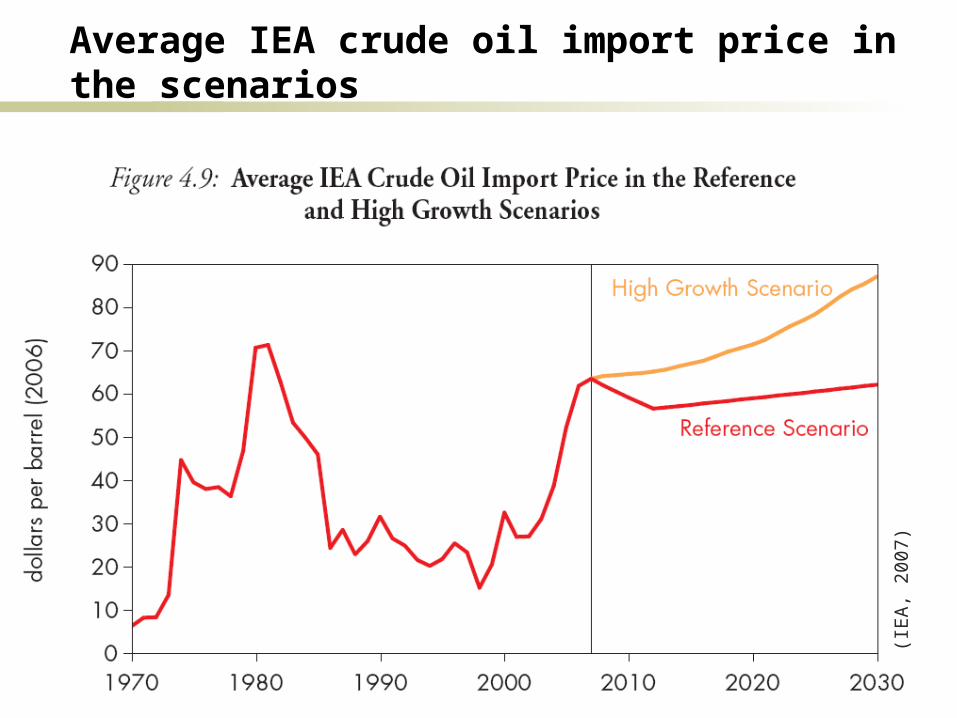
Average IEA crude oil import price in the scenarios
(IE
A,
2007
)
18
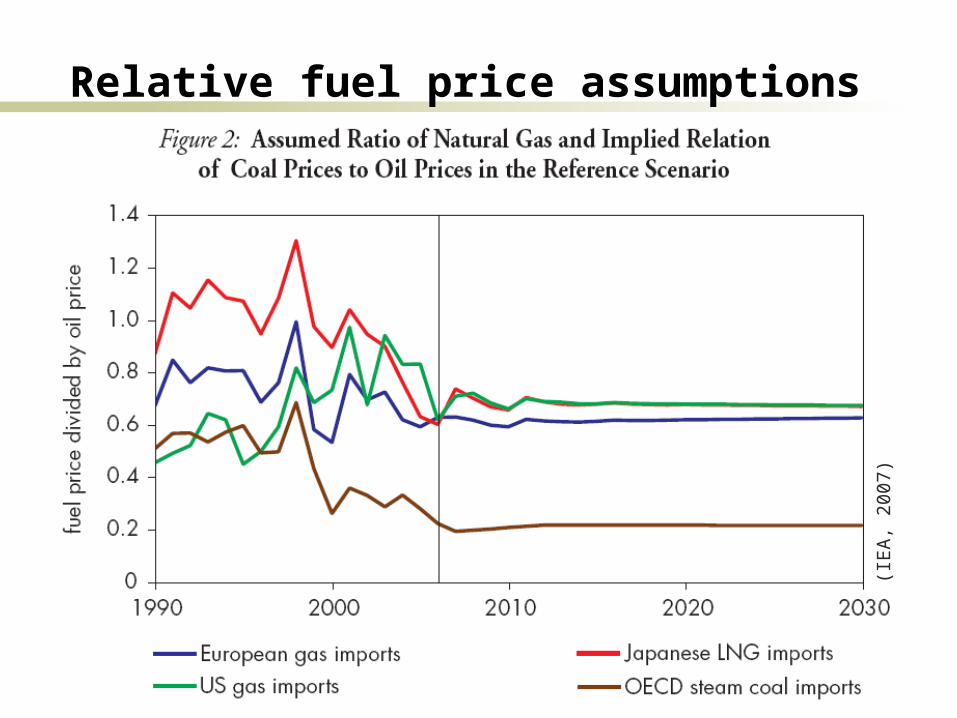
Relative fuel price assumptions
(IE
A,
2007
)
19
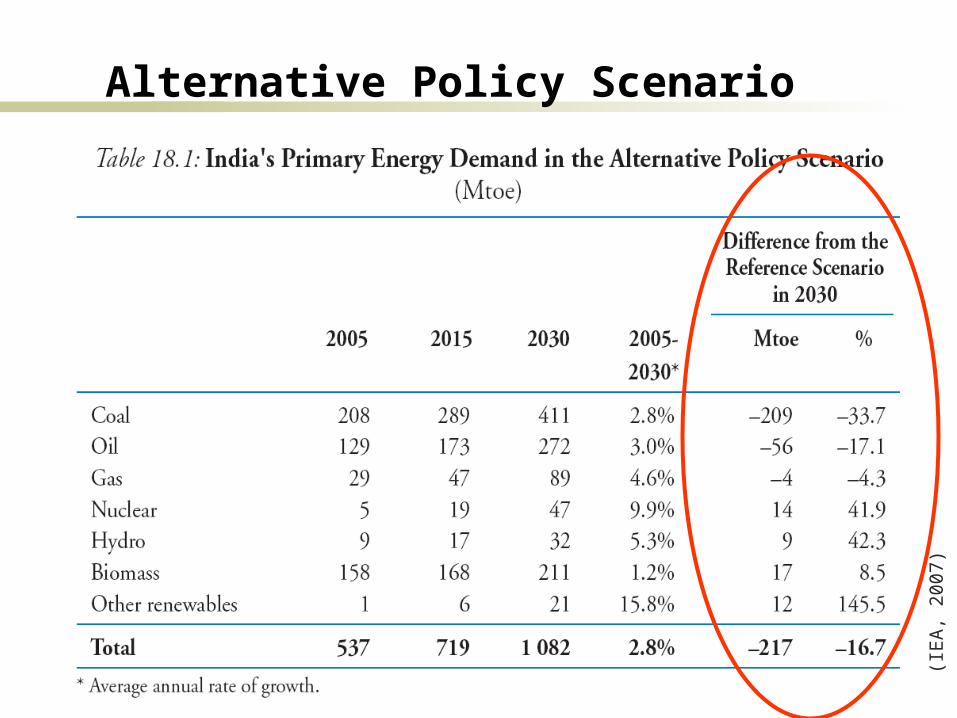
Alternative Policy Scenario
Macroeconomic and population assumptions are the same as in the Reference Scenario
Only policies aimed at enhancing energy security and/or addressing environmental problems including climate change are considered
20
SCENARIO OUTCOMES
21
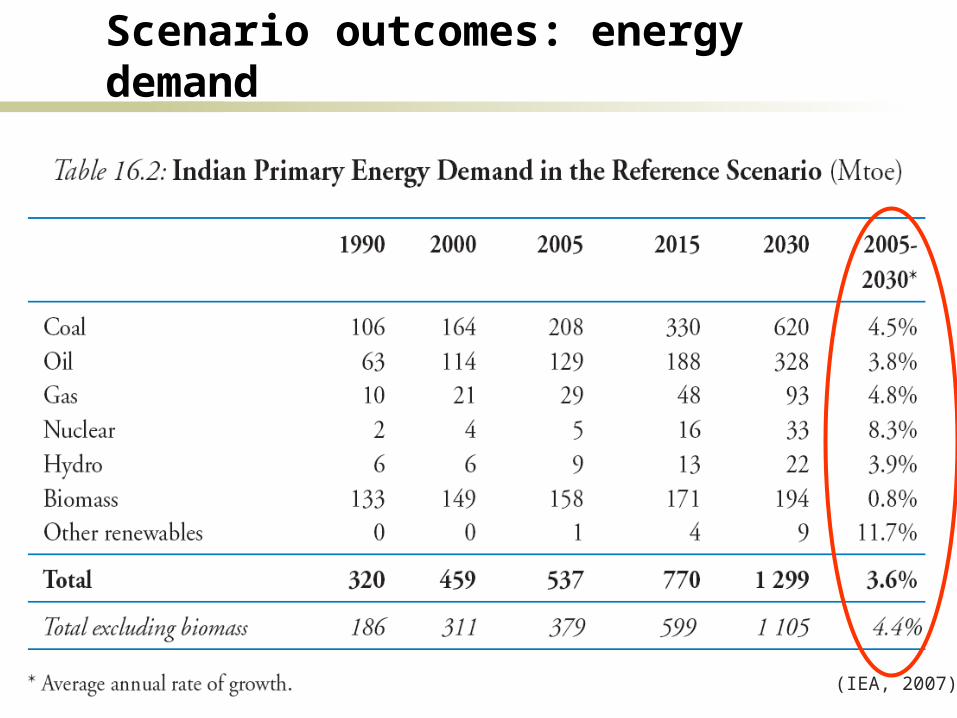
Scenario outcomes: energy demand
(IEA, 2007)
22
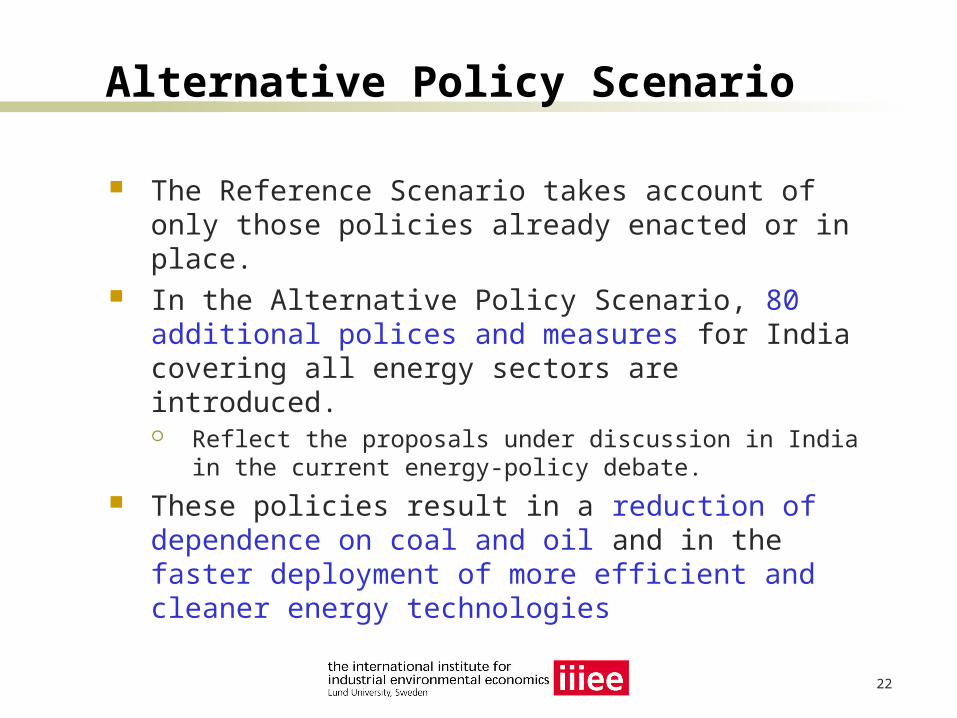
Alternative Policy Scenario
The Reference Scenario takes account of only those policies already enacted or in place.
In the Alternative Policy Scenario, 80 additional polices and measures for India covering all energy sectors are introduced. Reflect the proposals under discussion in India in the
current energy-policy debate.
These policies result in a reduction of dependence on coal and oil and in the faster deployment of more efficient and cleaner energy technologies
23
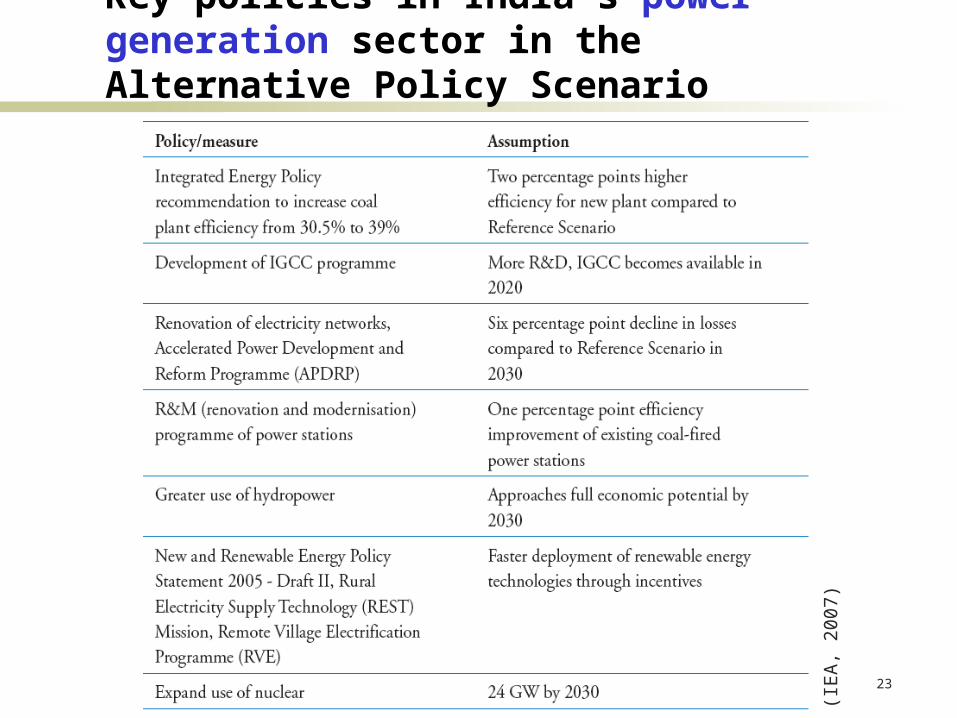
Key policies in India´s power generation sector in the Alternative Policy Scenario
(IE
A,
2007
)
24
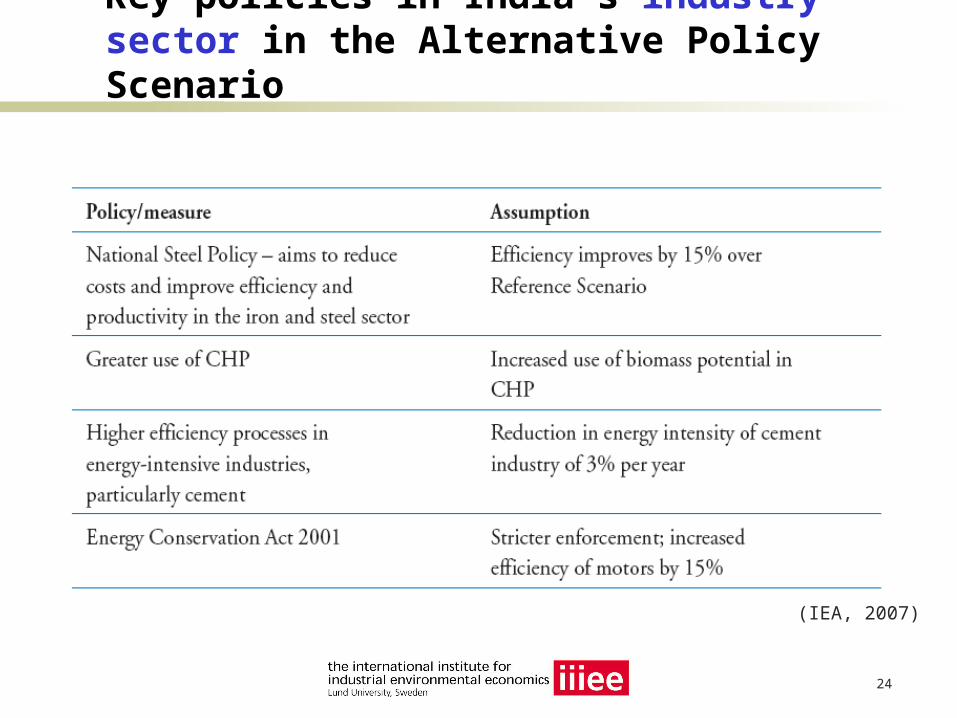
Key policies in India´s industry sector in the Alternative Policy Scenario
(IEA, 2007)
25
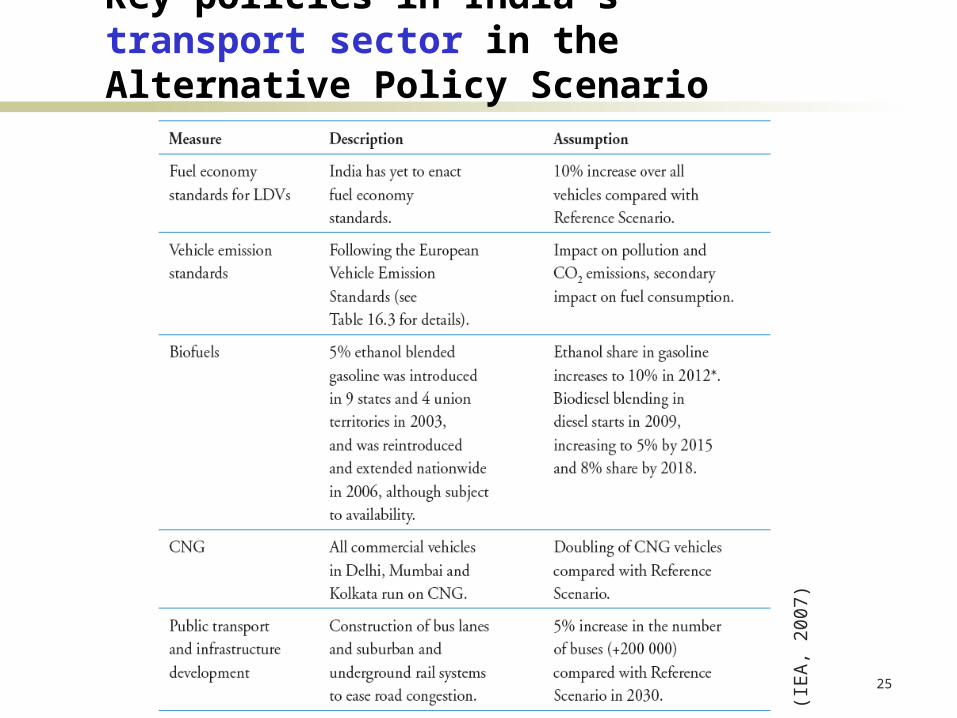
Key policies in India´s transport sector in the Alternative Policy Scenario
(IE
A,
2007
)
26
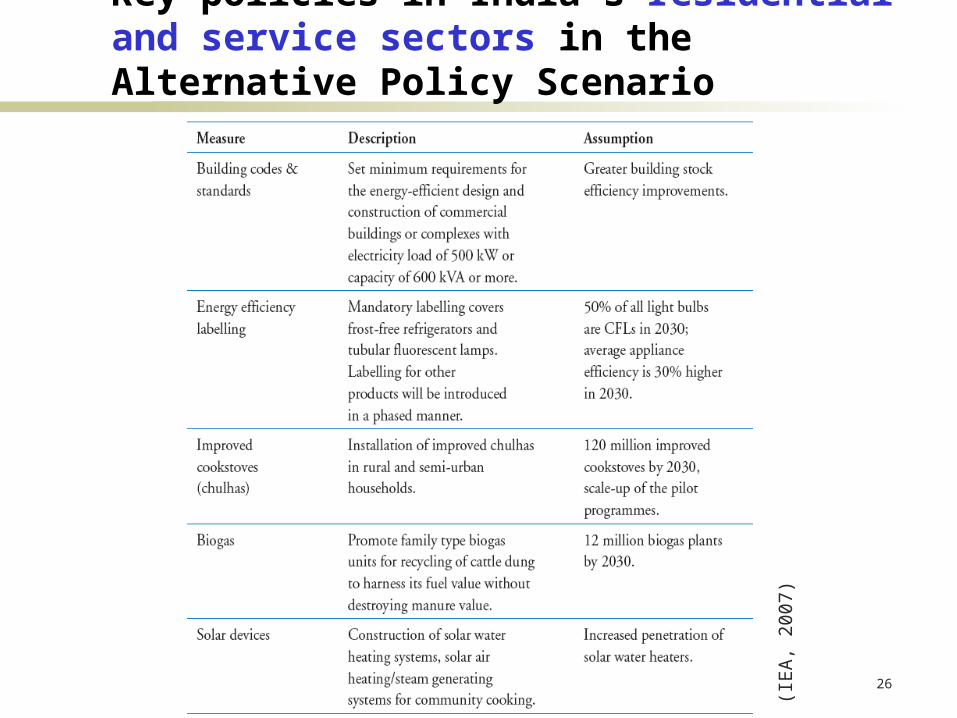
Key policies in India´s residential and service sectors in the Alternative Policy Scenario
(IE
A,
2007
)
27
Alternative Policy Scenario
(IE
A,
2007
)
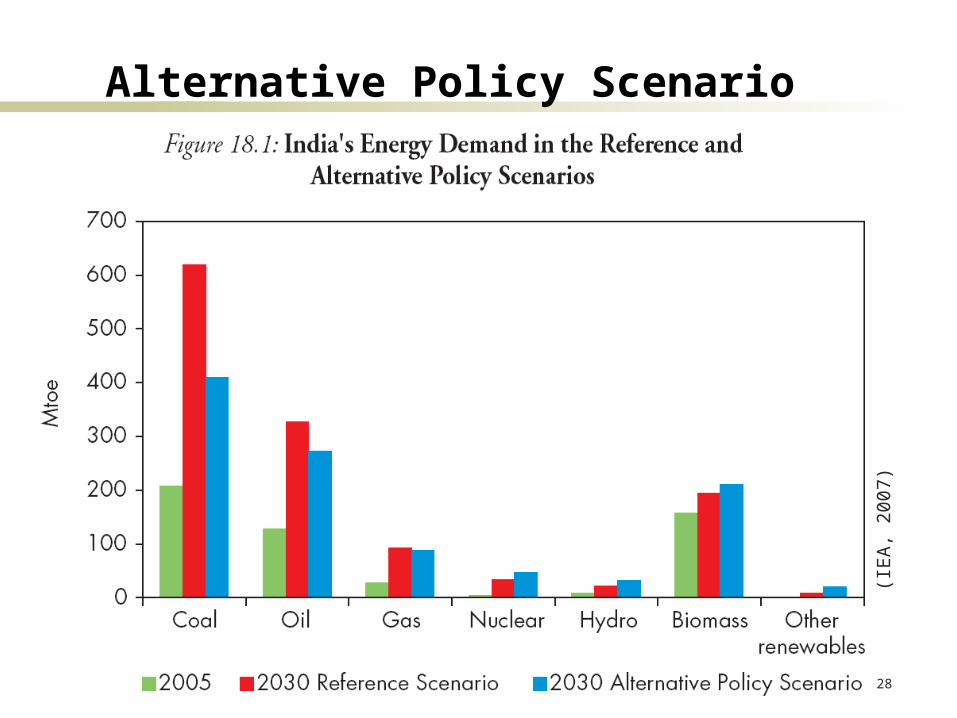
28
Alternative Policy Scenario
(IE
A,
2007
)
29
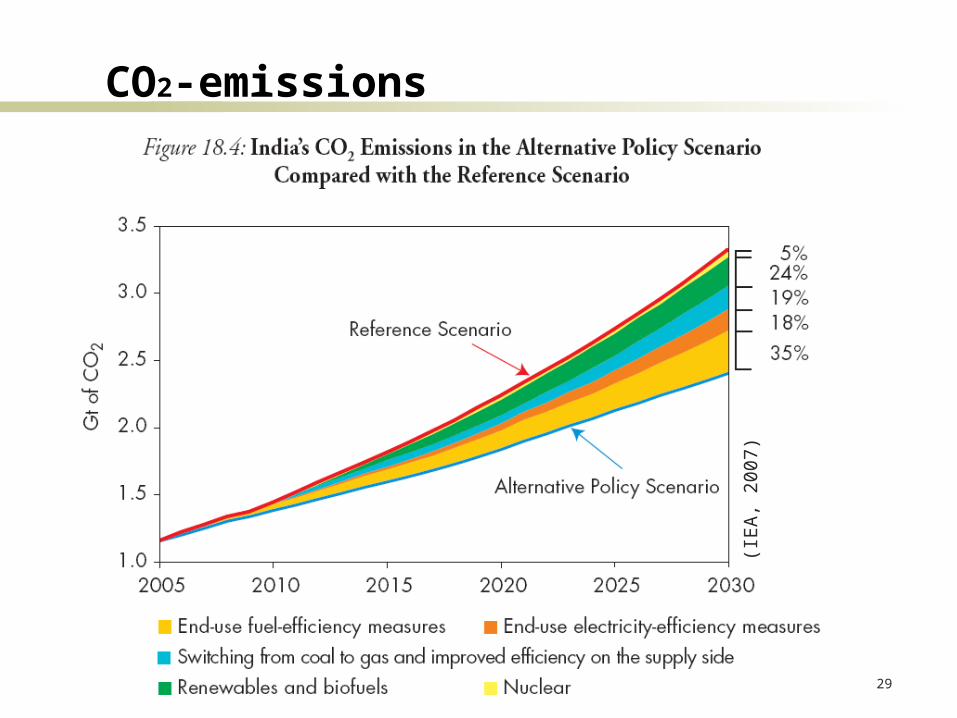
CO2-emissions
(IE
A,
2007
)
30
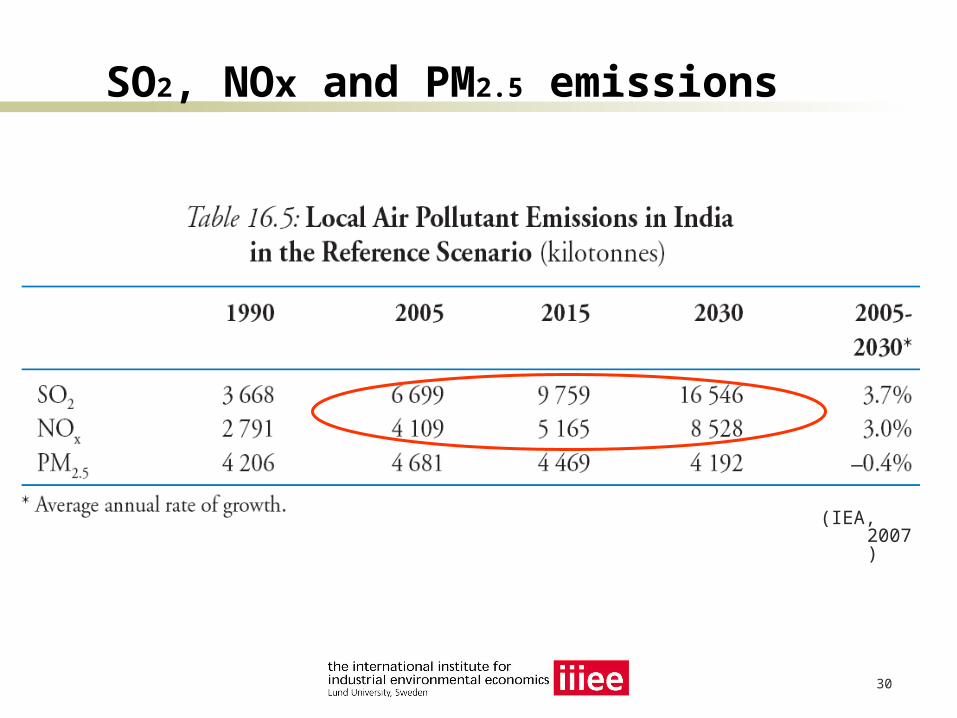
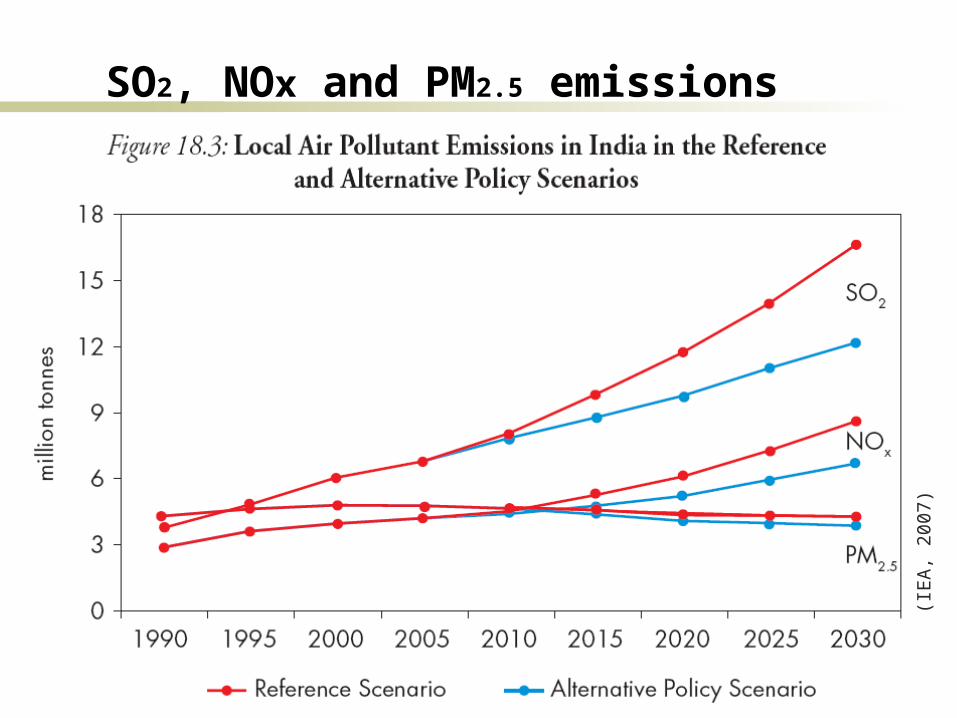
SO2, NOx and PM2.5 emissions
(IEA, 2007)
31
SO2, NOx and PM2.5 emissions
(IE
A,
2007
)
32
A more detailed look at some sectors
Transport sector Power sector
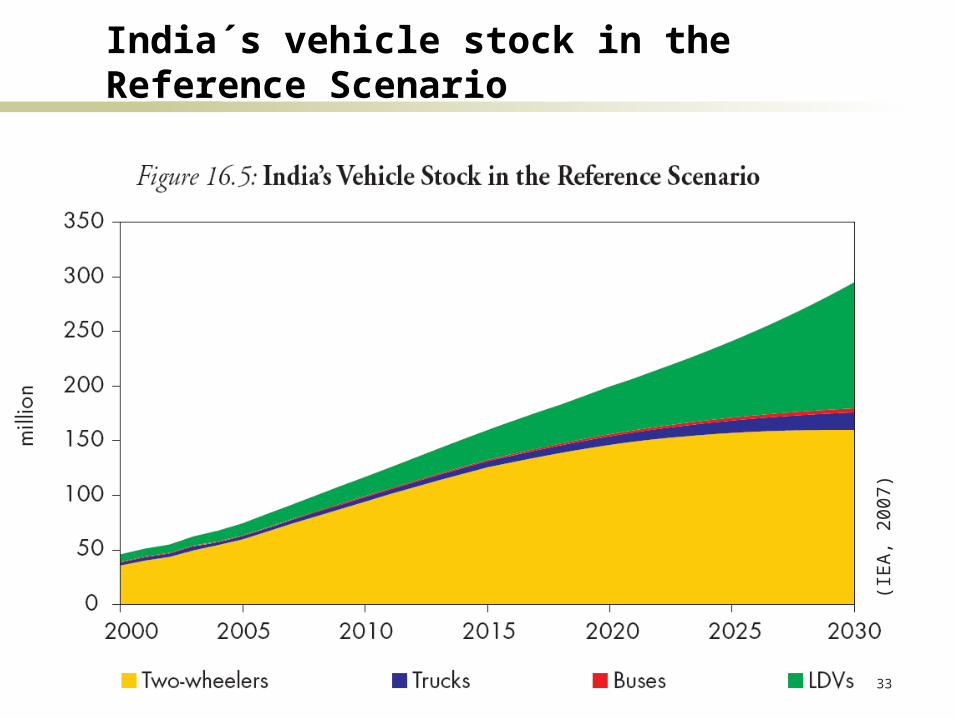
33
India´s vehicle stock in the Reference Scenario
(IE
A,
2007
)
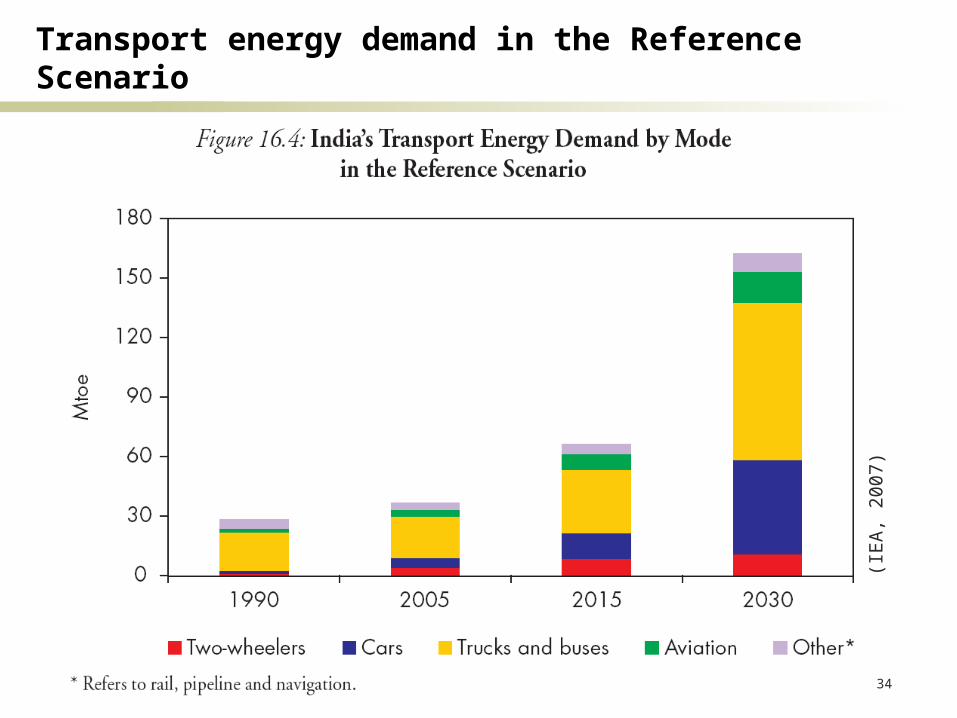
34
Transport energy demand in the Reference Scenario
(IE
A,
2007
)
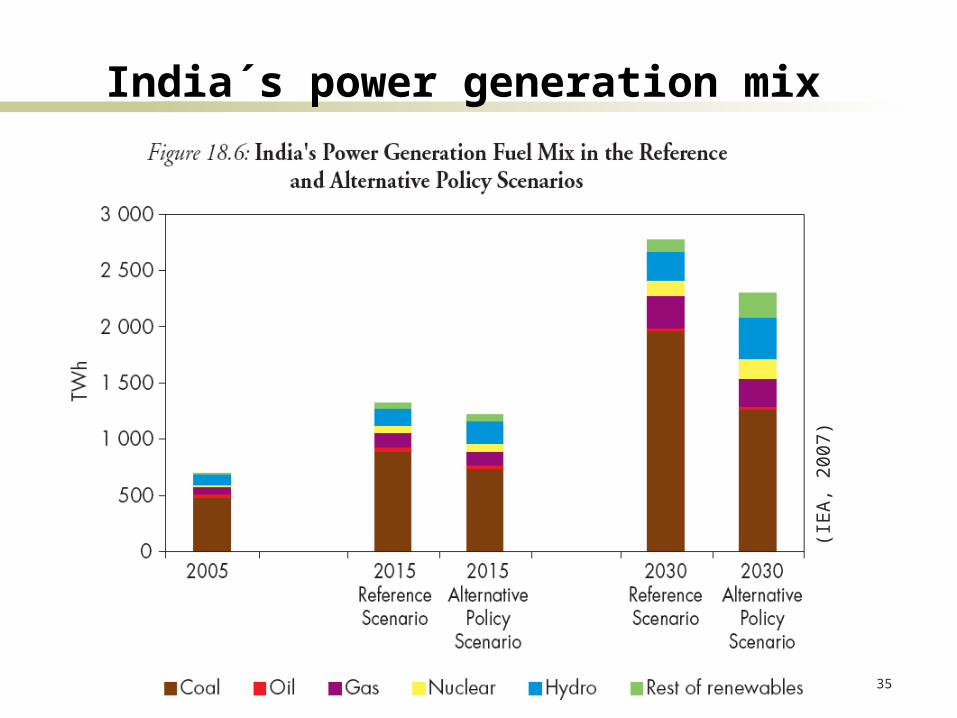
35
India´s power generation mix
(IE
A,
2007
)
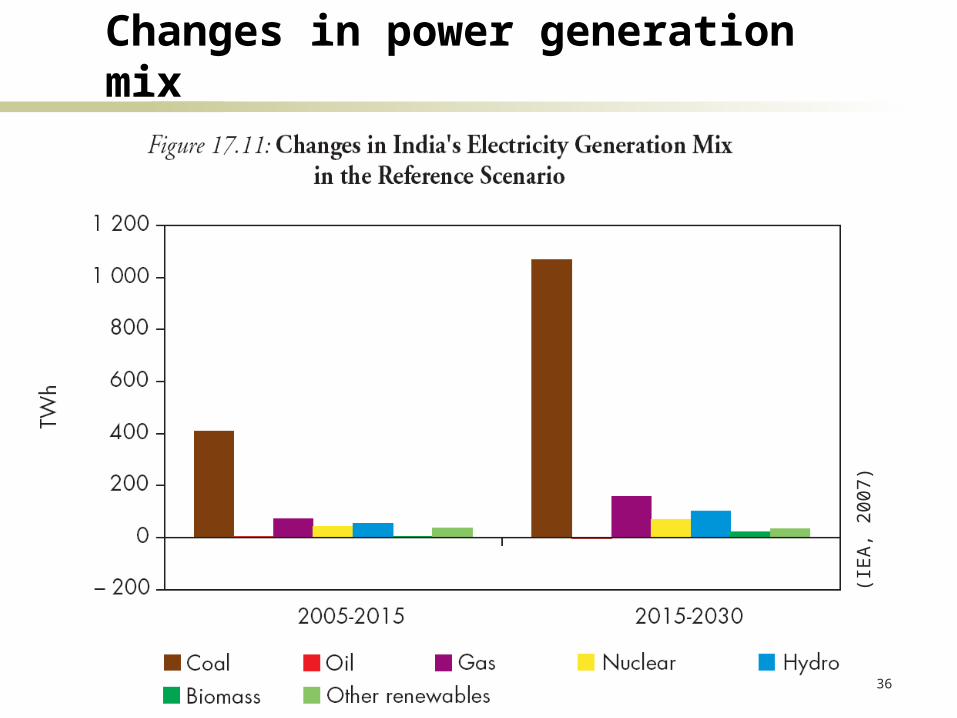
36
Changes in power generation mix
(IE
A,
2007
)
37
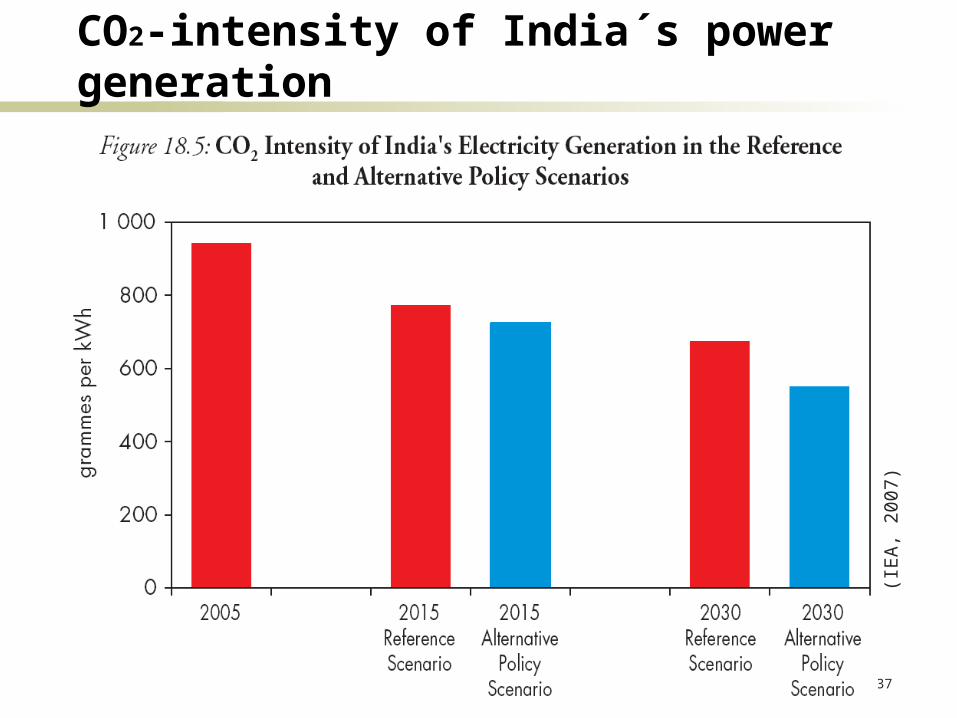
CO2-intensity of India´s power generation
(IE
A,
2007
)
38
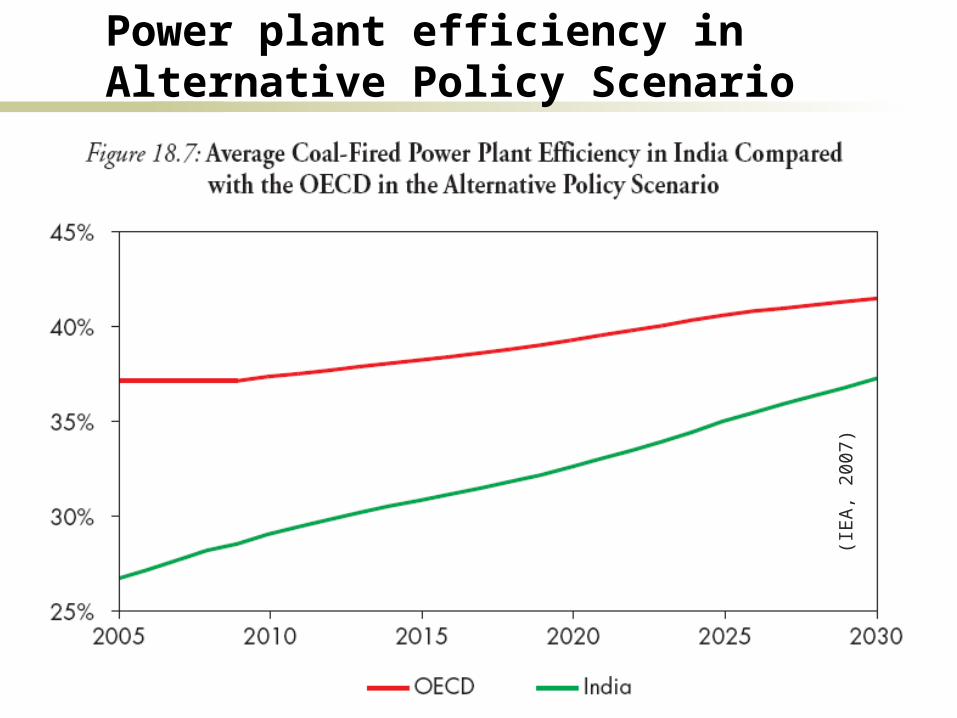
Power plant efficiency in Alternative Policy Scenario
(IE
A,
2007
)
39
Coal-fired power plant technology in India
Efficiency of India´s coal fired power plants is in the range of 27% - 30%, considerably lower than the OECD average of 37%
On average, efficiency is expected to increase from 27% now to 38% in 2030 (compared to OECD average of 42% in 2030)
In the Reference Scenario, no integrated gasification combined cycle (IGCC) plants nor Carbon Capture and Storage (CSS) facilities are expected to be built before 2030
40
Coal-fired power plant technology in India
The main supplier of coal-fired power plants in India is Bharat Heavy Electricals Ltd. (BHEL) “it is likely to maintain its dominant position in the future” (IEA, 2007) manufacturers from industrialised countries are more prominent in the
provision of gas turbines and hydro plants. BHEL's R&D expenditure is around 1% of sales, while internationally
this ratio is between 1.8 and 6%. “Many uncertainties exist as to the rate at which BHEL will be able to
expand its manufacturing capacity and when it will be in a position to produce far more efficient power plants, notably supercritical ones.”
With increasing demand for coal-fired power stations, it is likely that more plant purchases will have to be made from other manufacturers. “Competition between manufacturers is likely to encourage innovation”
(IEA, 2007) Doosan Heavy Industries of Korea has been selected as supplier of
five boilers for the 4 GW Mundra project
41
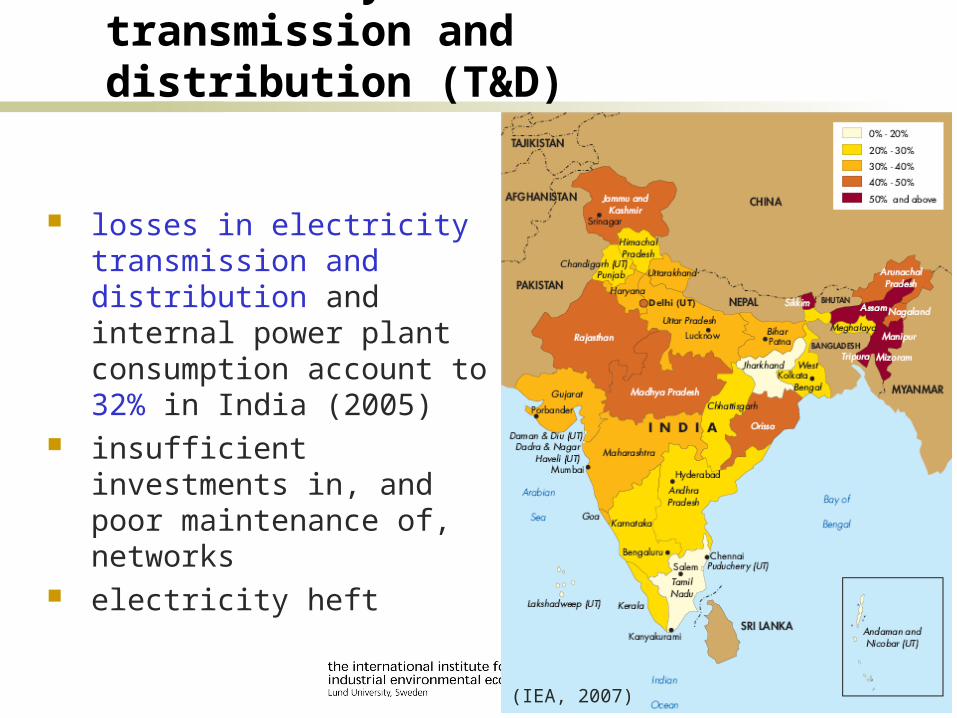
Electricity losses in transmission and distribution (T&D)
losses in electricity transmission and distribution and internal power plant consumption account to 32% in India (2005)
insufficient investments in, and poor maintenance of, networks
electricity heft
(IEA, 2007)
42
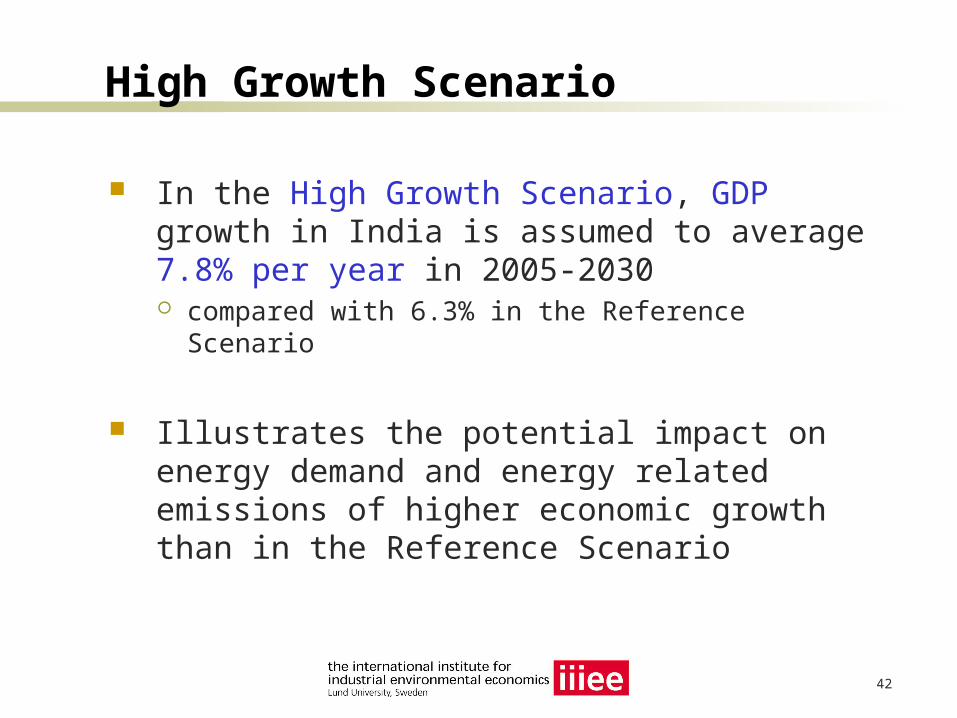
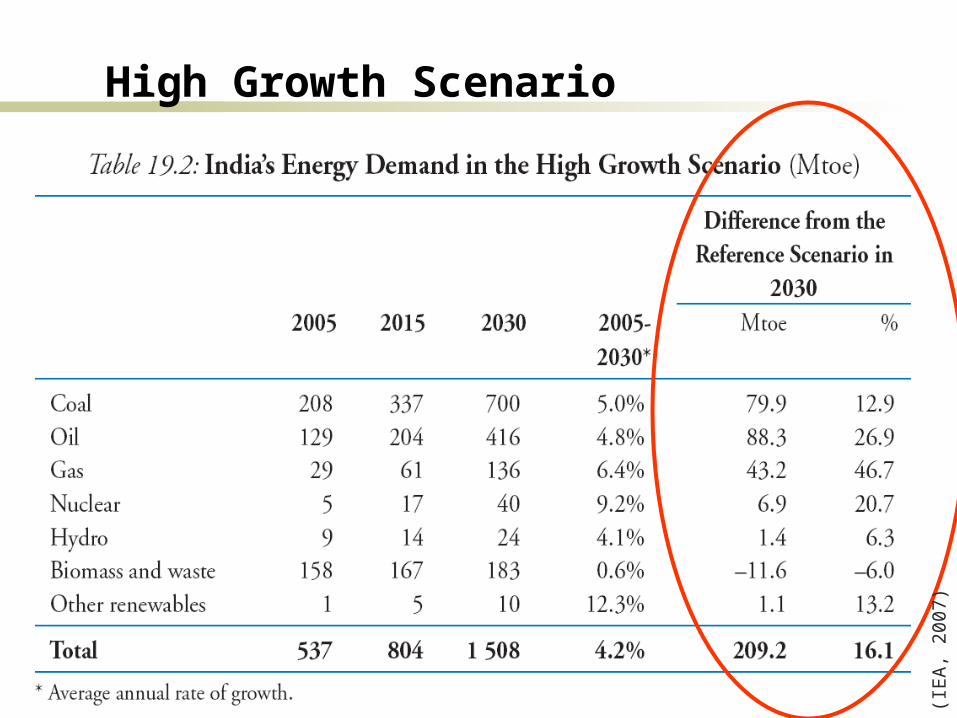
High Growth Scenario
In the High Growth Scenario, GDP growth in India is assumed to average 7.8% per year in 2005-2030 compared with 6.3% in the Reference Scenario
Illustrates the potential impact on energy demand and energy related emissions of higher economic growth than in the Reference Scenario
43
High Growth Scenario
(IE
A,
2007
)
44
High Growth Scenario projections
per-capita GDP is 42% higher than in the Reference Scenario
energy demand is 16% higher than in the Reference Scenario
The transport sector accounts for 74% of the additional final oil demand in the High Growth Scenario
energy prices, particularly for oil and gas, are higher in the High Growth Scenario partly due to higher demand
biomass use is lower than in the Reference Scenario, mainly due to fuel switching in the residential sector
45
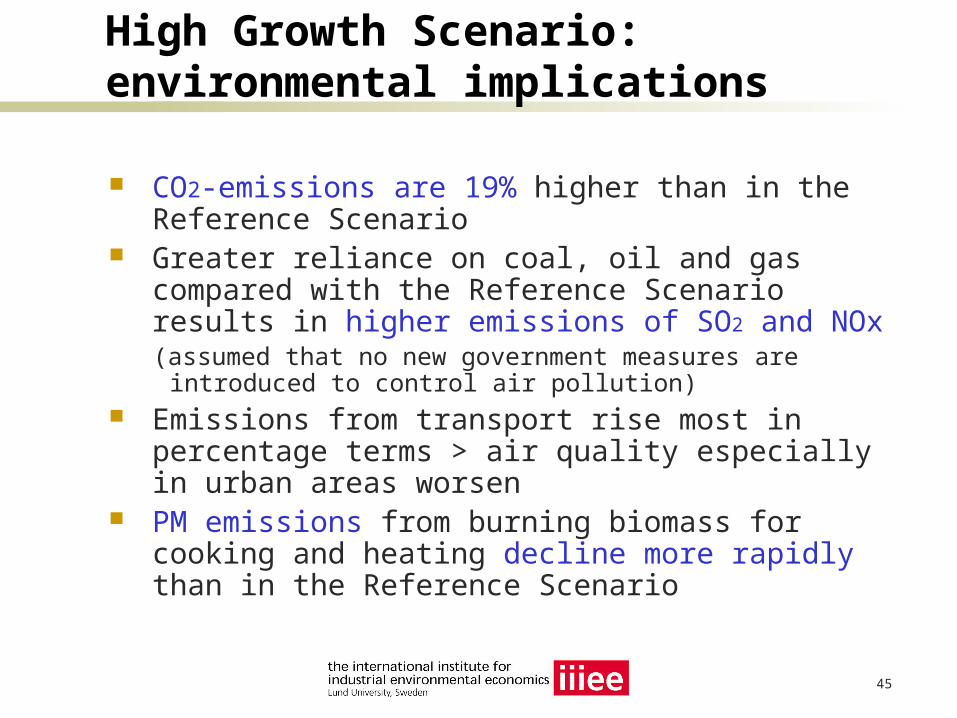
High Growth Scenario: environmental implications
CO2-emissions are 19% higher than in the Reference Scenario
Greater reliance on coal, oil and gas compared with the Reference Scenario results in higher emissions of SO2 and NOx(assumed that no new government measures are introduced
to control air pollution) Emissions from transport rise most in percentage
terms > air quality especially in urban areas worsen PM emissions from burning biomass for cooking
and heating decline more rapidly than in the Reference Scenario
46
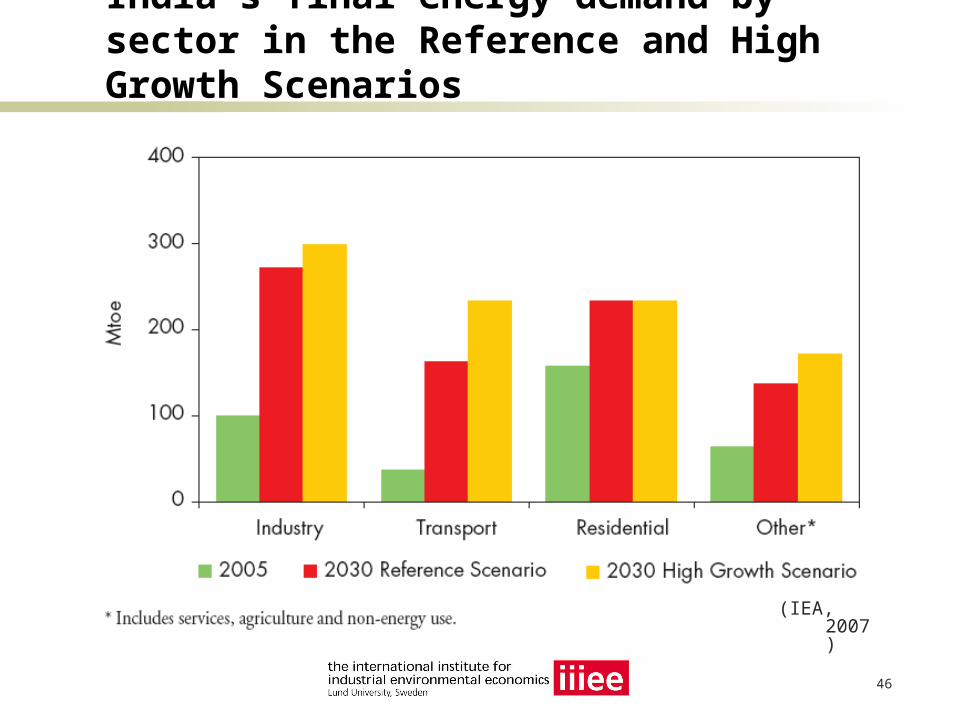
India´s final energy demand by sector in the Reference and High Growth Scenarios
(IEA, 2007)
47
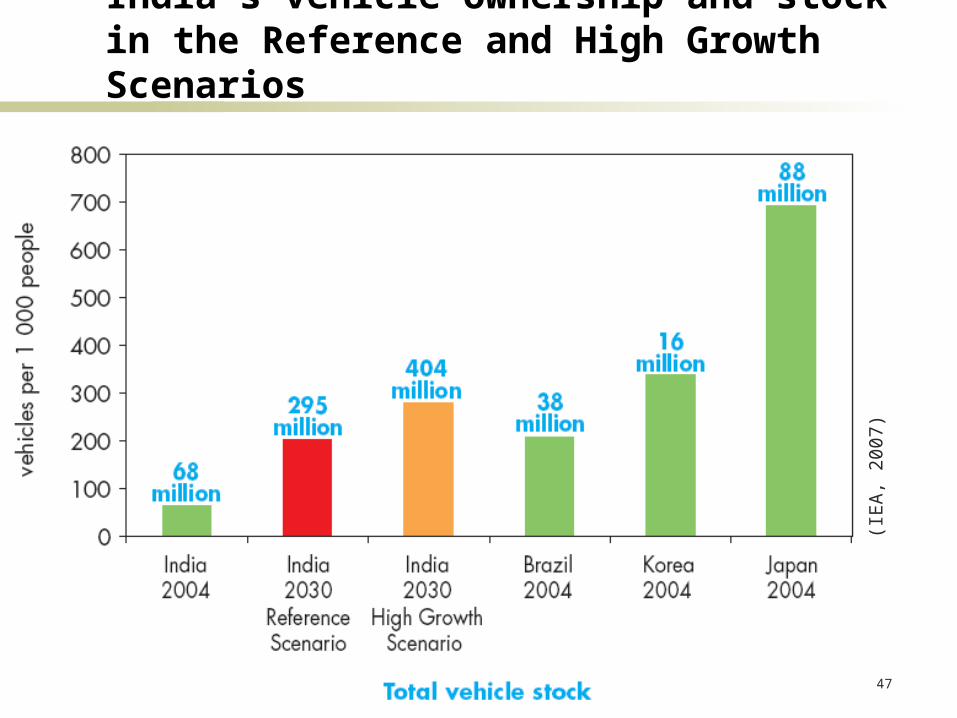
India´s vehicle ownership and stock in the Reference and High Growth Scenarios
(IE
A,
2007
)
48
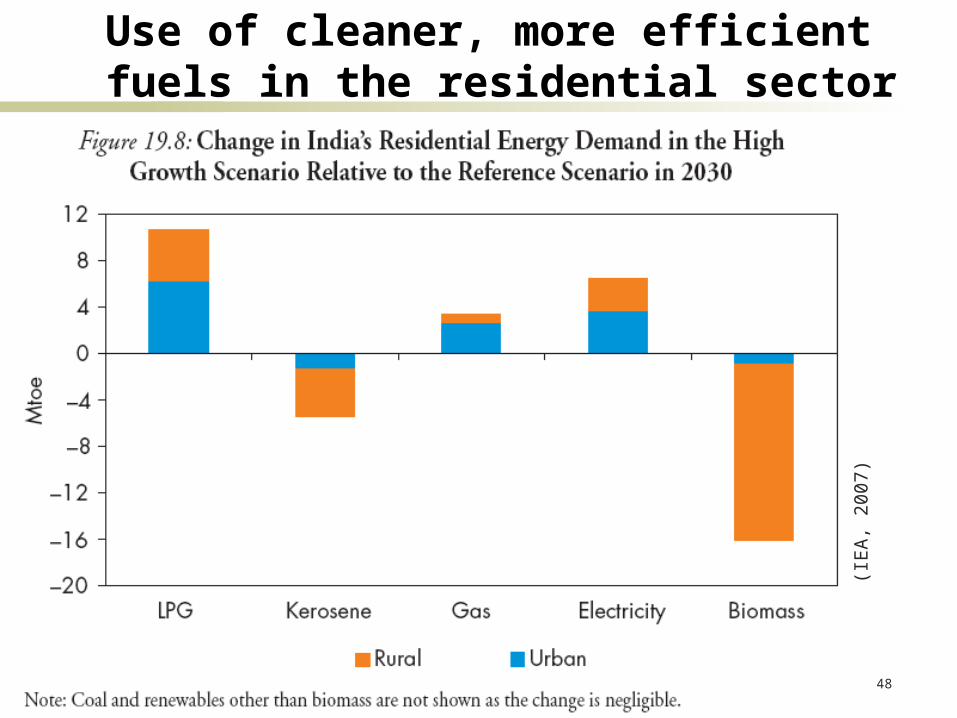
Use of cleaner, more efficient fuels in the residential sector
(IE
A,
2007
)
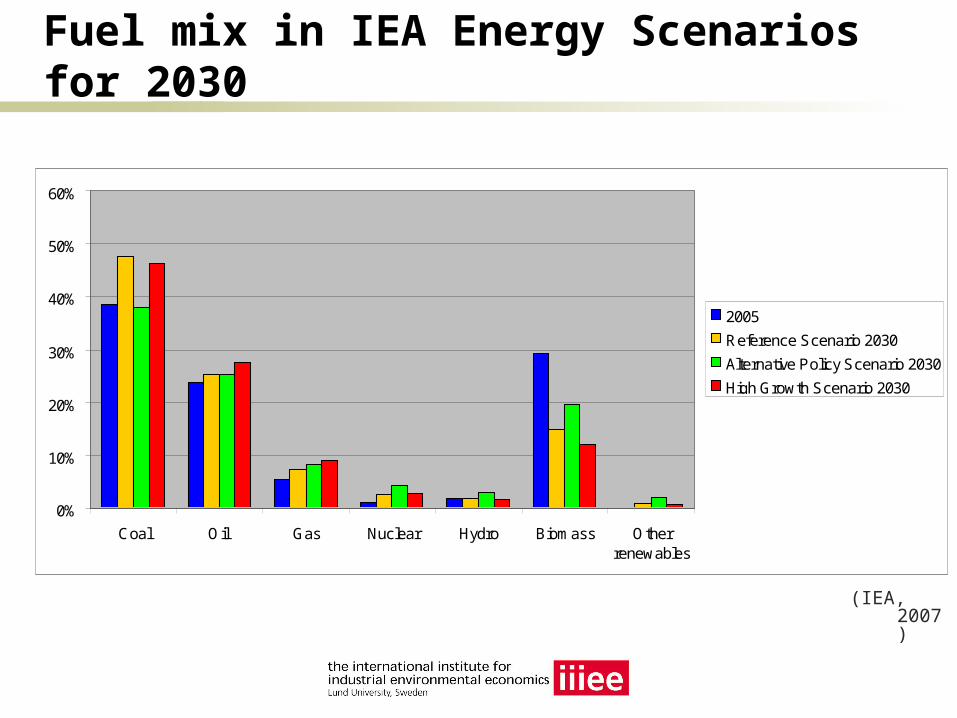
Fuel mix in IEA Energy Scenarios for 2030
0%
10%
20%
30%
40%
50%
60%
Coal Oil Gas Nuclear Hydro Biomass Otherrenewables
2005
Reference Scenario 2030
Alternative Policy Scenario 2030
High Growth Scenario 2030
(IEA, 2007)
50
Economic growth and energy demand
Economic growth is by far the most important driver of energy demand.
Future rates of economic growth are extremely uncertain, especially towards the end of the projection period.
Energy projections are highly sensitive to the underlying assumptions about GDP growth. In the High Growth Scenario, the cumulative effect of
even a marginally annual higher rate of GDP growth means that the level of energy demand in 2030 could be substantially higher than in the Reference Scenario.
51
Some final comments
The resources for modeling spent into the IEA scenarios are significant
Regional / country scenarios are linked to World Energy Scenarios