Embed Size (px)
Citation preview
1
Presentation Outline
FDI policy Investment incentive program FDI trends & distribution by sector FDI performance
2
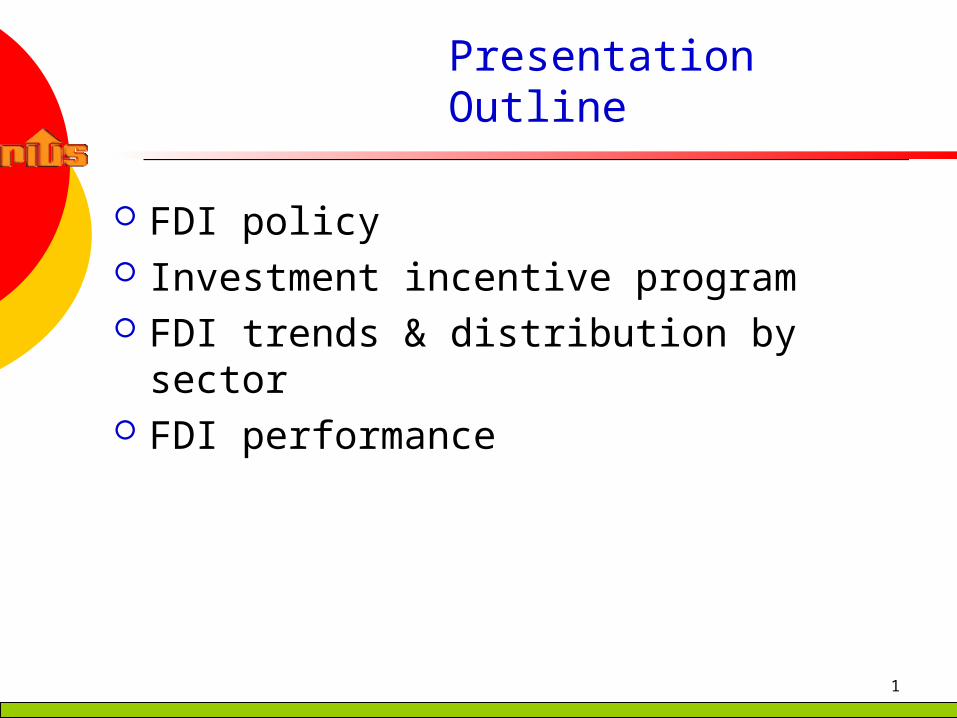
FDI policy reforms
List B
List A
List C
Foreign Investment Act 1991
areas where adequate number of firms exist to serve the economy
reserved for Filipinos due to health, defense, & moral reasons; protection of SMEs
reserved for Filipinos due to Constitutional constraints: mass media, cooperatives, small-scale mining
3
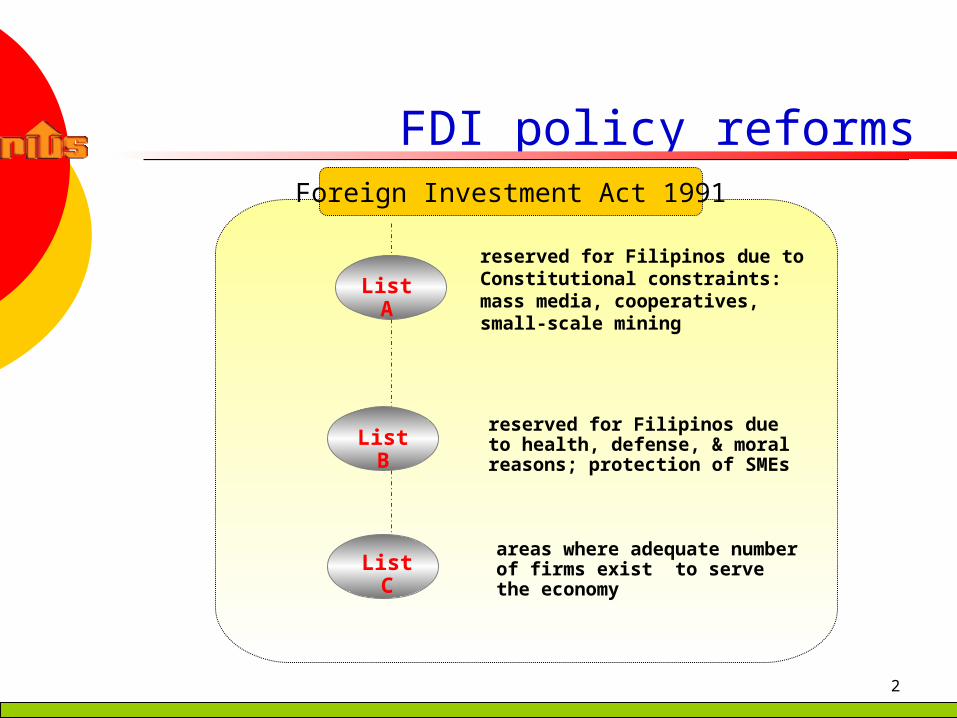
FDI policy reforms
Foreign Investment Act 1996
• retail trade liberalization (March 2000) allows 100% FDI with minimum equity US$7.5million• Foreign Bank Liberalization (1994): 10 new foreign banks • rural banking completely closed to FDI• restrictions on licensed professions, pyrotechnics & firecrackers; ceilings on financing, advertising, domestic air transport, commercial deep sea fishing
• restricts to 40% FDI in firms engaged in national security, defense, public health & safety & non-export firms with less than US$200,000 capital
List A
List B
4
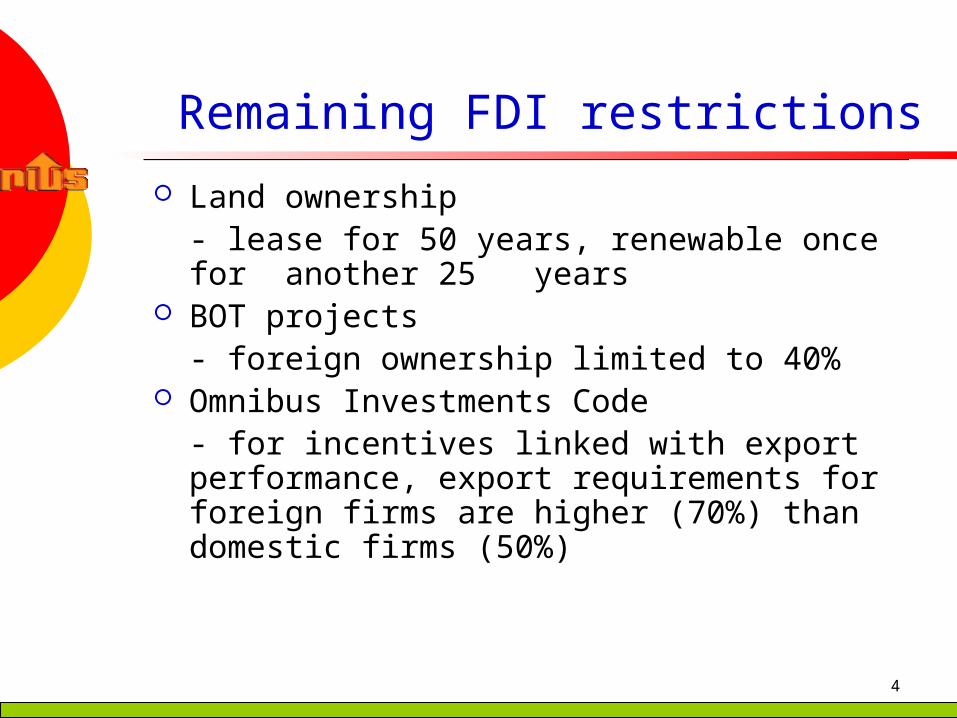
Remaining FDI restrictions
Land ownership- lease for 50 years, renewable once for another 25 years
BOT projects- foreign ownership limited to 40%
Omnibus Investments Code- for incentives linked with export performance, export requirements for foreign firms are higher (70%) than domestic firms (50%)
5
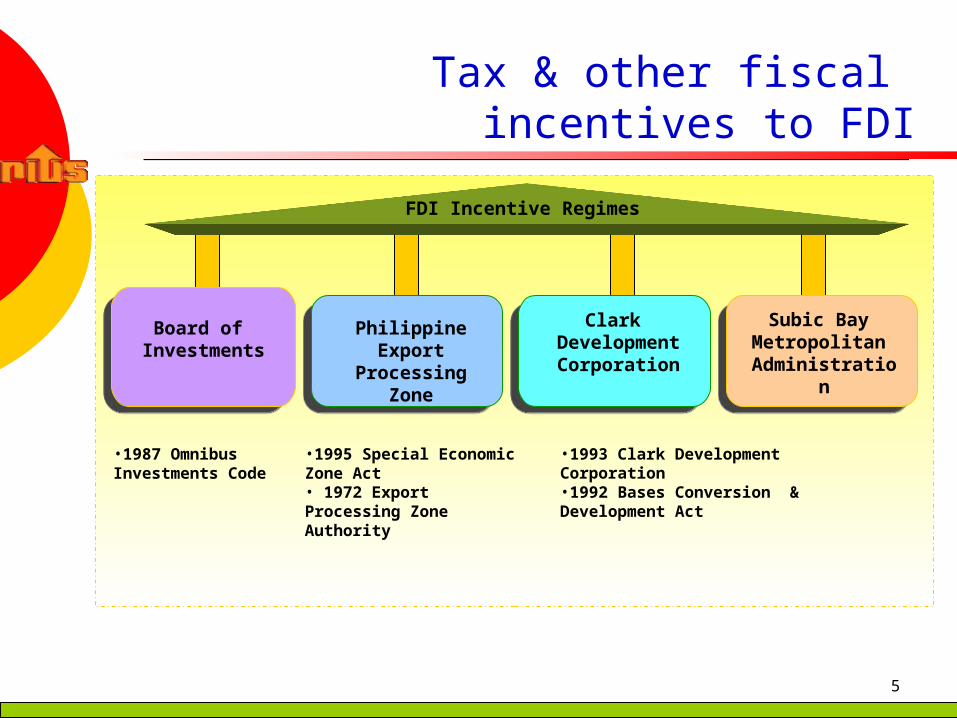
Tax & other fiscal incentives to FDI
Board of Investments
Philippine Export
Processing Zone
Subic Bay Metropolitan Administratio
n
Clark Development Corporation
FDI Incentive Regimes
•1987 Omnibus Investments Code
•1995 Special Economic Zone Act • 1972 Export Processing Zone Authority
•1993 Clark Development Corporation•1992 Bases Conversion & Development Act
6
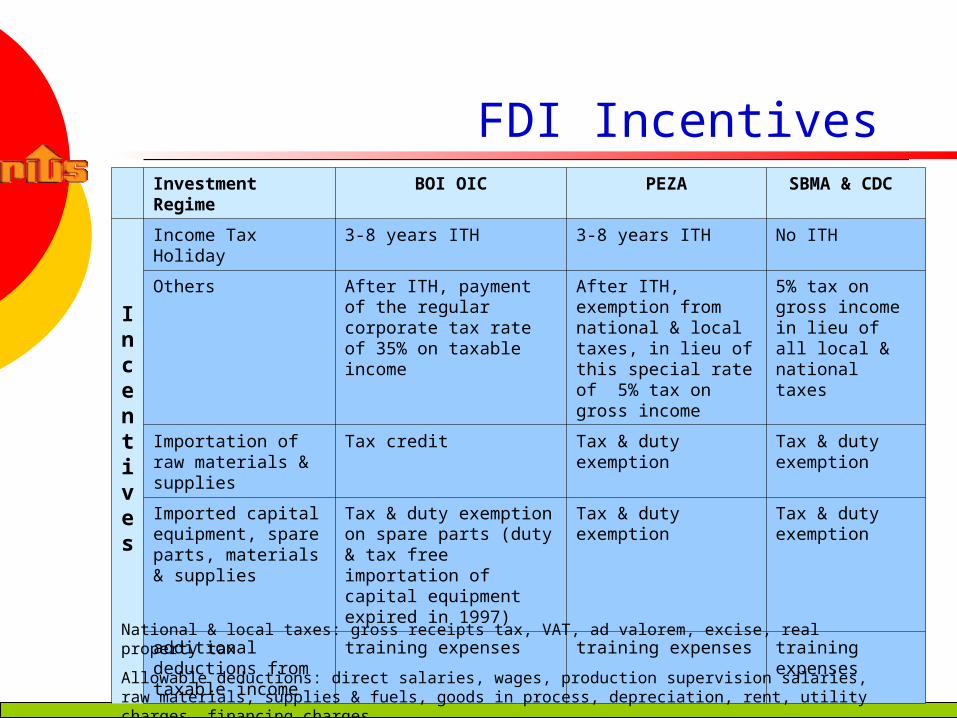
FDI Incentives Investment Regime
BOI OIC PEZA SBMA & CDC
Incentives
Income Tax Holiday 3-8 years ITH 3-8 years ITH No ITH
Others After ITH, payment of the regular corporate tax rate of 35% on taxable income
After ITH, exemption from national & local taxes, in lieu of this special rate of 5% tax on gross income
5% tax on gross income in lieu of all local & national taxes
Importation of raw materials & supplies
Tax credit Tax & duty exemption
Tax & duty exemption
Imported capital equipment, spare parts, materials & supplies
Tax & duty exemption on spare parts (duty & tax free importation of capital equipment expired in 1997)
Tax & duty exemption
Tax & duty exemption
additional deductions from taxable income
training expenses training expenses training expenses
National & local taxes: gross receipts tax, VAT, ad valorem, excise, real property tax
Allowable deductions: direct salaries, wages, production supervision salaries, raw materials, supplies & fuels, goods in process, depreciation, rent, utility charges, financing charges
7
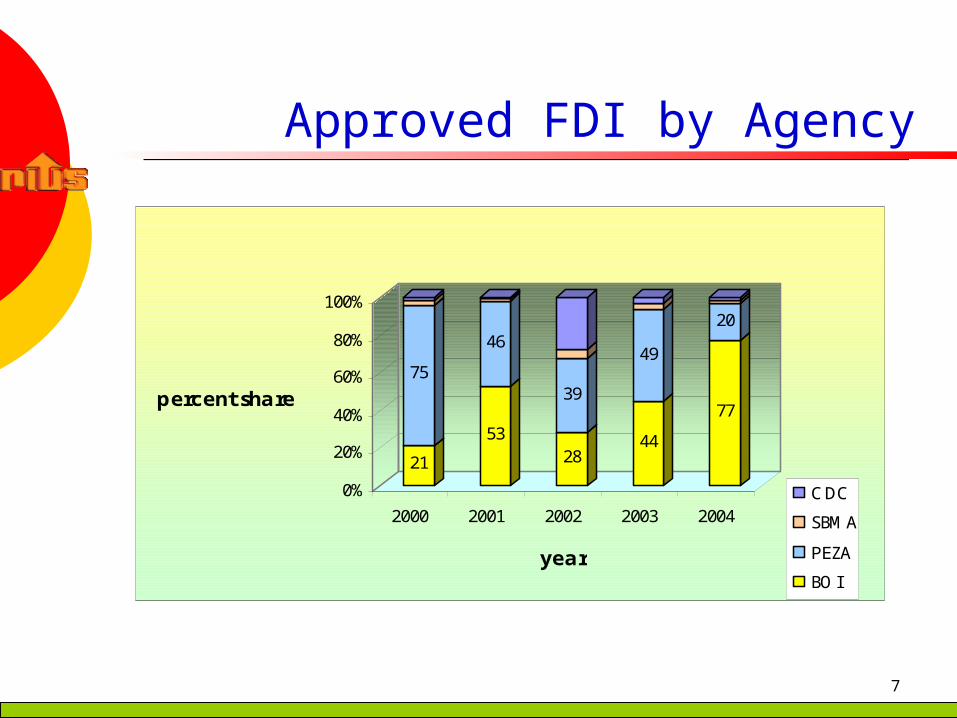
Approved FDI by Agency
21
75
53
46
28
39
44
49
77
20
0%
20%
40%
60%
80%
100%
percent share
2000 2001 2002 2003 2004
year
CDC
SBMA
PEZA
BOI
8
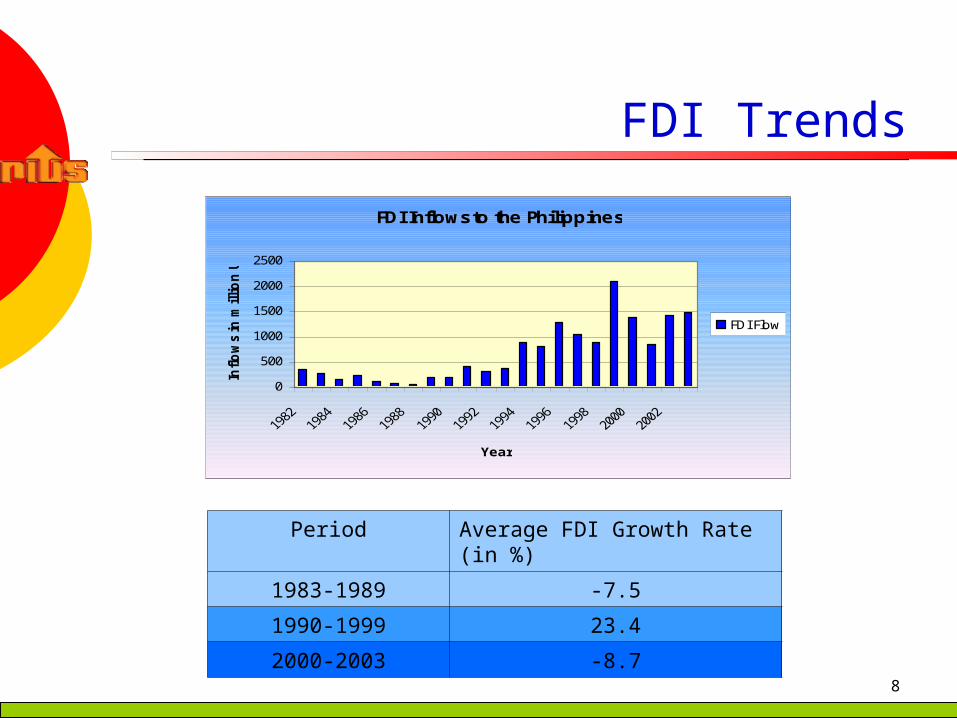
FDI Trends
FDI Inflows to the Philippines
0
500
1000
1500
2000
2500
Year
Inflow
s in
million U
S$
FDI Flow
Period Average FDI Growth Rate (in %)
1983-1989 -7.5
1990-1999 23.4
2000-2003 -8.7
9
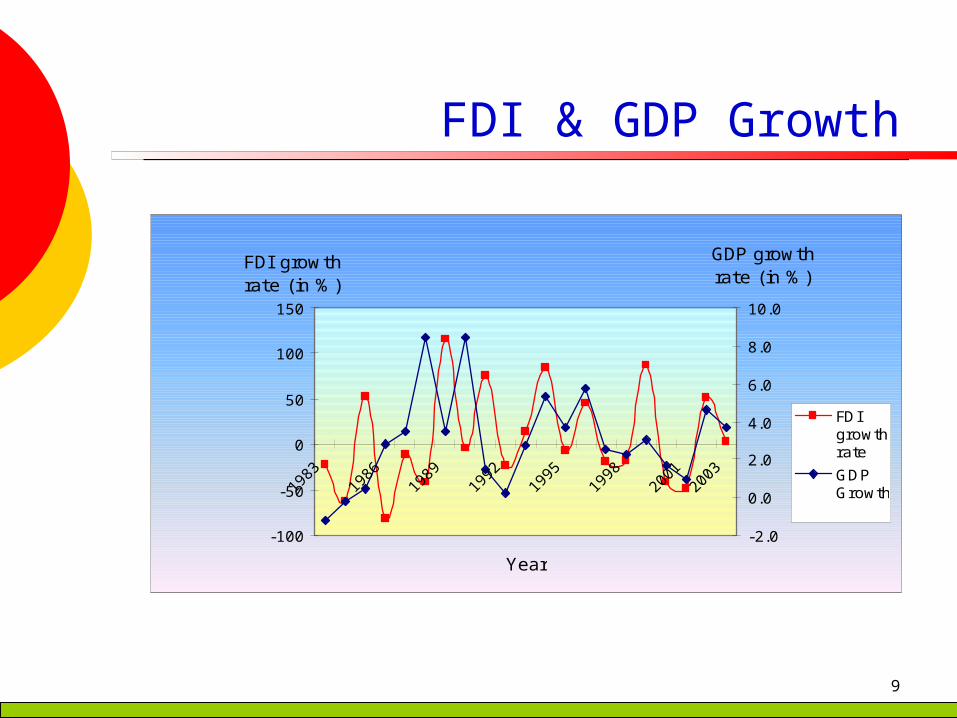
FDI & GDP Growth
-100
-50
0
50
100
150
Year
FDI growth rate (in %)
-2.0
0.0
2.0
4.0
6.0
8.0
10.0
GDP growth rate (in %)
FDIgrowthrate
GDPGrowth

10
FDI as % of GDP
FDI as Percentage of Gross Domestic Product
0
0.5
1
1.5
2
2.5
3
year
in p
erc
ent
FDI/GDP
Average FDI/GDP
0.54% 1980s
1.21 1990s
1.7 20s
Average FDI/GDP
0.54% 1980s
1.21 1990s
1.7 20s

11
FDI Distribution
0
10
20
30
40
50
60
Average Share (in %)
FIN MFG MIN COM SERV PUB UTIL
Sector
FDI Distribution by Sector
1980-1989
1990-1999
2000-2003
9%
15%
Food mfg
1812
1
0.9
5
6
38
5
11
6
3231
5045
34
15
8
Mfg: electronic components assembly, food, transport, chemicals, petroleum & coal, basic metal
Public Utilities: telecommunications
Mfg: electronic components assembly, food, transport, chemicals, petroleum & coal, basic metal
Public Utilities: telecommunications
12
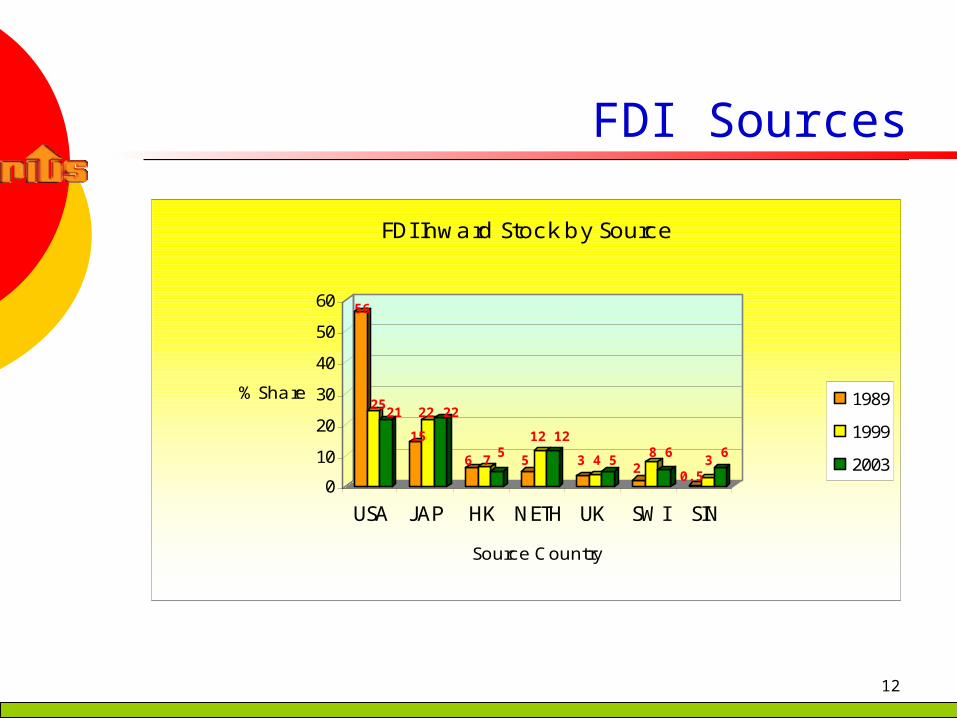
FDI Sources
0
10
20
30
40
50
60
% Share
USA JAP HK NETH UK SWI SIN
Source Country
FDI Inward Stock by Source
1989
1999
2003
56
2521
15
22 22
6 75
5
12 12
3 4 52
8 6
0.53
6

13
Comparative Performance
-10
0
10
20
30
40
50
FDI Inflows (in current US$billion)
PHILS INDO VIET MAL THAI SIN PRC
Country
Net Inflows
1981-1985
1993-1997
1998-2001
14
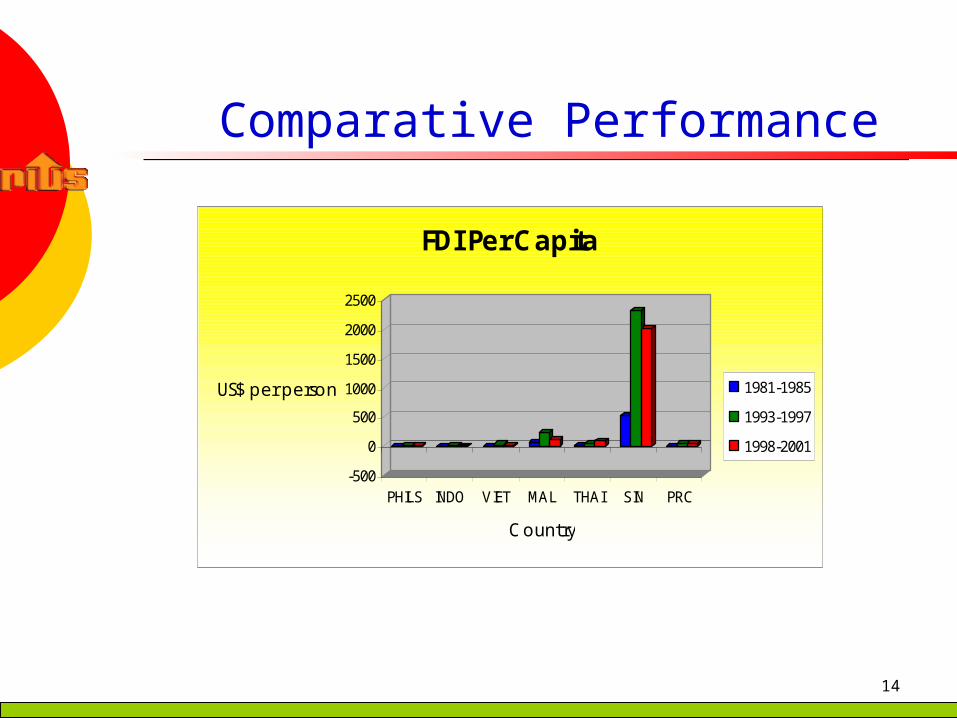
Comparative Performance
-500
0
500
1000
1500
2000
2500
US$ per person
PHILS INDO VIET MAL THAI SIN PRC
Country
FDI Per Capita
1981-1985
1993-1997
1998-2001
15
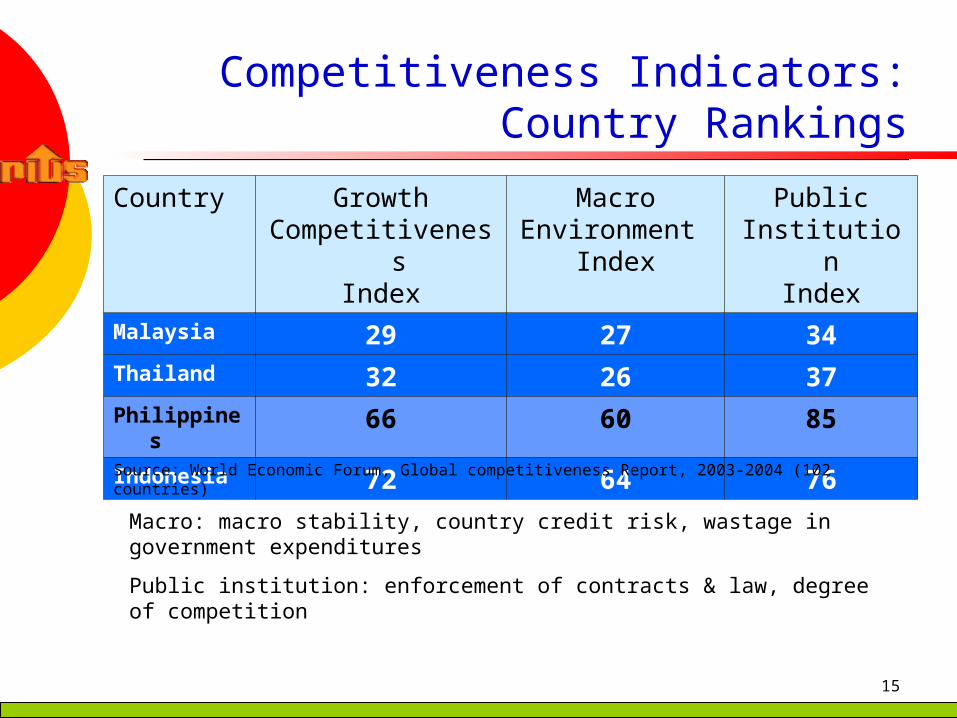
Competitiveness Indicators:Country Rankings
Country GrowthCompetitiveness
Index
MacroEnvironment
Index
PublicInstitution
IndexMalaysia 29 27 34Thailand 32 26 37Philippines 66 60 85Indonesia 72 64 76
Macro: macro stability, country credit risk, wastage in government expenditures
Public institution: enforcement of contracts & law, degree of competition
Source: World Economic Forum, Global competitiveness Report, 2003-2004 (102 countries)

16
Cost of Doing Business Indicators
Country Number of start-upprocedures
Time to start a business(days)
Cost to registerBusiness(% of per capita GNI)
Procedures to enforce a contract
Time to enforce a contract (days)
Employment laws index: range 0 (less rigid) to 100 (very rigid)
Philippines 11 59 24 28 164 60
PRChina 11 46 14 20 180 47
Malaysia 8 31 27 22 270 25
Hong Kong 5 11 2 17 180 27
Indonesia 11 168 15 - 225 57
S Korea 12 33 18 23 75 51
Singapore 7 8 1 23 50 20
Thailand 9 42 7 19 210 61
Vietnam 11 63 30 28 120 56
Source: World Bank, World Development Indicators, 2004.
17
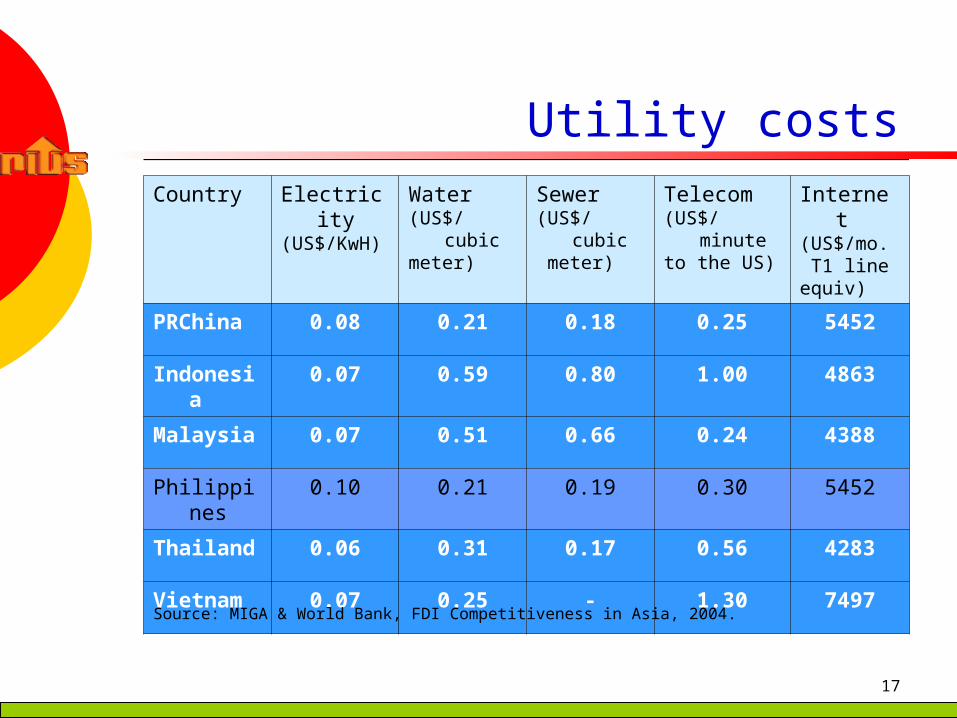
Utility costsCountry Electricity
(US$/KwH)Water(US$/cubic meter)
Sewer(US$/cubic meter)
Telecom(US$/minute to the US)
Internet(US$/mo. T1 line equiv)
PRChina 0.08 0.21 0.18 0.25 5452
Indonesia 0.07 0.59 0.80 1.00 4863
Malaysia 0.07 0.51 0.66 0.24 4388
Philippines 0.10 0.21 0.19 0.30 5452
Thailand 0.06 0.31 0.17 0.56 4283
Vietnam 0.07 0.25 - 1.30 7497
Source: MIGA & World Bank, FDI Competitiveness in Asia, 2004.
18
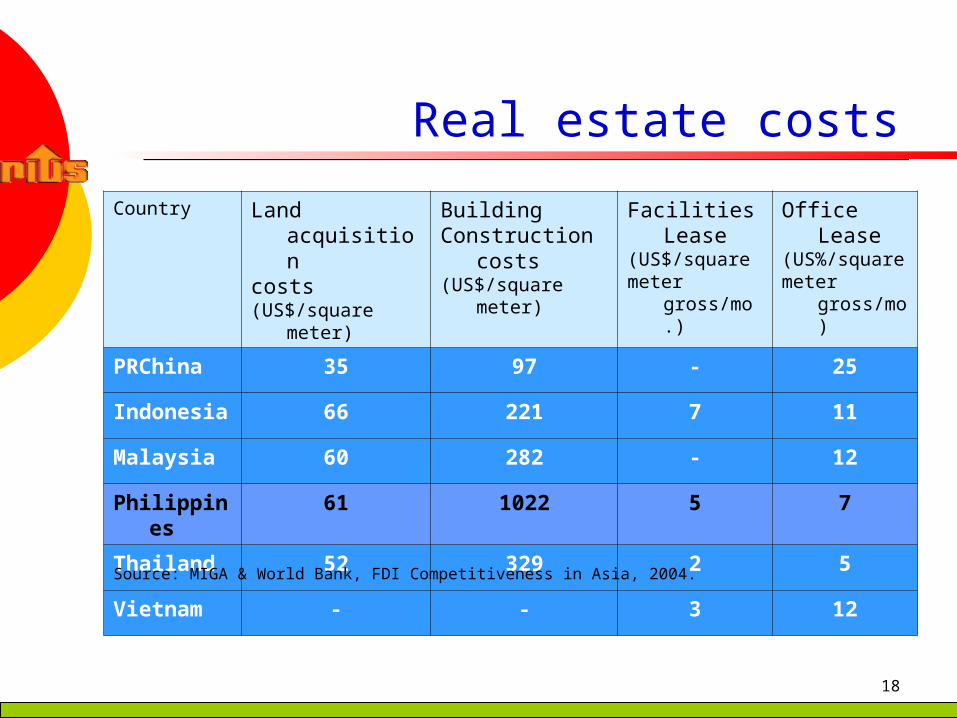
Real estate costs
Country Land acquisition costs (US$/square meter)
Building Construction costs (US$/square meter)
Facilities Lease(US$/square meter gross/mo.)
Office Lease (US%/square meter gross/mo)
PRChina 35 97 - 25
Indonesia 66 221 7 11
Malaysia 60 282 - 12
Philippines 61 1022 5 7
Thailand 52 329 2 5
Vietnam - - 3 12
Source: MIGA & World Bank, FDI Competitiveness in Asia, 2004.

19
Corporate tax rate
Country Rate
PRC 30% national tax3% local tax
Indonesia 10% first Rp50M15% next Rp50M
30% exceeding Rp100M
Malaysia 28
Philippines 35
Vietnam 28
Thailand 30Source: The Economist Intelligence Unit (2004)
20
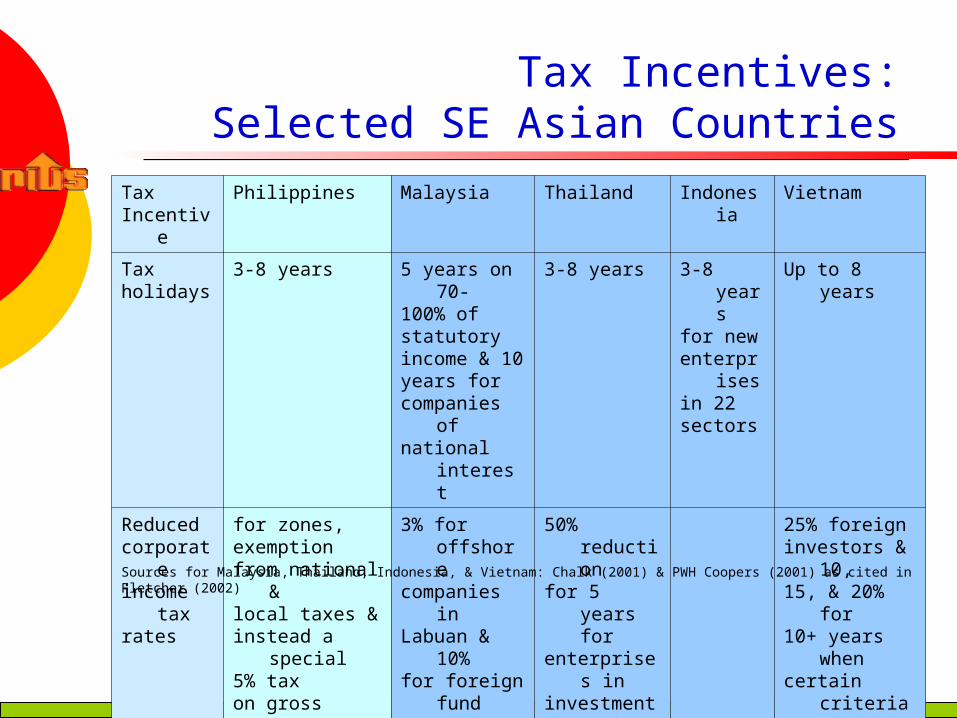
Tax Incentives:Selected SE Asian Countries
Tax Incentive
Philippines Malaysia Thailand Indonesia Vietnam
Tax holidays
3-8 years 5 years on 70-100% of statutory income & 10 years for companies of national
interest
3-8 years 3-8 years for new enterprises in 22 sectors
Up to 8 years
Reduced corporate income tax rates
for zones,exemption from national & local taxes &instead a special5% tax on gross income
3% for offshore companies in Labuan & 10% for foreign fund mgt companies
50% reductionfor 5 years for enterprises in investment promotionZones
25% foreign investors & 10,15, & 20% for10+ years whencertain criteria are met
Sources for Malaysia, Thailand, Indonesia, & Vietnam: Chalk (2001) & PWH Coopers (2001) as cited in Fletcher (2002)
21
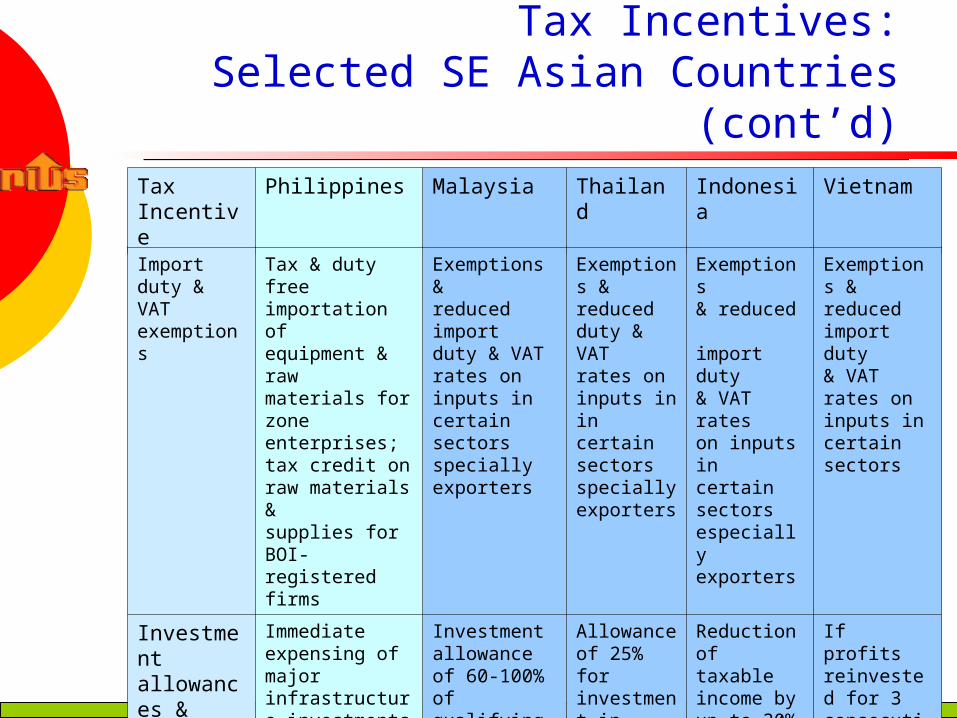
Tax Incentives:Selected SE Asian Countries (cont’d)
Tax Incentive
Philippines Malaysia Thailand Indonesia Vietnam
Import duty & VAT exemptions
Tax & duty free importation of equipment & raw materials for zone enterprises; tax credit on raw materials & supplies for BOI- registered firms
Exemptions & reduced import duty & VAT rates on inputs in certain sectors specially exporters
Exemptions & reduced duty & VAT rates on inputs inin certain sectors specially exporters
Exemptions & reduced import duty & VAT rateson inputs in certain sectors especially exporters
Exemptions & reduced import duty & VAT rates on inputs in certain sectors
Investment allowances & credits
Immediate expensing of major infrastructure investments by export enterprises in less developed areas
Investment allowance of 60-100% of qualifying capital expenditure
Allowance of 25% for investment in infrastructure
Reduction of taxable income by up to 30% of investment in priority sectors
If profits reinvested for 3 consecutive years, a portion or all of corporate income tax maybe refunded
22
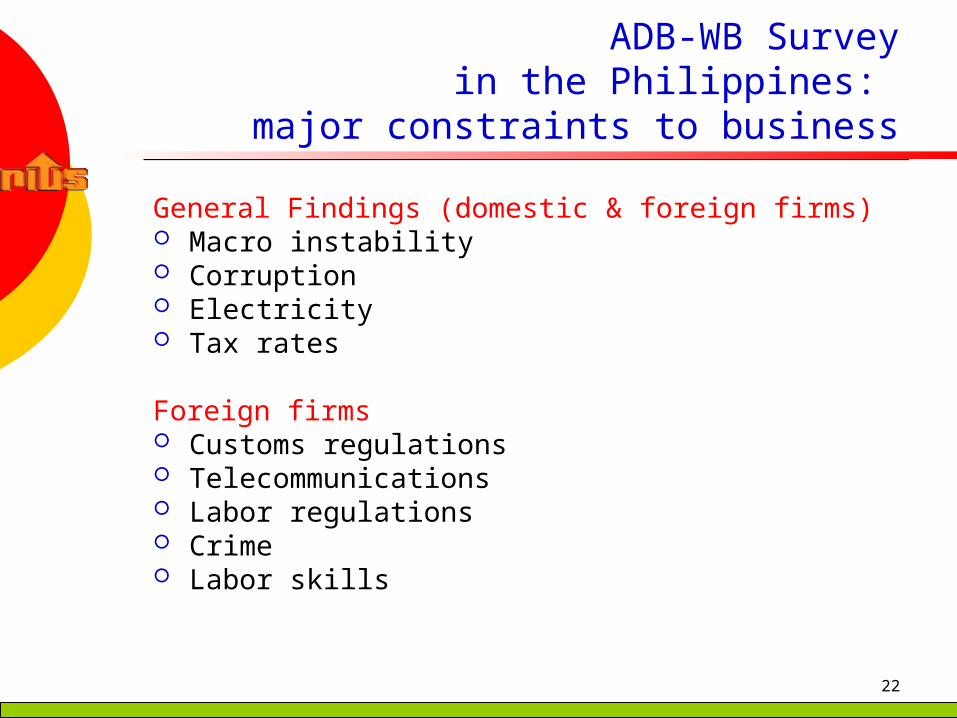
ADB-WB Survey in the Philippines:
major constraints to business
General Findings (domestic & foreign firms) Macro instability Corruption Electricity Tax rates
Foreign firms Customs regulations Telecommunications Labor regulations Crime Labor skills
23
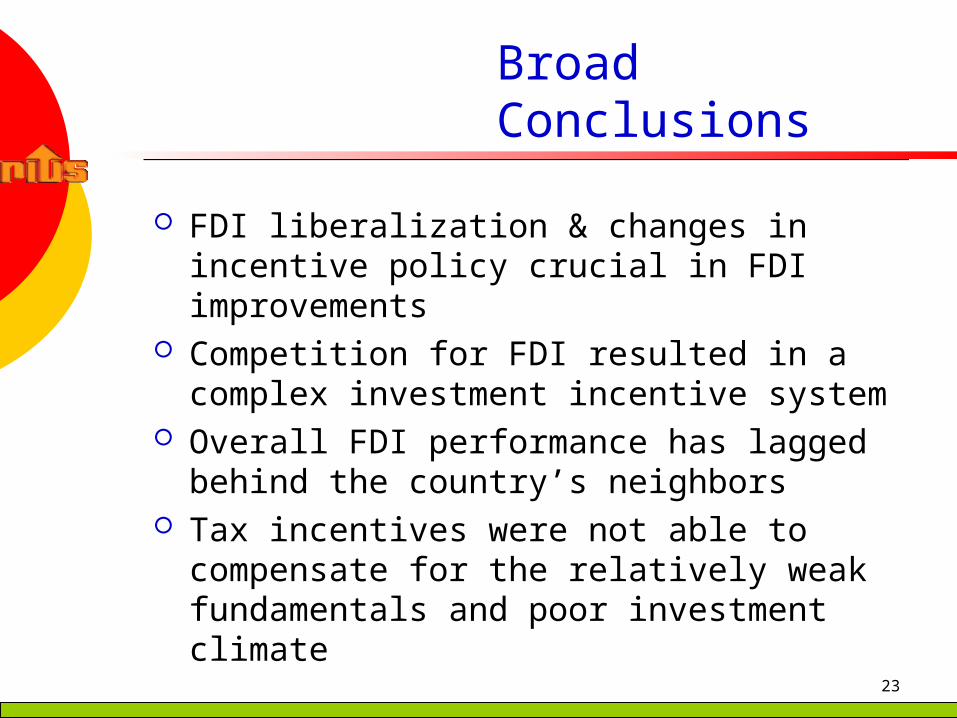
Broad Conclusions
FDI liberalization & changes in incentive policy crucial in FDI improvements
Competition for FDI resulted in a complex investment incentive system
Overall FDI performance has lagged behind the country’s neighbors
Tax incentives were not able to compensate for the relatively weak fundamentals and poor investment climate


![[PPT]PowerPoint Presentation - Vidarbha Industries … · Web viewJVs and Technical Collaboration (FDI) Incentives covered under FTP What is Incentive? Agreement on Subsidies and](https://img.pdfslide.net/doc/110x75/5ad11a0c7f8b9aff738b54ac/pptpowerpoint-presentation-vidarbha-industries-viewjvs-and-technical-collaboration.jpg)