Embed Size (px)
Citation preview
1
Spatiotemporal variability and contribution of different aerosol 1
types to the Aerosol Optical Depth over the Eastern Mediterranean 2
3
Aristeidis K. Georgoulias1,2,3,*, Georgia Alexandri4,5, Konstantinos A. Kourtidis5, 4
Jos Lelieveld3,6, Prodromos Zanis1, Ulrich Pöschl2, Robert Levy7, Vassilis 5
Amiridis8, Eleni Marinou4,8, Athanasios Tsikerdekis1 6
7
[1] Department of Meteorology and Climatology, School of Geology, Aristotle University of 8
Thessaloniki, 54124, Thessaloniki, Greece 9
[2] Multiphase Chemistry Department, Max Planck Institute for Chemistry, D-55128, Mainz, 10
Germany 11
[3] Energy, Environment and Water Research Center, The Cyprus Institute, Nicosia, Cyprus 12
[4] Laboratory of Atmospheric Physics, Physics Department, Aristotle University of 13
Thessaloniki, 54124, Thessaloniki, Greece 14
[5] Laboratory of Atmospheric Pollution and Pollution Control Engineering of Atmospheric 15
Pollutants, Department of Environmental Engineering, Democritus University of Thrace, 16
67100, Xanthi, Greece 17
[6] Atmospheric Chemistry Department, Max Planck Institute for Chemistry, D-55128, 18
Mainz, Germany 19
[7] Earth Science Division, NASA Goddard Space Flight Center, MD 20771, Greenbelt, USA 20
[8] Institute for Astronomy, Astrophysics, Space Application and Remote Sensing, National 21
Observatory of Athens, 15236 Athens, Greece 22 *current address: Laboratory of Atmospheric Pollution and Pollution Control Engineering of 23
Atmospheric Pollutants, Department of Environmental Engineering, Democritus University of 24
Thrace, 67100, Xanthi, Greece 25
26
Correspondence to: A. K. Georgoulias ([email protected]) 27
28
Abstract 29
This study characterizes the spatiotemporal variability and relative contribution of different 30
types of aerosols to the Aerosol Optical Depth (AOD) over the Eastern Mediterranean as 31
derived from MODIS Terra (3/2000-12/2012) and Aqua (7/2002-12/2012) satellite 32
instruments. For this purpose, a 0.1o x 0.1o gridded MODIS dataset was compiled and 33
2
validated against sunphotometric observations from the AErosol RObotic NETwork 1
(AERONET). The high spatial resolution and long temporal coverage of the dataset allows for 2
the determination of local hot spots like megacities, medium sized cities, industrial zones, and 3
power plant complexes, seasonal variabilities, and decadal averages. The average AOD at 550 4
nm (AOD550) for the entire region is ~ 0.22 ± 0.19 with maximum values in summer and 5
seasonal variabilities that can be attributed to precipitation, photochemical production of 6
secondary organic aerosols, transport of pollution and smoke from biomass burning in Central 7
and Eastern Europe, and transport of dust from the Sahara Desert and the Middle East. The 8
MODIS data were analyzed together with data from other satellite sensors, reanalysis projects 9
and a chemistry-aerosol-transport model using an optimized algorithm tailored for the region 10
and capable of estimating the contribution of different aerosol types to the total AOD550. The 11
spatial and temporal variability of anthropogenic, dust and fine mode natural aerosols over 12
land and anthropogenic, dust and marine aerosols over the sea is examined. The relative 13
contribution of the different aerosol types to the total AOD550 exhibits a low/high seasonal 14
variability over land/sea areas, respectively. Overall, anthropogenic aerosols, dust and fine 15
mode natural aerosols account for ~ 51 %, ~ 34 % and ~ 15 % of the total AOD550 over land, 16
while, anthropogenic aerosols, dust and marine aerosols account ~ 40 %, ~ 34 % and ~ 26 % 17
of the total AOD550 over the sea, based on MODIS Terra and Aqua observations. 18
19
1 Introduction 20
For more than fifteen years, two MODIS (Moderate Resolution Imaging Spectroradiometer) 21
satellite sensors monitor tropospheric aerosols at a global scale on a daily basis. The retrieved 22
aerosol optical properties have been used in numerous air quality studies as well as studies 23
related to the effect of airborne particles on various climatic parameters (e.g. radiation, clouds, 24
precipitation, etc.). The 1o x 1o daily gridded level-3 dataset is primarily used for global as well 25
as regional studies while the single pixel level-2 data with a 10 km resolution (at nadir) are 26
mostly used for regional and local scale studies. Nevertheless, the use of the coarse resolution 27
MODIS data has predominated even in regional studies. The reasons for this could be the 28
smaller file size which makes their processing and storage easier or the fact that they are easily 29
accessible through user-friendly data bases which also allow for a very basic analysis like e.g. 30
NASA's GIOVANNI website (http://giovanni.gsfc.nasa.gov/giovanni/) (Acker and Leptoukh, 31
2007). 32
3
The same holds for studies focusing on the Mediterranean Basin, an area which is considered of 1
particular sensitivity as far as air pollution and climate change is concerned (Lelieveld et al., 2
2002; Giorgi, 2006). The Mediterranean basin is one of the regions with highest aerosol optical 3
depths (AODs) in the world (Husar et al., 1997; Ichocku et al., 2005; Papadimas et al., 2008), 4
causing significant climate forcing especially in summer, which is characterized by low 5
cloudiness and high incoming solar radiation levels (Papadimas et al., 2012; Alexandri et al., 6
2015). The Mediterranean is also recognized as a crossroads between three continents where 7
aerosols of various types accumulate (Lelieveld et al., 2002). Marine aerosols from the 8
Mediterranean Sea and even the Atlantic Ocean combine with aerosols from continental Europe 9
(urban and rural), dust particles transported from the Sahara Desert and Middle East as well as 10
biomass burning aerosols from occasional wild fires and agricultural burning (Lelieveld et al., 11
2002). Specifically, as discussed in Hatzianastassiou et al. (2009), Eastern Mediterranean, the 12
region under investigation here, is located at a "key" point of this crossroads. There is a 13
significant number of ground and satellite-based studies on the abundance and optical properties 14
of tropospheric aerosols in the area; however, these studies are either focused on specific spots 15
or used a coarse spatial and temporal resolution. 16
The ground-based instrumentation used in studies focusing on the aerosol load and optical 17
properties over the Eastern Mediterranean includes active and passive sensors such as Lidars 18
(e.g. Papayannis and Balis, 1998; Balis et al., 2004; Papayannis et al., 2005, 2009; Amiridis et 19
al., 2005, 2009; Mamouri et al., 2013; Kokkalis et al., 2013; Nisantzi et al., 2015), Cimel 20
sunphotometers (e.g. Israelevich et al., 2003; Kubilay et al., 2003; Derimian et al., 2006; 21
Kalivitis et al., 2007; Kelektsoglou and Rapsomanikis, 2011; Nikitidou and Kazantzidis, 2013), 22
Brewer spectrophotometers (e.g. Kazadzis et al., 2007; Koukouli et al., 2010), Multi-Filter 23
Radiometers (e.g. Gerasopoulos et al., 2009, 2011; Kazadzis et al., 2014), ceilometers (e.g. 24
Tsaknakis et al., 2011), Microtops sunphotometers (e.g. El-Metwally and Alfaro, 2013), etc. 25
However, these and other studies not referenced here either refer to specific spots with the 26
majority of the ground stations being situated in large urban centers (e.g. Athens, Thessaloniki, 27
Cairo) or to specific events (e.g. Sahara dust intrusions, biomass burning events, etc.). 28
On the other hand, AOD and other aerosol optical properties have been studied over the greater 29
Eastern Mediterranean region based on data from Meteosat (Moulin et al., 1998), SeaWIFS 30
(Koren et al., 2003; Antoine and Nobileau, 2006; Mélin et al., 2007; Nabat et al., 2013), TOMS 31
(Alpert and Ganor, 2001; Israelevich et al., 2002; Koukouli et al. 2006; Hatzianastassiou et al., 32
2009; Koukouli et al., 2010, Israelevich et al., 2012, Kaskaoutis et al., 2012a; Nabat et al., 2013; 33
4
Gkikas et al., 2013, 2014; Varga et al., 2014), MODIS Terra and Aqua (Barnaba and Gobbi, 1
2004; Papayannis et al., 2005; Kaskaoutis et al., 2007, 2008, 2010, 2011, 2012a,b,c,d; 2
Kosmopoulos et al., 2008; Papadimas et al., 2008, 2009; Rudich et al., 2008; Carmona and 3
Alpert, 2009; Karnieli et al., 2009; Gkikas et al., 2009, 2013; Hatzianastassiou et al., 2009; El-4
Metwally et al., 2010; Koukouli et al., 2010; Kanakidou et al., 2011; Gerasopoulos et al., 2011; 5
de Meij and Lelieveld, 2011; Marey et al., 2011; de Meij et al., 2012; Nabat et al., 2012, 2013; 6
Nikitidou and Kazantzidis, 2013; Athanasiou et al., 2013; Benas et al., 2011, 2013; Sorek-7
Hamer et al., 2013; Kabatas et al., 2014; Kourtidis et al., 2014; Mishra et al., 2014; Flaounas et 8
al., 2015; Kloog et al., 2015), OMI/AURA (Kaskaoutis et al., 2010; El-Metwally et al., 2010; 9
Marey et al., 2011; Kaskaoutis et al., 2012b,c, Gkikas et al., 2013, 2014; Sorek-Hamer et al., 10
2013; Varga et al., 2014; Flaounas et al., 2015), CALIOP/CALIPSO (Amiridis et al., 2009, 11
2013, Mamouri et al., 2009; Marey et al., 2011; Kaskaoutis et al., 2012c; de Meij et al., 2012; 12
Nabat et al., 2012, 2013; Mamouri and Ansmann, 2015), MISR/Terra (Kanakidou et al., 2011; 13
Marey et al., 2011; de Meij and Lelieveld, 2011; de Meij et al., 2012; Nabat et al., 2013; 14
Kabatas et al., 2014; Abdelkader et al., 2015) as well as NOAA/AVHRR, MERIS/ENVISAT, 15
AATSR/ENVISAT, PARASOL/POLDER, MSG/SEVIRI, and Landsat satellite data (see 16
Retalis and Sifakis, 2010; Nabat et al., 2013; Benas et al., 2013; Sifakis et al., 2014). To our 17
knowledge, these studies comprise the majority of work focusing on tropospheric aerosols over 18
the Eastern Mediterranean by means of satellite remote sensing, published in peer reviewed 19
journals the last ~ 15 years. As shown in Fig. 4 of this work, the publication rate of satellite-20
based studies focusing on the Eastern Mediterranean aerosols nearly doubled every three years 21
during the period 1997-2014 which is indicative of the increasing scientific interest in the area. 22
In a very large fraction of the satellite-based studies referenced above, the used data are either of 23
coarse mode (usually 1o which is ~ 100 km for the mid-latitudes) or focus on specific spots for 24
validation purposes. In a few cases, high resolution data were used in spatiotemporal studies; 25
however, either these studies are restricted over surfaces covered by water or examine a short 26
period only. For example, Moulin et al. (1998) investigated the dust AOD patterns over the 27
oceanic areas of the Mediterranean Basin at a resolution of 35 x 35 km2 for a period of 11 years 28
(1984-1994) using Meteosat observations. A 7-year climatology (1998-2004) of total and dust 29
AOD for the same regions at a resolution of 0.16o x 0.16o was compiled by Antoine and 30
Nobileau (2006) using observations from SeaWIFS. Mélin et al. (2007) merged SeaWIFS and 31
MODIS data and presented high resolution AOD patterns (2 x 2 km2) for May 2003. As far as 32
MODIS is concerned, only Barnaba and Gobbi (2004) presented a high resolution (0.1o x 0.1o) 33
5
spatiotemporal analysis for a period of 1 year (2001) over sea only. In a recent paper, 1
Athanasiou et al. (2013) presented in detail a method for compiling a 0.5-degree resolution 2
AOD gridded dataset using level-2 MODIS Terra data for the greater region of Greece (2000-3
2008). However, the spatial resolution they used (~ 50 km) is not high enough to reveal local 4
sources (e.g. cities, islands, river banks, etc.). Overall, there has not been so far any detailed 5
high resolution spatiotemporal study of the AOD over the Eastern Mediterranean. 6
In this paper, the AOD550 spatiotemporal variability over the Eastern Mediterranean (30oN-7
45oN, 17.5oE-37.5oE) is presented at a high spatial resolution (0.1o x 0.1o) based on MODIS 8
Terra and Aqua observations. Level-2 MODIS data are used for the compilation of a 0.1-degree 9
gridded dataset which is validated against ground-based observations. In order to calculate the 10
contribution of different aerosol types to the total AOD, the MODIS data were analyzed 11
together with other satellite data, ERA-Interim reanalysis data and the Goddard Chemistry 12
Aerosol Radiation and Transport (GOCART) model using an algorithm optimized for the 13
surface properties of the Eastern Mediterranean region. The different datasets used in this 14
research are presented in detail in Sect. 2 while a detailed description of the method is given in 15
Sect. 3. Sect. 4 includes the results from the MODIS validation procedure, the annual and 16
seasonal variability of AOD550 over the region with a discussion on the local aerosol sources 17
and the differences between Terra and Aqua, and the annual and seasonal contribution of 18
different aerosol types to the total AOD550. Finally, in Sect. 5, the main conclusions of the paper 19
are presented along with a short discussion on how these results could contribute to future 20
studies in the area. 21
22
2 Observations, reanalysis data and model simulations 23
2.1 MODIS Terra and Aqua satellite observations 24
The main data used in this work come from the level-2 MODIS Terra (MOD04_L2) and 25
MODIS Aqua (MYD04_L2) Collection 051 dataset and have been acquired through NASA's 26
Level 1 and Atmosphere Archive and Distribution System (LAADS) 27
(http://ladsweb.nascom.nasa.gov). The fact that MODIS Terra and Aqua have a daytime 28
equator crossing time at 10:30 LT (morning) and 13:30 LT (noon), respectively. MODIS 29
instruments with a viewing swath of 2330 km measure backscattered radiation at 36 spectral 30
bands between 0.415 and 14.235 μm with a spatial resolution of 250, 500 and 1000 m, 31
providing a nearly global coverage on a daily basis. Aerosol optical properties for the 32
standard MODIS aerosol product are retrieved using two different "Dark Target" (DT) 33
6
algorithms. The one is used over land surfaces (Kaufman et al., 1997; Levy et al., 2007a, b; 1
Remer et al., 2005; Levy et al., 2010) and the other over oceanic regions (Tanré et al., 1997; 2
Levy et al., 2003; Remer et al., 2005). The "Deep Blue" algorithm (DB) (Hsu et al., 2004; 3
Hsu et al., 2006) has been used for retrievals over bright land surfaces (e.g. deserts) where the 4
DT algorithm fails. Only recently, updates to the algorithm allowed for extending the spatial 5
coverage of the DB aerosol product over all land areas (Hsu et al., 2013; Sayer et al., 2013; 6
2014). AERONET Cimel sunphotometric measurements have been extensively used for the 7
validation of the MODIS over-land and over-ocean products (e.g. Chu et al., 2002; Remer et 8
al., 2002; Remer et al., 2005; Levy et al., 2010; Shi et al., 2013). 9
In this work, AOD550 over both land and sea and the Fine Mode Ratio (FMR550) over sea from 10
Collection 051 were used at a spatial resolution of 10 km (at nadir). The uncertainty of the 11
MODIS aerosol optical depth has been estimated at ±(0.05+0.15AOD) over land (Chu et al., 12
2002; Levy et al., 2010) and ±(0.03+0.05AOD) over ocean (Remer et al., 2002) relative to the 13
AERONET AOD. Specifically, for the DT data used in this work only high quality retrievals 14
are used over land. This means that the data have a Quality Assurance Confidence (QAC) flag 15
equal to 3 (high confidence). For retrievals over sea we use data with a QAC flag of 1 16
(marginally good), 2 (good) and 3 (see Levy et al., 2009 for details). The pre-launch 17
uncertainty of FMR550 is ±30 % over ocean (Remer et al., 2005) while over land this 18
parameter is by no means trustworthy and should only be used in qualitative studies (e.g. see 19
Georgoulias and Kourtidis, 2011). In cases where DT algorithm does not provide products 20
over land, especially over bright arid and semi-arid regions of North Africa, AOD550 values 21
from the DB algorithm are used in our work. The expected uncertainty of the DB product 22
used here is ±(0.05+0.2AOD) relative to the AERONET AOD (Hsu et al., 2006). The 23
analyzed datasets cover the period from 3/2000 to 12/2012 for Terra and from 7/2002 to 24
12/2012 for Aqua MODIS covering the region of the Eastern Mediterranean. The Collection 25
051 DB data for Terra are available only until 12/2007 due to calibration issues; nevertheless, 26
these data are carefully used within our analysis to get a complete image of the aerosol load 27
over the region. 28
29
2.2 AERONET ground-based observations 30
For the evaluation of the MODIS AOD550, data from 13 AERONET Cimel network ground 31
stations in the region of the Eastern Mediterranean have been acquired 32
(http://aeronet.gsfc.nasa.gov). The stations were selected such that their operation period 33
7
covers at least 2 years and there are at least 100 common days of co-localized AERONET and 1
MODIS observations. AERONET Cimel sunphotometers measure solar radiation every 15 2
minutes within the spectral range from 340 to 1020 nm (Holben et al., 2001). The spectral 3
measurements allow for the retrieval of columnar aerosol properties (see Holben et al., 1998; 4
Dubovik and King, 2000; Dubovik et al., 2000, 2002). The AERONET AOD uncertainty is in 5
the order of 0.01-0.02 (Eck et al., 1999), being larger at shorter wavelengths. Here, we use 6
quadratic fits on a log-log scale to interpolate the AERONET data (AODs at 440, 500, 675 7
and 870 nm) to the MODIS band-effective wavelength of 550 nm (Eck et al., 1999; Levy et 8
al., 2010). So, we can directly compare the MODIS AOD550 retrievals against AERONET 9
observations. Simultaneous measurements of the Ångström Exponent (AE) for the spectral 10
range 440-870 nm (AE440-870) from the 13 AERONET stations mentioned above were also 11
utilized in this work in order to account for days with dust dominance. The uncertainty of the 12
AE is significantly higher than the AOD uncertainty, especially under low-AOD conditions. 13
Li et al. (2014) found that the uncertainty for a typical Northern Hemispheric AERONET 14
station (GSFC) is ~ 0.6 during winter when AODs are significantly lower compared to 15
summer (~ 0.15). 16
17
2.3 LIVAS CALIOP/CALIPSO dust climatology 18
Dust aerosol optical depths at 532 nm (AOD532) from CALIOP/CALIPSO (Cloud-Aerosol 19
Lidar with Orthogonal Polarization instrument aboard Cloud-Aerosol Lidar and Infrared 20
Pathfinder Satellite Observations satellite) at a resolution of 1o x 1o are also used here for the 21
period 2007-2012. CALIPSO measures cloud and aerosol properties flying at a 705 km sun 22
synchronous polar orbit with a 16 day repeat cycle and an equator-crossing time close to that 23
of the Aqua satellite (13:30 LT). The dust product used here comes from a Saharan-dust-24
optimized retrieval scheme that was developed within the framework of the LIVAS (Lidar 25
Climatology of Vertical Aerosol Structure for Space-Based LIDAR Simulation Studies) 26
project (Amiridis et al. 2015) and has been presented in detail in Amiridis et al. (2013). In 27
brief, the LIVAS dust product is optimized for Europe by applying a lidar ratio of 58 sr 28
instead of 40 sr to Level 2 dust related backscatter products. This correction results to an 29
improvement of the AOD532 product. Comparison against spatially and temporally co-located 30
AERONET observations (Amiridis et al., 2013) returned an absolute bias of ~ -0.03. The 31
corresponding reported biases for the original CALIPSO data are significantly higher (~ -32
0.10). The bias is even lower when compared against MODIS satellite-based observations. 33
8
Other improvements of this product are related to the use of a new methodology for the 1
calculation of pure dust extinction from dust mixtures and the application of an averaging 2
scheme that includes zero extinction values for the non-dust aerosol types detected. Overall, 3
this product (hereafter denoted as LIVAS dust product) exhibits better agreement with 4
observations from MODIS and AERONET and simulations from the BSC-DREAM8b dust 5
model over North Africa and Europe than the standard CALIPSO data hence being an ideal 6
tool for the evaluation of other satellite-based products. 7
8
2.4 Earth Probe TOMS and OMI satellite observations 9
For this work, UV Aerosol Index (AI) data (Herman et al., 1997) from the Earth Probe TOMS 10
(Total Ozone Mapping) spectrometer aboard Earth Probe for the period 1/2000-9/2004 at a 11
resolution of 1o (latitude) x 1.25o (longitude) and the OMI (Ozone Monitoring Instrument) 12
sensor aboard EOS AURA for the period 10/2004-12/2012 at a resolution of 1o x 1o were 13
acquired through the GIOVANNI web database (http://giovanni.gsfc.nasa.gov/giovanni/). 14
Earth Probe TOMS continued the record of the first three TOMS instruments aboard Nimbus-15
7, Meteor-3 and ADEOS flying in a sun synchronous orbit at an altitude of 740 km with an 16
instantaneous field of view size of 39 x 39 km2 at nadir. The instrument had an ascending 17
node equator crossing time at 12:00 LT covering 85 % of the globe on a daily basis from 18
7/1996 until 12/2005. The satellite was originally set to a 500 km sun synchronous orbit but 19
was set to its final orbit after the failure of ADEOS satellite in 6/1997. OMI is a UV/VIS 20
nadir solar backscatter spectrometer (Levelt et al., 2006) that continues the long TOMS 21
record. OMI flies in a sun synchronous polar orbit at an altitude of 705 km with an ascending 22
node equator crossing time at 13:45 LT. Its 2600 km viewing swath allows for almost daily 23
global coverage while the spatial resolution of the instrument is 13 x 24 km2 at nadir. The AI 24
(also known as Absorbing Aerosol index) which is calculated by the two instruments 25
constitutes a qualitative indicator of the presence of UV absorbing aerosols in the atmosphere 26
such as biomass burning and dust (Torres et al., 1998). Positive AI values generally represent 27
absorbing aerosols while small or negative values represent non-absorbing aerosols. The 28
Version 8 algorithm is applied to spectral measurements from both TOMS and OMI sensor to 29
produce a consistent long-term AI timeseries (Li et al., 2009). AI is calculated from the 30
difference in surface reflectivity derived from the 331.2 and 360 nm measurements exhibiting 31
an uncertainty of ±30 % (Torres et al., 2007). 32
33
9
2.5 ERA-Interim reanalysis data 1
Wind speed (ws) data at 10 m above surface from the ERA-Interim reanalysis (Dee et al., 2
2011) are used for 9:00 and 12:00 UTC on a daily basis for the period 2000-2012. We use 3
9:00 and 12:00 UTC data in order to be closer to the Terra and Aqua overpass time in the 4
area, respectively. The various ERA-Interim reanalysis fields are produced by ECMWF's 5
Integrated Forecast System (IFS) assimilating satellite and ground-based observations. The 6
system includes a 4-D variational analysis with a 12-hour analysis window. The spatial 7
resolution of the ERA-Interim data is ~ 79 km with 60 vertical levels from the surface up to 8
0.1 hPa while the data can be acquired at various resolutions (in this work 1ox1o) through 9
ECMWF's website (http://apps.ecmwf.int/datasets/data/interim-full-daily/). Over ocean, the 10
10 m ERA-interim wind speed exhibits a bias of less than -0.5 m/s compared to quality-11
controlled in situ observations on a global scale (Dee et al., 2011). Specifically, for the region 12
of the Eastern Mediterranean examined here, the 10 m ERA-interim wind speed exhibits a 13
bias of -0.96 m/s (-16 %) compared to satellite-based observations from QuikSCAT 14
(Hermann et al., 2011). 15
16
2.6 MACC reanalysis data 17
The daily MACC total and dust AOD550 data for the period 2003-2012 come from the aerosol 18
analysis and forecast system of ECMWF which consists of a forward model (Morcrette et al., 19
2009) and a data-assimilation module (Benedetti et al., 2009). AOD550 measurements from 20
the two MODIS instruments aboard Terra and Aqua are assimilated by the MACC forecasting 21
system through a 4D-Var assimilation algorithm to produce the aerosol analysis, leading to an 22
improved AOD representation compared to observations (see Benedetti et al., 2009; Mangold 23
et al., 2011). Five aerosol species are included within MACC, namely, mineral dust, sea salt, 24
sulfates, black carbon and organic matter. Three different size bins are used for mineral dust 25
and sea salt particles while the black carbon and organic material are distributed to a 26
hydrophilic and a hydrophobic mode. Dust and sea salt emissions are given as a function of 27
surface wind speed, while the emissions of the other species are taken from inventories. The 28
spatial resolution of the MACC reanalysis data is ~ 79 km with 60 vertical levels from the 29
surface up to 0.1 hPa and can be acquired through: http://apps.ecmwf.int/datasets/data/macc-30
reanalysis/ for the period 2003-2012. The MACC total and dust AODs have been evaluated 31
against ground and satellite-based observations (see Elguindi et al., 2010; Bellouin et al., 32
2013; Inness et al., 2013; Cesnulyte et al., 2014; Cuevas et al., 2015) showing that the MACC 33
10
aerosol products generally capture well the daily, seasonal and interannual variability of 1
aerosols. As discussed in Bellouin et al. (2013) the uncertainties of MACC total AOD550 (~ 2
0.03) and dust AOD550 (~ 0.014) arise from uncertainties in the MODIS retrievals which are 3
assimilated into the model and errors in the forward modeling of total and component AODs. 4
5
2.7 GOCART data 6
Daily total and dust AOD550 data from the GOCART chemistry-aerosol-transport model 7
simulations (version 006) are used in this study for the period 2000-2007. The GOCART 8
model (see Chin et al., 2000, 2002, 2004, 2007; Ginoux et al., 2001, 2004) uses the 9
assimilated meteorological fields of the Goddard Earth Observing System Data Assimilation 10
System (GEOS DAS) which are generated by the Goddard Global Modeling and Assimilation 11
Office (GMAO). The data which are used were acquired from an older version of NASA's 12
GIOVANNI web database (http://disc.sci.gsfc.nasa.gov/giovanni/) and come from a 13
simulation implemented at a spatial resolution of 2° (latitude) x 2.5° (longitude) with 30 14
vertical sigma layers (Chin et al., 2009). The model includes physicochemical processes of 15
major tropospheric aerosol components (sulfates, dust, black carbon, organic carbon, sea salt) 16
and precursor gases (SO2 and dimethylsulfide) incorporating various atmospheric processes. 17
The total AOD550 from GOCART compared to ground-based observations from the 18
AERONET exhibits a relative mean bias [mean(GOCART)/mean(AERONET)] of 1.120, 19
1.135 and 0.959 over Europe, North Africa and for the whole globe, respectively. 20
21
2.8 Ancillary data 22
Apart from the primary datasets presented above, three additional datasets were used in order 23
to support our findings. OMI/AURA daily gridded (Bucsela et al., 2013) tropospheric NO2 24
columnar data (OMNO2d version 2.1) at a spatial resolution of 0.25o x 0.25o were acquired 25
from NASA's GIOVANNI web database (http://giovanni.gsfc.nasa.gov/giovanni/) for the 26
period 2005-2012. The quality checked data used in this work correspond to sky conditions 27
where cloud fraction is less than 30 %. Planetary boundary layer (PBL) SO2 daily gridded 28
columnar data (OMSO2e version 1.1.7) were also acquired from GIOVANNI for the same 29
period. The OMSO2e gridded data (0.25o x 0.25o) used in this work are produced from best 30
level-2 pixel data, screened for OMI row anomaly and other data quality flags. The PBL SO2 31
column retrievals are produced with an algorithm based on principal component analysis 32
(PCA) of the OMI radiance data (Li et al., 2013). Finally, monthly precipitation data from the 33
11
3B43 TRMM and Other Sources Monthly Rainfall Product (version 7) at a spatial resolution 1
of 0.25o x 0.25o for the period 2000-2012 were obtained from GIOVANNI. This dataset is 2
derived from 3-hourly precipitation retrievals from the Precipitation Radar (PR), the TRMM 3
Microwave Imager (TMI) and the Visible and Infrared Scanner (VIRS) aboard the TRMM 4
(Tropical Rainfall Monitoring Mission) satellite merged with other satellite-based 5
precipitation data and the Global Precipitation Climatology Centre (GPCC) rain gauge 6
analysis (Huffman et al., 2007). 7
8
3 Methodology 9
3.1 Compiling a MODIS 0.1o x 0.1o gridded dataset 10
To investigate the spatial and temporal variability of aerosols over the Eastern Mediterranean 11
we first created a 0.1o x 0.1o daily gridded aerosol dataset using single pixel level-2 AOD550 and 12
FMR550 data from MODIS Collection 051. The same resolution has been utilized in previous 13
studies (e.g. Barnaba and Gobbi, 2004) in the region; however, without reporting on the 14
gridding methodology followed. In this work we present a gridding methodology that could be 15
used as a reference for future regional studies. The methodology has been successfully applied 16
in the past on level-2 MODIS Terra data in different cases studies, e.g. in order to examine the 17
weekly cycle patterns of AOD550 over the region of Central Europe and the aerosol load 18
changes observed over a cement plant in Greece due to changes in the deposition practices of 19
the primary materials (see Georgoulias and Kourtidis, 2012; Georgoulias et al., 2012; Kourtidis 20
et al., 2014). In the following lines we proceed to a detailed description of the method 21
underlining the potential of being used in detailed quantitative studies like this one. 22
First, a 0.1o x 0.1o resolution grid covering the Eastern Mediterranean (30oN-45oN, 17.5oE-23
37.5oE) is defined which corresponds to 30000 grid cells. As already mentioned in Sect. 2.1, 24
only level-2 single pixel AOD550 measurements with a QAC flag of 3 and a QAC flag greater 25
than 0 were used over land and over sea, respectively, to ensure the high quality of the data. 26
Pixels are attributed to a specific grid cell if their center falls within a 25 x 25 km2 square 27
window around the grid cell (see Fig. S1 in the Supplement). These pixels are then used for the 28
calculation of daily averages. As shown in Figure S1, a grid cell of 0.1o (~ 10 km) is as big as 29
the centre of a large Mediterranean city like Thessaloniki, Northern Greece (~ 1 million 30
inhabitants). The procedure was followed separately for MODIS Terra and Aqua data. In cases 31
of grid cells with no DT MODIS observations, data from the DB algorithm were used (over 32
12
bright arid and semi-arid regions of North Africa) constituting only a small part of the gridded 1
dataset. 2
The size of the gridding window was selected following Koukouli et al. (2007). They used both 3
10 and 25-km windows showing that the latter allows for the inclusion of more data points 4
without undermining the ability of monitoring accurately the aerosol load over a specific spot. 5
In addition, in cases of urban sites, a window of 25 km allows for the inclusion of pixels from 6
the surrounding non-urban surfaces where the MODIS surface reflectance parameterization is 7
better (Levy et al., 2010). The size of each MODIS pixel is 10 km at nadir, but at the swath 8
edges, it may become 2-3 times larger. Hence, ideally the maximum number of pixels that could 9
be used in the daily averaging is nine. The overlap between the windows of neighbouring grid 10
cells does not affect the representativeness of the dataset over each grid cell. Aerosols are 11
transported by air masses throughout the day and thus the aerosol load in neighbouring grid 12
cells is not expected to be completely independent. 13
In order to make sure that the use of a 25-km gridding window is optimal for capturing local 14
pollution sources we repeated the same procedure for bigger gridding windows (50-km, 75km 15
and 100-km) using MODIS Terra AOD550 data for the year 2004. Numerous aerosol hot spots 16
cannot be seen as the gridding window becomes bigger and there is a significant smoothing of 17
the aerosol patterns mainly over land (Fig. S2). The use of the MODIS gridded dataset in the 18
detection of local aerosol hot spots is discussed in more detail in Sect. 4. In addition, we 19
conducted a detailed validation of the MODIS data against sunphotometric data from a total of 20
13 AERONET stations in the region (see Fig. 1). The validation procedure was repeated several 21
times for different spatial collocation windows which were equal to the windows used for the 22
gridding procedure (i.e. 25, 50, 75 and 100-km) and for different data quality criteria. The 23
results of the validation procedure are presented in Sect. 4.1 while part of them is given in the 24
Supplement of this manuscript (see Table S2). Overall, it is shown that the gridding 25
methodology followed here offers the best compromise for studying the spatial variability of 26
aerosols on a regional or local scale, preserving at the same time the representativeness of the 27
real aerosol load over each specific spot. 28
In order to generalize our results, nine different sub-regions (Fig. 1) were selected apart from 29
the three basic regions of interest, namely, the whole Eastern Mediterranean (EMT) and the land 30
(EML) and oceanic (EMO) areas of the region. The selection was done mainly taking into 31
account geographical but also land type and land use criteria. The four sub-regions that 32
correspond to the land regions of the Eastern Mediterranean are the Northern Balkans Land 33
13
(NBL), the Southern Balkans Land (SBL), the Anatolia Land (ANL) and the Northern Africa 1
Land (NAL) region while the five sub-regions that correspond to the oceanic regions are the 2
Black Sea Oceanic (BSO), the North-Western Oceanic (NWO), the South-Western Oceanic 3
(SWO), the North-Eastern Oceanic (NEO) and the South-Eastern Oceanic (SEO) region. Mean 4
values of the total AOD550 from the Terra and Aqua MODIS are reported for each one of the 5
three basic regions of interest and their nine sub-regions in Sect. 4. 6
7
3.2 Contribution of different aerosol types to AOD550 8
3.2.1 Sea 9
In order to quantify the contribution of different types of aerosols to the total AOD550 we 10
followed a different approach for sea and land. This is due to the lack of reliable FMR550 11
retrievals over land (e.g. see Levy et al., 2010; Georgoulias and Kourtidis, 2011) which are 12
crucial for the algorithms used in this work. Over the sea we utilize wind speed data at 10 m 13
above surface from the ERA-Interim reanalysis, AI data from TOMS and OMI along with 14
AOD550 and FMR550 from the MODIS Terra and Aqua gridded datasets presented above. All the 15
datasets were brought to the same 0.1 degree spatial resolution as MODIS by using bilinear 16
interpolation. In the case of TOMS and OMI we used monthly mean AI data following Bellouin 17
et al. (2008) in order to avoid gaps especially during the TOMS period. 18
In general, the algorithm used over the oceanic regions (see Fig. 2) is similar with the one 19
presented in Bellouin et al. (2008). First, the marine AOD550 (τm) is calculated from near surface 20
wind speed using a linear relation which has been obtained from ground-based studies over 21
pollution free oceanic regions. Bellouin et al. (2008) use the linear relation of Smirnov (2003). 22
Then, if τm is greater or equal than AOD550 it is assumed that there are marine particles only 23
over this region. If τm is smaller than AOD550 a decision tree is followed which is first based on 24
FMR550 and then on AI in order to reach a conclusion about the type of aerosols that account for 25
AOD550. If FMR550 is smaller than the critical value of 0.35 and AI is greater than or equal to a 26
critical value it is assumed that there are both marine aerosols (τm) and dust (τd=AOD550-τm) 27
while if AI is smaller than this critical value it is assumed that there are marine aerosols only. 28
The AI critical value is equal to 1 in Bellouin et al. (2008). If FMR550 is greater than or equal to 29
0.83 it is assumed that there are both anthropogenic (τa=AOD550-τm) and marine aerosols (τm). 30
In the occasion of having a FMR550 equal to 0.35 or greater than 0.35 but smaller than 0.83 one 31
has to take again AI into consideration. If AI is less than the critical value it is assumed that 32
there are marine aerosols (τm) only while in the opposite occasion it is assumed that all the three 33
14
types of aerosols that can be defined over oceanic regions by this algorithm, namely, dust 1
[τd=(1-FMR550)(AOD550-τm)], anthropogenic [τa=FMR550(AOD550-τm)] and marine aerosols (τm) 2
are present. One should keep in mind that all the biomass burning aerosols are classified as 3
anthropogenic by this method. 4
In this work, we proceeded to a "fine-tuning" of the algorithm for the region of the Eastern 5
Mediterranean. First, we applied the algorithm on MODIS Terra data using the same equations 6
and critical values as in Bellouin et al. (2008). The results showed that the original Bellouin et 7
al. (2008) method might be valid for global studies but for a "closed" sea like the Mediterranean 8
the method leads to a large overestimation of sea salt AODs and therefore underestimation of 9
dust and anthropogenic aerosol AODs. Indicative of this situation is Fig. S3 in the Supplement 10
where we present the relative contribution of dust, marine and anthropogenic aerosols per 11
month over the oceanic regions of the Eastern Mediterranean as calculated using the original 12
Bellouin et al. (2008) method. It is shown that the marine contribution is several times higher 13
than the values reported for the Mediterranean Basin in previous studies (e.g. see Nabat et al., 14
2012). Evaluation of the algorithm was done using dust AOD532 data from the LIVAS 15
CALIOP/CALIPSO product. From LIVAS we only use the high quality Sahara dust product as 16
a reference and not other aerosol type retrievals (e.g. marine aerosols) since the dust retrievals 17
from CALIOP/CALIPSO are by far the most reliable (e.g. Burton et al., 2013). We performed 18
several tests by changing the linear relation that connects τm with near surface wind speed and 19
the AI critical values and compared each time the dust AOD550 seasonal variability with the 20
LIVAS AOD532 seasonal variability for the sea covered sub-regions of the Eastern 21
Mediterranean. Results from this algorithm-tuning procedure can be found in Figs. S4e-i of the 22
Supplement where one can also see the underestimation of dust AOD550 from the original 23
Bellouin et al. (2008) algorithm. 24
The linear relation given in Kaufman et al. (2005) was finally selected (τm=0.007ws+0.02). The 25
2000-2012 average wind speed over the sea for the region of the Eastern Mediterranean is ~ 5.3 26
m/s. Kaufman et al. (2005) reduced the offset in the linear relation of Smirnov (2003) from 0.06 27
to 0.02 to fit the average baseline AOD of 0.06 for the typical wind speed of 6 m/s. In addition, 28
our tests showed that an AI critical value of 1 performs well over the region of the Eastern 29
Mediterranean. The results did not change significantly when using other AI thresholds (e.g. 0.5 30
which is suggested in Jones and Christopher, 2011) and therefore we decided to adopt 1 as the 31
AI critical value. Another test, following the example of other studies (see Lehahn et al., 2010), 32
was to assume that for wind speed less than 5 m/s there is very little or no sea-spray particle 33
15
production (limited bursting of entrained air bubbles associated with whitecap formation). In 1
this case, τm is stable, equal to the offset of the linear relation between τm and wind speed which 2
is indicative of the background sea salt AOD550. However, this test reveals that the effect of 3
assuming stable τm for wind speed less than 5 m/s is insignificant and therefore we selected to 4
follow the Kaufman et al. (2005) linear relationship for the whole wind speed range. As shown 5
in Figs. S4e-i, the seasonal variability when applying our modified algorithm over oceanic 6
regions is very close to the LIVAS dust AOD532 especially for the months with lower dust load 7
(June-January). It is also shown that dust AODs from this algorithm are closer to the LIVAS 8
dust product than dust AODs from MACC reanalysis do. The slight overestimation of dust 9
AOD or the shift of the maximum dust load we observe for the period of high dust loads in the 10
region (February-May) is probably connected to the narrow swath and the 16-day time of 11
CALIPSO which means that several dust events might be not observed by the CALIOP 12
instrument contrary to MODIS which has a daily coverage. 13
14
3.2.2 Land 15
As already mentioned in the previous paragraph a different approach is followed over the land 16
regions of the Eastern Mediterranean due the low confidence on the MODIS FMR550 and 17
Ångström exponent retrievals over land compared to that over ocean (e.g. see Levy et al., 2010; 18
Georgoulias and Kourtidis, 2011). This limitation does not allow us to distinguish the 19
contribution of fine and coarse mode aerosols in terms of AOD550. In this case, we choose to use 20
daily model fields of the dust contribution to the total AOD (here MACC reanalysis and 21
GOCART). We follow a method similar with the one presented in Bellouin et al. (2013). 22
Specifically, we calculate the dust AOD550 by scaling the MODIS AOD550 data with the MACC 23
or GOCART dust/total AOD550 ratios [fd=τd(model)/τ(model)] on a daily basis. 24
Since the MACC data are available only from 2003 to 2012, in order to take advantage of the 25
full MODIS dataset (3/2000-12/2012), data from the GOCART model were used for the period 26
2000-2002. The GOCART data were normalized in order to be consistent with the MACC data. 27
Daily dust/total AOD550 ratios (fd) from the common GOCART-MACC period 2003-2007 were 28
first brought to a common 1o x 1o spatial resolution using bilinear interpolation and then we 29
calculated the regression line for each grid cell on a seasonal basis. The linear relations were 30
afterwards used in order to normalize the 2000-2002 GOCART ratios to have a homogeneous 31
dataset. The slopes and offsets of these regression lines and the corresponding correlation 32
coefficients (R) can be seen in Figs. S5, S6 and S7 of the Supplement, respectively. Overall, for 33
16
the whole time period, the MACC reanalysis fd ratios are lower by ~ 26 % from the GOCART fd 1
ratios and the linear relation connecting the two products is fdMACC=0.4964fdGOCART+0.0952 2
with a correlation coefficient R of 0.74. The fd values of the merged GOCART-MACC (2000-3
2012) timeseries were checked using the Standard Normalized Homogeneity Test (SNHT) as 4
described in Alexandersson (1986). The statistical significance was checked following Khaliq 5
and Ouarda (2007) and the fd timeseries were found to be homogeneous (see Fig. S8 of the 6
Supplement). Hence, this test verifies that the use of the merged GOCART-MACC fd dataset 7
will not insert any artifacts (e.g. trends or breaks) in the algorithm. Finally, the fd data were 8
brought to the same spatial resolution with MODIS data (0.1o x0.1o) using bilinear interpolation 9
again. 10
After the calculation of τd with the use of fd values (τd=fdAOD550), we proceed to the calculation 11
of the anthropogenic contribution to the total AOD550 (τa) by multiplying the non-dust part of 12
AOD550 with the anthropogenic fraction fa for the region of Eurasia (0.77±0.20) given in 13
Bellouin et al. (2013) [τa=fa(1-fd)AOD550]. The rest of the total AOD550 is attributed to the fine 14
mode natural aerosols [τn=(1-fa)(1-fd)AOD550] (see Fig. 2). As discussed in Bellouin et al. 15
(2013), the fine mode natural aerosols consist of sea salt, dimethyl sulfide from land and 16
oceanic sources, SO2 from degassing volcanoes and secondary organic aerosols from biogenic 17
emissions. It has to be highlighted that like in the case of oceanic regions the biomass burning 18
aerosols are classified as anthropogenic by this algorithm. As shown in Figs. S4a-d, the seasonal 19
variability of τd over land covered regions is very close to the LIVAS dust AOD532 which is 20
used as a reference. 21
Overall, the algorithm described above performs well as far as dust is concerned. This is further 22
shown when comparing MODIS Terra and Aqua τd values with collocated AERONET 23
observations for dust dominated days (see Fig. S9 in the Supplement). The method followed for 24
the collocation of the data is similar to the one presented in Sect. 4.1 while dust dominated days 25
were days with an AERONET AE smaller than 1 (see Mateos et al., 2014) and a MODIS based 26
τd greater than τa and τn or τm. The uncertainties of the calculated τa, τd, τn and τm values which 27
are inserted by the input data and the assumptions of the algorithm are expected to be similar 28
with the ones presented in Bellouin et al. (2013). Bellouin et al. (2013) using a Monte-Carlo 29
analysis indicated that τa can be specified with an uncertainty of ~ 23 % over land and ~ 16 % 30
over the ocean, τd can be specified with an uncertainty of ~ 19 % over land and ~ 33 % over the 31
ocean, τn can be specified with an uncertainty of ~ 41 % and τm with an uncertainty of ~ 28 %. 32
The results of the application of the algorithm described in the paragraphs above are presented 33
17
in the following section (Sect. 4) by means of maps, pie charts, plots and tables for each one of 1
the three basic regions of interest and their nine sub-regions. 2
3
4 Results and discussion 4
4.1 Validation of MODIS gridded data using ground-based observations 5
As discussed in Sects. 2 and 3, the high quality (QAC: 3) DT level-2 Collection 051 MODIS 6
data used in this work were validated in detail against data from 13 AERONET stations (see 7
Fig. 1). The stations were selected to make sure that their version 2.0 level 2.0 high quality 8
cloud screened Cimel sunphotometric observations were covering at least 2 years and there 9
were at least 100 common days of AERONET and MODIS observations. The exact 10
geolocation of the AERONET stations is given in Table 1 (see also Fig.1) along with the 11
period of available data, the hosting country, the type of the station (e.g. urban/rural, 12
coastal/continental, etc.) and the corresponding mean overpass time of Terra and Aqua 13
MODIS. First, we collocated spatially and temporally the MODIS and AERONET 14
observations by temporally averaging AERONET measurements within ±30 min from the 15
MODIS overpass time (see Levy et al., 2010) and spatially averaging MODIS measurements 16
centered within a 25 x 25 km2 window around each station (see Koukouli et al., 2010). The 17
use of a collocation window equal to the one used for the gridding procedure, practically, 18
allows us to validate at the same time the 0.1o x 0.1o MODIS gridded product. 19
The regression lines between MODIS and AERONET AODs are shown in Fig. 3 while 20
details about the validation results can be found in Table 2. Overall, the MODIS Terra DT 21
Collection 051 data overestimate AOD550 by 11.59 % (Normalized Mean Bias - NMB) with 22
63.28 % of the data falling within the expected error (EE) envelope and 67.78% within the 23
pre-launch expected error (plEE) envelope. The expected error envelope is define as: AOD - 24
|EE| ≤ AODMODIS ≤ AOD + |EE| with EE being ±(0.05±0.15AOD) (Levy et al., 2010) and 25
plEE being ±(0.05±0.20AOD) (Kaufman et al., 1997). On the other hand, the MODIS Aqua 26
DT Collection 051 data overestimate AOD550 by 25.18 % (NMB) with 57.14 % of the data 27
falling within the EE envelope and 61.87 % within the plEE envelope. The percentage of the 28
MODIS Terra and Aqua data falling within the EE envelope are close to the 57 % given in 29
Remer et al. (2005) for the Eastern Mediterranean. The validation results for each station 30
separately can be found in Table S1 of the Supplement. The results discussed in this 31
paragraph are comparable to the ones appearing in previous studies focusing on the 32
Mediterranean region (see Papadimas et al., 2009; Koukouli et al., 2010). In general, it is 33
18
shown here that the MODIS Terra Collection 051 data exhibit a better agreement with the 1
ground-based observations from AERONET than MODIS Aqua data do. Therefore, the 2
statistics appearing for MODIS Terra throughout the paper could be considered more robust. 3
To be in line with the global validation of the DT Collection 051 product by Levy et al. 4
(2010) we also performed a validation with the specifications used in their work. We used a 5
50 x 50 km2 window for the spatial collocation of the MODIS and AERONET data while 6
only days with at least 5 MODIS retrievals and 2 AERONET measurements were taken into 7
account. The increased size of the collocation window improves the results of the validation. 8
As shown in Table 2, MODIS Terra DT Collection 051 data overestimate AOD550 by 5.10 % 9
(NMB) with 70.17 % of the data falling within the EE envelope and 74.64 % within the plEE 10
envelope. For MODIS Aqua, the NMB is 15.34%, while the percentage of the measurements 11
falling within the EE and plEE envelope is 66.76 % and 70.45 %, respectively. These results 12
for the Eastern Mediterranean are close to the global ones presented in Levy et al. (2010). 13
As discussed in Sect. 3.1, data from the DB algorithm were used over bright arid and semi-14
arid regions of North Africa for the production of the 0.1o x 0.1o MODIS gridded dataset for 15
grid cells with no DT data. Therefore, in this work we also perform a validation of the DB 16
Collection 051 product over the region of the Eastern Mediterranean. In the case of DB data, 17
we first make use of all the available DB observations without any quality filtering over the 18
13 AERONET stations. A spatial window of 25-30 km has been typically used in the past for 19
the collocation of MODIS DB data with the AERONET observations (see Shi et al., 2011; 20
Ginoux et al.; 2012; Sayer et al., 2013; 2014) which is in line with the 25 x 25 km2 window 21
used here. The MODIS Terra DB data overestimate AOD550 by 21.38 % (NMB) with 51.90 % 22
of the data falling within the expected uncertainty (EU) envelope assuming a DB expected 23
uncertainty of ±0.05 ± 20%AODAERONET (Hsu et al., 2006). The MODIS Aqua DB Collection 24
051 data overestimate AOD550 by 33.03 % (NMB) with 55.30 % of the data falling within the 25
expected uncertainty envelope. We repeated the validation procedure for DB data taking into 26
account the highest quality data only. The sample of available measurements was diminished 27
by a factor of 5 in the case of MODIS Terra and 6 in the case of MODIS Aqua but the results 28
were pretty similar with the ones for the unfiltered data. Therefore, the use of unfiltered DB 29
data during the gridding procedure does not insert any significant uncertainty. The DB results 30
for the 13 AERONET stations examined here are not of the same agreement than the DT 31
results and the ones presented in previous studies utilizing DB Collection 051 data for other 32
stations and larger regions (see Shi et al., 2011; Ginoux et al., 2012). However, it has been 33
19
reported that stations in the region (e.g. Sede Boqer in Israel) are among the ones with the 1
greatest discrepancies between MODIS DB and AERONET measurements (Ginoux et al., 2
2012). Nevertheless, as commented in Sect. 3.1, the DB data constitute only a small fraction 3
of the data used for the production of the MODIS gridded dataset (~ 1 % only of the 30000 4
grid cells covering the Eastern Mediterranean has only DB retrievals) and therefore they do 5
not affect significantly its quality. Only areas in Northern Africa are expected to be affected 6
by the use of DB data due the extended lack of DT data there. 7
As discussed in Sect. 3.1 the gridding procedure was repeated four times using a gridding 8
window of 25, 50, 75 and 100-km using MODIS Terra AOD550 data for the year 2004 showing 9
that the 25-km window is optimal for capturing local pollution sources. In order to see how the 10
size of the gridding window affects the agreement between MODIS and AERONET data we 11
also proceeded to a validation of MODIS DT data against AERONET measurements using 12
different spatial collocation windows (25, 50, 75 and 100-km) and two quality criteria, a "strict" 13
one: at least 2 AERONET measurements for each MODIS-AERONET pair and "stricter" one: 14
at least 5 MODIS retrievals and 2 AERONET measurements for each MODIS-AERONET pair 15
as in Levy et al. (2010). The results for the DT MODIS Terra and Aqua data are presented in 16
Table S2 of the Supplement. In general, it is shown that the increased size of the spatial 17
collocation window leads to an improvement of the bias between satellite and ground-based 18
observations. This is probably due to the inclusion of more observations into the calculations 19
which diminishes the noise of the MODIS observations. In addition, as expected, the stricter 20
quality criteria lead to a better agreement between MODIS DT and AERONET data. Taking 21
into account not only the NMB but also the regression lines and the other metrics appearing in 22
Table 2S, it is concluded that the 50-km window is the best choice for the validation procedure 23
in line with Ichoku et al. (2002). On the other hand, the 25-km validation results are close to the 24
50-km ones (see Table S2) and at the same time the 25-km gridding window allows for a more 25
efficient detection of local aerosol sources as shown in Sect. 3.1. Taking this into account, we 26
suggest that the 25-km window used for the production of the 0.1o x 0.1o gridded MODIS 27
dataset is the optimal selection for studying the spatial variability of aerosols, preserving at the 28
same time the representativeness of the real aerosol load over each specific spot. 29
30
4.2 Aerosol spatial variability and hot spots 31
The AOD550 spatial variability over the greater Eastern Mediterranean region for the period 32
2000-2012 as seen from the Terra MODIS 0.1o x 0.1o dataset is presented in Fig. 4. Several 33
20
aerosol hot spots that coincide with megacities (e.g. Cairo, Istanbul), large cities (e.g. Athens, 1
Ankara, Alexandria, Izmir, Thessaloniki) or even medium sized cities (e.g. Larissa, 2
Limassol), industrial zones (e.g. OSTIM Industrial Zone in Ankara, Turkey), power plant 3
complexes (e.g. Maritsa Iztok complex at the Stara Zagora Province in Bulgaria, Ptolemaida-4
Kozani power plants in Western Macedonia, Greece), river basins (e.g. Evros river Basin at 5
the borders between Greece and Turkey), etc, can be detected on the map. Indicatively, in Fig 6
4 we give a list of 35 local particle pollution sources in the region; however, careful 7
inspection of this map and the seasonal maps presented in Fig. 6 allows for the detection of 8
many more aerosol sources. The results from the analysis of Aqua MODIS data are pretty 9
similar as shown in Fig. S10 of the Supplement. A significant number of the local aerosol 10
sources can also be detected on the OMI 2004-2012 tropospheric NO2 and PBL SO2 maps 11
given in Figs. 5a and b which reveals the origin of aerosols over these regions (e.g. traffic, 12
industrial activities, etc). However, there are regions of high aerosol load which cannot be 13
seen in Fig. 5a and b and vice versa which is indicative of the significant role of other 14
anthropogenic or natural processes that contribute to the local aerosol load (e.g. fires, soil dust 15
from agricultural activities or arid regions, Sahara dust transport). 16
The topography (Fig. 5c) and precipitation (see Fig. 5d for annual precipitation levels for the 17
period 2000-2012 from TRMM) are also major determinants of the local AOD550 levels. For 18
example, regions with mountain ranges on the Balkan Peninsula (e.g. Pindus mountain range 19
in Greece, Dinaric Alps that run through Albania and the former Yugoslav republics, the 20
Balkan mountain range in Central Bulgaria) are characterized by low AODs (see Fig. 4). On 21
the contrary, regions of low altitude are generally characterized by higher AODs because the 22
majority of anthropogenic activities is usually concentrated there. Also, low altitude regions 23
surrounded by high mountains are characterized by higher AODs as aerosols cannot be easily 24
transported by the wind (e.g. the industrialized regions in Central Bulgaria which are confined 25
between the high Balkan and Rodopi mountain ranges). As precipitation is the major removal 26
mechanism of pollutants in the atmosphere, regions with high AOD550 are in many cases 27
connected to low precipitation levels and vice versa (see Figs. 4 and 5d). It has to be 28
highlighted that the AOD550 over these regions is high primarily due to the emissions and the 29
atmospheric processes forming aerosol particles. The low removal rates from precipitation 30
just preserve the AOD550 levels high. A striking example is the region of Anatolia in Central 31
Turkey which is characterized by lower precipitation levels and higher aerosol loads 32
21
compared to the surrounding regions. Also, the low precipitation levels are partly responsible 1
for the high aerosol loads appearing over Northern Africa. 2
Overall, the mean AOD550 for the whole period of interest is estimated at 0.215 ± 0.187 for 3
Terra and 0.217 ± 0.199 for Aqua MODIS for the Eastern Mediterranean region which is ~ 45 4
% higher than the global average appearing in recent studies (e.g. Kourtidis et al., 2015). Over 5
land higher mean AODs are generally recorded (0.219 ± 0.165 for Terra and 0.239 ± 0.189 6
for Aqua MODIS) than over the sea (0.213 ± 0.201 for Terra and 0.202 ± 0.205 for Aqua 7
MODIS). All these values along with the mean AODs for the 9 sub-regions of interest 8
covering the Eastern Mediterranean can be found in Table 3. 9
The AOD550 spatial variability on a seasonal basis from MODIS Terra and Aqua is presented 10
in Fig. 6 along with the difference between the two products. The majority of the local aerosol 11
sources over land are more prominent in summer. The limited washout by precipitation (see 12
also Papadimas et al., 2008) and also the enhanced photochemical production of secondary 13
organic aerosols (Kanakidou et al., 2011 and references therein) contribute to the high AODs 14
appearing over local sources. In addition, during summer, over the region, there is typically a 15
significant transport of aerosols (e.g. see Kanakidou et al., 2011 and references therein) and 16
gaseous pollutants like SO2 and NO2 (see Georgoulias et al., 2009; Zyrichidou et al., 2009) 17
and biomass burning aerosols from Central-Eastern Europe. Over the sea, a profound 18
maximum is observed in spring extending across the North African coast and the neighboring 19
oceanic areas which is due to the well documented transport of significant amounts of dust 20
from the Sahara Desert (see Barnaba and Gobbi., 2004 and the list of references given in the 21
introduction). The seasonal variability of aerosols and the relative role of different aerosol 22
types and various processes is discussed in more details in Sect 4.4. 23
The difference between MODIS Terra and Aqua Collection 051 AOD550 over the Eastern 24
Mediterranean is -0.002 (-1.40 %) for winter, -0.009 (-3.27 %) for spring, -0.011 (-4.46 %) 25
for summer and 0.008 (4.40 %) for autumn. AOD550 levels from Terra MODIS are lower than 26
that from Aqua MODIS over land for all seasons. Over the sea, Terra MODIS AOD550 levels 27
are lower than that of Aqua MODIS only in winter. The fact that Terra MODIS measurements 28
are systematically higher than that from Aqua over the sea by ~ 0.01 on an annual basis is in 29
line with the findings of previous global studies for Collection 5 (e.g. Remer et al., 2006; 30
2008). Locally, one can see regions with positive and negative differences between Terra and 31
Aqua MODIS AOD550. The patterns of the Terra-Aqua difference per season are presented in 32
Figs. 6c, f, i and l while the patterns of the percent difference are given in Fig. S11 of the 33
22
Supplement. The largest part of the Terra-Aqua MODIS differences over land and sea which 1
are observed here may be attributed to the known calibration and sensor degradation issues of 2
MODIS (for details see Levy et al., 2010; 2013; Lyapustin et al., 2014; Georgoulias et al., 3
2016). A significant effort has been undertaken to address these issues in the new (Collection 4
6) MODIS product (e.g. Levy et al., 2013; Lyapustin et al., 2014; Georgoulias et al., 2016) 5
and a repetition of a similar analysis with Collection 6 data in the future would be a valuable 6
contribution. Taking into account the aforementioned issues and the retrieval uncertainty of 7
MODIS it becomes more than obvious that the attribution of observed differences between 8
Terra and Aqua to the diurnal variability of aerosol load (e.g. over biomass burning regions) 9
in the region is a difficult task. It is shown in Fig. S12 of the Supplement that the diurnal 10
variability of AOD550 from AERONET ranges significantly from station to station. The 11
average hourly departure from the daily mean for the total of the 13 stations ranges from ~ -5 12
% to ~ 5 %. Specifically, for the MODIS Terra and Aqua overpass times, the AERONET 13
AOD550 difference ranges from ~ -10 % to ~ 10 % (see Fig. S12b). The Terra-Aqua AOD550 14
difference is negative for the total of the 13 stations ranging from ~ -25 % to ~ -5 %. It is 15
shown in Fig. S12b that the two differences exhibit a similar variability from station to station 16
which indicates that part of the observed Terra-Aqua difference is indeed due to the diurnal 17
variability of aerosols. However, as mentioned above, the diurnal variability of aerosols is a 18
very delicate issue and should be comprehensively addressed in a future study. The same 19
stands for other kind of variabilities which could be connected to local and regional 20
anthropogenic activities like e.g. the weekly cycle of aerosols (see Georgoulias and Kourtidis, 21
2011; Georgoulias et al., 2015). 22
23
4.3 Contribution of different aerosol types to the total AOD550 24
4.3.1 Annual contribution 25
As mentioned above, we attempt to estimate in our work the contribution of different aerosol 26
types to the total AOD550 over the region of the Eastern Mediterranean was calculated 27
following the methodology presented in Sect. 3.2. For the land covered areas, based on 28
MODIS Terra observations, we estimate that 52 % (0.112±0.087) of the total AOD550 is due 29
to anthropogenic aerosols, 32 % (0.074±0.080) due to dust and 16 % (0.034±0.026) due to 30
fine mode natural aerosols (see Fig. 7). For the oceanic areas, 41 % (0.086±0.085) of the total 31
AOD550 is due to anthropogenic aerosols, 34 % (0.076±0.185) due to dust and 25 % 32
(0.054±0.018) due to marine aerosols (see Fig. 7). The results based on observations from 33
23
MODIS Aqua are similar. Over land, 50 % (0.117±0.093) of the total AOD550 is 1
anthropogenic, 35 % (0.090±0.102) is due to dust and 15 % (0.035±0.028) due to fine mode 2
natural aerosols, while, over the sea, 40 % (0.079±0.080) of the total AOD550 is of 3
anthropogenic origin, 33 % (0.070±0.181) is due to dust and 27 % (0.054±0.018) due to 4
marine aerosols (see Fig. 7). These results along with the relative contributions and the annual 5
τa, τd, τn and τm levels for each one of the nine sub-regions of interest (see Fig. 1) are given in 6
Table 4. 7
For anthropogenic aerosols, the region with the highest relative contribution is NBL (59 % for 8
both Terra and Aqua MODIS) while the region with the lowest relative contribution is SWO 9
(32 % for both Terra and Aqua MODIS) (see also Table 4). The spatial variability of τα is 10
presented in Fig. 8a for Terra MODIS and Fig. S13a of the Supplement for Aqua MODIS, the 11
patterns being similar in both cases. Over land, the annual τa patterns are similar to the 12
AOD550 patterns, the highest values appearing over local particle pollution sources (cities, 13
industrial zones, etc.). Over the sea, τa is higher along the coasts, while it drops significantly 14
towards other directions. An interesting feature here is that the oceanic region of Black Sea 15
(BSO) presents higher relative anthropogenic contributions than the rest of the oceanic sub-16
regions but also than land areas with significant anthropogenic sources (e.g. ANL and NAL). 17
This is indicative of the transport of atmospheric particles from Central Europe and biomass 18
burning aerosols during the biomass burning seasons in April-May from Russia (across the 19
latitudinal zone 45oN-55oN) and July-August from South-Western Russia and Eastern Europe 20
(Amiridis et al., 2010). These aerosols are transported at much lower latitudes as shown in 21
previous studies (e.g. Vrekoussis et al., 2005; Karnieli et al., 2009) reaching the Sahara Desert 22
and the Middle East regions (Pozzer et al., 2015). The fact that τa drops gradually from the 23
coasts is also seen in Fig. 9 where the latitudinal variability of the optical depths of the 24
different aerosol types (τa, τd, τn and τm) is presented for four bands that cover the whole 25
Eastern Mediterranean. An interesting feature is that τa increases nearby the shoreline 26
(particularly along the North African coastal zone) before it gradually decreases. Over land 27
aerosols are located within the atmospheric boundary layer, close to the emission sources, and 28
hence, their deposition and removal from the atmosphere is more efficient than over the sea. 29
The particles which are transported over the sea on the other hand usually reach greater 30
heights which prolongs their lifetime. 31
As shown in Fig. 9, the same feature is observed for dust. Indicatively, τd and the relative 32
contribution of dust to the total AOD550 on an annual basis over the oceanic regions of SWO 33
24
and SEO are in general higher or comparable to the ones over NAL (see Table 4 for more 1
details). In Fig. 9, the MODIS-based τd latitudinal variability is presented along with the 2
latitudinal variability of dust AOD532 and extinction coefficients of dust at 532 nm from 3
LIVAS. As expected, in all cases τd decreases with distance from the large dust sources in the 4
South and South-East (Sahara Desert, Middle East deserts) with local maxima over the 5
latitudinal zone from 35oN to 40oN (especially for band 2 and band 3). The latitudinal 6
variability of τd is similar to the latitudinal variability of dust AOD532 for all the four bands 7
despite the fact that the MODIS-based data have a resolution 100 times higher (0.1o vs 1o) and 8
therefore are more sensitive to local characteristics. Dust reaches heights up to ~ 4-5 km in the 9
area; however, the largest fraction of dust mass is confined within the first 2-3 km of the 10
troposphere (see Fig. 9). The annual τd patterns are shown in Fig. 8b for Terra MODIS (Fig. 11
S13b of the Supplement for Aqua MODIS). The main dust transport pathways over the 12
oceanic areas of the Eastern Mediterranean can be seen along with various local maxima over 13
land. The highest τd values over land appear over the regions of NAL and ANL (see Table 4) 14
and along the coasts. The high dust concentrations appearing over these regions are not only 15
due to the transport of dust from the nearby deserts but also due to local dust sources. A 16
recent study by Liora et al. (2015) reports various local sources of wind blown dust along the 17
coastal regions of Greece and Turkey, over the region of Anatolia in Turkey, over the Greek 18
islands, Crete, Cyprus and regions close to the coastal zone of Middle East. Their results are 19
in good agreement with the τd patterns presented in this work. 20
As shown in Fig. 7, fine mode natural aerosols exhibit the lowest contribution to the total 21
AOD550 compared to the other aerosol types over land. The spatial variability of τn is very low 22
compared to τa and τd as shown in Figs. 8c and 9. It is inferred from the values appearing in 23
Table 4 that τn increases slightly as one moves from North to South; however, the relative 24
contribution of fine mode natural aerosols to the total AOD550 slightly decreases (i.e. 17.67 % 25
over NBL and 14.97 % over NAL according to Terra MODIS observations). The latitudinal 26
variability and the percentages appearing in Table 4 are in accordance to the relative 27
contributions of biogenic aerosols to the total AOD550 appearing over the Eastern 28
Mediterranean in a recent modeling study (Rea et., 2015). 29
Similar to fine mode natural aerosols over land, marine aerosols generally have the lowest 30
contribution to the total AOD550 compared to the other aerosol types over the sea (see Fig. 7 31
and Table 4) except for BSO. The variability of τm is very low compared to τa and τd. On an 32
annual basis, high τm values appear over the Aegean Sea and the oceanic area between Crete 33
25
and the North African coast while slightly lower values appear along the coasts of the Eastern 1
Mediterranean (see Figs. 8d and 9). The τm patterns follow the near surface wind speed 2
patterns in the region (see Fig. S14 of the Supplement) being in accordance to the τm, marine 3
particulate matter concentration or sea salt emission patterns appearing in other studies (Im et 4
al., 2012; Nabat et al., 2013; Rea et al., 2015; Liora et al., 2015). 5
6
4.3.2 Seasonal contribution 7
The contribution of different aerosol types to the total AOD550 over the Eastern Mediterranean 8
varies from season to season. The relative contribution of each aerosol type over EML and 9
EMO for each season is shown in Fig. 10. Over land, the relative contribution of τa, τd and τn 10
to the total AOD550 exhibits a low seasonal variability. The relative contribution of 11
anthropogenic aerosols to the total AOD550 ranges from 49 % in SON to 55 % in DJF based 12
on Terra MODIS observations and from 48 % in MAM and SON to 52 % in JJA based on 13
Aqua MODIS observations. In contrast, over the oceanic regions the relative contribution of 14
τa, τd and τm to the total AOD550 exhibits a significant seasonal variability. The relative 15
contribution of anthropogenic aerosols to the total AOD550 ranges from 27 % / 27 % in DJF to 16
50 % / 47 % in JJA based on Terra/Aqua MODIS observations. The percentages appearing 17
here are in accordance to the values appearing in Hatzianastassiou et al. (2009) where a 18
different satellite-based approach was followed. Indicatively, for the greater Athens area, an 19
average summertime anthropogenic contribution of ~ 50 % was found here based on Terra 20
MODIS data which is within the summer period range of 47-61 % indicated in the study by 21
Hatzianastassiou et al. (2009). In addition, the corresponding values for the greater 22
Thessaloniki area, Crete, Cairo and Alexandria are 53 %, 38 %, 48 % and 41 %, respectively, 23
within the range of values (57-73 %, 36-52 %, 34-56 % and 23-60 %) shown in 24
Hatzianastassiou et al. (2009). Only in the case of Ankara, our results suggest a lower 25
anthropogenic contribution (52 % versus 71-84 %). Particularly for Athens, Gerasopoulos et 26
al. (2011) following a different approach incorporating ground-based AOD observations and 27
trajectory modeling reached similar results (annual contribution of ~ 62 % from local and 28
regional sources and continental Europe which is expected to be mostly of anthropogenic 29
origin). Similarly, for Crete, Bergamo et al. (2008) using a different approach, also utilizing 30
ground-based data, found an annual anthropogenic contribution of ~ 43 %. 31
The seasonal patterns of the anthropogenic aerosols (τa) over the Eastern Mediterranean based 32
on MODIS Terra observations are presented in Figs. 11a, e, i and m while the seasonal 33
26
variability of τa over the whole region, over the land covered part and the oceanic part and 1
over the 9 sub-regions of interest is presented in Fig. 12. The results based on MODIS Aqua 2
observations are similar and can be found in Figs. S15a, e, i and m and Fig. S16 of the 3
Supplement. Generally, the local hot spots are detectable throughout the year; however, they 4
are becoming much more discernible in spring and especially in summer. As shown in Fig. 5
12a, τa nearly doubles during the warm period of the year (spring-summer) with the seasonal 6
variability being stronger over the sea (Fig. 12c) than over land (Fig. 12b). A clear peak is 7
observed in summer, August being the month with highest τa levels. As discussed in Sect. 8
4.3.1 the summer peak is mostly a result of three basic reasons. The first one is the deficiency 9
of wet removal processes compared to the cold period. As shown in Fig. S17, based on the 10
TRMM satellite observations, August and July are the months with the lowest precipitation 11
levels over the land covered part (a drop of ~ 75 % compared to winter months) and over the 12
oceanic part (a drop of ~ 90 % compared to winter months) of the Eastern Mediterranean, 13
respectively. The second reason is the enhancement of the photochemical production of 14
secondary organic aerosols in summer (Kanakidou et al., 2011) and the third reason is the 15
transport of pollution aerosols from Central Europe and biomass burning aerosols from South-16
Western Russia and Eastern Europe during the biomass burning season in July-August 17
(Amiridis et al., 2010). The Etesians, which are persistent northerly winds that prevail over 18
the Eastern Mediterranean during summer, bring dry and cool air masses and aerosols from 19
the regions mentioned above while blocking at the same time the transport of desert dust in 20
the region and dispersing local pollution in urban areas to levels typical for rural areas (see 21
Tyrlis and Lelieveld, 2013 and references therein). As seen in Figs. 12a-l, a smaller but 22
distinct in most cases τa peak appears in April mostly as a result of the transport of biomass 23
burning aerosols from Russia (across the latitudinal zone 45oN-55oN). This is in line with the 24
findings of Sciare et al. (2008) who detected traces of these biomass burning aerosols at the 25
island of Crete in Southern Greece. 26
As discussed above, the relative contribution of dust to the total AOD550 over land exhibits a 27
low seasonal variability ranging from 29 % in DJF to 36 % in SON based on Terra MODIS 28
observations and from 33 % in JJA to 38 % in SON based on Aqua MODIS observations (see 29
Fig. 10). Over the oceanic regions the relative contribution of dust to the total AOD550 ranges 30
significantly throughout a year from 26 % / 28 % in JJA to 42 % / 39 % in MAM based on 31
Terra/Aqua MODIS observations. The percentages appearing here are in accordance to model 32
and observational studies. For example, de Meij et al. (2012) using the atmospheric chemistry 33
27
general circulation model EMAC (ECHAM/MESSy Atmospheric Chemistry) showed that 1
dust contributes on an annual level ~ 30 % to the total AOD550 over stations located in the 2
area of the Eastern Mediterranean. Gerasopoulos et al. (2011) found a ~ 23 % percent 3
contribution of North African dust to the total AOD over Athens using ground-based AOD 4
observations and trajectory modeling. Taking into account that part of the ~ 39 % local and 5
regional sources appearing in Gerasopoulos et al. (2011) is due to local dust sources, 6
especially in summer, turns out that their results are in agreement with the ~ 33 % relative 7
contribution found in this work for the greater Athens area based on Terra MODIS 8
observations. The seasonal patterns of dust (τd) over the region based on Terra MODIS 9
observations are shown in Figs. 11b, f, j and n while the seasonal variability of τd over the 10
whole region, over land, over the sea and over the 9 sub-regions of interest is shown in Fig. 11
12. The corresponding results based on MODIS Aqua observations are pretty similar and can 12
be found in Figs. S15b, f, j and n and Fig. S16 of the Supplement. 13
As seen in Fig. 11f, in spring, mostly due to the strong Sahara dust events, very high τd values 14
appear over land regions in North Africa, Middle East, Anatolia and oceanic areas across the 15
Eastern Mediterranean (especially below 35oN). Dust loading over the sea exhibits two 16
maxima, one at the coastal zone of Libya and one across the coastal zone of Middle East. The 17
same two maxima but with much lower τd values appear in summer (Fig. 11j) and autumn 18
(Fig. 11n). Over land, the τd patterns are similar in summer and autumn, the maximum values 19
appearing over the Anatolian Plateau and areas of North Africa and Middle East. During 20
winter, dust maxima appear across the coastal zone of Northern Africa with relatively low τd 21
values across the coastal zone of Middle East (Fig. 11b). In winter τd levels are low over land 22
compared to the other seasons (Figs. 11b, f, j and n) as precipitation levels (see Fig. S17 of the 23
Supplement) and hence wet scavenging of aerosols peak. At the same time, the local 24
emissions of dust are low for regions away from the large area sources in the South (Liora et 25
al., 2015). In contrast, over the sea τd levels in winter are similar or slightly higher for some 26
areas than that in summer and autumn (see Figs. 11 and 12) as this is the season with the 27
second highest frequency (after spring) of strong (~ 21 %) and extreme (~ 26 %) desert dust 28
episodes in the region (see Gkikas et al., 2013 for details). February is by far the winter month 29
with the highest τd levels (see Fig. 12) in line with the findings of Pey et al. (2013) who 30
showed that the intensity of African dust episodes over stations in Greece and Cyprus peaks 31
in February. Dust exhibits a strong peak in spring, April being the month with the highest τd 32
levels in line with other studies (e.g. Israelevic et al., 2012; Varga et al., 2014). The peak in 33
28
April is a result of the high cyclonic activity over North Africa during this month as shown by 1
Flaounas et al. (2015). According to the same study, low pressure systems are responsible for 2
~ 10-20 % of moderate and ~ 40-50 % of high and extreme Sahara dust transport events over 3
the Eastern Mediterranean. North Africa (Sharav) cyclones develop mainly in spring and 4
summer while Mediterranean cyclones develop in winter and autumn. The Mediterranean 5
cyclones are more intense than Sharav cyclones. The region, is also affected by events 6
bringing particles from dust source regions in the eastern part of the Mediterranean basin 7
(Negev desert in Israel, Sinai in Egypt, Anatolian Plateau in Turkey) and the Arabian deserts 8
(Basart et al. 2009; Pey et al., 2013; Abdelkader et al., 2015). Dust remains in the atmosphere 9
for a period of 1-4 days undergoing chemical aging before being removed (see Abdelkader et 10
al. 2015 and references therein). The seasonal variability of τd is much stronger and the spring 11
maxima much more prominent over the sea (see Fig. 12). This is expected, as dust is only 12
occasionally transported over the sea during episodic events, while over land, local sources 13
also contribute to the dust burden especially in summer due to the dryness of soil. For 14
example, over NBL, a broad spring-summer peak is observed, June being the month with the 15
highest τd levels. As one moves south (SBL, ANL and NAL) the April peak becomes more 16
prominent. 17
The relative contribution of fine mode natural aerosols to the total AOD550 over land exhibits 18
a very low seasonal variability ranging from 15 % in MAM and SON to 16 % in DJF and JJA 19
based on Terra MODIS observations and from 14 % in DJF and SON to 15 % in MAM and 20
JJA based on Aqua MODIS observations (see Fig. 10). The seasonal variability is also very 21
low, the highest values appearing in spring and summer (Fig. 12). Despite the generally low 22
contribution of fine mode natural aerosols to the total AOD550 over the Eastern 23
Mediterranean, τn levels are similar to τd levels during winter months over specific regions 24
(NBL and SBL). The low seasonal variability can also be seen in Figs. 11c, g, k and o where 25
the patterns of fine mode natural aerosols (τn) are presented. 26
The seasonal relative contribution of marine aerosols to the total AOD550 over the oceanic 27
regions of the Eastern Mediterranean is shown in Fig. 10. τm ranges from 20 % in MAM to 35 28
% in DJF based on Terra MODIS observations and from 21 % in MAM to 36 % in DJF based 29
on Aqua MODIS observations (see Fig. 10). Like in the case of fine mode natural aerosols, 30
the seasonal variability is very low, but here the highest values appear in winter (Fig. 12). Due 31
to the linear relation of τm and near surface wind speed within our algorithm (see Fig. 2) the 32
τm seasonal variability and patterns follow the wind speed ones (see Figs. 11d, h, l, p and 33
29
S14). Marine aerosol concentrations are lower close to the coastlines while the highest 1
concentrations (see Liora et al., 2015) and τm values within the Eastern Mediterranean appear 2
over the Aegean Sea (see Fig. 11). Overall, the τm patterns are in accordance to the τm, marine 3
particulate matter concentration and sea salt emission patterns from previous studies (Im et 4
al., 2012; Nabat et al., 2013; Rea et al., 2015; Liora et al., 2015). 5
6
5 Summary and conclusions 7
In this work, satellite data from MODIS Terra (3/2000-12/2012) and Aqua (7/2002-12/2012) 8
were analyzed separately in order to examine the spatial and temporal variability of aerosols 9
over the Eastern Mediterranean. A high resolution (0.1o x 0.1o) MODIS gridded dataset was 10
compiled using a method that could be used in future regional studies. A number of tests were 11
implemented and the dataset was validated in detail using sunphotometric observations from 12
13 AERONET stations. According to the validation, the statistics appearing for MODIS Terra 13
throughout the paper could be considered more robust while areas in Northern Africa are 14
expected to be affected by the extended use of DB data which do not exhibit a very good 15
matching with the ground-based observations. It is shown that the gridding method we use 16
offers the best compromise for studying the spatial variability of aerosols on a regional or 17
local scale, preserving at the same time the representativeness of the real aerosol load over 18
each specific spot. 19
Based on MODIS observations the average AOD550 levels over the region of the Eastern 20
Mediterranean are ~ 0.22 ± 0.19 which is ~ 45 % higher than the global mean. A number of 21
aerosol hot spots that coincide with megacities, large and even medium size cities, industrial 22
zones, power plant complexes, river basins, etc., can be detected on the AOD maps. A 23
number of local aerosol sources can also be seen on satellite retrieved tropospheric NO2 and 24
planetary boundary layer SO2 maps from OMI/AURA. This is indicative of the strong 25
presence of anthropogenic aerosols over these regions. Topography and precipitation also 26
play an important role. Generally, regions with mountain ranges are characterized by low 27
AODs while regions of low altitude are characterized by higher AODs. Regions with high 28
AOD550 are in many cases connected to low precipitation levels and vice versa. Precipitation 29
is the major washout mechanism of atmospheric pollutants., Low removal rates from 30
precipitation contribute in preserving high the AOD550 levels which are a result of emissions 31
and other atmospheric processes. 32
30
The AOD550 patterns over the Eastern Mediterranean exhibit a significant seasonal variability 1
which is mostly driven by precipitation, photochemical production of secondary organic 2
aerosols, transport of pollution and biomass burning aerosols from Central and Eastern 3
Europe and transport of dust from the Sahara Desert and the Middle East. Differences 4
between MODIS Terra and Aqua Collection 051 AOD550 over the Eastern Mediterranean are 5
generally small (~ -8 % over land and ~ 5 % over the sea). The comparison of the Terra-Aqua 6
differences with diurnal variabilities from the AERONET stations showed that only a part of 7
the observed differences is due to the diurnal variability of aerosols. 8
The MODIS data were combined with data from other satellites (Earth Probe TOMS, 9
ΟΜΙ/AURA), reanalysis projects (ERA-Interim, MACC) and a chemistry-aerosol-transport 10
model (GOCART) to calculate the contribution of different types of aerosols to the total 11
AOD550. The algorithm used was optimized for the Eastern Mediterranean through a number 12
of tests and comparison with LIVAS CALIOP/CALIPSO dust retrievals and AERONET 13
ground-based observations. A different approach is used for land and sea as there is not any 14
reliable satellite retrieved quantity to separate the contribution of fine and coarse mode 15
aerosols over water surfaces. 16
Overall, for the land areas, based on MODIS Terra observations, 52 % (0.112±0.087) of the 17
total AOD550 is due to anthropogenic aerosols, 32 % (0.074±0.080) due to dust and 16 % 18
(0.034±0.026) due to fine mode natural aerosols (see Fig. 7). For the oceanic areas, 41 % 19
(0.086±0.085) of the total AOD550 is due to anthropogenic aerosols, 34 % (0.076±0.185) due 20
to dust and 25 % (0.054±0.018) due to marine aerosols. The results based on observations 21
from MODIS Aqua are in accord with previous studies. 22
Over land, the τa maxima are detected over local particle pollution sources (cities, industrial 23
zones, etc.). Over the sea, τa is higher along the coasts being significantly lower at greater 24
distance. Very high τd values appear over land regions in North Africa, Middle East, Anatolia 25
and oceanic areas across the Eastern Mediterranean, especially for latitudes below 35oN. Over 26
the sea, dust loading exhibits two maxima, one at the coastal zone of Libya and one across the 27
coastal zone of the Middle East. τd decreases with distance from the large dust sources in the 28
South and South-East. Generally, dust reaches heights up to ~ 4-5 km in the area, the largest 29
fraction of dust mass being confined within the first 2-3 km of the troposphere. The spatial 30
variability of τn and τm is very low compared to τa and τd, following the total AOD550 patterns 31
and the near surface wind speed patterns, respectively. 32
31
Over land, the relative contribution of anthropogenic aerosols, dust and fine mode natural 1
aerosols to the total AOD550 exhibits a low seasonal variability, while over the sea the relative 2
contribution of anthropogenic aerosols, dust and marine aerosols shows a significant seasonal 3
variability. 4
τa nearly doubles during the warm period of the year (spring-summer), August and April 5
being the months with the highest τa levels. The summer peak is mostly the result of low 6
precipitation levels, enhancement of the photochemical production of secondary organic 7
aerosols and transport of pollution aerosols from Central Europe and biomass burning 8
aerosols from South-Western Russia and Eastern Europe during the biomass burning season 9
in July-August. The spring maximum in April is mostly the result of transport of biomass 10
burning aerosols from Russia in line with previous studies. Dust exhibits a strong peak in 11
spring (April), especially over the southern regions. April is the month with the highest τd 12
levels as a result of the high cyclonic activity over North Africa. The seasonal variability of 13
dust is much stronger and the spring maxima much more prominent over the sea as dust is 14
only occasionally transported there during episodic events, while over land, local sources 15
contribute to the dust burden, especially in summer due to the soil dryness. The seasonal 16
variability of fine mode natural aerosols is very low, the highest values appearing in spring 17
and summer. Marine aerosols also present a very low seasonal variability, the highest values 18
appearing in winter due to the high near surface wind speeds. 19
Overall, it is suggested that the AOD550, τa, τd, τn and τm high resolution gridded dataset which 20
was compiled in this work could be used in a number of future atmospheric and biological 21
studies focusing on the region of the Eastern Mediterranean (e.g. satellite and ground-based 22
studies on aerosol-cloud-radiation interactions, experimental and field campaign studies on 23
aerosols and clouds and research on the impact of aerosols on human health and nature). It is 24
also acknowledged that a future update of the results presented here using more recent 25
releases of MODIS aerosol data (e.g. Collection 6) and aerosol reanalysis datasets (e.g. 26
NASA's Modern-Era Retrospective Analysis For Research And Applications Aerosol Re-27
analysis) would be a useful contribution. 28
29
Acknowledgements 30
This research received funding from the European Social Fund (ESF) and national resources 31
under the operational programme Education and Lifelong Learning (EdLL) within the 32
framework of the Action "Supporting Postdoctoral Researchers" (QUADIEEMS project), 33
32
from the European Research Council under the European Union’s Seventh Framework 1
Programme (FP7/2007-2013)/ERC grant agreement no. 226144 (C8 project), from the FP7 2
Programme MarcoPolo (grant number 606953, theme SPA.2013.3.2-01) and from the 3
European Union’s Horizon 2020 research and innovation programme under grant agreement 4
no. 654109. The authors express their gratitude to the teams that developed the algorithms and 5
produced the satellite products used in this study and to those who worked on the production 6
of the model and reanalysis data used here. Special thanks are expressed to NASA Goddard 7
Space Flight Center (GSFC) Level 1 and Atmosphere Archive and Distribution System 8
(LAADS) (http://ladsweb.nascom.nasa.gov) for making available the MODIS Terra and Aqua 9
Collection 051 level-2 aerosol data and the principal investigators and staff maintaining the 10
13 AERONET (http://aeronet.gsfc.nasa.gov) sites used in the present work. LIVAS has been 11
financed under the ESA-ESTEC project LIVAS (contract no. 4000104106/11/NL/FF/fk). We 12
thank the ICARE Data and Services Center (www.icare.univ-lille1.fr) for providing access to 13
NASA's CALIPSO data and acknowledge the use of NASA's CALIPSO data. Special thanks 14
are expressed to ECMWF (www.ecmwf.int) for the provision of the ERA-Interim and MACC 15
reanalysis data. NASA's GIOVANNI web database (http://giovanni.gsfc.nasa.gov/giovanni/) 16
is highly acknowledged for the provision of Aerosol Index data from Earth Probe TOMS and 17
OMI, aerosol data from the GOCART chemistry-aerosol-transport model (older version of 18
GIOVANNI), tropospheric NO2 and PBL SO2 columnar data from OMI and precipitation data 19
from 3B43 TRMM and Other Sources Monthly Rainfall Product. A.K.G. acknowledges the 20
fruitful discussions with various colleagues from the Max Planck Institute for Chemistry and 21
the Cyprus Institute (EEWRC) who indirectly contributed to this research. 22
23
References 24
Abdelkader, M., Metzger, S., Mamouri, R. E., Astitha, M., Barrie, L., Levin, Z., and 25
Lelieveld, J.: Dust-air pollution dynamics over the eastern Mediterranean, Atmos. Chem. 26
Phys., 15, 9173-9189, doi:10.5194/acp-15-9173-2015, 2015. 27
Acker, J. G. and Leptoukh, G.: Online analysis enhances use of NASA Earth science data, 28
Eos Trans. AGU, 88(2), 14-17, doi:10.1029/2007EO020003, 2007. 29
Alexandersson, H.: A homogeneity test applied to precipitation data, J. Climatol., 6(6), 661-30
675, doi:10.1002/joc.3370060607, 1986. 31
33
Alexandri, G., Georgoulias, A. K., Zanis, P., Katragkou, E., Tsikerdekis, A., Kourtidis, K., 1
and Meleti, C.: On the ability of RegCM4 regional climate model to simulate surface solar 2
radiation patterns over Europe: an assessment using satellite-based observations, Atmos. 3
Chem. Phys., 15, 13195-13216, doi:10.5194/acp-15-13195-2015, 2015. 4
Alpert, P. and Ganor, E.: Sahara mineral dust measurements from TOMS: Comparison to 5
surface observations over the Middle East for the extreme dust storm, 14-17 March 1998, J. 6
Geophys. Res., 106, D16, doi:10.1029/2000JD900366, 2001. 7
Antoine, D. and Nobileau, D.: Recent increase of Saharan dust transport over the 8
Mediterranean Sea, as revealed from ocean color satellite (SeaWiFS) observations, J. 9
Geophys. Res., 111, D12214, doi:10.1029/2005JD006795, 2006. 10
Amiridis V., Balis, D., Kazadzis, S., Giannakaki, E., Papayannis, A., and Zerefos, C.: Four 11
years aerosol observations with a Raman lidar at Thessaloniki, Greece, in the framework of 12
European Aerosol Research Lidar Network (EARLINET), J. Geophys. Res., 110, D21203, 13
doi:10.1029/2005JD006190, 2005. 14
Amiridis, V., Balis, D. S., Giannakaki, E., Stohl, A., Kazadzis, S., Koukouli, M. E., and 15
Zanis, P.: Optical characteristics of biomass burning aerosols over Southeastern Europe 16
determined from UVRaman lidar measurements, Atmos. Chem. Phys., 9, 2431-2440, 17
doi:10.5194/acp-9-2431-2009, 2009. 18
Amiridis, V., Giannakaki, E., Balis, D. S., Gerasopoulos, E., Pytharoulis, I., Zanis, P., 19
Kazadzis, S., Melas, D., and Zerefos, C.: Smoke injection heights from agricultural burning in 20
Eastern Europe as seen by CALIPSO, Atmos. Chem. Phys., 10, 11567-11576, 21
doi:10.5194/acp-10-11567-2010, 2010. 22
Amiridis, V., Wandinger, U., Marinou, E., Giannakaki, E., Tsekeri, A., Basart, S., Kazadzis, 23
S., Gkikas, A., Taylor, M., Baldasano, J., and Ansmann, A.: Optimizing CALIPSO Saharan 24
dust retrievals, Atmos. Chem. Phys., 13, 12089-12106, doi:10.5194/acp-13-12089-2013, 25
2013. 26
Amiridis, V., Marinou, E., Tsekeri, A., Wandinger, U., Schwarz, A., Giannakaki, E., 27
Mamouri, R., Kokkalis, P., Binietoglou, I., Solomos, S., Herekakis, T., Kazadzis, S., 28
Gerasopoulos, E., Proestakis, E., Kottas, M., Balis, D., Papayannis, A., Kontoes, C., 29
Kourtidis, K., Papagiannopoulos, N., Mona, L., Pappalardo, G., Le Rille, O., and Ansmann, 30
34
A.: LIVAS: a 3-D multi-wavelength aerosol/cloud database based on CALIPSO and 1
EARLINET, Atmos. Chem. Phys., 15, 7127-7153, doi:10.5194/acp-15-7127-2015, 2015. 2
Athanassiou, G., Hatzianastassiou, N., Gkikas, A., Papadimas, C.D.: Estimating aerosol 3
optical depth over the broader greek area from MODIS satellite, Water Air Soil. Pollut., 224 4
(7) doi:10.1007/S12270-013-1605-2, 2013 5
Balis, D., Amiridis, V., Nickovic, S., Papayannis, A., and Zerefos, C.: Optical properties of 6
Saharan dust layers as detected by a Raman lidar at Thessaloniki, Greece, Geoph. Res. Lett., 7
31, doi:10.1029/2004GL019881, 2004. 8
Barnaba, F. and Gobbi, G. P.: Aerosol seasonal variability over the Mediterranean region and 9
relative impact of maritime, continental and Saharan dust particles over the basin from 10
MODIS data in the year 2001, Atmos. Chem. Phys., 4, 2367-2391, doi:10.5194/acp-4-2367-11
2004, 2004. 12
Basart, S., Pérez, C., Cuevas, E., Baldasano, J. M., and Gobbi, G. P.: Aerosol characterization 13
in Northern Africa, Northeastern Atlantic, Mediterranean Basin and Middle East from direct-14
sun AERONET observations, Atmos. Chem. Phys., 9, 8265-8282, doi:10.5194/acp-9-8265-15
2009, 2009. 16
Bellouin, N., Jones, A., Haywood, J. and Christopher, S. A.: Updated estimate of aerosol 17
direct radiative forcing from satellite observations and comparison against the Hadley Centre 18
climate model, J. Geophys. Res., 113(D10), D10205, doi:10.1029/2007JD009385, 2008. 19
Bellouin, N., Quaas, J., Morcrette, J.-J., and Boucher, O.: Estimates of aerosol radiative 20
forcing from the MACC re-analysis, Atmos. Chem. Phys., 13, 2045-2062, doi:10.5194/acp-21
13-2045-2013, 2013. 22
Benas, N., Hatzianastassiou, N., Matsoukas, C., Fotiadi, A., Mihalopoulos, N., and Vardavas, 23
I.: Aerosol shortwave direct radiative effect and forcing based on MODIS Level 2 data in the 24
Eastern Mediterranean (Crete), Atmos. Chem. Phys., 11, 12647-12662, doi:10.5194/acp-11-25
12647-2011, 2011. 26
Benas, N., Beloconi, A., and Chrysoulakis, N.: Estimation of urban PM10 concentration , 27
based on MODIS and MERIS / AATSR synergistic observations, Atmos. Environ., 79, 448-28
454, doi:10.1016/j.atmosenv.2013.07.012, 2013. 29
35
Benedetti, A., Morcrette, J.-J., Boucher, O., Dethof, A., Engelen, R. J., Fisher, M., Flentjes, 1
H., Huneeus, N., Jones, L., Kaiser, J. W., Kinne, S., Mangold, A., Razinger, M., Simmons, A. 2
J., Suttie, M., and the GEMS-AER team: Aerosol analysis and forecast in the ECMWF 3
Integrated Forecast System. Part II: Data assimilation, J. Geophys. Res., 114, D13205, 4
doi:10.1029/2008JD011115, 2009. 5
Bergamo, A., Tafuro, A. M., Kinne, S., De Tomasi, F., and Perrone, M. R.: Monthly-averaged 6
anthropogenic aerosol direct radiative forcing over the Mediterranean based on AERONET 7
aerosol properties, Atmos. Chem. Phys., 8, 6995-7014, doi:10.5194/acp-8-6995-2008, 2008. 8
Bucsela, E. J., Krotkov, N. A., Celarier, E. A., Lamsal, L. N., Swartz, W. H., Bhartia, P. K., 9
Boersma, K. F., Veefkind, J. P., Gleason, J. F., and Pickering, K. E.: A new stratospheric and 10
tropospheric NO2 retrieval algorithm for nadir-viewing satellite instruments: applications to 11
OMI, Atmos. Meas. Tech., 6, 2607-2626, doi:10.5194/amt-6-2607-2013, 2013. 12
Burton, S. P., Ferrare, R. A., Vaughan, M. A., Omar, A. H., Rogers, R. R., Hostetler, C. A., 13
and Hair, J. W.: Aerosol classification from airborne HSRL and comparisons with the 14
CALIPSO vertical feature mask, Atmos. Meas. Tech., 6, 1397-1412, doi:10.5194/amt-6-15
1397-2013, 2013. 16
Carmona, I. and Alpert, P.: Synoptic classification of Moderate Resolution Imaging 17
Spectroradiometer aerosols over Israel, J. Geophys. Res., 114(D7), D07208, 18
doi:10.1029/2008JD010160, 2009. 19
Cesnulyte, V., Lindfors, A. V., Pitkänen, M. R. A., Lehtinen, K. E. J., Morcrette, J.-J., and 20
Arola, A.: Comparing ECMWF AOD with AERONET observations at visible and UV 21
wavelengths, Atmos. Chem. Phys., 14, 593-608, doi:10.5194/acp-14-593-2014, 2014. 22
Chin, M., Rood, R. B., Lin, S.-J., Müller, J.-F. and Thompson, A. M.: Atmospheric sulfur 23
cycle simulated in the global model GOCART: Model description and global properties, J. 24
Geophys. Res., 105(D20), 24671, doi:10.1029/2000JD900384, 2000. 25
Chin, M., Ginoux, P., Kinne, S., Torres, O., Holben, B. N., Duncan, B. N., Martin, R. V., 26
Logan, J. A., Higurashi, A. and Nakajima, T.: Tropospheric Aerosol Optical Thickness from 27
the GOCART Model and Comparisons with Satellite and Sun Photometer Measurements, J. 28
Atmos. Sci., 59(3), 461-483, doi:10.1175/1520-0469(2002)059<0461:TAOTFT>2.0.CO;2, 29
2002. 30
36
Chin, M., Chu, A., Levy, R., Remer, L., Kaufman, Y., Holben, B., Eck, T., Ginoux, P. and 1
Gao, Q.: Aerosol distribution in the Northern Hemisphere during ACE-Asia: Results from 2
global model, satellite observations, and Sun photometer measurements, J. Geophys. Res. 3
Atmos., 109(D23), n/a-n/a, doi:10.1029/2004JD004829, 2004. 4
Chin, Mian, Diehl, T., Ginoux, P., and Malm, W.: Intercontinental transport of pollution and 5
dust aerosols: implications for regional air quality, Atmos. Chem. Phys., 7, 5501-5517, 6
doi:10.5194/acp-7-5501-2007, 2007. 7
Chin, M., Diehl, T., Dubovik, O., Eck, T. F., Holben, B. N., Sinyuk, A., and Streets, D. G.: 8
Light absorption by pollution, dust, and biomass burning aerosols: a global model study and 9
evaluation with AERONET measurements, Ann. Geophys., 27, 3439-3464, 10
doi:10.5194/angeo-27-3439-2009, 2009. 11
Chu, D. A., Kaufman, Y. J., Ichoku, C., Remer, L. A., Tanre, D., and Holben, B. N.: 12
Validation of MODIS aerosol optical depth retrieval over land. Geophys. Res. Lett., 29, 8007, 13
doi:10.1029/2001GL013205, 2002. 14
Cuevas, E., Camino, C., Benedetti, A., Basart, S., Terradellas, E., Baldasano, J. M., 15
Morcrette, J. J., Marticorena, B., Goloub, P., Mortier, A., Berjón, A., Hernández, Y., Gil-16
Ojeda, M., and Schulz, M.: The MACC-II 2007-2008 reanalysis: atmospheric dust evaluation 17
and characterization over northern Africa and the Middle East, Atmos. Chem. Phys., 15, 18
3991-4024, doi:10.5194/acp-15-3991-2015, 2015. 19
De Meij, A. and Lelieveld, J.: Evaluating aerosol optical properties observed by ground-based 20
and satellite remote sensing over the Mediterranean and the Middle East in 2006, Atmos. 21
Res., 99(3-4), 415-433, doi:10.1016/j.atmosres.2010.11.005, 2011. 22
De Meij, A., Pozzer, A., Pringle, K. J., Tost, H., Lelieveld, J.: EMAC model evaluation and 23
analysis of atmospheric aerosol properties and distribution, Atmos. Res, 114-115, 38-69, 24
2012. 25
Dee, D. P., Uppala, S. M., Simmons, a. J., Berrisford, P., Poli, P., Kobayashi, S., Andrae, U., 26
Balmaseda, M. a., Balsamo, G., Bauer, P., Bechtold, P., Beljaars, a. C. M., van de Berg, L., 27
Bidlot, J., Bormann, N., Delsol, C., Dragani, R., Fuentes, M., Geer, a. J., Haimberger, L., 28
Healy, S. B., Hersbach, H., Hólm, E. V., Isaksen, L., Kållberg, P., Köhler, M., Matricardi, M., 29
Mcnally, a. P., Monge-Sanz, B. M., Morcrette, J. J., Park, B. K., Peubey, C., de Rosnay, P., 30
Tavolato, C., Thépaut, J. N. and Vitart, F.: The ERA-Interim reanalysis: Configuration and 31
37
performance of the data assimilation system, Q. J. R. Meteorol. Soc., 137(656), 553-597, 1
doi:10.1002/qj.828, 2011. 2
Derimian, Y., Karnieli, A., Kaufman, Y. J., Andreae, M. O., Andreae, T. W., Dubovik, O., 3
Maenhaut, W., Koren, I. and Holben, B. N.: Dust and pollution aerosols over the Negev 4
desert, Israel: Properties, transport, and radiative effect, J. Geophys. Res., 111(D5), D05205, 5
doi:10.1029/2005JD006549, 2006. 6
Dubovik, O., Smirnov, a., Holben, B. N., King, M. D., Kaufman, Y. J., Eck, T. F. and 7
Slutsker, I.: Accuracy assessments of aerosol optical properties retrieved from Aerosol 8
Robotic Network (AERONET) Sun and sky radiance measurements, J. Geophys. Res., 9
105(D8), 9791, doi:10.1029/2000JD900040, 2000. 10
Dubovik, O. and King, M. D.: A flexible inversion algorithm for retrieval of aerosol optical 11
properties from Sun and sky radiance measurements, J. Geophys. Res., 105(D16), 20673, 12
doi:10.1029/2000JD900282, 2000. 13
Dubovik, O., Holben, B., Eck, T. F., Smirnov, A., Kaufman, Y. J., King, M. D., Tanré, D. and 14
Slutsker, I.: Variability of Absorption and Optical Properties of Key Aerosol Types Observed 15
in Worldwide Locations, J. Atmos. Sci., 59(3), 590-608, doi:10.1175/1520-16
0469(2002)059<0590:VOAAOP>2.0.CO;2, 2002. 17
Eck, T. F., Holben, B. N., Reid, J. S., Dubovik, O., Smirnov, A., O’Neill, N. T., Slutsker, I. 18
and Kinne, S.: Wavelength dependence of the optical depth of biomass burning, urban, and 19
desert dust aerosols, J. Geophys. Res., 104, 31333-31349, doi:10.1029/1999jd900923, 1999. 20
Elguindi, N., Clark, H., Ordóñez, C., Thouret, V., Flemming, J., Stein, O., Huijnen, V., 21
Moinat, P., Inness, A., Peuch, V.-H., Stohl, A., Turquety, S., Athier, G., Cammas, J.-P., and 22
Schultz, M.: Current status of the ability of the GEMS/MACC models to reproduce the 23
tropospheric CO vertical distribution as measured by MOZAIC, Geosci. Model Dev., 3, 501-24
518, doi:10.5194/gmd-3-501-2010, 2010 25
El-Metwally, M., Alfaro, S. C., Abdel Wahab, M. M., Zakey, A. S., and Chatenet, B.: 26
Seasonal and inter-annual variability of the aerosol content in Cairo (Egypt) as deduced from 27
the comparison of MODIS aerosol retrievals with direct AERONET measurements, Atmos. 28
Res., 97, 14-25, doi:10.1016/j.atmosres.2010.03.003, 2010. 29
38
El-Metwally, M. and Alfaro, S. C.: Correlation between meteorological conditions and 1
aerosol characteristics at an East-Mediterranean coastal site, Atmos. Res., 132-133, 76-90, 2
doi:10.1016/j.atmosres.2013.05.006, 2013. 3
Flaounas, E., Kotroni, V., Lagouvardos, K., Kazadzis, S., Gkikas, A. and Hatzianastassiou, 4
N.: Cyclone contribution to dust transport over the Mediterranean region, Atmos. Sci. Lett., 5
16(4), 473-478, doi:10.1002/asl.584, 2015. 6
Georgoulias, A. K., Balis, D., Koukouli, M. E., Meleti, C., Bais, A. and Zerefos, C.: A study 7
of the total atmospheric sulfur dioxide load using ground-based measurements and the 8
satellite derived Sulfur Dioxide Index, Atmos. Environ., 43(9), 1693-1701, 9
doi:10.1016/j.atmosenv.2008.12.012, 2009. 10
Georgoulias, A. K. and Kourtidis, K. A.: On the aerosol weekly cycle spatiotemporal 11
variability over Europe, Atmos. Chem. Phys., 11, 4611-4632, doi:10.5194/acp-11-4611-2011, 12
2011. 13
Georgoulias, A. K. and Kourtidis, K. A.: A high resolution satellite view of the aerosol 14
weekly cycle variability over Central Europe, Atmos. Res., 107, 145-160, 15
doi:10.1016/j.atmosres.2012.01.003, 2012. 16
Georgoulias, A. K., Kourtidis, K. A., Kosmidis, E., Despotakis, T., and Symeonidis, P.: 17
AMFIC-WSDB: a web data base for hosting and easy retrieval of atmospheric data from 18
satellites, Comput. Geosci., 48, 57-66, doi:10.1016/j.cageo.2012.05.001, 2012. 19
Georgoulias, A. K., Kourtidis, K. A., Alexandri, G., Rapsomanikis, S., and Sanchez-Lorenzo, 20
A.: Common summertime total cloud cover and aerosol optical depth weekly variabilities 21
over Europe: sign of the aerosol indirect effects?, Atmos. Res., 153, 59-73, 22
doi:10.1016/j.atmosres.2014.07.031, 2015. 23
Georgoulias, A. K., Alexandri, G., Kourtidis, K. A., Lelieveld, J., Zanis, P., and Amiridis, V.: 24
Differences between the MODIS Collection 6 and 5.1 aerosol datasets over the greater 25
Mediterranean region, Atmos. Environ., 147, 310-319, doi:10.1016/j.atmosenv.2016.10.014, 26
2016. 27
Gerasopoulos, E., Kokkalis, P., Amiridis, V., Liakakou, E., Perez, C., Haustein, K., 28
Eleftheratos, K., Andreae, M. O., Andreae, T. W., and Zerefos, C. S.: Dust specific extinction 29
cross-sections over the Eastern Mediterranean using the BSC-DREAM model and sun 30
39
photometer data: the case of urban environments, Ann. Geophys., 27, 2903-2912, 1
doi:10.5194/angeo-27-2903-2009, 2009. 2
Gerasopoulos, E., Amiridis, V., Kazadzis, S., Kokkalis, P., Eleftheratos, K., Andreae, M. O., 3
Andreae, T. W., El-Askary, H., and Zerefos, C. S.: Three-year ground based measurements of 4
aerosol optical depth over the Eastern Mediterranean: the urban environment of Athens, 5
Atmos. Chem. Phys., 11, 2145-2159, doi:10.5194/acp-11-2145-2011, 2011. 6
Ginoux, P., Chin, M., Tegen, I., Prospero, J. M., Holben, B., Dubovik, O. and Lin, S.-J.: 7
Sources and distributions of dust aerosols simulated with the GOCART model, J. Geophys. 8
Res., 106(D17), 20255, doi:10.1029/2000JD000053, 2001. 9
Ginoux, P., Prospero, J., Torres, O. and Chin, M.: Long-term simulation of global dust 10
distribution with the GOCART model: correlation with North Atlantic Oscillation, Environ. 11
Model. Softw., 19(2), 113-128, doi:10.1016/S1464-8152(03)00114-2, 2004. 12
Ginoux, P., Clarisse, L., Clerbaux, C., Coheur, P.-F., Dubovik, O., Hsu, N. C., and Van 13
Damme, M.: Mixing of dust and NH3 observed globally over anthropogenic dust sources, 14
Atmos. Chem. Phys., 12, 7351-7363, doi:10.5194/acp-12-7351-2012, 2012. 15
Giorgi, F.: Climate change hot-spots, Geophys. Res. Lett., 33(8), 1-4, 16
doi:10.1029/2006GL025734, 2006. 17
Gkikas, A., Hatzianastassiou, N., and Mihalopoulos, N.: Aerosol events in the broader 18
Mediterranean basin based on 7-year (2000-2007) MODIS C005 data, Ann. Geophys., 27, 19
3509-3522, doi:10.5194/angeo-27-3509-2009, 2009 20
Gkikas, A., Hatzianastassiou, N., Mihalopoulos, N., Katsoulis, V., Kazadzis, S., Pey, J., 21
Querol, X., and Torres, O.: The regime of intense desert dust episodes in the Mediterranean 22
based on contemporary satellite observations and ground measurements, Atmos. Chem. Phys., 23
13, 12135-12154, doi:10.5194/acp-13-12135-2013, 2013. 24
Gkikas, A., Houssos, E. E., Lolis, C. J., Bartzokas, A., Mihalopoulos, N., and 25
Hatzianastassiou, N.: Atmospheric circulation evolution related to desert-dust episodes over 26
the Mediterranean, Q. J. Roy. Meteorol. Soc., 690, 1634-1645, 2014. 27
Hatzianastassiou, N., Gkikas, A., Mihalopoulos, N., Torres, O. and Katsoulis, B. D.: Natural 28
versus anthropogenic aerosols in the eastern Mediterranean basin derived from multiyear 29
40
TOMS and MODIS satellite data, J. Geophys. Res. Atmos., 114(24), 1
doi:10.1029/2009JD011982, 2009. 2
Herman, J. R., Bhartia, P. K., Torres, O., Hsu, C., Seftor, C. and Celarier, E.: Global 3
distribution of UV-absorbing aerosols from Nimbus 7/TOMS data, J. Geophys. Res. Atmos., 4
102(D14), 16911-16922, doi:10.1029/96JD03680, 1997. 5
Herrmann, M., Somot, S., Calmanti, S., Dubois, C., and Sevault, F.: Representation of spatial 6
and temporal variability of daily wind speed and of intense wind events over the 7
Mediterranean Sea using dynamical downscaling: impact of the regional climate model 8
configuration, Nat. Hazards Earth Syst. Sci., 11, 1983-2001, doi:10.5194/nhess-11-1983-9
2011, 2011. 10
Holben, B. N., Eck, T. F., Slutsker, I., Tanré, D., Buis, J. P., Setzer, A., Vermote, E., Reagan, 11
J. A., Kaufman, Y. J., Nakajima, T., Lavenu, F., Jankowiak, I. and Smirnov, A.: 12
AERONET—A Federated Instrument Network and Data Archive for Aerosol 13
Characterization, Remote Sens. Environ., 66(1), 1-16, doi:10.1016/S0034-4257(98)00031-5, 14
1998. 15
Holben, B. N., Tanré, D., Smirnov, A., Eck, T. F., Slutsker, I., Abuhassan, N., Newcomb, W. 16
W., Schafer, J. S., Chatenet, B., Lavenu, F., Kaufman, Y. J., Castle, J. Vande, Setzer, A., 17
Markham, B., Clark, D., Frouin, R., Halthore, R., Karneli, A., O’Neill, N. T., Pietras, C., 18
Pinker, R. T., Voss, K. and Zibordi, G.: An emerging ground-based aerosol climatology: 19
Aerosol optical depth from AERONET, J. Geophys. Res. Atmos., 106(D11), 12067-12097, 20
doi:10.1029/2001JD900014, 2001. 21
Hsu, N. C., Tsay, S. C., King, M. D. and Herman, J. R.: Aerosol properties over bright-22
reflecting source regions, IEEE Trans. Geosci. Remote Sens., 42(3), 557-569, 23
doi:10.1109/TGRS.2004.824067, 2004. 24
Hsu, N. C., Tsay, S. C., King, M. D. and Herman, J. R.: Deep Blue retrievals of Asian aerosol 25
properties during ACE-Asia, IEEE Trans. Geosci. Remote Sens., 44(11), 3180-3195, 26
doi:10.1109/TGRS.2006.879540, 2006. 27
Hsu, N. C., Jeong, M.-J., Bettenhausen, C., Sayer, A. M., Hansell, R., Seftor, C. S., Huang, J. 28
and Tsay, S.-C.: Enhanced Deep Blue aerosol retrieval algorithm: The second generation, J. 29
Geophys. Res. Atmos., 118(16), 9296-9315, doi:10.1002/jgrd.50712, 2013. 30
41
Huffman, G. J., Bolvin, D. T., Nelkin, E. J., Wolff, D. B., Adler, R. F., Gu, G., Hong, Y., 1
Bowman, K. P., and Stocker, E. F.: The TRMM Multisatellite Precipitation Analysis 2
(TMPA): quasiglobal, multiyear, combined-sensor precipitation estimates at fine scales, J. 3
Hydrometeorol., 8, 38-55, doi:10.1175/JHM560.1, 2007. 4
Husar, R. B., Prospero, J. M., and Stowe, L. L.: Characterization of tropospheric aerosols over 5
the oceans with the NOAA advanced very high resolution radiometer optical thickness 6
operational product, J. Geophys. Res., 102, 16889-16909, 1997. 7
Ichoku, C.: A spatio-temporal approach for global validation and analysis of MODIS aerosol 8
products, Geophys. Res. Lett., 29(12), 8006, doi:10.1029/2001GL013206, 2002. 9
Ichoku, C., Remer, L. A., and Eck, T. F.: Quantitative evaluation and intercomparison of 10
morning and afternoon Moderate Resolution Imaging Spectroradiometer (MODIS) aerosol 11
measurements from Terra and Aqua, J. Geophys. Res.-Atmos., 110, D10S03, 12
doi:10.1029/2004JD004987, 2005. 13
Im, U., Markakis, K., Koçak, M., Gerasopoulos, E., Daskalakis, N., Mihalopoulos, N., 14
Poupkou, A., Kındap, T., Unal, A. and Kanakidou, M.: Summertime aerosol chemical 15
composition in the Eastern Mediterranean and its sensitivity to temperature, Atmos. Environ., 16
50, 164-173, doi:10.1016/j.atmosenv.2011.12.044, 2012. 17
Inness, A., Baier, F., Benedetti, A., Bouarar, I., Chabrillat, S., Clark, H., Clerbaux, C., 18
Coheur, P., Engelen, R. J., Errera, Q., Flemming, J., George, M., Granier, C., Hadji-Lazaro, 19
J., Huijnen, V., Hurtmans, D., Jones, L., Kaiser, J. W., Kapsomenakis, J., Lefever, K., Leitão, 20
J., Razinger, M., Richter, A., Schultz, M. G., Simmons, A. J., Suttie, M., Stein, O., Thépaut, 21
J.-N., Thouret, V., Vrekoussis, M., Zerefos, C., and the MACC team: The MACC reanalysis: 22
an 8 yr data set of atmospheric composition, Atmos. Chem. Phys., 13, 4073-4109, 23
doi:10.5194/acp-13-4073-2013, 2013. 24
Israelevich, P. L., Levin, Z., Joseph, J. H., and Ganor, E.: Desert aerosol transport in the 25
Mediterranean region as inferred from the TOMS aerosol index, J. Geophys. Res., 107(D21), 26
4572, doi:10.1029/2001JD002011, 2002. 27
Israelevich, P. L., Ganor, E., Levin, Z., and Joseph, J. H.: Annual variations of physical 28
properties of desert dust over Israel, J. Geophys. Res., 108(D13), 4381, 29
doi:10.1029/2002JD003163, 2003. 30
42
Israelevich, P., Ganor, E., Alpert, P., Kishcha, P. and Stupp, A.: Predominant transport paths 1
of Saharan dust over the Mediterranean Sea to Europe, J. Geophys. Res., 117(D2), D02205, 2
doi:10.1029/2011JD016482, 2012. 3
Jones, T. A. and Christopher, S. A.: A reanalysis of MODIS fine mode fraction over ocean 4
using OMI and daily GOCART simulations, Atmos. Chem. Phys., 11, 5805-5817, 5
doi:10.5194/acp-11-5805-2011, 2011. 6
Kabatas, B., Unal, A., Pierce, R. B., Kindap, T. and Pozzoli, L.: The contribution of Saharan 7
dust in PM10 concentration levels in Anatolian Peninsula of Turkey, Sci. Total Environ., 488-8
489(1), 413-421, doi:10.1016/j.scitotenv.2013.12.045, 2014. 9
Kalivitis, N., Gerasopoulos, E., Vrekoussis, M., Kouvarakis, G., Kubilay, N., 10
Hatzianastassiou, N., Vardavas, I. and Mihalopoulos, N.: Dust transport over the eastern 11
Mediterranean derived from Total Ozone Mapping Spectrometer, Aerosol Robotic Network, 12
and surface measurements, J. Geophys. Res., 112(D3), D03202, doi:10.1029/2006JD007510, 13
2007. 14
Kanakidou, M., Mihalopoulos, N., Kindap, T., Im, U., Vrekoussis, M., Gerasopoulos, E., 15
Dermitzaki, E., Unal, A., Koçak, M., Markakis, K., Melas, D., Kouvarakis, G., Youssef, A. 16
F., Richter, A., Hatzianastassiou, N., Hilboll, A., Ebojie, F., Wittrock, F., von Savigny, C., 17
Burrows, J. P., Ladstaetter-Weissenmayer, A. and Moubasher, H.: Megacities as hot spots of 18
air pollution in the East Mediterranean, Atmos. Environ., 45(6), 1223-1235, 19
doi:10.1016/j.atmosenv.2010.11.048, 2011. 20
Karnieli, A., Derimian, Y., Indoitu, R., Panov, N., Levy, R. C., Remer, L. A., Maenhaut, W., 21
and Holben, B. N.: Temporal trend in anthropogenic sulfur aerosol transport from central and 22
eastern Europe to Israel, J. Geophys. Res., 114, D00D19, doi:10.1029/2009JD011870, 2009. 23
Kaskaoutis, D. G., Kosmopoulos, P., Kambezidis, H. D. and Nastos, P. T.: Aerosol 24
climatology and discrimination of different types over Athens, Greece, based on MODIS data, 25
Atmos. Environ., 41(34), 7315-7329, doi:10.1016/j.atmosenv.2007.05.017, 2007. 26
Kaskaoutis, D. G., Kambezidis, H. D., Nastos, P. T. and Kosmopoulos, P. G.: Study on an 27
intense dust storm over Greece, Atmos. Environ., 42(29), 6884-6896, 28
doi:10.1016/j.atmosenv.2008.05.017, 2008. 29
Kaskaoutis, D. G., Nastos, P. T., Kosmopoulos, P. G. and Kambezidis, H. D.: The combined 30
use of satellite data, air-mass trajectories and model applications for monitoring dust transport 31
43
over Athens, Greece, Int. J. Remote Sens., 31(19), 5089-5109, 1
doi:10.1080/01431160903283868, 2010. 2
Kaskaoutis, D. G., Kharol, S. K., Sifakis, N., Nastos, P. T., Sharma, A. R., Badarinath, K. V. 3
S. and Kambezidis, H. D.: Satellite monitoring of the biomass-burning aerosols during the 4
wildfires of August 2007 in Greece: Climate implications, Atmos. Environ., 45(3), 716-726, 5
doi:10.1016/j.atmosenv.2010.09.043, 2011. 6
Kaskaoutis, D. G., Kosmopoulos, P. G., Nastos, P. T., Kambezidis, H. D., Sharma, M. and 7
Mehdi, W.: Transport pathways of Sahara dust over Athens, Greece as detected by MODIS 8
and TOMS, Geomatics, Nat. Hazards Risk, 3(1), 35-54, doi:10.1080/19475705.2011.574296, 9
2012a. 10
Kaskaoutis, D. G., Prasad, A. K., Kosmopoulos, P. G., Sinha, P. R., Kharol, S. K., Gupta, P., 11
El-Askary, H. M. and Kafatos, M.: Synergistic use of remote sensing and modeling for 12
tracing dust storms in the mediterranean, Adv. Meteorol., 2012, doi:10.1155/2012/861026, 13
2012b. 14
Kaskaoutis, D. G., Nastos, P. T., Kosmopoulos, P. G. and Kambezidis, H. D.: Characterising 15
the long-range transport mechanisms of different aerosol types over Athens, Greece during 16
2000-2005, Int. J. Climatol., 32(8), 1249-1270, doi:10.1002/joc.2357, 2012c. 17
Kaskaoutis, D. G., Kahn, R. A., Pawan Gupta, P., Jayaraman, A., and Bartzokas, A.: Desert 18
Dust Properties, Modelling, and Monitoring, Advances in Meteorology, vol. 2012, ID 19
483632, 2 pp, 2012. doi:10.1155/2012/483632, 2012d. 20
Kaufman, Y. J., Tanré, D., Remer, L. a., Vermote, E. F., Chu, a. and Holben, B. N.: 21
Operational remote sensing of tropospheric aerosol over land from EOS moderate resolution 22
imaging spectroradiometer, J. Geophys. Res., 102(D14), 17051, doi:10.1029/96JD03988, 23
1997. 24
Kaufman, Y. J., Koren, I., Remer, L. A., Tanré, D., Ginoux, P. and Fan, S.: Dust transport and 25
deposition observed from the Terra-Moderate Resolution Imaging Spectroradiometer 26
(MODIS) spacecraft over the Atlantic Ocean, J. Geophys. Res. D Atmos., 110(10), 1-16, 27
doi:10.1029/2003JD004436, 2005. 28
Kazadzis, S., Bais, A., Amiridis, V., Balis, D., Meleti, C., Kouremeti, N., Zerefos, C. S., 29
Rapsomanikis, S., Petrakakis, M., Kelesis, A., Tzoumaka, P., and Kelektsoglou, K.: Nine 30
44
years of UV aerosol optical depth measurements at Thessaloniki, Greece, Atmos. Chem. 1
Phys., 7, 2091-2101, doi:10.5194/acp-7-2091-2007, 2007. 2
Kazadzis, S., Veselovskii, I., Amiridis, V., Gröbner, J., Suvorina, A., Nyeki, S., 3
Gerasopoulos, E., Kouremeti, N., Taylor, M., Tsekeri, A., and Wehrli, C.: Aerosol 4
microphysical retrievals from precision filter radiometer direct solar radiation measurements 5
and comparison with AERONET, Atmos. Meas. Tech., 7, 2013-2025, doi:10.5194/amt-7-6
2013-2014, 2014. 7
Kelektsoglou, K. and Rapsomanikis, S.: AERONET observations of direct and indirect 8
aerosol effects over a South European conurbation, Int. J. Remote Sens., 32, 2779-2798, 9
2011. 10
Khaliq, M. N. and Ouarda, T. B. M. J.: On the critical values of the standard normal 11
homogeneity test (SNHT), Int. J. Climatol., 27(5), 681-687, doi:10.1002/joc.1438, 2007. 12
Kloog, I., Sorek-Hamer, M., Lyapustin, A., Coull, B., Wang, Y., Just, A. C., Schwartz, J., and 13
Broday, D. M.: Estimating daily PM2.5 and PM10 across the complex geo-climate region of 14
Israel using MAIAC satellite-based AOD data, Atmos. Environ., 122, 409-416, 15
doi:10.1016/j.atmosenv.2015.10.004, 2015. 16
Kokkalis, P., Papayannis, A., Amiridis, V., Mamouri, R. E., Veselovskii, I., Kolgotin, A., 17
Tsaknakis, G., Kristiansen, N. I., Stohl, A., and Mona, L.: Optical, microphysical, mass and 18
geometrical properties of aged volcanic particles observed over Athens, Greece, during the 19
Eyjafjallajökull eruption in April 2010 through synergy of Raman lidar and sunphotometer 20
measurements, Atmos. Chem. Phys., 13, 9303-9320, doi:10.5194/acp-13-9303-2013, 2013. 21
Koren, I., Joseph, J.H., Israelevich P.: Detection of dust plumes and their sources in 22
northeastern Libya, Can J Remote Sens, 29 (2003), pp. 792-796, 2003. 23
Kosmopoulos, P. G., Kaskaoutis, D. G., Nastos, P. T., and Kambezidis, H. D.: Seasonal 24
variation of columnar aerosol optical properties over Athens, Greece, based on MODIS data, 25
Remote Sens. Environ., 112, 2354-2366, doi:10.1016/j.rse.2007.11.006, 2008. 26
Koukouli, M., Balis, D., Amiridis, V., Kazadzis, S., Bais, A., Nickovic, S. and Torres, O.: 27
Aerosol variability over Thessaloniki using ground based remote sensing observations and the 28
TOMS aerosol index, Atmos. Environ., 40(28), 5367-5378, 29
doi:10.1016/j.atmosenv.2006.04.046, 2006. 30
45
Koukouli, M. E., Kazadzis, S., Amiridis, V., Ichoku, C., and Balis, D. S.: Comparisons of 1
satellite derived aerosol optical depth over a variety of sites in the southern Balkan region as 2
an indicator of local air quality, Remote sensing of clouds and the atmosphere XII, edited by: 3
Comerón, A., Picard, R. H., Schäfer, K., Slusser, J. R., and Amodeo, A., Proceedings of SPIE, 4
Vol. 67451V, doi:10.1117/12.737681, 2007. 5
Koukouli, M. E., Kazadzis, S., Amiridis, V., Ichoku, C., Balis, D. S. and Bais, A. F.: Signs of 6
a negative trend in the MODIS aerosol optical depth over the Southern Balkans, Atmos. 7
Environ., 44(9), 1219-1228, doi:10.1016/j.atmosenv.2009.11.024, 2010. 8
Kourtidis, K., Rapsomanikis, S., Zerefos, C., Georgoulias, A. K., Pavlidou E.: Severe 9
particulate pollution from the deposition practices of the primary materials of a cement plant, 10
Environ. Sci. Pollut. Res., 21, 9796-9808. doi:10.1007/S12356-014-2969-6, 2014. 11
Kourtidis, K., Stathopoulos, S., Georgoulias, A. K., Alexandri, G., and Rapsomanikis, S.: A 12
study of the impact of synoptic weather conditions and water vapor on aerosol-cloud 13
relationships over major urban clusters of China, Atmos. Chem. Phys., 15, 10955-10964, 14
doi:10.5194/acp-15-10955-2015, 2015. 15
Kubilay, N.: Optical properties of mineral dust outbreaks over the northeastern 16
Mediterranean, J. Geophys. Res., 108(D21), 4666, doi:10.1029/2003JD003798, 2003. 17
Lehahn, Y., Koren, I., Boss, E., Ben-Ami, Y., and Altaratz, O.: Estimating the maritime 18
component of aerosol optical depth and its dependency on surface wind speed using satellite 19
data, Atmos. Chem. Phys., 10, 6711-6720, doi:10.5194/acp-10-6711-2010, 2010. 20
Lelieveld, J., Berresheim, H., Borrmann, S., Crutzen, P. J., Dentener, F. J., Fischer, H., 21
Feichter, J., Flatau, P. J., Heland, J., Holzinger, R., Korrmann, R., Lawrence, M. G., Levin, 22
Z., Markowicz, K. M., Mihalopoulos, N., Minikin, A., Ramanathan, V., De Reus, M., 23
Roelofs, G. J., Scheeren, H. A., Sciare, J., Schlager, H., Schultz, M., Siegmund, P., Steil, B., 24
Stephanou, E. G., Stier, P., Traub, M., Warneke, C., Williams, J., and Ziereis, H.: Global air 25
pollution crossroads over the Mediterranean., Science, 298(5594), 794-799, 26
doi:10.1126/science.1075457, 2002. 27
Levelt, P. F., Van den Oord, G. H. J., Dobber, M. R., Malkki, A., Visser, H., de Vries, J., 28
Stammes, P., Lundell, J. O. V and Saari, H.: The Ozone Monitoring Instrument, Ieee Trans. 29
Geosci. Remote Sens., 44(5), 1093-1101, doi:Urn:nbn:nl:ui:25-648485, 2006. 30
46
Levy, R. C.: Evaluation of the Moderate-Resolution Imaging Spectroradiometer (MODIS) 1
retrievals of dust aerosol over the ocean during PRIDE, J. Geophys. Res., 108(D19), 8594, 2
doi:10.1029/2002JD002460, 2003. 3
Levy, R. C., Remer, L. A. and Dubovik, O.: Global aerosol optical properties and application 4
to Moderate Resolution Imaging Spectroradiometer aerosol retrieval over land, J. Geophys. 5
Res. Atmos., 112(D13), doi:10.1029/2006JD007815, 2007a. 6
Levy, R. C., Remer, L. A., Mattoo, S., Vermote, E. F., and Kaufman, Y. J.: Second-7
generation operational algorithm: Retrieval of aerosol properties over land from inversion of 8
Moderate Resolution Imaging Spectroradiometer spectral reflectance, J. Geophys. Res. 9
Atmos., 112(D13), doi:10.1029/2006JD007811, 2007b. 10
Levy, R., Remer, L., Tanré, D., Mattoo, S., and Kaufman, Y.: Algorithm for remote sensing 11
of tropospheric aerosol over dark targets from MODIS: Collections 005 and 051: Revision 2, 12
February 2009, MODIS Algorithm Theoretical Basis Document, 2009. 13
Levy, R. C., Remer, L. A., Kleidman, R. G., Mattoo, S., Ichoku, C., Kahn, R., and Eck, T. F.: 14
Global evaluation of the Collection 5 MODIS dark-target aerosol products over land, Atmos. 15
Chem. Phys., 10, 10399-10420, doi:10.5194/acp-10-10399-2010, 2010. 16
Levy, R. C., Mattoo, S., Munchak, L. A., Remer, L. A., Sayer, A. M., Patadia, F., and Hsu, N. 17
C.: The Collection 6 MODIS aerosol products over land and ocean, Atmos. Meas. Tech., 6, 18
2989-3034, doi:10.5194/amt-6-2989-2013, 2013. 19
Li, J., Carlson, B. E., and Lacis, A. A.: A study on the temporal and spatial variability of 20
absorbing aerosols using Total Ozone Mapping Spectrometer and Ozone Monitoring 21
Instrument Aerosol Index data, J. Geophys. Res., 114(D9), D09213, 22
doi:10.1029/2008JD011278, 2009. 23
Li, C., Joiner, J., Krotkov, N. A., and Bhartia, P. K.: A fast and sensitive new satellite SO2 24
retrieval algorithm based on principal component analysis: Application to the ozone 25
monitoring instrument, Geophys. Res. Lett., 40, 6314-6318, doi:10.1002/2013GL058134, 26
2013. 27
Li, J., Carlson, B. E., Dubovik, O., and Lacis, A. A.: Recent trends in aerosol optical 28
properties derived from AERONET measurements, Atmos. Chem. Phys., 14, 12271-12289, 29
doi:10.5194/acp-14-12271-2014, 2014. 30
47
Liora, N., Markakis, K., Poupkou, A., Giannaros, T. M. and Melas, D.: The natural emissions 1
model (NEMO): Description, application and model evaluation, Atmos. Environ., 122, 493-2
504, doi:10.1016/j.atmosenv.2015.10.014, 2015. 3
Lyapustin, A., Wang, Y., Xiong, X., Meister, G., Platnick, S., Levy, R., Franz, B., Korkin, S., 4
Hilker, T., Tucker, J., Hall, F., Sellers, P., Wu, A., and Angal, A.: Scientific impact of 5
MODIS C5 calibration degradation and C6+ improvements, Atmos. Meas. Tech., 7, 4353-6
4365, doi:10.5194/amt-7-4353-2014, 2014. 7
Mamouri, R. E., Amiridis, V., Papayannis, A., Giannakaki, E., Tsaknakis, G., and Balis, D. 8
S.: Validation of CALIPSO space-borne-derived attenuated backscatter coefficient profiles 9
using a ground-based lidar in Athens, Greece, Atmos. Meas. Tech., 2, 513-522, 10
doi:10.5194/amt-2-513-2009, 2009. 11
Mamouri, R. E., Ansmann, A., Nisantzi, A., Kokkalis, P., Schwarz, A., and Hadjimitsis, D.: 12
Low Arabian extinctionto-backscatter ratio, Geophys. Res. Lett., 40, 4762-4766, 13
doi:10.1002/grl.50898, 2013. 14
Mamouri, R. E. and Ansmann, A.: Estimated desert-dust ice nuclei profiles from polarization 15
lidar: methodology and case studies, Atmos. Chem. Phys., 15, 3463-3477, doi:10.5194/acp-16
15-3463-2015, 2015. 17
Mangold, A., De Backer, H., De Paepe, B., Dewitte, S., Chiapello, I., Derimian, Y., 18
Kacenelenbogen, M., Léon, J.-F., Huneeus, N., Schulz, M., Ceburnis, D., O’Dowd, C., 19
Flentje, H., Kinne, S., Benedetti, A., Morcrette, J.-J. and Boucher, O.: Aerosol analysis and 20
forecast in the European Centre for Medium-Range Weather Forecasts Integrated Forecast 21
System: 3. Evaluation by means of case studies, J. Geophys. Res., 116(D3), D03302, 22
doi:10.1029/2010JD014864, 2011. 23
Marey, H. S., Gille, J. C., El-Askary, H. M., Shalaby, E. A., and El-Raey, M. E.: Aerosol 24
climatology over Nile Delta based on MODIS, MISR and OMI satellite data, Atmos. Chem. 25
Phys., 11, 10637-10648, doi:10.5194/acp-11-10637-2011, 2011. 26
Mateos, D., Antón, M., Toledano, C., Cachorro, V. E., Alados-Arboledas, L., Sorribas, M., 27
Costa, M. J., and Baldasano, J. M.: Aerosol radiative effects in the ultraviolet, visible, and 28
near-infrared spectral ranges using long-term aerosol data series over the Iberian Peninsula, 29
Atmos. Chem. Phys., 14, 13497-13514, doi:10.5194/acp-14-13497-2014, 2014. 30
48
Mélin, F., Zibordi, G. and Djavidnia, S.: Development and validation of a technique for 1
merging satellite derived aerosol optical depth from SeaWiFS and MODIS, Remote Sens. 2
Environ., 108(4), 436-450, doi:10.1016/j.rse.2006.11.026, 2007. 3
Mishra, A. K., Klingmueller, K., Fredj, E., Lelieveld, J., Rudich, Y., and Koren, I.: Radiative 4
signature of absorbing aerosol over the eastern Mediterranean basin, Atmos. Chem. Phys., 14, 5
7213-7231, doi:10.5194/acp-14-7213-2014, 2014. 6
Morcrette, J.-J., Boucher, O., Jones, L., Salmond, D., Bechtold, P., Beljaars, A., Benedetti, A., 7
Bonet, A., Kaiser, J. W., Razinger, M., Schulz, M., Serrar, S., Simmons, A. J., Sofiev, M., 8
Suttie, M., Tompkins, A. M. and Untch, A.: Aerosol analysis and forecast in the European 9
Centre for Medium-Range Weather Forecasts Integrated Forecast System: Forward modeling, 10
J. Geophys. Res., 114(D6), D06206, doi:10.1029/2008JD011235, 2009. 11
Moulin, C., Lambert, C. E., Dayan, U., Masson, V., Ramonet, M., Bousquet, P., Legrand, M., 12
Balkanski, Y. J., Guelle, W., Marticorena, B., Bergametti, G. and Dulac, F.: Satellite 13
climatology of African dust transport in the Mediterranean atmosphere, J. Geophys. Res. 14
Atmos., 103(D11), 13137-13144, doi:10.1029/98JD00171, 1998. 15
Nabat, P., Solmon, F., Mallet, M., Kok, J. F., and Somot, S.: Dust emission size distribution 16
impact on aerosol budget and radiative forcing over the Mediterranean region: a regional 17
climate model approach, Atmos. Chem. Phys., 12, 10545-10567, doi:10.5194/acp-12-10545-18
2012, 2012. 19
Nabat, P., Somot, S., Mallet, M., Chiapello, I., Morcrette, J. J., Solmon, F., Szopa, S., Dulac, 20
F., Collins, W., Ghan, S., Horowitz, L. W., Lamarque, J. F., Lee, Y. H., Naik, V., Nagashima, 21
T., Shindell, D., and Skeie, R.: A 4-D climatology (1979-2009) of the monthly tropospheric 22
aerosol optical depth distribution over the Mediterranean region from a comparative 23
evaluation and blending of remote sensing and model products, Atmos. Meas. Tech., 6, 1287-24
1314, doi:10.5194/amt-6-1287-2013, 2013. 25
Nikitidou, E. and Kazantzidis, A.: On the differences of ultraviolet and visible irradiance 26
calculations in the Mediterranean basin due to model- and satellite-derived climatologies of 27
aerosol optical properties, Int. J. Climatol., 33(13), 2877-2888, doi:10.1002/joc.3638, 2013. 28
Nisantzi, A., Mamouri, R. E., Ansmann, A., Schuster, G. L., and Hadjimitsis, D. G.: Middle 29
East versus Saharan dust extinction-to-backscatter ratios, Atmos. Chem. Phys., 15, 7071-30
7084, doi:10.5194/acp-15-7071-2015, 2015. 31
49
Papadimas, C. D., Hatzianastassiou, N., Mihalopoulos, N., Querol, X., and Vardavas, I.: 1
Spatial and temporal variability in aerosol properties over the Mediterranean basin based on 2
6-year (2000-2006) MODIS data, J. Geophys. Res., 113(D11), D11205, 3
doi:10.1029/2007JD009189, 2008. 4
Papadimas, C. D., Hatzianastassiou, N., Mihalopoulos, N., Kanakidou, M., Katsoulis, B. D., 5
and Vardavas, I.: Assessment of the MODIS Collections C005 and C004 aerosol optical depth 6
products over the Mediterranean basin, Atmos. Chem. Phys., 9, 2987-2999, doi:10.5194/acp-7
9-2987-2009, 2009. 8
Papadimas, C. D., Hatzianastassiou, N., Matsoukas, C., Kanakidou, M., Mihalopoulos, N. and 9
Vardavas, I.: The direct effect of aerosols on solar radiation over the broader Mediterranean 10
basin, Atmos. Chem. Phys., 12(15), 7165-7185, doi:10.5194/acp-12-7165-2012, 2012. 11
Papayannis, A. and Balis, D.: Study of the structure of the lower troposphere over Athens 12
using a backscattering Lidar during the MEDCAPHOT-TRACE experiment: Measurements 13
over a suburban area, Atmos. Envi., 32, 12, 2161-2172, 1998. 14
Papayannis, A., Balis, D., Amiridis, V., Chourdakis, G., Tsaknakis, G., Zerefos, C., Castanho, 15
A. D. A., Nickovic, S., Kazadzis, S., and Grabowski, J.: Measurements of Saharan dust 16
aerosols over the Eastern Mediterranean using elastic backscatter-Raman lidar, 17
spectrophotometric and satellite observations in the frame of the EARLINET project, Atmos. 18
Chem. Phys., 5, 2065-2079, doi:10.5194/acp-5-2065-2005, 2005. 19
Papayannis, A., Mamouri, R. E., Amiridis, V., Kazadzis, S., Pérez, C., Tsaknakis, G., 20
Kokkalis, P., and Baldasano, J. M.: Systematic lidar observations of Saharan dust layers over 21
Athens, Greece in the frame of EARLINET project (2004-2006), Ann. Geophys., 27, 3611-22
3620, doi:10.5194/angeo-27-3611-2009, 2009. 23
Pey, J., Querol, X., Alastuey, A., Forastiere, F., and Stafoggia, M.: African dust outbreaks 24
over the Mediterranean Basin during 2001-2011: PM10 concentrations, phenomenology and 25
trends, and its relation with synoptic and mesoscale meteorology, Atmos. Chem. Phys., 13, 26
1395-1410, doi:10.5194/acp-13-1395-2013, 2013. 27
Pozzer, A., de Meij, A., Yoon, J., Tost, H., Georgoulias, A. K., and Astitha, M.: AOD trends 28
during 2001–2010 from observations and model simulations, Atmos. Chem. Phys., 15, 5521-29
5535, doi:10.5194/acp-15-5521-2015, 2015. 30
50
Rea, G., Turquety, S., Menut, L., Briant, R., Mailler, S., and Siour, G.: Source contributions 1
to 2012 summertime aerosols in the Euro-Mediterranean region, Atmos. Chem. Phys., 15, 2
8013-8036, doi:10.5194/acp-15-8013-2015, 2015. 3
Remer, L. A., Tanre, D., Kaufman, Y. J., Ichoku, C., Mattoo, S., Levy, R., Chu, D. A., 4
Holben, B., Dubovik, O., Smirnov, A., Martins, J. V., Li, R. R., Ahmad, Z.: Validation of 5
MODIS aerosol retrieval over ocean, Geophys. Res. Lett., 29(12), 2-5, 6
doi:10.1029/2001GL013204, 2002. 7
Remer, L. A., Kaufman, Y. J., Tanré, D., Mattoo, S., Chu, D. A., Martins, J. V., Li, R.-R., 8
Ichoku, C., Levy, R. C., Kleidman, R. G., Eck, T. F., Vermote, E. and Holben, B. N.: The 9
MODIS Aerosol Algorithm, Products, and Validation, J. Atmos. Sci., 62(4), 947-973, 10
doi:10.1175/JAS3385.1, 2005. 11
Remer, L., Kaufman, Y., and Kleidman, R.: Comparison of three years of terra and aqua 12
MODIS aerosol optical thickness over the global oceans, IEEE Geosci. Remote S., 3, 537-13
540, doi:10.1109/LGRS.2006.879562, 2006. 14
Remer, L. A., Kleidman, R. G., Levy, R. C., Kaufman, Y. J., Tanré, D., Mattoo, S., Martins, 15
J. V., Ichoku, C., Koren, I., Yu, H. and Holben, B. N.: Global aerosol climatology from the 16
MODIS satellite sensors, J. Geophys. Res., 113(D14), D14S07, doi:10.1029/2007JD009661, 17
2008. 18
Retalis, A. and Sifakis, N.: Urban aerosol mapping over Athens using the differential textural 19
analysis (DTA) algorithm on MERIS-ENVISAT data, ISPRS J. Photogramm. Remote Sens., 20
65(1), 17-25, doi:10.1016/j.isprsjprs.2009.08.001, 2010. 21
Rudich, Y., Kaufman, Y. J., Dayan, U., Yu, H., and Kleidman, R. G.: Estimation of 22
transboundary transport of pollution aerosols by remote sensing in the eastern Mediterranean, 23
J. Geophys. Res., 113, D14S14, doi:10.1029/2007JD009601, 2008. 24
Sayer, A. M., Hsu, N. C., Bettenhausen, C. and Jeong, M. J.: Validation and uncertainty 25
estimates for MODIS Collection 6 “deep Blue” aerosol data, J. Geophys. Res. Atmos., 26
118(14), 7864-7872, doi:10.1002/jgrd.50600, 2013. 27
Sayer, A. M., Munchak, L. A., Hsu, N. C., Levy, R. C., Bettenhausen, C. and Jeong, M.-J.: 28
MODIS Collection 6 aerosol products: Comparison between Aqua’s e-Deep Blue, Dark 29
Target, and “merged” data sets, and usage recommendations, J. Geophys. Res. Atmos., 30
119(24), 13,965-13,989, doi:10.1002/2014JD022453, 2014. 31
51
Sciare, J., Oikonomou, K., Favez, O., Liakakou, E., Markaki, Z., Cachier, H., and 1
Mihalopoulos, N.: Long-term measurements of carbonaceous aerosols in the Eastern 2
Mediterranean: evidence of long-range transport of biomass burning, Atmos. Chem. Phys., 8, 3
5551-5563, doi:10.5194/acp-8-5551-2008, 2008. 4
Shi, Y., Zhang, J., Reid, J. S., Holben, B., Hyer, E. J., and Curtis, C.: An analysis of the 5
collection 5 MODIS over-ocean aerosol optical depth product for its implication in aerosol 6
assimilation, Atmos. Chem. Phys., 11, 557-565, doi:10.5194/acp-11-557-2011, 2011. 7
Shi, Y., Zhang, J., Reid, J. S., Hyer, E. J., and Hsu, N. C.: Critical evaluation of the MODIS 8
Deep Blue aerosol optical depth product for data assimilation over North Africa, Atmos. 9
Meas. Tech., 6, 949-969, doi:10.5194/amt-6-949-2013, 2013. 10
Sifakis, N. I., Iossifidis, C. and Kontoes, C.: CHRISTINE Code for High ResolutIon Satellite 11
mapping of optical ThIckness and ÅNgstrom Exponent. Part II: First application to the urban 12
area of Athens, Greece and comparison to results from previous contrast-reduction codes, 13
Comput. Geosci., 62, 142-149, doi:10.1016/j.cageo.2013.05.011, 2014. 14
Smirnov, A.: Maritime component in aerosol optical models derived from Aerosol Robotic 15
Network data, J. Geophys. Res., 108(D1), 4033, doi:10.1029/2002JD002701, 2003. 16
Sorek-Hamer, M., Cohen, A., Levy, R. C., Ziv, B. and Broday, D. M.: Classification of dust 17
days by satellite remotely sensed aerosol products, Int. J. Remote Sens., 34(8), 2672-2688, 18
doi:10.1080/01431161.2012.748991, 2013. 19
Tanré, D., Kaufman, Y. J., Herman, M. and Mattoo, S.: Remote sensing of aerosol properties 20
over oceans using the MODIS/EOS spectral radiances, J. Geophys. Res. Atmos., 102(D14), 21
16971-16988, doi:10.1029/96JD03437, 1997. 22
Torres, O., Bhartia, P. K., Herman, J. R., Ahmad, Z., and Gleason, J.: Derivation of aerosol 23
properties from a satellite measurements of backscattered ultraviolet radiation: Theoretical 24
basis, J. Geophys. Res., 103, 17099-17110, 1998. 25
Torres, O., Tanskanen, A., Veihelman, B., Ahn, C., Braak, R., Bhartia, P. K., Veefkind, P., 26
and Levelt, P.: Aerosols and Surface UV Products from OMI Observations: An Overview, J. 27
Geophys. Res., 112, D24S47, doi:10.1029/2007JD008809, 2007. 28
52
Tsaknakis, G., Papayannis, A., Kokkalis, P., Amiridis, V., Kambezidis, H. D., Mamouri, R. 1
E., Georgoussis, G., and Avdikos, G.: Inter-comparison of lidar and ceilometer retrievals for 2
aerosol and Planetary Boundary Layer profiling over Athens, Greece, Atmos. Meas. Tech., 4, 3
1261-1273, doi:10.5194/amt-4-1261-2011, 2011. 4
Tyrlis, E. and Lelieveld, J.: Climatology and dynamics of the summer Etesian winds over the 5
Eastern Mediterranean, J. Atmos. Sci., 70, 3374-3396, doi:10.1175/JAS-D-13-035.1, 2013. 6
Varga, G., Ujvari, G., and Kovacs, J.: Spatiotemporal patterns of Saharan dust outbreaks in 7
the Mediterranean Basin, Aeolian Res., 15, 151-160, doi:10.1016/j.aeolia.2014.06.005, 2014. 8
Vrekoussis, M., Liakakou, E., Koçak, M., Kubilay, N., Oikonomou, K., Sciare, J. and 9
Mihalopoulos, N.: Seasonal variability of optical properties of aerosols in the Eastern 10
Mediterranean, Atmos. Environ., 39(37), 7083-7094, doi:10.1016/j.atmosenv.2005.08.011, 11
2005. 12
Zyrichidou, I., Koukouli, M. E., Balis, D. S., Katragkou, E., Melas, D., Poupkou, A., 13
Kioutsioukis, I., van der A, R., Boersma, F. K., van Roozendael, M., and Richter, A.: Satellite 14
observations and model simulations of tropospheric NO2 columns over south-eastern Europe, 15
Atmos. Chem. Phys., 9, 6119-6134, doi:10.5194/acp-9-6119-2009, 2009. 16
17
18
19
20
21
22
23
24
25
26
27
28
29
30
31
32
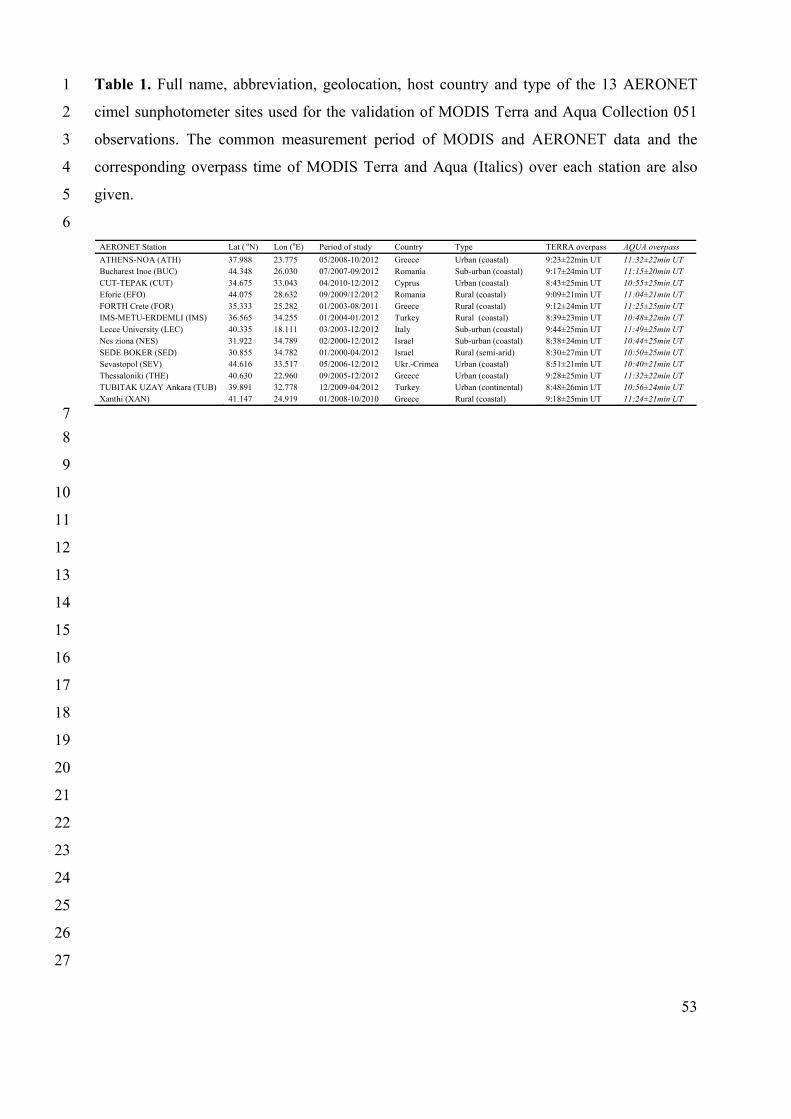
53
Table 1. Full name, abbreviation, geolocation, host country and type of the 13 AERONET 1
cimel sunphotometer sites used for the validation of MODIS Terra and Aqua Collection 051 2
observations. The common measurement period of MODIS and AERONET data and the 3
corresponding overpass time of MODIS Terra and Aqua (Italics) over each station are also 4
given. 5
6
AERONET Station Lat ( oN) Lon (oE) Period of study Country Type TERRA overpass AQUA overpass
ATHENS-NOA (ATH) 37.988 23.775 05/2008-10/2012 Greece Urban (coastal) 9:23±22min UT 11:32±22min UT Bucharest Inoe (BUC) 44.348 26.030 07/2007-09/2012 Romania Sub-urban (coastal) 9:17±24min UT 11:15±20min UT CUT-TEPAK (CUT) 34.675 33.043 04/2010-12/2012 Cyprus Urban (coastal) 8:43±25min UT 10:55±25min UT Eforie (EFO) 44.075 28.632 09/2009/12/2012 Romania Rural (coastal) 9:09±21min UT 11:04±21min UT FORTH Crete (FOR) 35.333 25.282 01/2003-08/2011 Greece Rural (coastal) 9:12±24min UT 11:25±25min UT IMS-METU-ERDEMLI (IMS) 36.565 34.255 01/2004-01/2012 Turkey Rural (coastal) 8:39±23min UT 10:48±22min UT Lecce University (LEC) 40.335 18.111 03/2003-12/2012 Italy Sub-urban (coastal) 9:44±25min UT 11:49±25min UT Nes ziona (NES) 31.922 34.789 02/2000-12/2012 Israel Sub-urban (coastal) 8:38±24min UT 10:44±25min UT SEDE BOKER (SED) 30.855 34.782 01/2000-04/2012 Israel Rural (semi-arid) 8:30±27min UT 10:50±25min UT Sevastopol (SEV) 44.616 33.517 05/2006-12/2012 Ukr.-Crimea Urban (coastal) 8:51±21min UT 10:40±21min UT Thessaloniki (THE) 40.630 22.960 09/2005-12/2012 Greece Urban (coastal) 9:28±25min UT 11:32±22min UT TUBITAK UZAY Ankara (TUB) 39.891 32.778 12/2009-04/2012 Turkey Urban (continental) 8:48±26min UT 10:56±24min UT Xanthi (XAN) 41.147 24.919 01/2008-10/2010 Greece Rural (coastal) 9:18±25min UT 11:24±21min UT
7
8
9
10
11
12
13
14
15
16
17
18
19
20
21
22
23
24
25
26
27
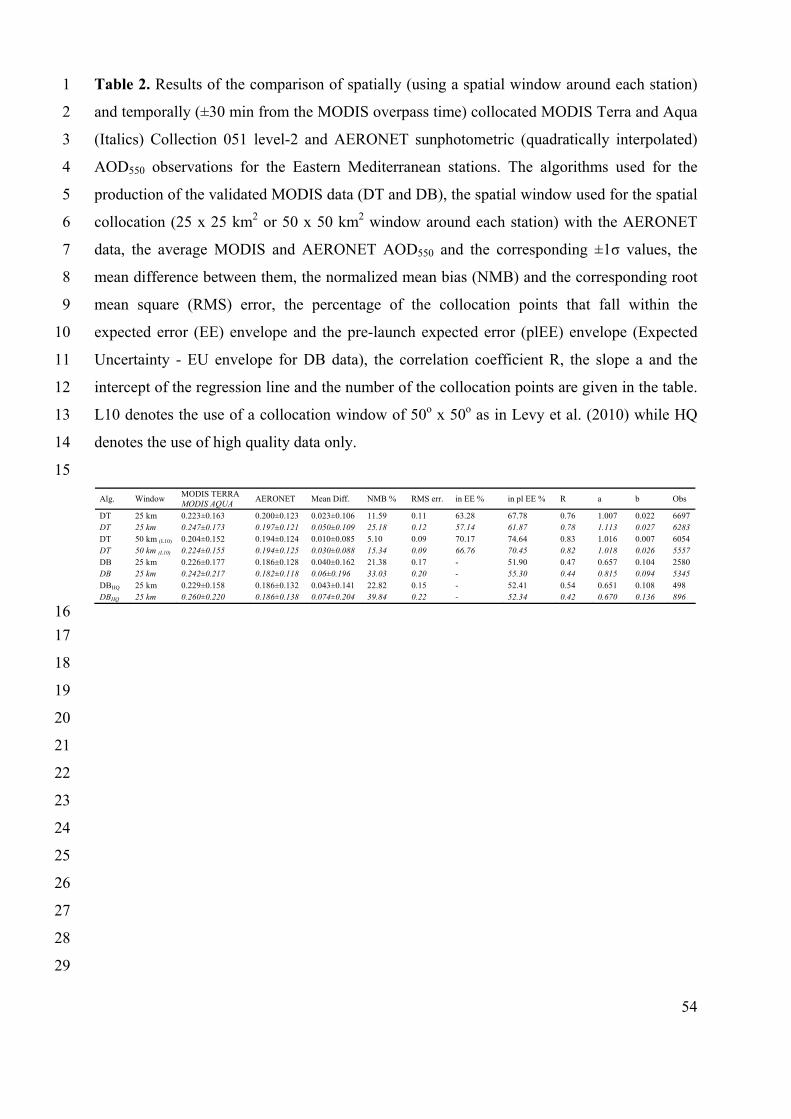
54
Table 2. Results of the comparison of spatially (using a spatial window around each station) 1
and temporally (±30 min from the MODIS overpass time) collocated MODIS Terra and Aqua 2
(Italics) Collection 051 level-2 and AERONET sunphotometric (quadratically interpolated) 3
AOD550 observations for the Eastern Mediterranean stations. The algorithms used for the 4
production of the validated MODIS data (DT and DB), the spatial window used for the spatial 5
collocation (25 x 25 km2 or 50 x 50 km2 window around each station) with the AERONET 6
data, the average MODIS and AERONET AOD550 and the corresponding ±1σ values, the 7
mean difference between them, the normalized mean bias (NMB) and the corresponding root 8
mean square (RMS) error, the percentage of the collocation points that fall within the 9
expected error (EE) envelope and the pre-launch expected error (plEE) envelope (Expected 10
Uncertainty - EU envelope for DB data), the correlation coefficient R, the slope a and the 11
intercept of the regression line and the number of the collocation points are given in the table. 12
L10 denotes the use of a collocation window of 50o x 50o as in Levy et al. (2010) while HQ 13
denotes the use of high quality data only. 14
15
Alg. Window MODIS TERRA MODIS AQUA
AERONET Mean Diff. NMB % RMS err. in EE % in pl EE % R a b Obs
DT 25 km 0.223±0.163 0.200±0.123 0.023±0.106 11.59 0.11 63.28 67.78 0.76 1.007 0.022 6697 DT 25 km 0.247±0.173 0.197±0.121 0.050±0.109 25.18 0.12 57.14 61.87 0.78 1.113 0.027 6283 DT 50 km (L10) 0.204±0.152 0.194±0.124 0.010±0.085 5.10 0.09 70.17 74.64 0.83 1.016 0.007 6054 DT 50 km (L10) 0.224±0.155 0.194±0.125 0.030±0.088 15.34 0.09 66.76 70.45 0.82 1.018 0.026 5557 DB 25 km 0.226±0.177 0.186±0.128 0.040±0.162 21.38 0.17 - 51.90 0.47 0.657 0.104 2580 DB 25 km 0.242±0.217 0.182±0.118 0.06±0.196 33.03 0.20 - 55.30 0.44 0.815 0.094 5345 DBHQ 25 km 0.229±0.158 0.186±0.132 0.043±0.141 22.82 0.15 - 52.41 0.54 0.651 0.108 498 DBHQ 25 km 0.260±0.220 0.186±0.138 0.074±0.204 39.84 0.22 - 52.34 0.42 0.670 0.136 896
16
17
18
19
20
21
22
23
24
25
26
27
28
29
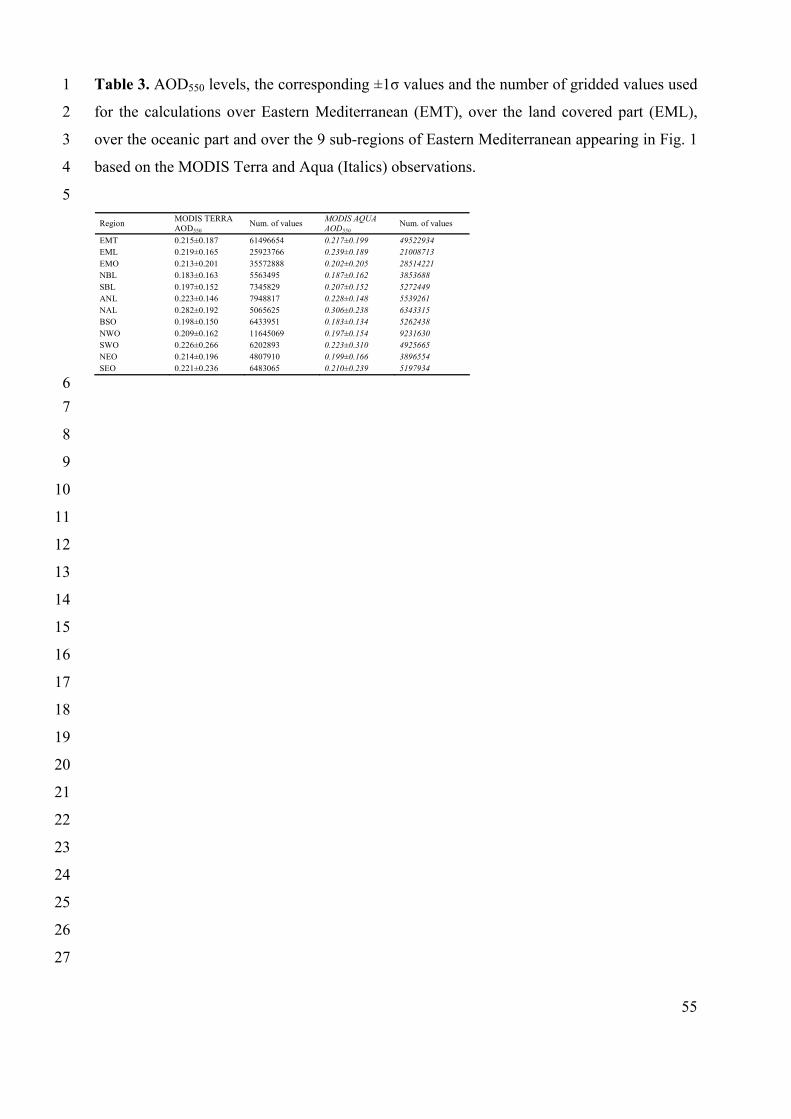
55
Table 3. AOD550 levels, the corresponding ±1σ values and the number of gridded values used 1
for the calculations over Eastern Mediterranean (EMT), over the land covered part (EML), 2
over the oceanic part and over the 9 sub-regions of Eastern Mediterranean appearing in Fig. 1 3
based on the MODIS Terra and Aqua (Italics) observations. 4
5
Region MODIS TERRA AOD550
Num. of values MODIS AQUA AOD550
Num. of values
EMT 0.215±0.187 61496654 0.217±0.199 49522934 EML 0.219±0.165 25923766 0.239±0.189 21008713 EMO 0.213±0.201 35572888 0.202±0.205 28514221 NBL 0.183±0.163 5563495 0.187±0.162 3853688 SBL 0.197±0.152 7345829 0.207±0.152 5272449 ANL 0.223±0.146 7948817 0.228±0.148 5539261 NAL 0.282±0.192 5065625 0.306±0.238 6343315 BSO 0.198±0.150 6433951 0.183±0.134 5262438 NWO 0.209±0.162 11645069 0.197±0.154 9231630 SWO 0.226±0.266 6202893 0.223±0.310 4925665 NEO 0.214±0.196 4807910 0.199±0.166 3896554 SEO 0.221±0.236 6483065 0.210±0.239 5197934
6
7
8
9
10
11
12
13
14
15
16
17
18
19
20
21
22
23
24
25
26
27
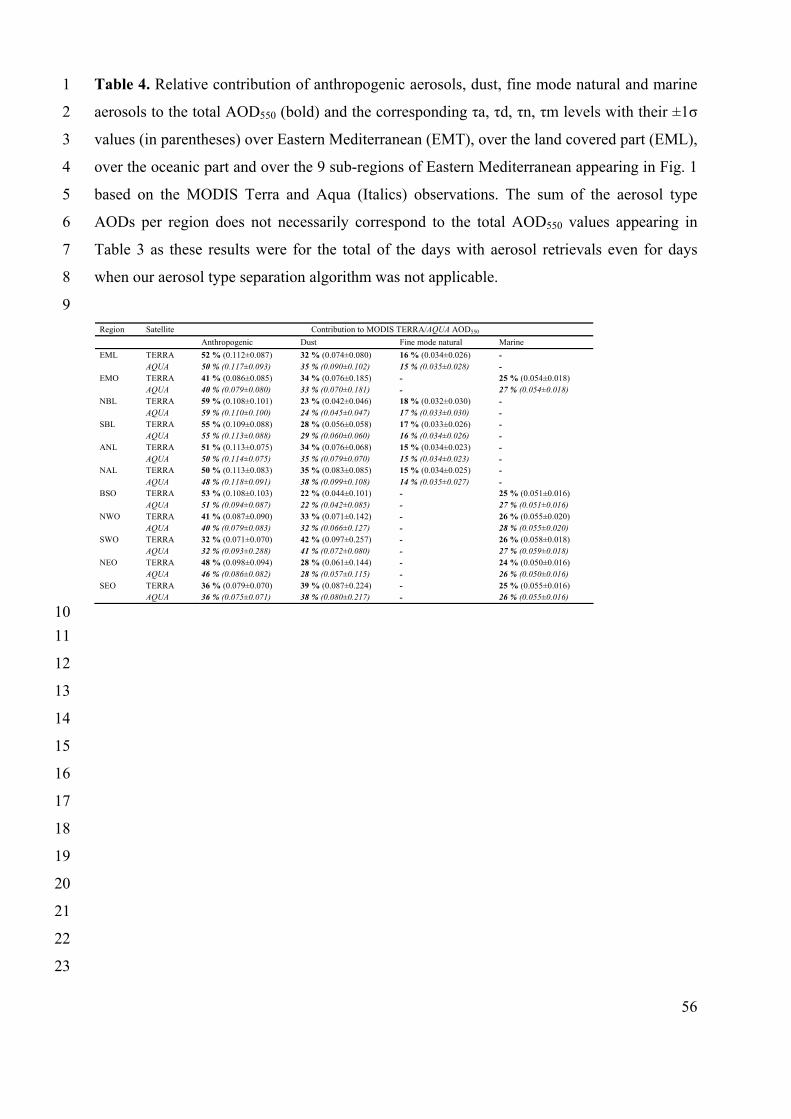
56
Table 4. Relative contribution of anthropogenic aerosols, dust, fine mode natural and marine 1
aerosols to the total AOD550 (bold) and the corresponding τa, τd, τn, τm levels with their ±1σ 2
values (in parentheses) over Eastern Mediterranean (EMT), over the land covered part (EML), 3
over the oceanic part and over the 9 sub-regions of Eastern Mediterranean appearing in Fig. 1 4
based on the MODIS Terra and Aqua (Italics) observations. The sum of the aerosol type 5
AODs per region does not necessarily correspond to the total AOD550 values appearing in 6
Table 3 as these results were for the total of the days with aerosol retrievals even for days 7
when our aerosol type separation algorithm was not applicable. 8
9
Region Satellite Contribution to MODIS TERRA/AQUA AOD550
Anthropogenic Dust Fine mode natural Marine
EML TERRA 52 % (0.112±0.087) 32 % (0.074±0.080) 16 % (0.034±0.026) - AQUA 50 % (0.117±0.093) 35 % (0.090±0.102) 15 % (0.035±0.028) - EMO TERRA 41 % (0.086±0.085) 34 % (0.076±0.185) - 25 % (0.054±0.018) AQUA 40 % (0.079±0.080) 33 % (0.070±0.181) - 27 % (0.054±0.018) NBL TERRA 59 % (0.108±0.101) 23 % (0.042±0.046) 18 % (0.032±0.030) - AQUA 59 % (0.110±0.100) 24 % (0.045±0.047) 17 % (0.033±0.030) - SBL TERRA 55 % (0.109±0.088) 28 % (0.056±0.058) 17 % (0.033±0.026) - AQUA 55 % (0.113±0.088) 29 % (0.060±0.060) 16 % (0.034±0.026) - ANL TERRA 51 % (0.113±0.075) 34 % (0.076±0.068) 15 % (0.034±0.023) - AQUA 50 % (0.114±0.075) 35 % (0.079±0.070) 15 % (0.034±0.023) - NAL TERRA 50 % (0.113±0.083) 35 % (0.083±0.085) 15 % (0.034±0.025) - AQUA 48 % (0.118±0.091) 38 % (0.099±0.108) 14 % (0.035±0.027) - BSO TERRA 53 % (0.108±0.103) 22 % (0.044±0.101) - 25 % (0.051±0.016) AQUA 51 % (0.094±0.087) 22 % (0.042±0.085) - 27 % (0.051±0.016) NWO TERRA 41 % (0.087±0.090) 33 % (0.071±0.142) - 26 % (0.055±0.020) AQUA 40 % (0.079±0.083) 32 % (0.066±0.127) - 28 % (0.055±0.020) SWO TERRA 32 % (0.071±0.070) 42 % (0.097±0.257) - 26 % (0.058±0.018) AQUA 32 % (0.093±0.288) 41 % (0.072±0.080) - 27 % (0.059±0.018) NEO TERRA 48 % (0.098±0.094) 28 % (0.061±0.144) - 24 % (0.050±0.016) AQUA 46 % (0.086±0.082) 28 % (0.057±0.115) - 26 % (0.050±0.016) SEO TERRA 36 % (0.079±0.070) 39 % (0.087±0.224) - 25 % (0.055±0.016) AQUA 36 % (0.075±0.071) 38 % (0.080±0.217) - 26 % (0.055±0.016)
10
11
12
13
14
15
16
17
18
19
20
21
22
23
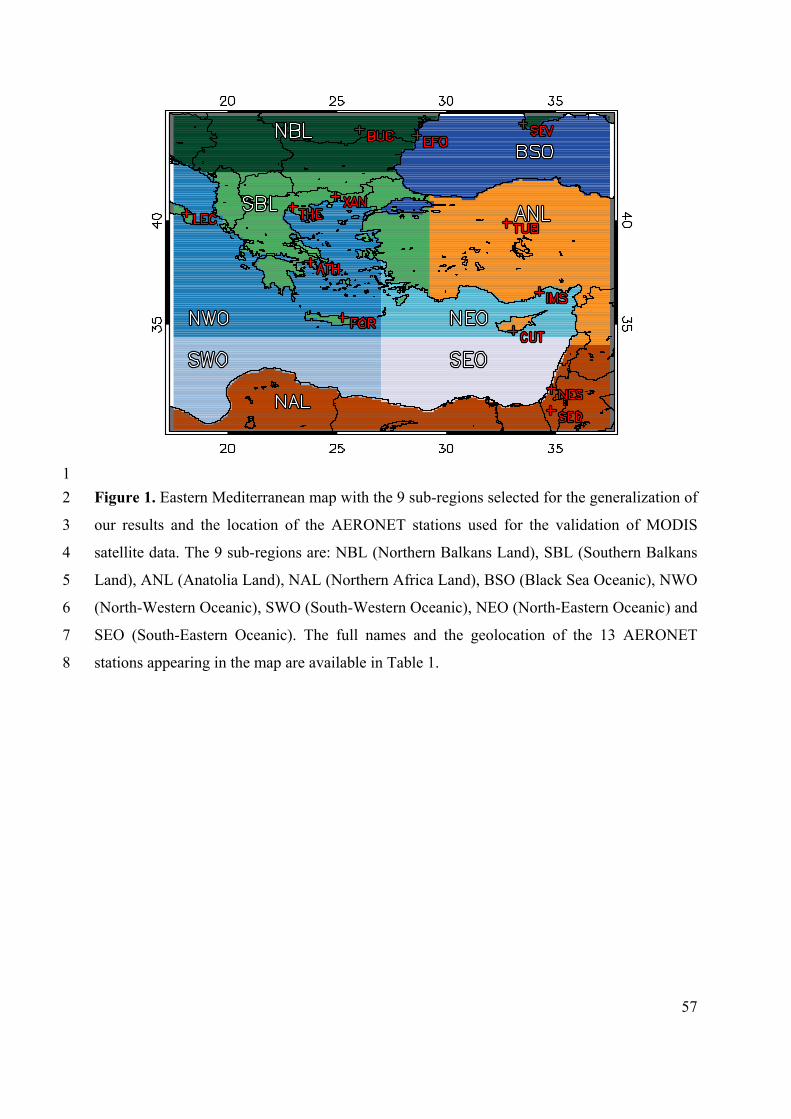
57
1
Figure 1. Eastern Mediterranean map with the 9 sub-regions selected for the generalization of 2
our results and the location of the AERONET stations used for the validation of MODIS 3
satellite data. The 9 sub-regions are: NBL (Northern Balkans Land), SBL (Southern Balkans 4
Land), ANL (Anatolia Land), NAL (Northern Africa Land), BSO (Black Sea Oceanic), NWO 5
(North-Western Oceanic), SWO (South-Western Oceanic), NEO (North-Eastern Oceanic) and 6
SEO (South-Eastern Oceanic). The full names and the geolocation of the 13 AERONET 7
stations appearing in the map are available in Table 1. 8
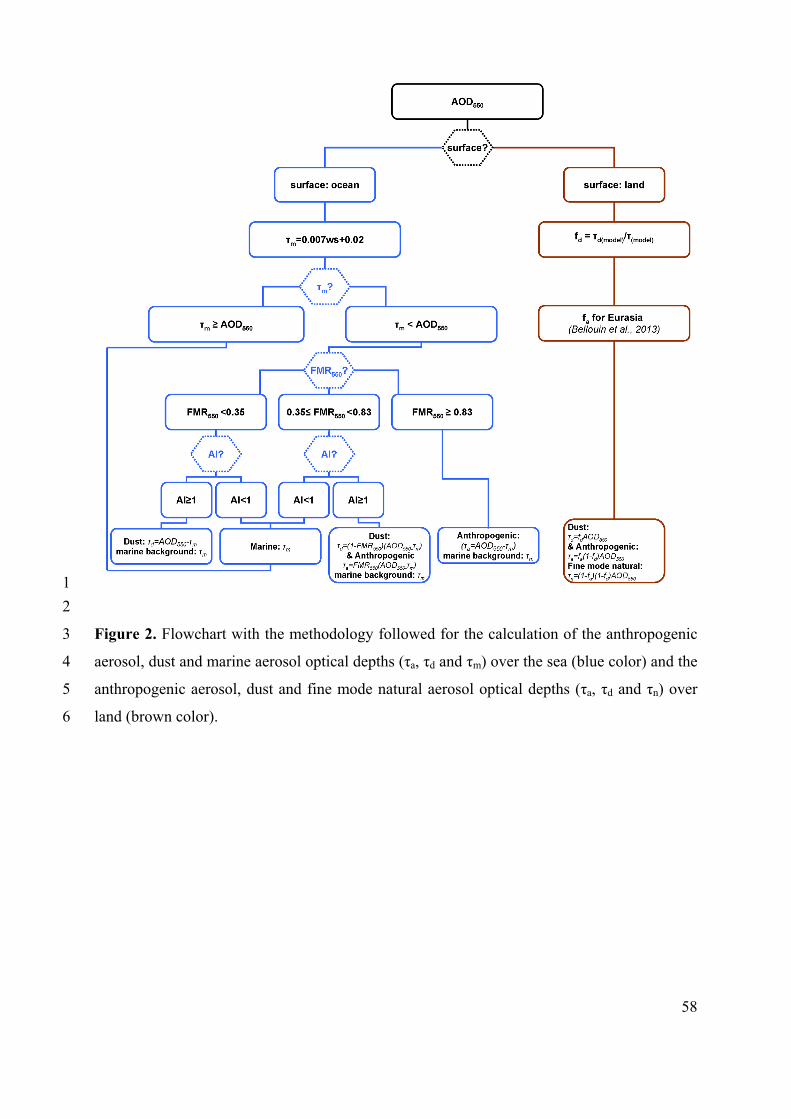
58
1
2
Figure 2. Flowchart with the methodology followed for the calculation of the anthropogenic 3
aerosol, dust and marine aerosol optical depths (τa, τd and τm) over the sea (blue color) and the 4
anthropogenic aerosol, dust and fine mode natural aerosol optical depths (τa, τd and τn) over 5
land (brown color). 6
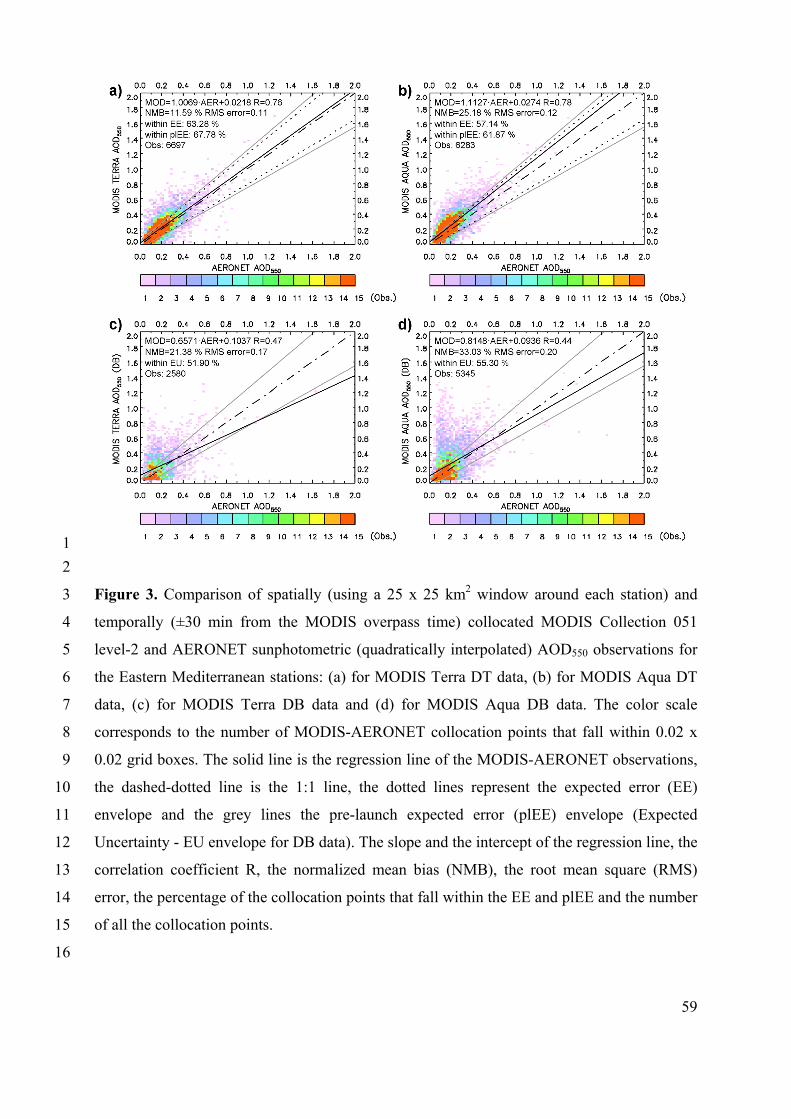
59
1
2
Figure 3. Comparison of spatially (using a 25 x 25 km2 window around each station) and 3
temporally (±30 min from the MODIS overpass time) collocated MODIS Collection 051 4
level-2 and AERONET sunphotometric (quadratically interpolated) AOD550 observations for 5
the Eastern Mediterranean stations: (a) for MODIS Terra DT data, (b) for MODIS Aqua DT 6
data, (c) for MODIS Terra DB data and (d) for MODIS Aqua DB data. The color scale 7
corresponds to the number of MODIS-AERONET collocation points that fall within 0.02 x 8
0.02 grid boxes. The solid line is the regression line of the MODIS-AERONET observations, 9
the dashed-dotted line is the 1:1 line, the dotted lines represent the expected error (EE) 10
envelope and the grey lines the pre-launch expected error (plEE) envelope (Expected 11
Uncertainty - EU envelope for DB data). The slope and the intercept of the regression line, the 12
correlation coefficient R, the normalized mean bias (NMB), the root mean square (RMS) 13
error, the percentage of the collocation points that fall within the EE and plEE and the number 14
of all the collocation points. 15
16
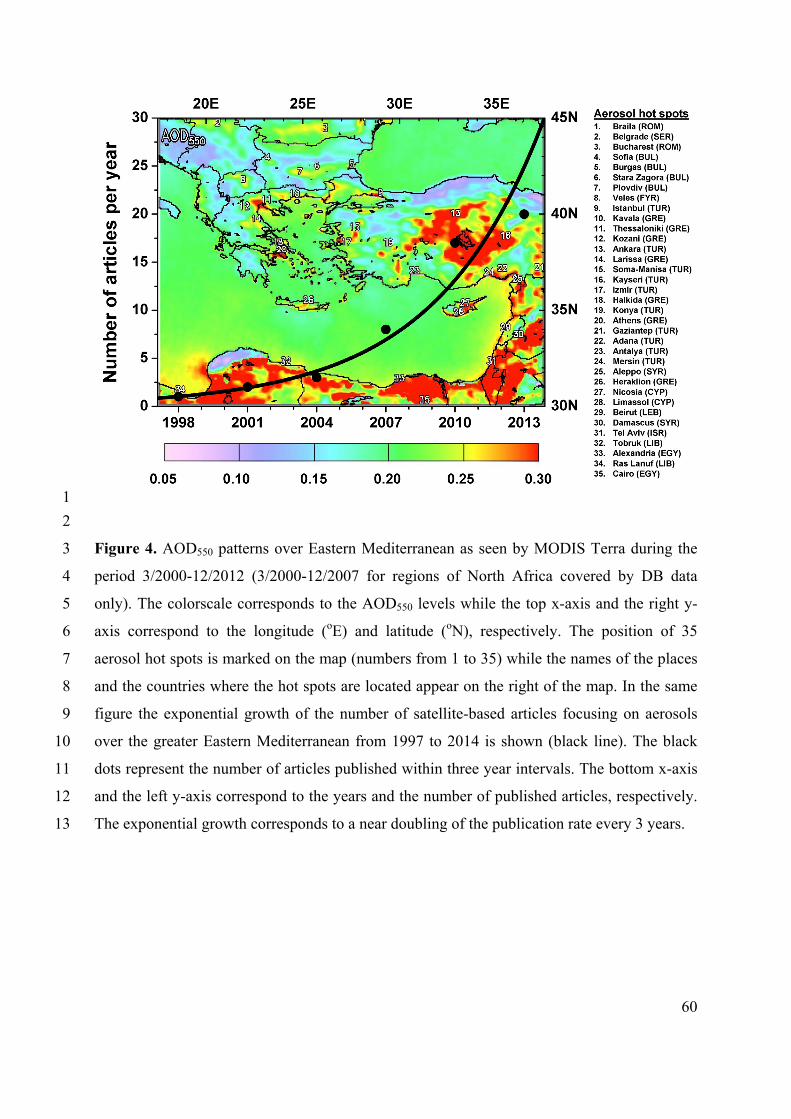
60
1
2
Figure 4. AOD550 patterns over Eastern Mediterranean as seen by MODIS Terra during the 3
period 3/2000-12/2012 (3/2000-12/2007 for regions of North Africa covered by DB data 4
only). The colorscale corresponds to the AOD550 levels while the top x-axis and the right y-5
axis correspond to the longitude (oE) and latitude (oN), respectively. The position of 35 6
aerosol hot spots is marked on the map (numbers from 1 to 35) while the names of the places 7
and the countries where the hot spots are located appear on the right of the map. In the same 8
figure the exponential growth of the number of satellite-based articles focusing on aerosols 9
over the greater Eastern Mediterranean from 1997 to 2014 is shown (black line). The black 10
dots represent the number of articles published within three year intervals. The bottom x-axis 11
and the left y-axis correspond to the years and the number of published articles, respectively. 12
The exponential growth corresponds to a near doubling of the publication rate every 3 years. 13
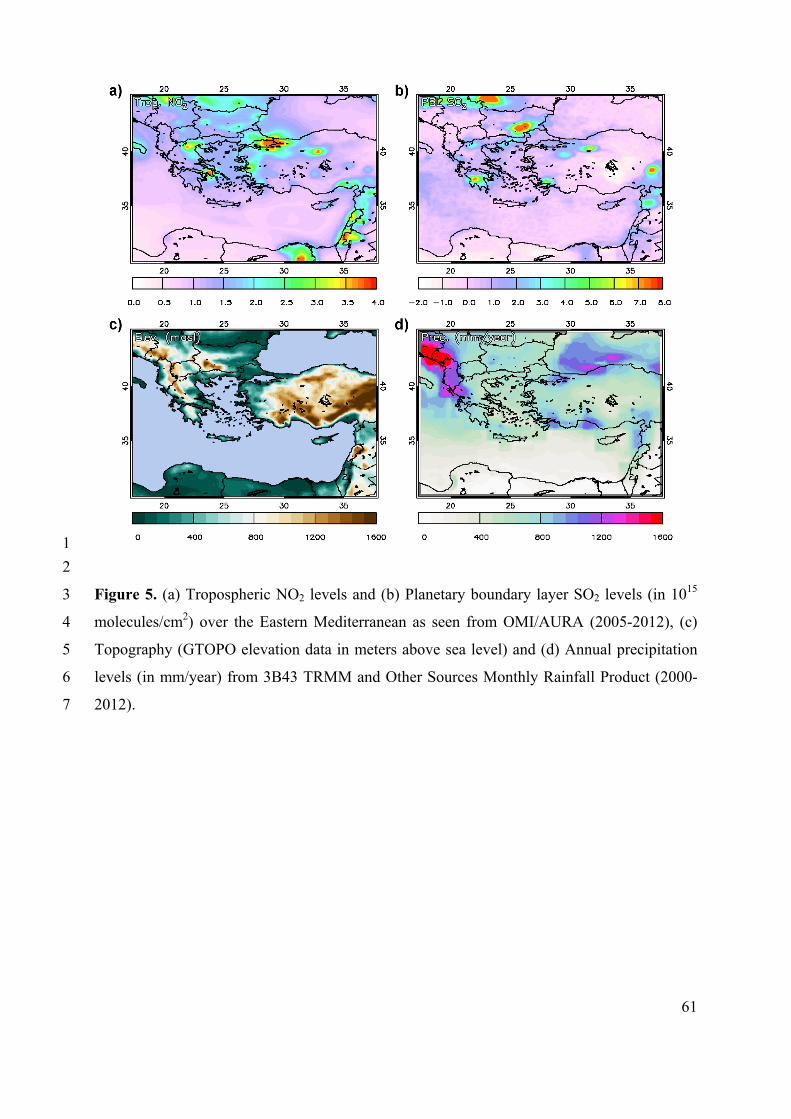
61
1
2
Figure 5. (a) Tropospheric NO2 levels and (b) Planetary boundary layer SO2 levels (in 1015 3
molecules/cm2) over the Eastern Mediterranean as seen from OMI/AURA (2005-2012), (c) 4
Topography (GTOPO elevation data in meters above sea level) and (d) Annual precipitation 5
levels (in mm/year) from 3B43 TRMM and Other Sources Monthly Rainfall Product (2000-6
2012). 7
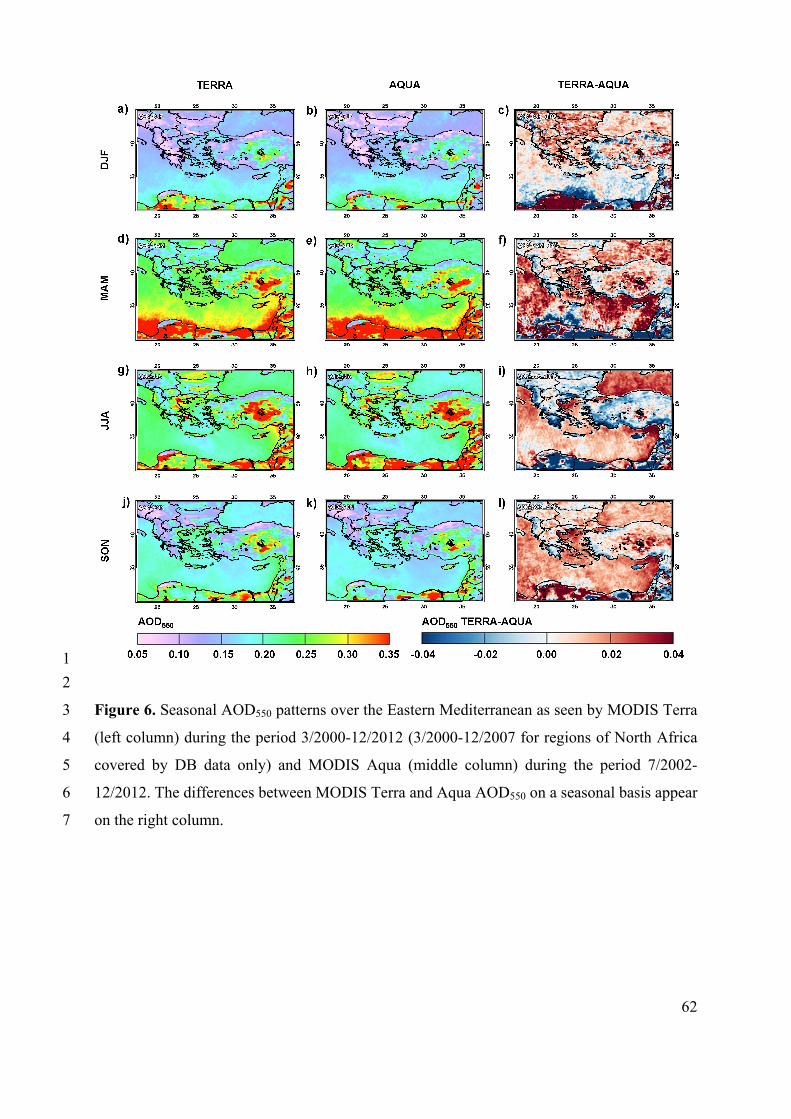
62
1
2
Figure 6. Seasonal AOD550 patterns over the Eastern Mediterranean as seen by MODIS Terra 3
(left column) during the period 3/2000-12/2012 (3/2000-12/2007 for regions of North Africa 4
covered by DB data only) and MODIS Aqua (middle column) during the period 7/2002-5
12/2012. The differences between MODIS Terra and Aqua AOD550 on a seasonal basis appear 6
on the right column. 7
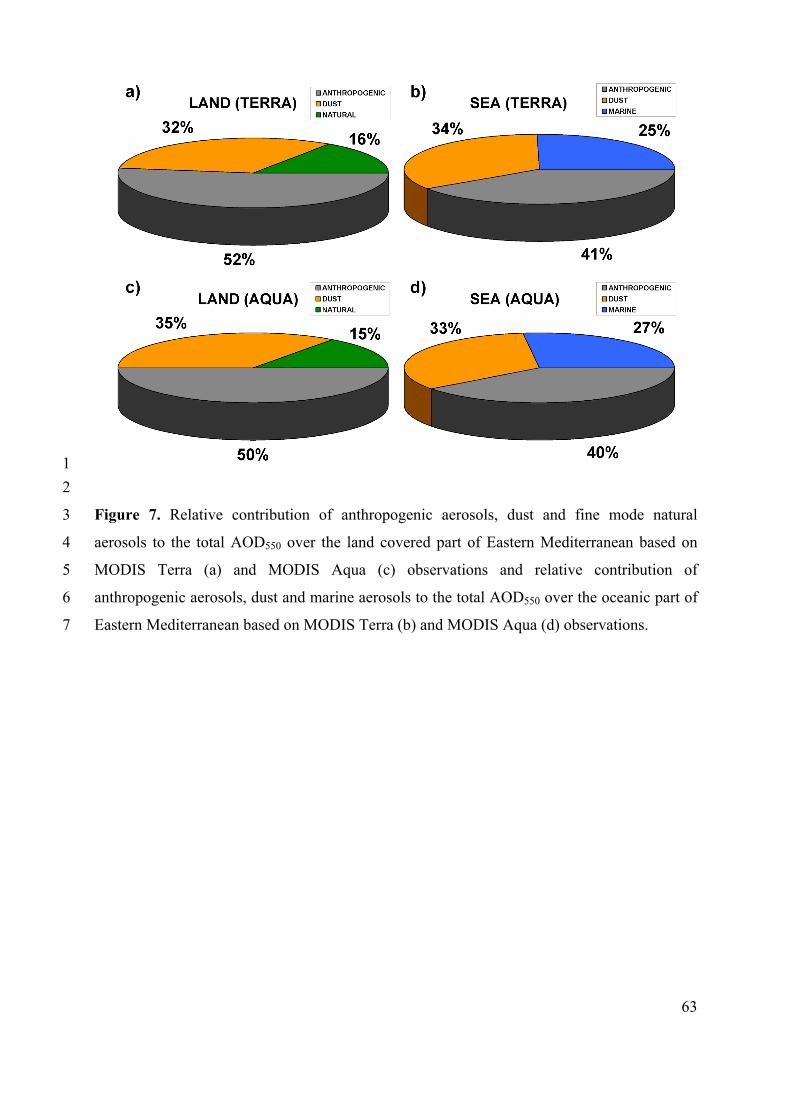
63
1
2
Figure 7. Relative contribution of anthropogenic aerosols, dust and fine mode natural 3
aerosols to the total AOD550 over the land covered part of Eastern Mediterranean based on 4
MODIS Terra (a) and MODIS Aqua (c) observations and relative contribution of 5
anthropogenic aerosols, dust and marine aerosols to the total AOD550 over the oceanic part of 6
Eastern Mediterranean based on MODIS Terra (b) and MODIS Aqua (d) observations. 7
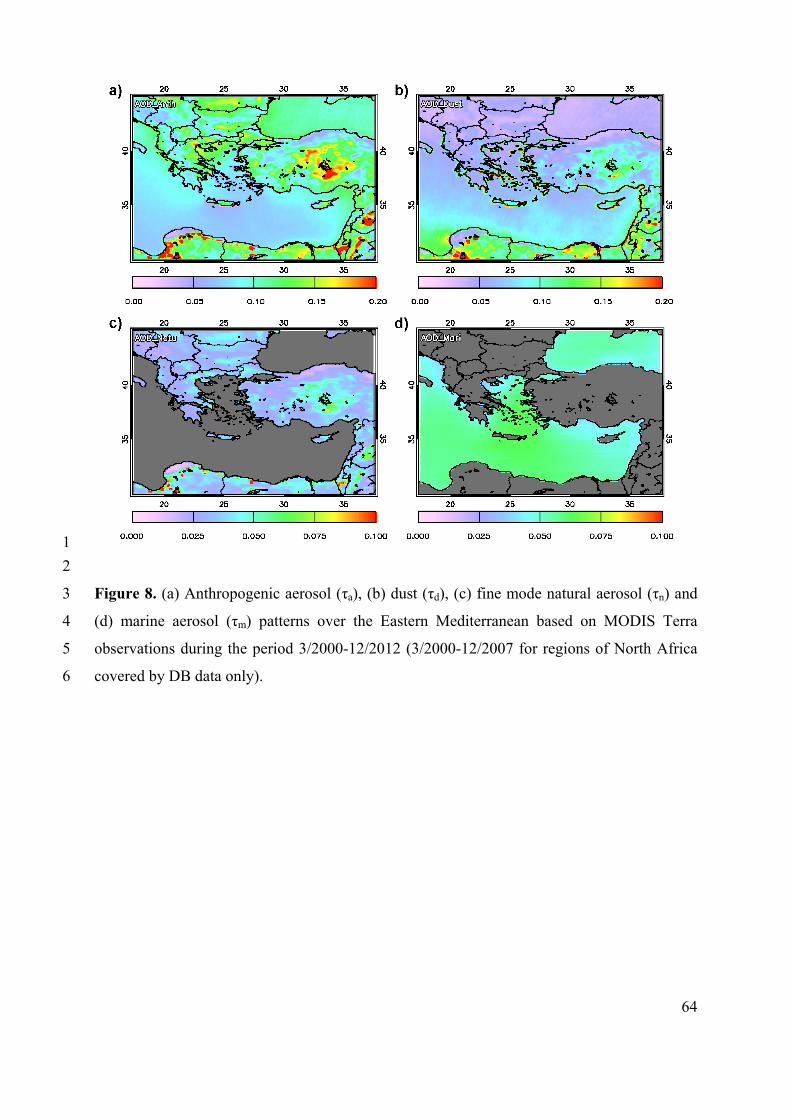
64
1
2
Figure 8. (a) Anthropogenic aerosol (τa), (b) dust (τd), (c) fine mode natural aerosol (τn) and 3
(d) marine aerosol (τm) patterns over the Eastern Mediterranean based on MODIS Terra 4
observations during the period 3/2000-12/2012 (3/2000-12/2007 for regions of North Africa 5
covered by DB data only). 6
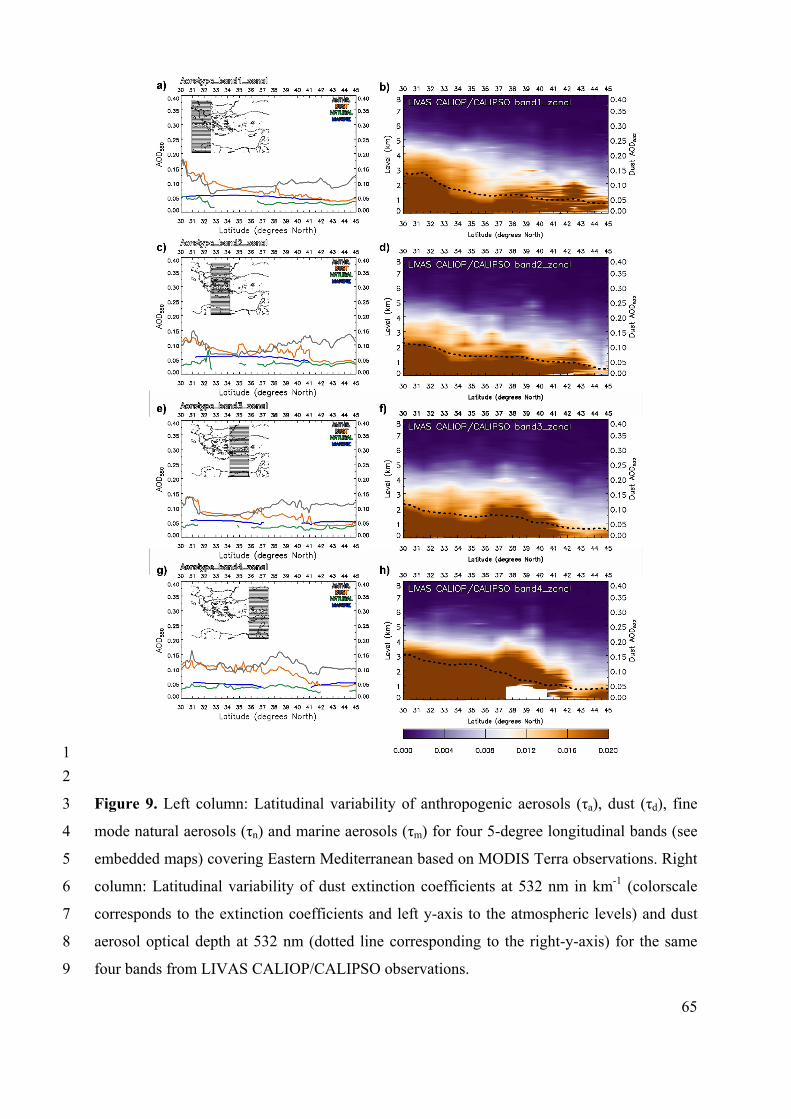
65
1
2
Figure 9. Left column: Latitudinal variability of anthropogenic aerosols (τa), dust (τd), fine 3
mode natural aerosols (τn) and marine aerosols (τm) for four 5-degree longitudinal bands (see 4
embedded maps) covering Eastern Mediterranean based on MODIS Terra observations. Right 5
column: Latitudinal variability of dust extinction coefficients at 532 nm in km-1 (colorscale 6
corresponds to the extinction coefficients and left y-axis to the atmospheric levels) and dust 7
aerosol optical depth at 532 nm (dotted line corresponding to the right-y-axis) for the same 8
four bands from LIVAS CALIOP/CALIPSO observations. 9
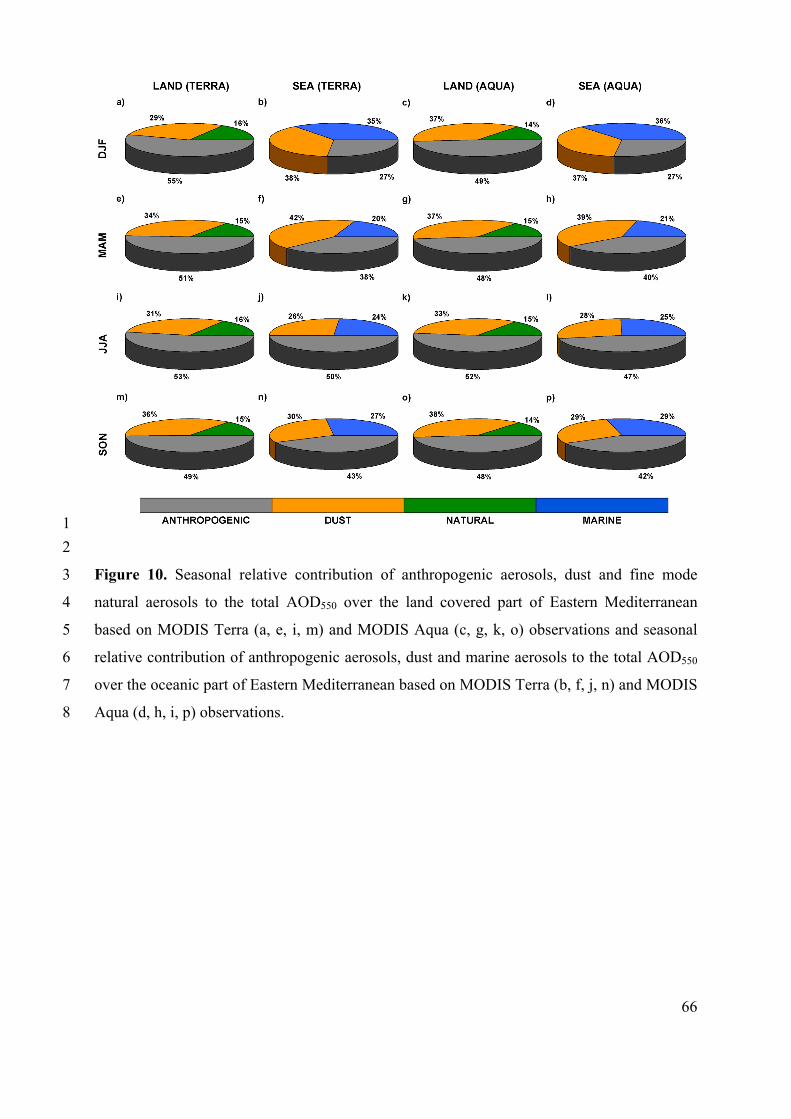
66
1
2
Figure 10. Seasonal relative contribution of anthropogenic aerosols, dust and fine mode 3
natural aerosols to the total AOD550 over the land covered part of Eastern Mediterranean 4
based on MODIS Terra (a, e, i, m) and MODIS Aqua (c, g, k, o) observations and seasonal 5
relative contribution of anthropogenic aerosols, dust and marine aerosols to the total AOD550 6
over the oceanic part of Eastern Mediterranean based on MODIS Terra (b, f, j, n) and MODIS 7
Aqua (d, h, i, p) observations. 8
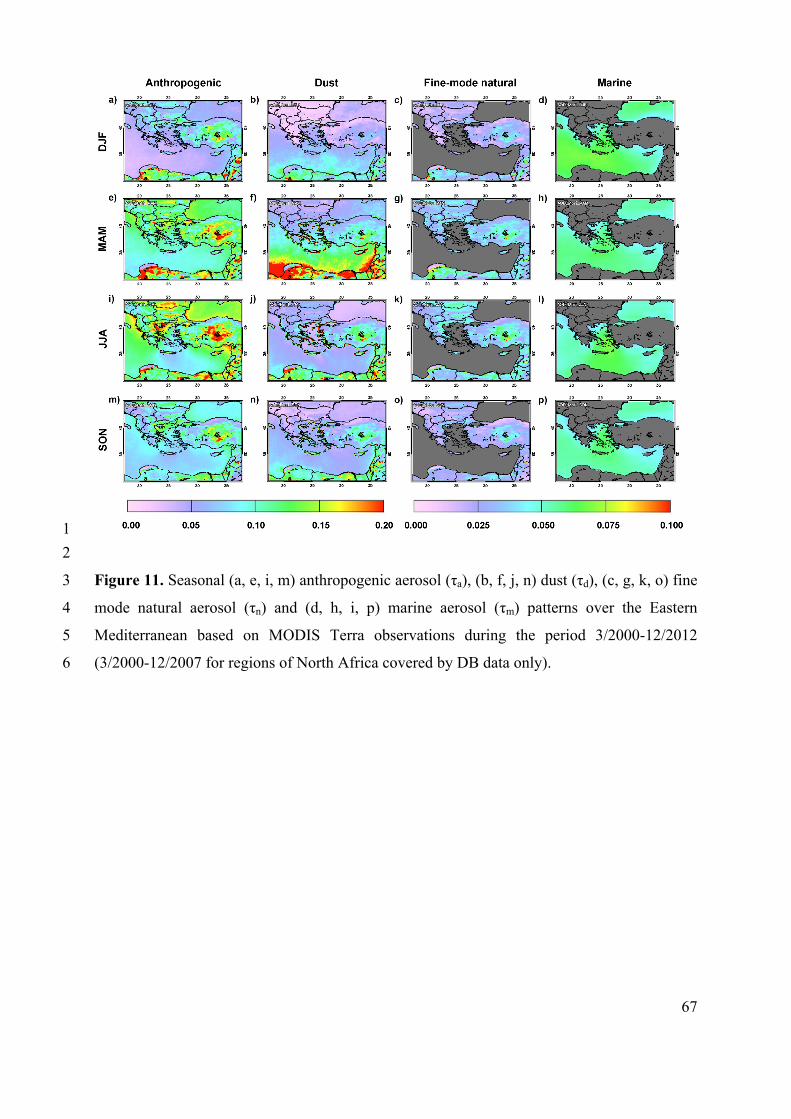
67
1
2
Figure 11. Seasonal (a, e, i, m) anthropogenic aerosol (τa), (b, f, j, n) dust (τd), (c, g, k, o) fine 3
mode natural aerosol (τn) and (d, h, i, p) marine aerosol (τm) patterns over the Eastern 4
Mediterranean based on MODIS Terra observations during the period 3/2000-12/2012 5
(3/2000-12/2007 for regions of North Africa covered by DB data only). 6
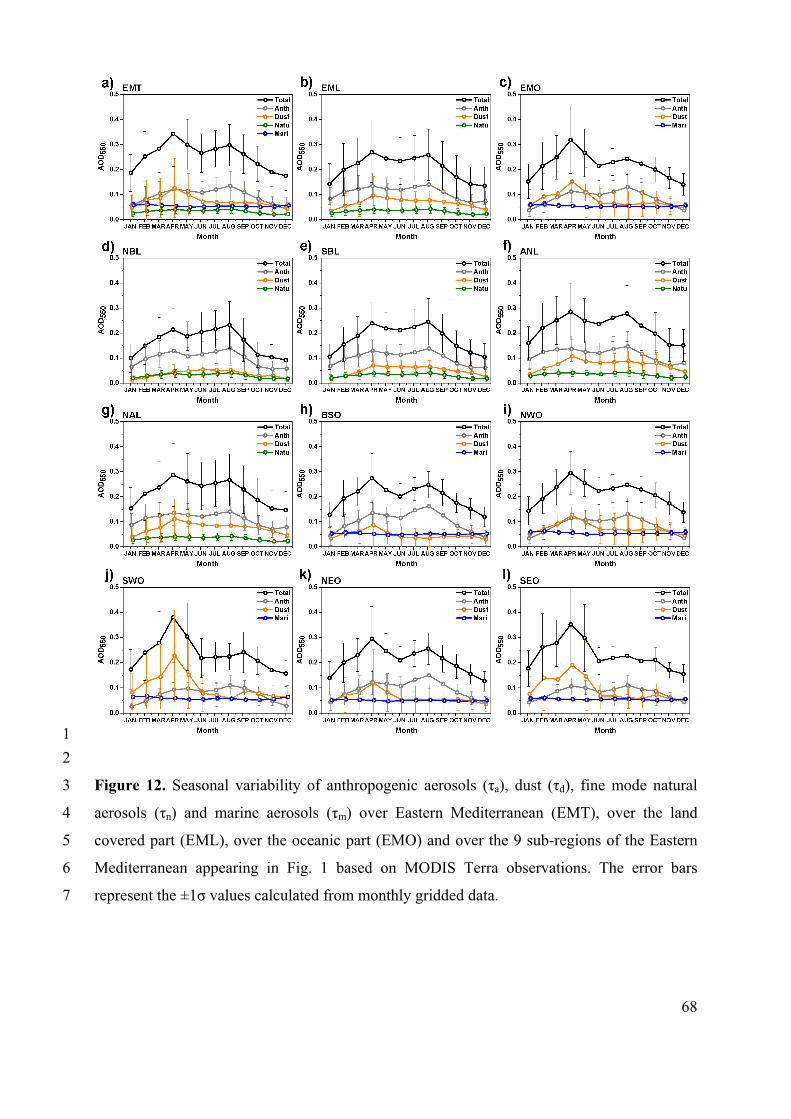
68
1
2
Figure 12. Seasonal variability of anthropogenic aerosols (τa), dust (τd), fine mode natural 3
aerosols (τn) and marine aerosols (τm) over Eastern Mediterranean (EMT), over the land 4
covered part (EML), over the oceanic part (EMO) and over the 9 sub-regions of the Eastern 5
Mediterranean appearing in Fig. 1 based on MODIS Terra observations. The error bars 6
represent the ±1σ values calculated from monthly gridded data. 7