Embed Size (px)
Citation preview
1
Tsunami Early WarningSome thoughts and Lessons learned
Jörn LauterjungGFZ Potsdam
2
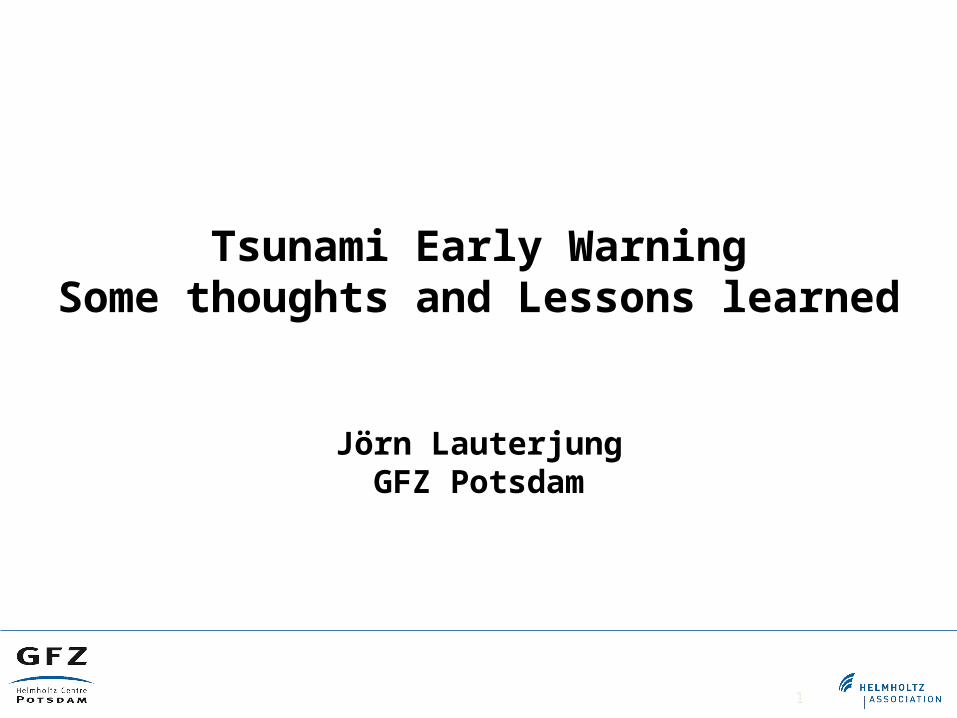
Tsunami-prone Areas
Sumatra, 2004Mentawai, 2010
Java, 2006
Japan, 2011
Chile, 2010
3
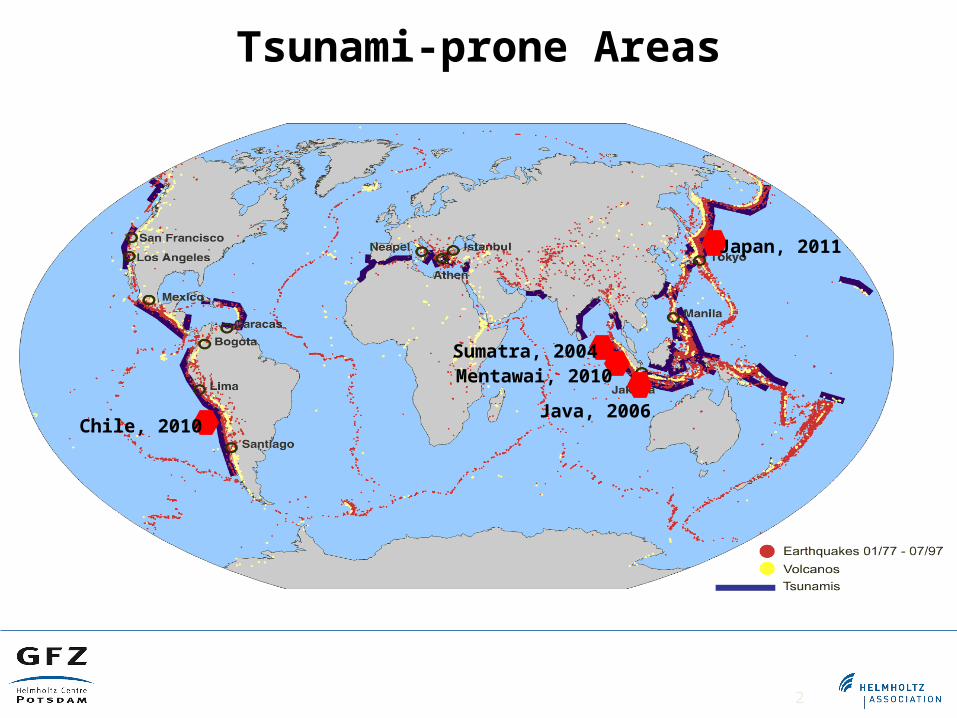
The International UNESCO FrameworkIntergovernmental Coordination Groups (ICG)
ICG PTWS
ICG IOTWS
ICG NEAMTWS
ICG CARIBE
4
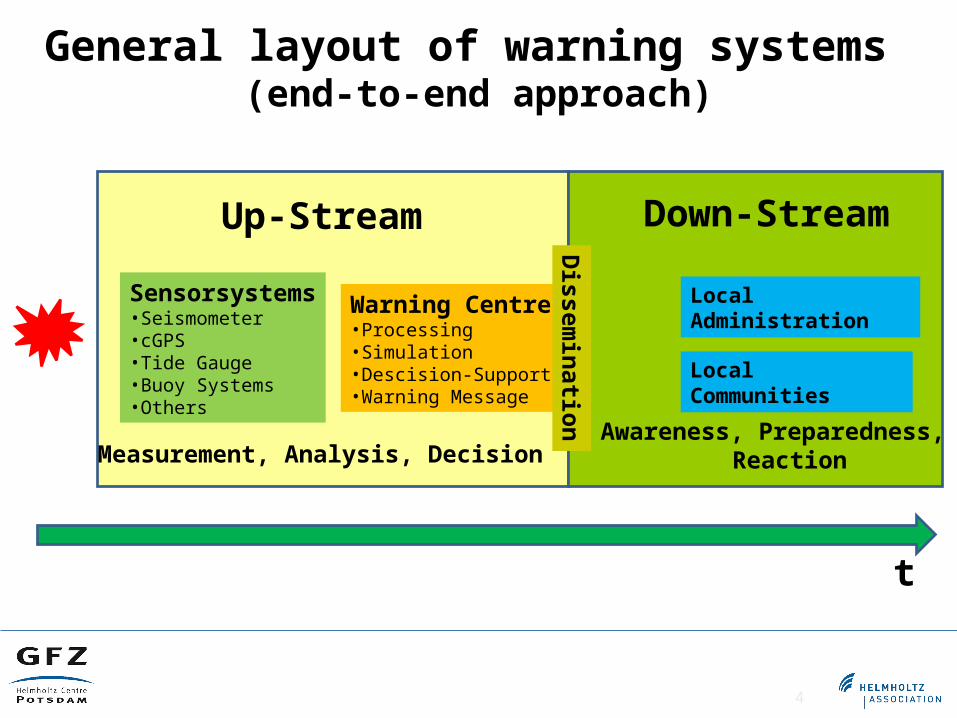
General layout of warning systems (end-to-end approach)
Sensorsystems•Seismometer•cGPS•Tide Gauge•Buoy Systems•Others
Warning Centre•Processing•Simulation•Descision-Support•Warning Message
Up-Stream
Measurement, Analysis, Decision
Dissem
inatio
nLocal Communities
Down-Stream
t
Awareness, Preparedness, Reaction
Local Administration
5
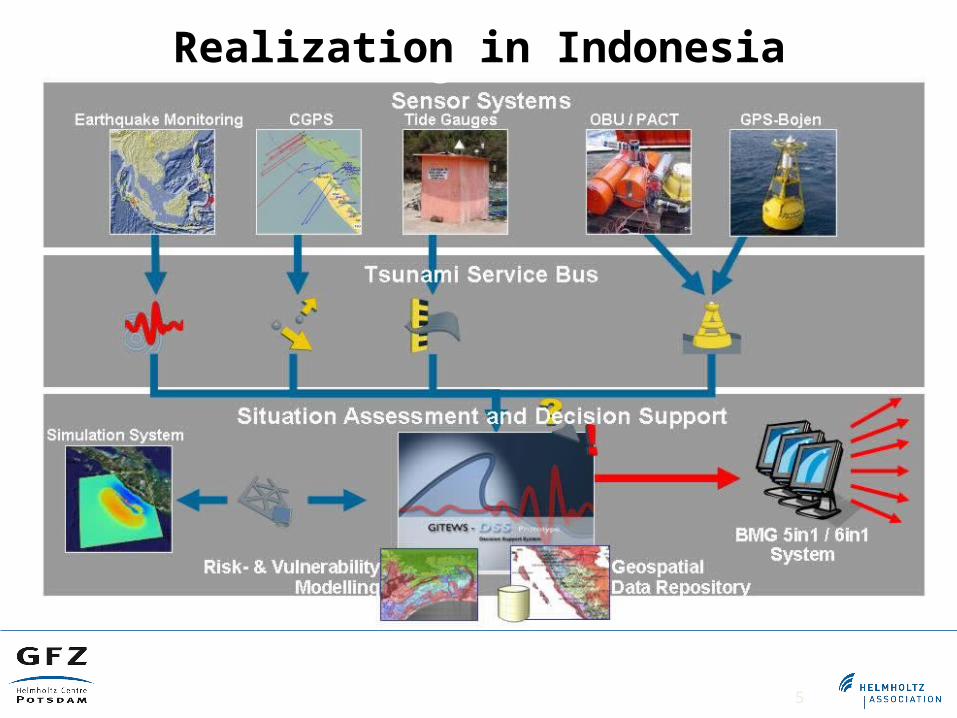
Warning ProcessRealization in Indonesia
6
Warning Process
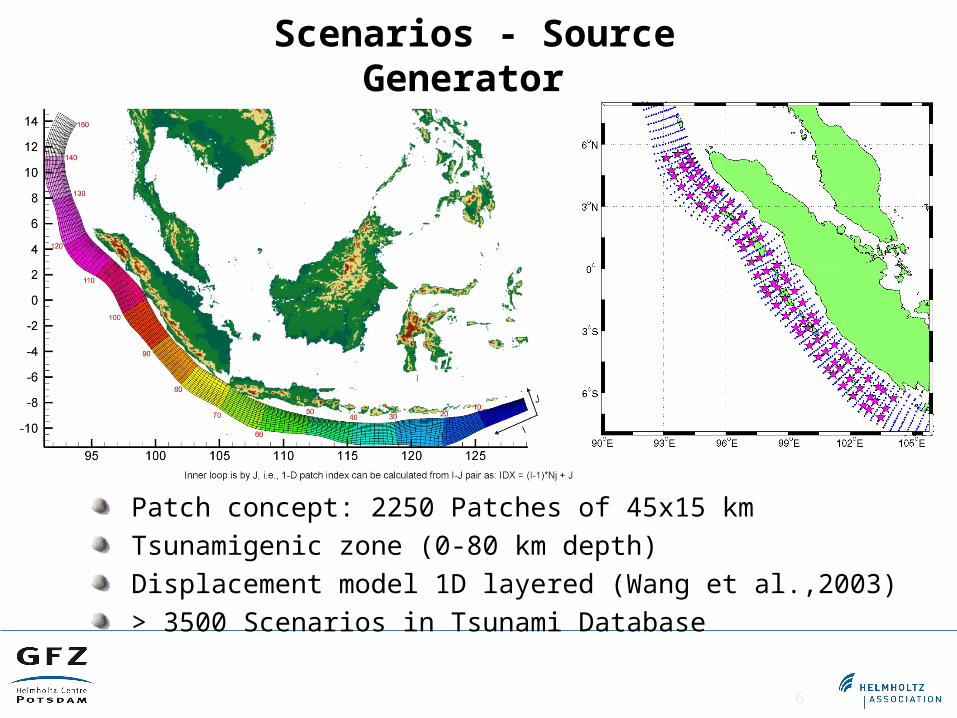
Patch concept: 2250 Patches of 45x15 kmTsunamigenic zone (0-80 km depth)Displacement model 1D layered (Wang et al.,2003)> 3500 Scenarios in Tsunami Database
Scenarios - Source Generator
7
Warning Process
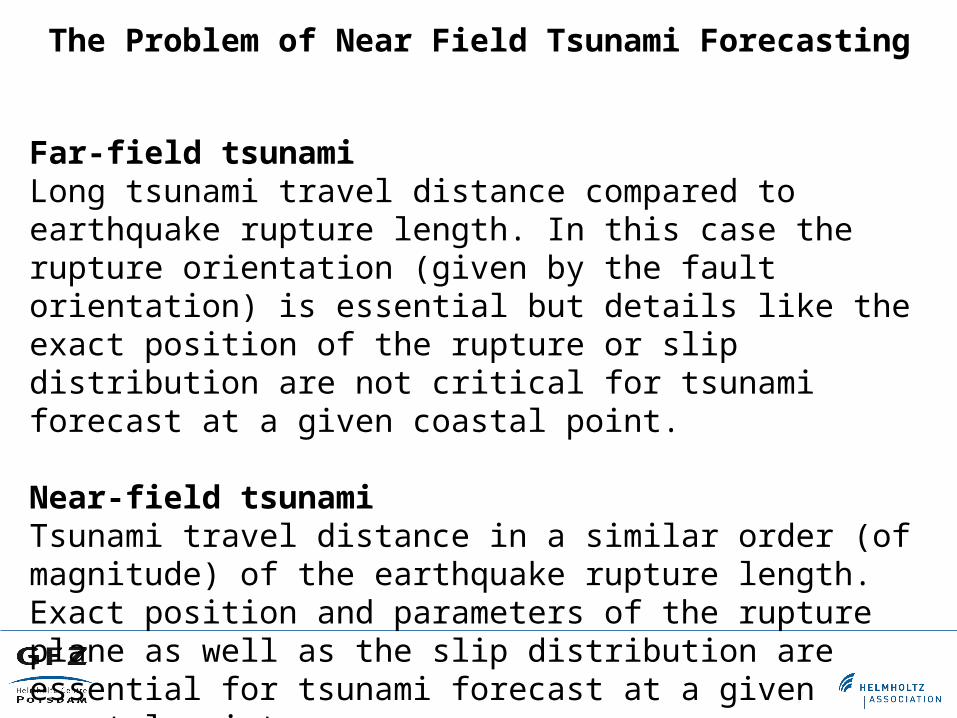
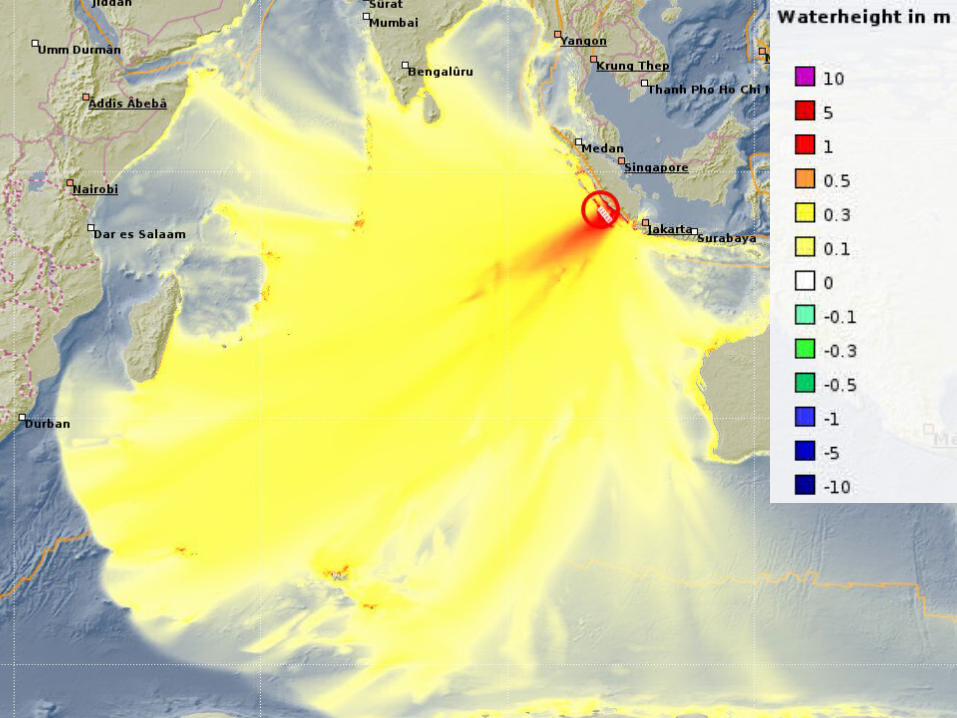
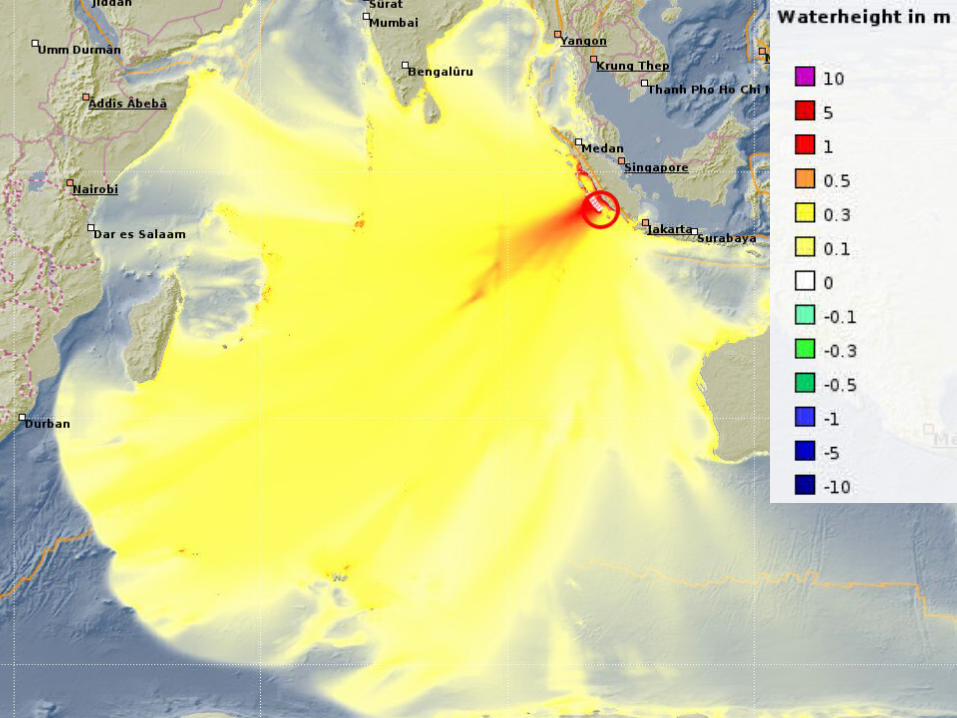
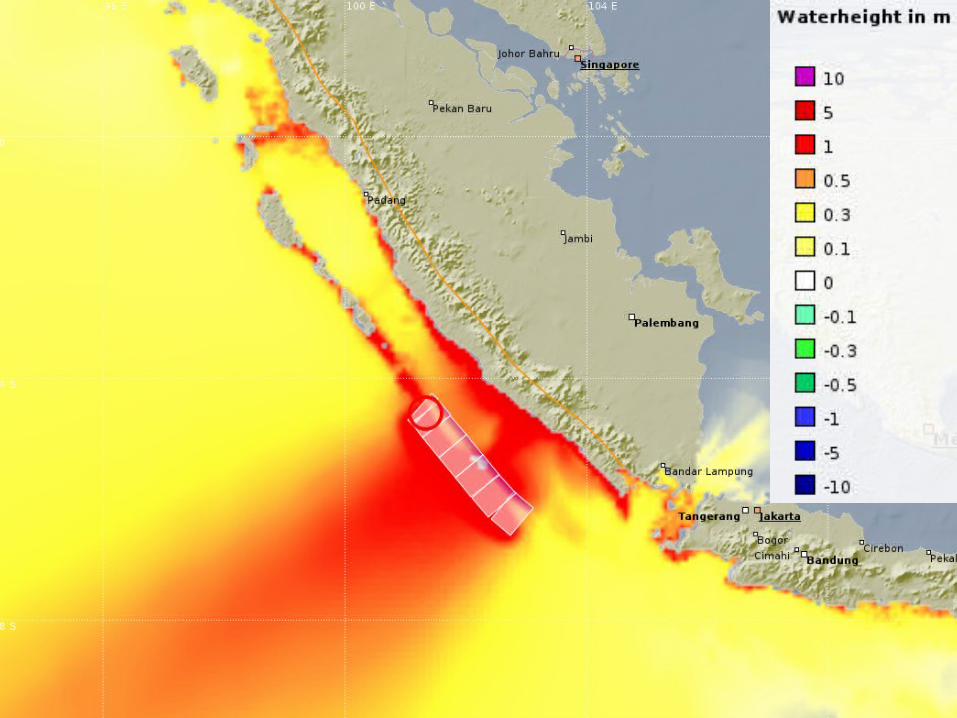
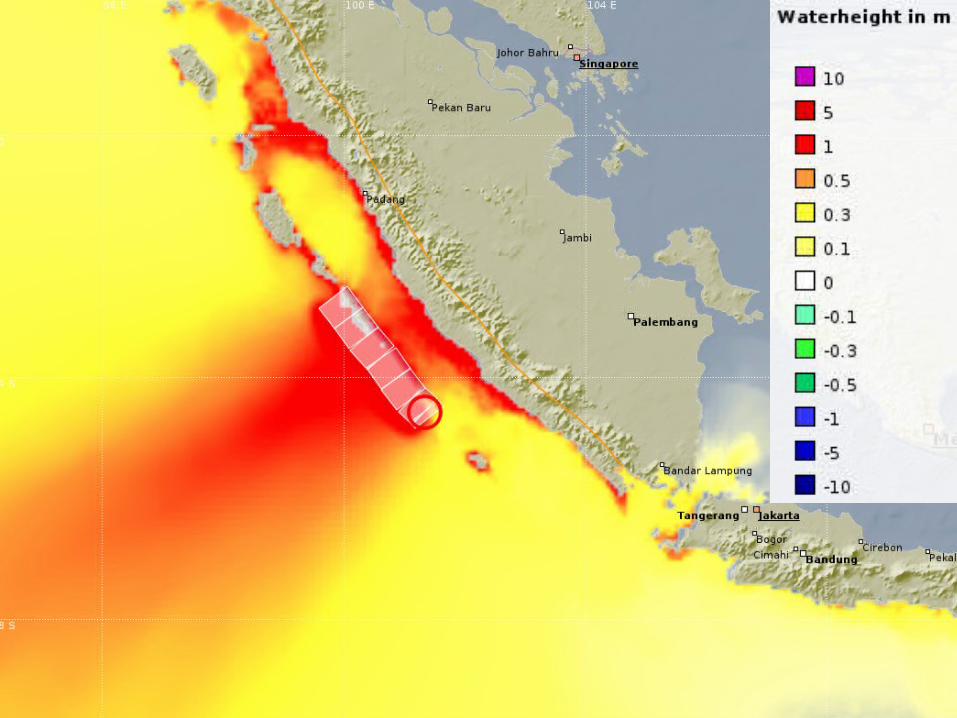
Far-field tsunamiLong tsunami travel distance compared to earthquake rupture length. In this case the rupture orientation (given by the fault orientation) is essential but details like the exact position of the rupture or slip distribution are not critical for tsunami forecast at a given coastal point.
Near-field tsunamiTsunami travel distance in a similar order (of magnitude) of the earthquake rupture length. Exact position and parameters of the rupture plane as well as the slip distribution are essential for tsunami forecast at a given coastal point.
The Problem of Near Field Tsunami Forecasting
12
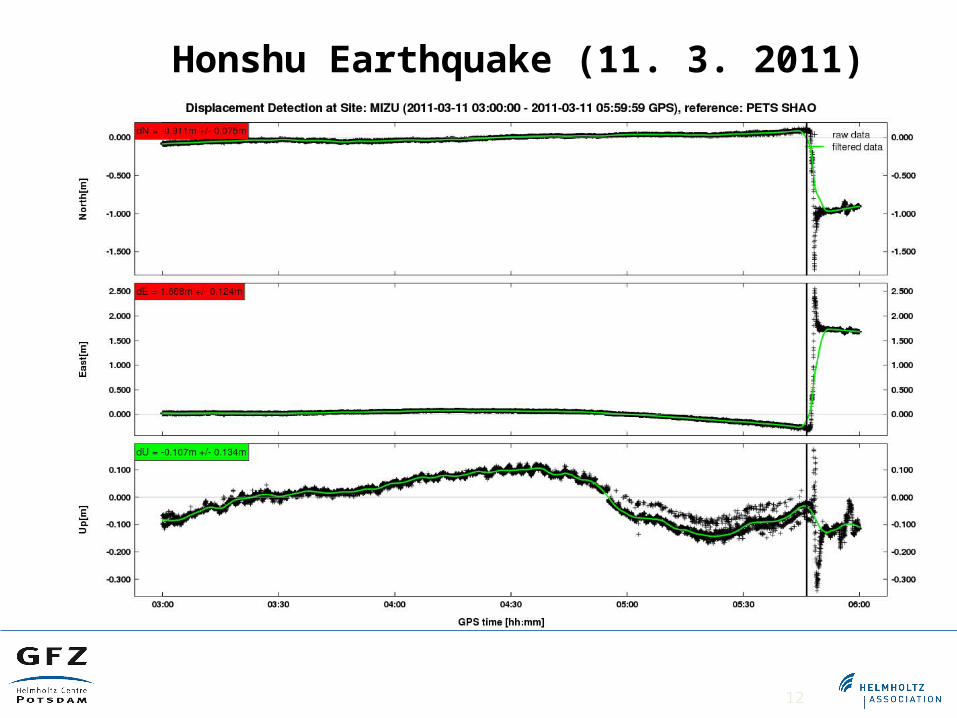
Warning ProcessHonshu Earthquake (11. 3. 2011)
13
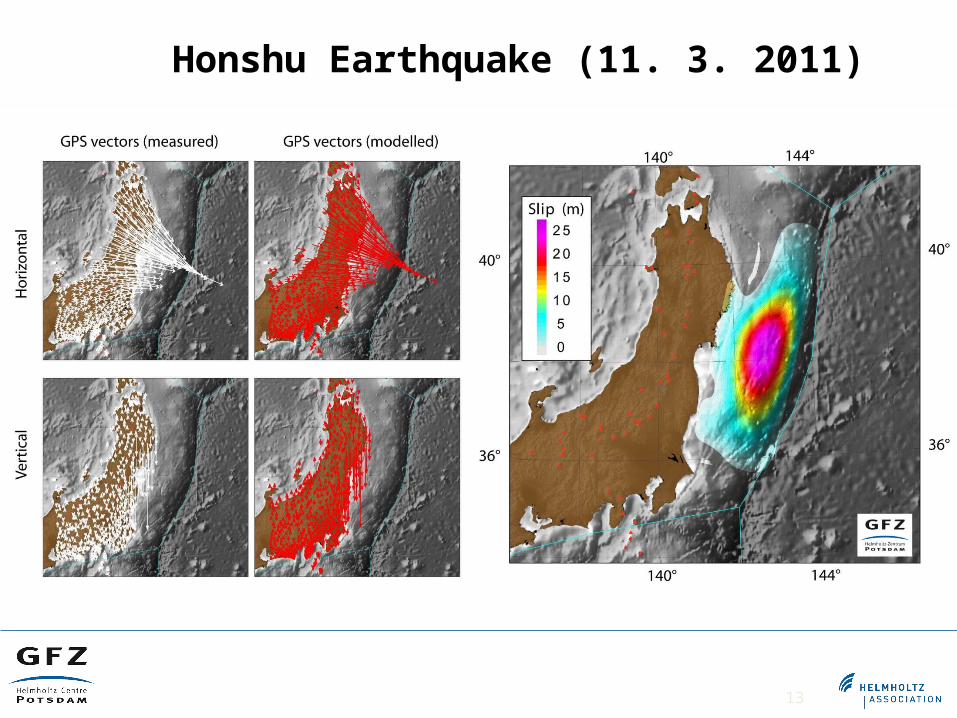
Warning ProcessHonshu Earthquake (11. 3. 2011)
matching
Numerical World
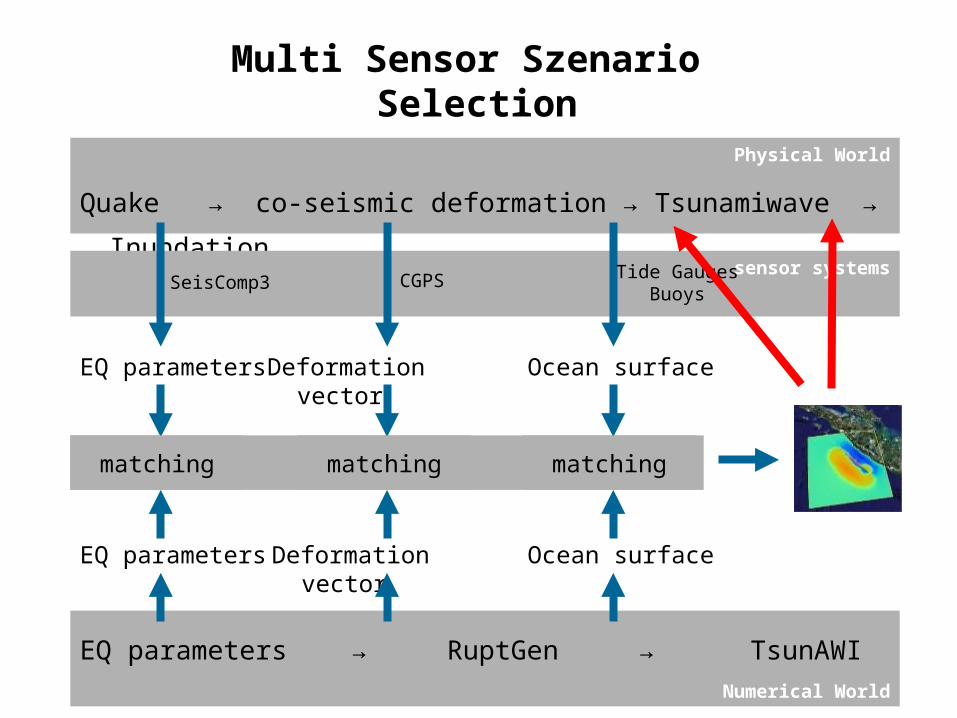
Multi Sensor Szenario Selection
EQ parameters → RuptGen → TsunAWI
EQ parameters Deformation vector Ocean surface
Physical World
Quake → co-seismic deformation → Tsunamiwave →
Inundationsensor systems
SeisComp3 CGPS Tide GaugesBuoys
EQ parameters Deformation vector Ocean surface
matching matching matching
15
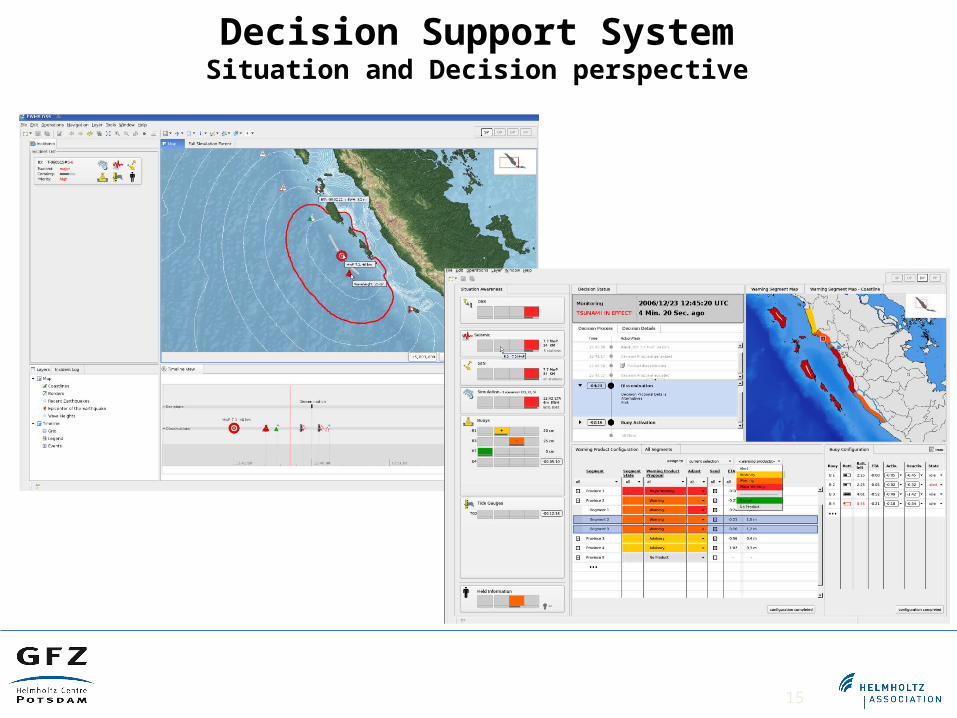
Warning ProcessDecision Support SystemSituation and Decision perspective
16
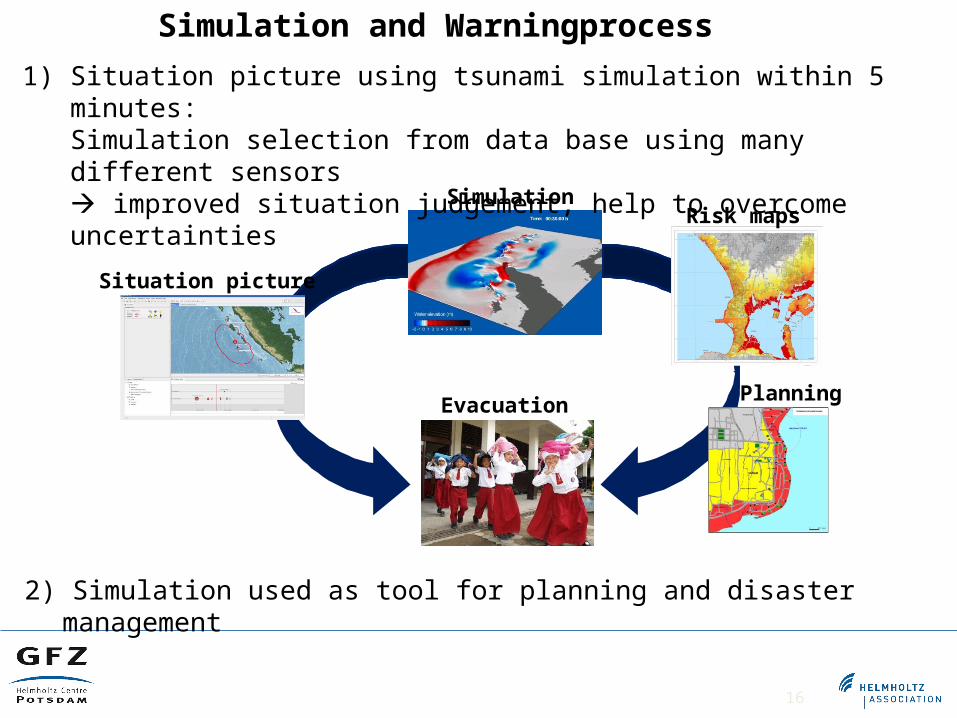
Warning Process
Simulation
Situation picture
Evacuation
Risk maps
Planning
1) Situation picture using tsunami simulation within 5 minutes:Simulation selection from data base using many different sensors improved situation judgement, help to overcome uncertainties
2) Simulation used as tool for planning and disaster management
Simulation and Warningprocess
17
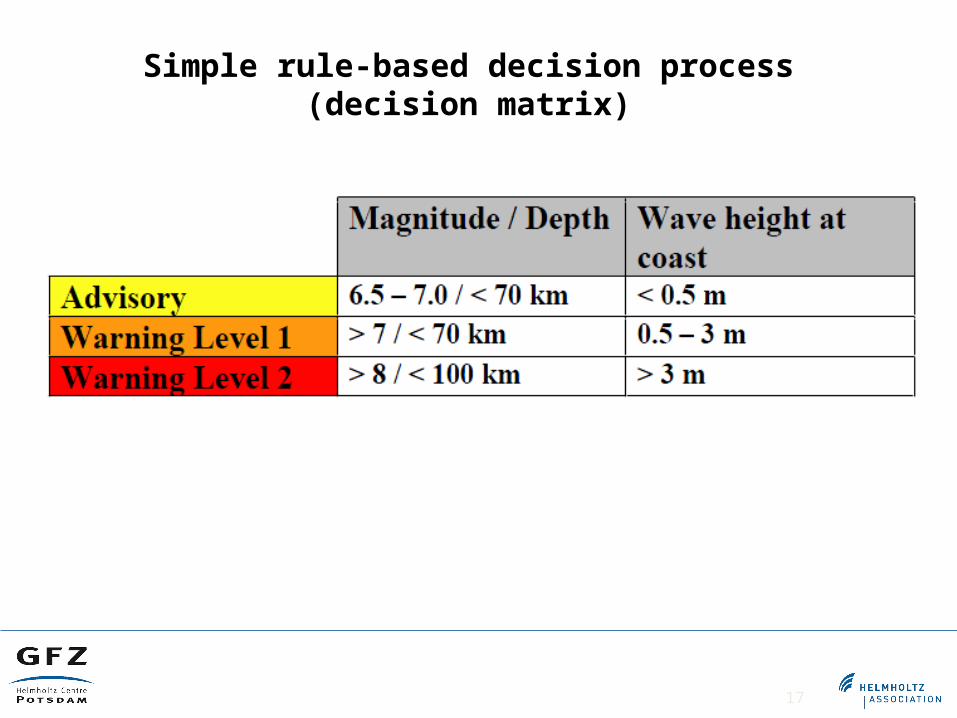
Simple rule-based decision process (decision matrix)
18
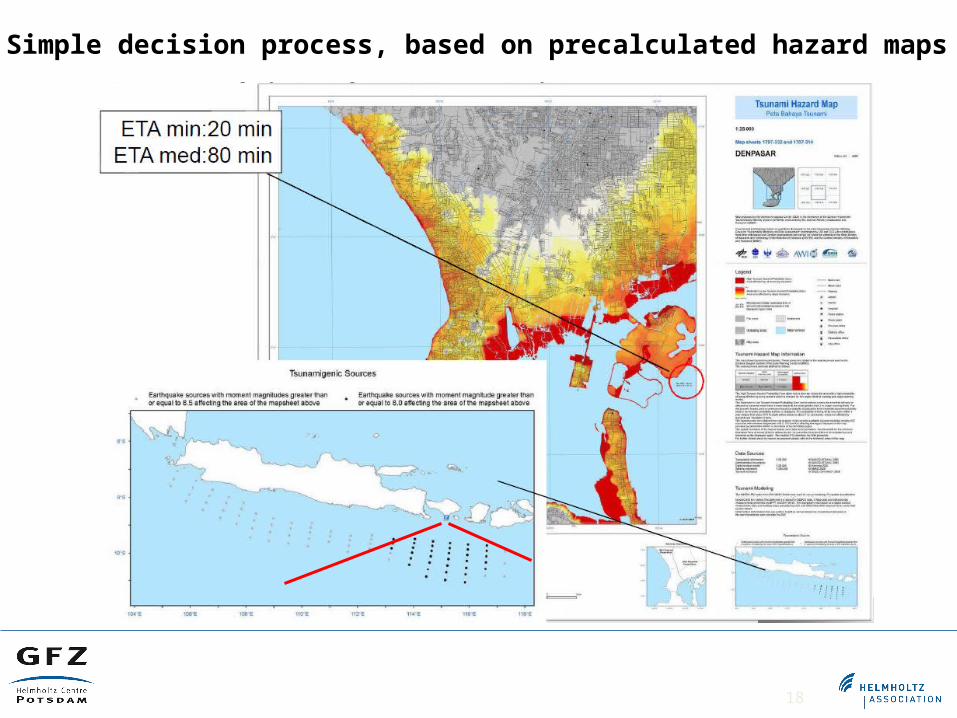
Simple decision process, based on precalculated hazard maps
19
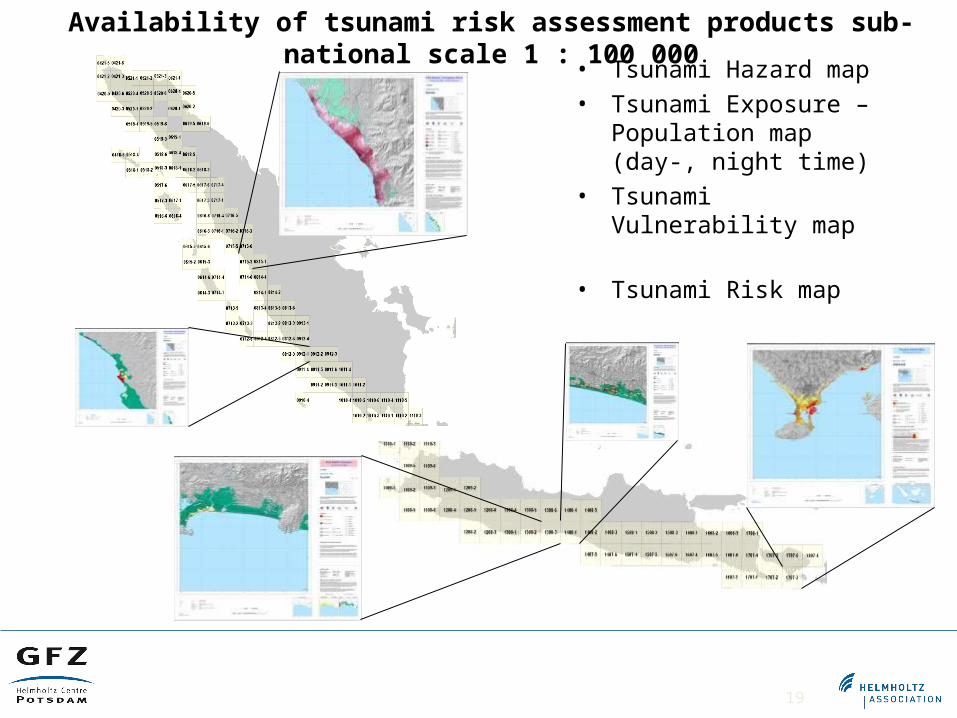
Warning Process• Tsunami Hazard map• Tsunami Exposure –
Population map (day-, night time)
• Tsunami Vulnerability map
• Tsunami Risk map
Availability of tsunami risk assessment products sub-national scale 1 : 100 000
20
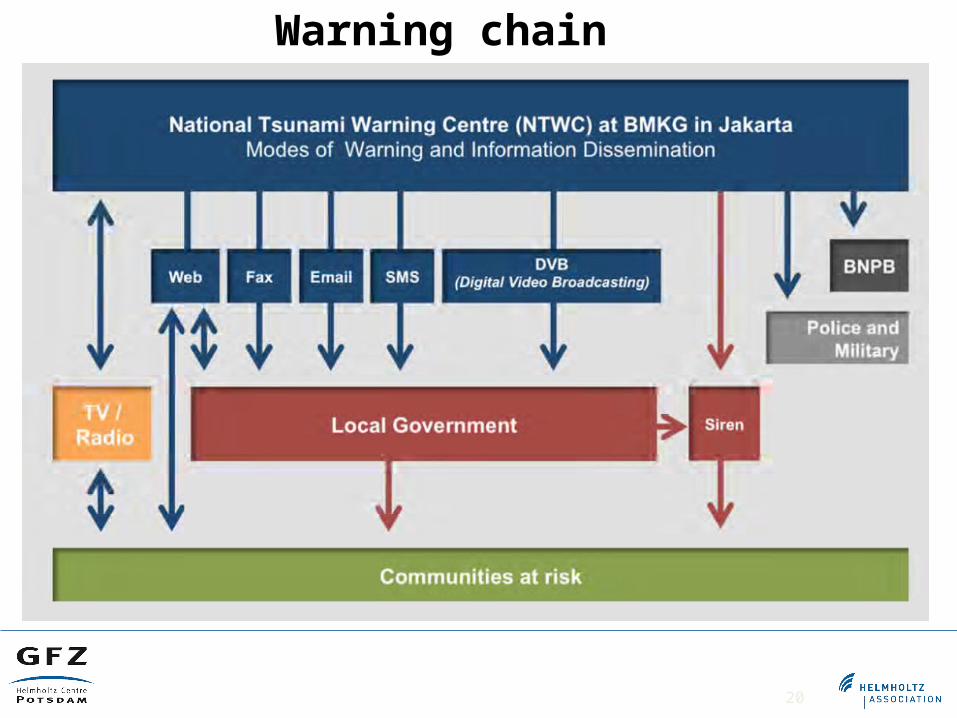
Warning chain
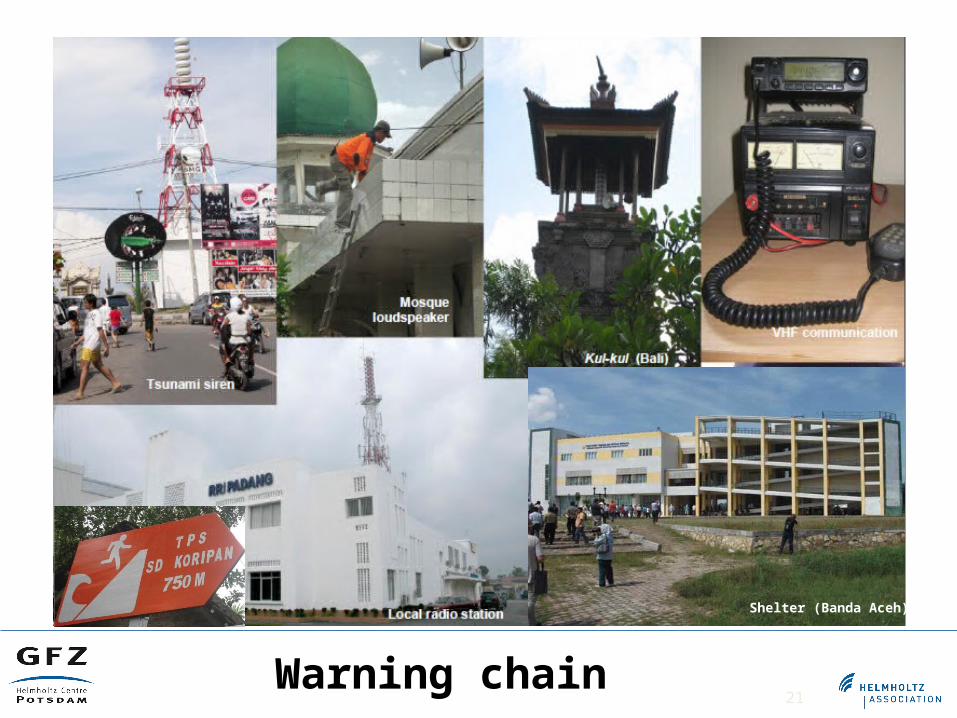
21Warning chain
Shelter (Banda Aceh)
22
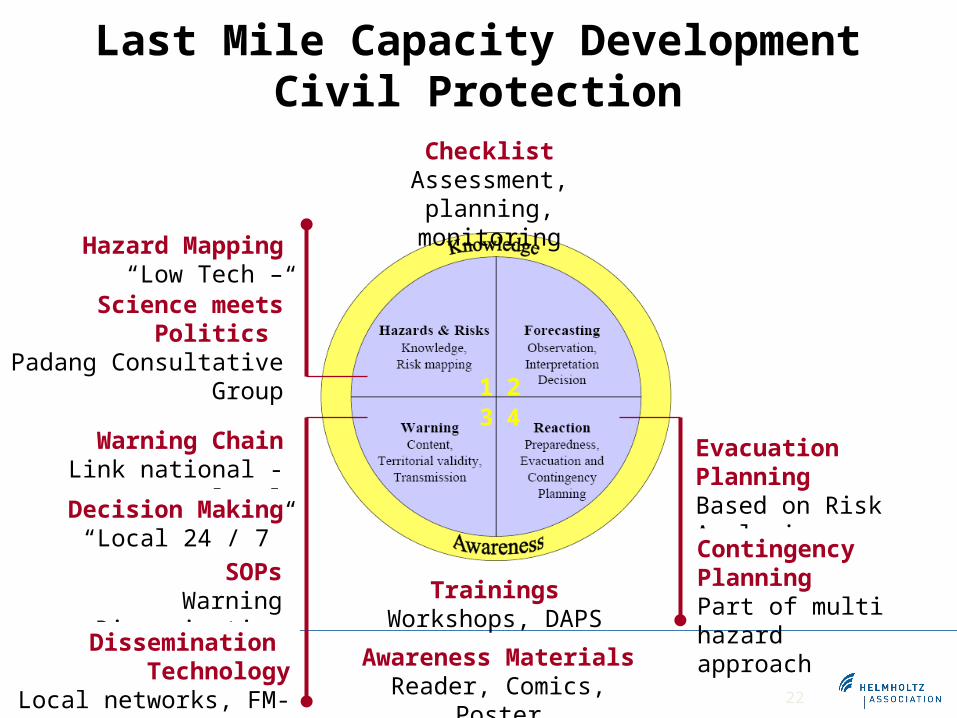
Hazard Mapping“Low Tech – Method”
Science meets Politics Padang Consultative
Group
Warning ChainLink national - local
Decision Making“Local 24 / 7”
SOPsWarning Dissemination
Dissemination Technology
Local networks, FM-RDS
Evacuation PlanningBased on Risk Analysis
Awareness MaterialsReader, Comics, Poster
TrainingsWorkshops, DAPS
ChecklistAssessment, planning,
monitoring
1 23 4
Contingency PlanningPart of multi hazard approach
Last Mile Capacity DevelopmentCivil Protection
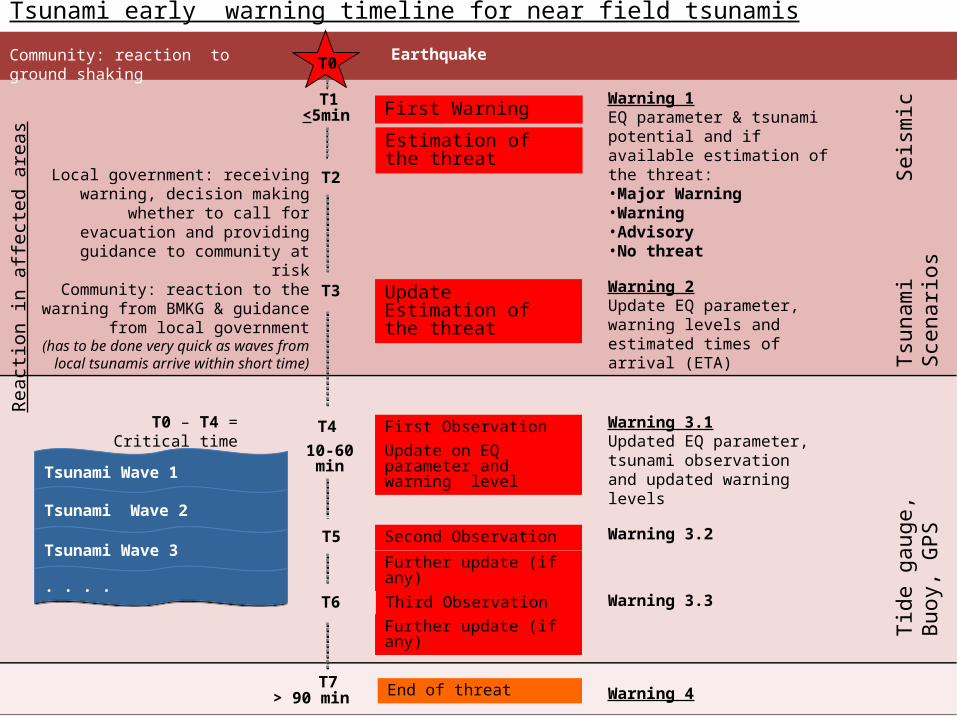
Tsunami early warning timeline for near field tsunamis
T1
T2
T5
T4
T7
T3
<5min
10-60 min
> 90 min
T6
T0
Local government: receiving warning, decision making whether to call for
evacuation and providing guidance to community at risk
Community: reaction to the warning from BMKG & guidance from local
government(has to be done very quick as waves from
local tsunamis arrive within short time)
Reac
tion
in a
ffect
ed a
reas
Community: reaction to ground shaking Earthquake
First Warning
Estimation of the threat
Warning 1EQ parameter & tsunami potential and if available estimation of the threat: •Major Warning•Warning•Advisory•No threat
Warning 2Update EQ parameter, warning levels and estimated times of arrival (ETA)
Tsun
ami S
cena
rios
Update Estimation of the threat
First Observation
End of threat
Second Observation
Further update (if any)
Third Observation
Warning 3.1Updated EQ parameter, tsunami observation and updated warning levels
Warning 3.2
Warning 3.3
Warning 4
Tide
gau
ge, B
uoy,
GPS
T0 – T4 = Critical time
Further update (if any)
Tsunami Wave 1Tsunami Wave 1
Tsunami Wave 2Tsunami Wave 2
Tsunami Wave 3Tsunami Wave 3
. . . . . . . .
Seis
mic
Update on EQ parameter and warning level
24
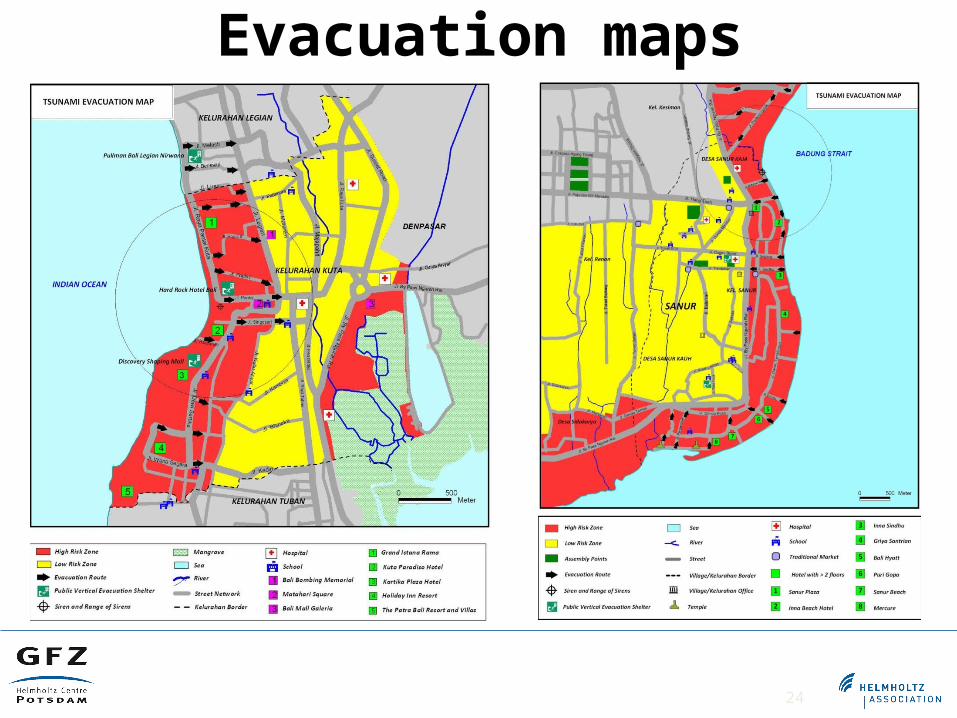
Evacuation maps
25
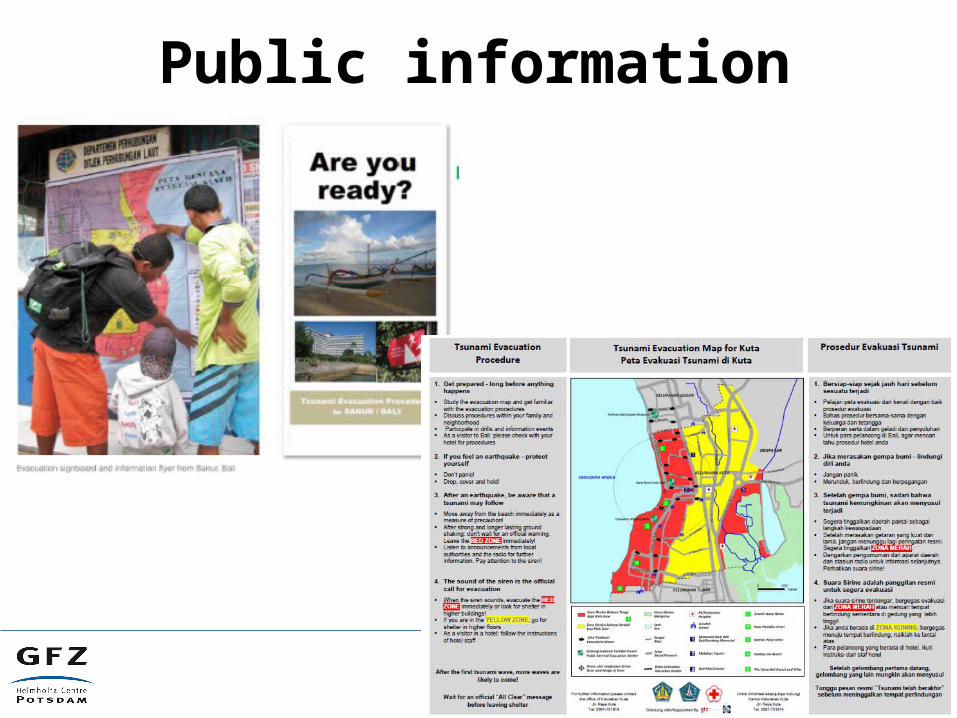
Public information
26
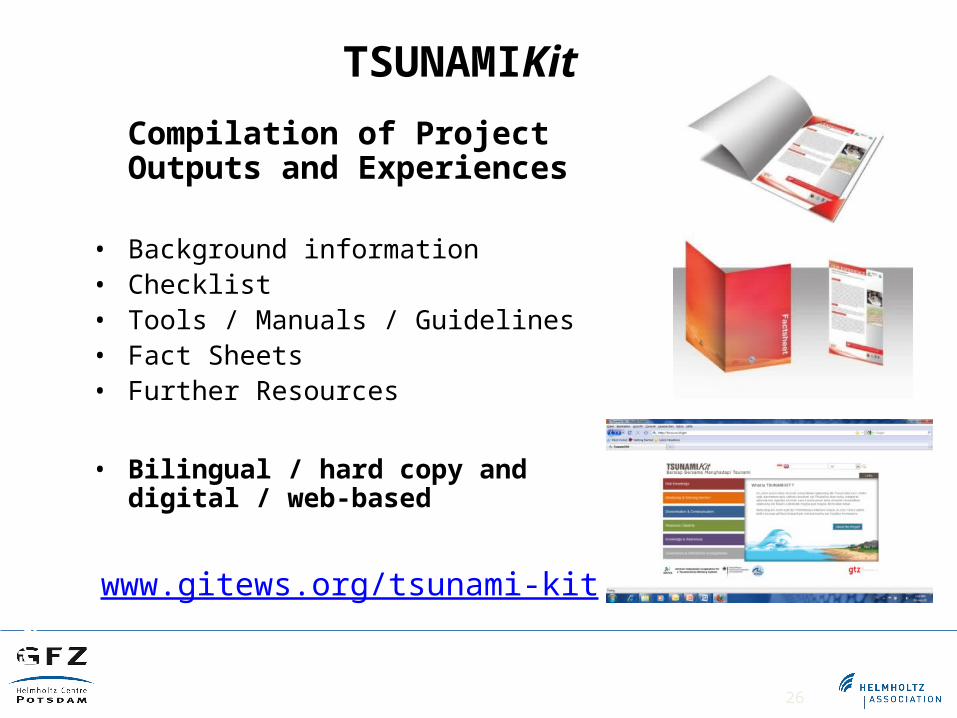
Compilation of Project Outputs and Experiences
• Background information• Checklist• Tools / Manuals / Guidelines• Fact Sheets• Further Resources
• Bilingual / hard copy and digital / web-based
www.gitews.org/tsunami-kit
Th
e P
roje
ct
Docu
men
tati
on
TSUNAMIKit
27
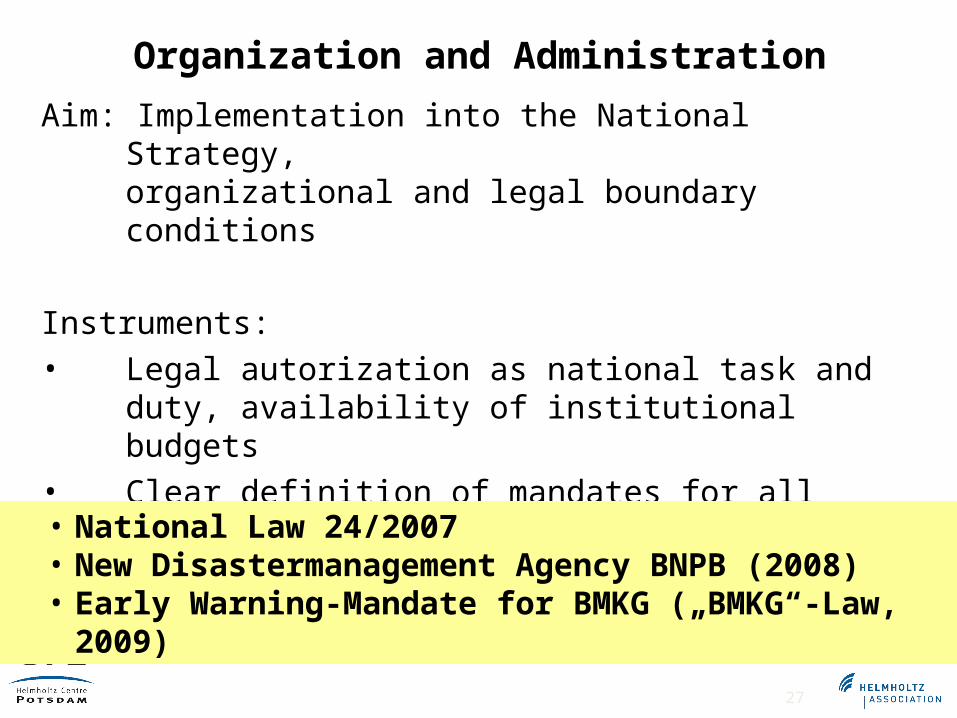
Aim: Implementation into the National Strategy,organizational and legal boundary conditions
Instruments:• Legal autorization as national task and duty,
availability of institutional budgets• Clear definition of mandates for all agencies,
institutions and bodies: national, governmental level, local
• National Law 24/2007• New Disastermanagement Agency BNPB (2008)• Early Warning-Mandate for BMKG („BMKG“-Law, 2009)
Organization and Administration
28
Conclusion
Tsunami Early warning improved remarkably in many regions
GPS improves the information situation in the early stage after an Earth quake for near field cases
There is still a long way to go to improve Early warning• More relevant information needed in the early stage after an
Earth quake especially in the near field case: GPS, near real time inversion for slip distribution
• Risk assessment including preparedness of local communities