Embed Size (px)
Citation preview
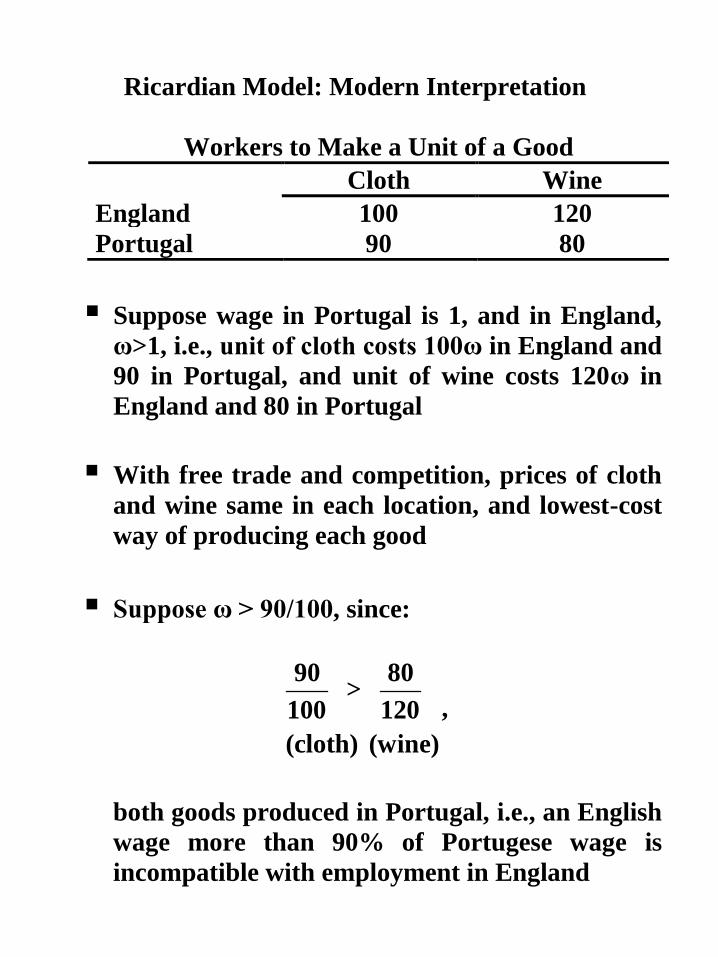
Ricardian Model: Modern Interpretation
Workers to Make a Unit of a Good
Cloth Wine
England 100 120
Portugal 90 80
Suppose wage in Portugal is 1, and in England,
ω>1, i.e., unit of cloth costs 100ω in England and
90 in Portugal, and unit of wine costs 120ω in
England and 80 in Portugal
With free trade and competition, prices of cloth
and wine same in each location, and lowest-cost
way of producing each good
Suppose ω > 90/100, since:
90 80 >
100 120
(cloth) (wine)
,
both goods produced in Portugal, i.e., an English
wage more than 90% of Portugese wage is
incompatible with employment in England
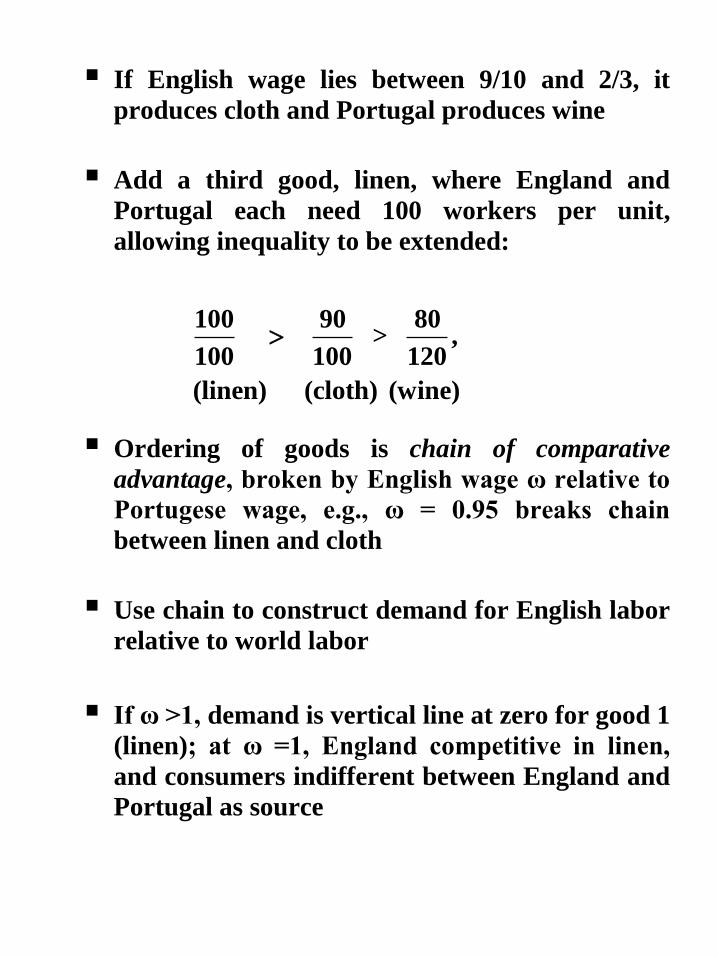
If English wage lies between 9/10 and 2/3, it
produces cloth and Portugal produces wine
Add a third good, linen, where England and
Portugal each need 100 workers per unit,
allowing inequality to be extended:
100 90 80 > ,
100 100 120
(linen) (cloth) (wine)
Ordering of goods is chain of comparative
advantage, broken by English wage ω relative to
Portugese wage, e.g., ω = 0.95 breaks chain
between linen and cloth
Use chain to construct demand for English labor
relative to world labor
If ω >1, demand is vertical line at zero for good 1
(linen); at ω =1, England competitive in linen,
and consumers indifferent between England and
Portugal as source
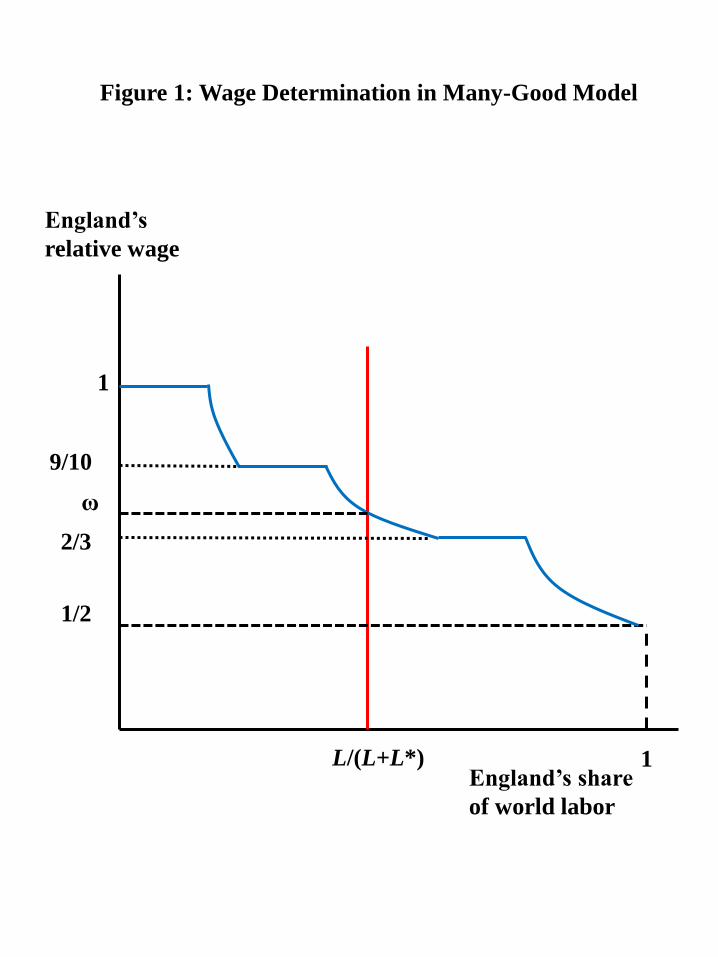
Demand for English labor flat (perfectly elastic)
between zero, until demand for linen saturated at
price of 100
Decline in ω results in England being sole supplier
of linen – as price is 100ω, fall in ω lowers price of
linen, increasing demand and hence demand for
English labor
Once ω=0.9, England becomes competitive in
cloth, and demand curve for labor is flat again,
buyers of cloth being indifferent between England
and Portugal as supplier
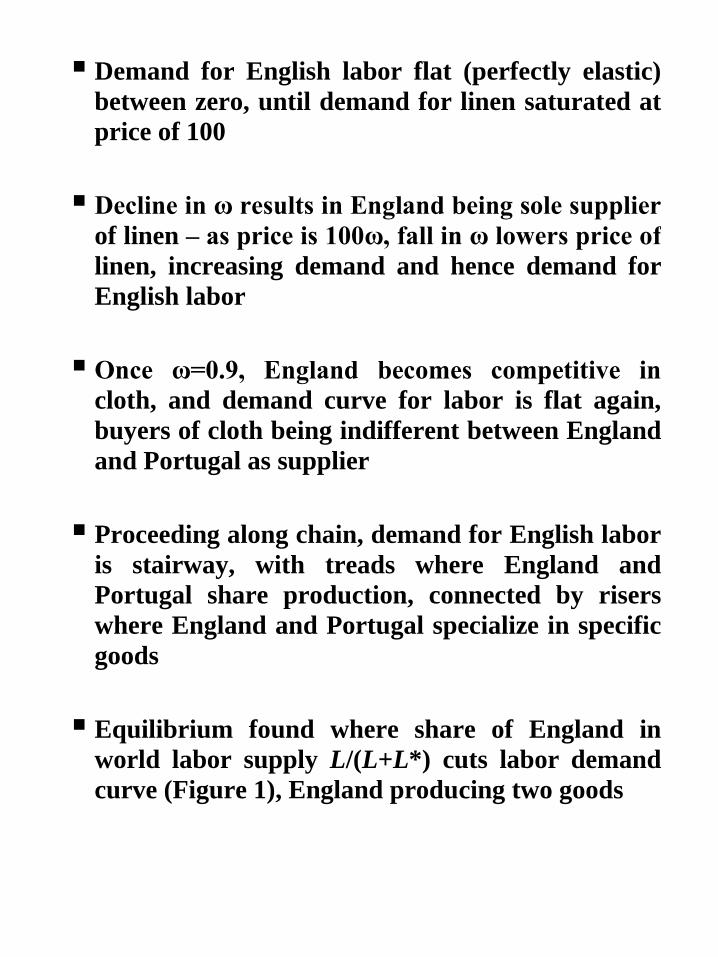
Proceeding along chain, demand for English labor
is stairway, with treads where England and
Portugal share production, connected by risers
where England and Portugal specialize in specific
goods
Equilibrium found where share of England in
world labor supply L/(L+L*) cuts labor demand
curve (Figure 1), England producing two goods
ω
1
9/10
2/3
1/2
England’s
relative wage
England’s share
of world labor
L/(L+L*)
Figure 1: Wage Determination in Many-Good Model
1
Along a riser, drop in ω raises demand for English
goods at intensive margin, i.e., all English goods
sold at lower prices; when ω hits tread, trade
expands at extensive margin, i.e., England sells
more goods
Given technologies of constant returns, having
larger share of labor force, country may have to
lower its wage, i.e., either sell more of its goods or
sell wider range of goods
Dornbusch, Fischer and Samuelson (1977) made
establishing equilibrium easier by making chain of
comparative advantage a continuum
Assumed set of goods correspond to all points on
interval between 0 and 1, goods being sorted to
form chain of comparative advantage
England has strongest comparative advantage in
goods near to 0, Portugal having strongest
comparative advantage in goods near to 1
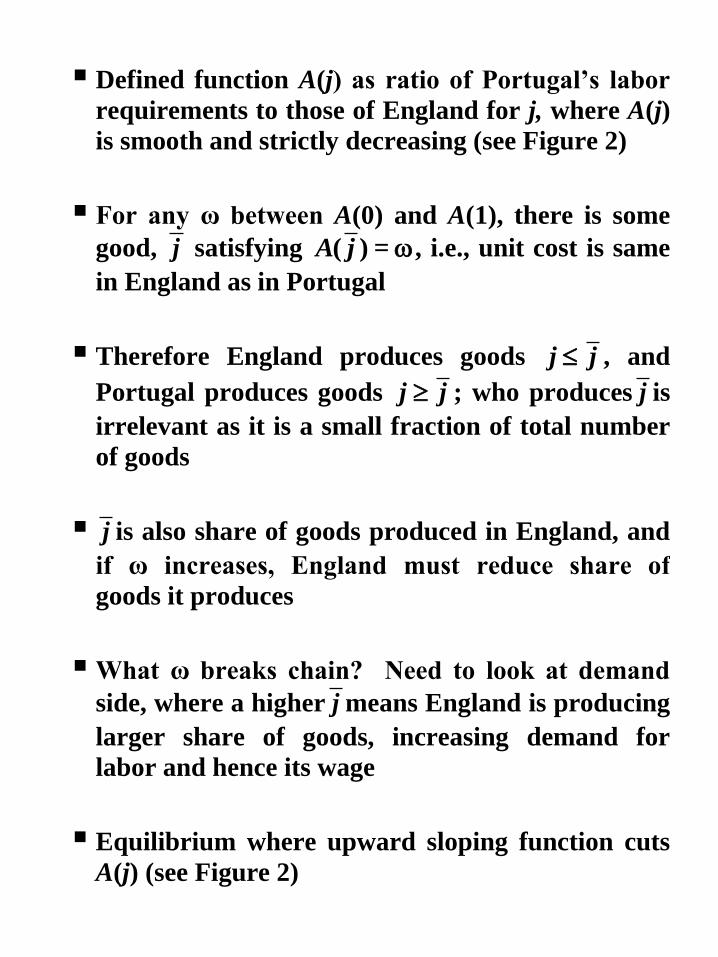
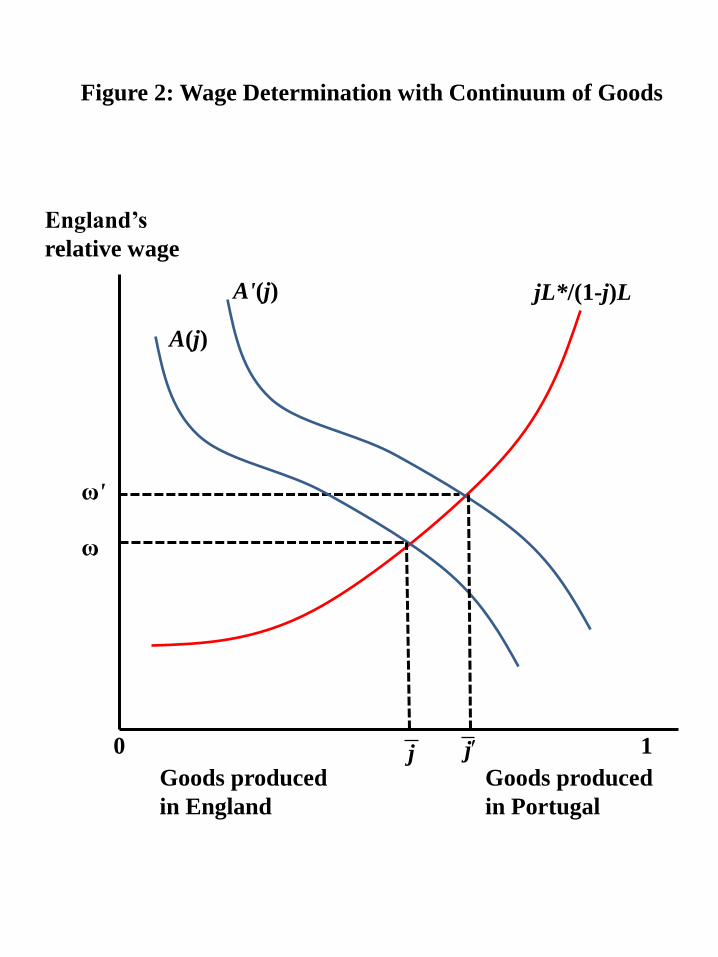
Defined function A(j) as ratio of Portugal’s labor
requirements to those of England for j, where A(j)
is smooth and strictly decreasing (see Figure 2)
For any ω between A(0) and A(1), there is some
good, j satisfying ( ) =A j , i.e., unit cost is same
in England as in Portugal
Therefore England produces goods j j , and
Portugal produces goods j j ; who produces j is
irrelevant as it is a small fraction of total number
of goods
j is also share of goods produced in England, and
if ω increases, England must reduce share of
goods it produces
What ω breaks chain? Need to look at demand
side, where a higher j means England is producing
larger share of goods, increasing demand for
labor and hence its wage
Equilibrium where upward sloping function cuts
A(j) (see Figure 2)
ω
England’s
relative wage
Goods produced
in England
jL*/(1-j)L
Figure 2: Wage Determination with Continuum of Goods
1
ω'
A'(j)
A(j)
0
Goods produced
in Portugal
j j
Assume tastes such that consumers spread
spending evenly across goods – share of goods
produced in England becomes share of spending
on English goods
Labor market equilibrium requires full
employment of workers in England at Portugal at
ω, with English workers paid fraction j of world
income, i.e., ( )L = j L+ L*
A uniform increase in English productivity results
in England getting relatively more productive in
making every good, raising ω and expanding
share of goods it produces
Suppose iceberg transport costs d are introduced,
where d > 1, implying goods get destroyed in
transit, and d affects all goods
Creates range of non-traded goods, as each
country can make them more cheaply itself, but
still a range of goods near 0 that England trades,
and range near 1 that Portugal trades
With I countries, define labor requirement to
produce good j in country i as ai(j), realization of
random draw from probability distribution
(Eaton and Kortum, 2002)
Probability labor requirement a for producing
good j in country i less than positive number x
forms Weibull distribution:
θ
-( )Pr[ ( ) ] = 1- iA x
ia j x e
where Ai captures country’s absolute advantage,
and θ captures comparative advantage
Country that has accumulated more technology
will have higher Ai, and if common θ imposed
across countries, see how technologies around
world interact via trade
With I countries, trade costs d vary with country
pairs, i.e., cost of delivering unit of good j is 1nid
from country i, where = 1iid
Can capture idea that trade costs fall with shorter
distances between countries – “gravity” effect
Cost of producing good j in i and delivering it to n
is ( ) ( )ni i i nic j = a j w d
With wages and costs the same across all goods in
country i, ( )nic j has same distribution as ( )ia j ,
with Ai replaced by Ani = Ai/(widni) – effect of raw
efficiency on cost distribution offset by a higher
wage and transport costs
Competition guarantees pn(j) of good j in country
n is lowest cost cn(j) looking across all potential
sources
Hence, distribution of price of good j in n has
same distribution as costs cn(j), where pn(j) is
minimum price of j across all potential sources I
niπ is probability i is lowest cost supplier of good in
country n, where probability falls with transport
costs dni, and wages adjusted for absolute
advantage
With continuum of goods, niπ is share of goods in n
supplied by i, and also fraction of n’s spending on
goods from i
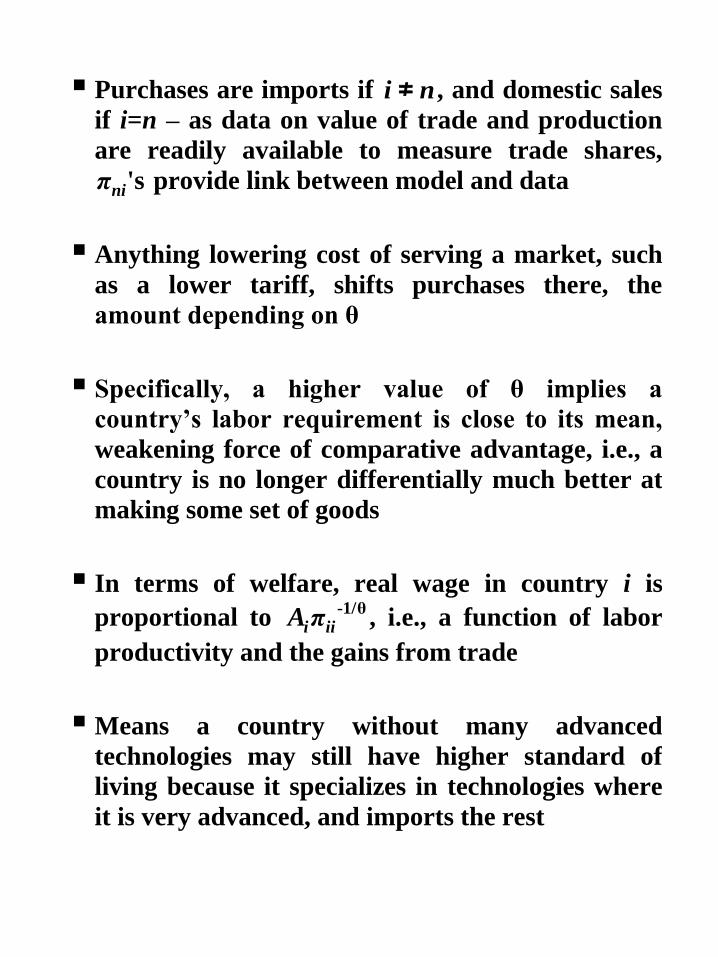
Purchases are imports if ≠i n , and domestic sales
if i=n – as data on value of trade and production
are readily available to measure trade shares,
'sniπ provide link between model and data
Anything lowering cost of serving a market, such
as a lower tariff, shifts purchases there, the
amount depending on θ
Specifically, a higher value of θ implies a
country’s labor requirement is close to its mean,
weakening force of comparative advantage, i.e., a
country is no longer differentially much better at
making some set of goods
In terms of welfare, real wage in country i is
proportional to -1/θ
i iiA π , i.e., a function of labor
productivity and the gains from trade
Means a country without many advanced
technologies may still have higher standard of
living because it specializes in technologies where
it is very advanced, and imports the rest
Of course, home shares depend on relative wages,
relative wages increasing in relative
productivities, and declining in relative labor
endowments
Eaton and Kortum (2012) fit model using OECD
data and values for key parameters, calculating:
(i)gains from trade, (ii) impact of falling trade
costs, and (iii) benefits of technological
improvements in trading partners
Table 1 reports home share of spending ( iiπ ) for
25 countries:
(i) Home share larger than share of global GDP –
trade barriers chopping up markets
(ii) Home share declined substantially between 1996
and 2006, reflecting globalization
(iii) Gains from trade substantial, and will continue
if trade costs fall further
(iv) In making US 10% more productive: US relative
wages rise 30%, and real wage rises in rest of
world by 1.6%
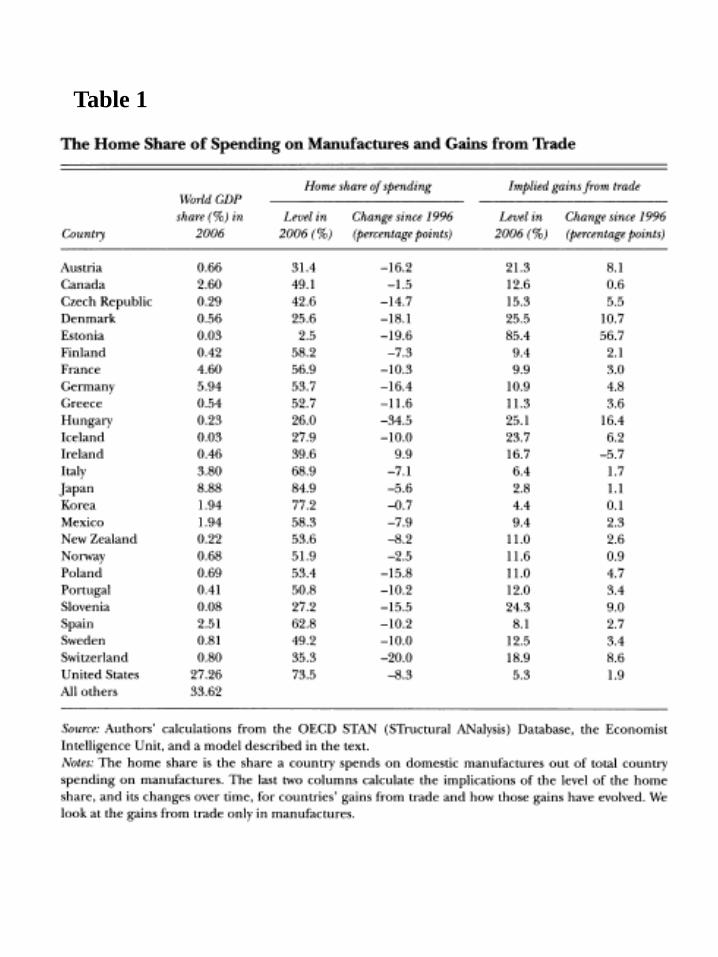
Table 1