Embed Size (px)
Citation preview
© 2
001
McG
raw
-Hill
Co
mp
anie
s
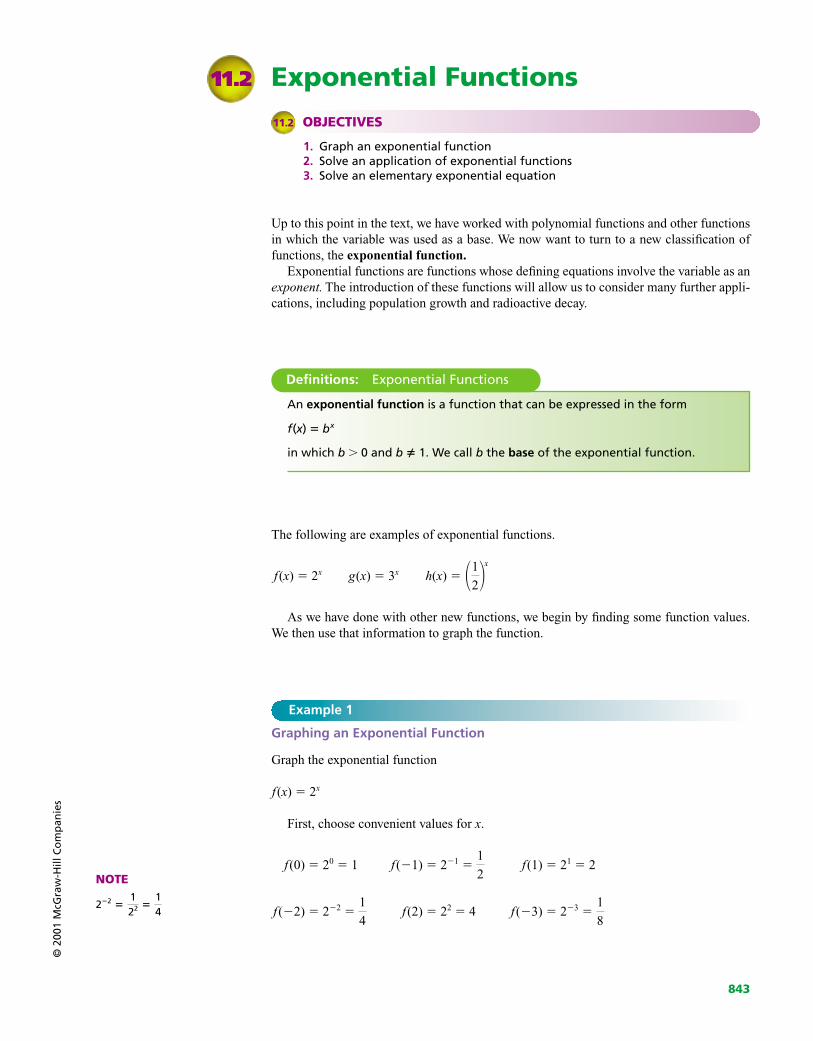
Exponential Functions11.2
843
11.2 OBJECTIVES
1. Graph an exponential function 2. Solve an application of exponential functions3. Solve an elementary exponential equation
Up to this point in the text, we have worked with polynomial functions and other functionsin which the variable was used as a base. We now want to turn to a new classification offunctions, the exponential function.
Exponential functions are functions whose defining equations involve the variable as anexponent. The introduction of these functions will allow us to consider many further appli-cations, including population growth and radioactive decay.
The following are examples of exponential functions.
f(x) � 2x g(x) � 3x h(x) �
As we have done with other new functions, we begin by finding some function values.We then use that information to graph the function.
�1
2 x
Graphing an Exponential Function
Graph the exponential function
f(x) � 2x
First, choose convenient values for x.
f(0) � 20 � 1 f(�1) � 2�1 � f(1) � 21 � 2
f(�2) � 2�2 � f(2) � 22 � 4 f(�3) � 2�3 �1
8
1
4
1
2
An exponential function is a function that can be expressed in the form
f(x) � bx
in which b � 0 and b � 1. We call b the base of the exponential function.
Definitions: Exponential Functions
NOTE
2�2 �122 �
14
Example 1
844 CHAPTER 11 EXPONENTIAL AND LOGARITHMIC FUNCTIONS
© 2
001
McG
raw
-Hill
Co
mp
anie
s
Graphing an Exponential Function
Graph the exponential function
f(x) �
First, choose convenient values for x.
f(0) � � 1 f(�1) � � 2 f(1) � �
f(�2) � � 4 f(2) � � f(�3) � � 8
f(3) � �1
8�1
2 3
�1
2 �31
4�1
2 2
�1
2 �2
1
2�1
2 1
�1
2 �1
�1
2 0
�1
2 x
Example 2
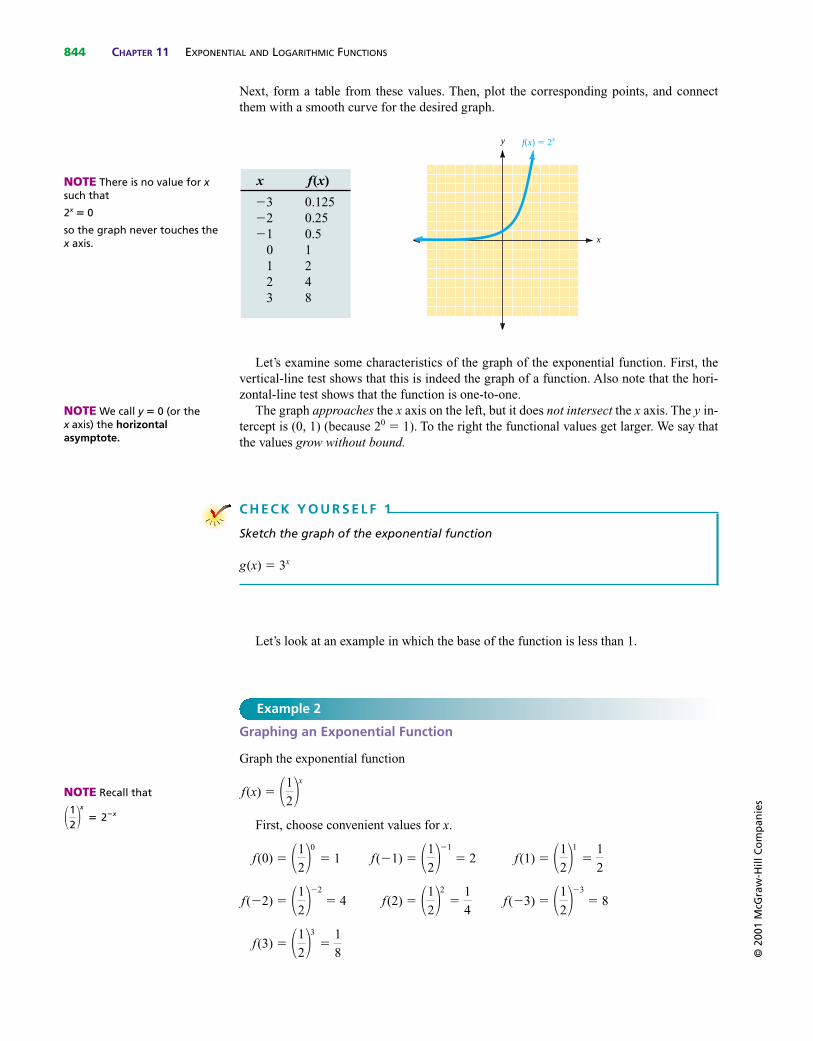
Next, form a table from these values. Then, plot the corresponding points, and connectthem with a smooth curve for the desired graph.
Let’s examine some characteristics of the graph of the exponential function. First, thevertical-line test shows that this is indeed the graph of a function. Also note that the hori-zontal-line test shows that the function is one-to-one.
The graph approaches the x axis on the left, but it does not intersect the x axis. The y in-tercept is (0, 1) (because 20 � 1). To the right the functional values get larger. We say thatthe values grow without bound.
f(x) � 2xy
x
x f(x)
�3 0.125�2 0.25�1 0.5
0 11 22 43 8
C H E C K Y O U R S E L F 1
Sketch the graph of the exponential function
g(x) � 3x
Let’s look at an example in which the base of the function is less than 1.
NOTE Recall that
�12
x
� 2�x
NOTE There is no value for xsuch that
2x � 0
so the graph never touches thex axis.
NOTE We call y � 0 (or thex axis) the horizontalasymptote.
EXPONENTIAL FUNCTIONS SECTION 11.2 845©
200
1 M
cGra
w-H
ill C
om
pan
ies
NOTE Again, by the vertical-and horizontal-line tests, this isthe graph of a one-to-onefunction.
NOTE The base of a growthfunction is greater than 1.
NOTE The base of a decayfunction is less than 1 butgreater than 0.
The following algorithm summarizes our work thus far in this section.
C H E C K Y O U R S E L F 2
Sketch the graph of the exponential function
g(x) � �1
3 x
Step 1 Establish a table of values by considering the function in the formy � bx.
Step 2 Plot points from that table of values and connect them with a smoothcurve to form the graph.
Step 3 If b � 1, the graph increases from left to right. If 0 b 1, the graphdecreases from left to right.
Step 4 All graphs will have the following in common:(a) The y intercept will be (0, 1).(b) The graphs will approach, but not touch, the x axis.(c) The graphs will represent one-to-one functions.
Step by Step: Graphing an Exponential Function
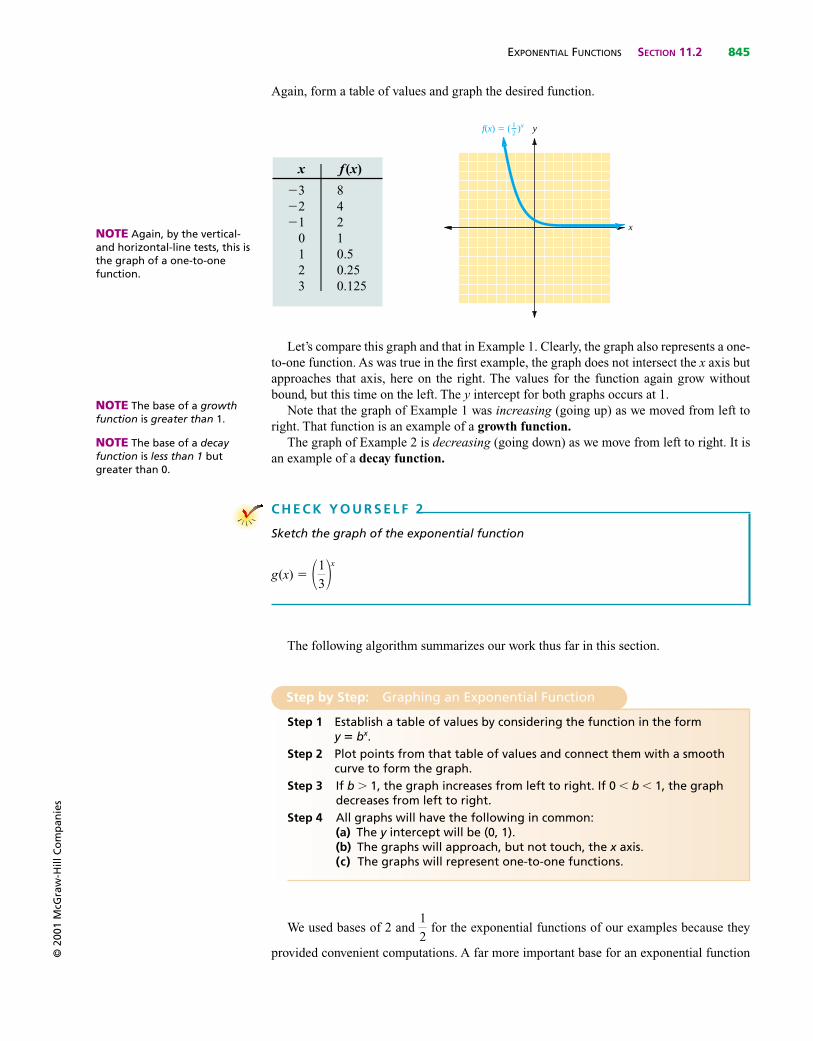
Again, form a table of values and graph the desired function.
Let’s compare this graph and that in Example 1. Clearly, the graph also represents a one-to-one function. As was true in the first example, the graph does not intersect the x axis butapproaches that axis, here on the right. The values for the function again grow withoutbound, but this time on the left. The y intercept for both graphs occurs at 1.
Note that the graph of Example 1 was increasing (going up) as we moved from left toright. That function is an example of a growth function.
The graph of Example 2 is decreasing (going down) as we move from left to right. It isan example of a decay function.
f(x) � ( )x21 y
x
x f(x)
�3 8�2 4�1 2
0 11 0.52 0.253 0.125
We used bases of 2 and for the exponential functions of our examples because they
provided convenient computations. A far more important base for an exponential function
1
2
846 CHAPTER 11 EXPONENTIAL AND LOGARITHMIC FUNCTIONS
© 2
001
McG
raw
-Hill
Co
mp
anie
s
A Population Application
(a) Suppose that the population of a city is presently 20,000 and that the population isexpected to grow at a rate of 5% per year. The equation
P(t) � 20,000e(0.05)t
gives the town’s population after t years. Find the population in 5 years.Let t � 5 in the original equation to obtain
P(5) � 20,000e(0.05)(5) � 25,681
which is the population expected 5 years from now.
(b) Suppose $1000 is invested at an annual rate of 8%, compounded continuously. Theequation
A(t) � 1000e0.08t
gives the amount in the account after t years. Find the amount in the account after 9 years.Let t � 9 in the original equation to obtain
A(9) � 1000e(0.08)(9) � 2054
which is the amount in the account after 9 years.
Example 3
NOTE Be certain that youenclose the multiplication(0.05 � 5) in parentheses or thecalculator will misinterpret yourintended order of operation.
NOTE Continuouscompounding will give thehighest accumulation ofinterest at any rate. However,daily compounding will result inan amount of interest that isonly slightly less.
NOTE Note that in 9 years theamount in the account is a littlemore than double the originalprincipal.
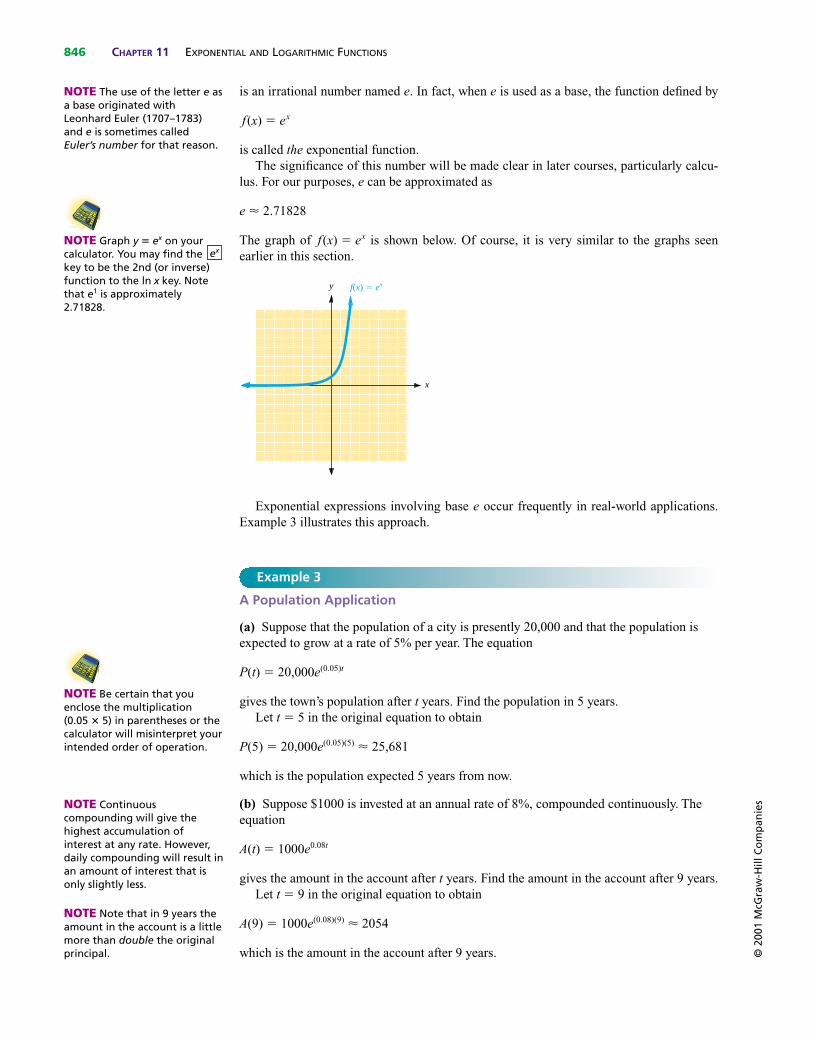
is an irrational number named e. In fact, when e is used as a base, the function defined by
f(x) � ex
is called the exponential function.The significance of this number will be made clear in later courses, particularly calcu-
lus. For our purposes, e can be approximated as
e � 2.71828
The graph of f(x) � ex is shown below. Of course, it is very similar to the graphs seenearlier in this section.
Exponential expressions involving base e occur frequently in real-world applications.Example 3 illustrates this approach.
f(x) � exy
x
NOTE The use of the letter e asa base originated withLeonhard Euler (1707–1783)and e is sometimes calledEuler’s number for that reason.
NOTE Graph y � ex on yourcalculator. You may find the key to be the 2nd (or inverse)function to the ln x key. Notethat e1 is approximately2.71828.
ex
EXPONENTIAL FUNCTIONS SECTION 11.2 847©
200
1 M
cGra
w-H
ill C
om
pan
ies
C H E C K Y O U R S E L F 3
If $1000 is invested at an annual rate of 6%, compounded continuously, then theequation for the amount in the account after t years is
A(t) � 1000e0.06t
Use your calculator to find the amount in the account after 12 years.
As we observed in this section, the exponential function is always one-to-one. Thisyields an important property that can be used to solve certain types of equations involvingexponents.
If b � 0 and b � 1, then
bm � bn if and only if m � n (1)
in which m and n are any real numbers.
Rules and Properties: Exponential Property
Solving an Exponential Equation
(a) Solve 2x � 8 for x.
We recognize that 8 is a power of 2, and we can write the equation as
2x � 23 Write with equal bases.
Applying property (1), we have
x � 3 Set exponents equal.
and 3 is the solution.
(b) Solve 32x � 81 for x.
Because 81 � 34, we can write
32x � 34
2x � 4
x � 2
We see that 2 is the solution for the equation.
(c) Solve 2x�1 � for x.
Again, we write as a power of 2, so that
2x�1 � 2�4
1
16
1
16
Example 4
NOTE The answer can easily bechecked by substitution. Lettingx � 2 gives
32(2) � 34 � 81
NOTE116
�124 � 2�4
The usefulness of this property is illustrated in Example 4.
848 CHAPTER 11 EXPONENTIAL AND LOGARITHMIC FUNCTIONS
© 2
001
McG
raw
-Hill
Co
mp
anie
s
C H E C K Y O U R S E L F A N S W E R S
1. y � g(x) � 3x 2.
3. $2054.43 4. (a) �4�; (b) �2�; (c) ��2�
y
x
y
x
y � �1
3 x
NOTE To verify the solution.
2�5�1 � 2�4
2�4 � 2�4
116
�116
C H E C K Y O U R S E L F 4
Solve each of the following equations for x.
(a) 2x � 16 (b) 4x�1 � 64 (c) 32x �1
81
Then
x � 1 � �4
x � �5
The solution is �5.
© 2
001
McG
raw
-Hill
Co
mp
anie
s
Exercises
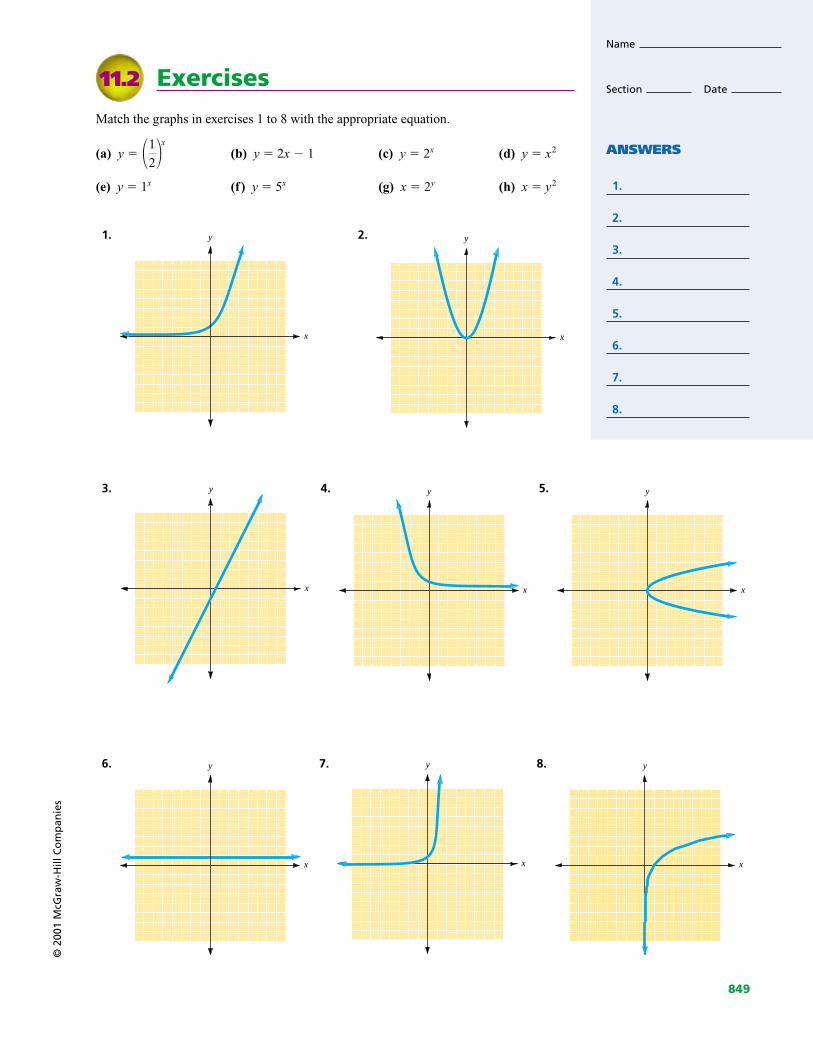
Match the graphs in exercises 1 to 8 with the appropriate equation.
(a) y � (b) y � 2x � 1 (c) y � 2x (d) y � x2
(e) y � 1x (f) y � 5x (g) x � 2y (h) x � y2
1. 2. y
x
y
x
�1
2 x
11.2
Name
Section Date
ANSWERS
1.
2.
3.
4.
5.
6.
7.
8.
849
3. 4. 5.
6. 7. 8.
x
yy
x
y
x
y
x
y
x
y
x
© 2
001
McG
raw
-Hill
Co
mp
anie
s
In exercises 9 to 12, let f(x) � 4x and find each of the following.
9. f(0) 10. f(1)
11. f(2) 12. f(�2)
In exercises 13 to 16, let g(x) � 4x�1 and find each of the following.
13. g(0) 14. g(1)
15. g(2) 16. g(�2)
In exercises 17 to 20, let h(x) � 4x � 1 and find each of the following.
17. h(0) 18. h(1)
19. h(2) 20. h(�2)
In exercises 21 to 24, let f(x) � and find each of the following.
21. f(1) 22. f(�1)
23. f(�2) 24. f(2)
In exercises 25 to 36, graph each exponential function.
25. y � 4x 26. y �
y
x
y
x
�1
4 x
�1
4 x
ANSWERS
9.
10.
11.
12.
13.
14.
15.
16.
17.
18.
19.
20.
21.
22.
23.
24.
25.
26.
850
27. y � 28. y �
29. y � 3 2x 30. y � 2 3x
31. y � 3x 32. y � 2x�1
x
yy
x
y
x
y
x
y
x
y
x
�3
2 x
�2
3 x
© 2
001
McG
raw
-Hill
Co
mp
anie
sANSWERS
27.
28.
29.
30.
31.
32.
851
© 2
001
McG
raw
-Hill
Co
mp
anie
s
33. y � 22x 34. y �
35. y � e�x 36. y � e2x
In exercises 37 to 48, solve each exponential equation for x.
37. 2x � 32 38. 4x � 64 39. 10x � 10,000 40. 5x � 125
41. 3x � 42. 2x � 43. 22x � 64 44. 32x � 81
45. 2x�1 � 64 46. 4x�1 � 16 47. 3x�1 � 48. 2x�2 �
Suppose it takes 1 h for a certain bacterial culture to double by dividing in half. If thereare 100 bacteria in the culture to start, then the number of bacteria in the culture after xhours is given by N(x) � 100 2x. In exercises 49 to 51, use this function to find each ofthe following.
49. The number of bacteria in the culture 50. The number of bacteria in the cultureafter 2 h. after 3 h.
51. The number of bacteria in the cultureafter 5 h.
1
8
1
27
1
16
1
9
y
x
y
x
y
xx
y
�1
2 2x
ANSWERS
33.
34.
35.
36.
37.
38.
39.
40.
41.
42.
43.
44.
45.
46.
47.
48.
49.
50.
51.
852
52. Graph the relationship between the number of bacteria in the culture and the numberof hours. Be sure to choose an appropriate scale for the N axis.
The half-life of radium is 1690 years. That is, after a 1690-year period, one-half of theoriginal amount of radium will have decayed into another substance. If the originalamount of radium is 64 grams (g), the formula relating the amount of radium left aftertime t is given by R(t) � 64 2�t�1690. In exercises 53 to 55, use that formula to find eachof the following.
53. The amount of radium left after 54. The amount of radium left after1690 years. 3380 years.
55. The amount of radium left after5070 years.
56. Graph the relationship between the amount of radium remaining and time. Be sure touse appropriate scales for the R and t axes.
If $1000 is invested in a savings account with an interest rate of 8%, compoundedannually, the amount in the account after t years is given by A(t) � 1000(1 � 0.08)t.In exercises 57 to 59, use a calculator to find each of the following.
57. The amount in the account after 58. The amount in the account after2 years. 5 years.
R
t
N
x
© 2
001
McG
raw
-Hill
Co
mp
anie
sANSWERS
52.
53.
54.
55.
56.
57.
58.
853
© 2
001
McG
raw
-Hill
Co
mp
anie
s
59. The amount in the account after 9 years.
60. Graph the relationship between the amount in the account and time. Be sure to chooseappropriate scales for the A and t axes.
The so-called learning curve in psychology applies to learning a skill, such as typing, inwhich the performance level progresses rapidly at first and then levels off with time.You can approximate N, the number of words per minute that a person can type aftert weeks of training, with the equation N � 80(1 � e�0.06t). Use a calculator to find thefollowing.
61. (a) N after 10 weeks, (b) N after 20 weeks, (c) N after 30 weeks.
62. Graph the relationship between the number of words per minute N and the number ofweeks of training t.
63. Find two different calculators that have keys. Describe how to use the function oneach of the calculators.
64. Are there any values of x for which ex produces an exact answer on the calculator?Why are other answers not exact?
ex
N
t
A
t
ANSWERS
59.
60.
61.
62.
63.
64.
854
A possible calculator sequence for evaluating the expression
in which n � 10 is
1 1 10 10
In exercises 65 to 69, use that sequence to find for the following values of n.
65. n � 100 66. n � 1000 67. n � 10,000
68. n � 100,000 69. n � 1,000,000
70. What did you observe from the experiment above?
71. Graph the exponential function defined by y � 2x.
72. Graph the function defined by x � 2y on the same set of axes as the previous graph.What do you observe? Hint: To graph x � 2y, choose convenient values for y andthen find the corresponding values for x.
y
x
y
x
�1 �1
n n
��)��(
�1 �1
n n
© 2
001
McG
raw
-Hill
Co
mp
anie
sANSWERS
65.
66.
67.
68.
69.
70.
71.
72.
855
© 2
001
McG
raw
-Hill
Co
mp
anie
s
Answers1. (c) 3. (b) 5. (h) 7. (f) 9. 1 11. 16 13. 4 15. 64
17. 2 19. 17 21. 23. 16
25. y � 4x 27. y �
29. y � 3 2x 31. y � 3x
33. y � 22x 35. y � e�x
37. �5� 39. �4� 41. ��2� 43. �3� 45. �5� 47. ��2�
49. 400 51. 3200 53. 32 g 55. 8 g 57. $1166.40 59. $1999
61. (a) 36; (b) 56; (c) 67 63. 65. 2.7048 67. 2.71815
69. 2.71828 71. See Example 1 for graph of y � 2x.
y � e�x
y
x
y
x
y � 22x
y
x
y � 3xy � 3 2x
y
x
y � ( )x32
y
x
y
x
y � 4x
�2
3 x
1
4
856