Embed Size (px)
Citation preview
8/12/2019 1130 Sun Bank Investors Who Were They Who Are They and What Are They Looking For
http://slidepdf.com/reader/full/1130-sun-bank-investors-who-were-they-who-are-they-and-what-are-they-looking 1/40
Bank Investors: Who Were They, Who AreThey and What Are They Looking For
Lisa Schultz
Managing Director, Equity Capital Markets & Syndicate, U.S.,
Stifel Nicolaus Weisel
11:30 AM - 12:20 AM
Anton Schutz
President & Chief Investment Officer, Mendon Capital Advisors
Corporation and Founder, New Ground Capital
On Demand Passcode: CAMELBACK Twitter Hashtag: #AOBA13Wireless Passcode: AOBA2013
8/12/2019 1130 Sun Bank Investors Who Were They Who Are They and What Are They Looking For
http://slidepdf.com/reader/full/1130-sun-bank-investors-who-were-they-who-are-they-and-what-are-they-looking 2/40
I. Evolution of the Bank Market
II. What Investors Are Currently Looking For
III. Bank Investors Today
IV. Shareholder Activism
V. Positioning For The Future
Presentation Outline
Stifel, Nicolaus & Company, Incorporated and Thomas Weisel Partners LLC are affiliated broker-dealer subsidiaries of StifelFinancial Corp. which are collectively referred to herein under the marketing name Stifel Nicolaus Weisel, representing the firm’sinvestment banking services. This document has been prepared by the investment banking division and is not a product of StifelResearch. The information and statistical data contained herein have been obtained from sources that Stifel Nicolaus Weiselbelieves are reliable, but Stifel Nicolaus Weisel makes no representation or warranty as to the accuracy or completeness of any suchinformation or data and expressly disclaims any and all liability relating to or resulting from your use of these materials. Theinformation and data contained herein are current only as of the date(s) indicated, and Stifel Nicolaus Weisel has no intention,obligation, or duty to update these materials after such date(s). These materials do not constitute an offer to sell or the solicitation ofan offer to buy any securities. Stifel Nicolaus may be a market-maker in certain of these securities, and Stifel Nicolaus Weisel mayhave provided investment banking services to certain of the companies listed herein. Stifel Nicolaus, Thomas Weisel Partners,and/or their respective officers, directors, employees, and affiliates may at any time hold a long or short position in any of thesesecurities and may from time-to-time purchase or sell such securities. These materials may not be distributed without StifelNicolaus Weisel’s prior written consent.
Copyright 2013 Stifel, Nicolaus & Company, Incorporated

8/12/2019 1130 Sun Bank Investors Who Were They Who Are They and What Are They Looking For
http://slidepdf.com/reader/full/1130-sun-bank-investors-who-were-they-who-are-they-and-what-are-they-looking 3/40
I. Evolution of the Bank Market
8/12/2019 1130 Sun Bank Investors Who Were They Who Are They and What Are They Looking For
http://slidepdf.com/reader/full/1130-sun-bank-investors-who-were-they-who-are-they-and-what-are-they-looking 4/40
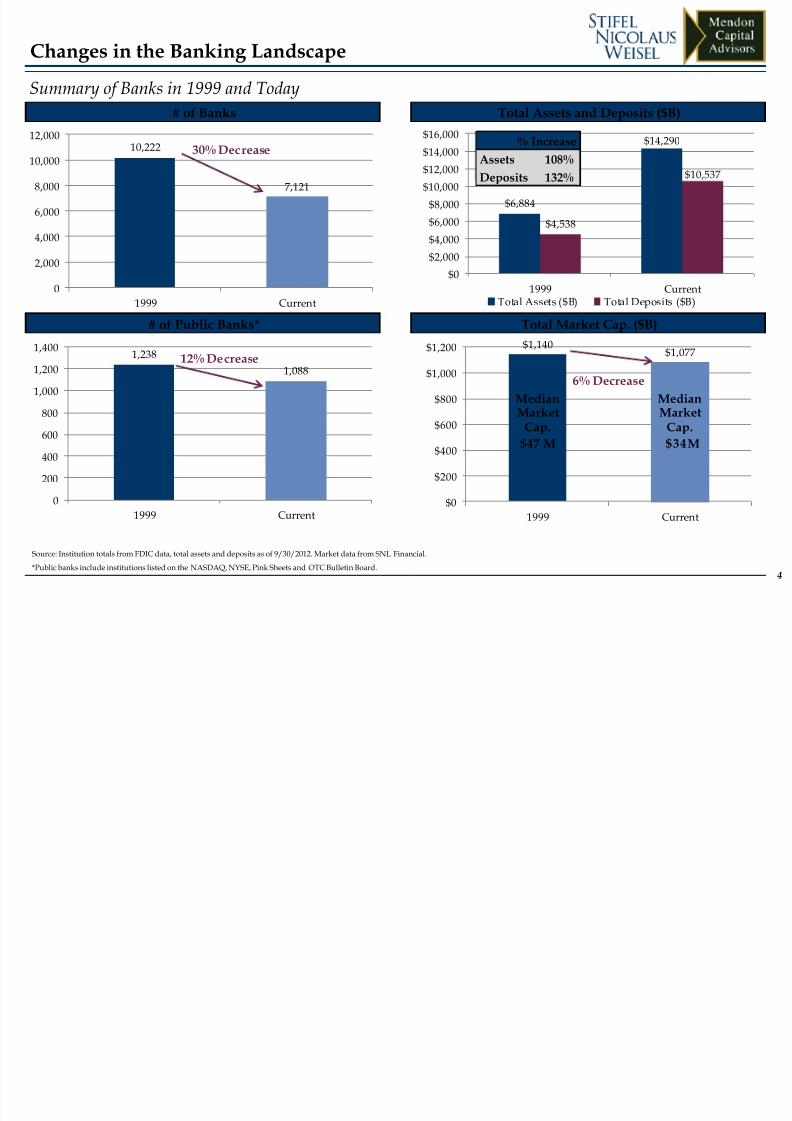
$6,884
$14,290
$4,538
$10,537
$0
$2,000
$4,000
$6,000
$8,000
$10,000
$12,000
$14,000$16,000
1999 CurrentTotal Assets ($B) Total Deposits ($B)
4
Source: Institution totals from FDIC data, total assets and deposits as of 9/30/2012. Market data from SNL Financial.
*Public banks include institutions listed on the NASDAQ, NYSE, Pink Sheets and OTC Bulletin Board.
Summary of Banks in 1999 and Today
Changes in the Banking Landscape
# of Banks Total Assets and Deposits ($B)
# of Public Banks* Total Market Cap. ($B)
1,238
1,088
0
200
400
600
800
1,000
1,200
1,400
1999 Current
12% Decrease$1,140
$1,077
$0
$200
$400
$600
$800
$1,000
$1,200
1999 Current
Median
MarketCap.
$47 M
Median
MarketCap.
$34M
6% Decrease
% Increase
Assets 108%
Deposits 132%
10,222
7,121
0
2,000
4,000
6,000
8,000
10,000
12,000
1999 Current
30% Decrease
8/12/2019 1130 Sun Bank Investors Who Were They Who Are They and What Are They Looking For
http://slidepdf.com/reader/full/1130-sun-bank-investors-who-were-they-who-are-they-and-what-are-they-looking 5/40
5
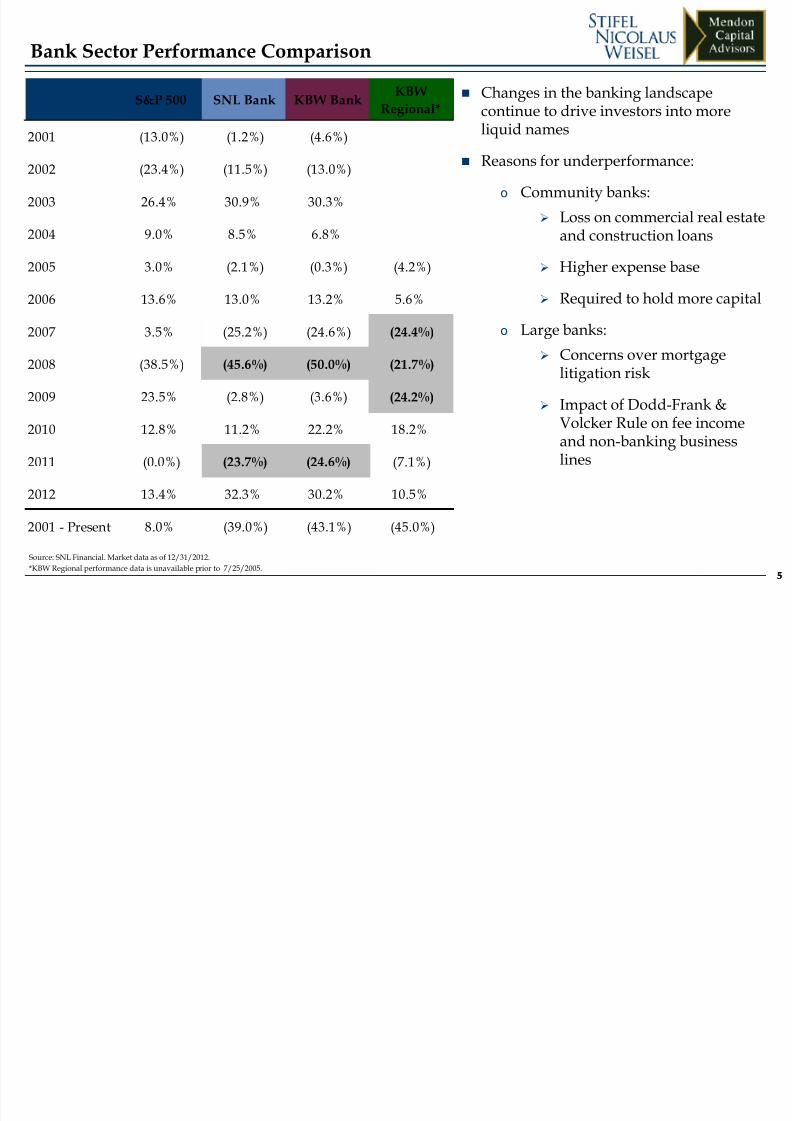
Bank Sector Performance Comparison
5
Source: SNL Financial. Market data as of 12/31/2012.
*KBW Regional performance data is unavailable prior to 7/25/2005.
S&P 500 SNL Bank KBW BankKBW
Regional*
2001 (13.0%) (1.2%) (4.6%)
2002 (23.4%) (11.5%) (13.0%)
2003 26.4% 30.9% 30.3%
2004 9.0% 8.5% 6.8%
2005 3.0% (2.1%) (0.3%) (4.2%)
2006 13.6% 13.0% 13.2% 5.6%
2007 3.5% (25.2%) (24.6%) (24.4%)
2008 (38.5%) (45.6%) (50.0%) (21.7%)
2009 23.5% (2.8%) (3.6%) (24.2%)
2010 12.8% 11.2% 22.2% 18.2%
2011 (0.0%) (23.7%) (24.6%) (7.1%)
2012 13.4% 32.3% 30.2% 10.5%
2001 - Present 8.0% (39.0%) (43.1%) (45.0%)
Changes in the banking landscapecontinue to drive investors into more
liquid names Reasons for underperformance:
o Community banks:
Loss on commercial real estateand construction loans
Higher expense base
Required to hold more capital
o Large banks:
Concerns over mortgagelitigation risk
Impact of Dodd-Frank &Volcker Rule on fee incomeand non-banking businesslines
8/12/2019 1130 Sun Bank Investors Who Were They Who Are They and What Are They Looking For
http://slidepdf.com/reader/full/1130-sun-bank-investors-who-were-they-who-are-they-and-what-are-they-looking 6/40
6
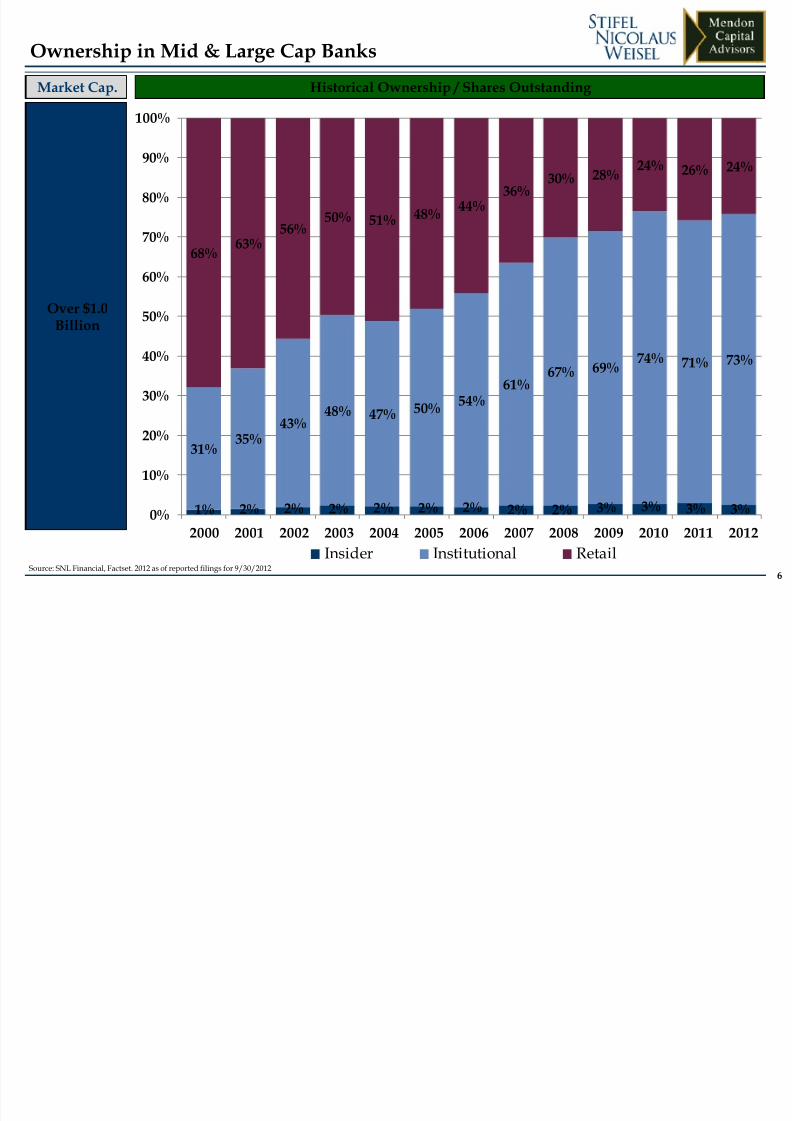
Ownership in Mid & Large Cap Banks
Source: SNL Financial, Factset. 2012 as of reported filings for 9/30/2012.
Over $1.0Billion
Market Cap. Historical Ownership / Shares Outstanding
1% 2% 2% 2% 2% 2% 2% 2% 2% 3% 3% 3% 3%
31% 35%
43% 48% 47% 50%
54%61%
67% 69% 74% 71% 73%
68% 63%
56%50% 51% 48%
44%36%
30% 28% 24% 26% 24%
0%
10%
20%
30%
40%
50%
60%
70%
80%
90%
100%
2000 2001 2002 2003 2004 2005 2006 2007 2008 2009 2010 2011 2012
Insider Institutional Retail
8/12/2019 1130 Sun Bank Investors Who Were They Who Are They and What Are They Looking For
http://slidepdf.com/reader/full/1130-sun-bank-investors-who-were-they-who-are-they-and-what-are-they-looking 7/407
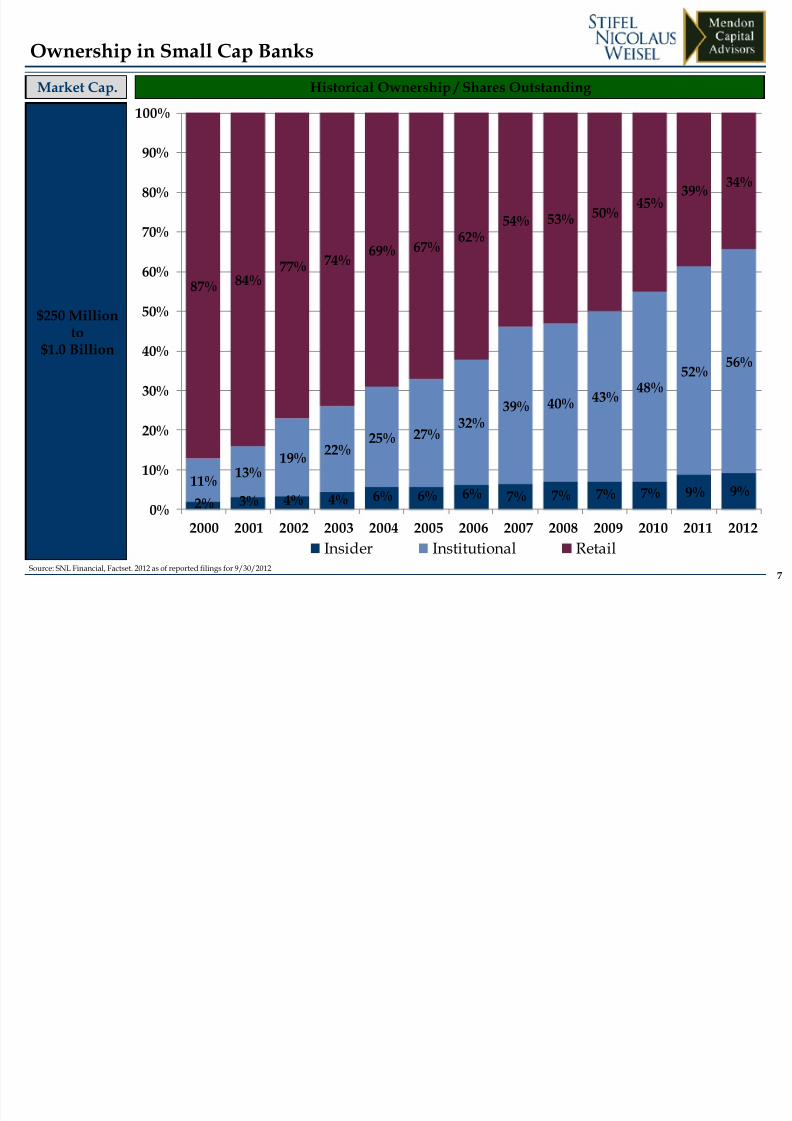
Ownership in Small Cap Banks
Market Cap.
$250 Millionto
$1.0 Billion
Historical Ownership / Shares Outstanding
2% 3% 4% 4% 6% 6% 6% 7% 7% 7% 7% 9% 9%11%
13%19%
22%25% 27%
32%39% 40% 43%
48%52%
56%
87% 84%77% 74%
69% 67% 62%
54% 53% 50% 45%
39% 34%
0%
10%
20%
30%
40%
50%
60%
70%
80%
90%
100%
2000 2001 2002 2003 2004 2005 2006 2007 2008 2009 2010 2011 2012
Insider Institutional RetailSource: SNL Financial, Factset. 2012 as of reported filings for 9/30/2012.
8/12/2019 1130 Sun Bank Investors Who Were They Who Are They and What Are They Looking For
http://slidepdf.com/reader/full/1130-sun-bank-investors-who-were-they-who-are-they-and-what-are-they-looking 8/408
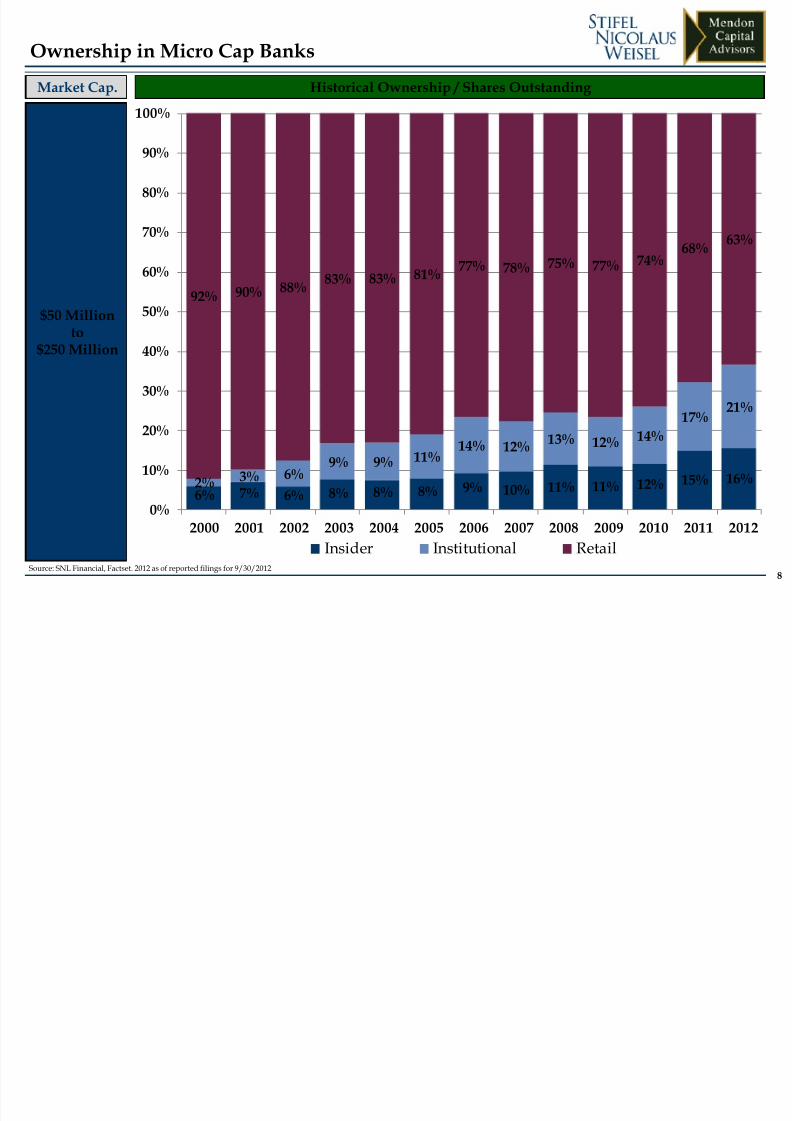
Ownership in Micro Cap Banks
Market Cap.
$50 Millionto
$250 Million
Historical Ownership / Shares Outstanding
6% 7% 6% 8% 8% 8% 9% 10% 11% 11% 12% 15% 16%2% 3% 6%9% 9% 11%
14% 12% 13% 12% 14%
17% 21%
92% 90% 88% 83% 83% 81% 77% 78% 75% 77% 74%
68% 63%
0%
10%
20%
30%
40%
50%
60%
70%
80%
90%
100%
2000 2001 2002 2003 2004 2005 2006 2007 2008 2009 2010 2011 2012
Insider Institutional RetailSource: SNL Financial, Factset. 2012 as of reported filings for 9/30/2012.
8/12/2019 1130 Sun Bank Investors Who Were They Who Are They and What Are They Looking For
http://slidepdf.com/reader/full/1130-sun-bank-investors-who-were-they-who-are-they-and-what-are-they-looking 9/409
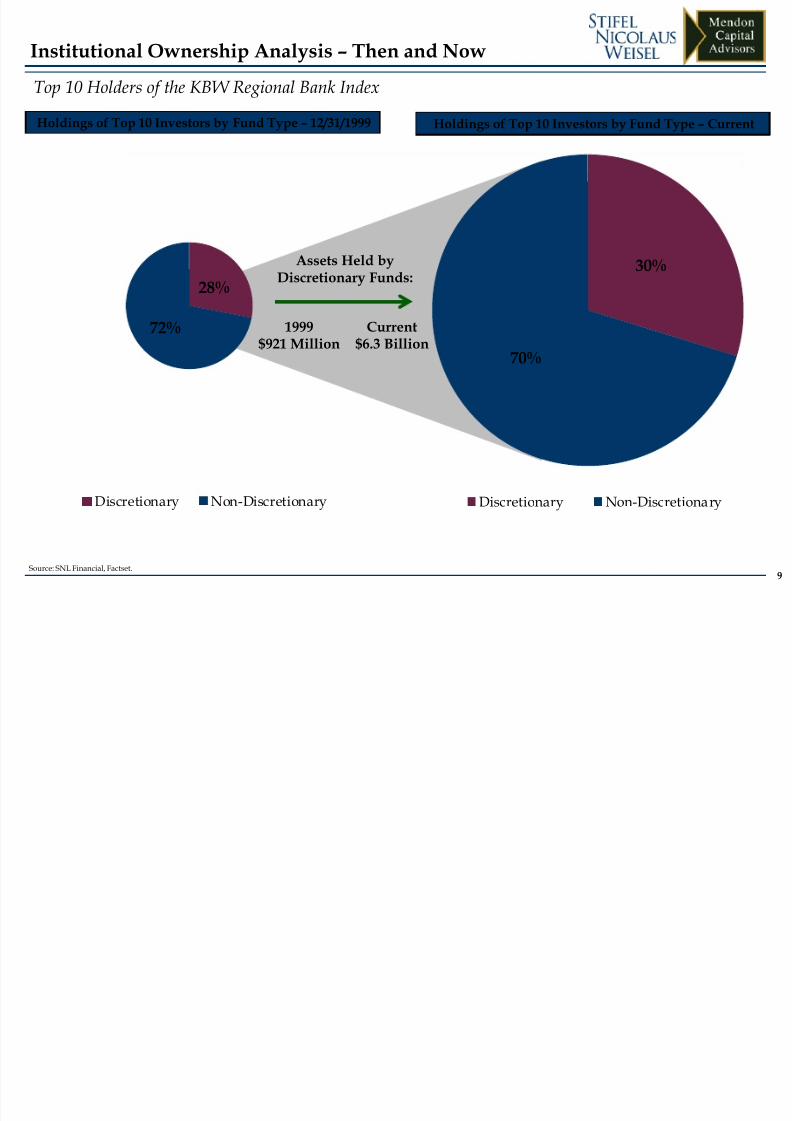
Institutional Ownership Analysis – Then and Now
Source: SNL Financial, Factset.
Holdings of Top 10 Investors by Fund Type – 12/31/1999 Holdings of Top 10 Investors by Fund Type – Current
Top 10 Holders of the KBW Regional Bank Index
30%
70%
Discretionary Non-Discretionary
28%
72%
Discretionary Non-Discretionary
1999$921 Million
Assets Held by
Discretionary Funds:
Current$6.3 Billion
8/12/2019 1130 Sun Bank Investors Who Were They Who Are They and What Are They Looking For
http://slidepdf.com/reader/full/1130-sun-bank-investors-who-were-they-who-are-they-and-what-are-they-looking 10/4010
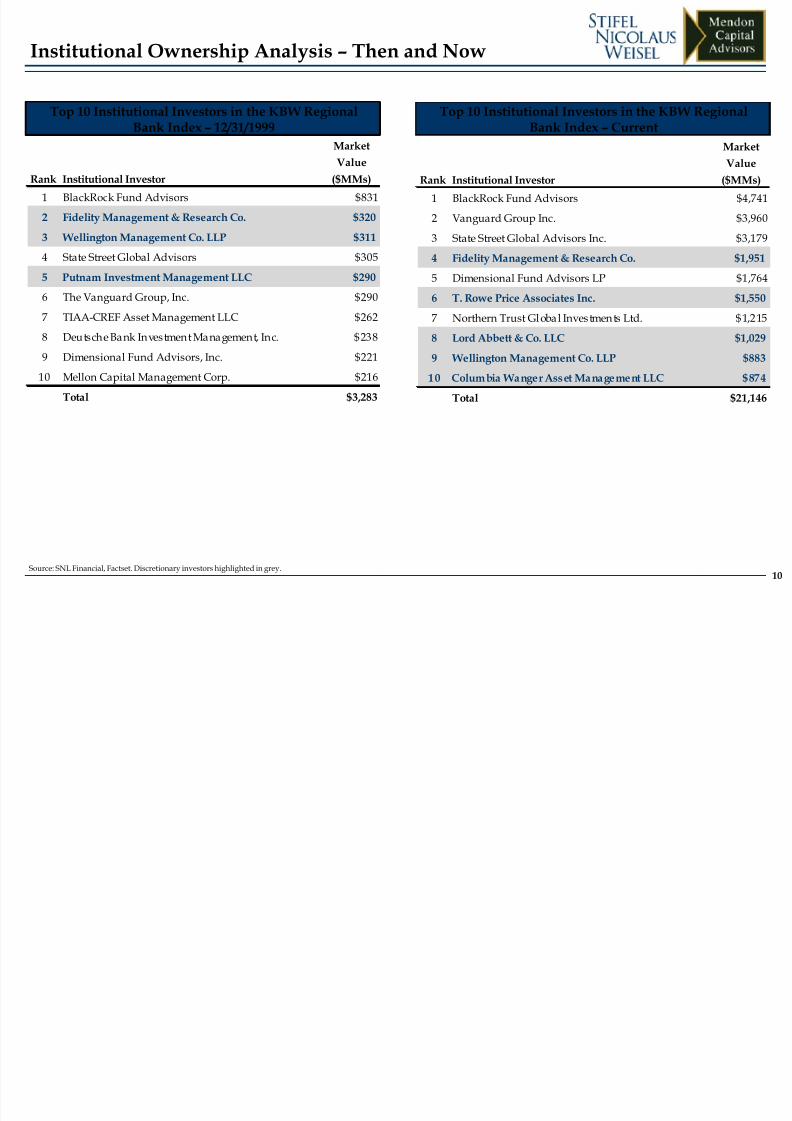
Institutional Ownership Analysis – Then and Now
Top 10 Institutional Investors in the KBW RegionalBank Index – 12/31/1999
Top 10 Institutional Investors in the KBW RegionalBank Index – Current
Source: SNL Financial, Factset. Discretionary investors highlighted in grey.
Rank Institutional Investor
Market
Value
($MMs)
1 BlackRock Fund Advisors $831
2 Fidelity Management & Research Co. $320
3 Wellington Management Co. LLP $311
4 State Street Global Advisors $305
5 Putnam Investment Management LLC $290
6 The Vanguard Group, Inc. $290
7 TIAA-CREF Asset Management LLC $262
8 Deutsche Bank Investment Management, Inc. $238
9 Dimensional Fund Advisors, Inc. $221
10 Mellon Capital Management Corp. $216
Total $3,283
Rank Institutional Investor
Market
Value
($MMs)
1 BlackRock Fund Advisors $4,741
2 Vanguard Group Inc. $3,960
3 State Street Global Advisors Inc. $3,179
4 Fidelity Management & Research Co. $1,951
5 Dimensional Fund Advisors LP $1,764
6 T. Rowe Price Associates Inc. $1,550
7 Northern Trust Global Investments Ltd. $1,215
8 Lord Abbett & Co. LLC $1,029
9 Wellington Management Co. LLP $883
10 Columbia Wanger Asset Management LLC $874
Total $21,146
8/12/2019 1130 Sun Bank Investors Who Were They Who Are They and What Are They Looking For
http://slidepdf.com/reader/full/1130-sun-bank-investors-who-were-they-who-are-they-and-what-are-they-looking 11/4011
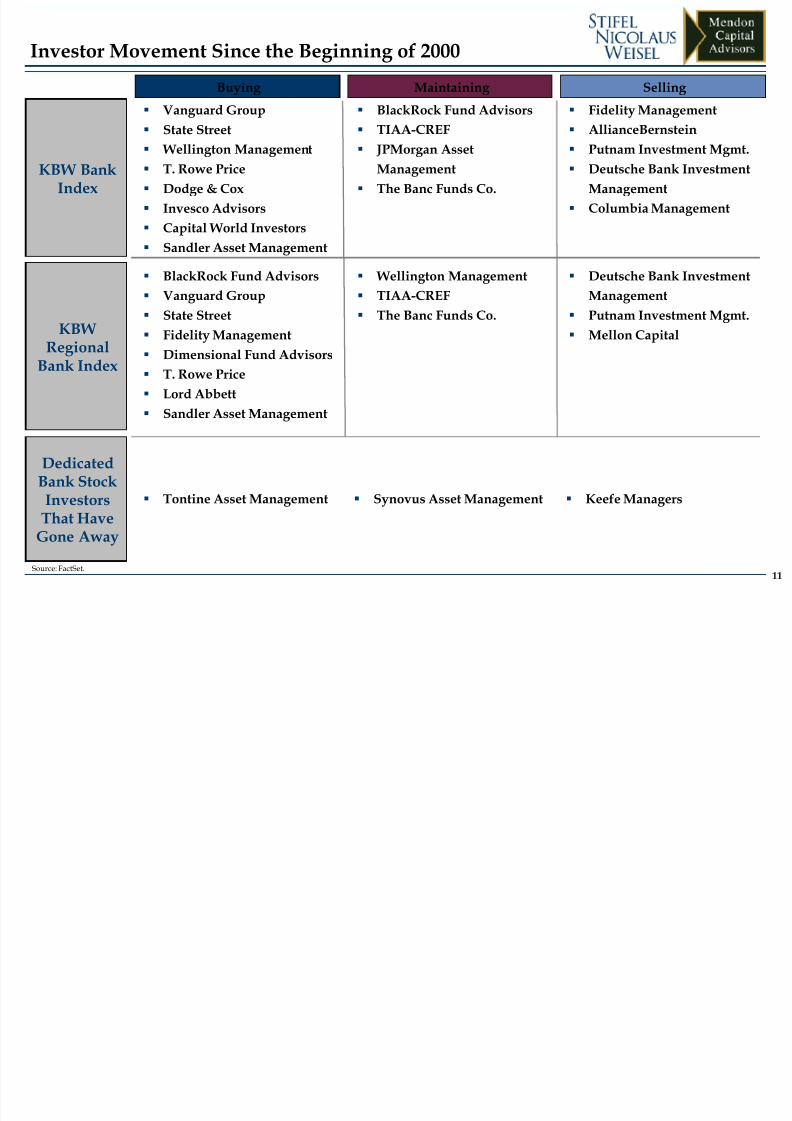
BlackRock Fund Advisors
TIAA-CREF
JPMorgan Asset
Management
The Banc Funds Co.
Fidelity Management
AllianceBernstein
Putnam Investment Mgmt.
Deutsche Bank Investment
Management
Columbia Management
Investor Movement Since the Beginning of 2000
KBW BankIndex
KBWRegional
Bank Index
Buying Maintaining Selling
Vanguard Group
State Street
Wellington Management
T. Rowe Price
Dodge & Cox
Invesco Advisors
Capital World Investors
Sandler Asset Management
BlackRock Fund Advisors Vanguard Group
State Street
Fidelity Management
Dimensional Fund Advisors
T. Rowe Price
Lord Abbett
Sandler Asset Management
Wellington Management TIAA-CREF
The Banc Funds Co.
Deutsche Bank InvestmentManagement
Putnam Investment Mgmt.
Mellon Capital
Source: FactSet.
DedicatedBank StockInvestors
That HaveGone Away
Tontine Asset Management Synovus Asset Management Keefe Managers

8/12/2019 1130 Sun Bank Investors Who Were They Who Are They and What Are They Looking For
http://slidepdf.com/reader/full/1130-sun-bank-investors-who-were-they-who-are-they-and-what-are-they-looking 12/4012
Public Float Soaked Up by Index Funds
Bank ownership trends mirror those of the broader market in the sense that more money is being
managed through non-discretionary funds (ETFs and passively managed index funds)
ETFs and Index Funds have grown in popularity as investors look for lower cost investment alternatives
in a stock market that has been relatively unchanged since the beginning of 2000. Contributing to this
phenomenon have been:
High levels of stock market volatility, including the 2009 “flash crash”
Underperformance by some of the higher profile active managers (Bill Miller and others)
Access, liquidity and specialization of ETFs relative to traditional mutual funds
Current liquidity in bank stocks is diminished as public float is further reduced by shares held by index
funds
Price/valuation impacted by a higher liquidity discount applied by investors
Changes in stock ownership impacted more and more by computers/models, not fundamental
valuation techniques applied by real-life portfolio managers, which on occasion leads to over-
corrections based on technical indicators
8/12/2019 1130 Sun Bank Investors Who Were They Who Are They and What Are They Looking For
http://slidepdf.com/reader/full/1130-sun-bank-investors-who-were-they-who-are-they-and-what-are-they-looking 13/4013
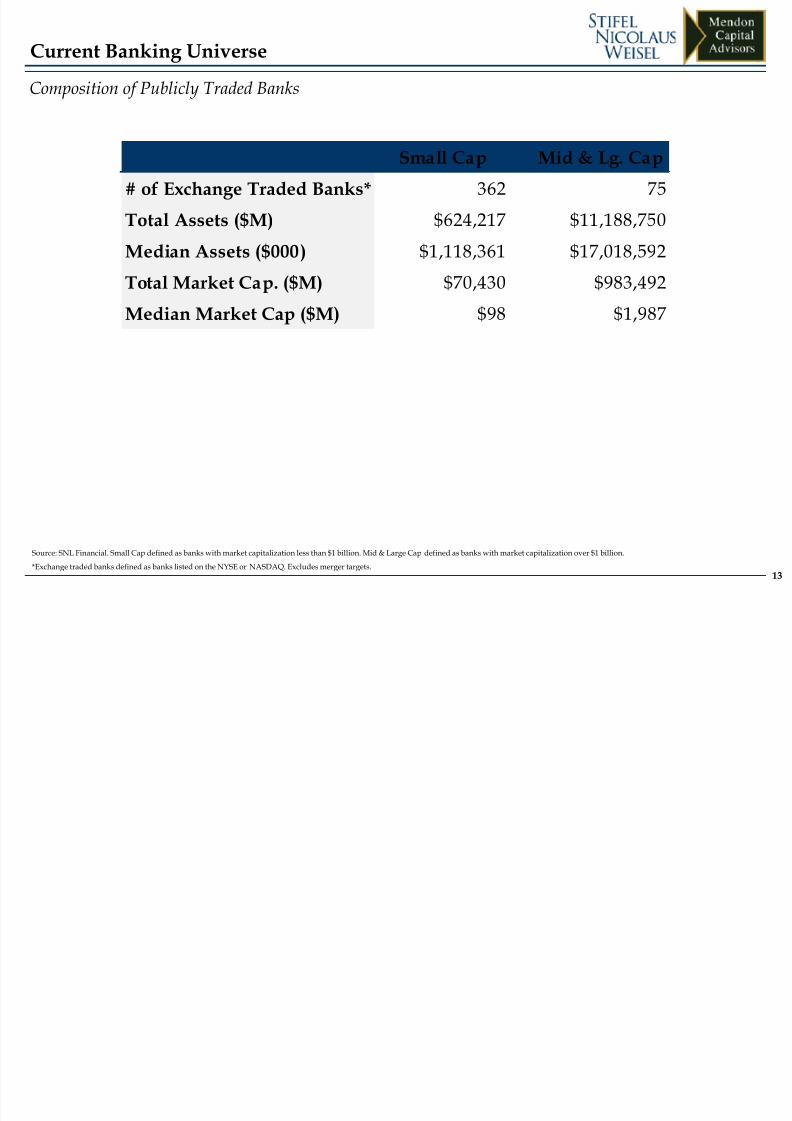
Source: SNL Financial. Small Cap defined as banks with market capitalization less than $1 billion. Mid & Large Cap defined as banks with market capitalization over $1 billion.*Exchange traded banks defined as banks listed on the NYSE or NASDAQ. Excludes merger targets.
Composition of Publicly Traded Banks
Current Banking Universe
Small Cap Mid & Lg. Cap
# of Exchange Traded Banks* 362 75
Total Assets ($M) $624,217 $11,188,750
Median Assets ($000) $1,118,361 $17,018,592
Total Market Cap. ($M) $70,430 $983,492
Median Market Cap ($M) $98 $1,987
8/12/2019 1130 Sun Bank Investors Who Were They Who Are They and What Are They Looking For
http://slidepdf.com/reader/full/1130-sun-bank-investors-who-were-they-who-are-they-and-what-are-they-looking 14/40
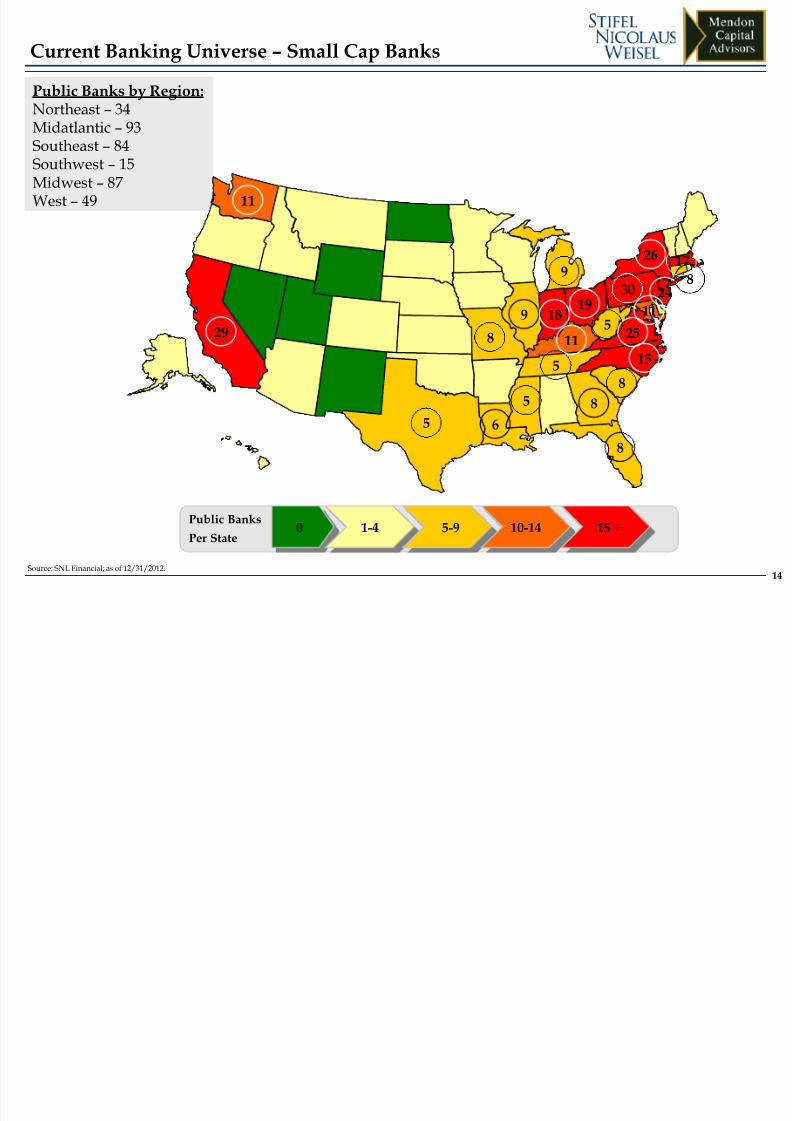
Public Banks by Region:Northeast – 34Midatlantic – 93Southeast – 84Southwest – 15Midwest – 87West – 49
Source: SNL Financial; as of 12/31/2012.
29
8
9
Public Banks
Per State0 1-4 5-9 10-14 15 +
Current Banking Universe – Small Cap Banks
18
11
6
11
15
248
19
26
25
11
14
8
17
8
5
30
85
5
5
9

8/12/2019 1130 Sun Bank Investors Who Were They Who Are They and What Are They Looking For
http://slidepdf.com/reader/full/1130-sun-bank-investors-who-were-they-who-are-they-and-what-are-they-looking 15/40
Public Banks by Region:Northeast – 3Midatlantic – 16Southeast – 15Southwest – 10Midwest – 17West – 14
Source: SNL Financial; as of 12/31/2012.
Public Banks
Per State0 1-4 5-9 10-14 15 +
Current Banking Universe – Mid & Large Cap Banks
15
9
8
6
6
1
54
1
2
3
2

8/12/2019 1130 Sun Bank Investors Who Were They Who Are They and What Are They Looking For
http://slidepdf.com/reader/full/1130-sun-bank-investors-who-were-they-who-are-they-and-what-are-they-looking 16/40
II. What Investors Are Currently Looking For
8/12/2019 1130 Sun Bank Investors Who Were They Who Are They and What Are They Looking For
http://slidepdf.com/reader/full/1130-sun-bank-investors-who-were-they-who-are-they-and-what-are-they-looking 17/40
17
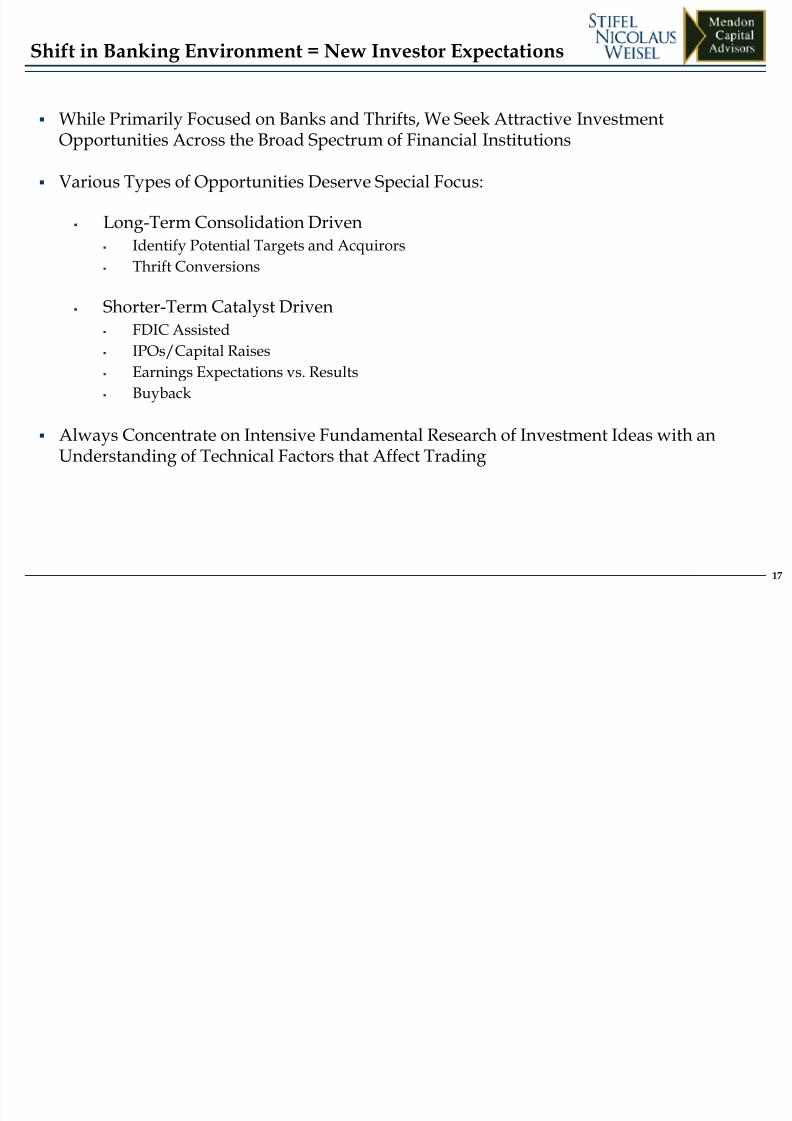
Shift in Banking Environment = New Investor Expectations
While Primarily Focused on Banks and Thrifts, We Seek Attractive Investment
Opportunities Across the Broad Spectrum of Financial Institutions
Various Types of Opportunities Deserve Special Focus:
Long-Term Consolidation Driven Identify Potential Targets and Acquirors
Thrift Conversions
Shorter-Term Catalyst Driven FDIC Assisted
IPOs/Capital Raises
Earnings Expectations vs. Results
Buyback
Always Concentrate on Intensive Fundamental Research of Investment Ideas with anUnderstanding of Technical Factors that Affect Trading

8/12/2019 1130 Sun Bank Investors Who Were They Who Are They and What Are They Looking For
http://slidepdf.com/reader/full/1130-sun-bank-investors-who-were-they-who-are-they-and-what-are-they-looking 18/40
18
Three-Step Discipline:
Idea Generation
•Daily review forvaluation anomalies
•Map and model M&Apossibilities
•Analyst road trips:
several per year peranalyst
• Industry conferencesthroughout the year
• In-house managementvisits
•Daily industry news
•Filter sell-side ideas,IPOs, capital offerings
Investment Decision
•Analyst presents ideaand thesis to PM andHead Trader
•Team discussions toensure all key factorsknown and analyzed
•PM makes final call;analysts have discretionin PM’s absence
Position Monitoring
•Analyst maintainsresponsibility forinvestment thesis
•Monitor daily changes inprice and volume; newsupdates
•Regular discussions withcompany management
•Special focus aroundearnings releases, 10-Qreleases and headlinenews
Investment Process
8/12/2019 1130 Sun Bank Investors Who Were They Who Are They and What Are They Looking For
http://slidepdf.com/reader/full/1130-sun-bank-investors-who-were-they-who-are-they-and-what-are-they-looking 19/40
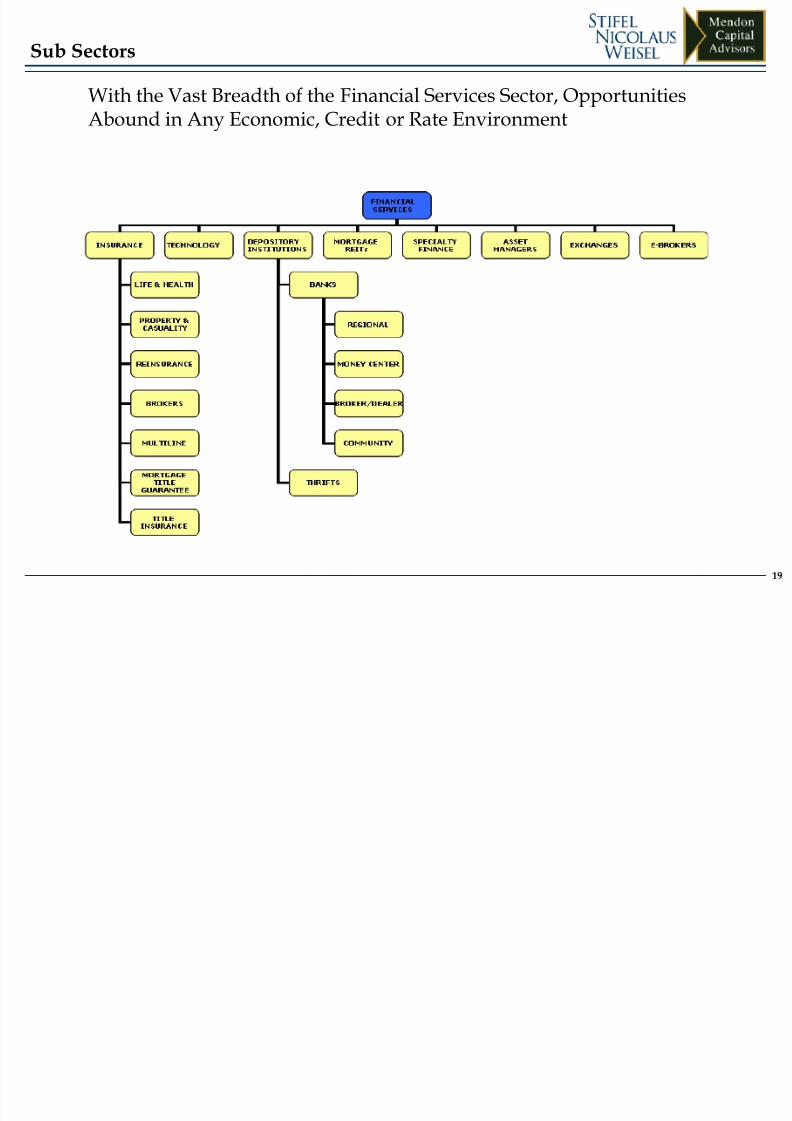
19
Sub Sectors
With the Vast Breadth of the Financial Services Sector, OpportunitiesAbound in Any Economic, Credit or Rate Environment
8/12/2019 1130 Sun Bank Investors Who Were They Who Are They and What Are They Looking For
http://slidepdf.com/reader/full/1130-sun-bank-investors-who-were-they-who-are-they-and-what-are-they-looking 20/40
20
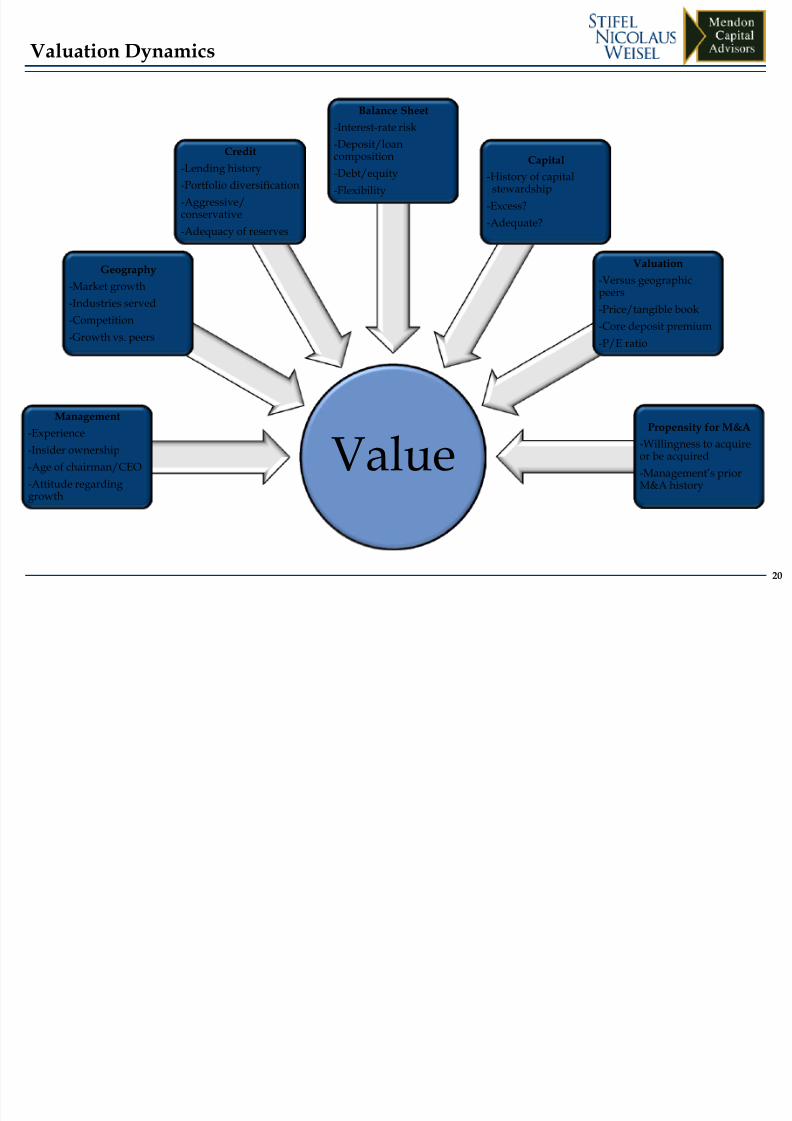
Valuation Dynamics
ValueManagement
-Experience
-Insider ownership
-Age of chairman/CEO
-Attitude regardinggrowth
Geography
-Market growth
-Industries served
-Competition
-Growth vs. peers
Credit
-Lending history
-Portfolio diversification
-Aggressive/conservative
-Adequacy of reserves
Balance Sheet
-Interest-rate risk
-Deposit/loancomposition
-Debt/equity
-Flexibility
Capital
-History of capitalstewardship
-Excess?
-Adequate?
Valuation
-Versus geographicpeers
-Price/tangible book
-Core deposit premium
-P/E ratio
Propensity for M&A
-Willingness to acquireor be acquired
-Management’s priorM&A history
8/12/2019 1130 Sun Bank Investors Who Were They Who Are They and What Are They Looking For
http://slidepdf.com/reader/full/1130-sun-bank-investors-who-were-they-who-are-they-and-what-are-they-looking 21/40
Deal activity, advantageous to buyer and seller, will accelerate over next two to
five years due to:
Regulatory headwinds
Dodd-Frank Act
TARP exit
Lack of significant revenue growth Weak loan demand
Reduced fee income
Capital constraints
Capital markets mostly shut to smaller banks
“Tired” management teams and boards of directors
Improved valuations & market conditions
21
Consolidation Dynamics
8/12/2019 1130 Sun Bank Investors Who Were They Who Are They and What Are They Looking For
http://slidepdf.com/reader/full/1130-sun-bank-investors-who-were-they-who-are-they-and-what-are-they-looking 22/40
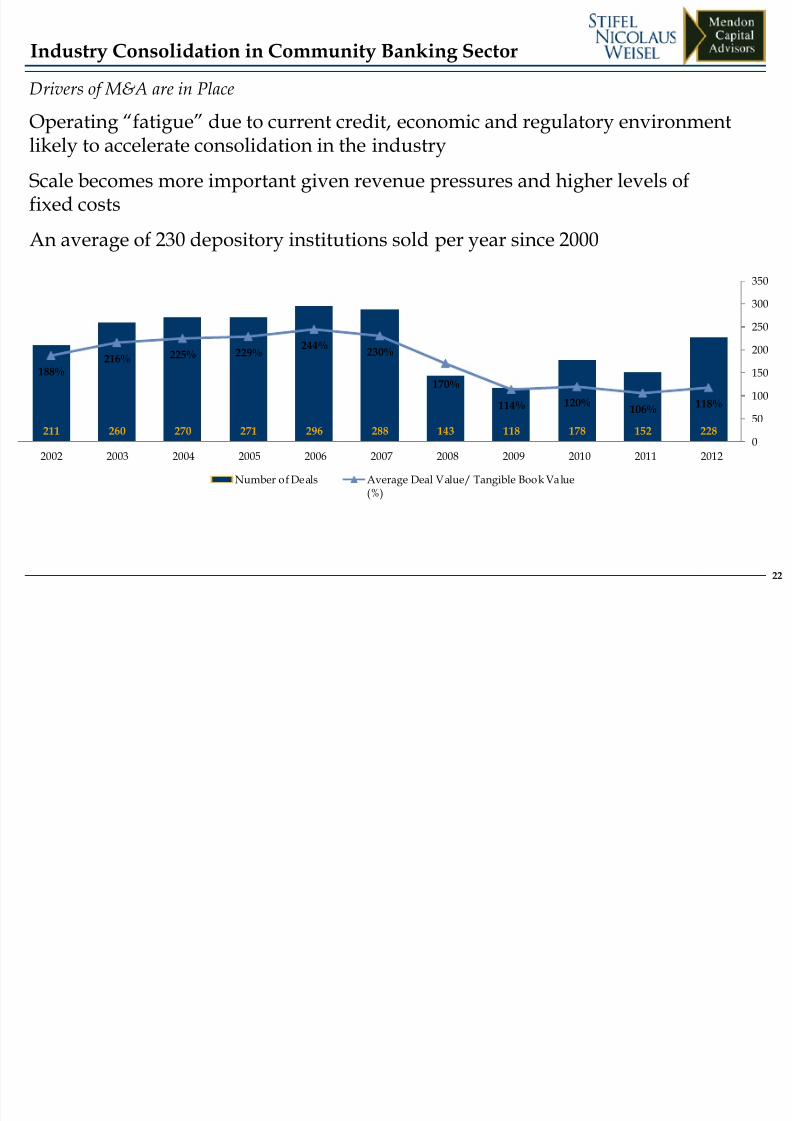
22
Drivers of M&A are in Place
Operating “fatigue” due to current credit, economic and regulatory environment
likely to accelerate consolidation in the industry
Scale becomes more important given revenue pressures and higher levels offixed costs
An average of 230 depository institutions sold per year since 2000
211 260 270 271 296 288 143 118 178 152 228
188%216% 225% 229%
244%230%
170%
114% 120%106%
118%
0
50
100
150
200
250
300
350
2002 2003 2004 2005 2006 2007 2008 2009 2010 2011 2012
Number of Deals Average Deal Value/ Tangible Book Value(%)
Industry Consolidation in Community Banking Sector
8/12/2019 1130 Sun Bank Investors Who Were They Who Are They and What Are They Looking For
http://slidepdf.com/reader/full/1130-sun-bank-investors-who-were-they-who-are-they-and-what-are-they-looking 23/40
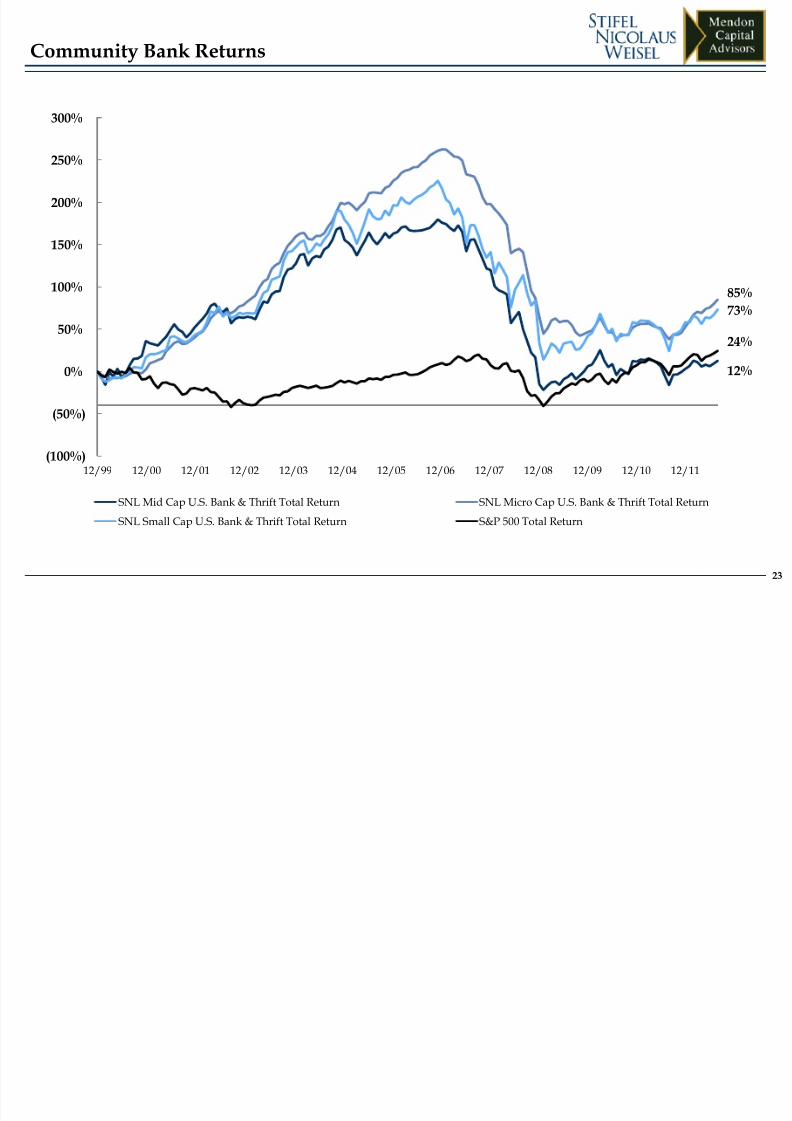
23
Community Bank Returns
12%
85%
73%
24%
(100%)
(50%)
0%
50%
100%
150%
200%
250%
300%
12/99 12/00 12/01 12/02 12/03 12/04 12/05 12/06 12/07 12/08 12/09 12/10 12/11
SNL Mid Cap U.S. Bank & Thrift Total Return SNL Micro Cap U.S. Bank & Thrift Total Return
SNL Small Cap U.S. Bank & Thrift Total Return S&P 500 Total Return
8/12/2019 1130 Sun Bank Investors Who Were They Who Are They and What Are They Looking For
http://slidepdf.com/reader/full/1130-sun-bank-investors-who-were-they-who-are-they-and-what-are-they-looking 24/40
24
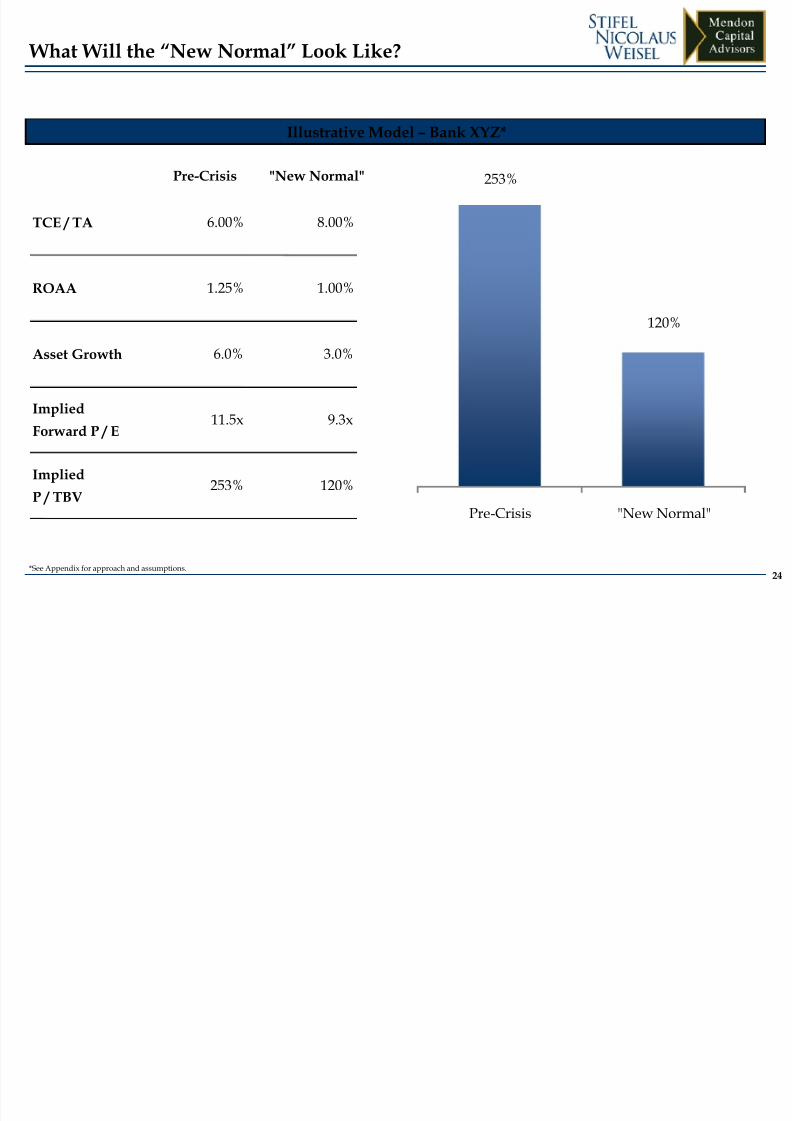
Illustrative Model – Bank XYZ*
Pre-Crisis "New Normal"
TCE / TA 6.00% 8.00%
ROAA 1.25% 1.00%
Asset Growth 6.0% 3.0%
Implied
Forward P / E 11.5x 9.3x
Implied
P / TBV253% 120%
253%
120%
Pre - Crisis "New Normal"
What Will the “New Normal” Look Like?
*See Appendix for approach and assumptions.

8/12/2019 1130 Sun Bank Investors Who Were They Who Are They and What Are They Looking For
http://slidepdf.com/reader/full/1130-sun-bank-investors-who-were-they-who-are-they-and-what-are-they-looking 25/40
III. Bank Investors Today
8/12/2019 1130 Sun Bank Investors Who Were They Who Are They and What Are They Looking For
http://slidepdf.com/reader/full/1130-sun-bank-investors-who-were-they-who-are-they-and-what-are-they-looking 26/40
26
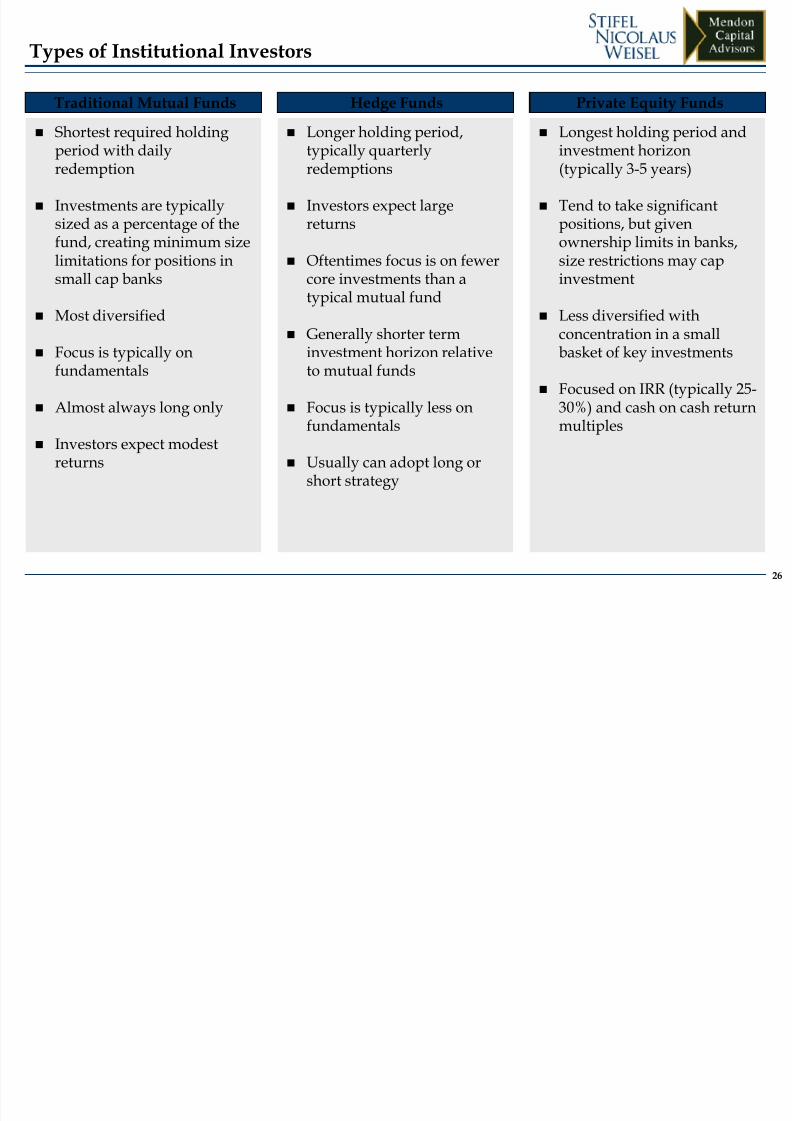
Traditional Mutual Funds Private Equity FundsHedge Funds
Shortest required holdingperiod with dailyredemption
Investments are typicallysized as a percentage of thefund, creating minimum sizelimitations for positions in
small cap banks
Most diversified
Focus is typically onfundamentals
Almost always long only
Investors expect modestreturns
Longer holding period,typically quarterlyredemptions
Investors expect largereturns
Oftentimes focus is on fewer
core investments than atypical mutual fund
Generally shorter terminvestment horizon relativeto mutual funds
Focus is typically less onfundamentals
Usually can adopt long orshort strategy
Longest holding period andinvestment horizon(typically 3-5 years)
Tend to take significantpositions, but givenownership limits in banks,size restrictions may cap
investment
Less diversified withconcentration in a smallbasket of key investments
Focused on IRR (typically 25-30%) and cash on cash returnmultiples
Types of Institutional Investors
8/12/2019 1130 Sun Bank Investors Who Were They Who Are They and What Are They Looking For
http://slidepdf.com/reader/full/1130-sun-bank-investors-who-were-they-who-are-they-and-what-are-they-looking 27/40
27
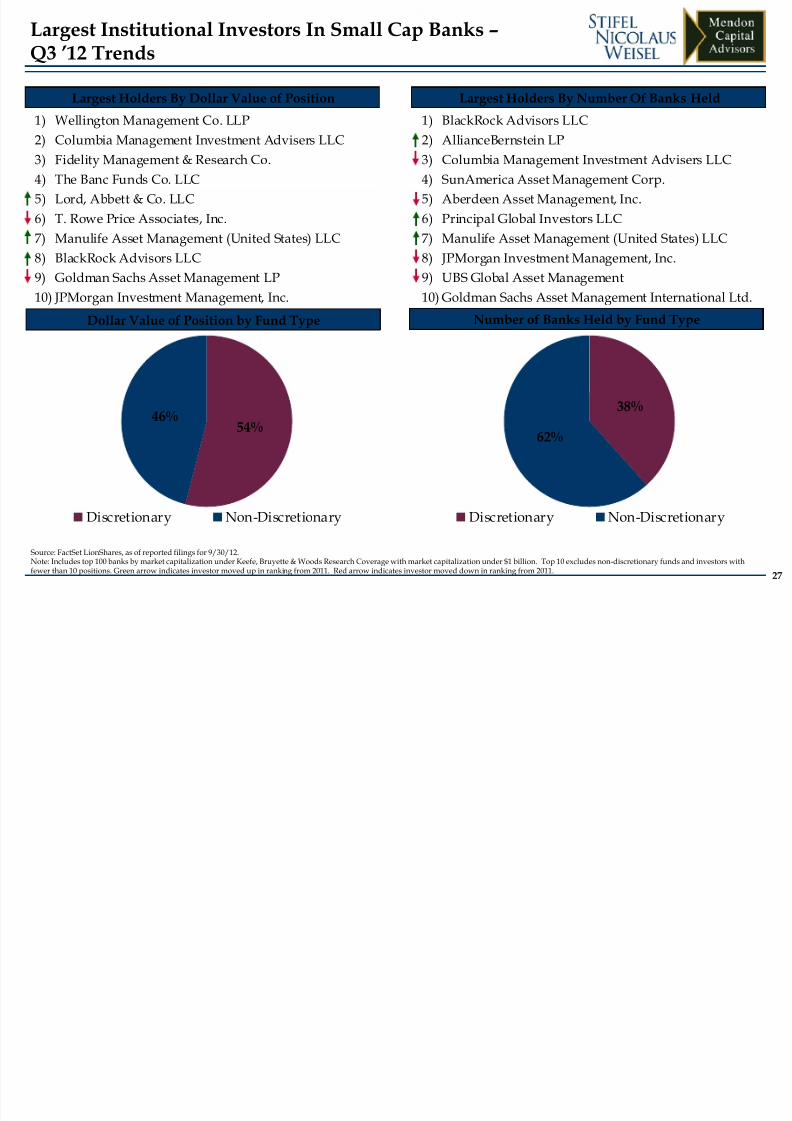
Largest Holders By Number Of Banks HeldLargest Holders By Dollar Value of Position
Source: FactSet LionShares, as of reported filings for 9/30/12.Note: Includes top 100 banks by market capitalization under Keefe, Bruyette & Woods Research Coverage with market capitalization under $1 billion. Top 10 excludes non-discretionary funds and investors withfewer than 10 positions. Green arrow indicates investor moved up in ranking from 2011. Red arrow indicates investor moved down in ranking from 2011.
Largest Institutional Investors In Small Cap Banks –Q3 ’12 Trends
1) BlackRock Advisors LLC
2) AllianceBernstein LP3) Columbia Management Investment Advisers LLC
4) SunAmerica Asset Management Corp.
5) Aberdeen Asset Management, Inc.
6) Principal Global Investors LLC
7) Manulife Asset Management (United States) LLC
8) JPMorgan Investment Management, Inc.
9) UBS Global Asset Management10) Goldman Sachs Asset Management International Ltd.
1) Wellington Management Co. LLP
2) Columbia Management Investment Advisers LLC3) Fidelity Management & Research Co.
4) The Banc Funds Co. LLC
5) Lord, Abbett & Co. LLC
6) T. Rowe Price Associates, Inc.
7) Manulife Asset Management (United States) LLC
8) BlackRock Advisors LLC
9) Goldman Sachs Asset Management LP10) JPMorgan Investment Management, Inc.
Dollar Value of Position by Fund Type Number of Banks Held by Fund Type
54%46%
Discretionary Non-Discretionary
38%
62%
Discretionary Non-Discretionary
8/12/2019 1130 Sun Bank Investors Who Were They Who Are They and What Are They Looking For
http://slidepdf.com/reader/full/1130-sun-bank-investors-who-were-they-who-are-they-and-what-are-they-looking 28/40
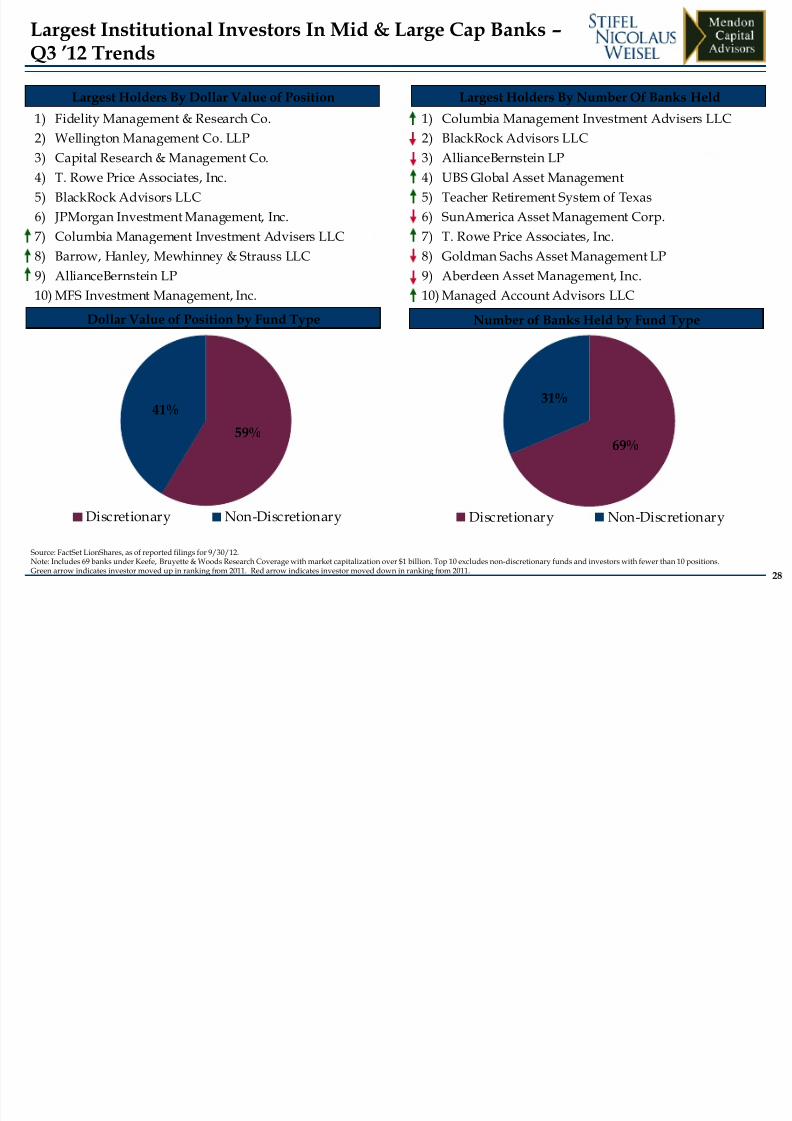
1) Columbia Management Investment Advisers LLC
2) BlackRock Advisors LLC3) AllianceBernstein LP
4) UBS Global Asset Management
5) Teacher Retirement System of Texas
6) SunAmerica Asset Management Corp.
7) T. Rowe Price Associates, Inc.
8) Goldman Sachs Asset Management LP
9) Aberdeen Asset Management, Inc.10) Managed Account Advisors LLC
28
Largest Holders By Number Of Banks HeldLargest Holders By Dollar Value of Position
Source: FactSet LionShares, as of reported filings for 9/30/12.Note: Includes 69 banks under Keefe, Bruyette & Woods Research Coverage with market capitalization over $1 billion. Top 10 excludes non-discretionary funds and investors with fewer than 10 positions.Green arrow indicates investor moved up in ranking from 2011. Red arrow indicates investor moved down in ranking from 2011.
1) Fidelity Management & Research Co.
2) Wellington Management Co. LLP3) Capital Research & Management Co.
4) T. Rowe Price Associates, Inc.
5) BlackRock Advisors LLC
6) JPMorgan Investment Management, Inc.
7) Columbia Management Investment Advisers LLC
8) Barrow, Hanley, Mewhinney & Strauss LLC
9) AllianceBernstein LP10) MFS Investment Management, Inc.
Dollar Value of Position by Fund Type Number of Banks Held by Fund Type
59%
41%
Discretionary Non-Discretionary
69%
31%
Discretionary Non-Discretionary
Largest Institutional Investors In Mid & Large Cap Banks –Q3 ’12 Trends
8/12/2019 1130 Sun Bank Investors Who Were They Who Are They and What Are They Looking For
http://slidepdf.com/reader/full/1130-sun-bank-investors-who-were-they-who-are-they-and-what-are-they-looking 29/40
29Source: FactSet as of 9/30/12 filings.
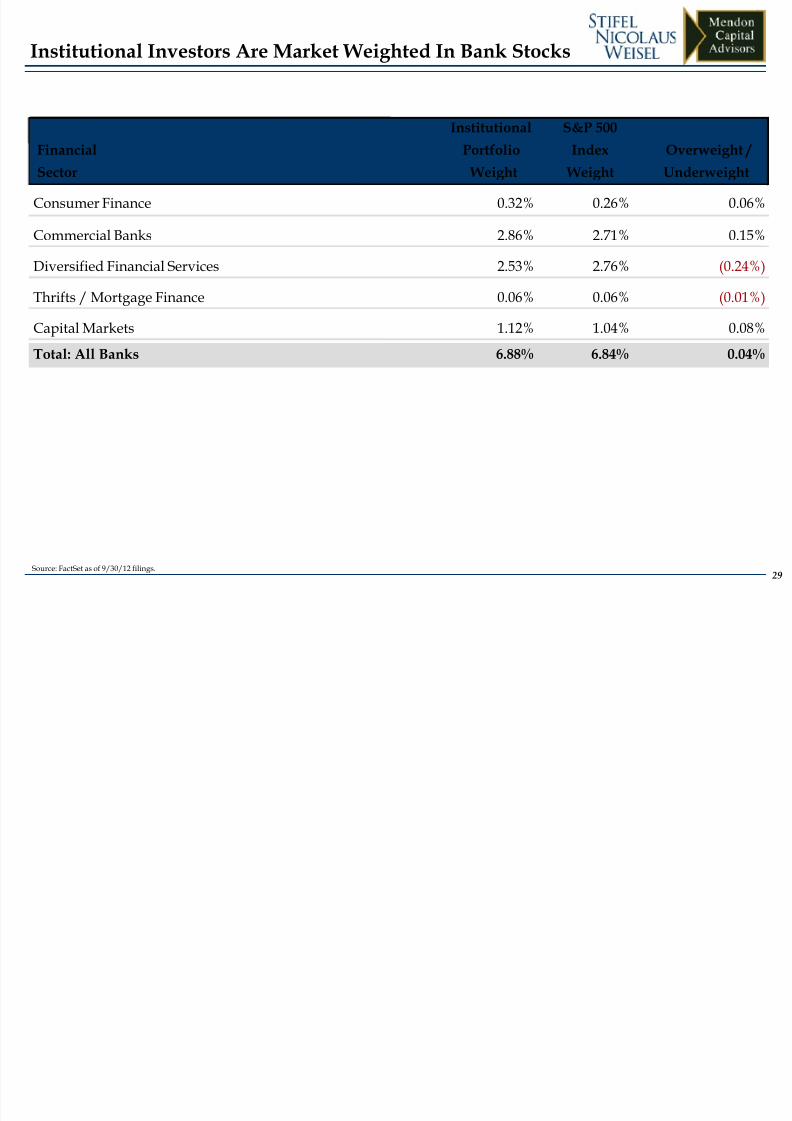
Institutional Investors Are Market Weighted In Bank Stocks
Financial
Sector
Institutional
Portfolio
Weight
S&P 500
Index
Weight
Overweight /
Underweight
Consumer Finance 0.32% 0.26% 0.06%
Commercial Banks 2.86% 2.71% 0.15%
Diversified Financial Services 2.53% 2.76% (0.24%)
Thrifts / Mortgage Finance 0.06% 0.06% (0.01%)
Capital Markets 1.12% 1.04% 0.08%
Total: All Banks 6.88% 6.84% 0.04%
8/12/2019 1130 Sun Bank Investors Who Were They Who Are They and What Are They Looking For
http://slidepdf.com/reader/full/1130-sun-bank-investors-who-were-they-who-are-they-and-what-are-they-looking 30/40
30
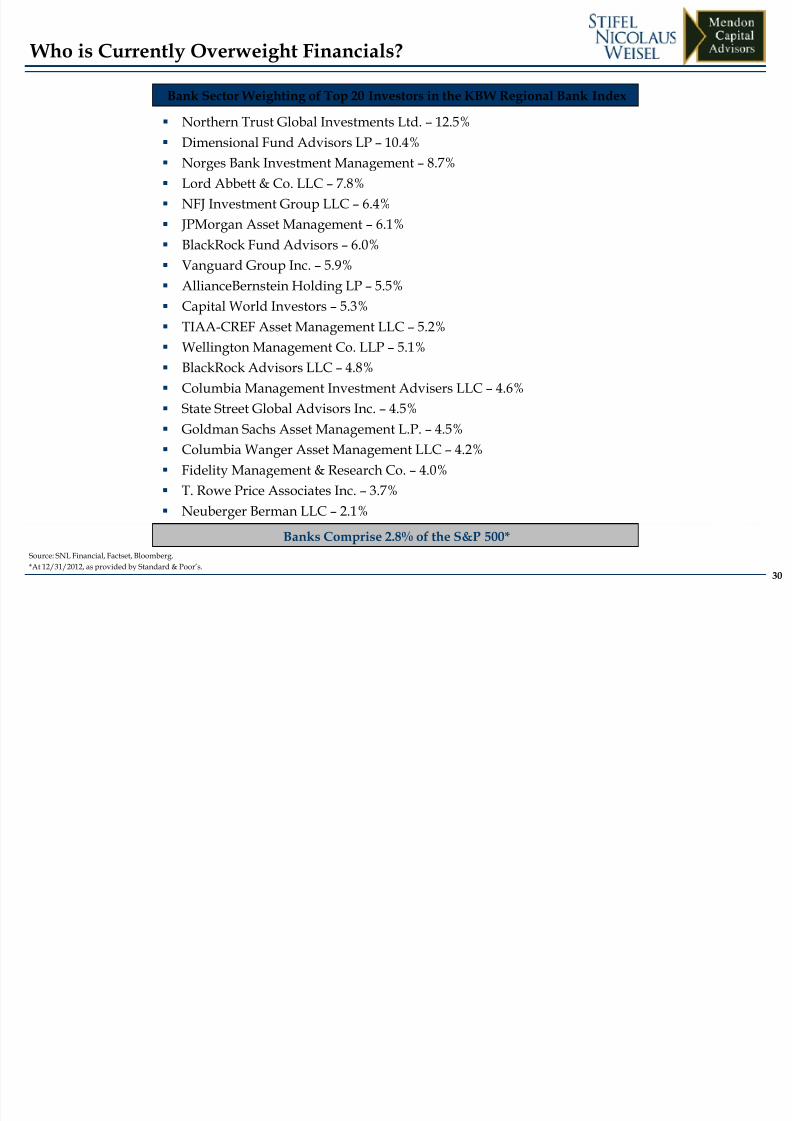
Who is Currently Overweight Financials?
Source: SNL Financial, Factset, Bloomberg.*At 12/31/2012, as provided by Standard & Poor’s.
Northern Trust Global Investments Ltd. – 12.5%
Dimensional Fund Advisors LP – 10.4% Norges Bank Investment Management – 8.7%
Lord Abbett & Co. LLC – 7.8%
NFJ Investment Group LLC – 6.4%
JPMorgan Asset Management – 6.1%
BlackRock Fund Advisors – 6.0%
Vanguard Group Inc. – 5.9%
AllianceBernstein Holding LP – 5.5%
Capital World Investors – 5.3%
TIAA-CREF Asset Management LLC – 5.2%
Wellington Management Co. LLP – 5.1%
BlackRock Advisors LLC – 4.8%
Columbia Management Investment Advisers LLC – 4.6%
State Street Global Advisors Inc. – 4.5%
Goldman Sachs Asset Management L.P. – 4.5%
Columbia Wanger Asset Management LLC – 4.2%
Fidelity Management & Research Co. – 4.0%
T. Rowe Price Associates Inc. – 3.7%
Neuberger Berman LLC – 2.1%
Banks Comprise 2.8% of the S&P 500*
Bank Sector Weighting of Top 20 Investors in the KBW Regional Bank Index

8/12/2019 1130 Sun Bank Investors Who Were They Who Are They and What Are They Looking For
http://slidepdf.com/reader/full/1130-sun-bank-investors-who-were-they-who-are-they-and-what-are-they-looking 31/40
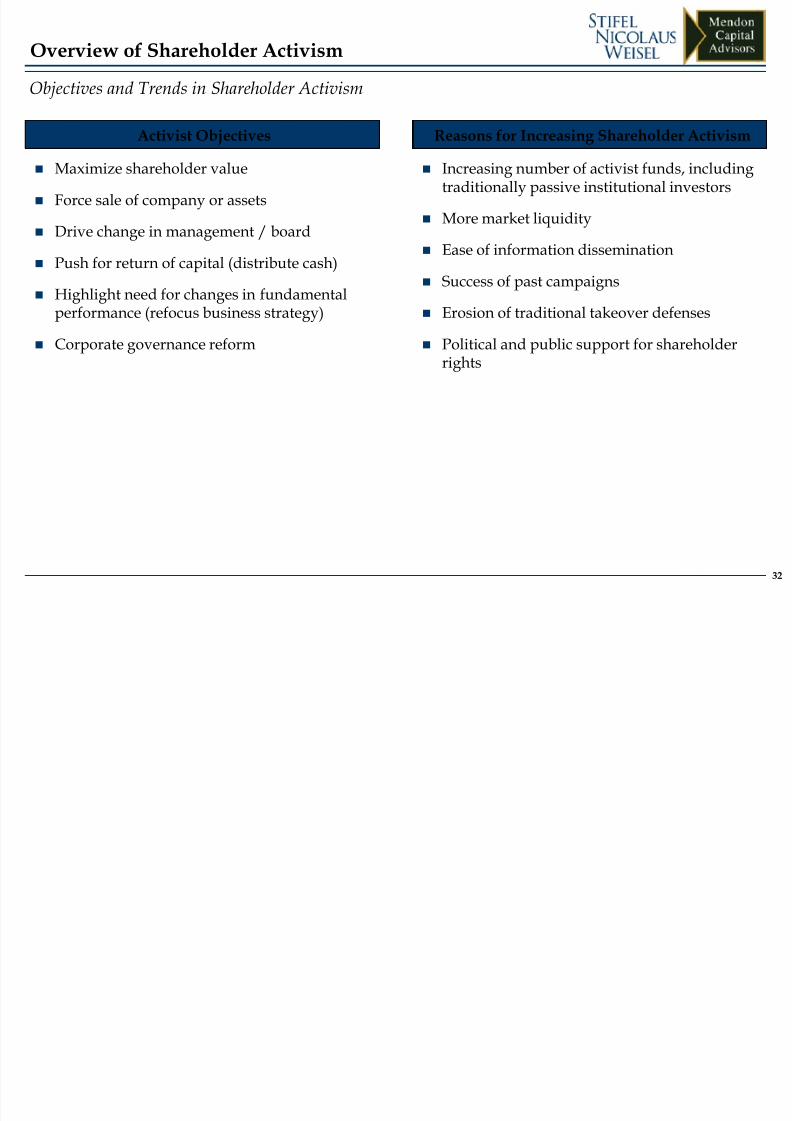
IV. Shareholder Activism
8/12/2019 1130 Sun Bank Investors Who Were They Who Are They and What Are They Looking For
http://slidepdf.com/reader/full/1130-sun-bank-investors-who-were-they-who-are-they-and-what-are-they-looking 32/40
32
Objectives and Trends in Shareholder Activism
Maximize shareholder value
Force sale of company or assets
Drive change in management / board
Push for return of capital (distribute cash)
Highlight need for changes in fundamentalperformance (refocus business strategy)
Corporate governance reform
Activist Objectives Reasons for Increasing Shareholder Activism Increasing number of activist funds, including
traditionally passive institutional investors
More market liquidity
Ease of information dissemination
Success of past campaigns
Erosion of traditional takeover defenses
Political and public support for shareholderrights
Overview of Shareholder Activism

8/12/2019 1130 Sun Bank Investors Who Were They Who Are They and What Are They Looking For
http://slidepdf.com/reader/full/1130-sun-bank-investors-who-were-they-who-are-they-and-what-are-they-looking 33/40
33
$0.1$0.1$0.2
$0.2$0.3
$0.5
$0.8
$1.2
$1.4
$1.7
$2.1
$1.5$1.6
$1.7$1.7
$1.8
$0.0
$0.5
$1.0
$1.5
$2.0
$2.5
1 9 9 7
1 9 9 8
1 9 9 9
2 0 0 0
2 0 0 1
2 0 0 2
2 0 0 3
2 0 0 4
2 0 0 5
2 0 0 6
2 0 0 7
2 0 0 8
2 0 0 9
2 0 1 0
2 0 1 1
3 Q ' 1 2
The Rise of Activist Hedge Funds
Most mutual funds and older LBO funds are barred frommaking unsolicited bids by clauses in their fundpartnership agreements
o Pension funds demanded this out of fear of adversepublicity
However, hedge funds are not bound by such restrictions
o Hedge funds are becoming a force in nearly everypublic takeover because of the amount of capital at
their disposalo This activism requires attention and warrants
careful preparation as for responding to a hostiletakeover bid. In fact, some of the attacks aredesigned to facilitate a takeover or to force a sale ofthe target
o Diligent planning and a proactive approach arecritical. Failure to prepare reduces a company’sability to control its own destiny
While the number of proxy fights has remained relativelyflat, the percentage of dissident victories (includingoutright sales, partial victories and settlements) haveincreased steadily
o Corporate control contests are increasingly votingcontests with a large public relations component
o Companies need to focus on a variety of constituentinterests including governance policies, social issues
and traditional Wall Street metrics
Growth in the Hedge Fund Industry’s AUM
($ in trillions)
The Activist Hedge Fund
Overview of Shareholder Activism
Source: Barclay Hedge Alternative Investment Database.
8/12/2019 1130 Sun Bank Investors Who Were They Who Are They and What Are They Looking For
http://slidepdf.com/reader/full/1130-sun-bank-investors-who-were-they-who-are-they-and-what-are-they-looking 34/40
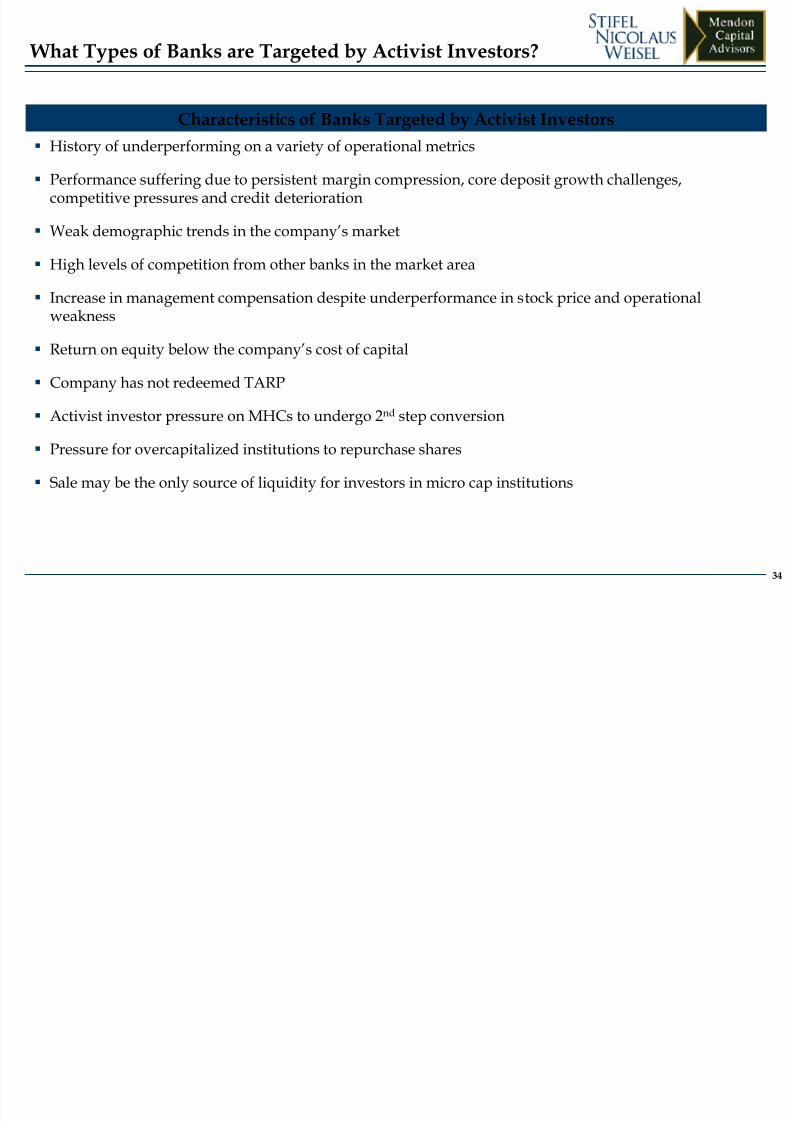
Characteristics of Banks Targeted by Activist Investors
History of underperforming on a variety of operational metrics
Performance suffering due to persistent margin compression, core deposit growth challenges,competitive pressures and credit deterioration
Weak demographic trends in the company’s market
High levels of competition from other banks in the market area
Increase in management compensation despite underperformance in stock price and operationalweakness
Return on equity below the company’s cost of capital
Company has not redeemed TARP
Activist investor pressure on MHCs to undergo 2nd
step conversion
Pressure for overcapitalized institutions to repurchase shares
Sale may be the only source of liquidity for investors in micro cap institutions
What Types of Banks are Targeted by Activist Investors?
34

8/12/2019 1130 Sun Bank Investors Who Were They Who Are They and What Are They Looking For
http://slidepdf.com/reader/full/1130-sun-bank-investors-who-were-they-who-are-they-and-what-are-they-looking 35/40
V. Positioning For The Future
8/12/2019 1130 Sun Bank Investors Who Were They Who Are They and What Are They Looking For
http://slidepdf.com/reader/full/1130-sun-bank-investors-who-were-they-who-are-they-and-what-are-they-looking 36/40
36
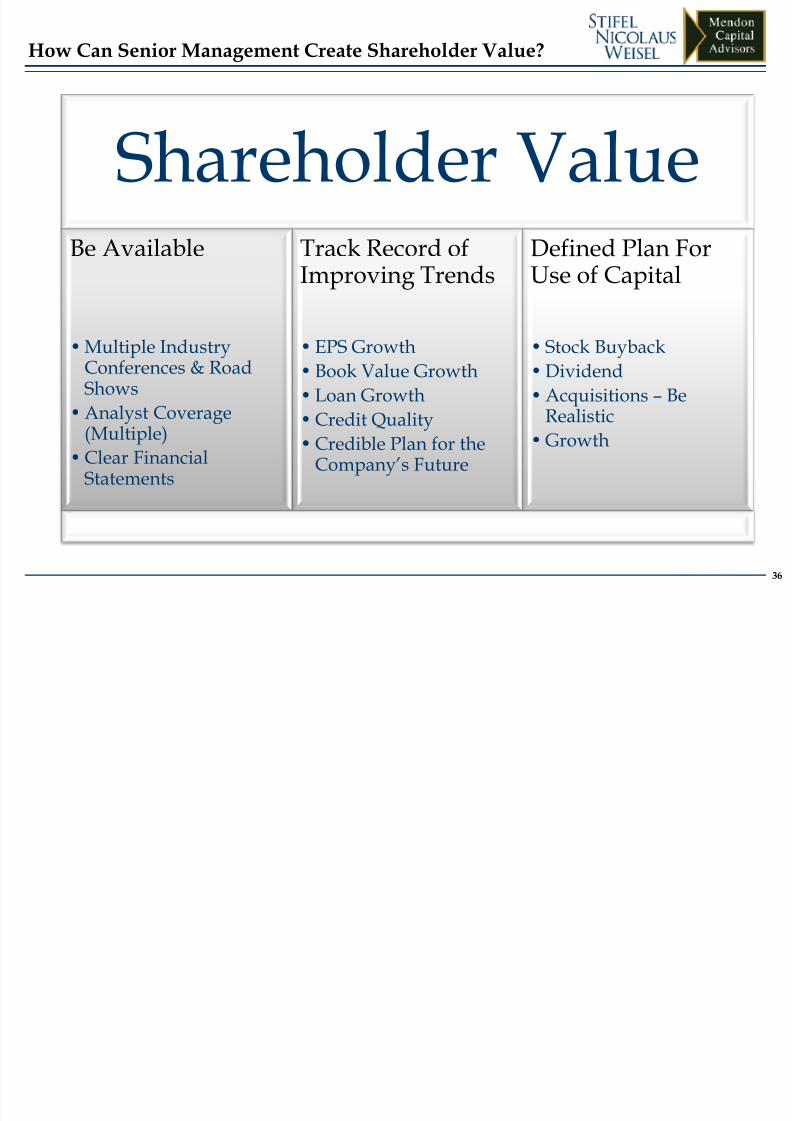
How Can Senior Management Create Shareholder Value?
Shareholder ValueBe Available
•Multiple IndustryConferences & RoadShows
•
Analyst Coverage(Multiple)
•Clear FinancialStatements
Track Record of
Improving Trends
• EPS Growth
• Book Value Growth
• Loan Growth
• Credit Quality• Credible Plan for the
Company’s Future
Defined Plan For
Use of Capital
• Stock Buyback
• Dividend
• Acquisitions – Be
Realistic• Growth

8/12/2019 1130 Sun Bank Investors Who Were They Who Are They and What Are They Looking For
http://slidepdf.com/reader/full/1130-sun-bank-investors-who-were-they-who-are-they-and-what-are-they-looking 37/40
Return of Excess Capital: Best Options for Shareholders
Our research suggests shareholders are most likely to benefit from a large, sustainable increase in a
bank’s common dividend Performance is driven by investor perception of a stable dividend at a higher rate as well as the
strong probability for further future increases
Highest stock price impact occurred through increasing common dividends but maintaining apayout ratio less than 20%, leading to a 9.7% Bank Index outperformance
Tax changes for 2013 will negatively impact dividends as drivers of stock multiples
Stock repurchase programs have been the second most beneficial option for bank to return excesscapital
Banks that repurchased greater than 7.50% of their float outperformed their peer group index,confirming the positive effect large scale buy backs have on EPS
Least beneficial method of returning excess capital to shareholders is special dividends, as they haveprovided minimal share price outperformance in the 12 months following the declaration
Underperformance due to the one-time nature of this type of capital distribution
– Company management is perceived to view opportunities to internally return excess capitalas limited
Special dividends be beneficial and lead to stock price outperformance provided they are declaredunder the appropriate set of circumstances and to the shareholder base
Source: Stifel Nicolaus Research.
Bank Stock Investors’ Perception
37
8/12/2019 1130 Sun Bank Investors Who Were They Who Are They and What Are They Looking For
http://slidepdf.com/reader/full/1130-sun-bank-investors-who-were-they-who-are-they-and-what-are-they-looking 38/40
Source: SNL Financial and FactSet.
Conclusions
Recently, returns in bank stocks have been on par with the S&P 500
The regional bank index returned 10.5% in 2012, which mirrored the return on the S&P 500
Trailing twenty-four month returns have slightly lagged the S&P 500, which returned 13.4%
Lowered expectations of bank stock investors are the result of changing industry trends:
Lower loan growth
Margin compression
Additional capital requirements (Basel III)
Bank investors are market neutral
Focus on current shareholders
Selectively target new investors
New positions likely came from transactions
Bank Stock Investors’ Perception
38

8/12/2019 1130 Sun Bank Investors Who Were They Who Are They and What Are They Looking For
http://slidepdf.com/reader/full/1130-sun-bank-investors-who-were-they-who-are-they-and-what-are-they-looking 39/40
Appendix

8/12/2019 1130 Sun Bank Investors Who Were They Who Are They and What Are They Looking For
http://slidepdf.com/reader/full/1130-sun-bank-investors-who-were-they-who-are-they-and-what-are-they-looking 40/40
Illustrative Model – Bank XYZ
Approach and Assumptions
Illustrative, bottoms up valuation approach which depicts how the theoretical value of a bank and impliedmultiples are impacted by changes in assumptions in terms of profitability, asset growth and required capital
― By projecting an earnings stream based on an assumed ROAA and asset growth rate, one is able to calculatea dividend stream in relation to the excess capital generated above a certain TCE requirement. Thisdividend stream is then discounted back at the assumed cost of capital (assuming the dividend is a growingannuity) to arrive at the implied valuation of the bank. From that point, one can arrive at the implied
pricing multiples.
What Will the “New Normal” Look Like?