Embed Size (px)
Citation preview
12 Lead EKG Interpretation Advanced
12 Lead EKG Interpretation Advanced Concepts
Theresa Wadas PhD, DNP, ACNP-BC, FNP-BC, FAANP Assistant Professor
University of Alabama Capstone College of Nursing
Objectives:
• Describe methods for axis, hypertrophy, and infarct identification.
• Demonstrate “putting it all together” for systematic 12 lead EKG interpretation.
• Review dysrhythmias encountered in clinical practice.
Summary
• Normal Conduction
• Leads
• Normal Waveforms
• Rate
• Rhythm
• Waveform Analysis
12 Lead EKG Interpretation Advanced
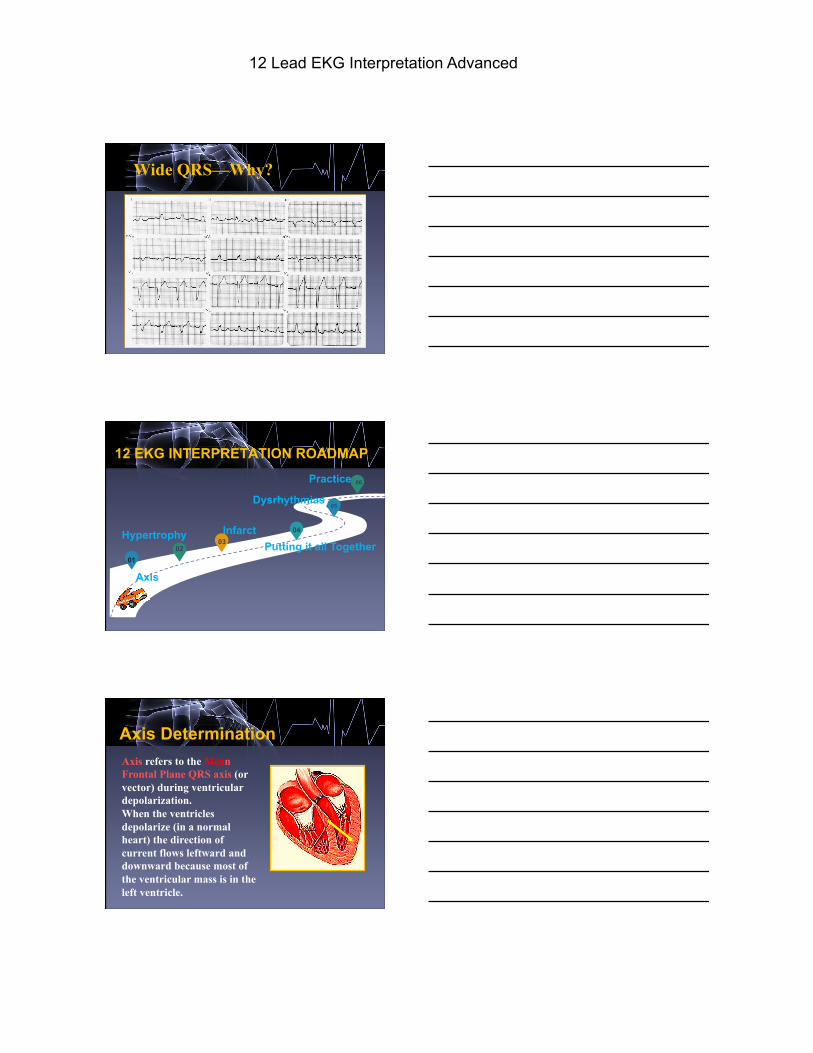
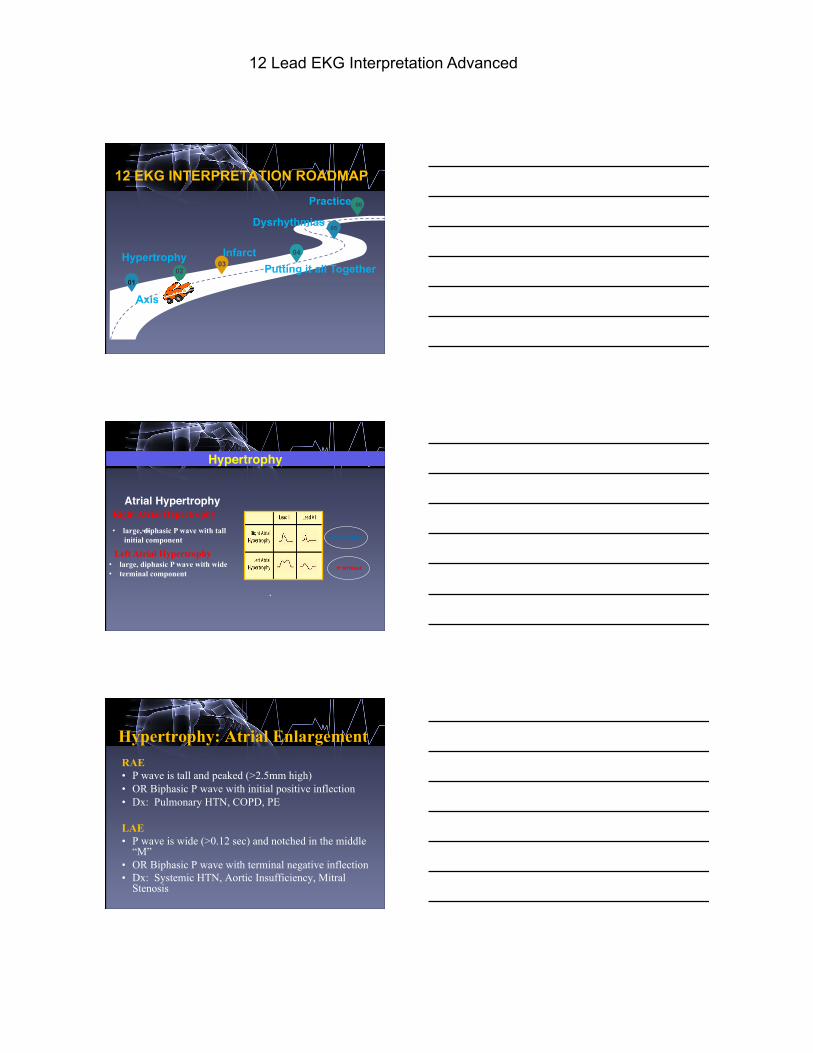
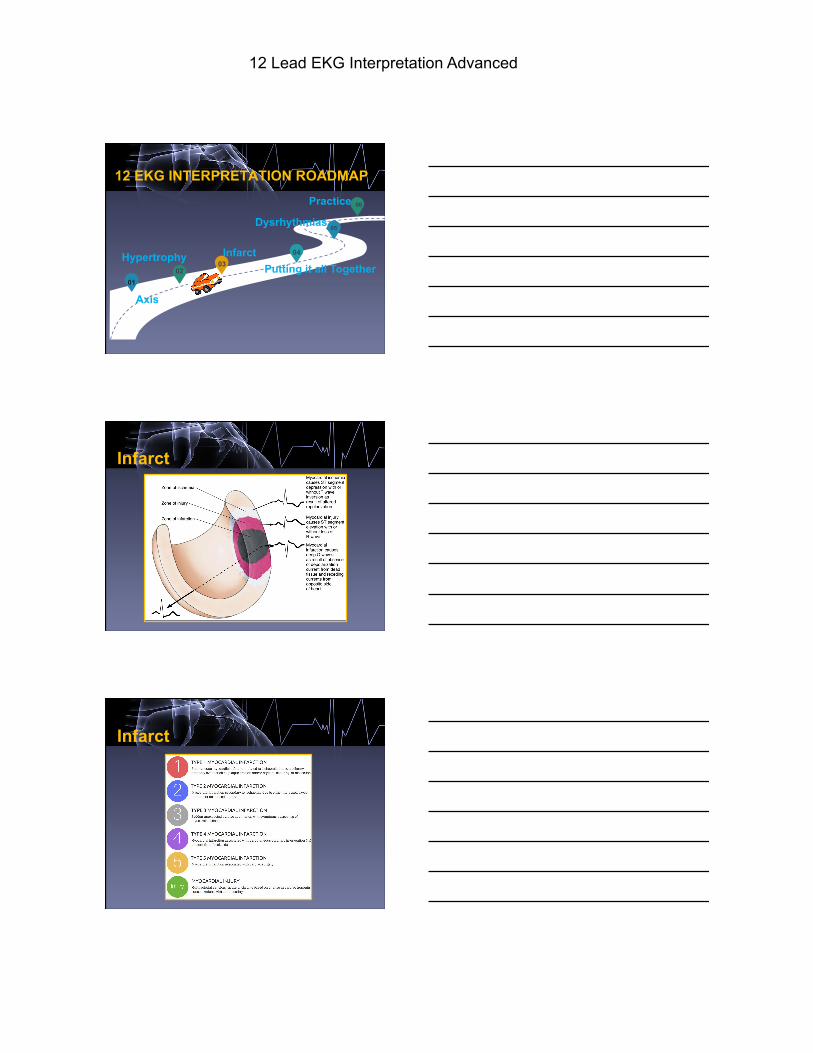
12 EKG INTERPRETATION ROADMAP
03 02
04
05
06
01
Practice.
Dysrhythmias
Infarct Putting it all Together
Hypertrophy
Axis
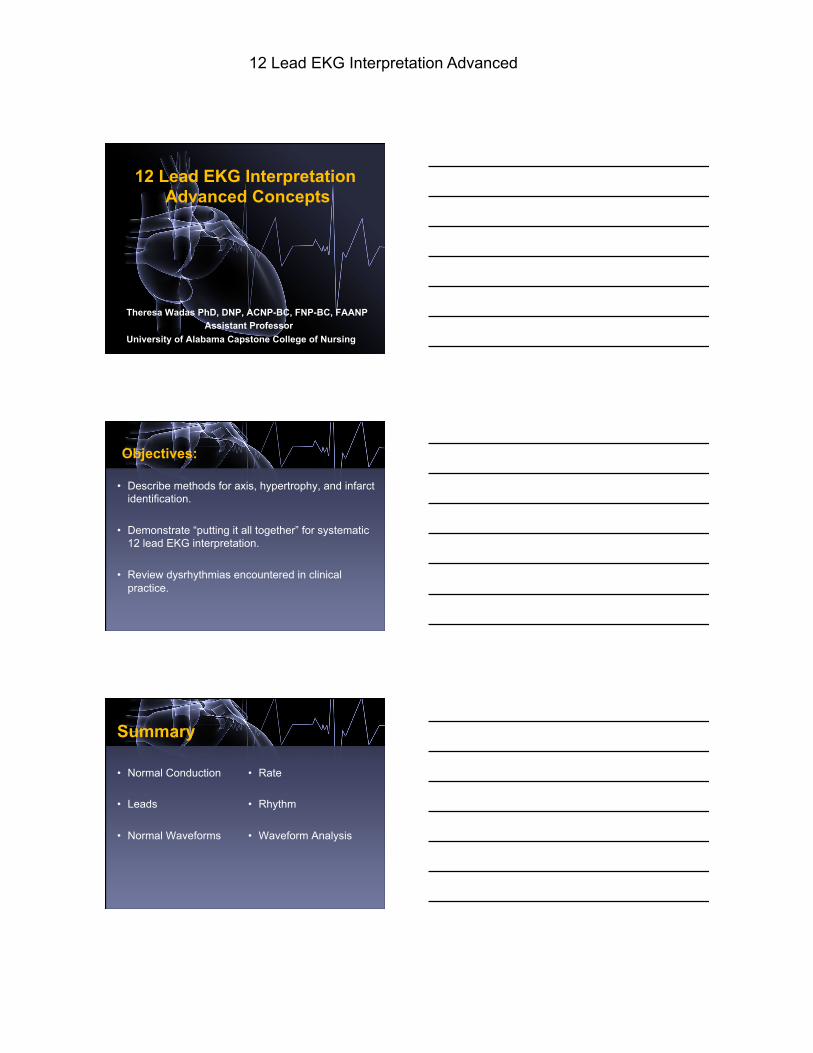
Electrical Conduction in the Heart
Bundle Branch Blocks
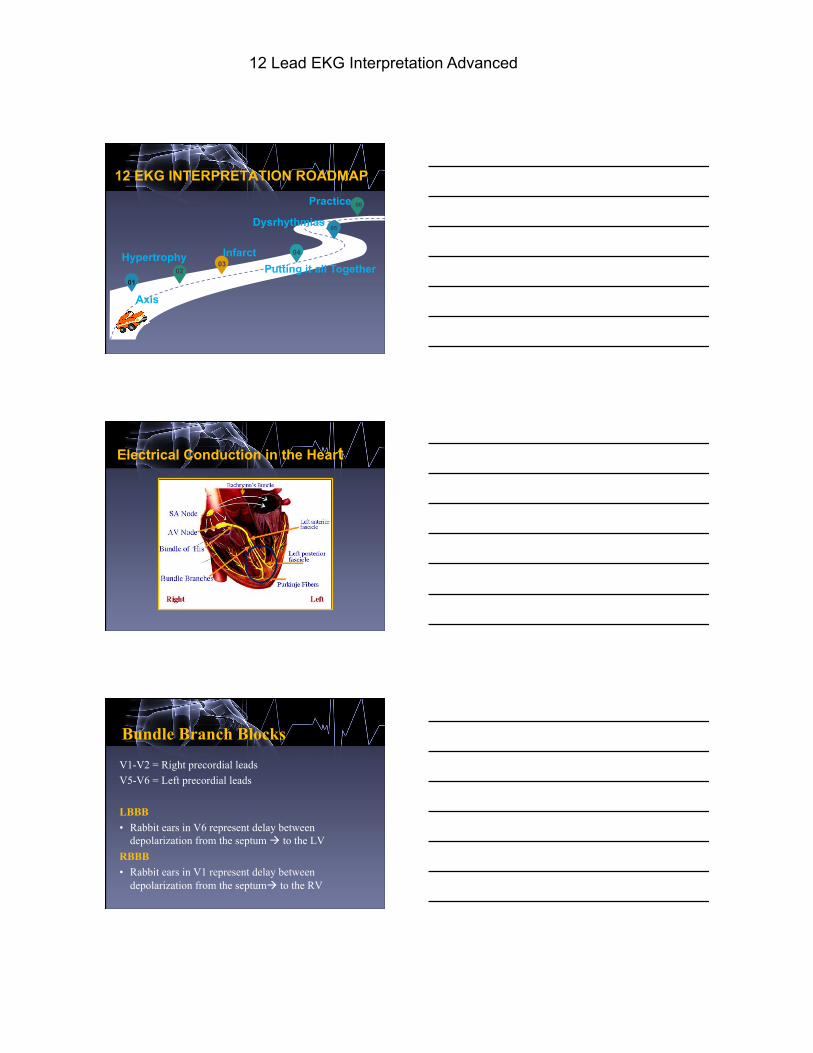
V1-V2 = Right precordial leads V5-V6 = Left precordial leads LBBB • Rabbit ears in V6 represent delay between
depolarization from the septum à to the LV RBBB • Rabbit ears in V1 represent delay between
depolarization from the septumà to the RV
12 Lead EKG Interpretation Advanced
Bundle Branch Blocks
V1-V2 = Right precordial leads V5-V6 = Left precordial leads LBBB • Rabbit ears in V6 represent delay between
depolarization from the septum à to the LV RBBB • Rabbit ears in V1 represent delay between
depolarization from the septumà to the RV
Bundle Branch Blocks
V1 V6
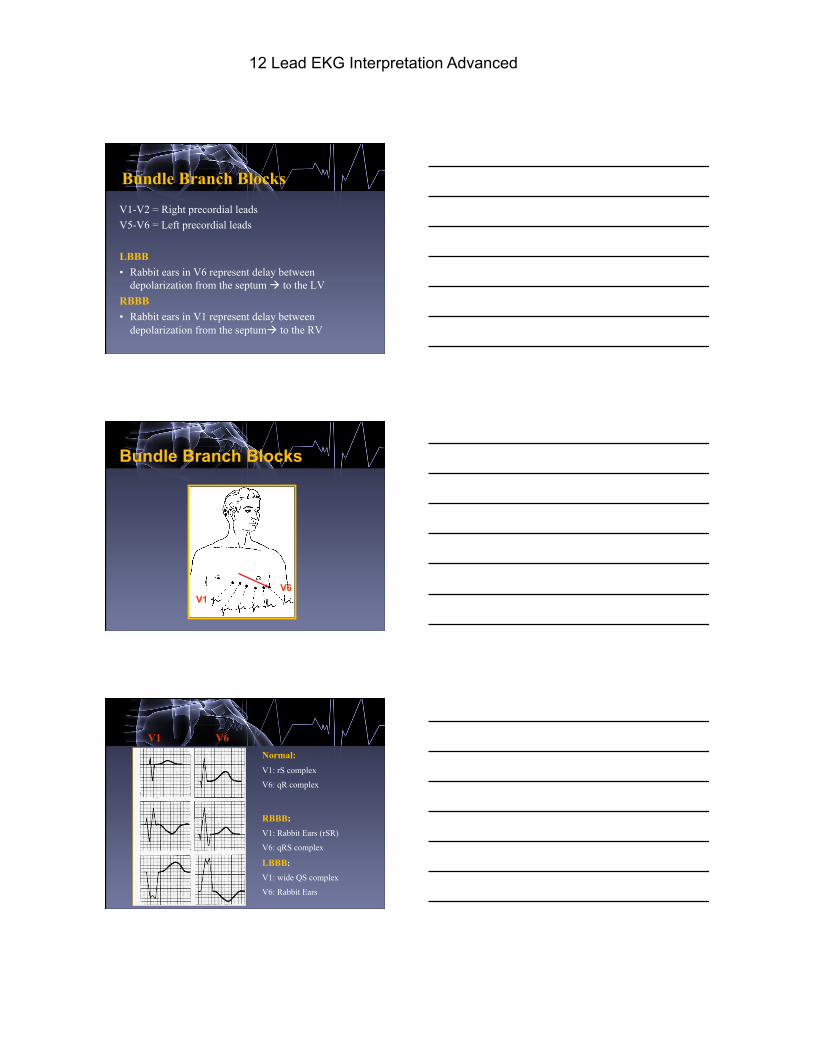
Normal: V1: rS complex
V6: qR complex
RBBB: V1: Rabbit Ears (rSR)
V6: qRS complex
LBBB:
V1: wide QS complex
V6: Rabbit Ears
V1 V6
12 Lead EKG Interpretation Advanced
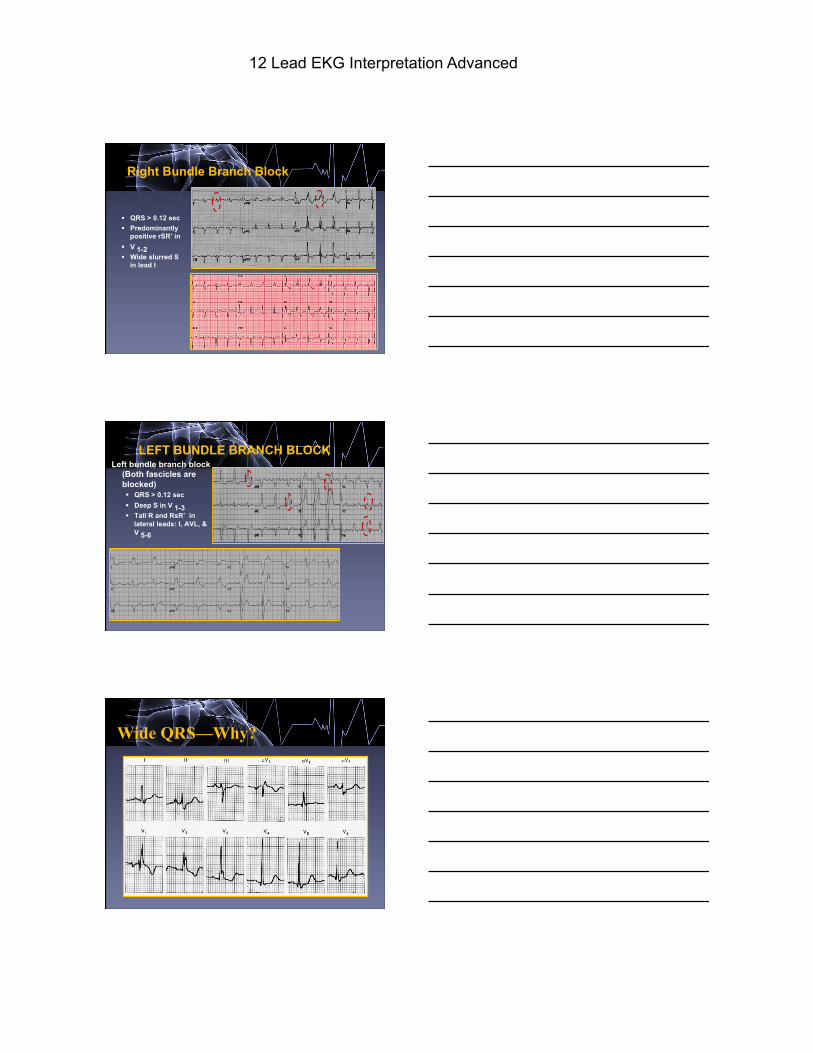
Right Bundle Branch Block
§ QRS > 0.12 sec § Predominantly
positive rSR’ in § V 1-2 § Wide slurred S
in lead I
LEFT BUNDLE BRANCH BLOCK Left bundle branch block
(Both fascicles are blocked) § QRS > 0.12 sec § Deep S in V 1-3 § Tall R and RsR’ in
lateral leads: I, AVL, & V 5-6
Wide QRS—Why?
12 Lead EKG Interpretation Advanced
Wide QRS—Why?
12 EKG INTERPRETATION ROADMAP
03 02
04
05
06
01
Practice.
Dysrhythmias
Infarct Putting it all Together
Hypertrophy
Axis
Axis Determination Axis refers to the Mean Frontal Plane QRS axis (or vector) during ventricular depolarization. When the ventricles depolarize (in a normal heart) the direction of current flows leftward and downward because most of the ventricular mass is in the left ventricle.
12 Lead EKG Interpretation Advanced
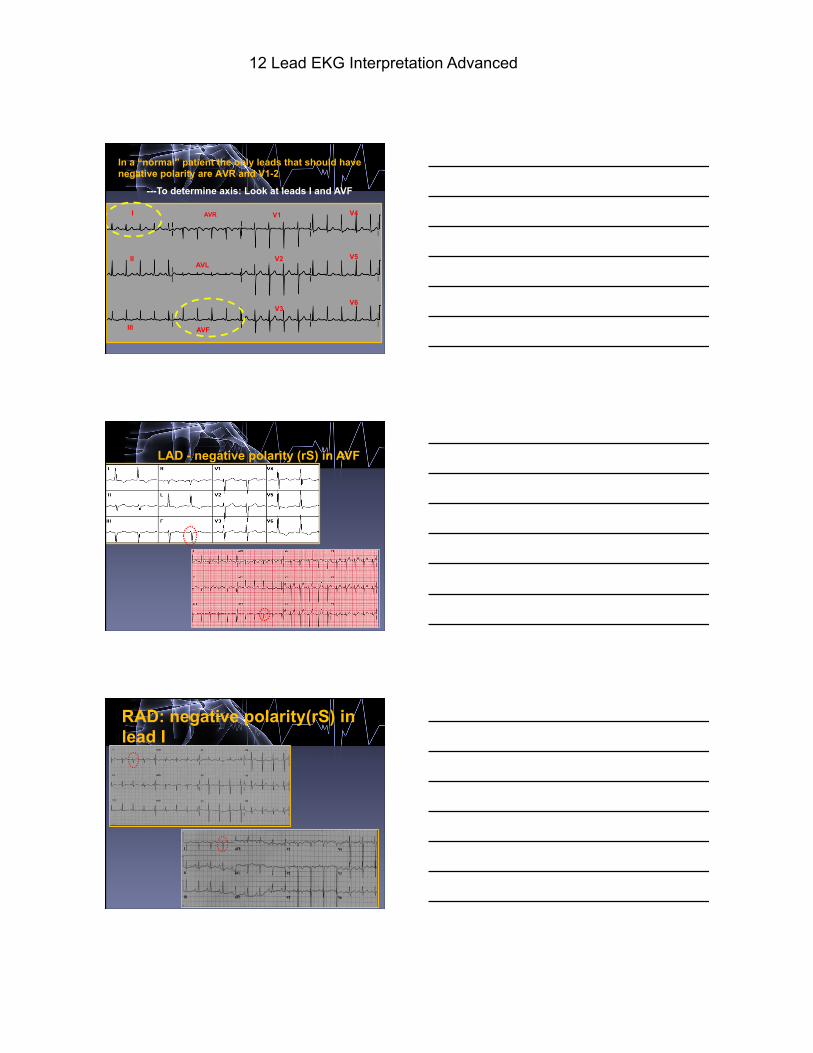
In a “normal” patient the only leads that should have negative polarity are AVR and V1-2
AVF
I
II
III
AVL
V1
V2
V3
V4
V5
V6
AVR
---To determine axis: Look at leads I and AVF
LAD - negative polarity (rS) in AVF
RAD: negative polarity(rS) in lead I
12 Lead EKG Interpretation Advanced
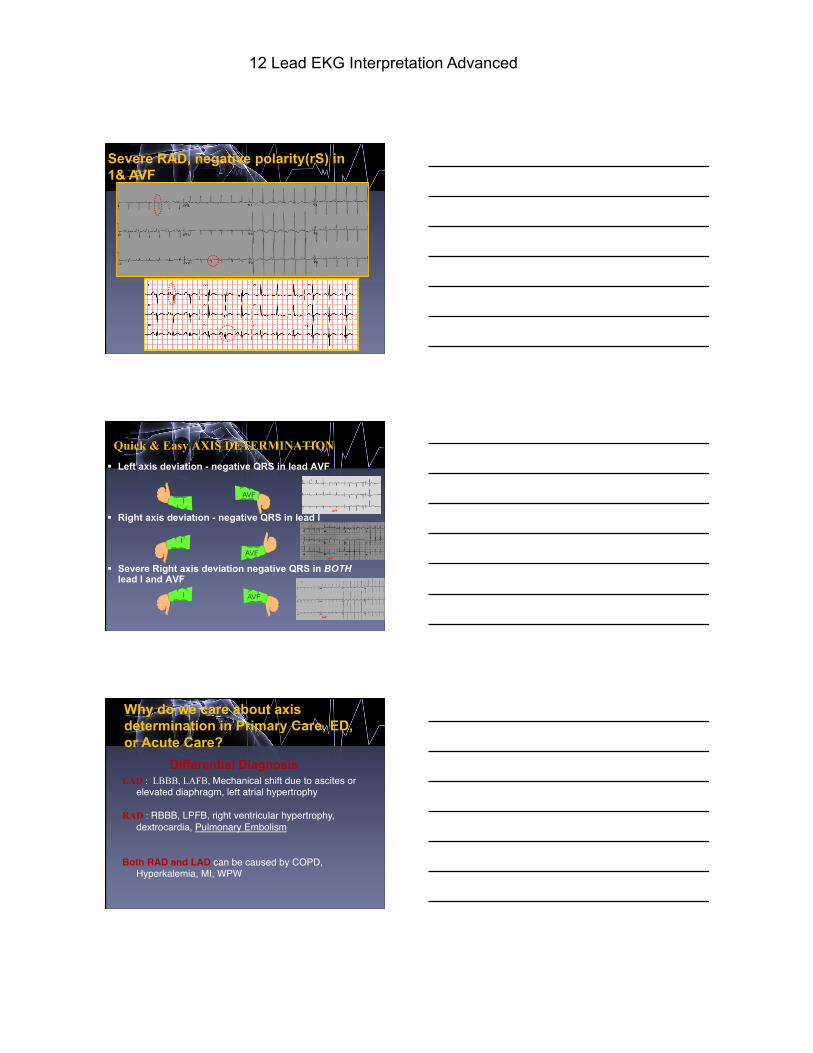
Severe RAD, negative polarity(rS) in 1& AVF
§ Left axis deviation - negative QRS in lead AVF
§ Right axis deviation - negative QRS in lead I
§ Severe Right axis deviation negative QRS in BOTH lead I and AVF
Quick & Easy AXIS DETERMINATION
AVF
AVF
AVF
AVF
AVF
AVF
I
I
I
I
I
I
Why do we care about axis determination in Primary Care, ED, or Acute Care?
Differential Diagnosis LAD : LBBB, LAFB, Mechanical shift due to ascites or
elevated diaphragm, left atrial hypertrophy RAD : RBBB, LPFB, right ventricular hypertrophy,
dextrocardia, Pulmonary Embolism
Both RAD and LAD can be caused by COPD, Hyperkalemia, MI, WPW
12 Lead EKG Interpretation Advanced
12 EKG INTERPRETATION ROADMAP
03 02
04
05
06
01
Practice.
Dysrhythmias
Infarct Putting it all Together
Hypertrophy
Axis
Hypertrophy
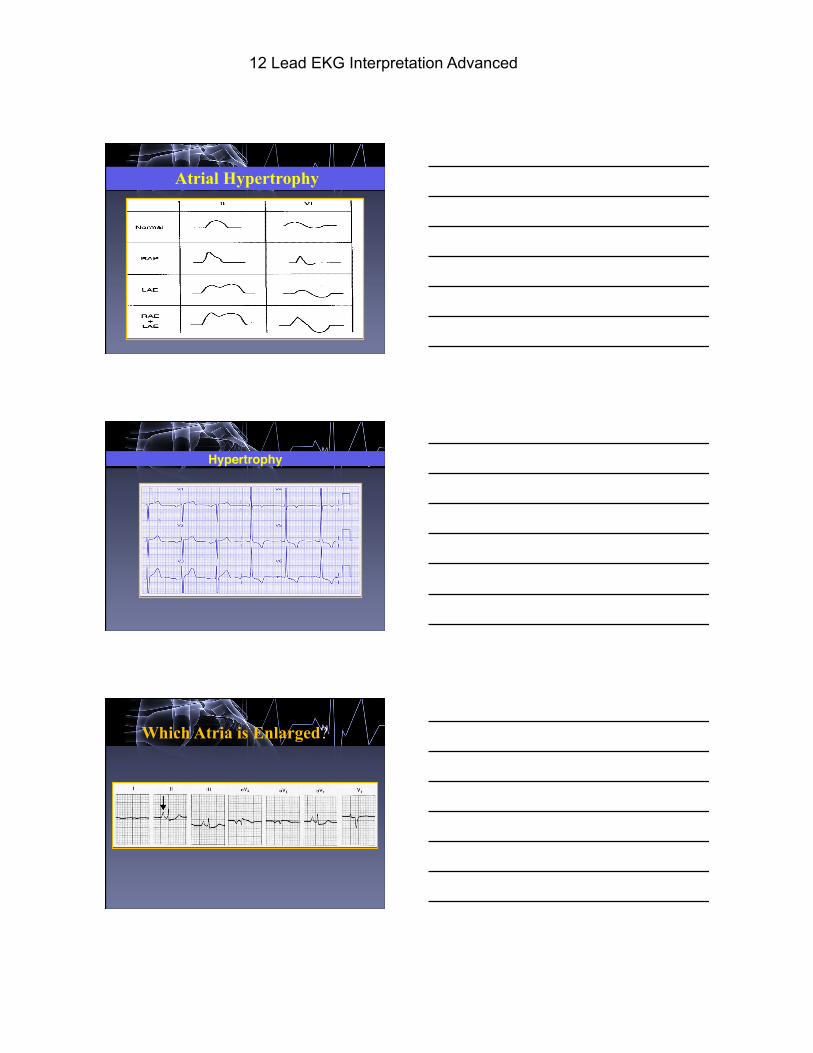
Atrial HypertrophyRight Atrial Hypertrophy
Initial
Left Atrial Hypertrophy • large, diphasic P wave with wide • terminal component
•
•
‘P’ PULMONALE
‘P’ MITRALE
• large, diphasic P wave with tall initial component
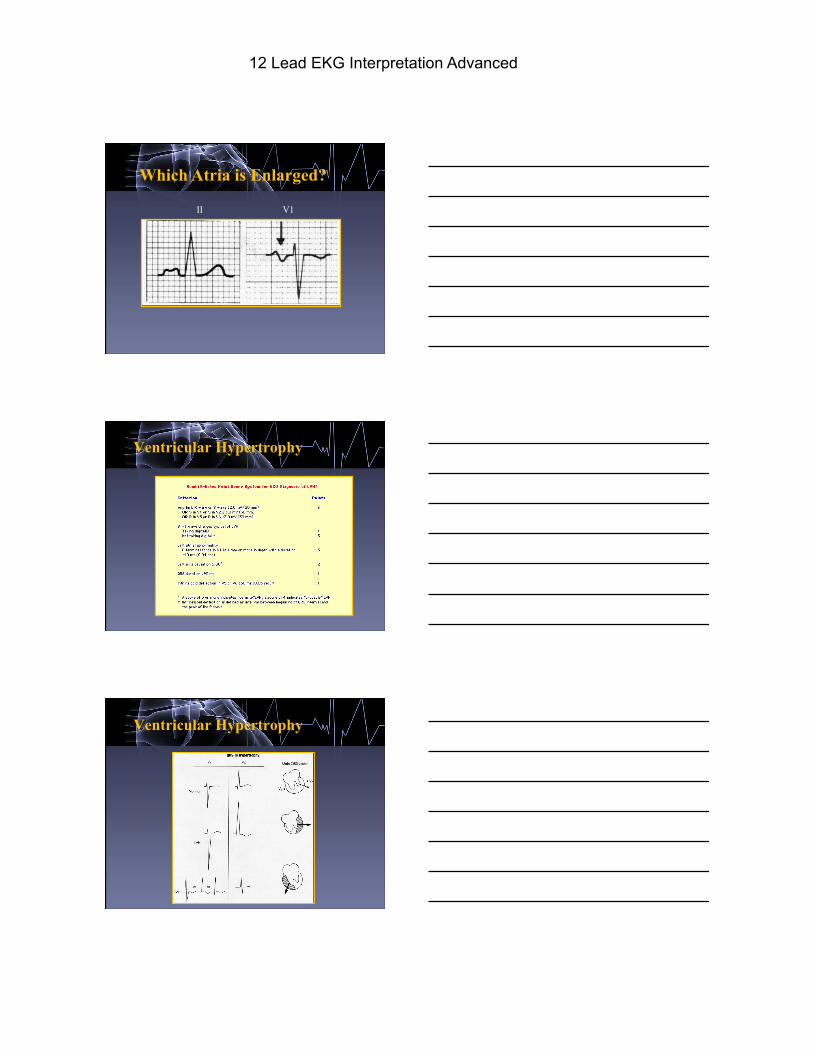
Hypertrophy: Atrial Enlargement RAE • P wave is tall and peaked (>2.5mm high) • OR Biphasic P wave with initial positive inflection • Dx: Pulmonary HTN, COPD, PE LAE • P wave is wide (>0.12 sec) and notched in the middle
“M” • OR Biphasic P wave with terminal negative inflection • Dx: Systemic HTN, Aortic Insufficiency, Mitral
Stenosis
12 Lead EKG Interpretation Advanced
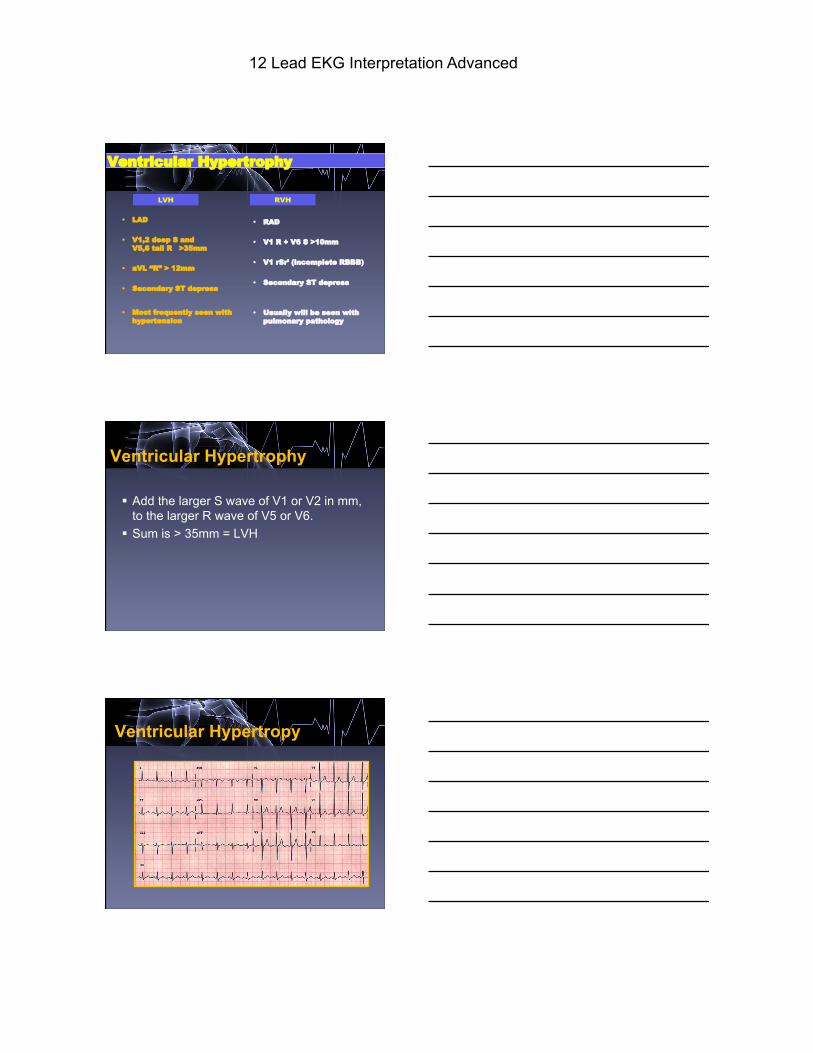
Atrial Hypertrophy
Hypertrophy
•
•
•
Which Atria is Enlarged?
12 Lead EKG Interpretation Advanced
Which Atria is Enlarged?
II V1
Ventricular Hypertrophy
Ventricular Hypertrophy
12 Lead EKG Interpretation Advanced
• LAD
• V1,2 deep S and V5,6 tall R >35mm
• aVL “R” > 12mm
• Secondary ST depress
• Most frequently seen with hypertension
• RAD
• V1 R + V6 S >10mm
• V1 rSr’ (incomplete RBBB)
• Secondary ST depress
• Usually will be seen with
pulmonary pathology
Ventricular Hypertrophy
LVH RVH
Ventricular Hypertrophy
§ Add the larger S wave of V1 or V2 in mm, to the larger R wave of V5 or V6.
§ Sum is > 35mm = LVH
Ventricular Hypertropy
12 Lead EKG Interpretation Advanced
12 EKG INTERPRETATION ROADMAP
03 02
04
05
06
01
Practice.
Dysrhythmias
Infarct Putting it all Together
Hypertrophy
Axis
Infarct
Infarct
12 Lead EKG Interpretation Advanced
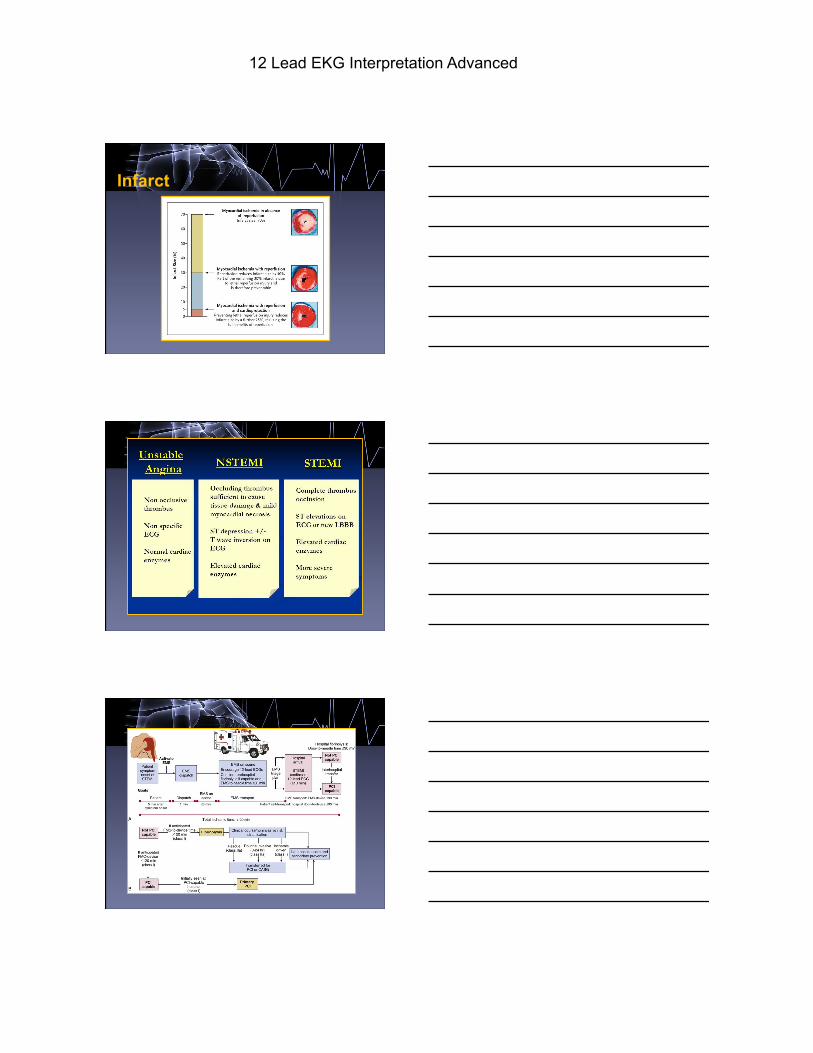
Infarct
Infarct
Infarct
12 Lead EKG Interpretation Advanced
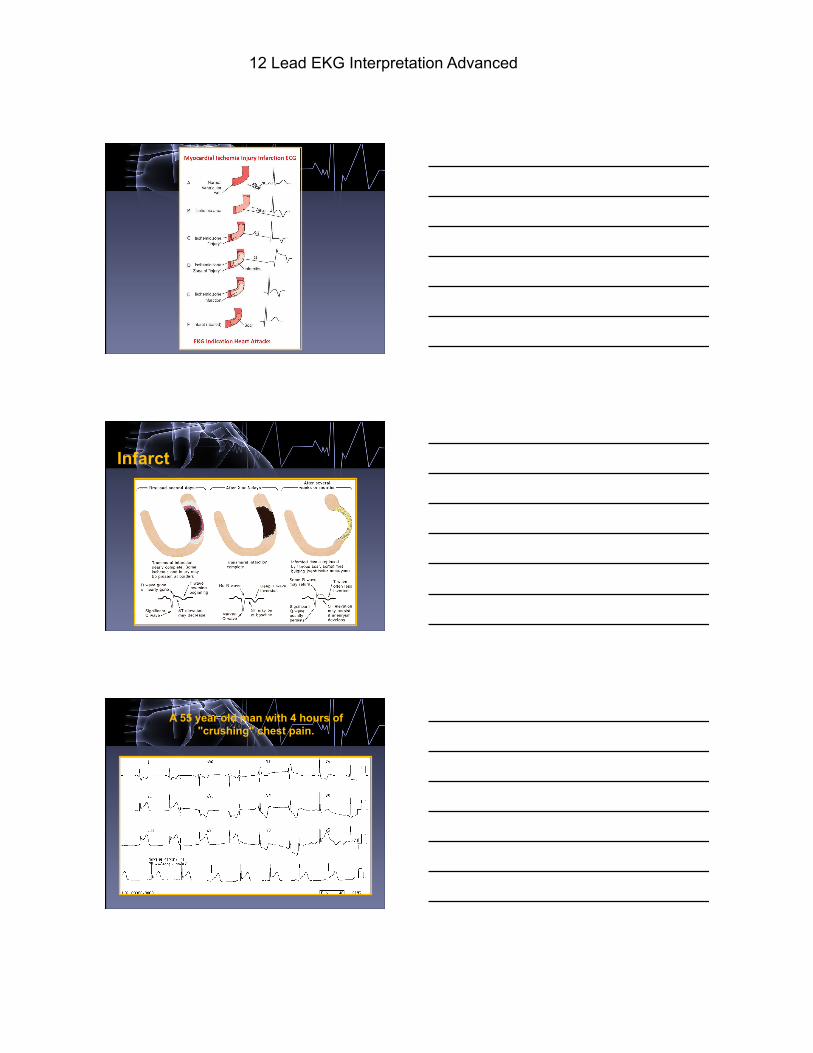
Infarct
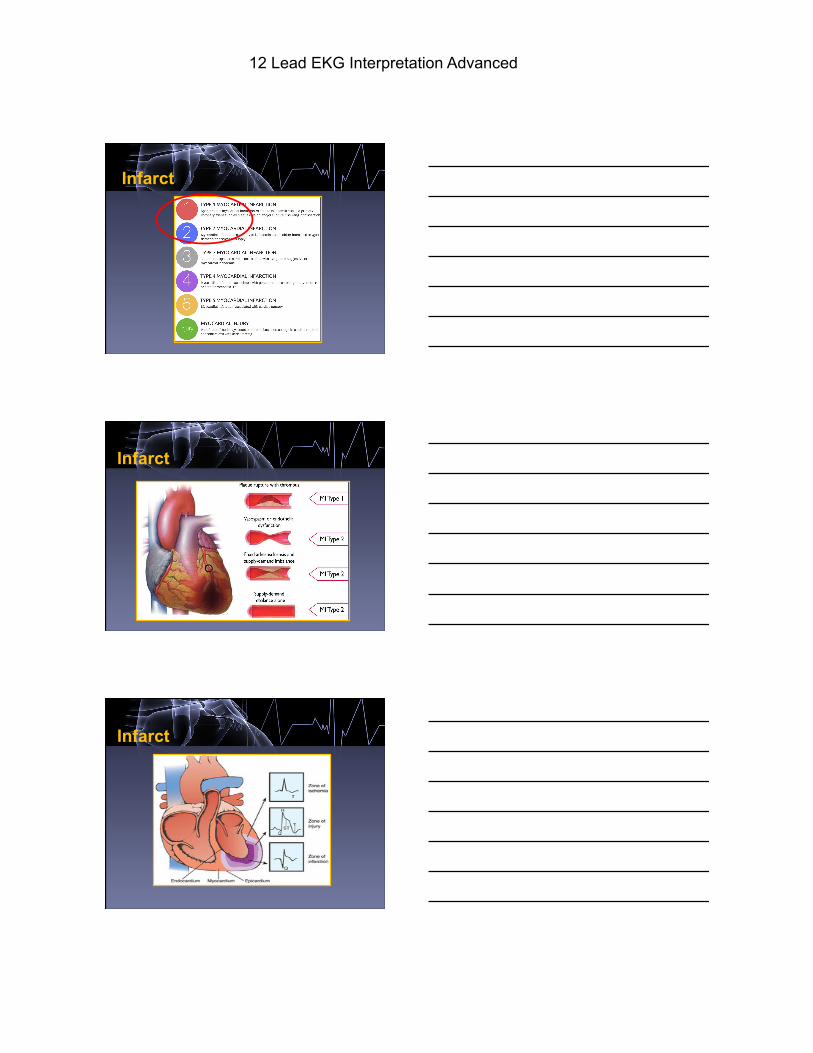
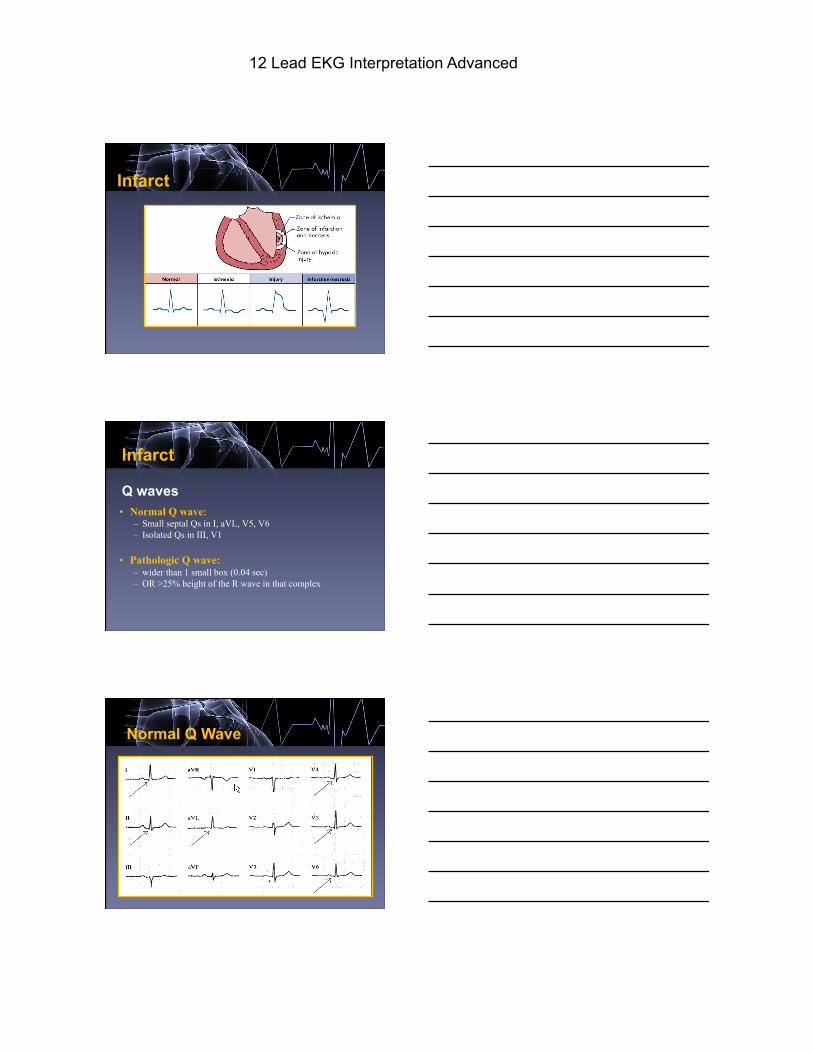
Q waves • Normal Q wave:
– Small septal Qs in I, aVL, V5, V6 – Isolated Qs in III, V1
• Pathologic Q wave: – wider than 1 small box (0.04 sec) – OR >25% height of the R wave in that complex
Infarct
Normal Q waves
Normal Q Wave
12 Lead EKG Interpretation Advanced
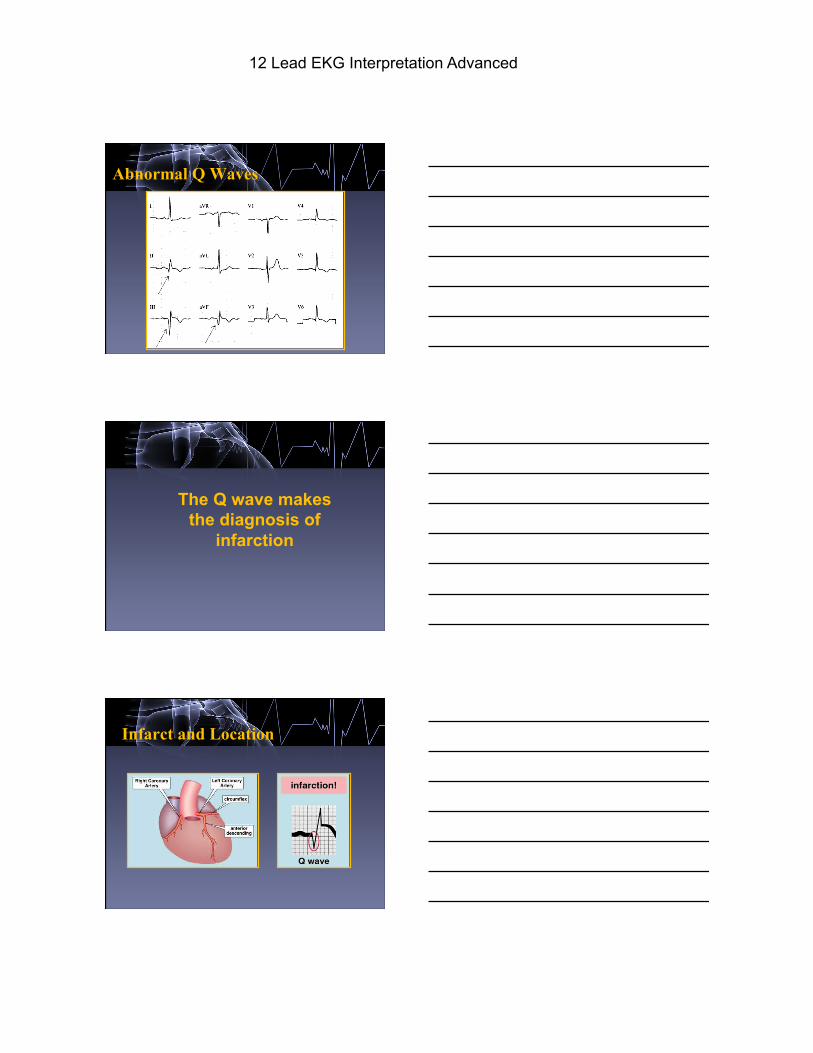
Abnormal Q Waves
The Q wave makes the diagnosis of
infarction
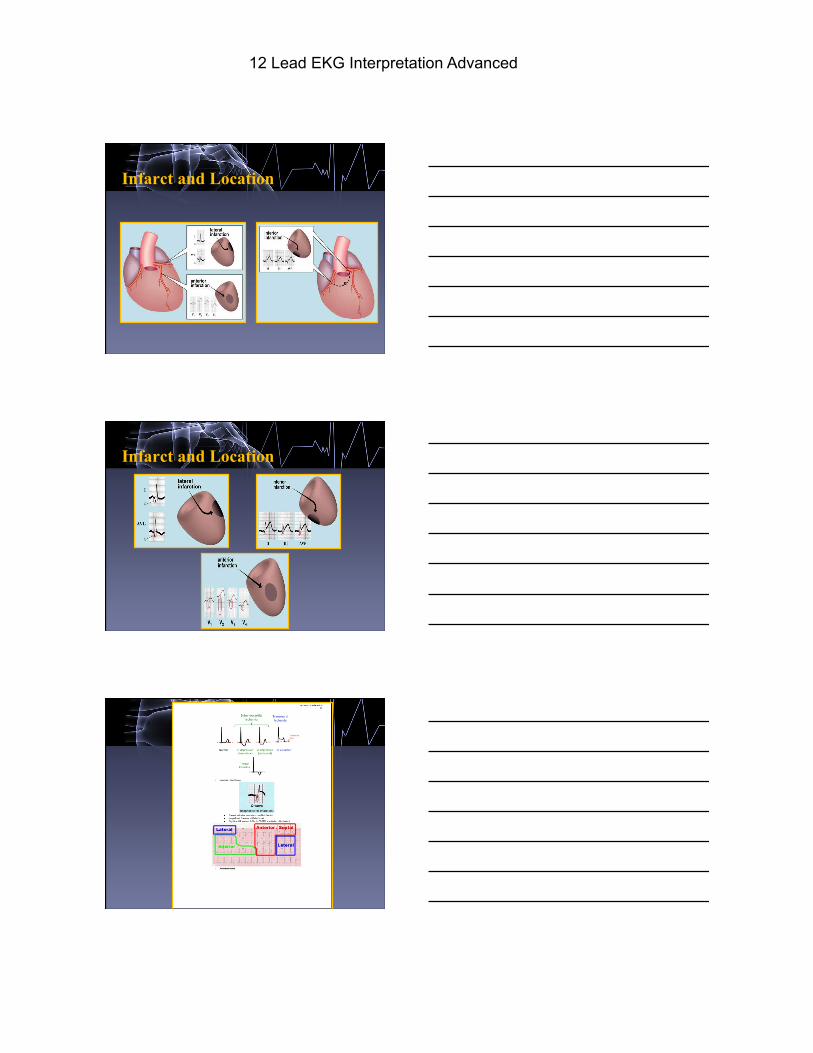
Infarct and Location
12 Lead EKG Interpretation Advanced
Infarct and Location
Infarct and Location
12 Lead EKG Interpretation Advanced
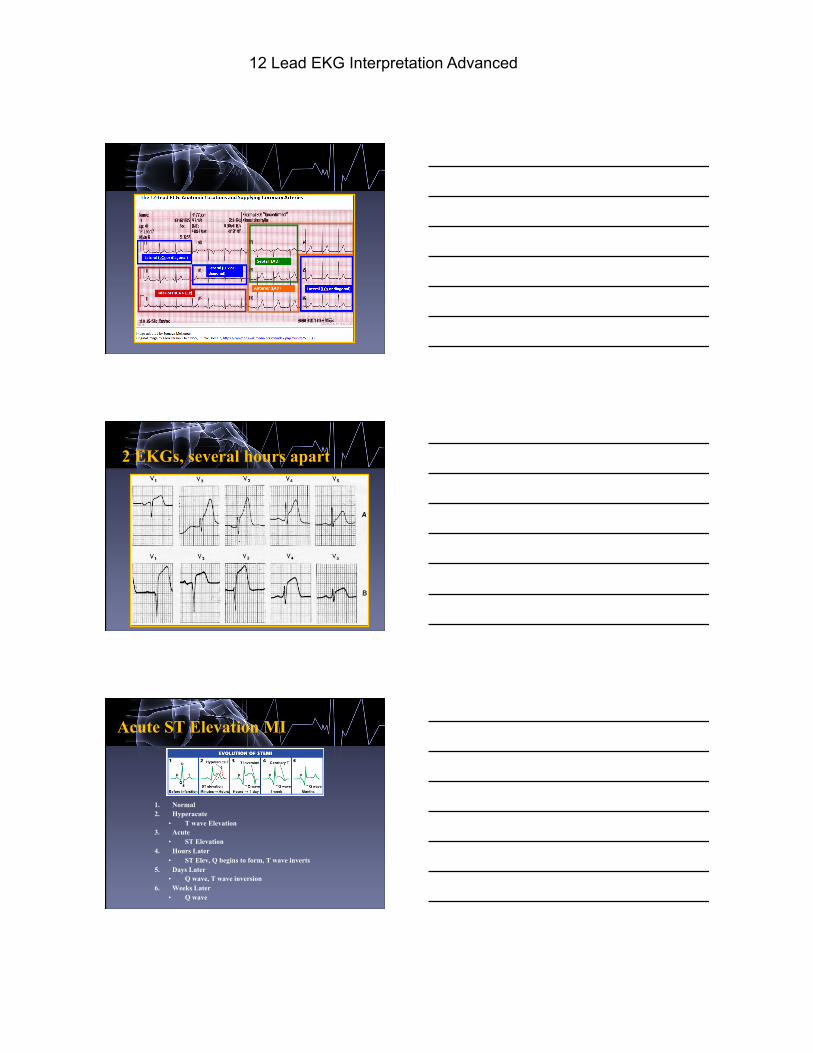
2 EKGs, several hours apart
Acute ST Elevation MI
1. Normal 2. Hyperacute
• T wave Elevation 3. Acute
• ST Elevation 4. Hours Later
• ST Elev, Q begins to form, T wave inverts 5. Days Later
• Q wave, T wave inversion 6. Weeks Later
• Q wave
12 Lead EKG Interpretation Advanced
Infarct
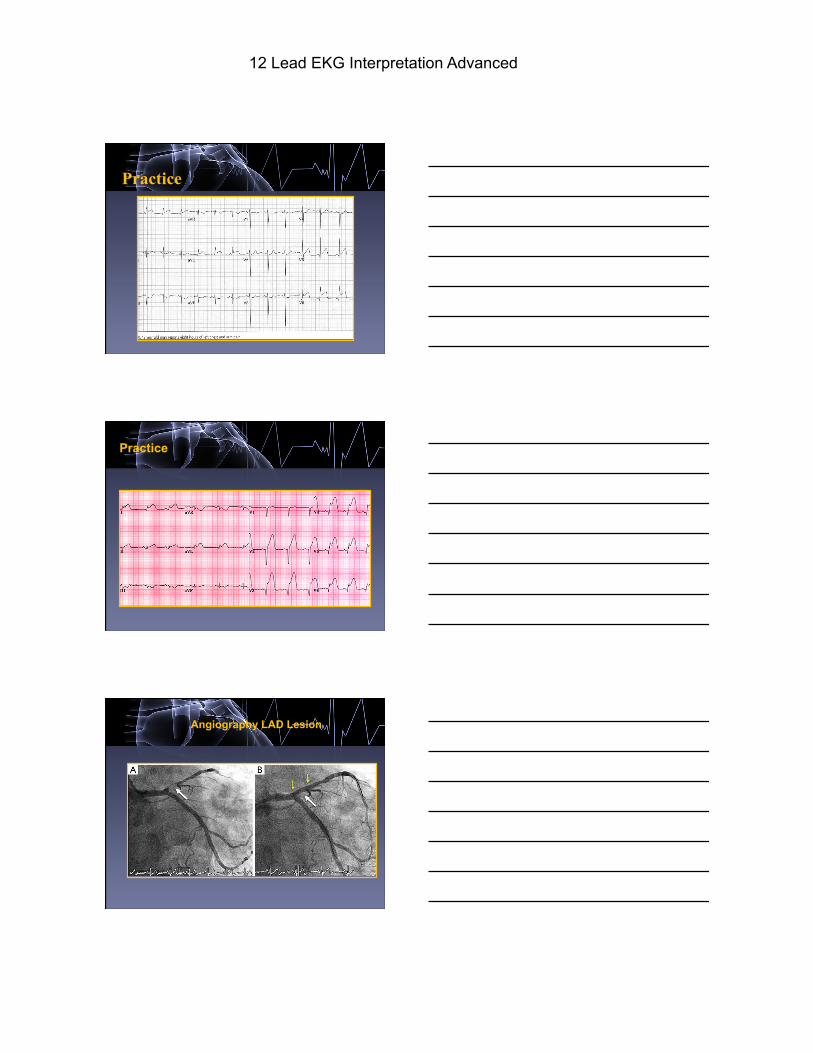
A 55 year old man with 4 hours of "crushing" chest pain.
12 Lead EKG Interpretation Advanced
Practice
Practice
Angiography LAD Lesion
12 Lead EKG Interpretation Advanced
Infarct
12 Lead EKG Interpretation Advanced
12 EKG INTERPRETATION ROADMAP
03 02
04
05
06
01
Practice.
Dysrhythmias
Infarct
Putting it all Together
Hypertrophy
Axis
12 Lead EKG Interpretation Advanced
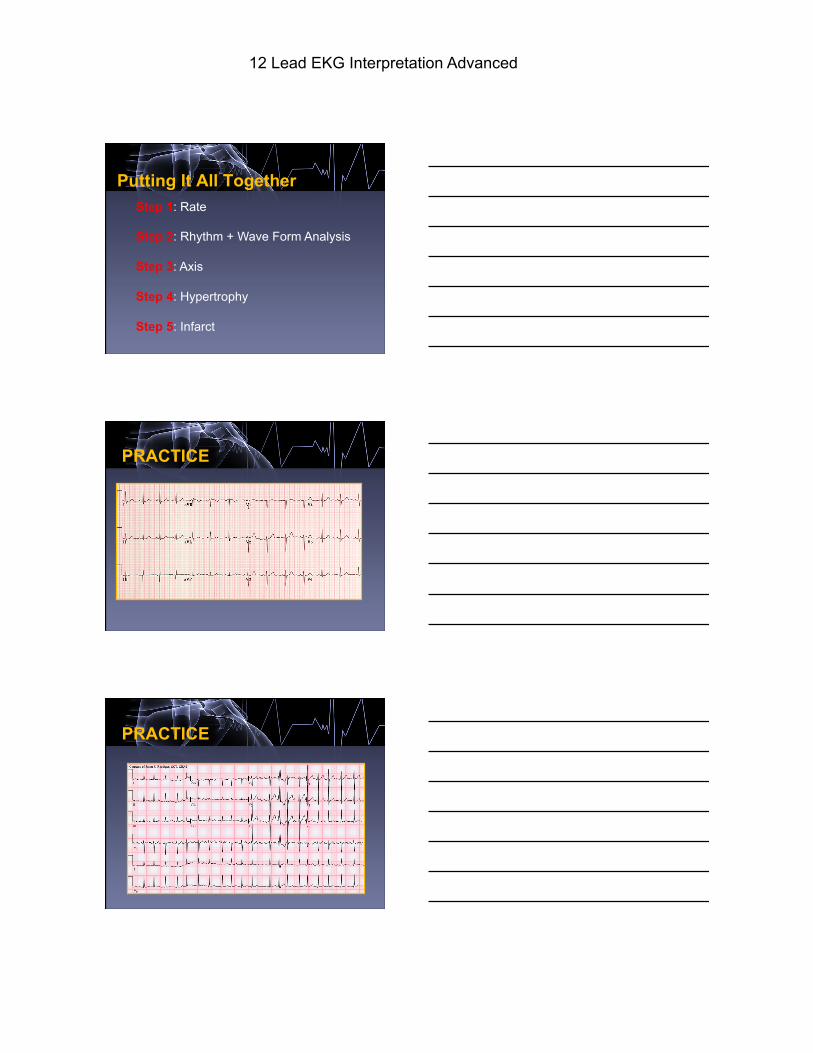
Putting It All Together Step 1: Rate Step 2: Rhythm + Wave Form Analysis Step 3: Axis Step 4: Hypertrophy Step 5: Infarct
PRACTICE
PRACTICE
12 Lead EKG Interpretation Advanced
12 EKG INTERPRETATION ROADMAP
03 02
04
05
06
01
Practice.
Dysrhythmias
Infarct Putting it all Together
Hypertrophy
Axis
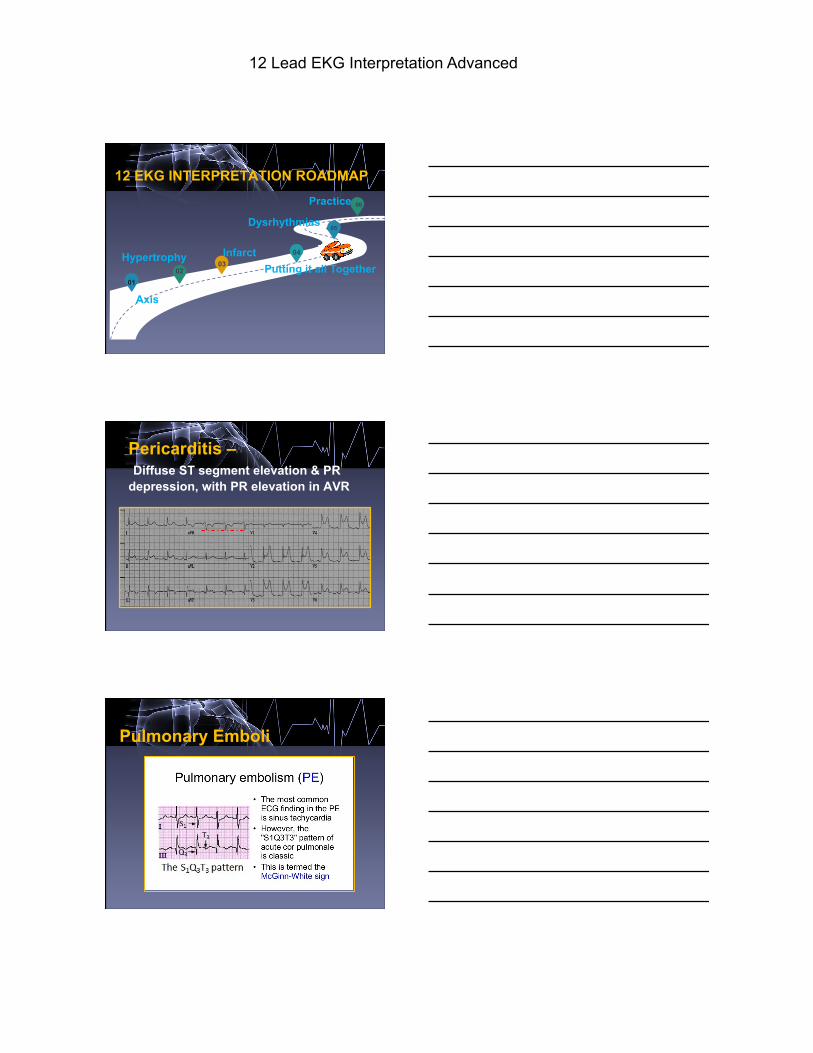
Pericarditis – Diffuse ST segment elevation & PR depression, with PR elevation in AVR
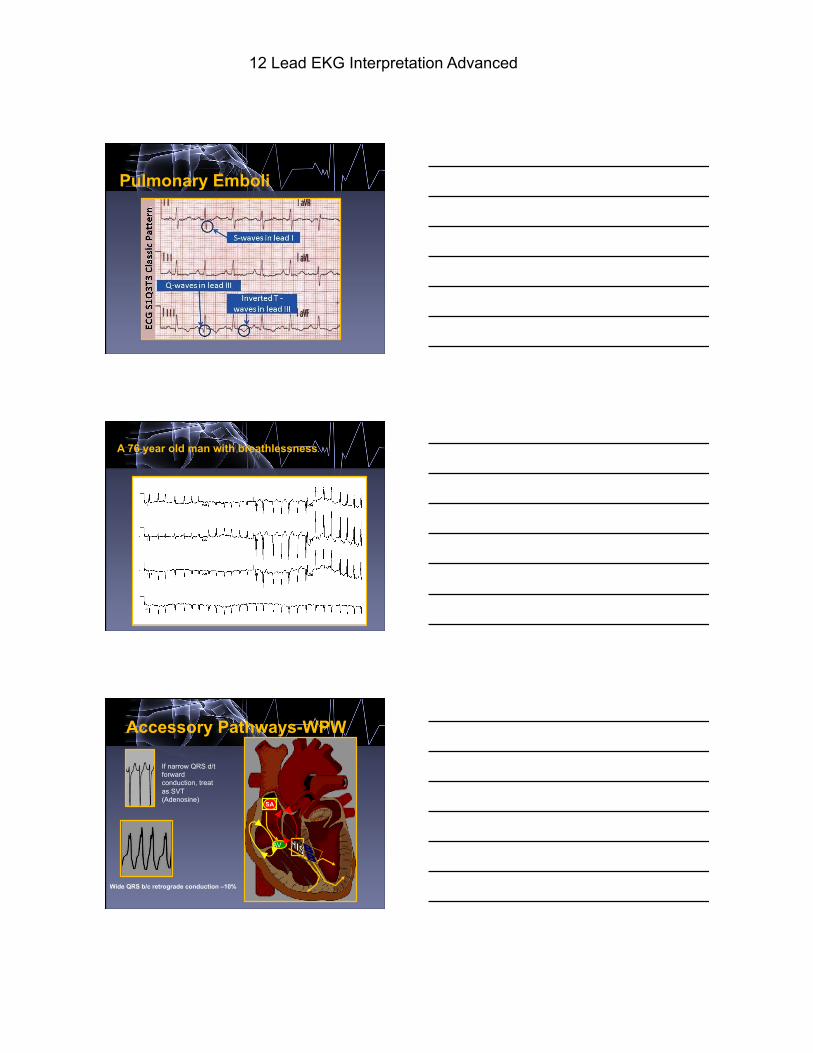
Pulmonary Emboli
12 Lead EKG Interpretation Advanced
Pulmonary Emboli
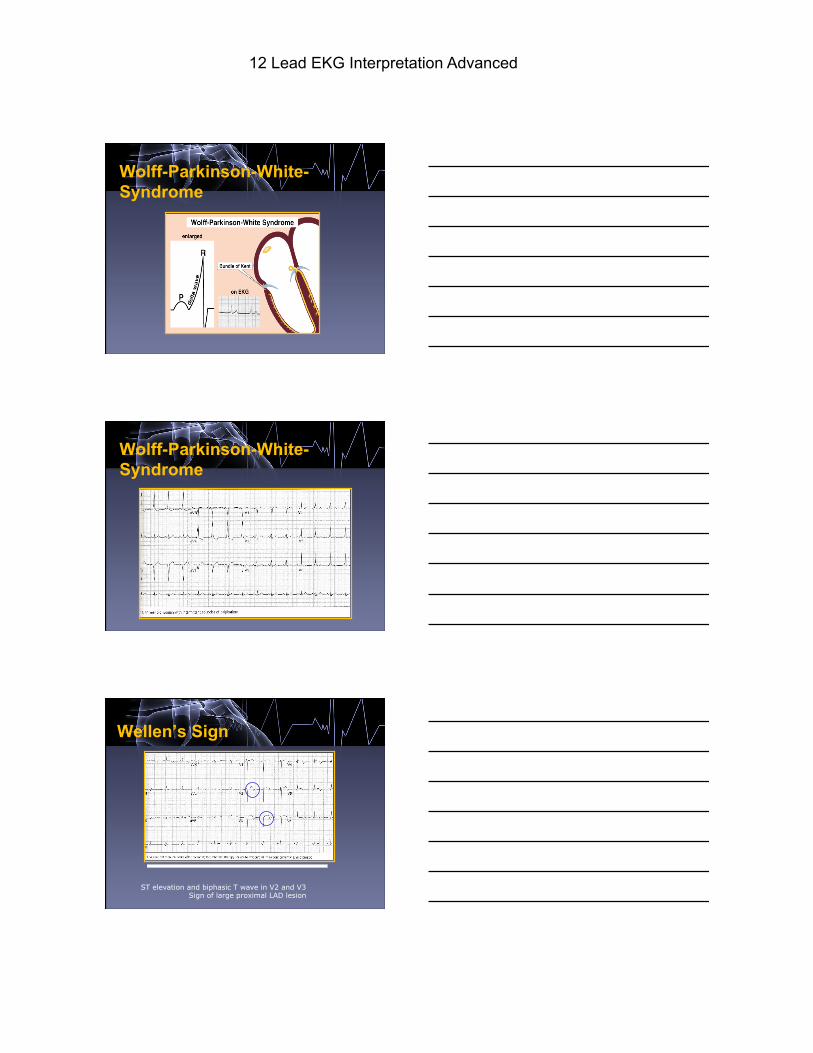
A 76 year old man with breathlessness.
AV
SA
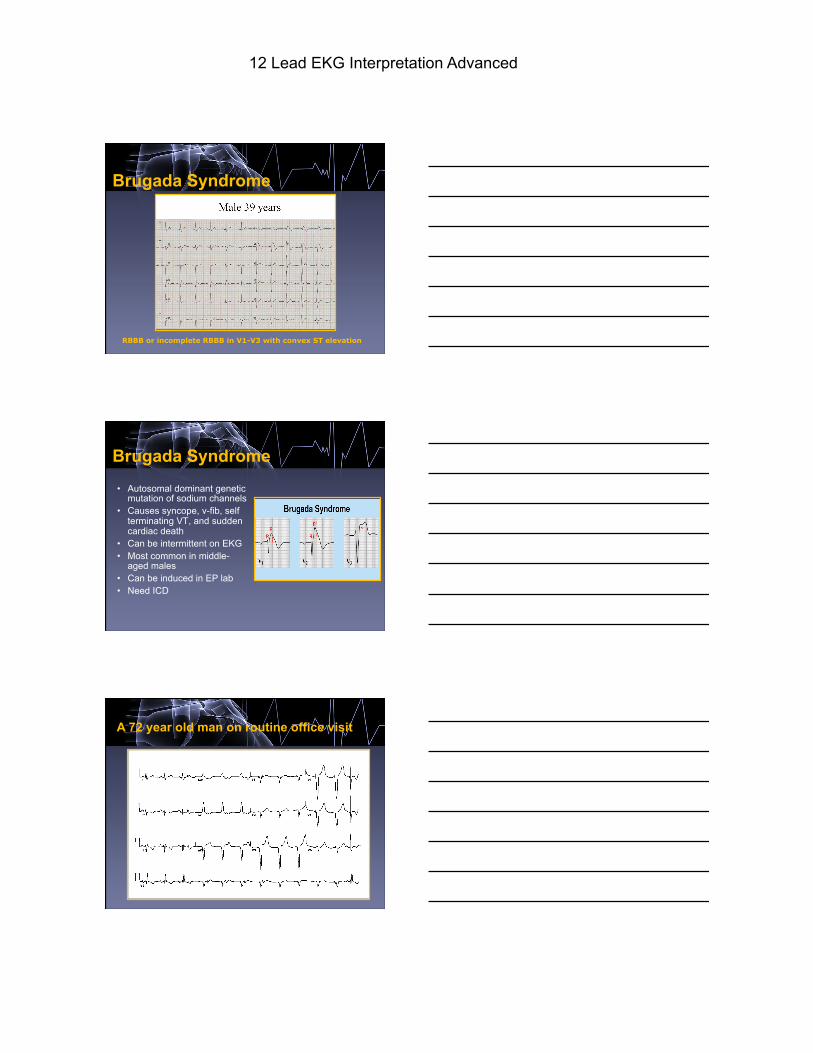
Accessory Pathways-WPW
If narrow QRS d/t forward conduction, treat as SVT (Adenosine)
Wide QRS b/c retrograde conduction –10%
12 Lead EKG Interpretation Advanced
Wolff-Parkinson-White-Syndrome
Wolff-Parkinson-White-Syndrome
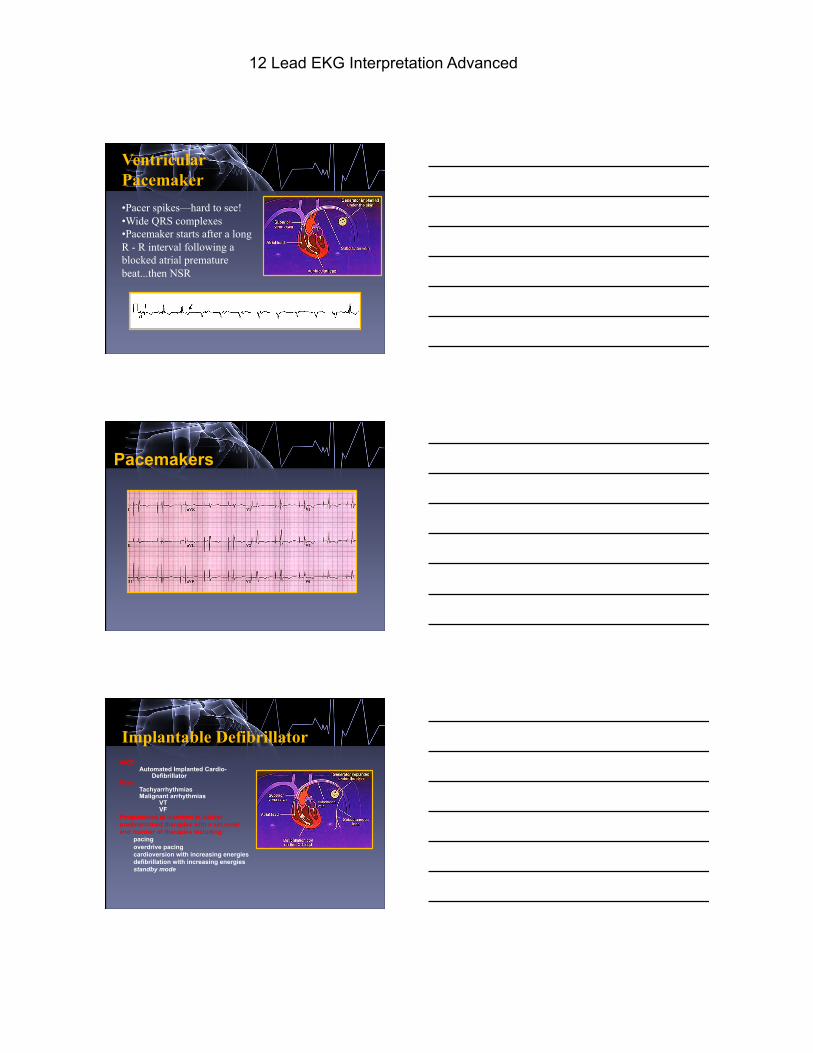
Wellen’s Sign
ST elevation and biphasic T wave in V2 and V3 Sign of large proximal LAD lesion
12 Lead EKG Interpretation Advanced
Brugada Syndrome
RBBB or incomplete RBBB in V1-V3 with convex ST elevation
Brugada Syndrome • Autosomal dominant genetic
mutation of sodium channels • Causes syncope, v-fib, self
terminating VT, and sudden cardiac death
• Can be intermittent on EKG • Most common in middle-
aged males • Can be induced in EP lab • Need ICD
A 72 year old man on routine office visit
12 Lead EKG Interpretation Advanced
Ventricular Pacemaker
• Pacer spikes—hard to see! • Wide QRS complexes • Pacemaker starts after a long R - R interval following a blocked atrial premature beat...then NSR
Pacemakers
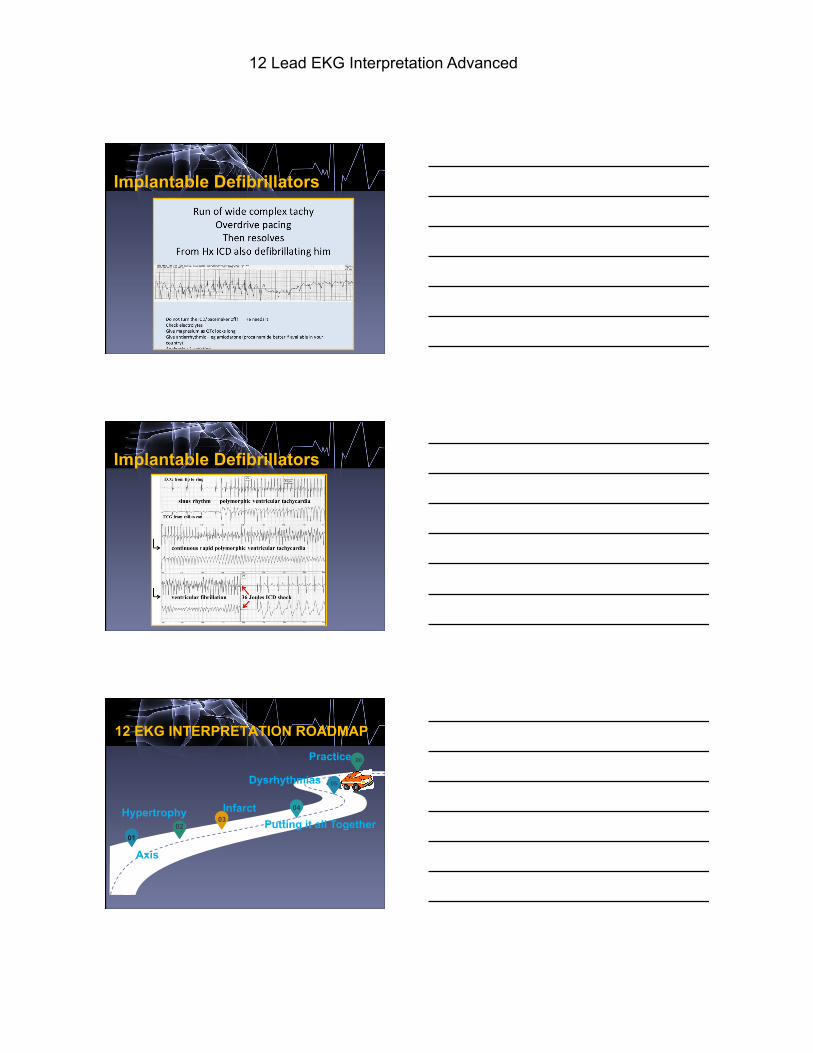
Implantable Defibrillator
AICD Automated Implanted Cardio-
Defibrillator Uses
Tachyarrhythmias Malignant arrhythmias
VT VF
Programmed at insertion to deliver predetermined therapies with a set order and number of therapies including:
pacing overdrive pacing cardioversion with increasing energies defibrillation with increasing energies standby mode
12 Lead EKG Interpretation Advanced
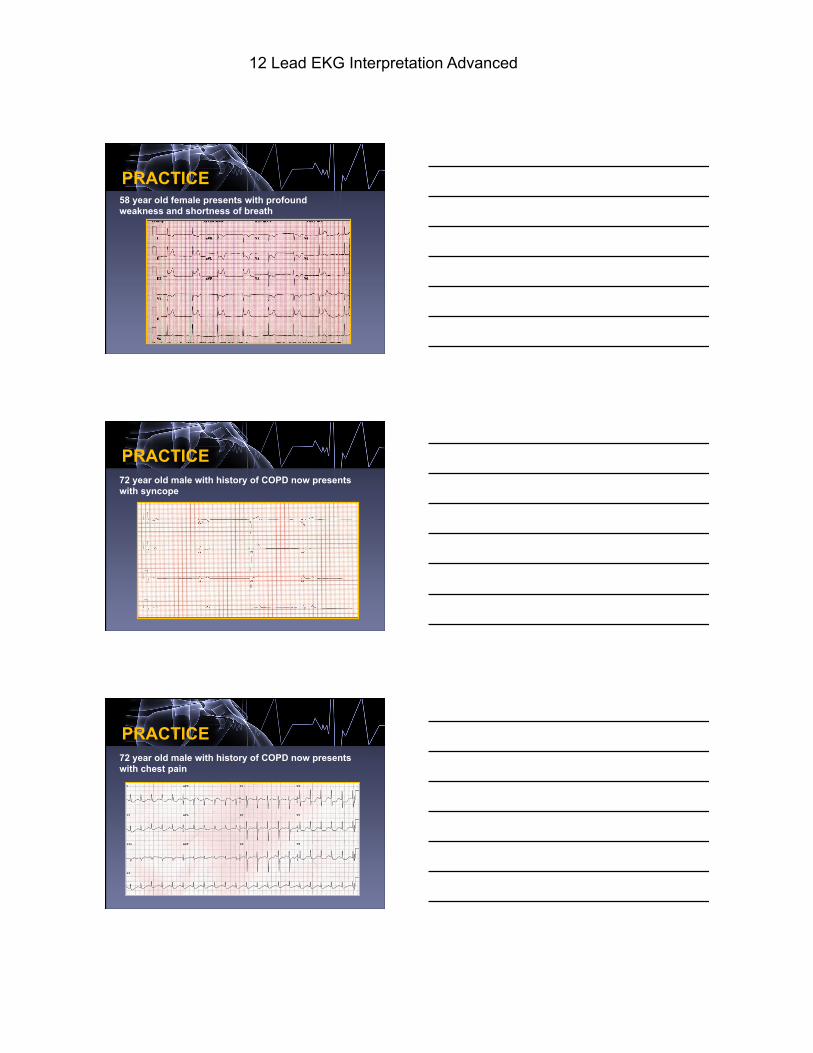
Implantable Defibrillators
Implantable Defibrillators
12 EKG INTERPRETATION ROADMAP
03 02
04
05
06
01
Practice.
Dysrhythmias
Infarct Putting it all Together
Hypertrophy
Axis
12 Lead EKG Interpretation Advanced
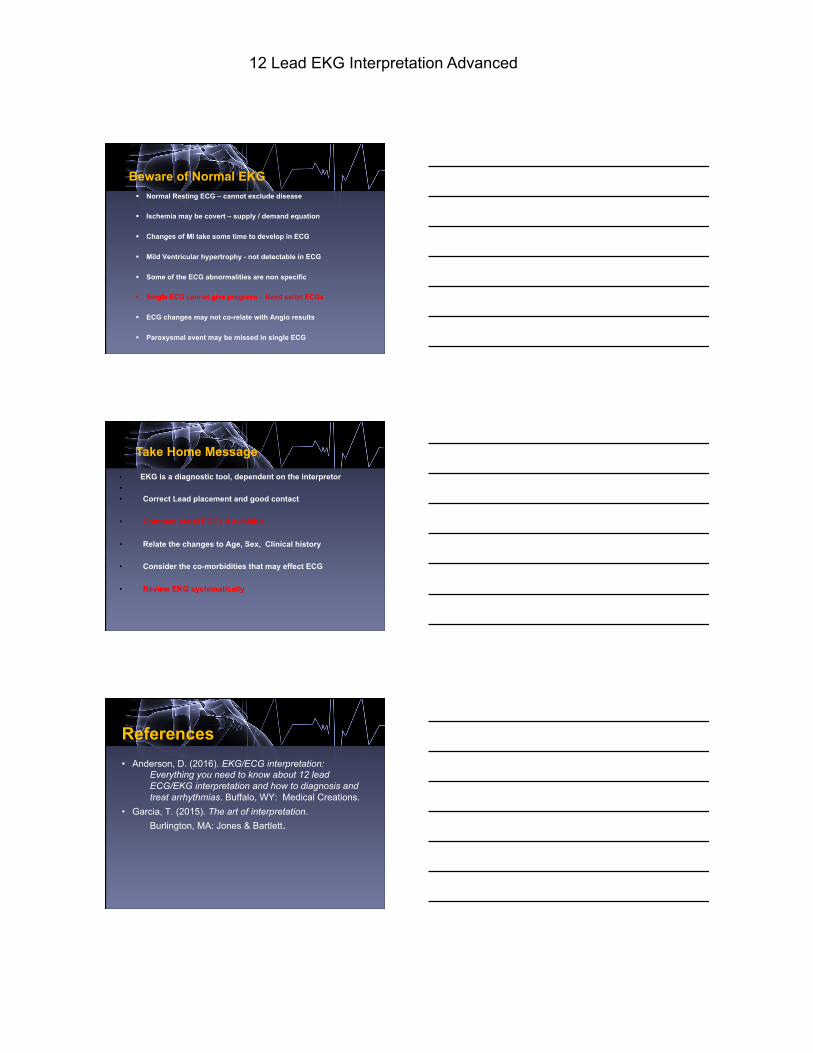
PRACTICE 58 year old female presents with profound weakness and shortness of breath
PRACTICE 72 year old male with history of COPD now presents with syncope
PRACTICE 72 year old male with history of COPD now presents with chest pain
12 Lead EKG Interpretation Advanced
§ Normal Resting ECG – cannot exclude disease
§ Ischemia may be covert – supply / demand equation
§ Changes of MI take some time to develop in ECG
§ Mild Ventricular hypertrophy - not detectable in ECG
§ Some of the ECG abnormalities are non specific
§ Single ECG cannot give progress – Need serial ECGs
§ ECG changes may not co-relate with Angio results
§ Paroxysmal event may be missed in single ECG
Beware of Normal EKG
• EKG is a diagnostic tool, dependent on the interpretor • • Correct Lead placement and good contact
• Compare serial ECGs if available
• Relate the changes to Age, Sex, Clinical history
• Consider the co-morbidities that may effect ECG
• Review EKG systematically
Take Home Message
References • Anderson, D. (2016). EKG/ECG interpretation:
Everything you need to know about 12 lead ECG/EKG interpretation and how to diagnosis and treat arrhythmias. Buffalo, WY: Medical Creations.
• Garcia, T. (2015). The art of interpretation. Burlington, MA: Jones & Bartlett.
12 Lead EKG Interpretation Advanced
12 EKG INTERPRETATION ROADMAP
PRACTICE ! PRACTICE! PRACTICE!